


Abstract
Addressing the governance dilemmas of urban vacant land (UVL) has become a major challenge in the process of global urban sustainable development. Taking Chongqing as a case study area, this paper employs Kernel Density Analysis, Bivariate Spatial Autocorrelation, and the PLUS model to explore the quantitative characteristics and spatial distribution patterns of UVL. Three scenarios—the Baseline Development Scenario, Incremental Development Scenario, and Stock Development Scenario—are constructed to simulate the evolutionary trends of UVL and investigate the regulatory effects of different urban development models. The results are as follows: (1) From 2021 to 2025, the scale of UVL shows an expanding trend. The number of UVL plots increased from 1393 to 2308, and the total area rose from 5127.73 hectares to 11,842.43 hectares, with its proportion in the built-up area increasing from 7.37% to 16.98%. (2) The spatial scope of UVL continued to expand, and the agglomeration correlation between different land types was enhanced. The spatial distribution pattern of UVL was significantly influenced by policy factors. (3) Scenario simulations show that the growth rate of UVL in 2030 is ranked as follows: Incremental Development Scenario (95.93%) > Baseline Development Scenario (69.52%) > Stock Development Scenario (43.12%). The stock development model can effectively resolve the urban contradiction between “development and protection” and represents the optimal path for future urban development. This study has clarified the evolutionary patterns of urban vacant land and their compatibility with urban development models, providing a reference for optimising vacant land management and sustainable development in similar cities. However, certain limitations exist in data acquisition and the scope of the research.
1. Introduction
Globally, vacant land remains present even within developed cities [1,2,3]. Cyclical spatial expansion and contraction during urban development inevitably generate vacant land, which, in turn, affects urban development [4,5]. Urban vacant land reflects the degradation of land resources during urbanization. The growth in its quantity and scale leads to inefficient land use, deterioration of the living environment, and an increase in criminal activities, thereby triggering urban security issues and hindering the socio-economic development of cities [6,7]. From the perspective of global urban development, the formation and evolution of urban vacant land exhibit differentiated characteristics across different regions and various urban development models, meaning that urban vacant land does not have a uniform manifestation or one-size-fits-all solution. Against this background, scholars worldwide have conducted in-depth discussions on the conceptual definition [8,9,10], cause analysis [11,12], identification methods [13,14], and governance approaches [15,16] of urban vacant land, providing important theoretical support for understanding the formation logic and optimal utilization of such land.
Urban vacant land is in a dynamic process of change over time, and its formation mechanisms and evolution mechanism are closely related to urban development models [17]. A large body of research has adopted various methods to explore the relationship between urban vacant land and urban development. For example, Gebru et al. [18] identified the potential driving factors of urban vacant land through binary logistic regression analysis, arguing that measures such as policy reforms and infrastructure investment are crucial for the sustainable use of urban land and urban development; Chen et al. [19] provided a complete analytical framework for the regreening of urban vacant land, offering an effective path for optimizing the urban ecological environment; Mara Ferreria [20] explored the relationship between urban vacant space and the stability of urban development, arguing that the governance of urban vacant space is essentially a process in which urban instability is continuously normalized; Galen Newman [21] found that vacant land increased significantly after urban economic crises; Qu et al. [22] pointed out that the essence of urban land idleness lies in the interest game between the government and land-using units, and that the processes of urbanization and economic development have a certain impact on the generation of urban vacant land. These achievements highlight the intrinsic relationship between urban development and the creation of vacant land, suggesting that the coordinated advancement of social, economic, and ecological processes that promote vacant land governance and the transformation of urban land use is crucial for achieving harmonious development of human–land relations [4,23]. However, most of them focus on the static characteristic analysis of vacant land and have not yet incorporated urban vacant land into different urban development models to explore its dynamic process and future evolution trend from the changing spatiotemporal dimension.
Scenario analysis is an effective tool for simulating future land use change [24]. By setting different development scenarios and quantifying the interactions among key driving factors, it can scientifically predict the evolution direction of land use structure [25] and provide a basis for formulating differentiated spatial regulation policies [26]. Currently, most simulations of existing land use scenarios adopt traditional models such as GeoSOS [27], CA-Markov, and FLUS [28]. Although these models can realize macro-scale pattern simulation, they have difficulty capturing the dynamic evolution of land use patches in the temporal and spatial dimensions. Compared with the above-mentioned models, the PLUS model has more prominent advantages in regional land use simulation: with the help of the LEAS module, this model explores the driving mechanism of various land type expansions based on random forests, which can better identify the causes of various land use changes [28,29,30]; in addition, it realizes patch-level spatial evolution through the CARS module, making the spatial evolution of land types more realistic [31,32]; at the same time, it can flexibly embed multi-scenario constraint conditions, better meeting the needs of land use simulation under multiple scenarios.
Accordingly, this paper takes the main urban area of Chongqing as the study area. Methods such as Kernel Density Analysis and Bivariate Spatial Autocorrelation Analysis are employed to explore the quantitative characteristics and spatial distribution patterns of urban vacant land from 2021 to 2025. Building on this foundation, three typical development scenarios are further established: baseline development, incremental land development, and stock land development. The PLUS model is used to simulate the temporal and spatial evolution path of urban vacant land in 2030, so as to analyze the regulatory role and influence mechanism of different urban development models on the evolution process of vacant land. This paper aims to address three major scientific questions: (1) What kind of spatial distribution pattern does urban vacant land present? (2) How has the scale of urban vacant land changed in the past five years? (3) How will future urban development models influence the distribution of vacant land?
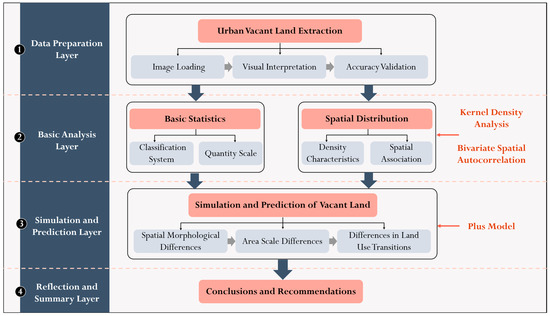
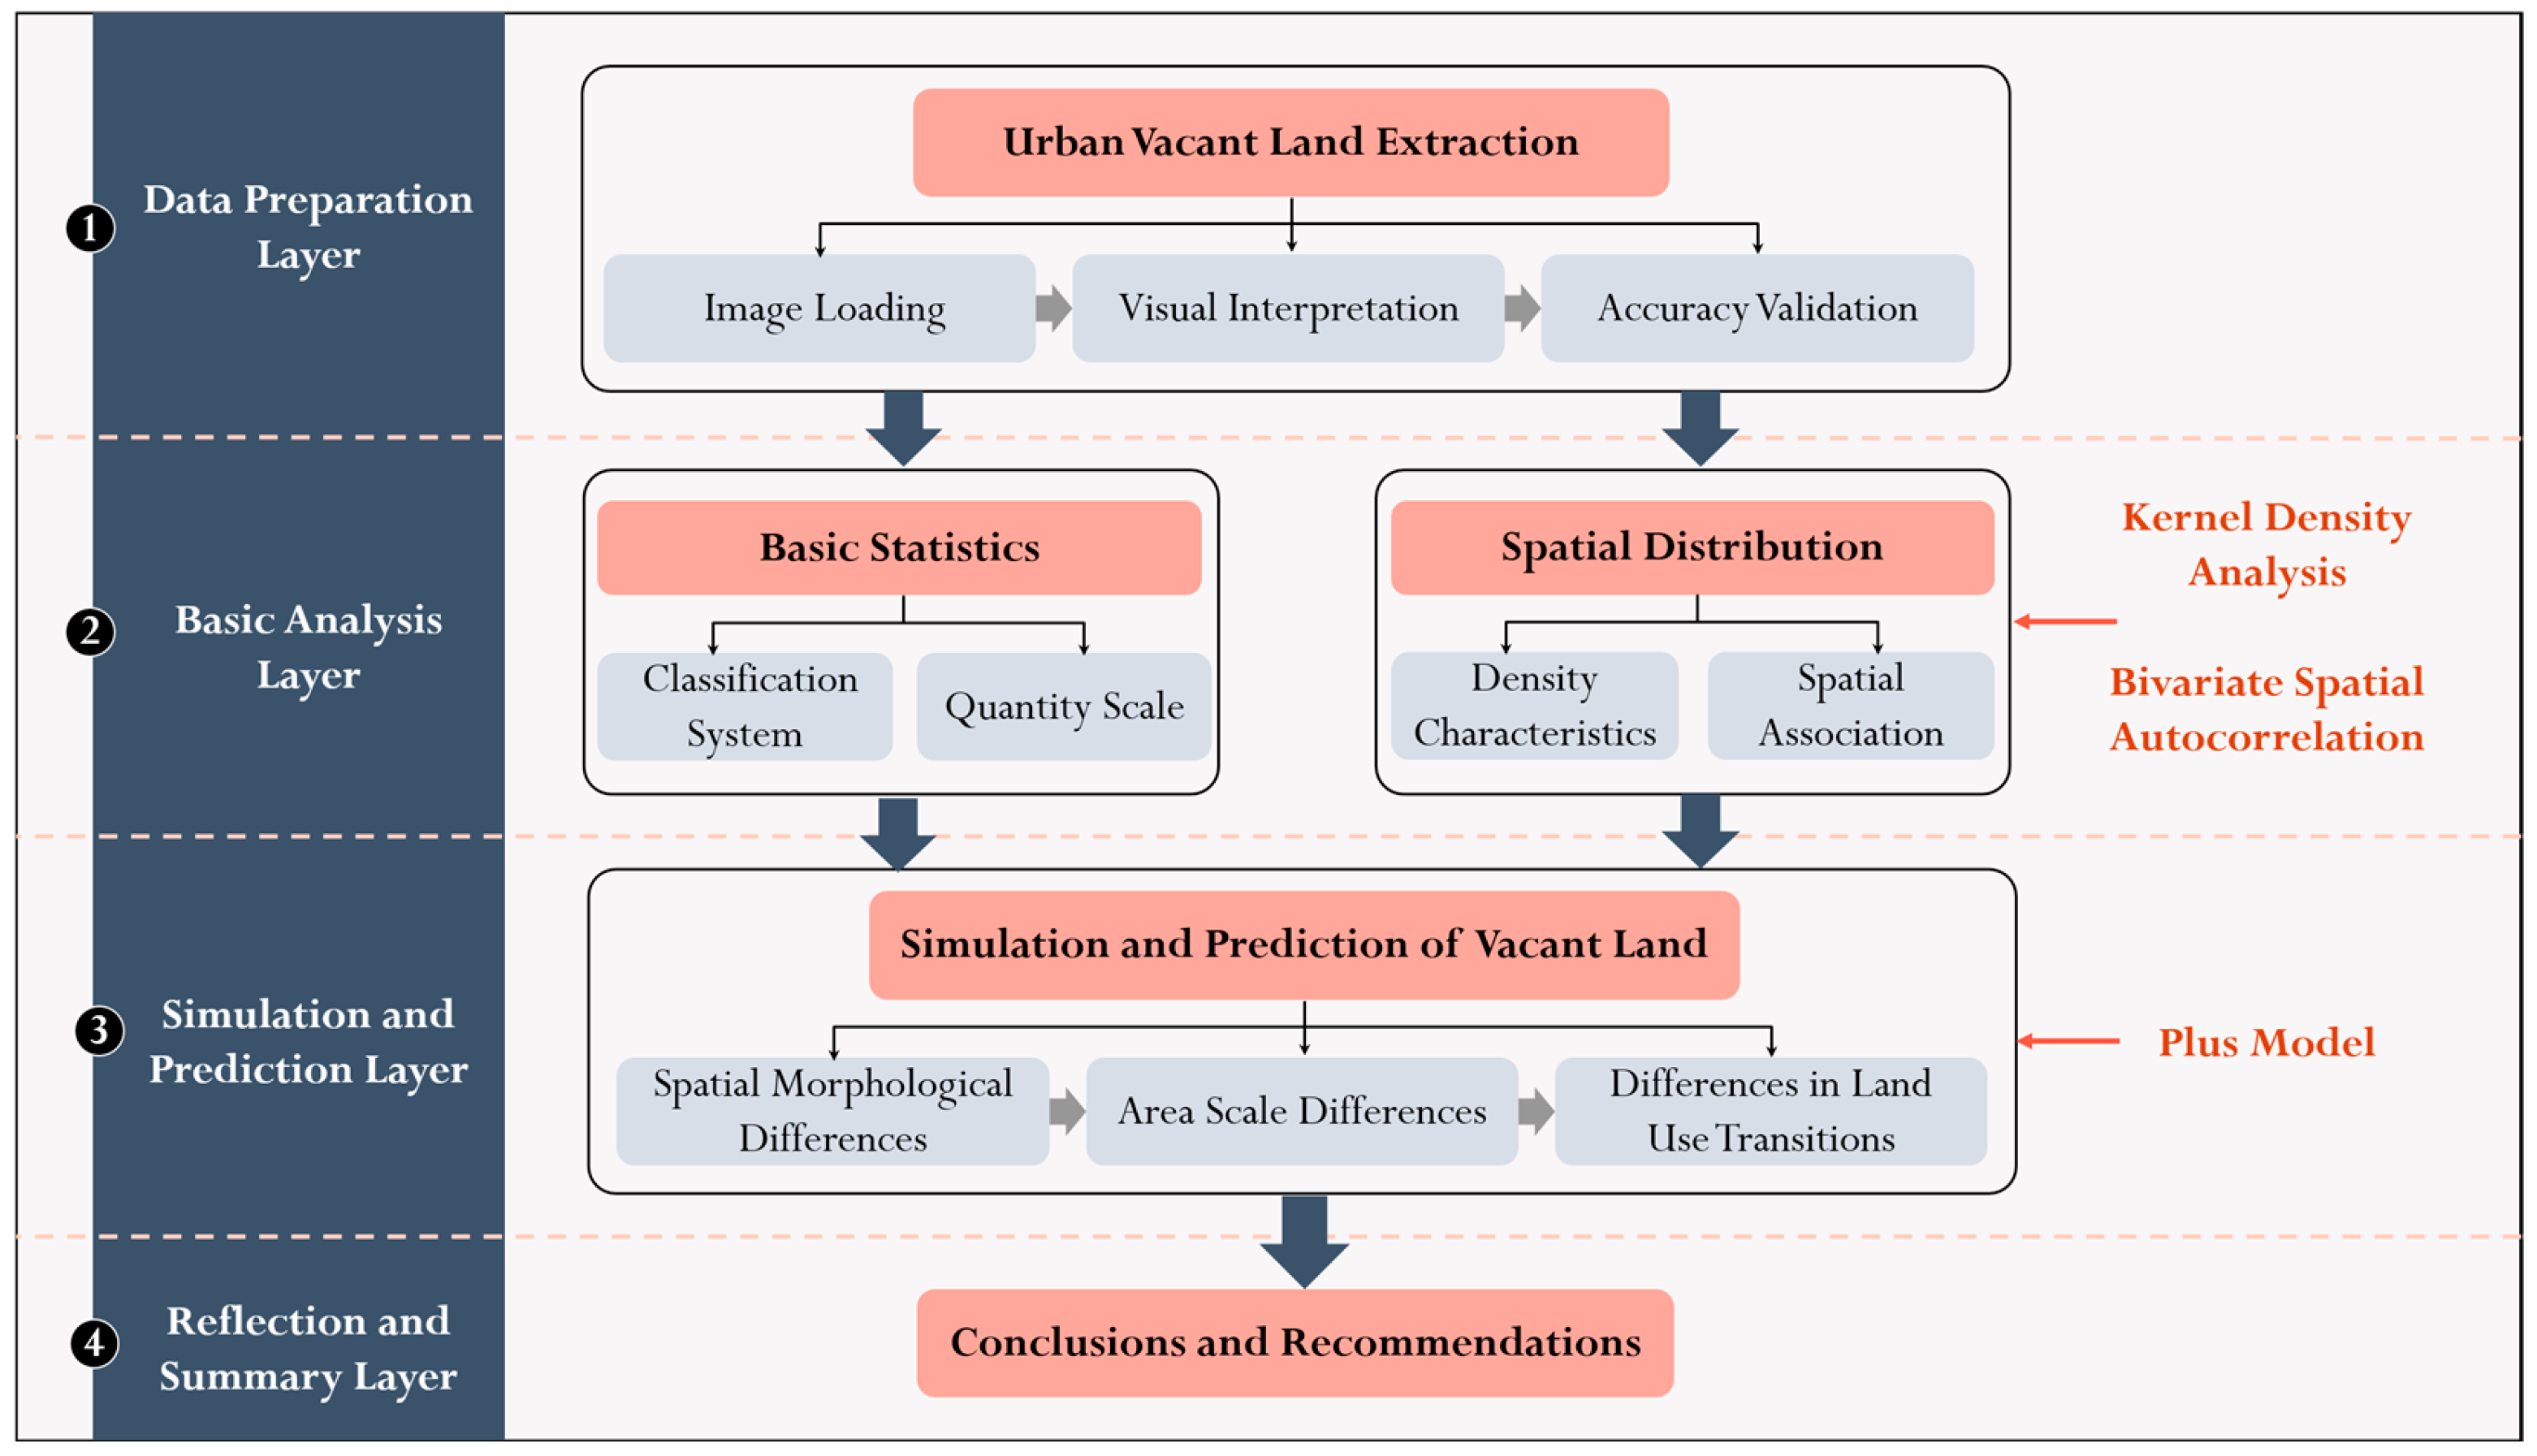
The research framework of this paper is as follows (Figure 1): Urban vacant land in the main urban area of Chongqing in 2021 and 2025 was extracted via visual interpretation, followed by a basic statistical analysis of its quantity and scale. Subsequently, Kernel Density Analysis and Bivariate Spatial Autocorrelation Analysis were adopted to examine the spatial distribution characteristics of urban vacant land. Furthermore, urban development scenarios were constructed using the PLUS Model to simulate the spatiotemporal dynamics and predict the future evolution of urban vacant land.
Figure 1.
Research Technical Flowchart.
2. Materials and Methods
2.1. Study Area
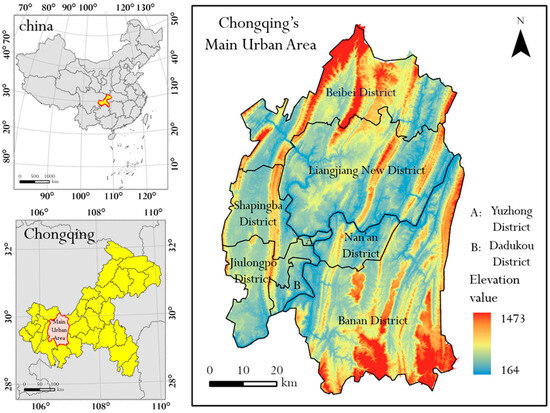
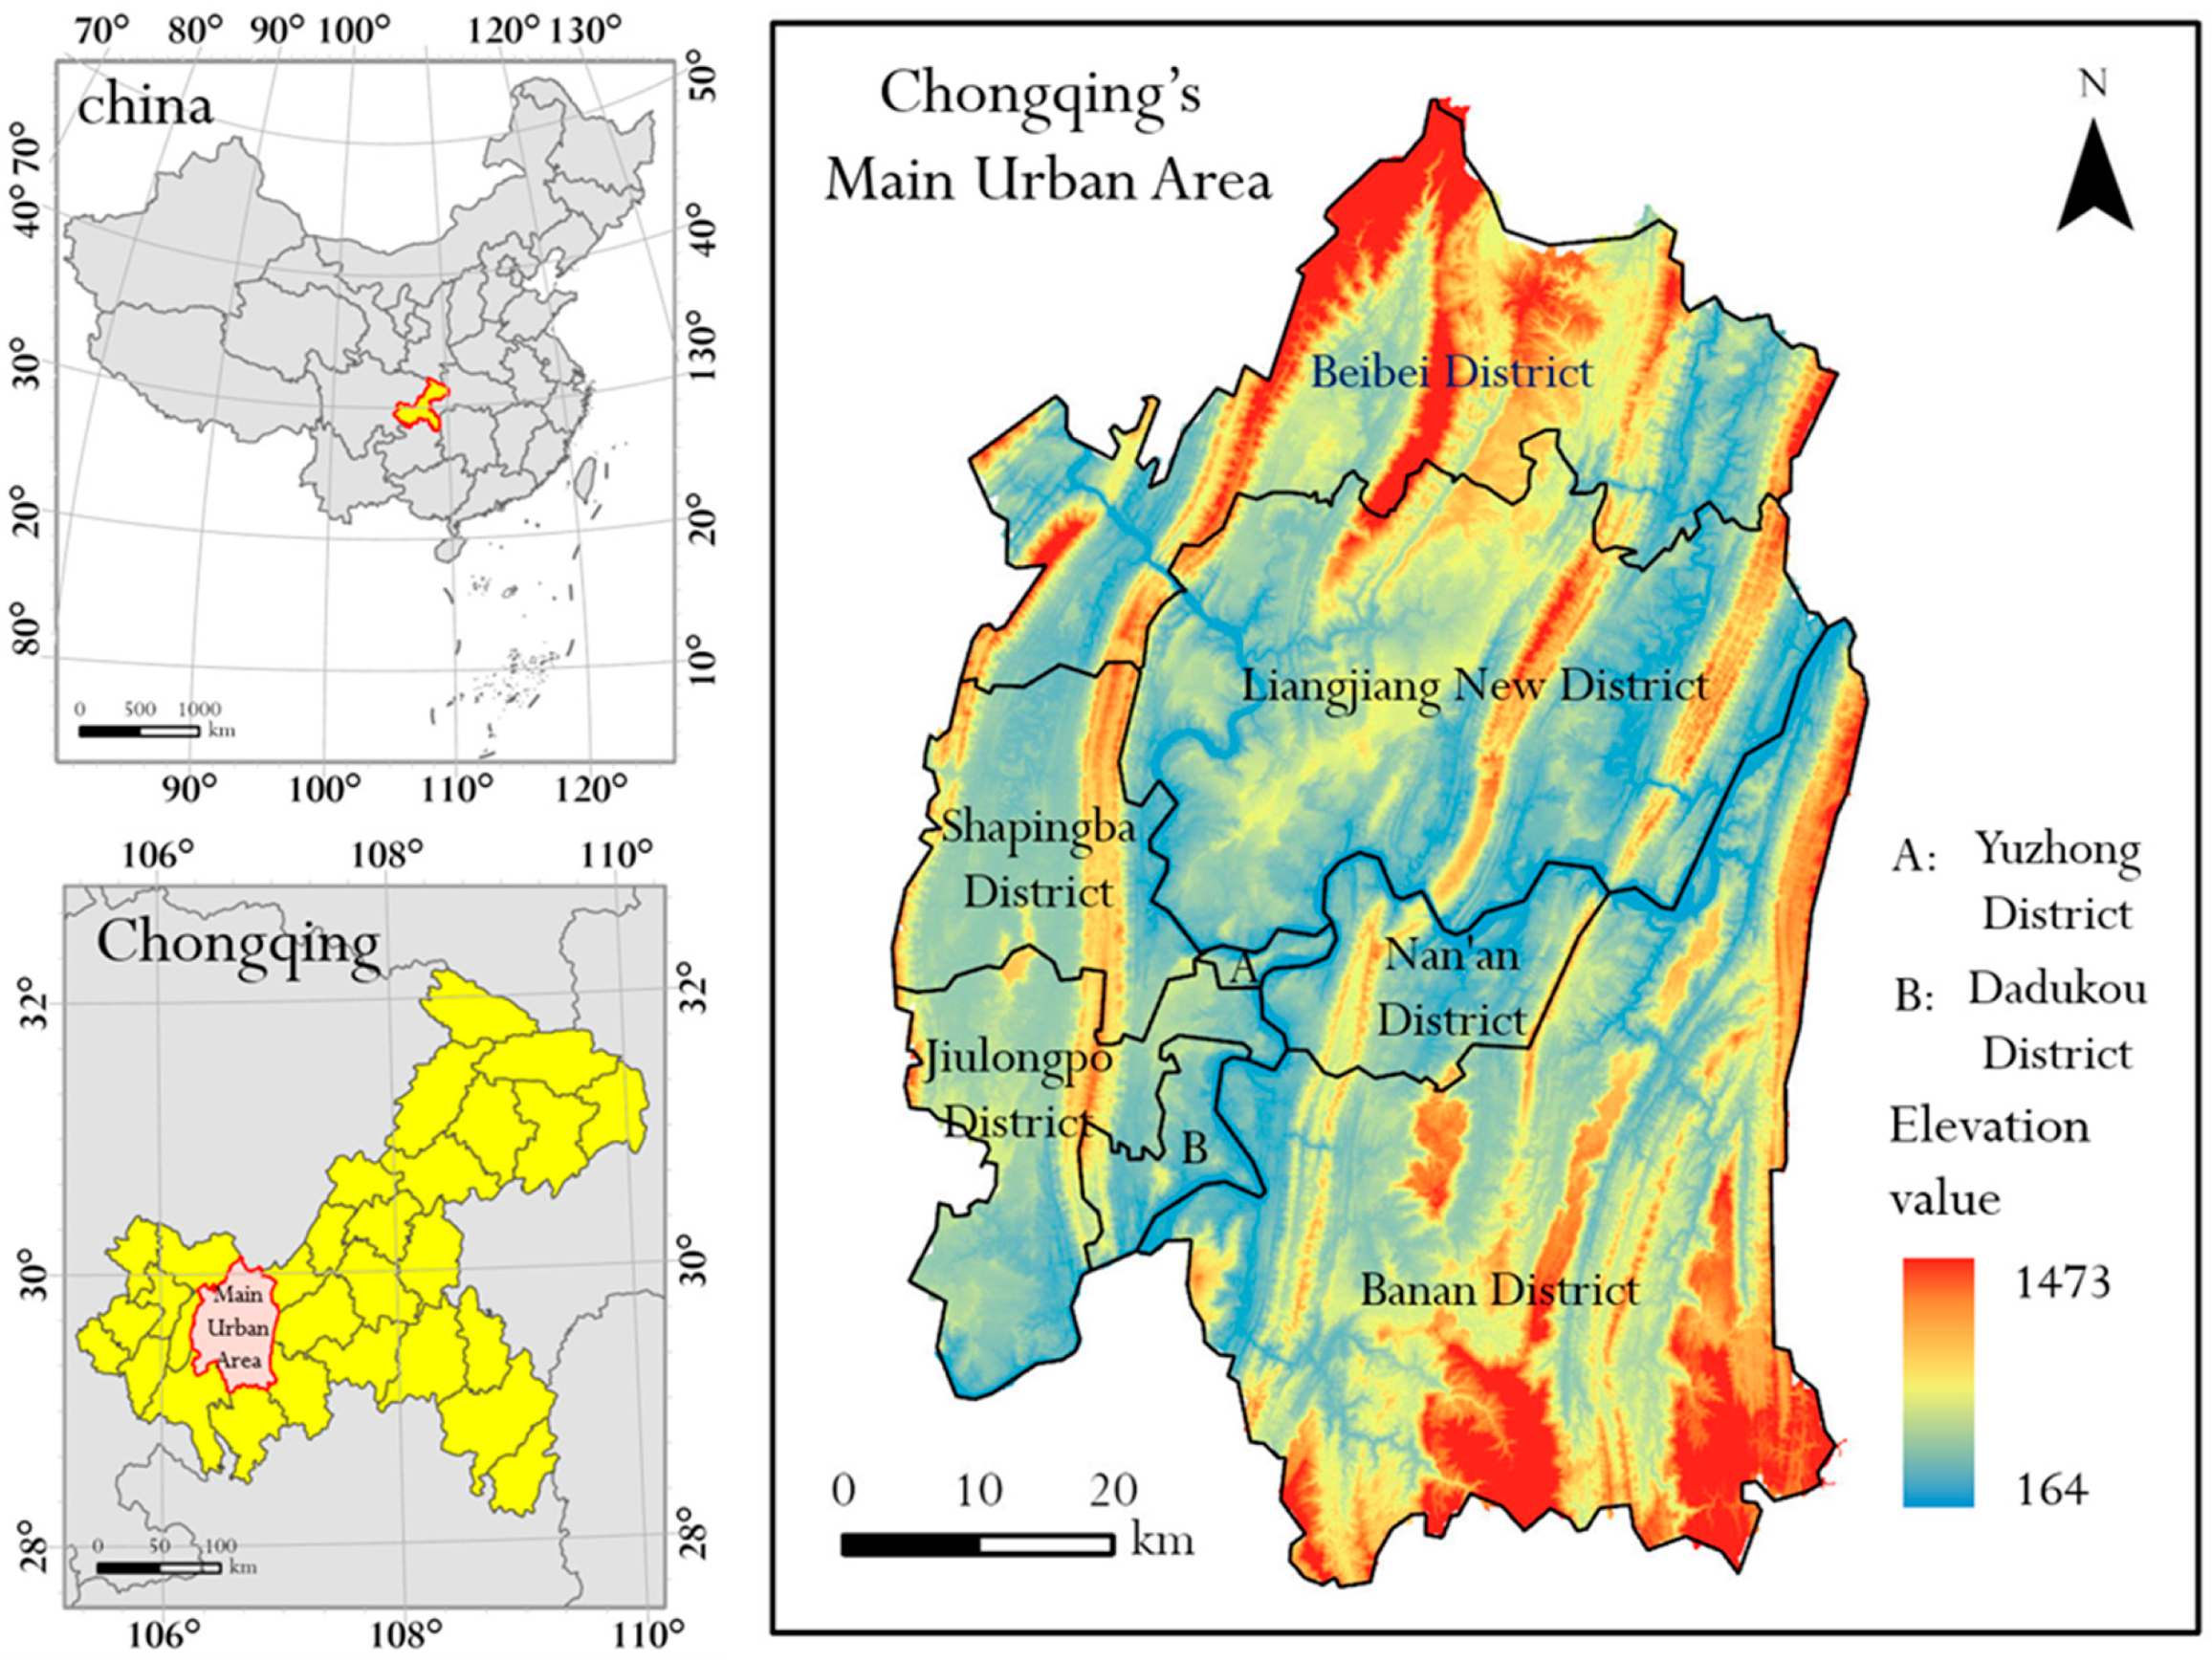
Chongqing serves as a crucial strategic pillar for the development of western China, and the effectiveness of its urban spatial governance is critical to the overall situation of regional development. The reasons for selecting the main urban area of Chongqing as the research case are as follows (Figure 2): (1) Abundant research samples. The fragmented terrain of Chongqing has given rise to a large number of urban vacant lands, providing a solid sample base for this study. (2) Diversified types of vacant land. As an old industrial base and a megacity in central and western China, Chongqing has undergone industrial transformation characterized by “ transition from secondary industry to tertiary industry” in the course of development. Various types of stock vacant land, such as industrial relics and old residential quarters, constitute research objects with diverse categories and complex formation mechanisms. (3) Significant demonstration effect. Chongqing is the only municipality directly under the central government in central and western China, and also an important demonstration zone for the country to promote new-type urbanization. This study focuses on the impacts of future urban development models on different land use conversion pathways, and provides scientific suggestions for addressing the core contradiction between urban “development and protection”.
Figure 2.
Overview of Chongqing’s Geographical Location.
2.2. Data Sources
2.2.1. Urban Vacant Land Dataset
The extraction steps of urban vacant land data are as follows: (1) ArcGIS Pro (v3.0.36056) software was used to load high-resolution remote sensing images provided by the ESRI Platform (https://livingatlas.arcgis.com/wayback/, accessed on 1 July 2025). Urban vacant land in the study area was extracted through visual interpretation (The specific operation process is shown in Figure 3), with the image acquisition time selected as April 2021 and April 2025, and the spatial resolution of approximately 1 m; (2) Historical street view photos from multiple platforms such as Baidu and Amap were integrated to inspect and verify the extracted vacant land; (3) Field sampling survey was adopted for the final verification of the extraction results to ensure accuracy.
Figure 3.
Urban Vacant Land Identification Flowchart.
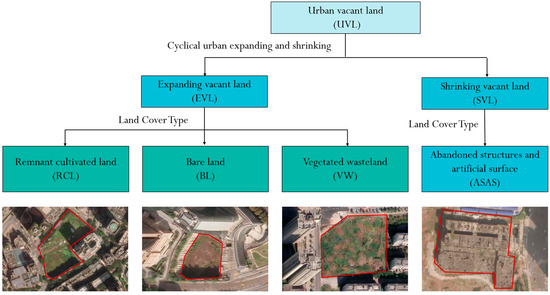
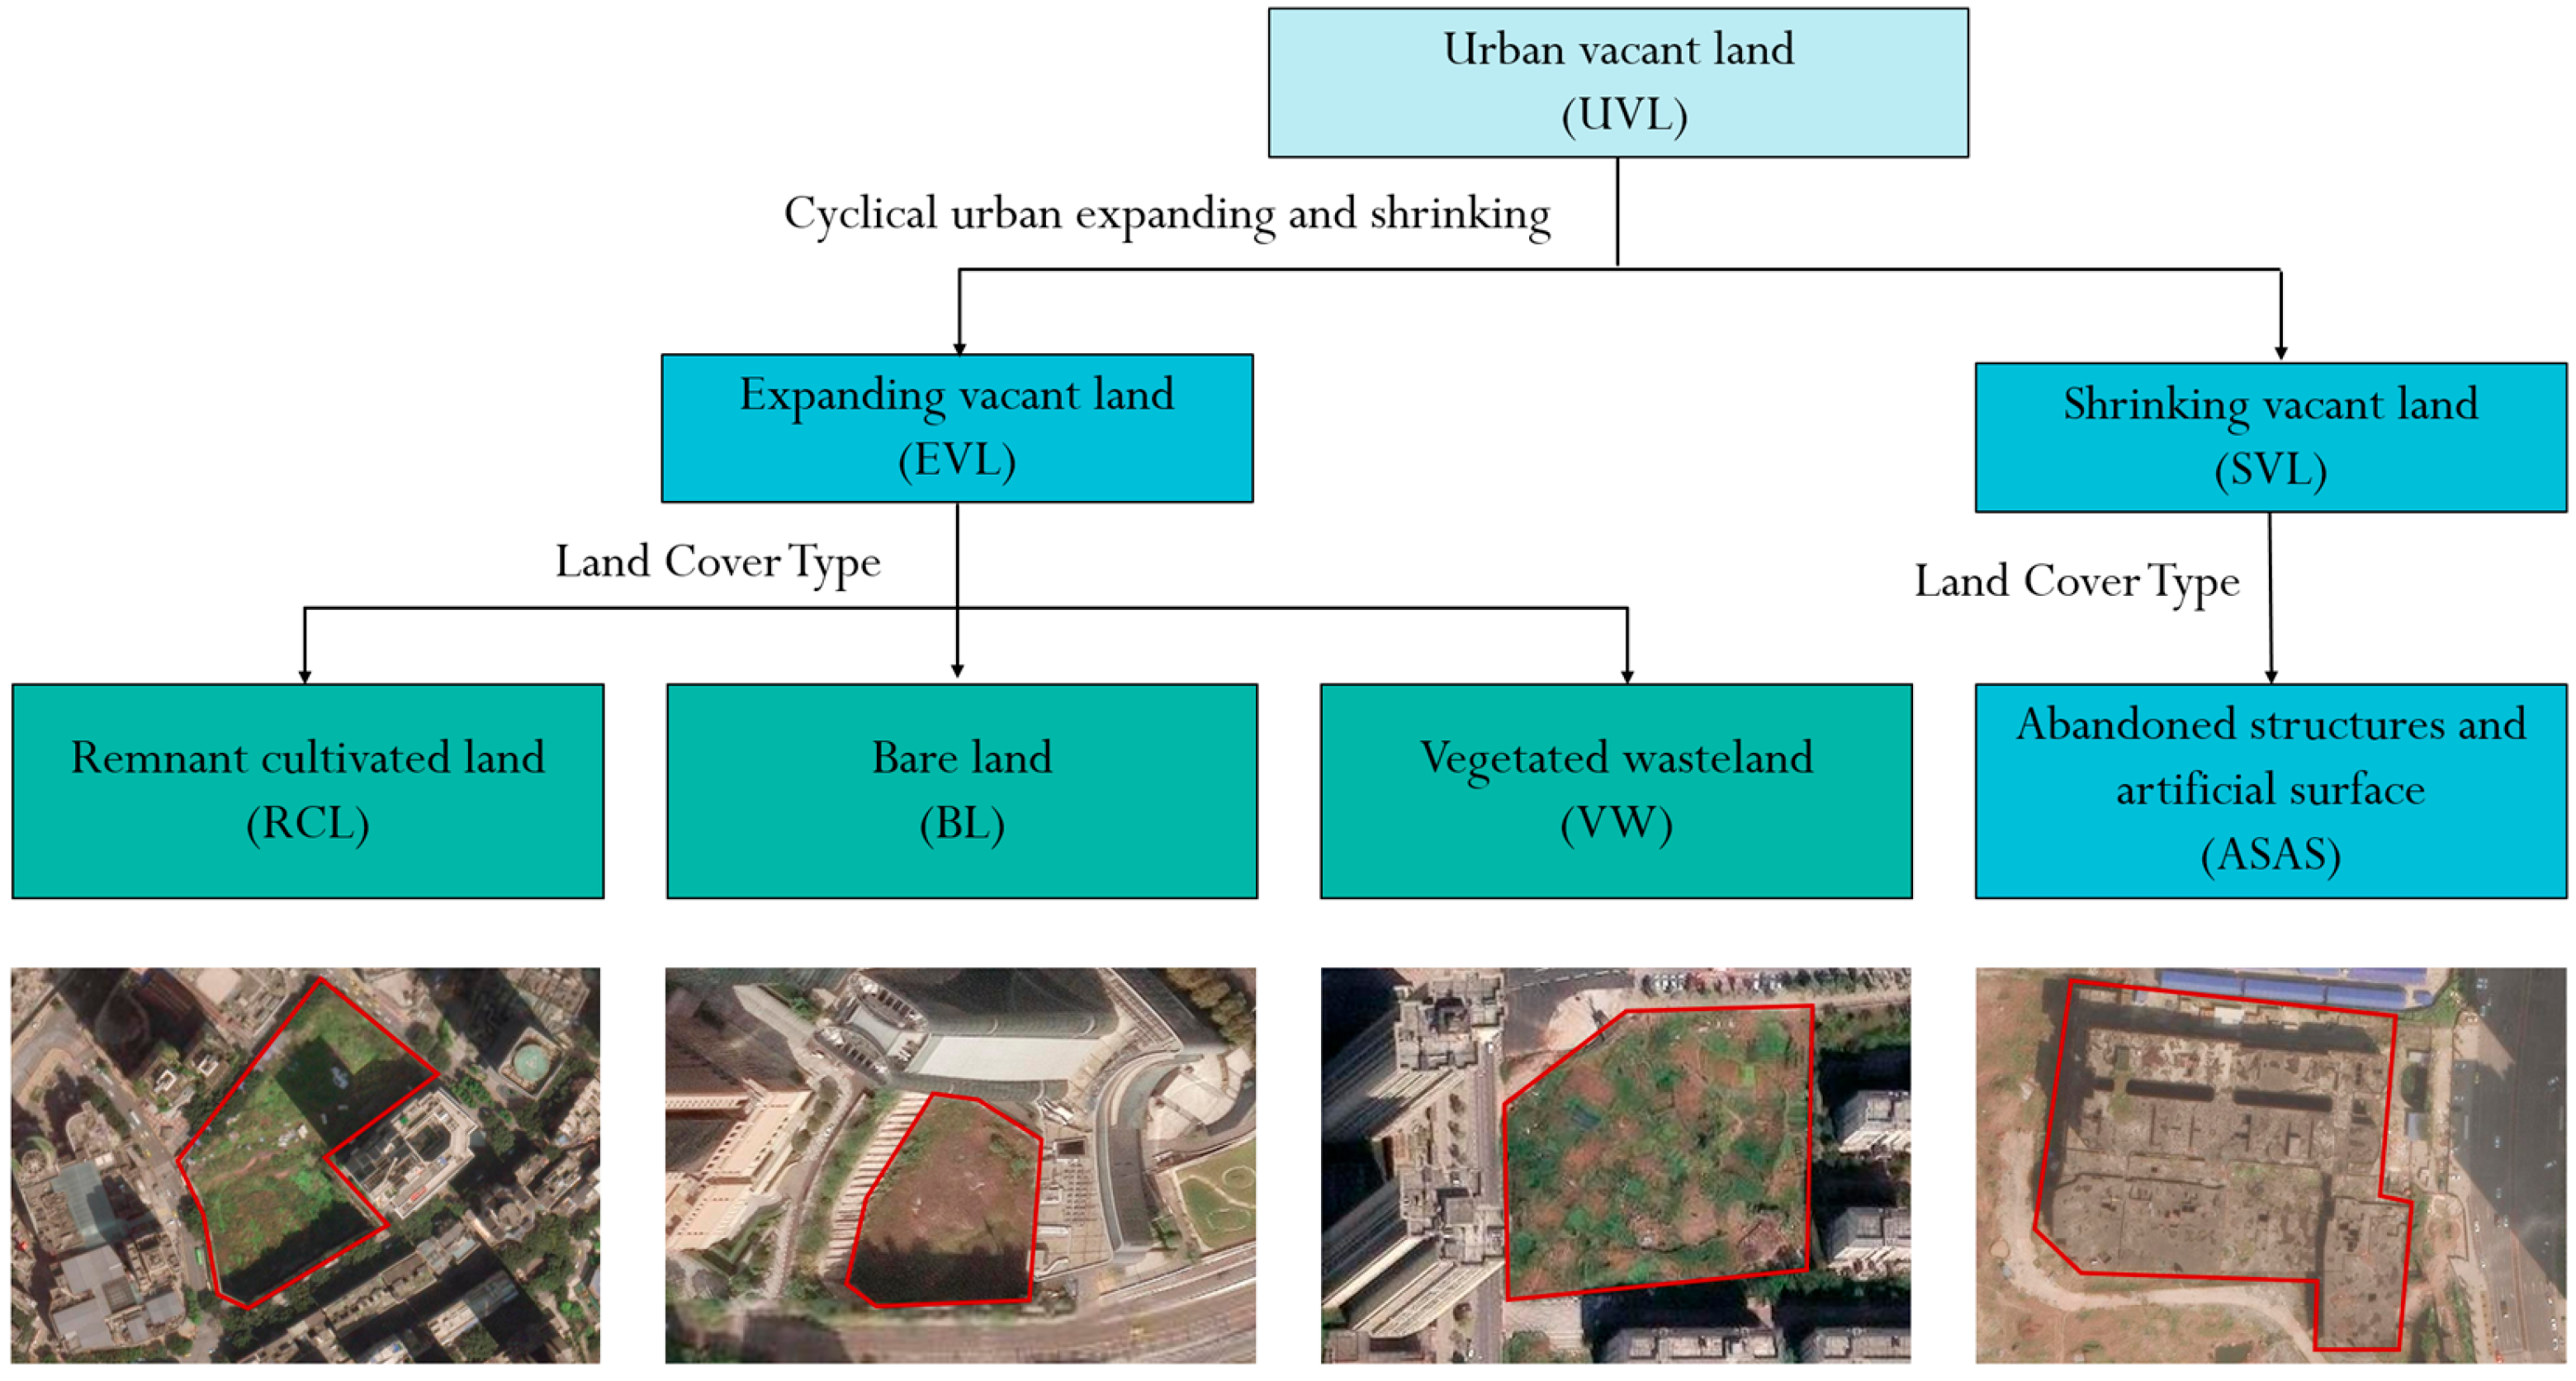
This study defines Urban Vacant Land (UVL) as land within urban boundaries that is not effectively utilized, encompassing land cover types such as bare land, vegetated wasteland, remnant cultivated land, and abandoned structures. Meanwhile, this study inherits the dual-layer classification system of urban vacant land proposed previously by the research group [33] (Figure 4), and further classifies UVL based on its formation mechanisms and land cover types. Specifically, expanding vacant land (EVL) refers to vacant land generated during the process of urban spatial expansion, mainly including sub-types such as remnant cultivated land (RCL), vegetated wasteland (VW), and bare land (BL); in contrast, shrinking vacant land (SVL) refers to vacant land generated during the process of urban spatial contraction, mainly including sub-types such as abandoned structures and abandoned artificial surfaces (ASAS).
Figure 4.
Urban Vacant Land Classification System Diagram.
2.2.2. Other Datasets
(1) Land Cover Data: This data is derived from China’s Annual Land Cover Dataset (CLCD), developed by the research team of Professors Yang Jie and Huang Xin based on the Google Earth Engine (GEE) platform, with a spatial resolution of 30 m [34]. (2) Elevation Data: This data is obtained from the Shuttle Radar Topography Mission (SRTM) data of the U.S. Space Shuttle Endeavour, collected in 2000 and with a spatial resolution of 250 m. (3) Nighttime Light Data: This data is sourced from the National Tibetan Plateau/Third Pole Environment Data Center (https://data.tpdc.ac.cn/, accessed on 1 February 2025) and has a spatial resolution of 500 m. (4) Building Data: This data is extracted by scholars such as Zhang Yecheng [35] through the fusion of Google Earth images, street view images, and POI data, combined with integrated AI models including OCRNet and XGBoost, thus generating multi-attribute building vector data. (5) Vegetation Coverage Data: This data is derived from the MOD13A1 product released by the National Aeronautics and Space Administration (NASA). It is calculated using the pixel dichotomy model based on the Normalized Difference Vegetation Index (NDVI), with a spatial resolution of 500 m [36]. (6) Transportation Data: This data is obtained from the official website of OpenStreetMap (OSM) (https://download.geofabrik.de/asia/china.html, accessed on 1 August 2025). (7) GDP per Unit Area Data: This data is sourced from the National Tibetan Plateau/Third Pole Environment Data Center [37] and the Institute of Geographic Sciences and Natural Resources Research, Chinese Academy of Sciences, with a spatial resolution of 1 km. (8) China Map Data: This data is derived from the National Geographic Information Public Service Platform (Tianditu) (https://www.tianditu.gov.cn/, accessed on 1 August 2025).
2.3. Research Methods
2.3.1. Scenario Simulation of Land Use Change Based on the PLUS Model
- PLUS Model
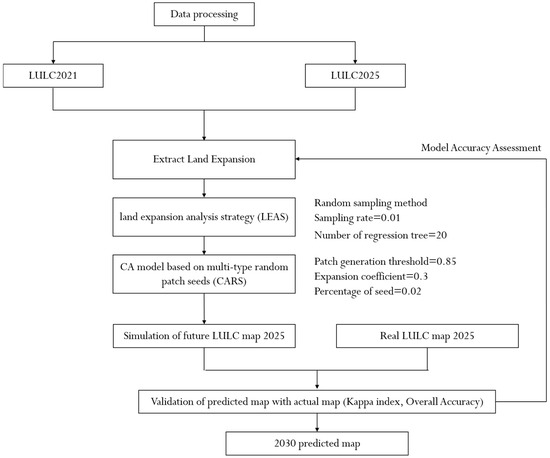
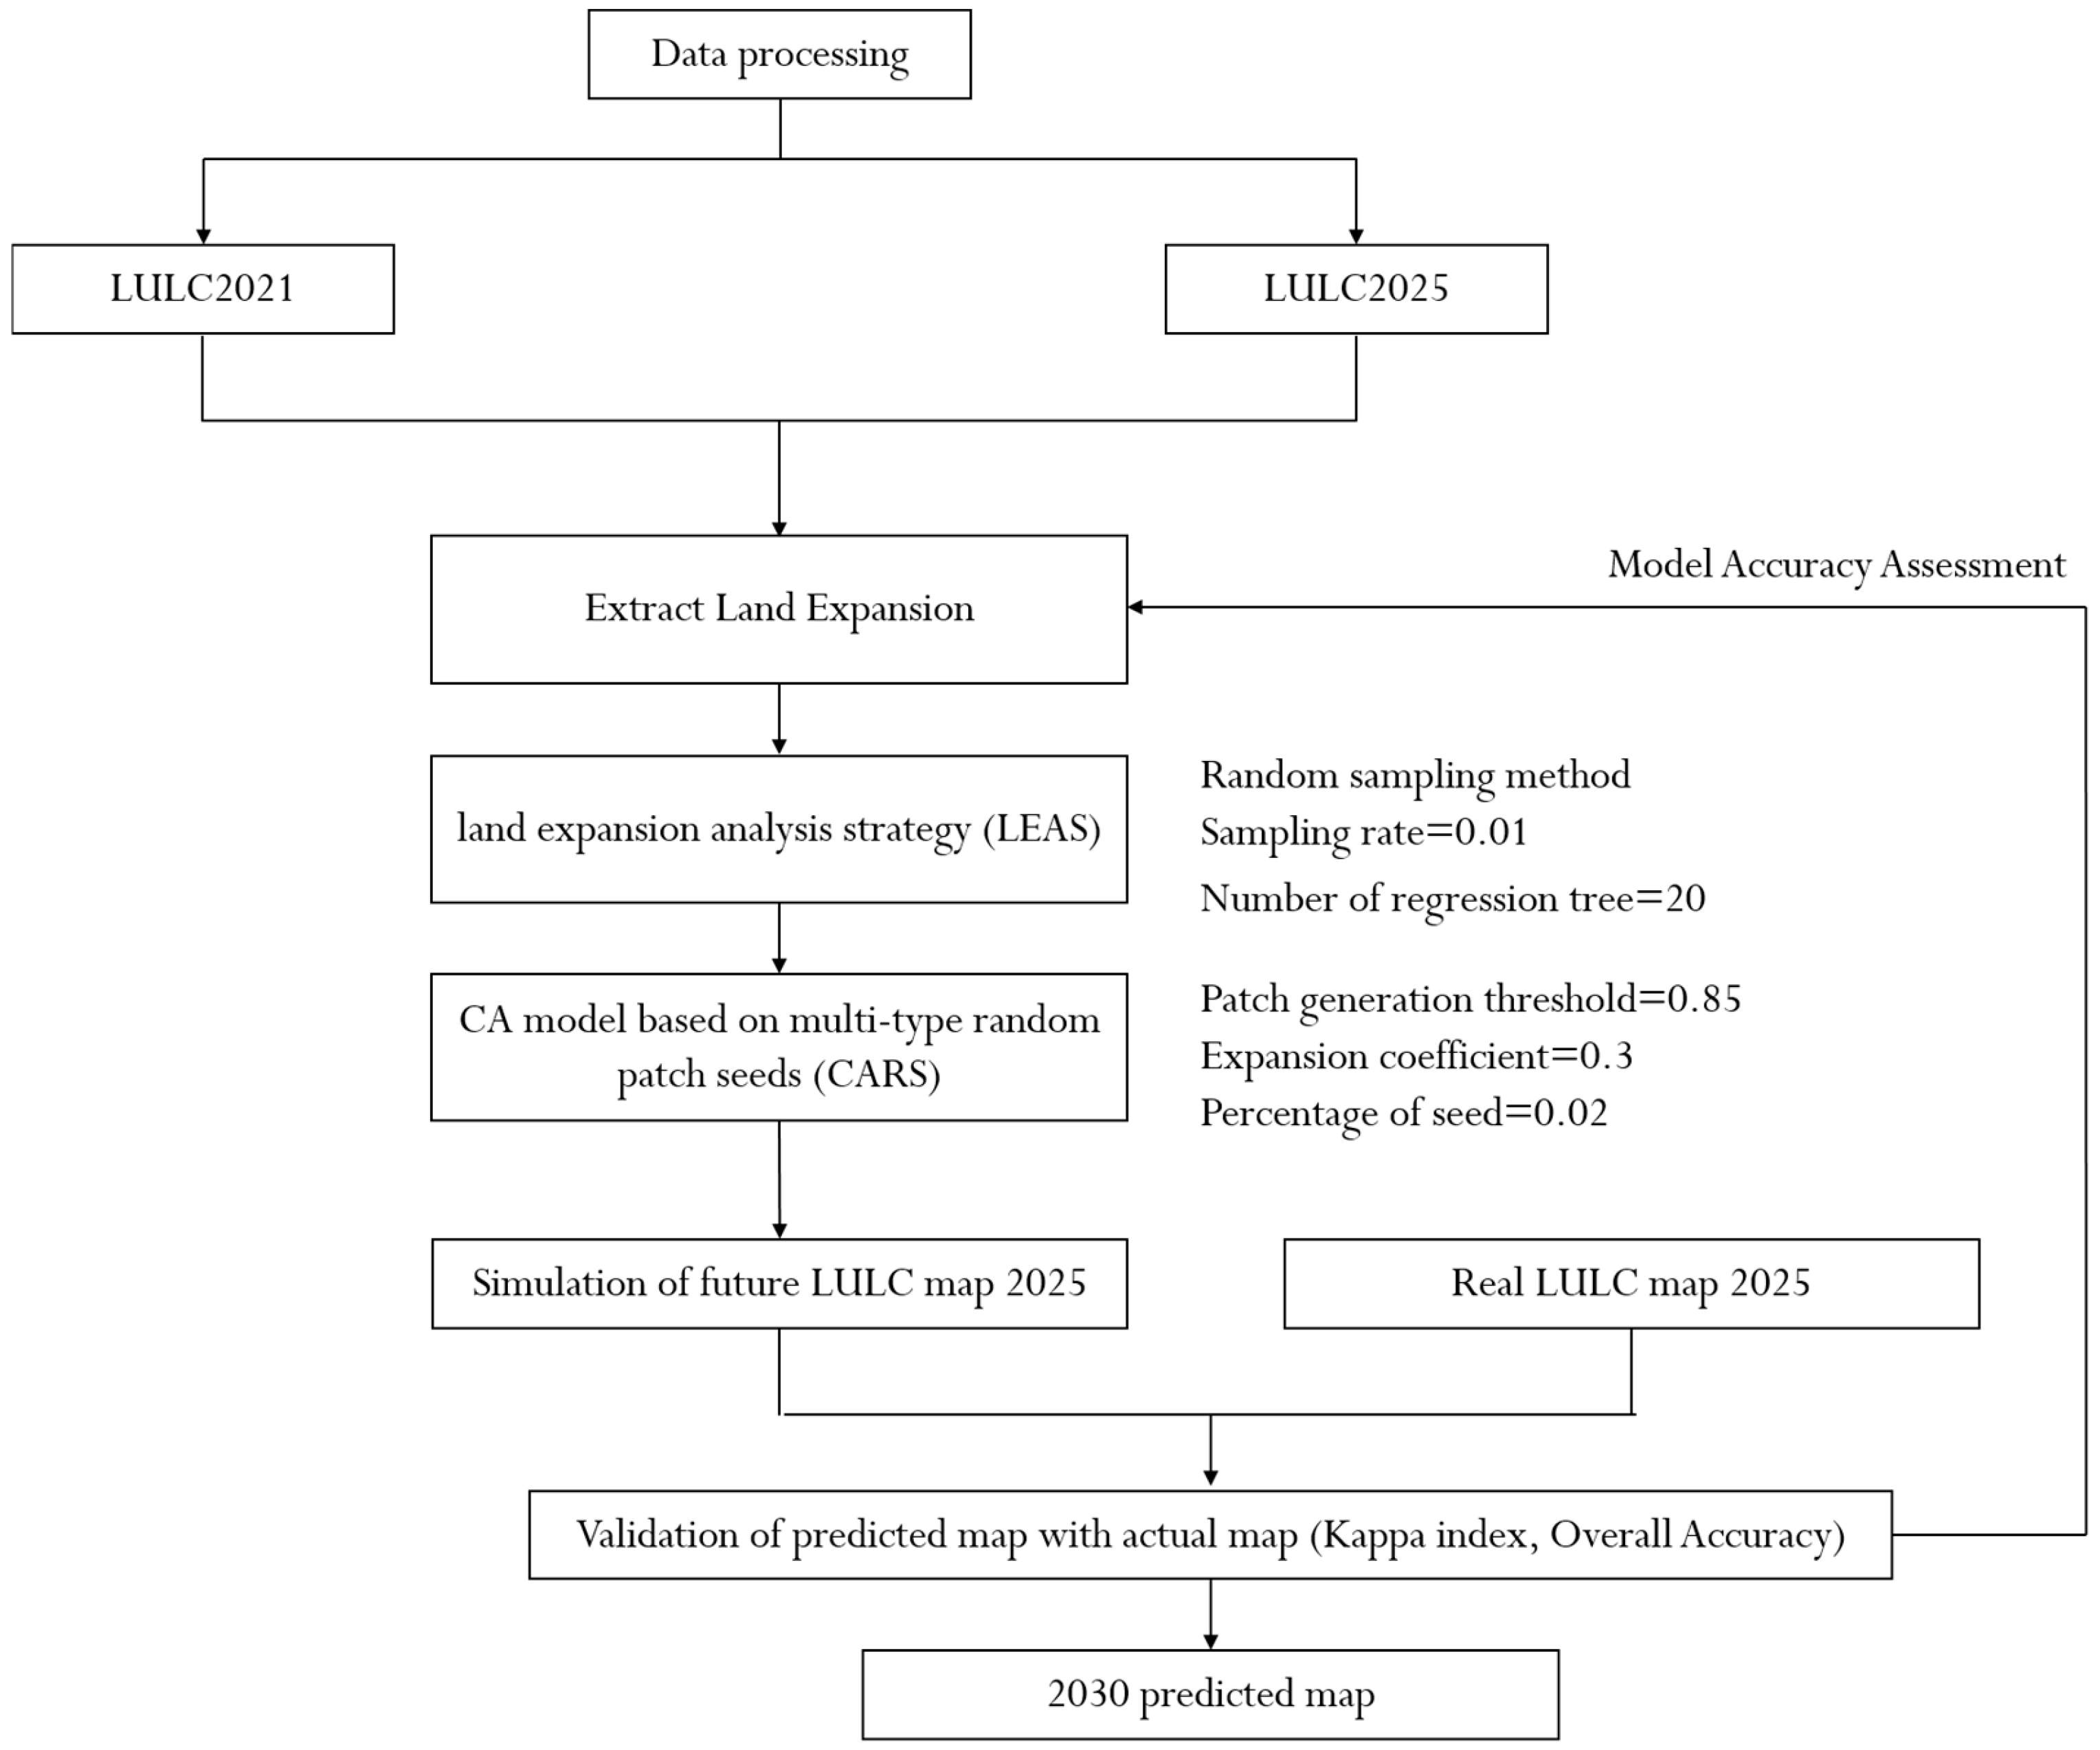
The PLUS Model (v1.40, Patch-generating Land Use Simulation Model) is a patch-generating land use change simulation model based on raster data [38]. The construction process of the PLUS Model in this study is as follows (Figure 5): Based on the land use data of Chongqing in 2021, the land use situation in 2025 was simulated. The simulation results were compared with the actual land use data in 2025 to evaluate the simulation accuracy of the model, and relevant parameters were continuously adjusted to meet the expected accuracy requirements.
Figure 5.
PLUS Model Construction Flow Diagram.
- 2.
- Selection of Influencing Factors
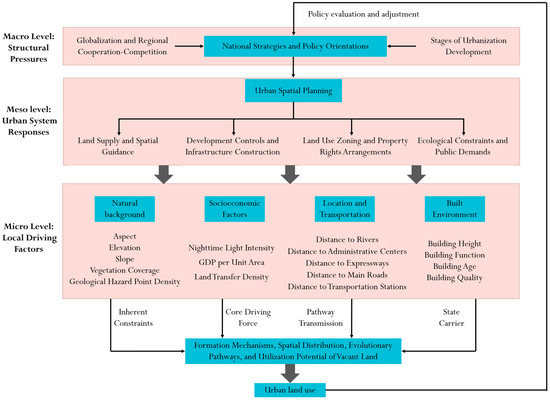
The mechanisms underlying the aggregation of urban spatial elements are intricate and multifaceted. They are deeply embedded within macro-level contexts such as economic globalization and stages of urbanization, closely intertwined with meso-level urban spatial planning, and directly influenced by micro-level factors including local environments and transportation accessibility. Therefore, this paper constructs a systematic analytical framework (Figure 6) from macro, meso, and micro levels to clarify the complex logical relationships among multi-level, multi-dimensional factors and elucidate their driving mechanisms on urban spatial elements.
Figure 6.
Analysis Diagram of Urban Vacant Land Formation Driving Mechanism.
The impact of urban planning on spatial elements primarily manifests at the meso-level of the city. Through planning tools such as land supply and spatial guidance, development control, and infrastructure construction, it influences the built environment and socioeconomic vitality at the local level, thereby affecting specific land use patterns at the micro-level. Consequently, the influence of urban planning on land use at the plot scale is predominantly indirect. At the micro level, natural conditions such as topography and geomorphology and ecological carrying capacity delineate the physical boundaries for urban land development, serving as the inherent constraints conditions on vacant land formation; socioeconomic factors including industrial structure and economic policies act as the core drivers propelling the evolution of vacant land; the level of transportation accessibility dictates land development priorities; and the built environment, as the carrier of vacant land status, influences its development potential. Based on this, this paper identifies 17 influencing factors to construct an analytical framework for simulating urban vacant land (Table 1).
Table 1.
Land Use Drivers and Sources.
- 3.
- Scenario Setting
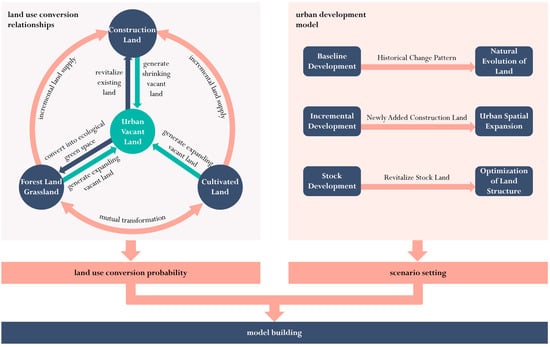
The formation and transformation of urban vacant land are deeply embedded within the urban development process. Based on spatial expansion patterns, urban development scenarios can be categorised into three trajectories (Figure 7): firstly, the baseline development scenario, which extends past land development patterns without policy intervention, following historical expansion trends and dynamic characteristics of land use types in Chongqing’s main urban area; secondly, the incremental development scenario, where urban growth is primarily driven by expanding urban land scale and spatial extension through new construction land supply over a defined period [39]; thirdly, the stock development scenario represents a model where, under conditions of maintaining the total scale of construction land unchanged and without spatial expansion, urban development is primarily driven through urban renewal, asset revitalisation, and resource reallocation. This involves the coordinated allocation of various incremental resources and the optimisation of the existing spatial structure to promote urban development [39,40].
Figure 7.
Construction Diagram of Urban Development Scenarios.
Clarifying the conversion relationships between different land categories forms the foundation and prerequisite for simulating diverse development scenarios. Within the dynamic transformation of land types, urban vacant land primarily originates from two sources: firstly, the encroachment and transition of cultivated land, forest land, and grassland in urban fringe areas to urban construction space, reflecting incremental spatial expansion—such vacant land is usually classified as EVL; Secondly, within urban core areas or built-up areas, the idleness and abandonment of existing stock land due to factors such as functional decline, structural adjustment, or industrial transformation of existing construction land—such vacant land is typically categorized as SVL. Concurrently, the reuse paths of urban vacant land are mainly focused on two core directions: On one hand, through planning guidance and policy incentives, idle vacant land is redeveloped to meet the needs of urban functional improvement and economic development; On the other hand, urban vacant land is transformed into parks, green spaces, or other ecological infrastructure to enhance urban ecological resilience and optimize the quality of the human settlement environment. Furthermore, under the urban incremental development scenario, cultivated land, forest land, and grassland continuously supply incremental land for construction land.
This study examines the expansion characteristics of vacant land and developed land in Chongqing’s main urban districts. By adjusting the transfer probability with a 30% [41,42,43,44] modification factor, three development scenarios are established: baseline urban development, incremental development, and stock-based development. The parameter adjustments for each scenario are as follows (Table 2 and Table 3):
Table 2.
Land Use Demand.
Table 3.
Land Use Conversion Cost Matrix.
- (1)
- Baseline Development Scenario: Using land use data from 2021 and 2025, the land demand for various land types in Chongqing’s main urban area in 2030 was calculated using the Markov matrix. In this scenario, remnant cultivated land within vacant land remains cultivated land—it is classified as cultivated land when not included in the built-up area and becomes vacant land after being incorporated into the built-up area. Therefore, vacant land will not be converted to cultivated land, and the land use conversion cost matrix is derived accordingly.
- (2)
- Incremental Development Scenario: Guided by extensive urban expansion, this scenario restricts the conversion of construction land to cultivated land, forest land, and grassland. Based on the Baseline Development Scenario, the Markov transition probabilities are adjusted as follows: ① The transition probabilities of cultivated land, forest land, and grassland to vacant land are increased by 30%; ② The transition probabilities of cultivated land, forest land, and grassland to construction land are increased by 30%; ③ The transition probabilities of vacant land to forest land, grassland, and construction land are decreased by 30%; ④ The transition probability of construction land to vacant land is increased by 30%. Based on the adjusted land type transition probability matrix, the pixel demand for various land types in the future under the Incremental Development Scenario is recalculated.
- (3)
- Stock Development Scenario: In the stock development scenario, the development orientation is to revitalize stock land, and the conversion of cultivated land, forest land and grassland into built-up areas is restricted. Based on the Baseline Development Scenario, the Markov transition probabilities are adjusted as follows: ① The transition probabilities of cultivated land, forest land, and grassland to vacant land are reduced by 30%; ② The transition probabilities of cultivated land, forest land, and grassland to construction land are reduced by 30%; ③ The transition probabilities of vacant land to forest land, grassland, and construction land are increased by 30%; ④ The transition probability of construction land to vacant land is reduced by 30% Based on the adjusted land type transition probability matrix, the pixel demand for various land types in the future under the Existing Development Scenario is recalculated.
2.3.2. Kernel Density Analysis
Kernel density analysis is a classic non-parametric estimation method in spatial data analysis [45,46,47]. For a spatial point set (where denotes the coordinate of the i-th point), the calculation formula for the kernel density at an arbitrary location x is as follows:
where n is the total number of spatial points; d denotes the spatial dimension (d = 2 in two-dimensional planar analysis); h represents the bandwidth, a core parameter that determines the degree of density smoothing and spatial resolution; K stands for the kernel function, which is used to define the attenuation pattern of the influence exerted by a point on its surrounding areas; and refers to the standardized distance.
2.3.3. Bivariate Spatial Autocorrelation Analysis
Bivariate spatial autocorrelation is a method in spatial statistics for analyzing the spatial association characteristics of two geographic variables [48,49,50]. Its formula is given as follows:
where ; ; denotes the value of attribute l for spatial unit p; denotes the value of attribute m for spatial unit q; and represent the mean values of attribute l and attribute m respectively; and and stand for the variances of attribute l and attribute m respectively.
3. Results
3.1. Quantitative Scale of Urban Vacant Land
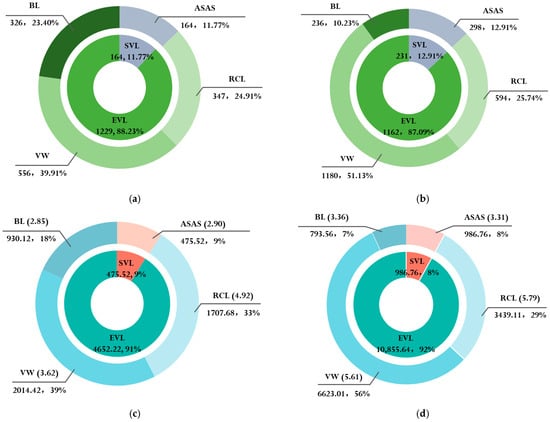
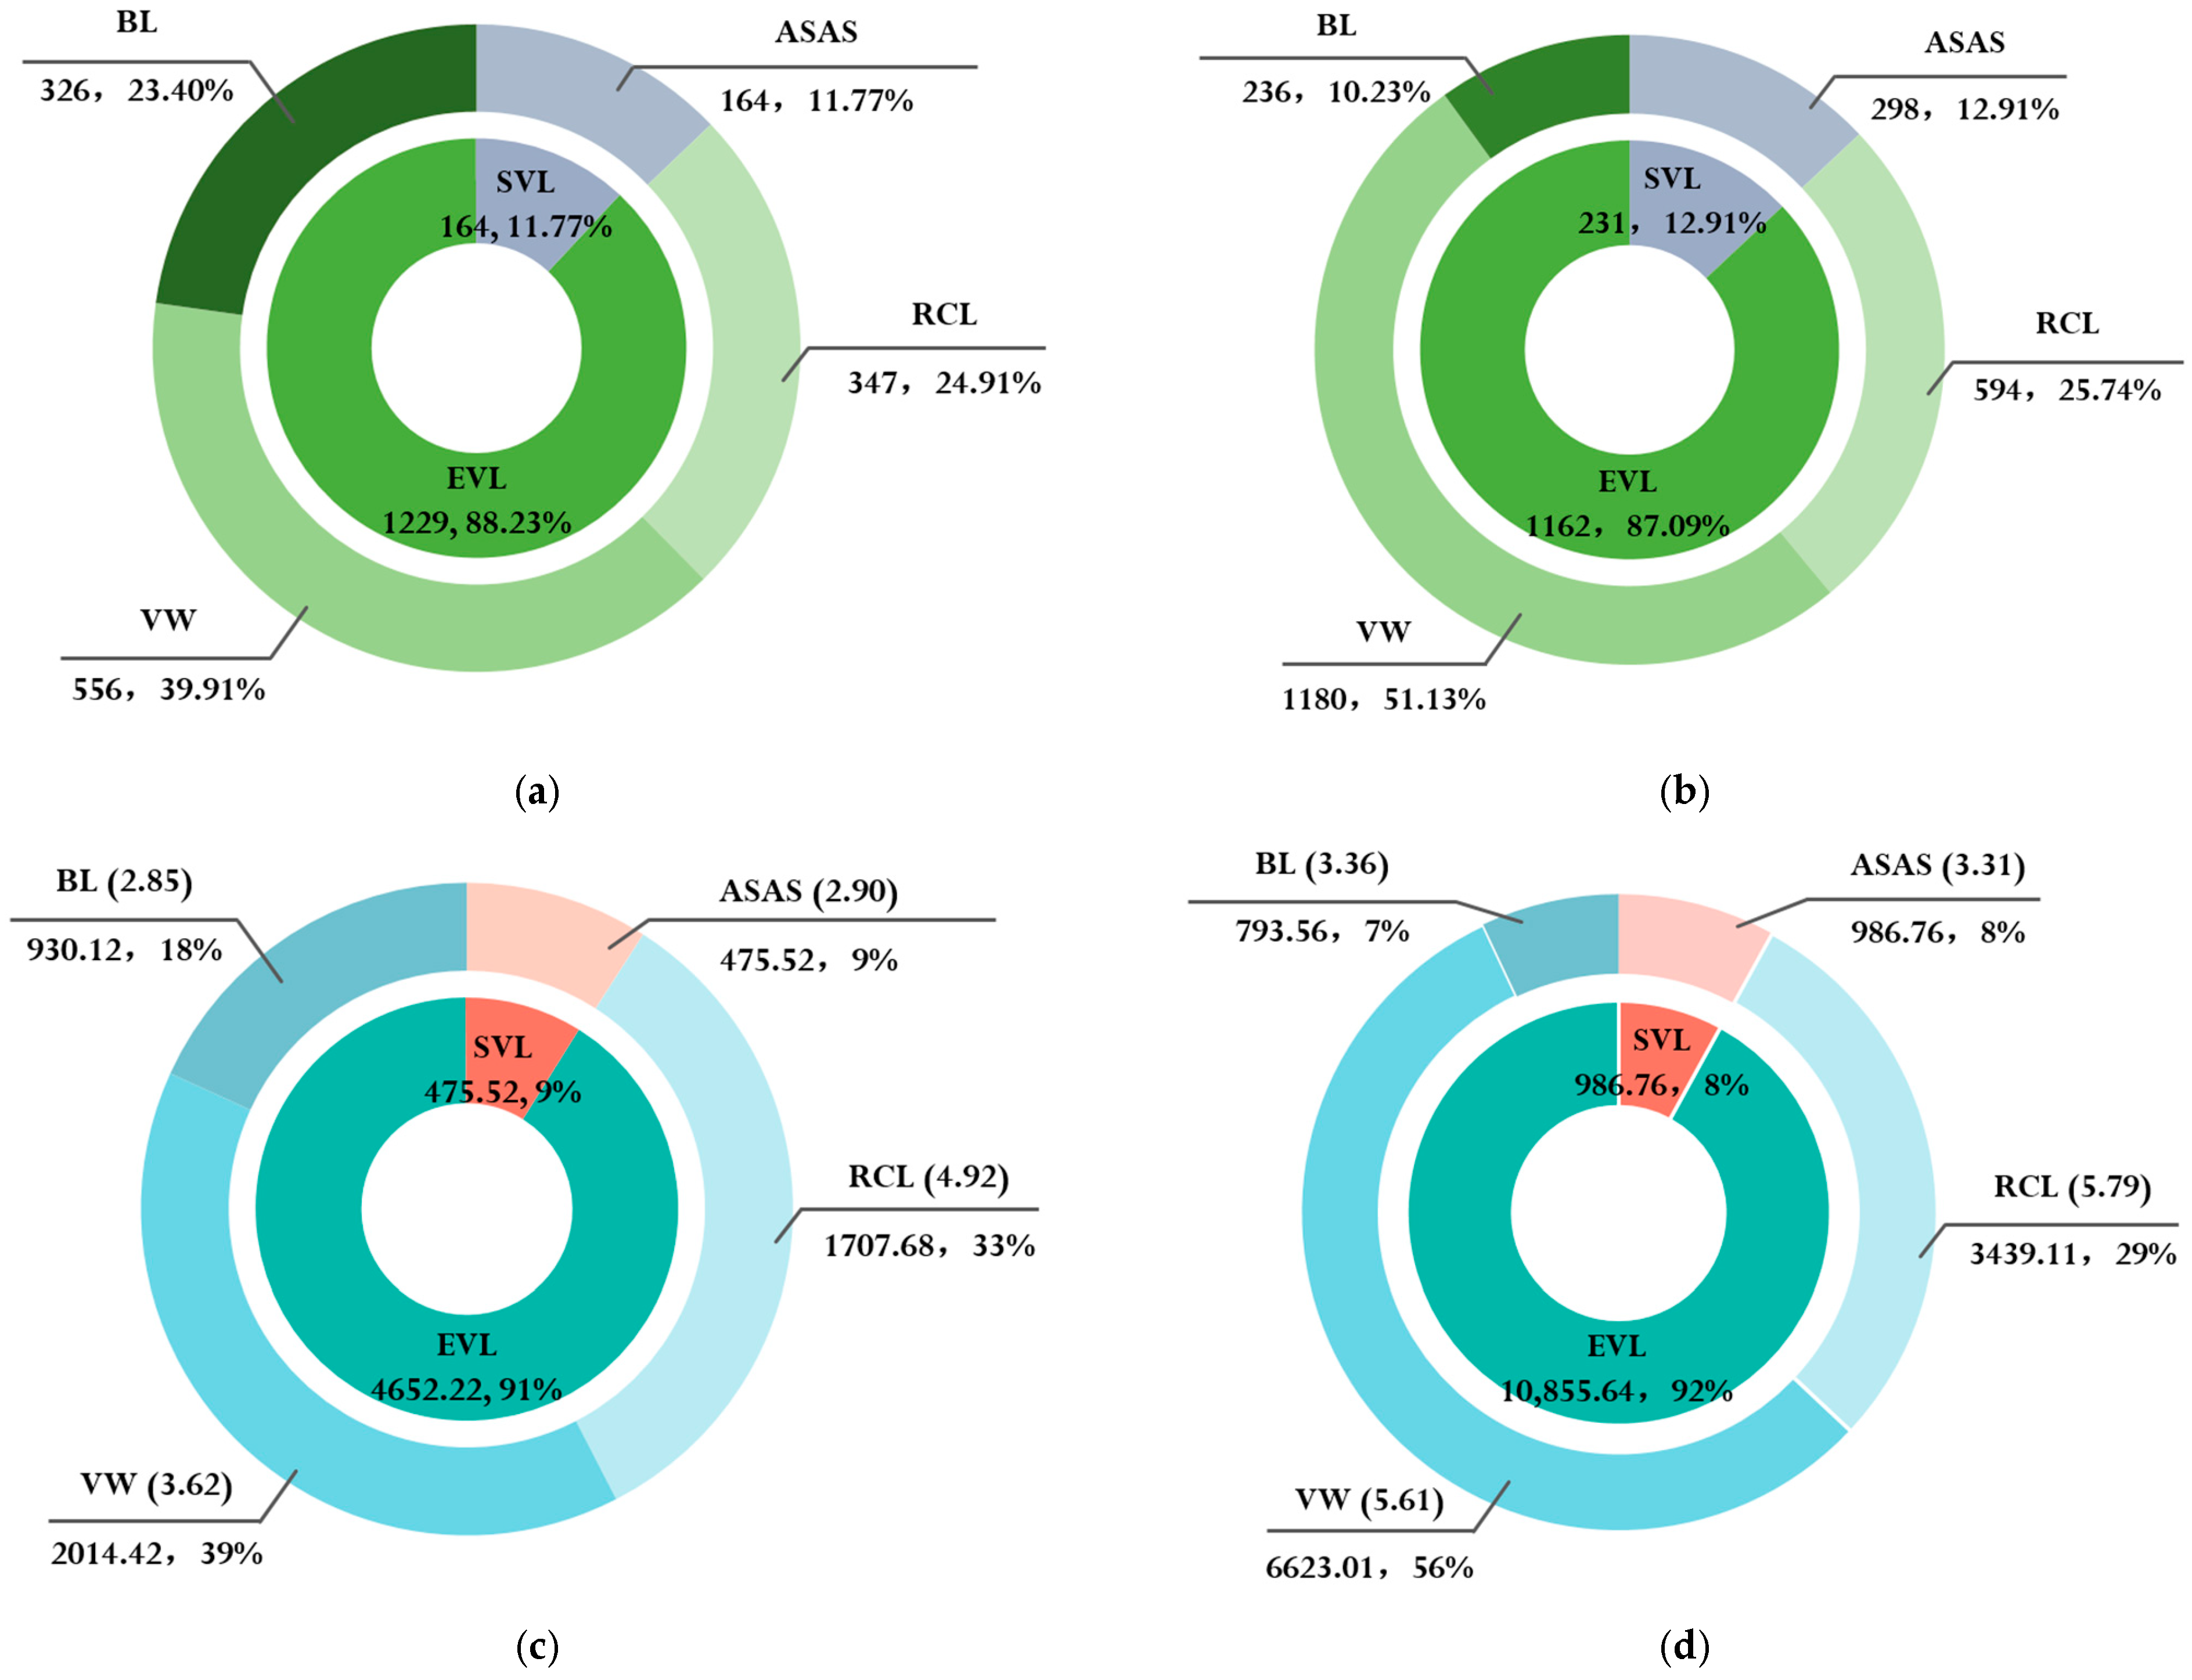
In 2021, there were 1393 plots of vacant land in the main urban area of Chongqing, with a total area of 5127.73 hectares, accounting for 7.37% of the total built-up area (Figure 8). Among them, there were 1229 plots of EVL, accounting for 63.31% of the total number of UVL. In terms of area, the total area of EVL was 4652.22 hectares, accounting for about 90.73% of the UVL area.
Figure 8.
Statistical Chart of Urban Vacant Land Quantity and Area. (a) Overview of Urban Vacant Land Quantity in 2021; (b) Overview of Urban Vacant Land Quantity in 2025; (c) Overview of Urban Vacant Land Area (ha) in 2021; (d) Overview of Urban Vacant Land Area (ha) in 2025. Note: The values in parentheses represent the average patch area.
In 2025, the scale of UVL in the study area showed a significant growth trend, with a total of 2308 plots and a total area of 11,842.43 hectares, accounting for 16.98% of the total built-up area in the same year. Compared to 2021, the number of vacant lots increased by 65.69%, indicating an expansion trend in the scale of urban vacant land. From the perspective of type structure, EVL still occupied an absolute dominant position, with 2010 plots (accounting for 87.09%) and a total area of 10,855.68 hectares (accounting for 91.67%).
3.2. Spatial Distribution of Urban Vacant Land
3.2.1. Density Characteristics
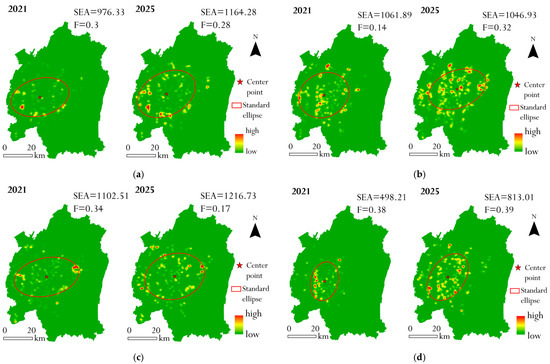
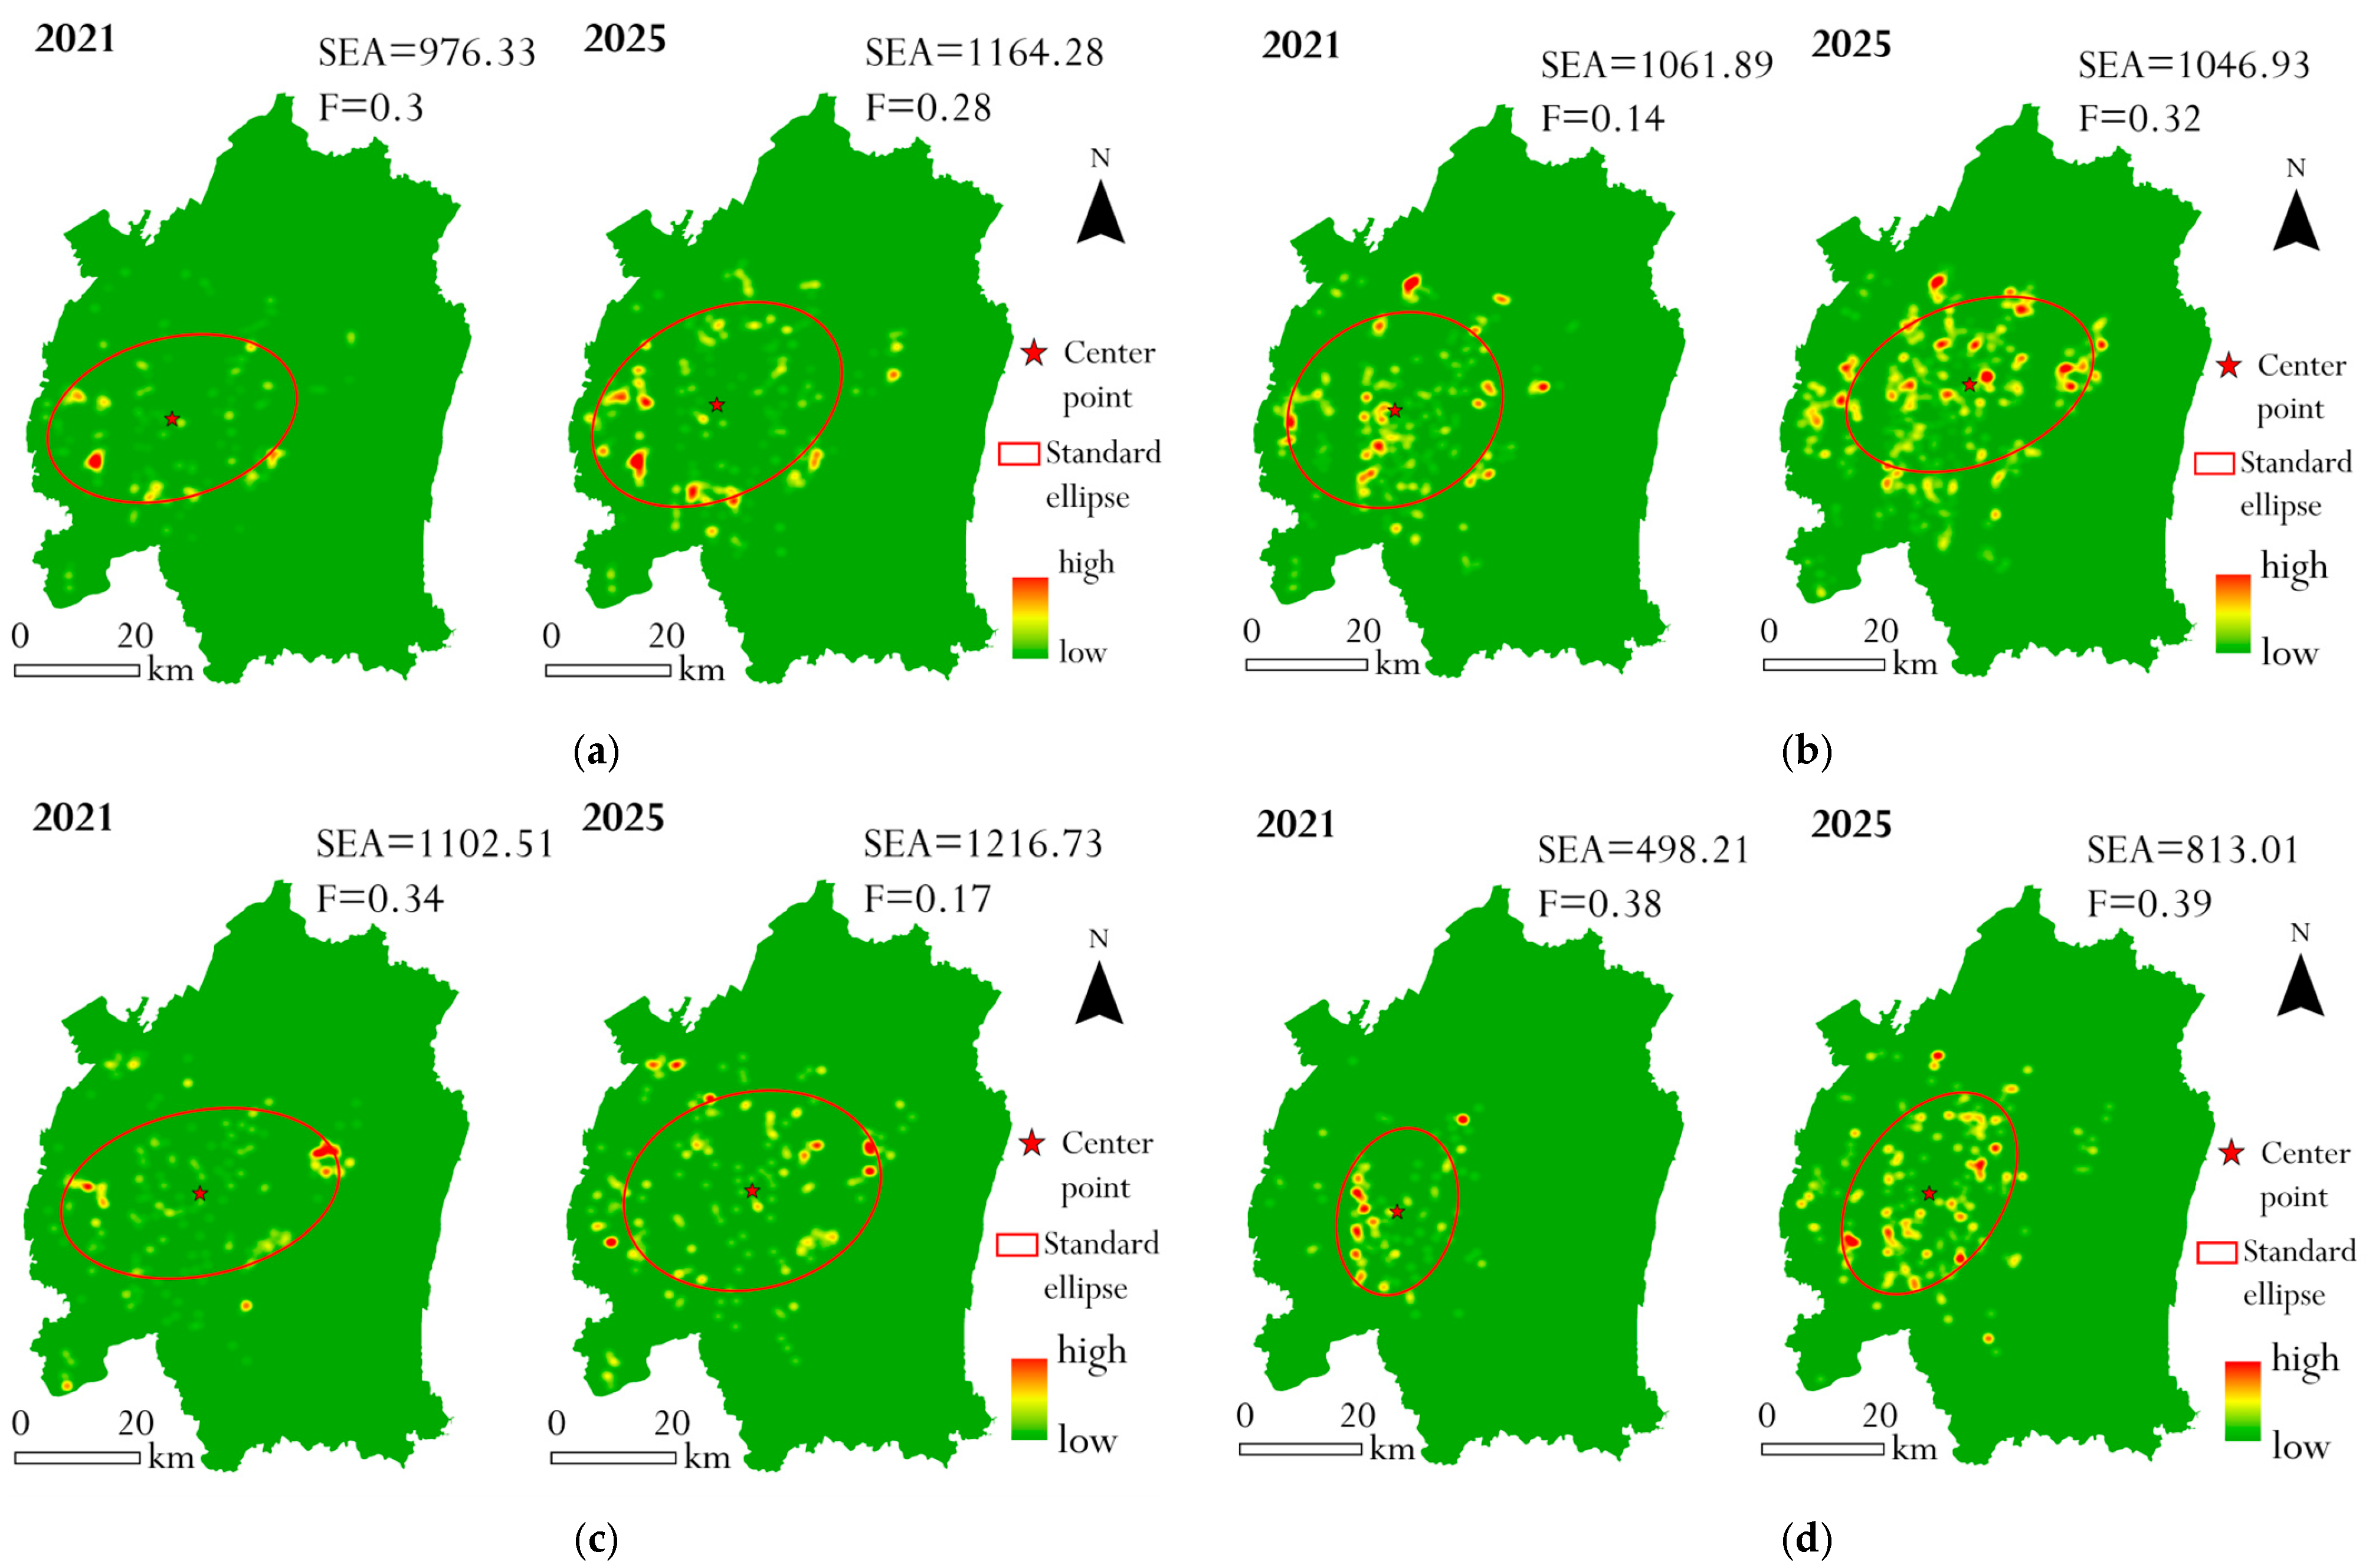
During the study period, the distribution range of all types of vacant land expanded to varying degrees, and the growth magnitude of SVL was significantly greater than that of EVL (Figure 9). The area of the standard deviation ellipse for SVL increased from 498.21 square kilometers to 813.01 square kilometers, with an increase of 63.2%. In addition, the oblateness of SVL consistently maintained the highest value among the four types of vacant land, and its distribution demonstrated stronger directionality than EVL. Furthermore, RCL was mainly distributed in the southeastern part of the city, while both VW and BL showed a northward tilting trend.
Figure 9.
Kernel Density Analysis Maps of Various Land Use Types. (a) RCL; (b) VW; (c) BL; (d) ASAS. Note: SEA: Standard Ellipse Area, unit: square kilometer; F: Flattening.
3.2.2. Correlation Characteristics
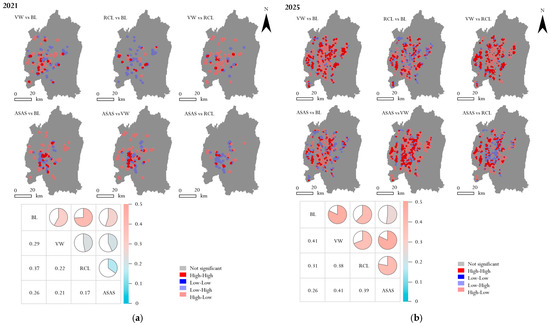
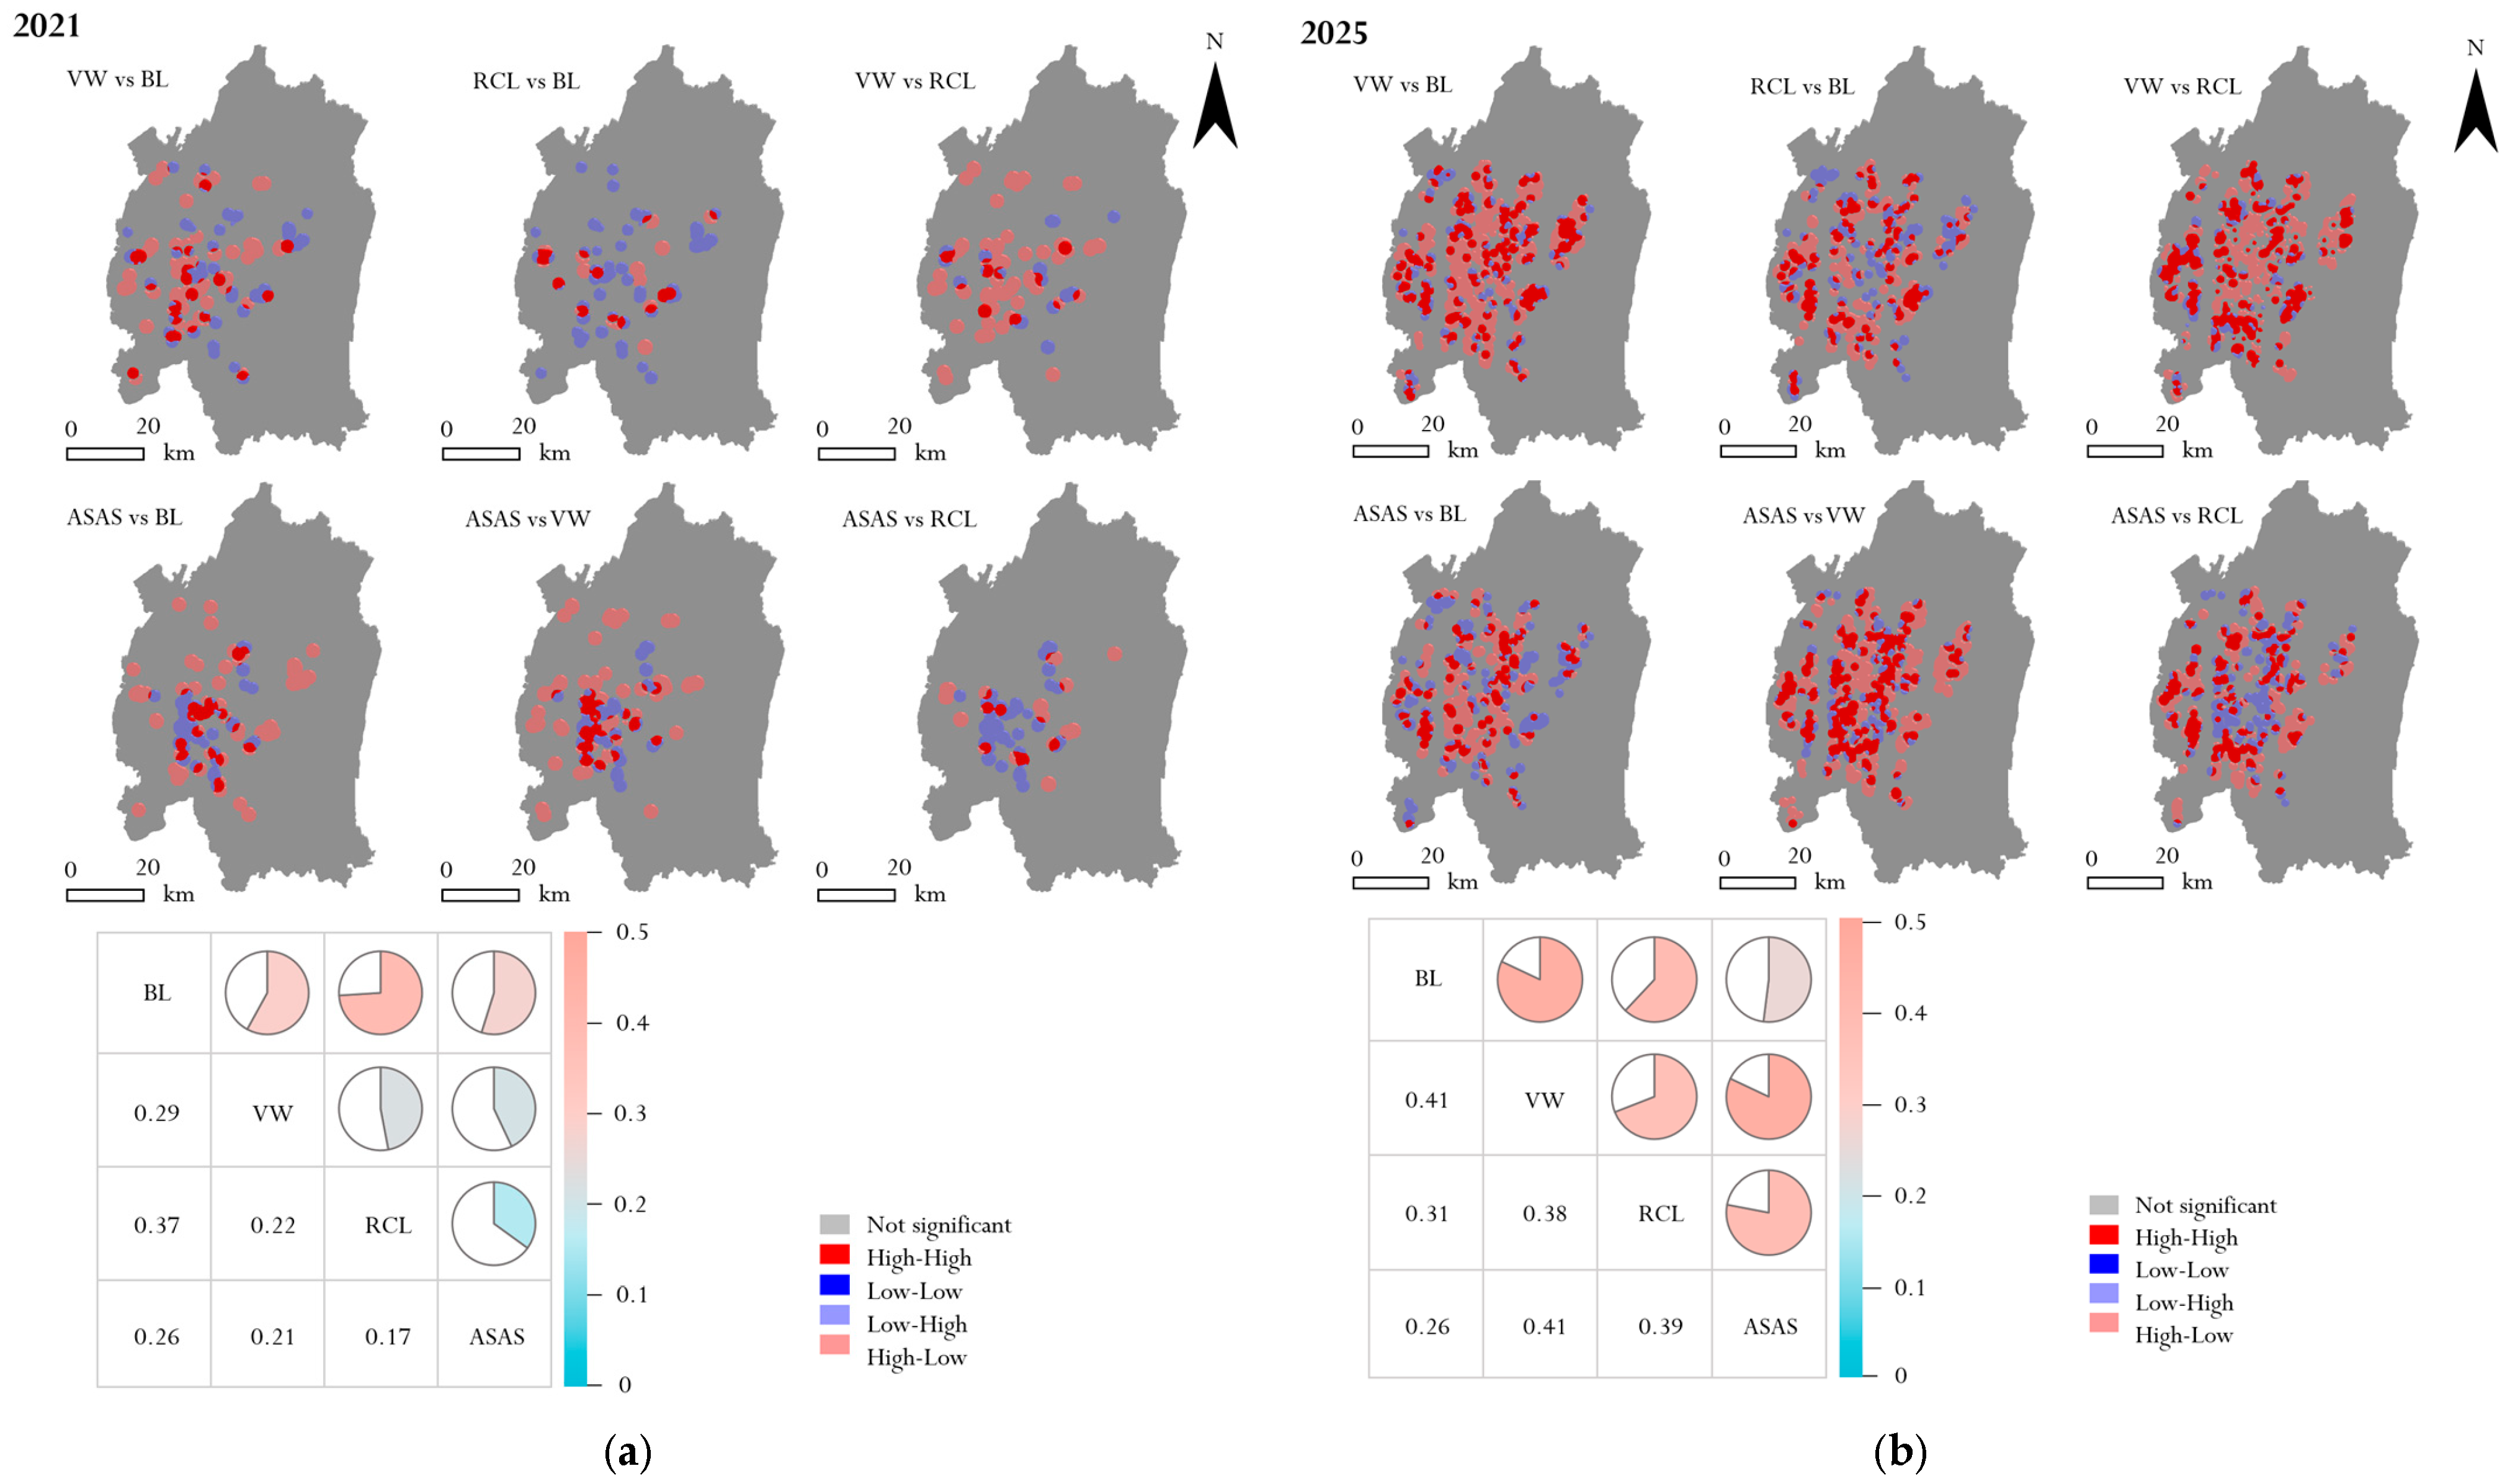
In 2021, the internal spatial correlation of EVL was relatively strong (Figure 10). Among them, the correlation between RCL and BL was the strongest (I = 0.37). The correlation strength between SVL (ASAS) and EVL was generally low. EVL was mainly distributed in newly developed areas on the urban periphery, whereas SVL was scattered in the core areas of old urban districts. The spatial differentiation between the two types of vacant land resulted in low interactive correlation.
Figure 10.
Urban Vacant Land Correlation Characteristics Map Land Use Types. (a) Bivariate Spatial Autocorrelation Results for 2021. (b) Bivariate Spatial Autocorrelation Results for 2025. Note: The p-value of all correlation combinations is 0.001, and the z-value for all combinations is greater than 2.58.
In 2025, the overall positive correlation strength of the internal correlation within EVL increased significantly compared with 2021. The correlation strength between BL and VW rose from 0.29 in 2021 to 0.41, representing the strongest combination among all correlations. Notably, the correlation strength between SVL (ASAS) and EVL was enhanced, with the strongest correlation detected with VW (I = 0.4072), reflecting an improvement in the spatial interactivity between the two types of vacant land.
3.3. Scenario Simulation of Urban Vacant Land Evolution
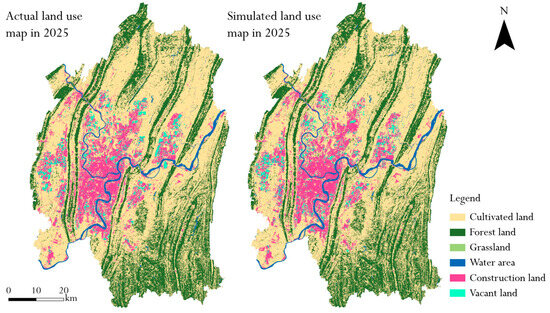
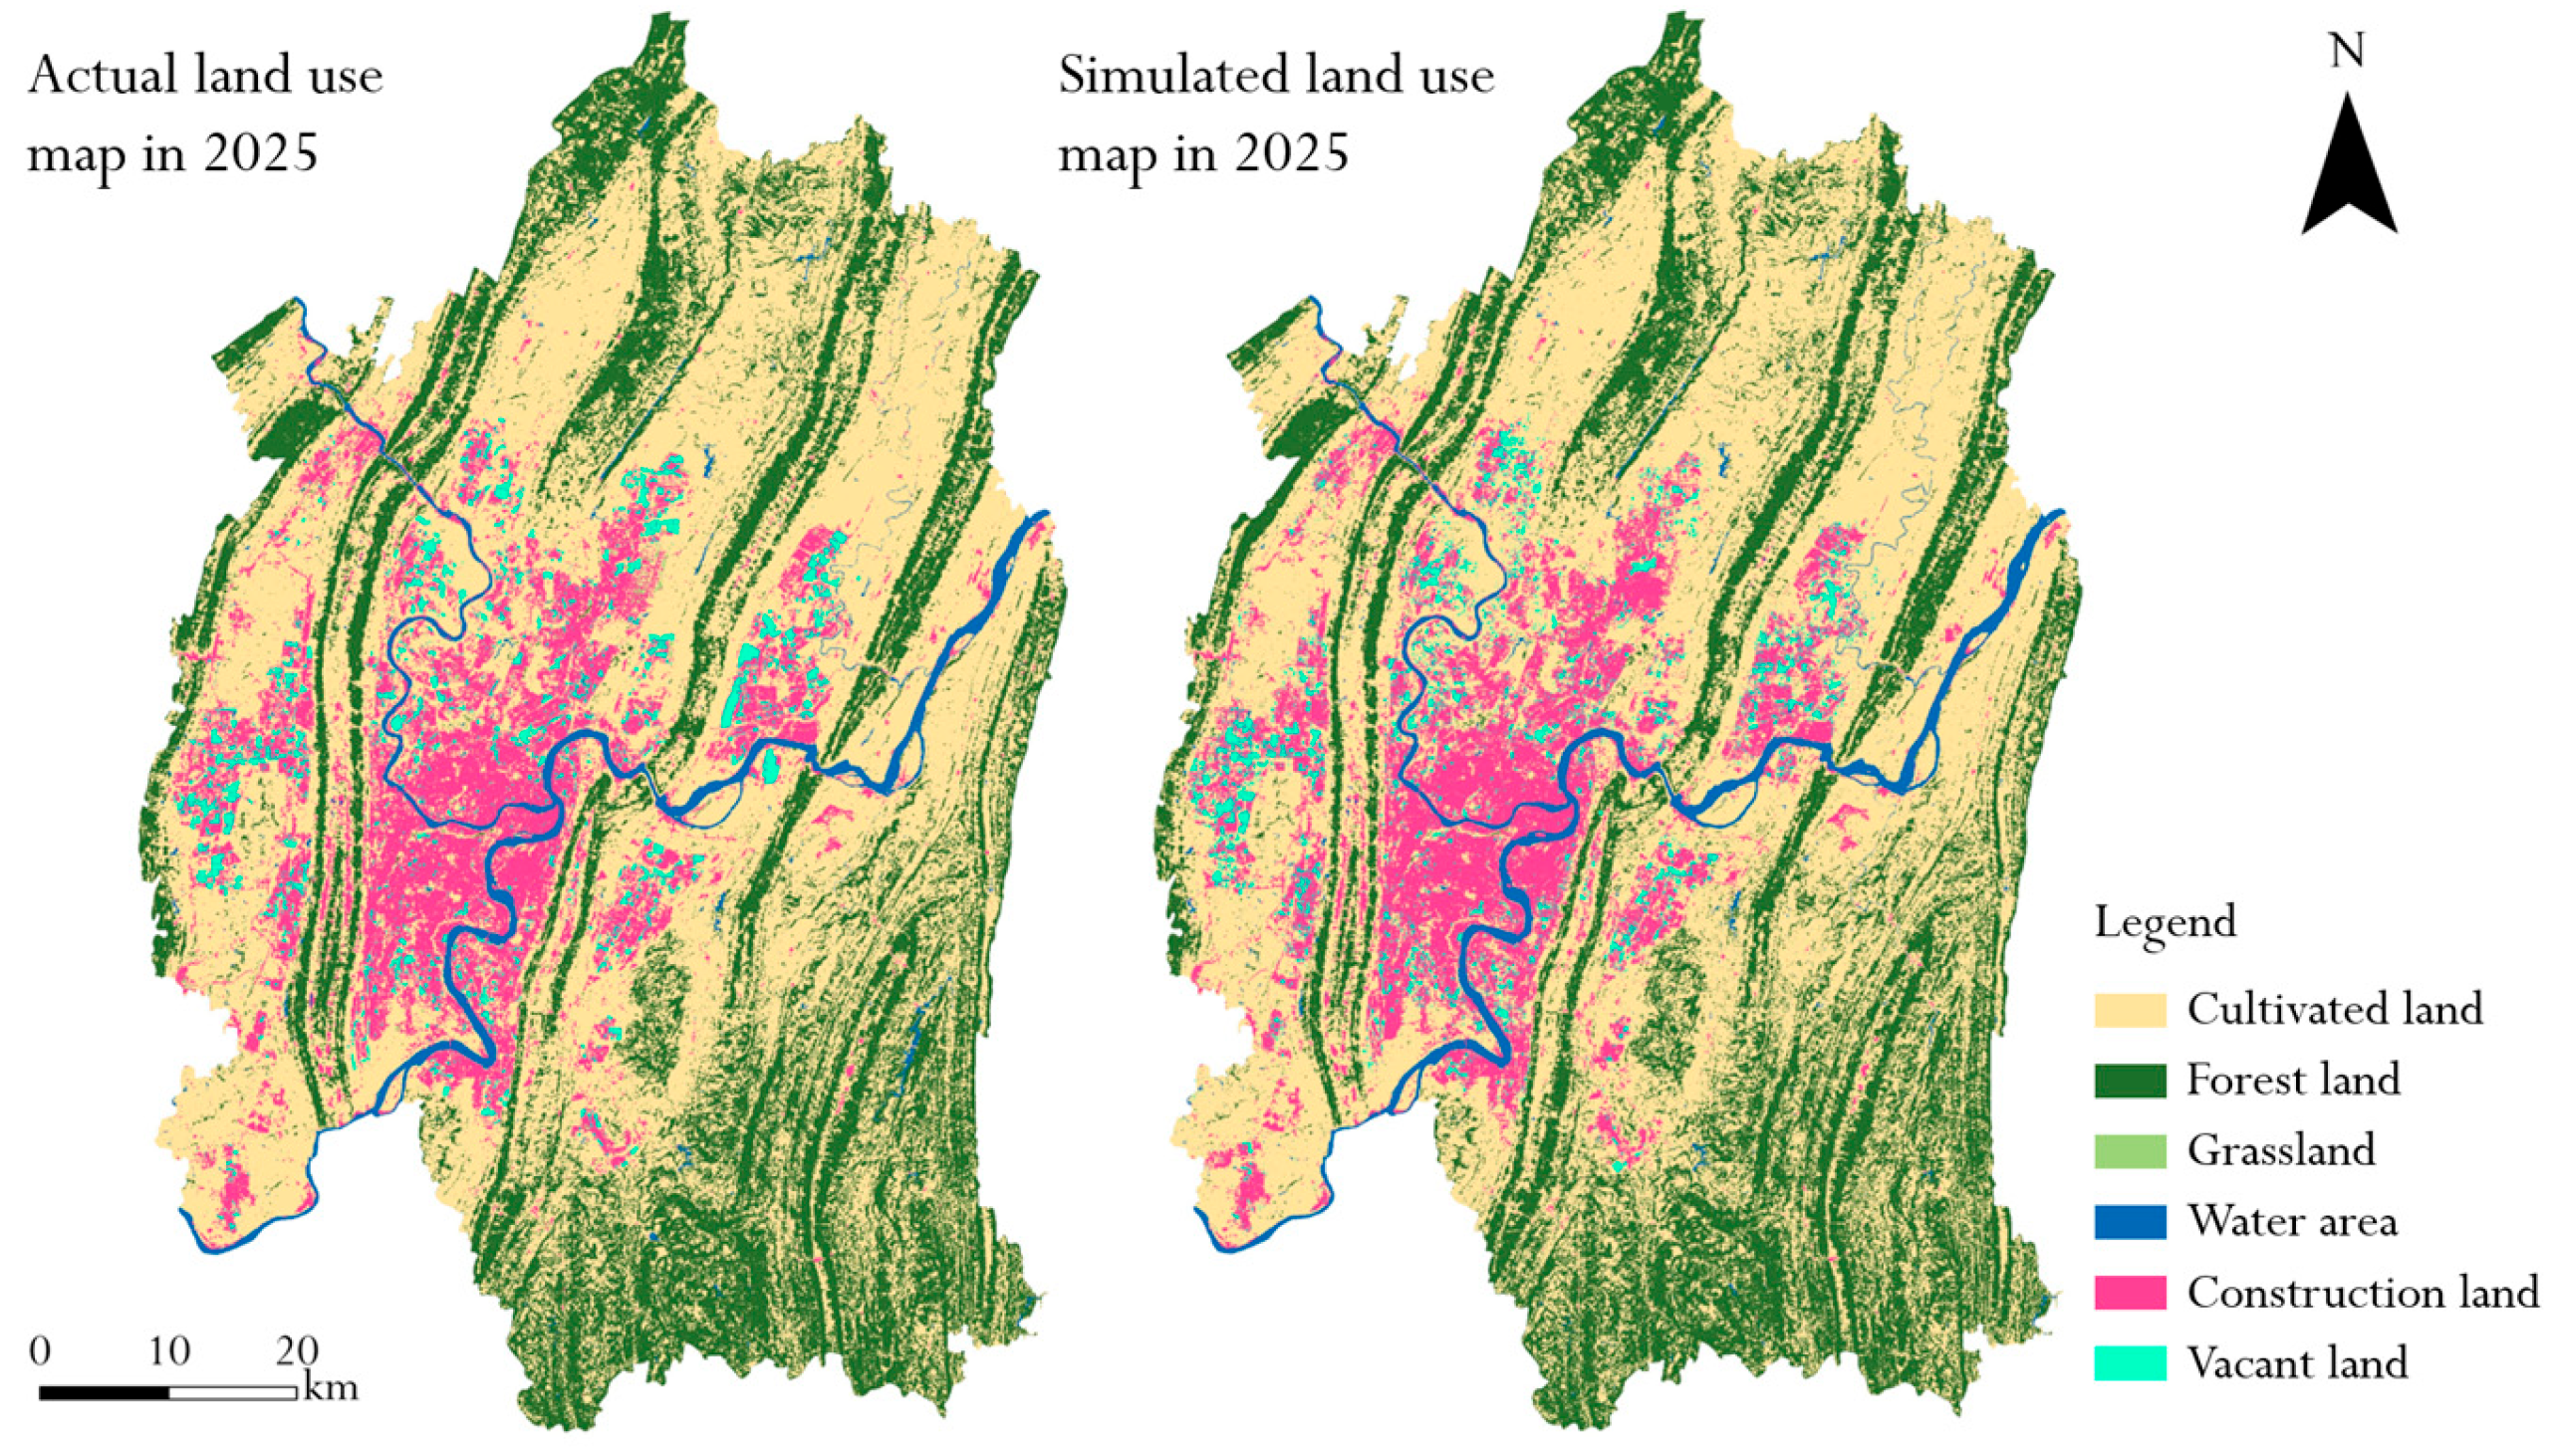
The overall accuracy (OA) of the PLUS model simulation reached 0.90, with a Kappa coefficient of 0.83. The following is a comparison between the simulated image and the actual image for 2025 (Figure 11). In addition, based on the ArcGIS Pro software, this study adopted the stratified random sampling method to construct a validation sample library, and randomly generated 300 validation sample points in proportion. The calculated Producer’s Accuracy (PA) and User’s Accuracy (UA) of the vacant land category were 0.63 and 0.70 respectively. All indicators met the simulation accuracy standards, which fully demonstrates that the simulation results of this model are highly reliable and scientific.
Figure 11.
2025 Land Use Actual vs. Simulated Comparison Map.
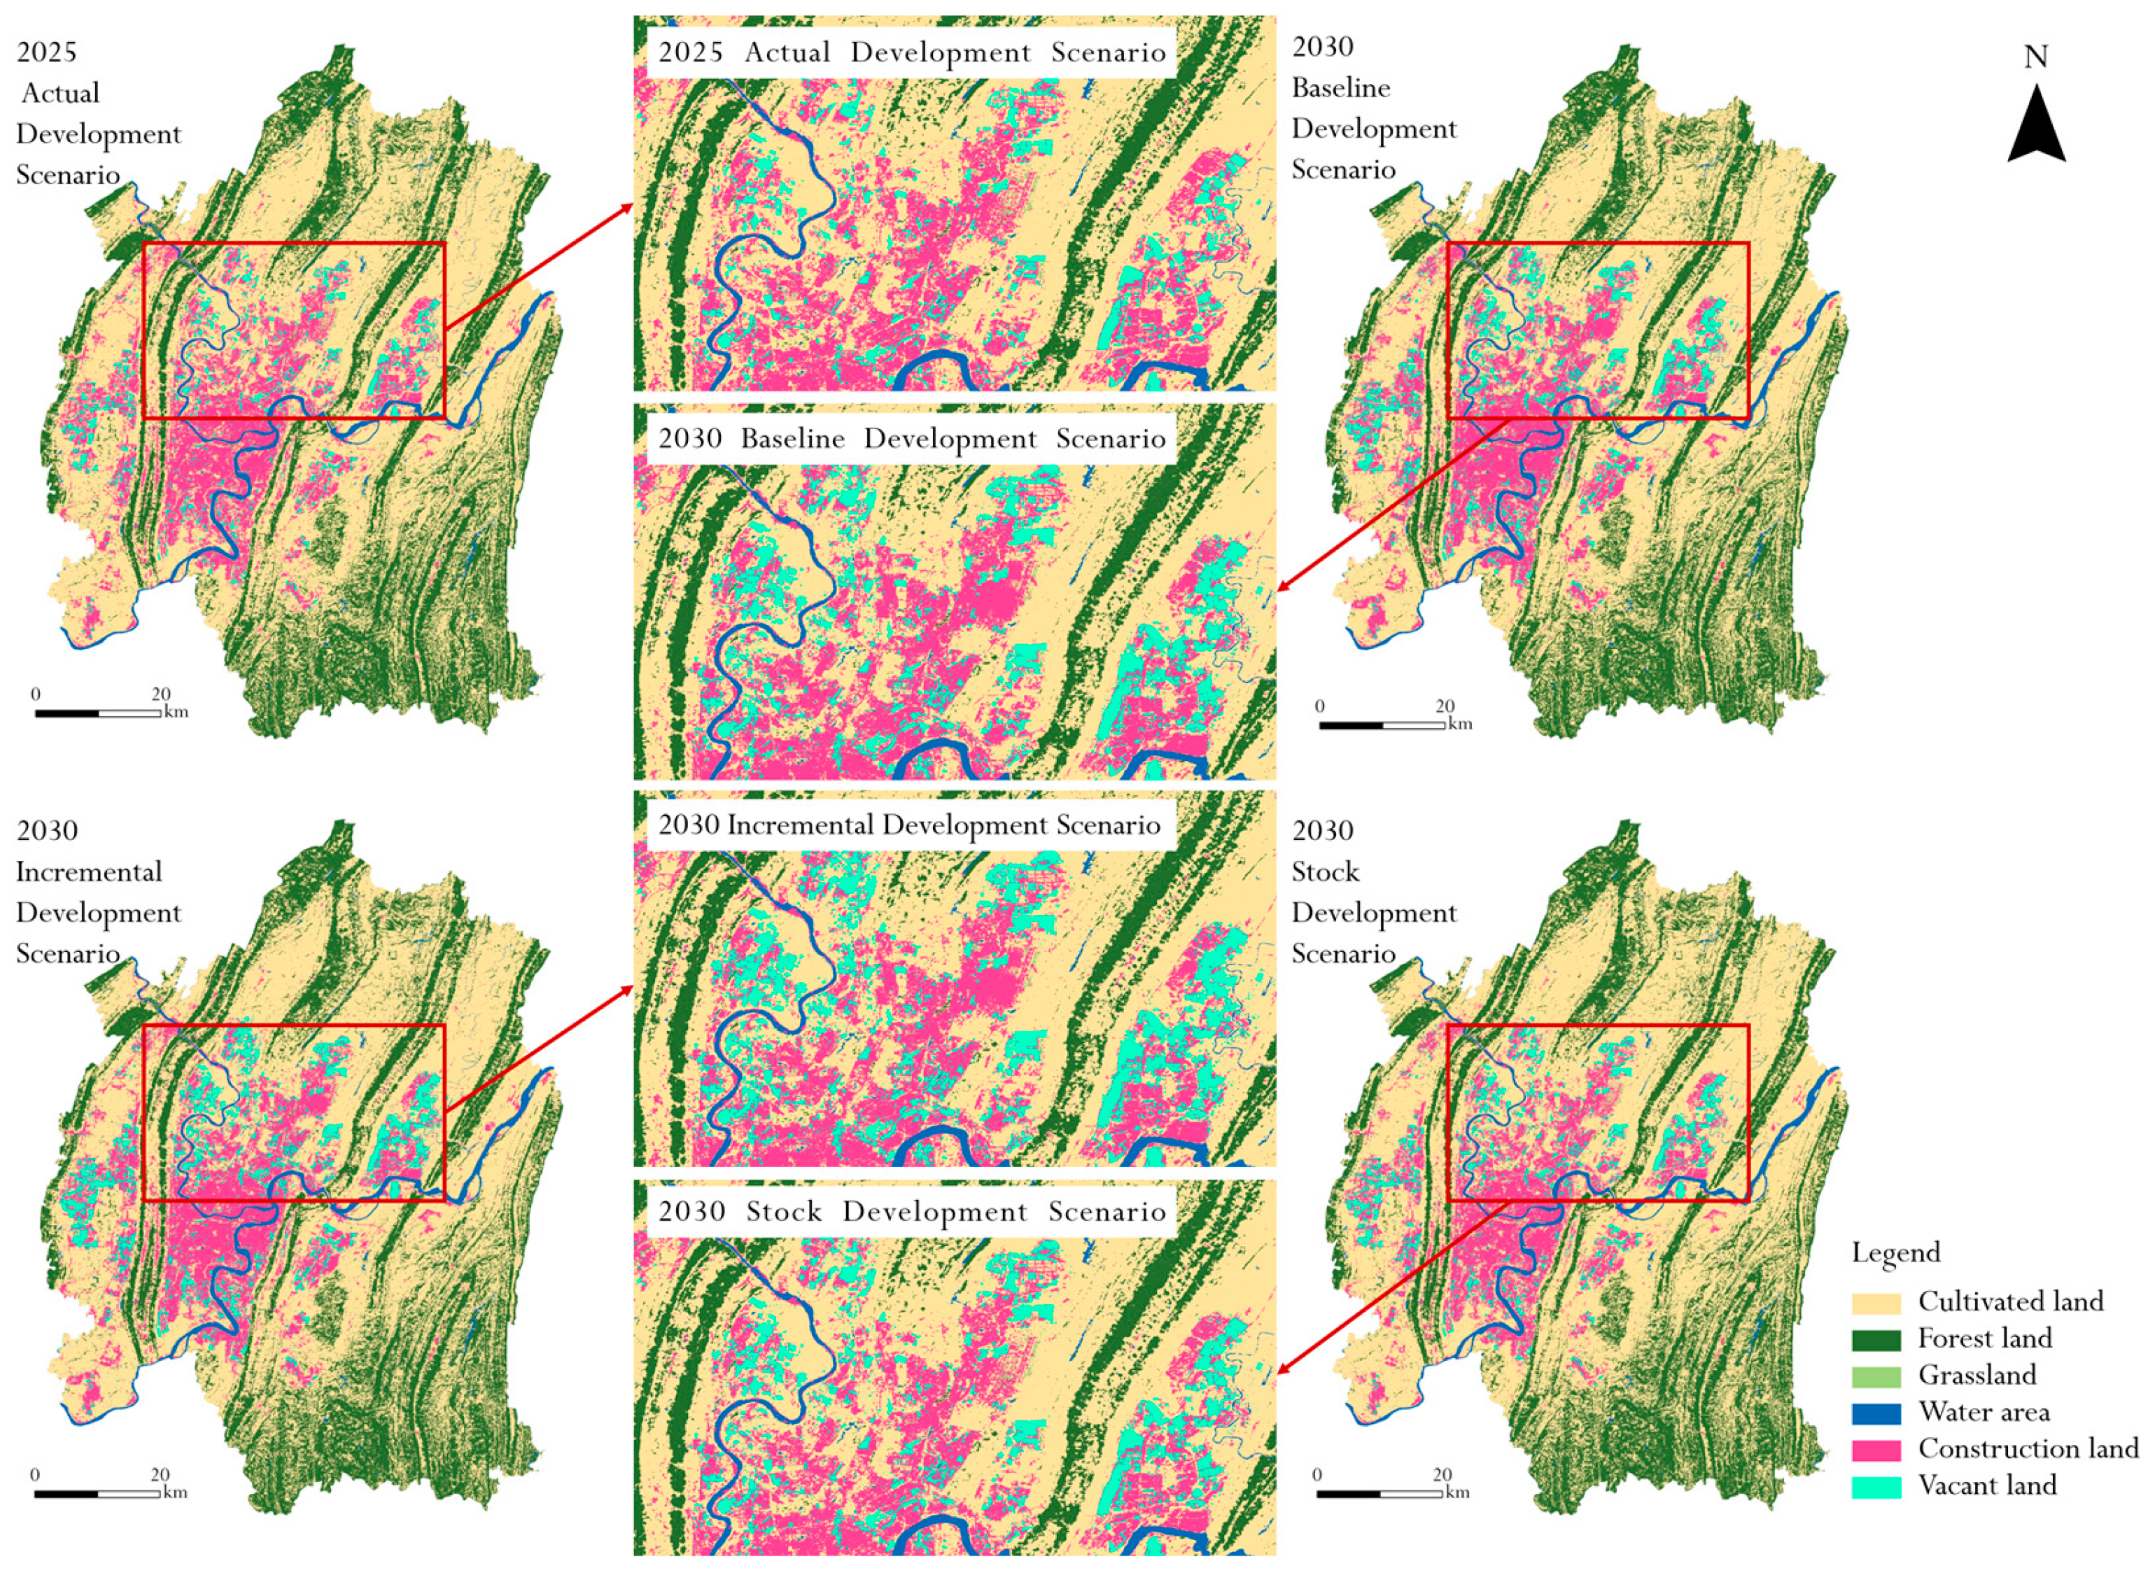
The actual land use status in 2025 and the spatial distribution of land use under the Baseline Development Scenario, Incremental Development Scenario and Stock Development Scenario in 2030 are shown in Figure 12. From the perspective of the spatial morphology of urban vacant land (UVL), vacant land shows a trend of outward expansion under all three scenarios. Among them, under the Incremental Development Scenario, the distribution range of vacant land is the widest, mainly concentrated in Shapingba District and Liangjiang New Area, presenting an overall tilting trend of northward expansion. Under the Stock Development Scenario, the scope of vacant land shrinks to the minimum, and the internal stock space of the city is exploited and utilized more efficiently.
Figure 12.
Scenario Simulation Evolution Map.
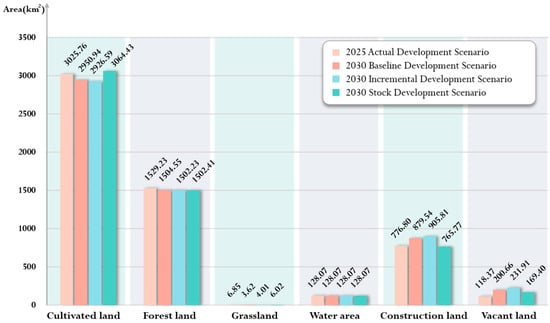
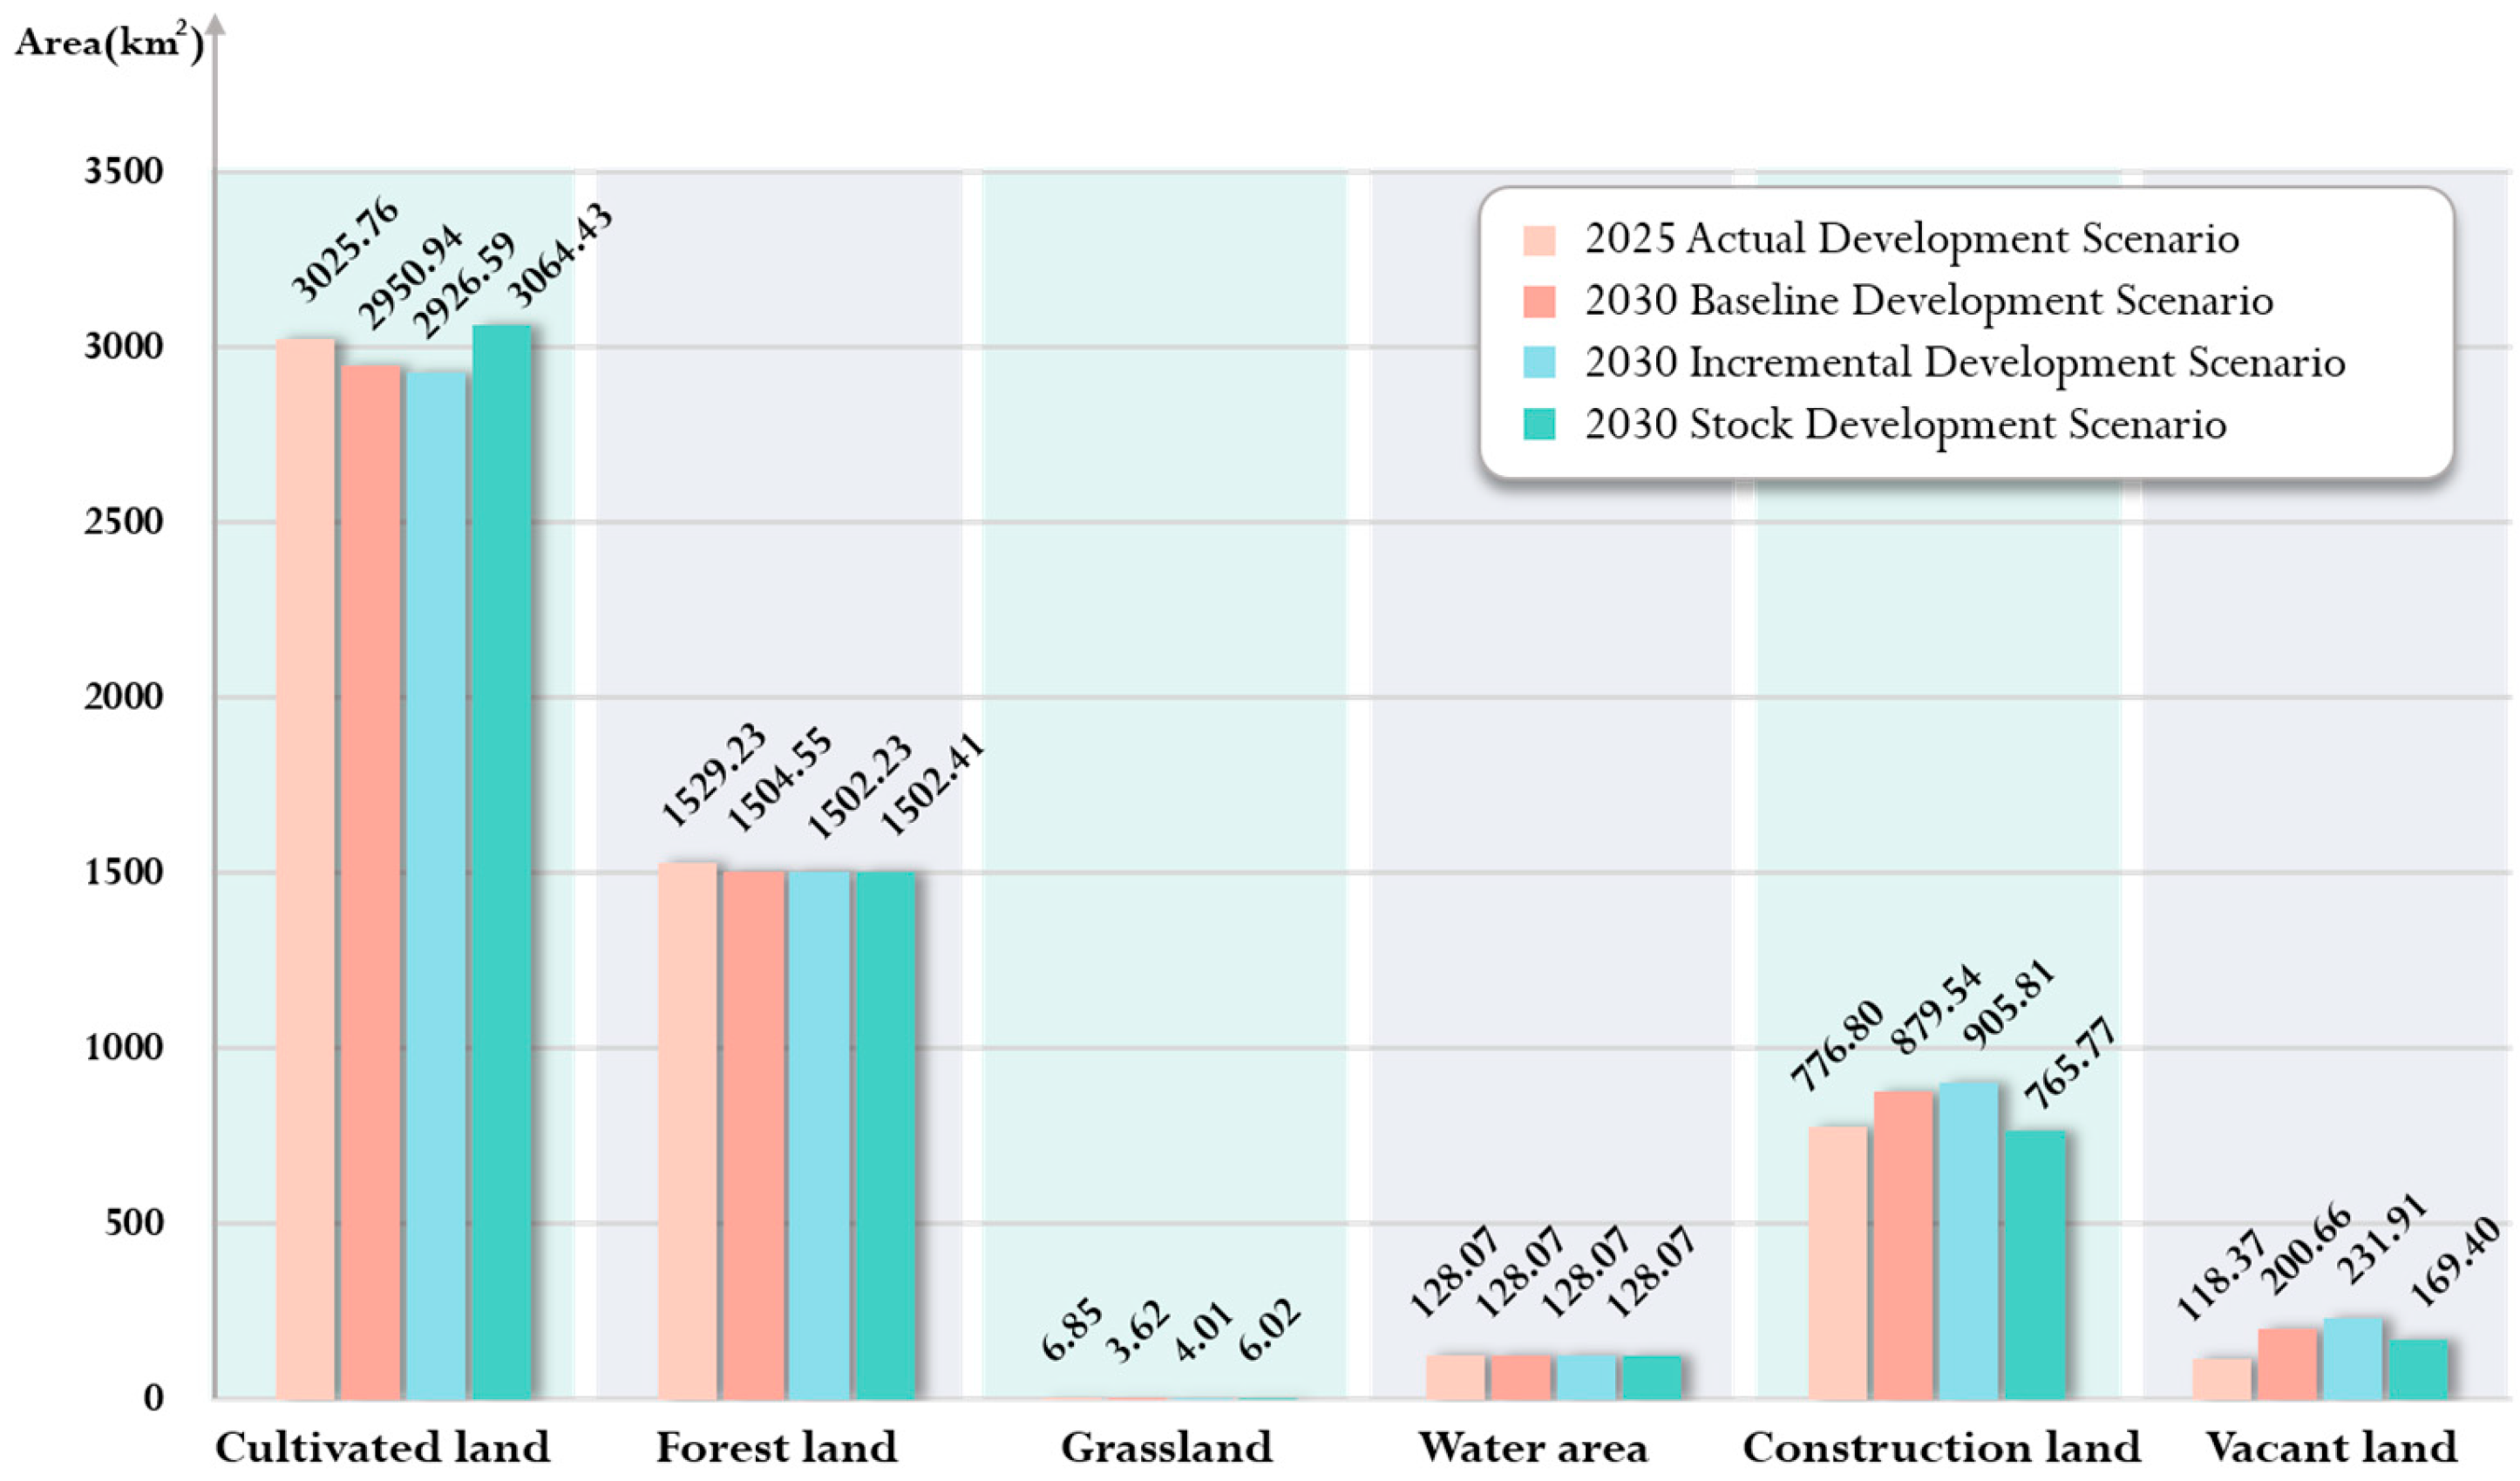
The area of each land use type under different scenarios is statistically shown in the following Figure 13. Under the Baseline Development Scenario, Incremental Development Scenario and Stock Development Scenario, the area of urban vacant land (UVL) increases from 118.37 square kilometers in 2025 to 200.66 square kilometers, 231.91 square kilometers and 169.40 square kilometers respectively, with growth rates of 69.52%, 95.93% and 43.12% in sequence, making it the land use type with the most significant changes.
Figure 13.
Area of Various Land Use Types Under Different Scenarios.
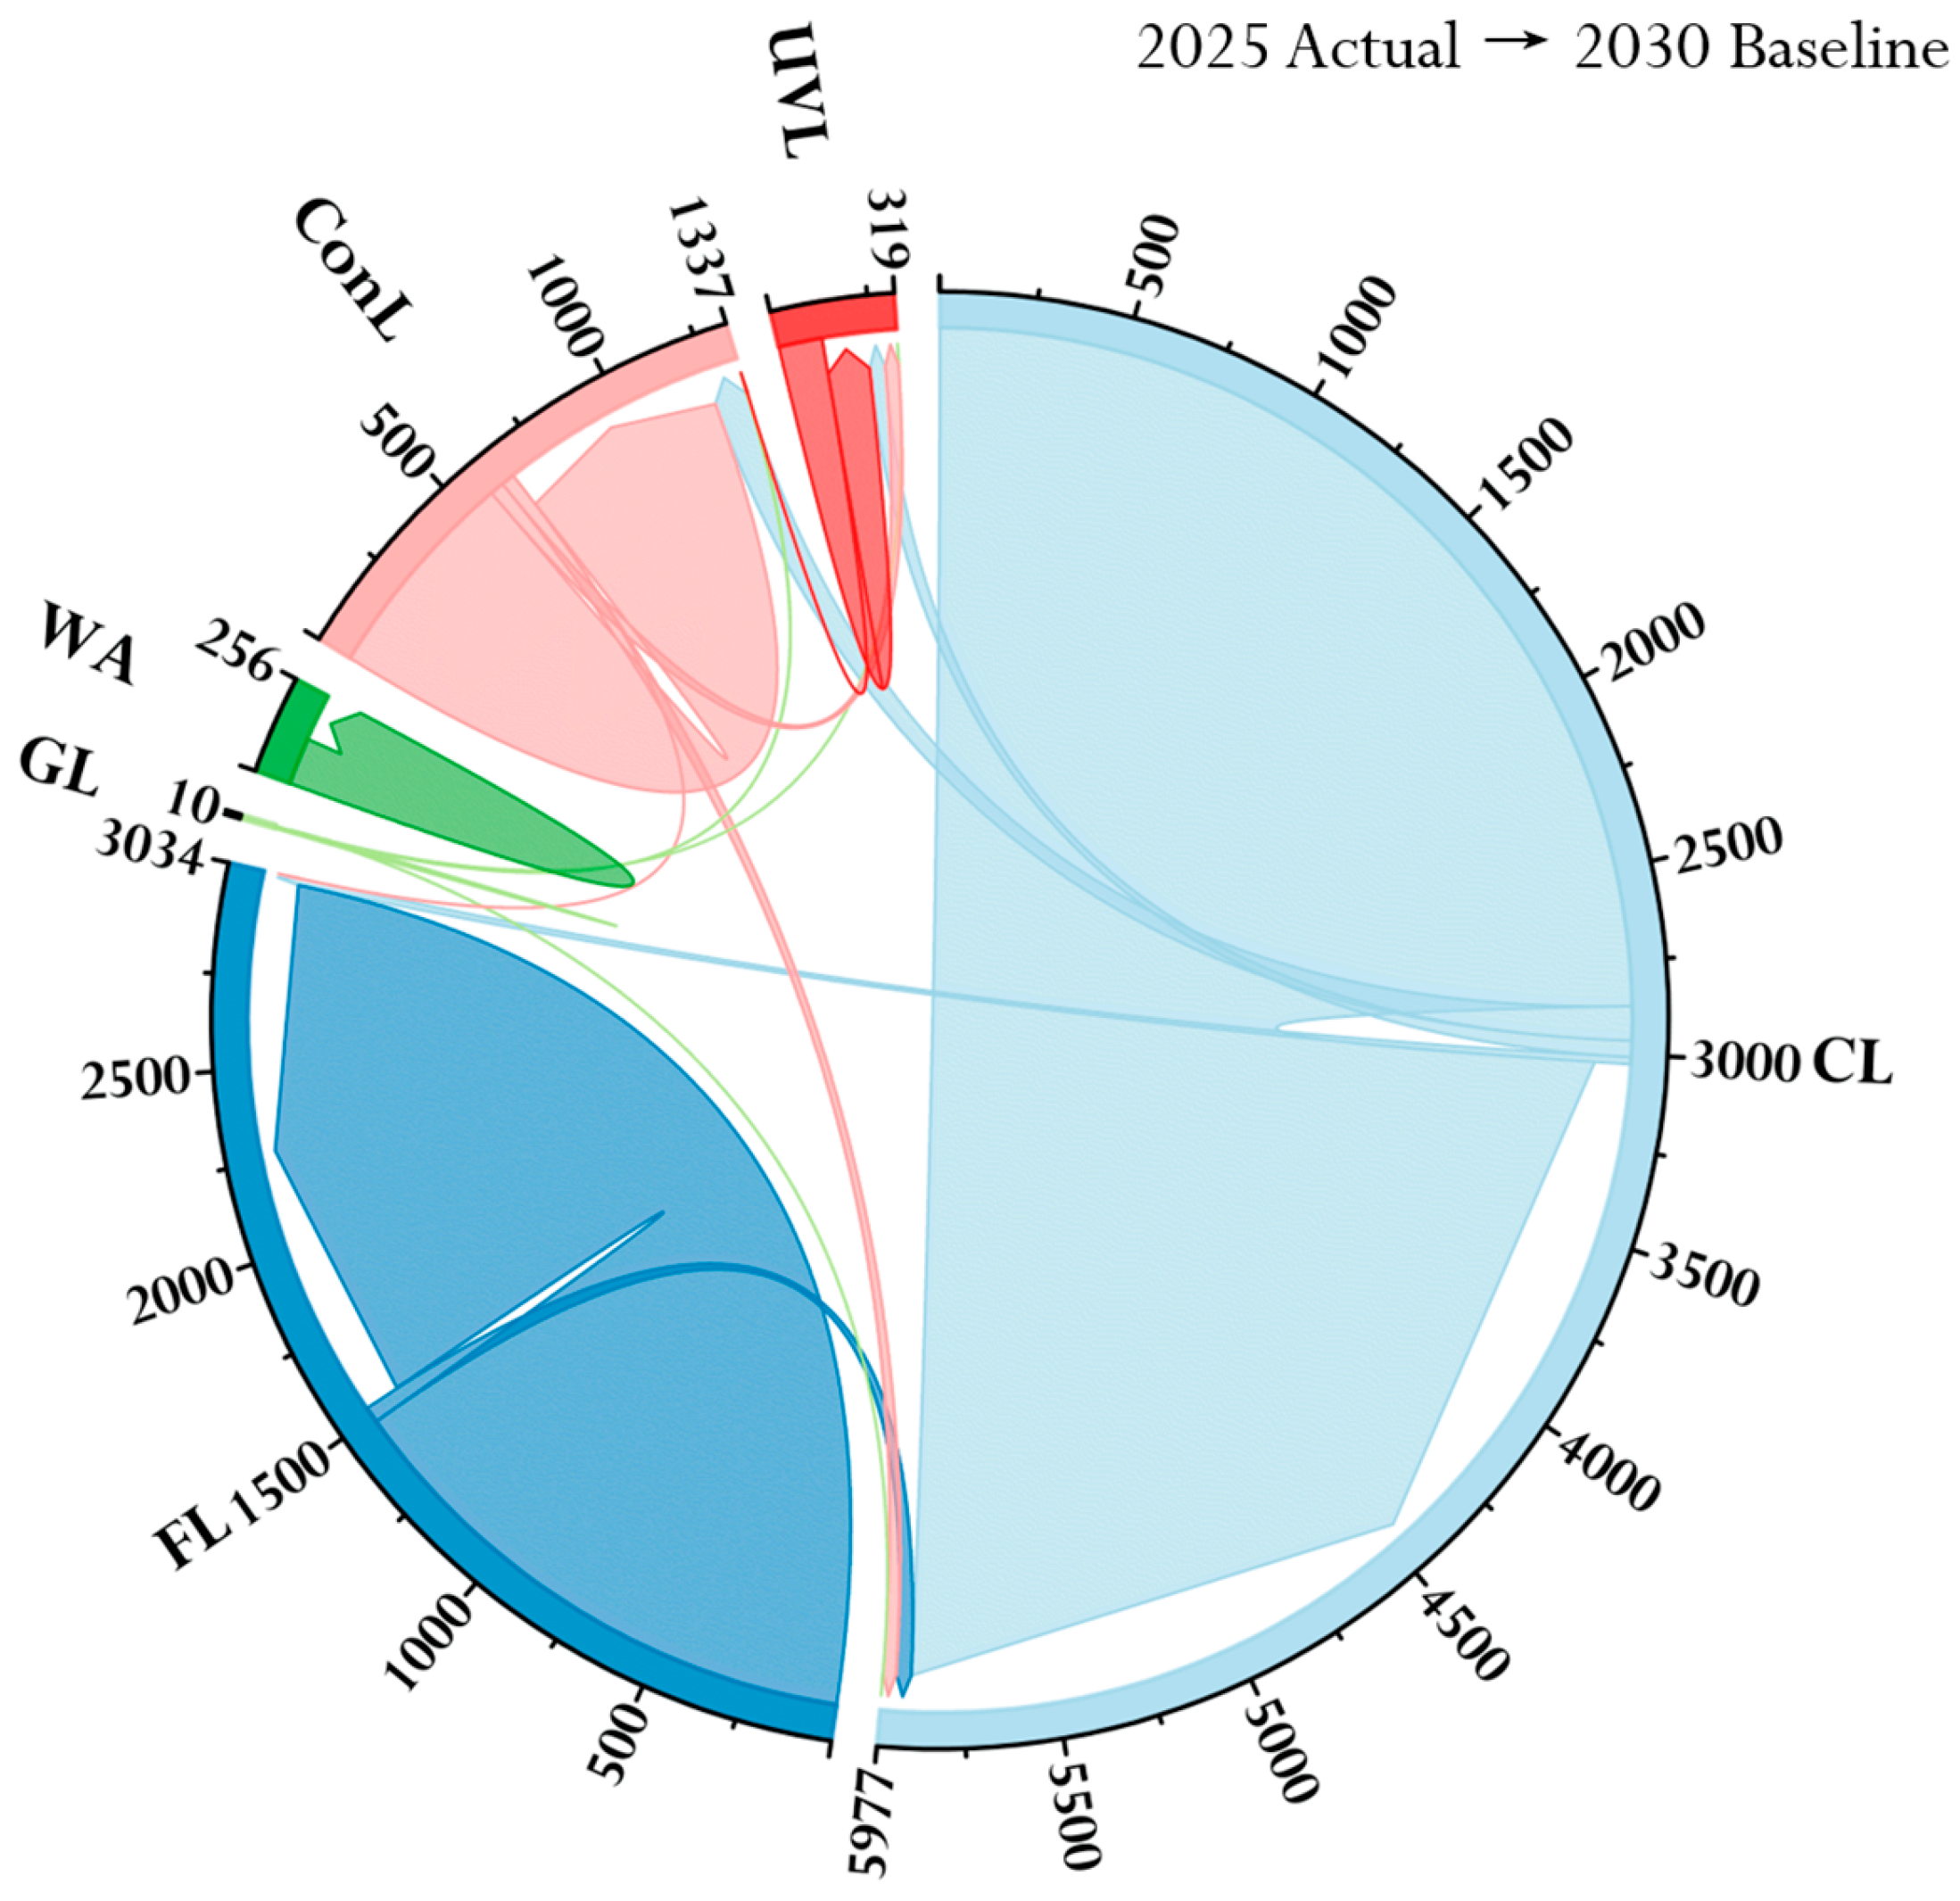
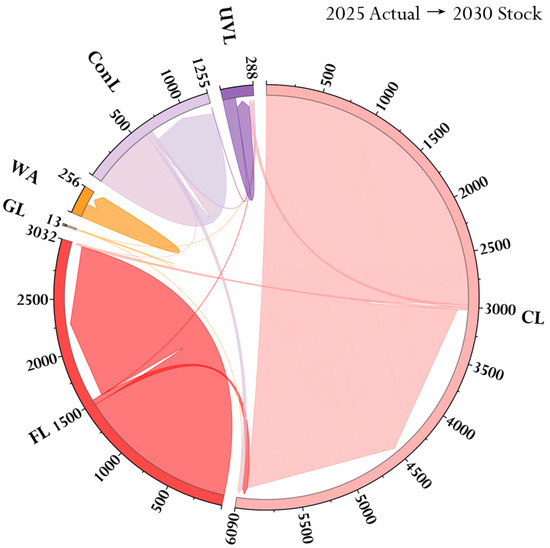
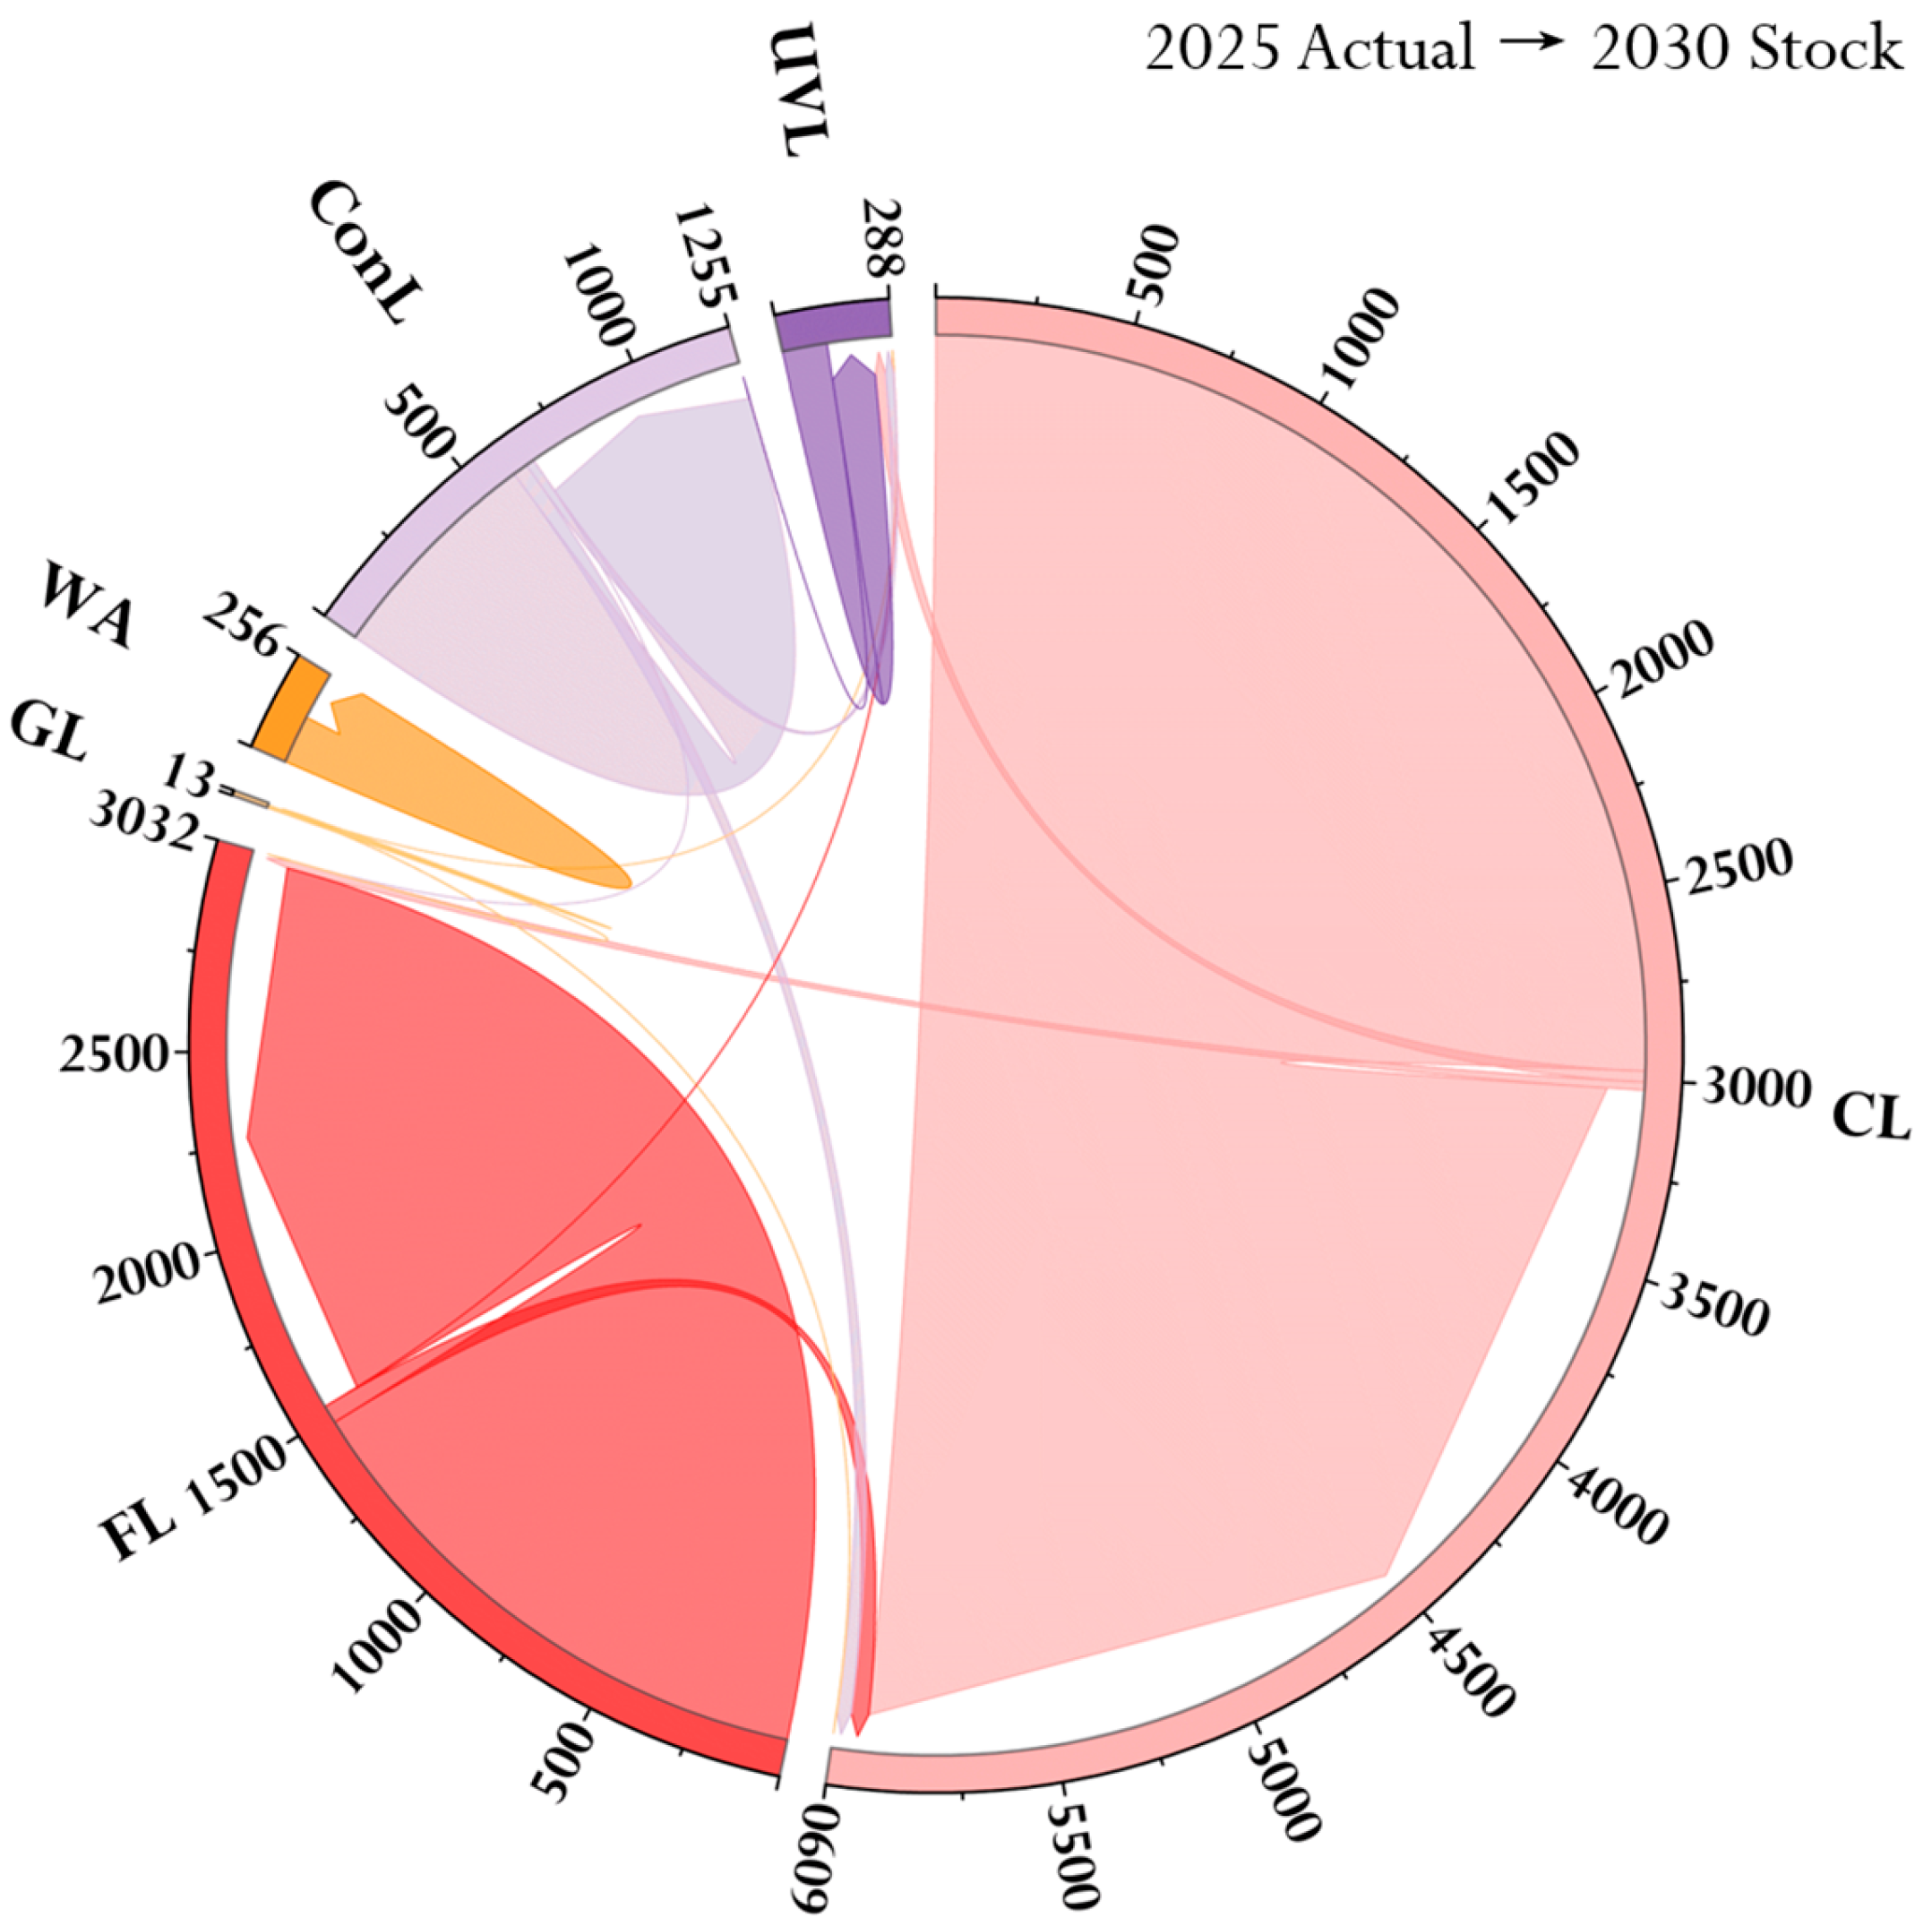
The transfer areas for each land category under the baseline, incremental, and stock development scenarios from 2025 to 2030 are shown in Figure 14, Figure 15 and Figure 16. In the Baseline Development Scenario, various types of ecological land are gradually converted into built-up areas. By 2030, the total reduction of the three types of ecological land (Cultivated Land, Forest Land, Grassland) will be 102.73 square kilometers. The built-up area will increase by 102.74 square kilometers (with a growth rate of 13.23%), and urban vacant land (UVL) will increase by 82.29 square kilometers (with a growth rate of 69.52%). Under the baseline development model without intervention, land development efficiency is high, but land utilization efficiency is low. As a result, land fails to be utilized efficiently, giving rise to a certain scale of low-efficiency vacant land.
Figure 14.
Land Transfer Map from the 2025 Actual Development Scenario to the 2030 Baseline Development Scenario.
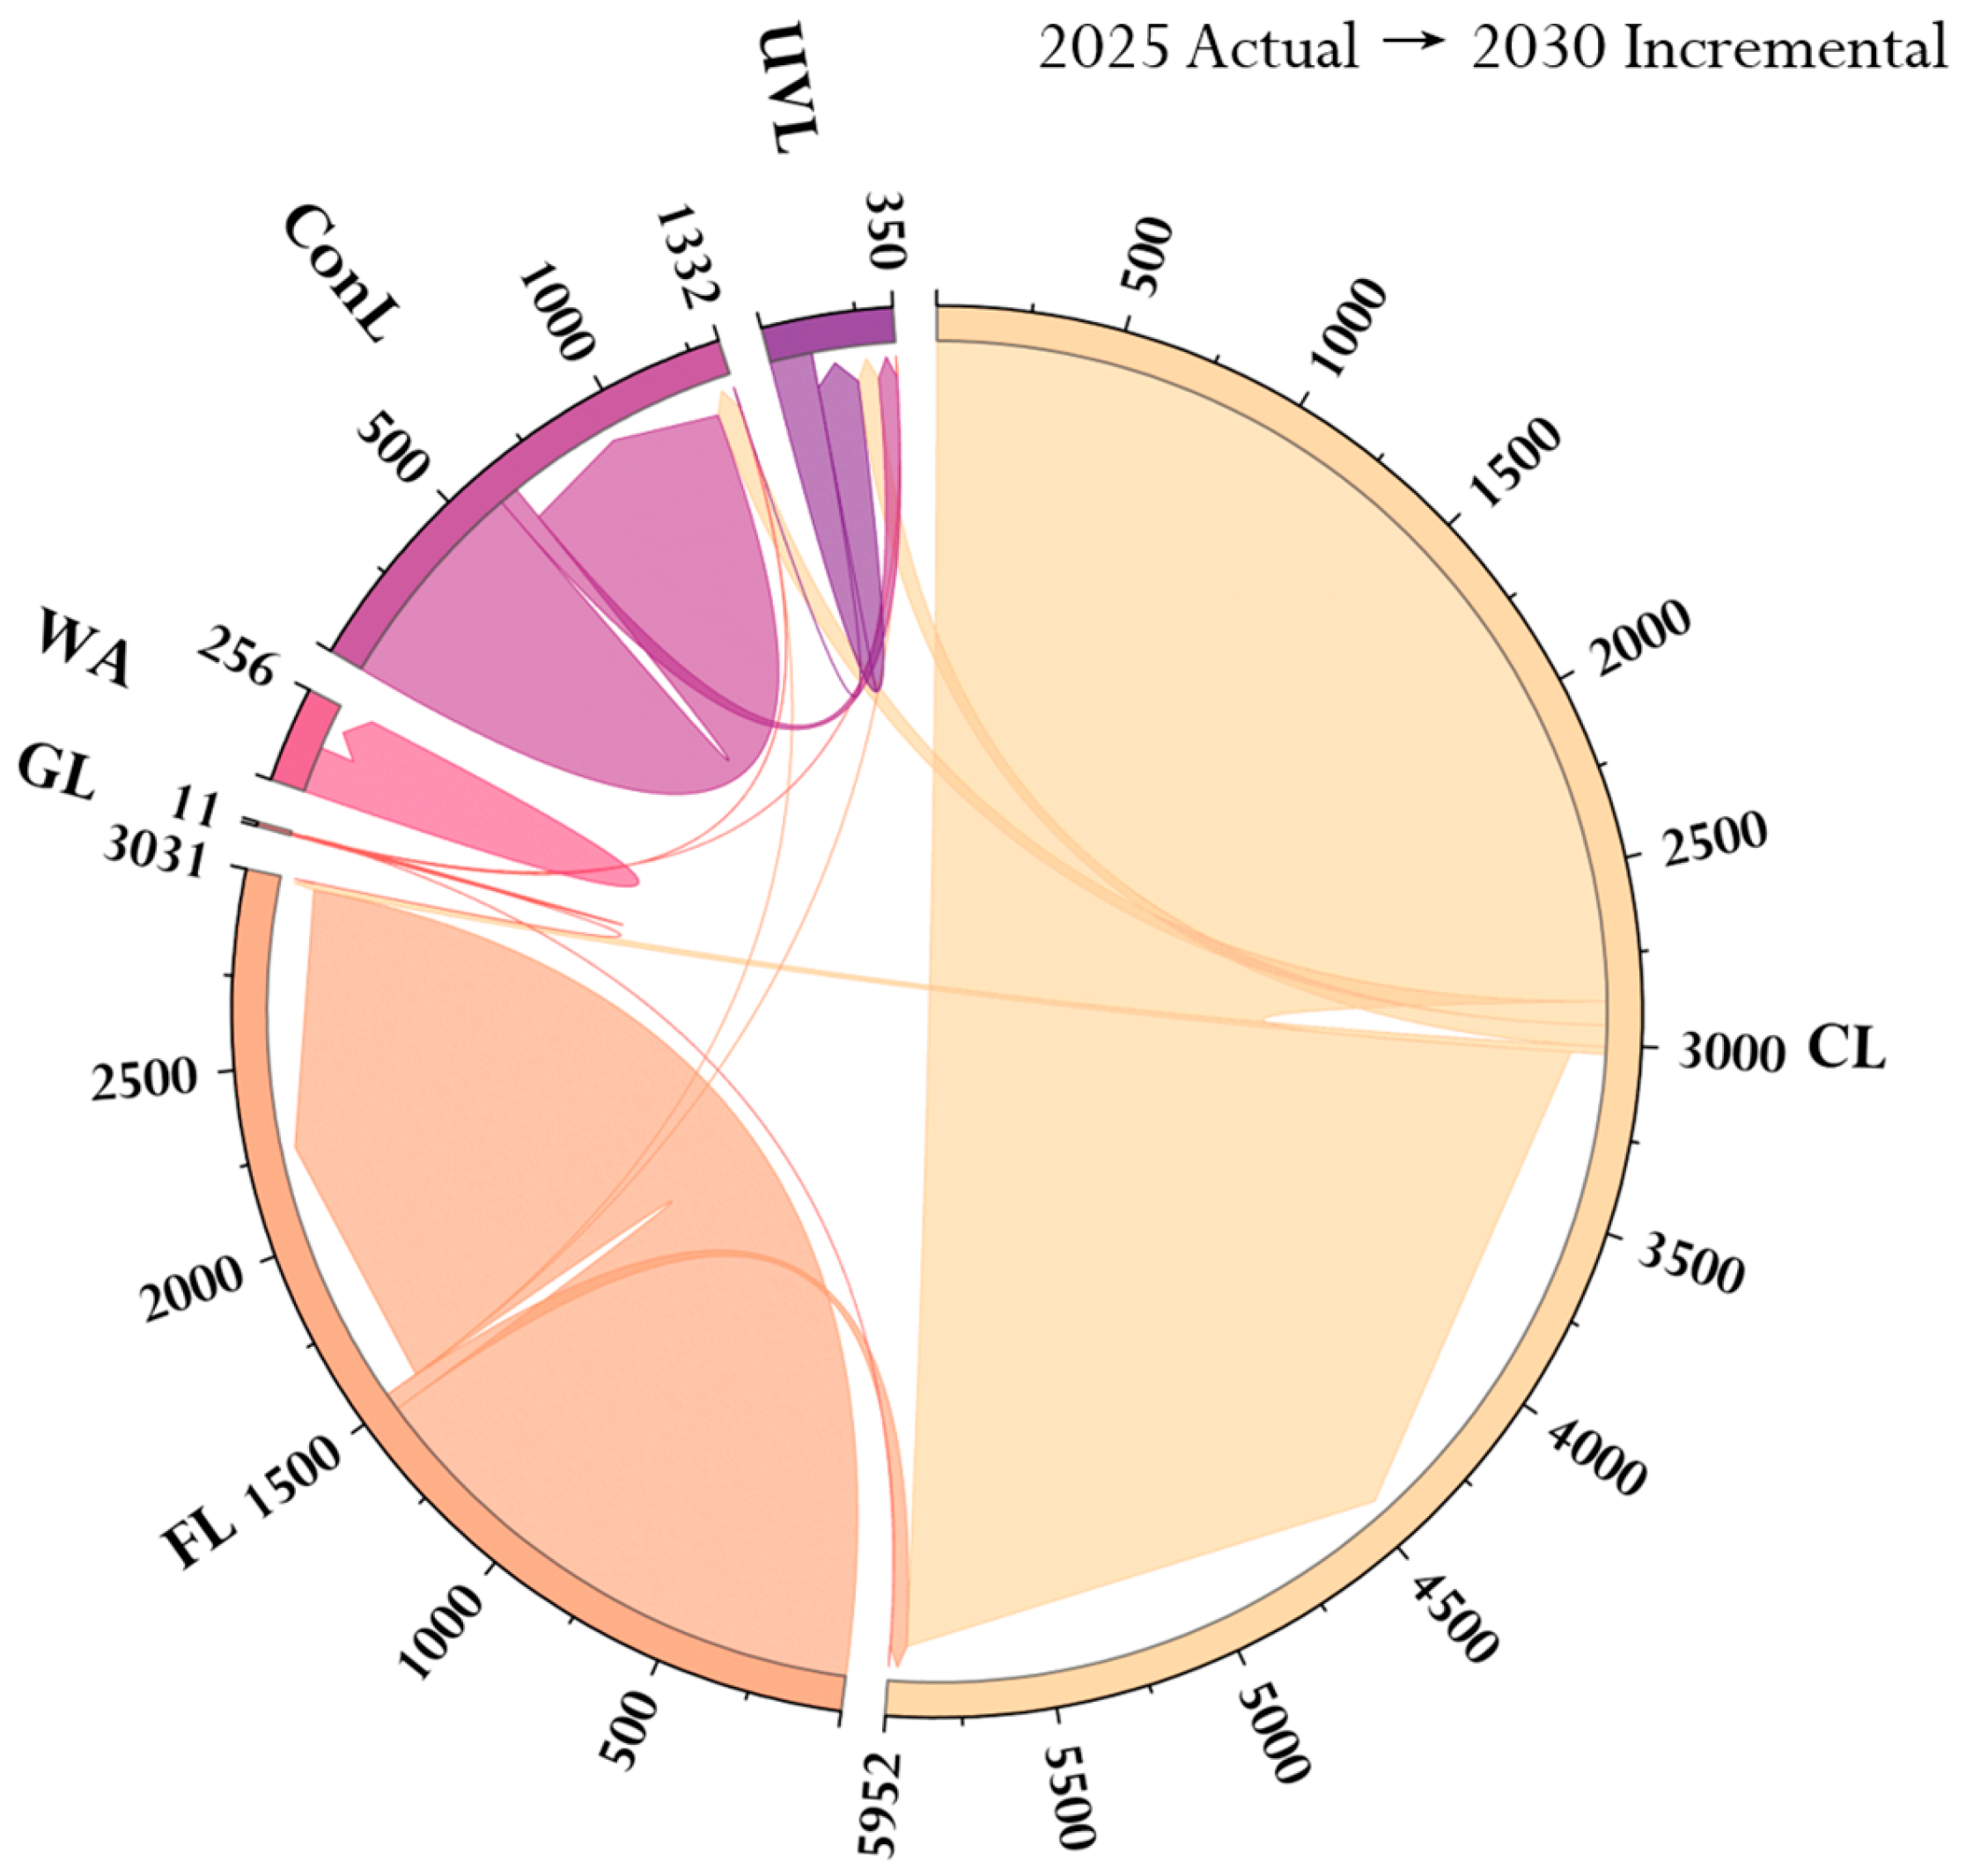
Figure 15.
Land Transfer Map from the 2025 Actual Development Scenario to the 2030 Incremental Development Scenario.
Figure 16.
Map of Land Transfers from the 2025 Actual Development Scenario to the 2030 Stock Development Scenario.
In the Incremental Development Scenario, the area of various ecological land converted into built-up areas increases. The total reduction of the three types of ecological land (Cultivated Land, CL; Forest Land, FL; Grassland, GL) reaches 129.01 square kilometers. The built-up area increases by 129.01 square kilometers (with a growth rate of 16.61%), and urban vacant land (UVL) increases by 113.54 square kilometers (with a growth rate of 95.93%). Under the incremental development model, the intensity of urban outward expansion is significantly enhanced, while the problem of inefficient land use is further exacerbated.
In the Stock Development Scenario, various types of ecological land are protected and developed, the scale of built-up areas remains relatively stable, and urban vacant land (UVL) is efficiently converted. By 2030, the area of cultivated land (CL) will increase by 38.67 square kilometers (with a growth rate of 1.28%), indicating that cultivated land has been effectively protected. The built-up area will decrease by 11.03 square kilometers (with a decrease rate of 1.42%), and the reduction and optimization of construction land have been realized through urban renewal. The area of UVL will increase by 51.04 square kilometers (with a growth rate of 43.12%), with both its increment and growth rate being the lowest among the three scenarios. Stock vacant land has been efficiently transformed through approaches such as redevelopment and functional replacement. Meanwhile, the functional stability of existing construction land has been enhanced, and the sustainability of land use has been improved.
4. Discussion
4.1. Quantity and Distribution of Urban Vacant Land
This study takes the main urban area of Chongqing as the research case and conducts a comparative analysis of the quantitative scale and spatial distribution characteristics of urban vacant land between 2021 and 2025. Regarding the scale of urban vacant land, the proportion of vacant land to the total built-up area increased from 7.37% to 16.98% between 2021 and 2025. The expansion of urban vacant land is influenced by multiple factors. Often obscured by wild weeds, accumulated pollutants, or abandoned structures, the inherent “concealed” nature of urban vacant land frequently leads to its existence being overlooked [51]. Beyond the inherent characteristics of vacant lots, urban expansion also plays a significant role in their growth [12]. During Chongqing’s 20-year urbanization process from 2013 to 2023, the area of construction land increased from 920.55 square kilometers to 1500.31 square kilometers. This expansion not only increased land supply but also created more opportunities for the emergence of vacant lots [52].
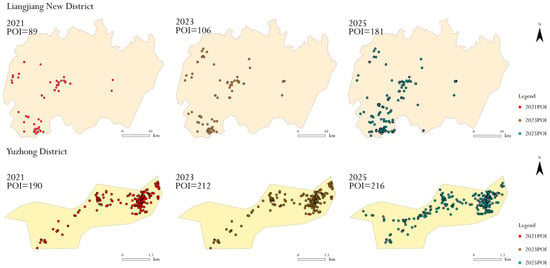
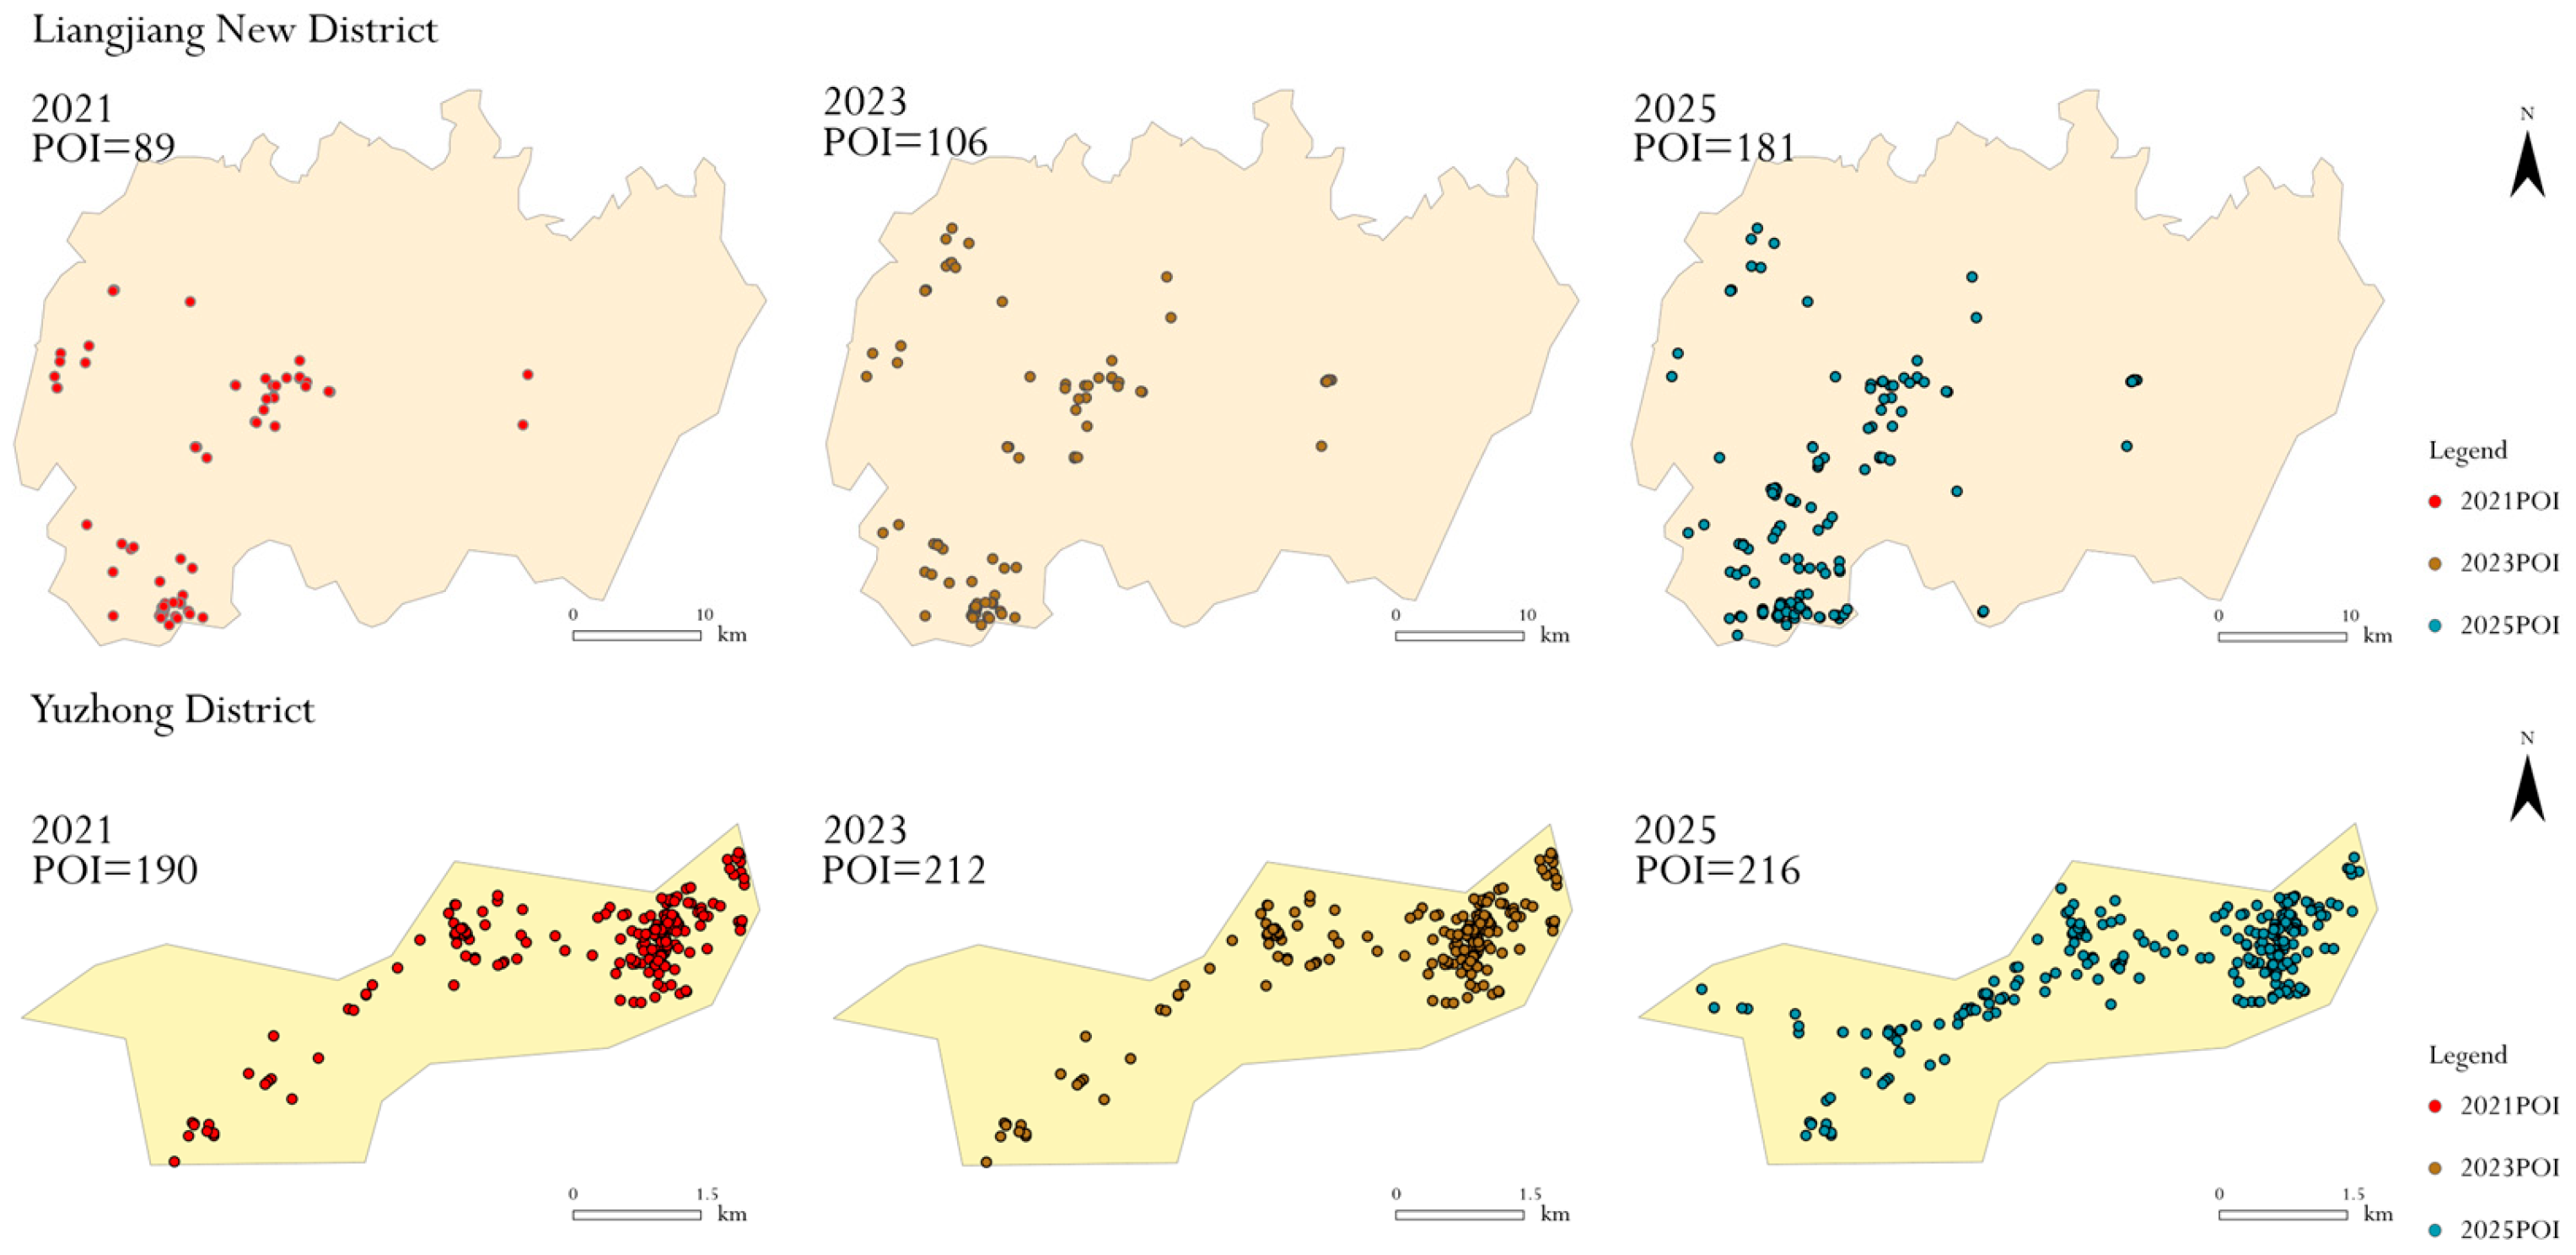
The spatial distribution characteristics of urban vacant land are significantly affected by natural conditions and policy factors. During the study period, remnant cultivated land extended to the southeast, while bare land and vegetated wasteland showed a northward development trend. The southeast part of the main urban area of Chongqing has favorable farming conditions and is less affected by the extrusion caused by the northward shift of the urban development focus, thus becoming the reserved and extended area for remnant cultivated land. Regional core policies play a dominant role in guiding the agglomeration direction of urban spatial elements [53]. By overlaying POI data from Liangjiang New Area and Yuzhong District for 2021, 2023, and 2025, we conducted comparative statistical analysis of their development intensity (Figure 17). Results indicate that Liangjiang New Area’s average annual POI growth rate reached 19.42%, surpassing Yuzhong District’s 8.26%, reflecting the northern area’s more active development activities and higher construction intensity. The “Chongqing Municipal Plan for Fully Integrating into the Belt and Road Initiative and Accelerating the Construction of an Inland Open Hub during the 14th Five-Year Plan Period (2021–2025)” explicitly designates the northern urban area as the core development zone of the metropolitan region, with a focus on promoting high-level development and construction in Liangjiang New Area. Guided by regional development policies, the northern area has seen continuous expansion in land supply scale and accelerated development pace. However, issues commonly arising during high-intensity development—such as supply–demand mismatches, project cycle discrepancies, and development sequencing misalignments—have collectively contributed to the formation and persistence of urban vacant land.
Figure 17.
Comparison Chart of POI Quantity Changes in Liangjiang New Area and Yuzhong District for 2021, 2023, and 2025.
The spatial distribution correlation of various types of urban vacant land has been significantly strengthened, a conclusion that is consistent with existing relevant research results [54,55]. Compared with land use types with relatively stable utilization characteristics such as forest land and construction land, urban vacant land is in a dynamic “unstable” conversion process between different land categories. For example, against the background of the continuous advancement of deindustrialization, some factory buildings with large land areas have been left idle and abandoned due to industrial transformation, and the corresponding plots are classified as abandoned structures and artificial surface. When abandoned structures and hardened surfaces are demolished and cleared, such vacant land can be revitalized and reused if the plot completes land expropriation and construction proceeds smoothly. However, once problems such as capital chain rupture and a stalemate in the game among multiple stakeholders occur during the development process, the plot will lose human intervention and enter a stage of natural succession. With the gradual invasion and coverage of wild vegetation, it will eventually evolve into a vegetated wasteland.
4.2. Evolution of Urban Vacant Land Under Different Future Scenarios
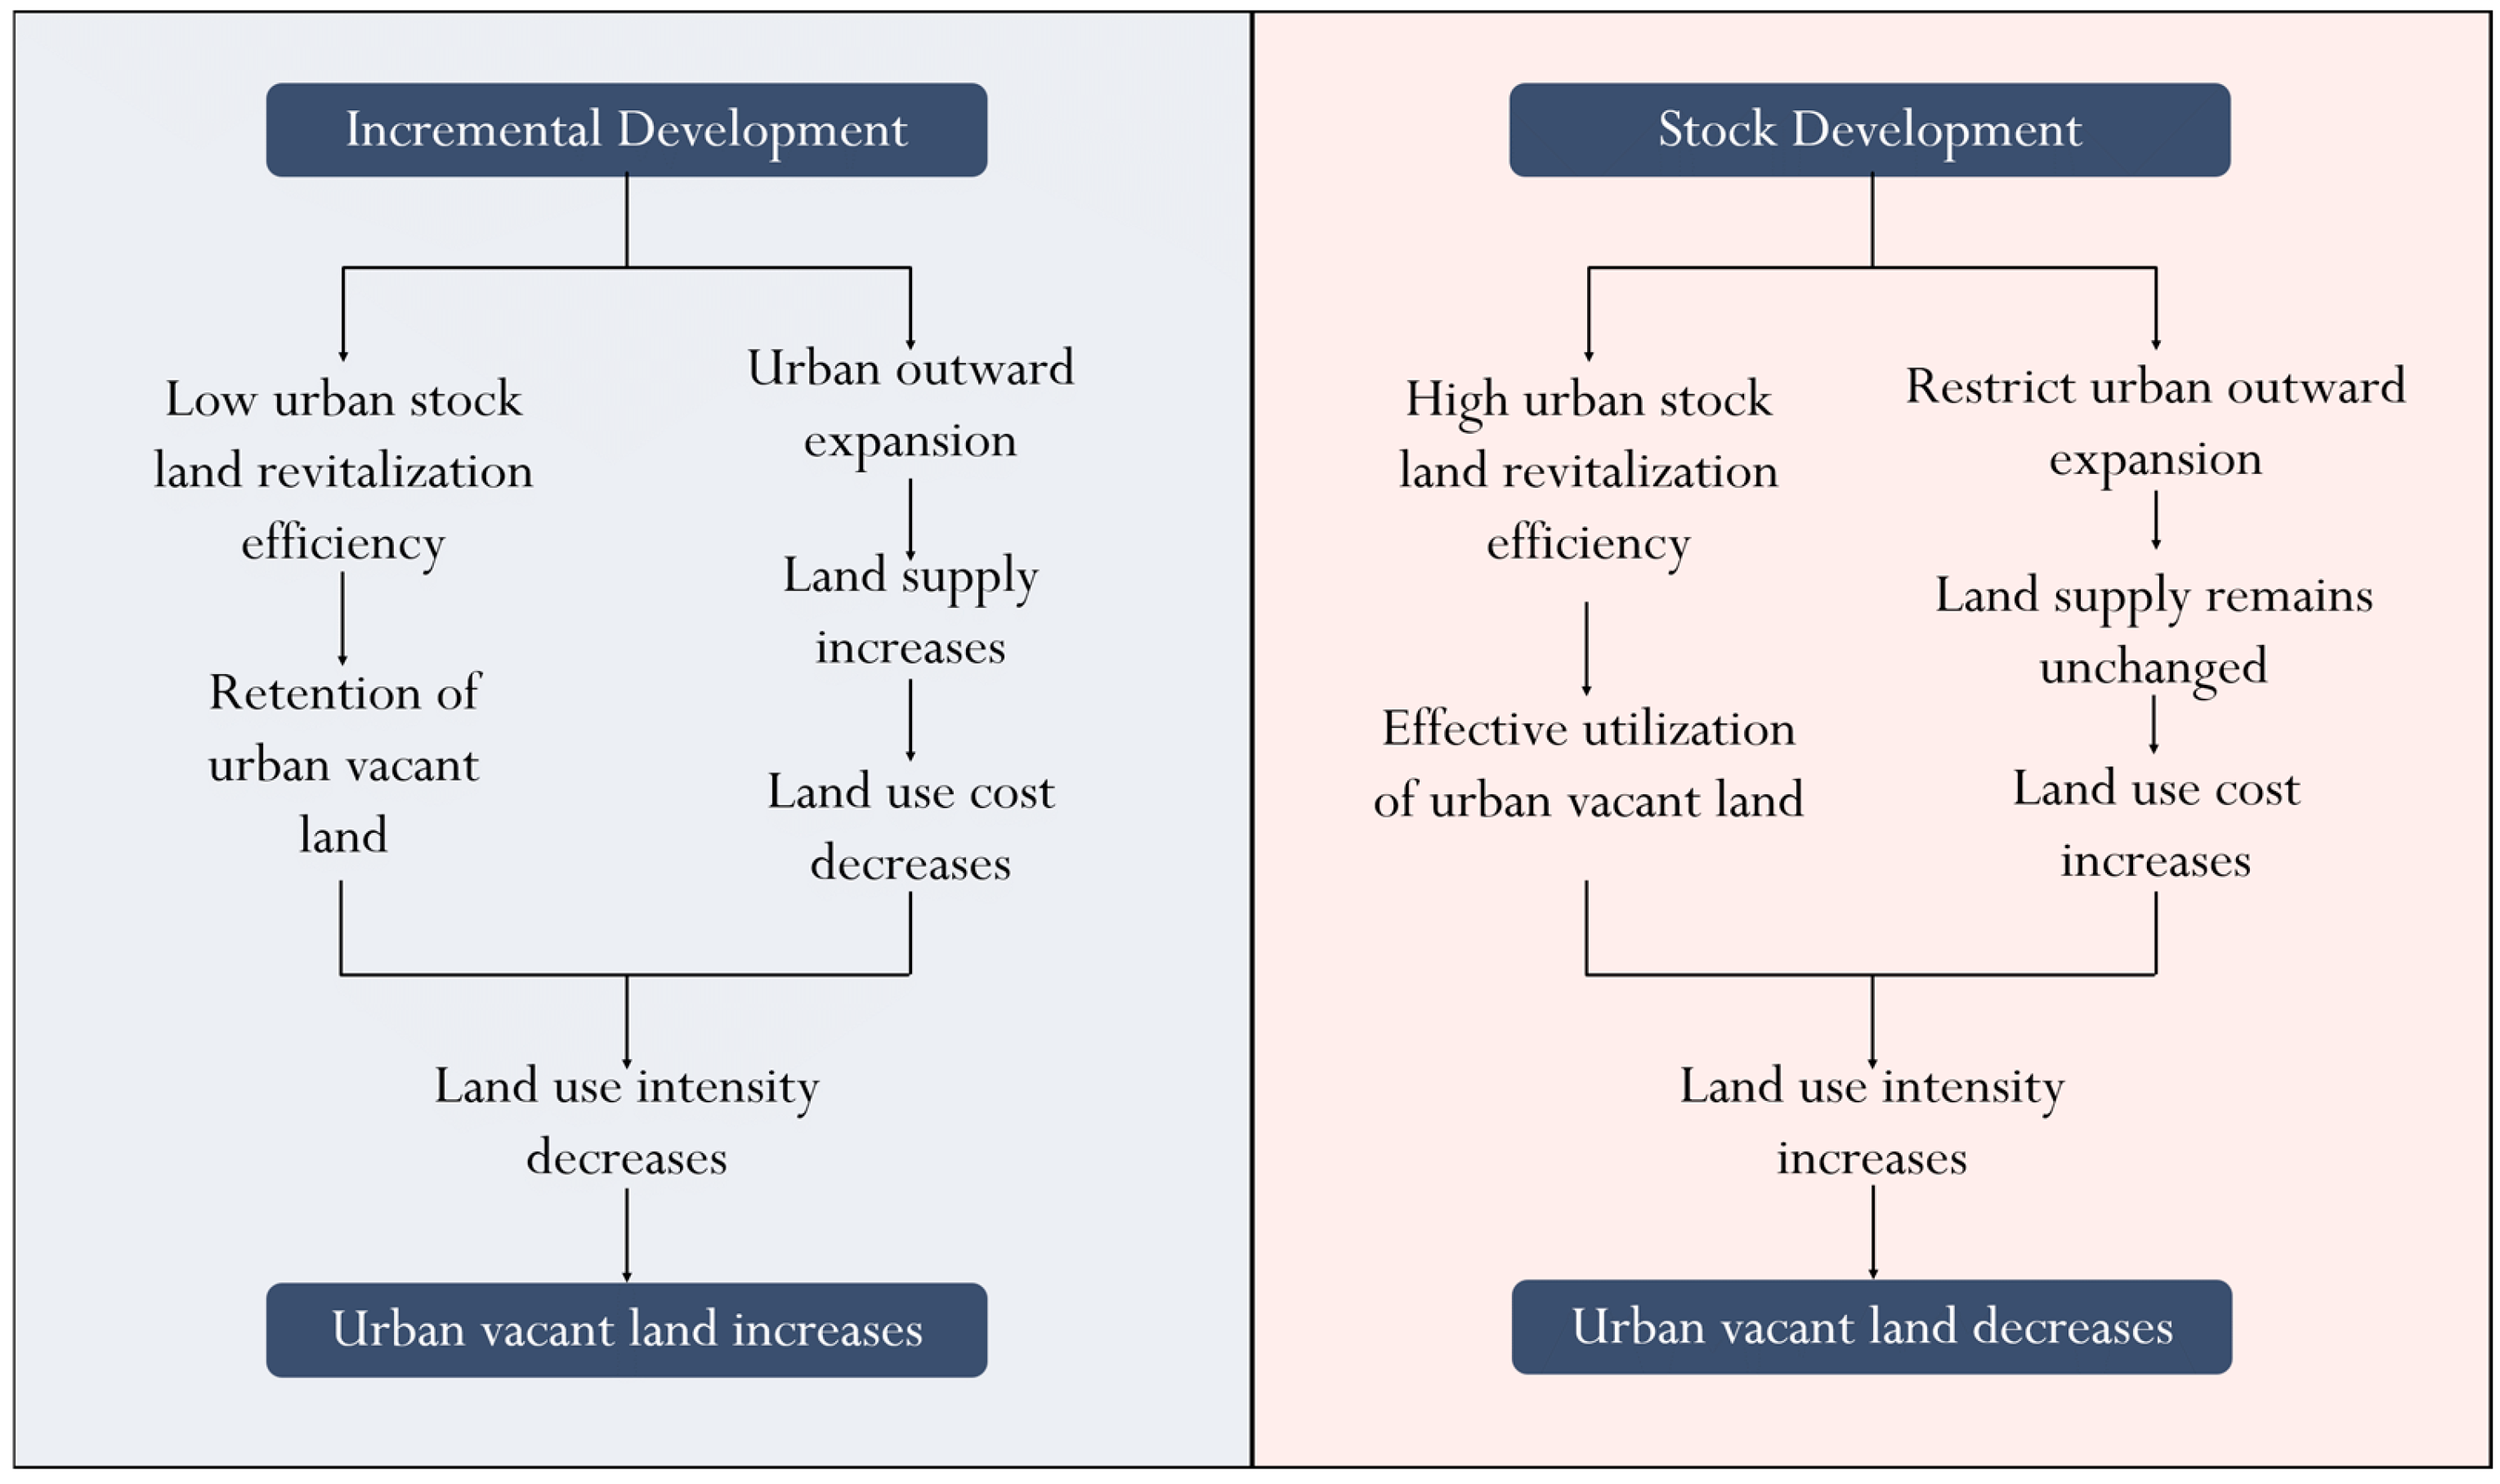
Different urban development models are key factors influencing the evolution of urban vacant land (Figure 18). Compared with other development models, urban stock development greatly reduces the probability of vacant land generation and promotes the effective protection of ecological land. Urban vacant land serves as the “elastic space” of the land use system, and its existence and evolution are always accompanied by the contradictions and opportunities of urban development. The cognition and perception of the value of urban vacant land has undergone a transformation from regarding it as a “blighted area” and “dead space” to recognizing it as a resource “full of potential” and even an object for renovation and reuse [7]. In the initial stage of its emergence, the disorderly distribution of a large amount of vacant land forms a negative urban landscape, increases management costs, may even cause potential safety hazards, and exerts various negative impacts on urban development. From the perspective of resource attributes, however, vacant land contains enormous development potential. Urban vacant land not only carries important economic benefits, but also constitutes a green development area with vital ecological functions such as air purification, environmental regulation and water conservation [56,57].
Figure 18.
Urban Development Patterns and the Relationship with Urban Vacant Land.
The incremental development model takes “outward expansion” as its core logic, achieving scale expansion through continuously expropriating land on the urban periphery. This model effectively supported population growth and industrial settlement during the early stage of urban development, driving the rapid development of the urban economy. Nevertheless, it cannot be ignored that such blind expansion without systematic planning is often accompanied by severe ecological costs. In addition, comprehensive factors including the phased land hoarding of the governments, speculative behaviors of developers and insufficient investment have led to a substantial increase in inefficient urban vacant land. The stock development model focuses on “tapping internal potential”, shifting the focus of development from “land enclosure expansion” to “spatial restructuring”. Through the systematic revitalization and optimization and upgrading of internal stock spaces such as idle factory buildings, inefficient commercial areas and old residential areas, this model not only avoids excessive dependence on new incremental land but also realizes the iterative upgrading of the urban spatial structure. Under this development model, there is no need to occupy a large amount of ecological land on the urban periphery, which effectively protects cultivated land, forest land and maintains the stability of the urban ecosystem [58,59]. Meanwhile, refined development of stock land activates stock land resources and improves the intensity of land conservation. Those inefficient vacant lands once scattered across the city have been transformed into functional spaces such as pocket parks, convenience service centers and industrial incubation bases under scientific planning, realizing the rational utilization of stock resources.
4.3. Policy Implications
As China’s urban land use has gradually entered a new stage of stock-oriented development, a critical challenge has emerged for urban land development: how to shift from the traditional incremental development model that focuses on spatial outward expansion to an intensive development model centered on the revitalization of stock resources, so as to realize the intensive utilization of land resources. In response to this challenge, this paper puts forward the following policy recommendations:
- (1)
- Implement differentiated policies based on urban vacant land types. Vegetated wasteland and bare land: These large-scale, rapidly expanding vacant areas are closely linked to urban sprawl and reserve land stockpiling. Strictly control the timing of new construction land development to prevent long-term idleness. Remnant cultivated land: Primarily located in urban–rural transition zones, these areas serve agricultural production and ecological buffer functions. Implement “land reclamation compensation and quality enhancement” to achieve coordinated development between farmland protection and urban expansion. Abandoned structures and abandoned artificial surfaces are concentrated in central urban districts. While these sites offer prime locations, they present challenges of high renewal costs and complex property rights. Drawing from Tokyo’s experience with small-scale, incremental renewal, a “micro-renovation” approach can be adopted to preserve historical and cultural heritage while enhancing the living environment.
- (2)
- Multi-stakeholder participation to tackle urban vacant land governance challenges. The management of urban vacant land is the outcome of negotiations among multiple stakeholders. It requires moving beyond the traditional model of “single-government control” to establish a governance system characterized by “government guidance, market leadership, social participation, and multi-party coordination.” First, fully leverage the government’s role in overall coordination and leadership. Led by the Municipal Bureau of Natural Resources, collaborate with departments such as Housing and Urban–Rural Development and Finance to clarify responsibilities. Second, harness the resource allocation advantages of market entities to revitalize urban vacant land spaces. Fully respect market principles by guiding enterprises, social organizations, and other market entities to participate in vacant land management, using financial innovation to lower participation barriers. Additionally, local subdistrict offices and community committees should lead efforts to solicit residents’ needs for revitalizing vacant land through surveys and public hearings. This ensures stakeholders—including residents, communities, and nearby businesses—are informed, enhancing governance acceptance and implementation feasibility.
- (3)
- Centered on urban renewal, we must coordinate existing vacant land resources. Simulation results for urban vacant land indicate that the existing stock development model can effectively reduce urban construction and social production costs, enhance land use efficiency, and strengthen the sustainability of urban development. Therefore, we should persist in replacing incremental outward expansion with the restructuring of existing spaces, treating idle vacant land and inefficiently used land as crucial spatial carriers for future urban development. Through scientific planning, shift land use from outward land acquisition to internal potential tapping, continuously optimizing urban spatial structures and functional layouts. This ultimately achieves intensive, efficient, green, low-carbon, and high-quality sustainable urban development. It should be noted that scenario simulations are constructed based on foundational data from the current stage of urban development. Uncertainties in future urban development may influence vacant land evolution trends. Therefore, the policy recommendations proposed in this study require dynamic adaptation to actual conditions during implementation.
4.4. Limitations
This study still has certain limitations. (1) Due to limitations in the workload of high-resolution image interpretation and data availability, this study selected only data from the 2021 and 2025 periods to analyze urban open space changes, and has not yet established a long-term time series spanning three or more periods. Future research should extend the temporal scope, integrating multiple periods of high-precision data to conduct dynamic monitoring and trend analysis over longer timeframes. (2) Policy is an important factor affecting the evolution of urban vacant land. Factors such as differences in implementation intensity and inter-departmental coordination efficiency during policy implementation may affect the effect of vacant land transformation. However, limited by data availability, the quantitative setting of policy implementation intensity has not been carried out in the model simulation. (3) This study only selects a relatively small research area and a single case city. Global urban development models exhibit diversity and complexity. Future research may expand its geographical scope to further explore the commonalities and differences in urban vacant land evolution under incremental and stock-based development logics, and investigate governance pathways tailored to diverse cities.
5. Conclusions
This study focuses on the main urban area of Chongqing City. Using high-resolution remote sensing imagery to extract urban vacant land, spatial analysis methods such as kernel density analysis and bivariate spatial autocorrelation analysis were employed to examine the quantitative characteristics and spatial distribution patterns of urban vacant land from 2021 to 2025. Three development scenarios—baseline, incremental, and stock-based—were constructed. The PLUS model simulated the spatiotemporal evolution of urban vacant land by 2030 to investigate how different urban development patterns regulate its transformation. Addressing three predefined scientific questions, the study yielded the following core findings:
- (1)
- The spatial distribution of urban vacant land is uneven, with significant spatial correlations among different land types. Residual farmland is primarily distributed in the urban–rural transition zone in the southeast; scrubland and bare land are clustered in the northeast, forming contiguous patches influenced by policy and topography; and abandoned buildings and concrete surfaces are concentrated in the historic downtown core. Furthermore, strong internal correlations exist among different land categories, suggesting urban vacant land may undergo dynamic “unstable” transitions between land types.
- (2)
- Over the past five years, the quantity and spatial extent of urban vacant land have continuously expanded. Between 2021 and 2025, the number of vacant land parcels increased from 1393 to 2308, representing a 65.69% growth rate. The total area of vacant land expanded from 5127.73 hectares to 11,842.43 hectares, a 130.95% increase. The proportion of vacant land within built-up areas rose from 7.37% to 16.98%, making it a significant component of the urban land use structure. The rapid expansion of vacant land has become a prominent feature in the land use development of the main urban area.
- (3)
- Simulation results under different development scenarios for 2030 reveal significant differences in the regulatory effects of the three models—baseline development, incremental development, and stock development—on urban vacant land evolution. These differences manifest in terms of vacant land growth rates, land use efficiency, and ecological conservation. Regarding vacant land growth rates, the incremental development model exhibits the highest increase (95.93%), followed by the baseline development model (69.52%), with the stock development model showing the lowest growth (43.12%). In terms of land use efficiency, the incremental development model relies on outward expansion, leading to inefficient land utilization. The baseline development model maintains the existing pace of development, resulting in moderate growth of vacant land and limited optimization of land use. The stock development model, however, focuses on revitalizing and optimizing existing land within the city. It achieves the coordinated advancement of farmland protection, reduction and optimization of construction land, and efficient conversion of urban vacant land. This model effectively resolves the core contradiction between “development and protection” in cities and represents the optimal path for future urban development.
Author Contributions
Conceptualization, W.Z. and Z.-X.W.; methodology, Z.-X.W.; software, Z.-X.W.; validation, W.Z. and Z.-X.W.; formal analysis, W.Z.; investigation, Z.-X.W.; resources, Z.-X.W.; data curation, Z.-X.W.; writing—original draft preparation, Z.-X.W.; writing—review and editing, Z.-X.W.; visualization, Z.-X.W.; supervision, W.Z.; project administration, W.Z.; funding acquisition, W.Z. All authors have read and agreed to the published version of the manuscript.
Funding
This research received no external funding.
Institutional Review Board Statement
Not applicable.
Informed Consent Statement
Not applicable.
Data Availability Statement
The original contributions presented in this study are included in the article. Further inquiries can be directed to the corresponding author.
Conflicts of Interest
The authors declare no conflicts of interest.
Abbreviations
The following abbreviations are used in this manuscript:
| UVL | Urban Vacant Land |
| EVL | Expanding Vacant Land |
| SVL | Shrinking Vacant Land |
| RCL | Remnant Cultivated Land |
| BL | Bare Land |
| VW | Vegetated Wasteland |
| ASAS | Abandoned Structures and Artificial Surface |
| CL | Cultivated Land |
| FL | Forest Land |
| GL | Grassland |
| WA | Water Area |
| ConL | Construction Land |
References
- Mao, L.; Zheng, Z.; Meng, X.; Zhou, Y.; Zhao, P.; Yang, Z.; Long, Y. Large-Scale Automatic Identification of Urban Vacant Land Using Semantic Segmentation of High-Resolution Remote Sensing Images. Landsc. Urban Plan. 2022, 222, 104384. [Google Scholar] [CrossRef] [Scilit]
- Tu, T.; Wang, X.; Long, Y. Spatiotemporal Changes of Urban Vacant Land and Its Distribution Patterns in Shrinking Cities on the Globe. Sci. Total Environ. 2024, 947, 174424. [Google Scholar] [CrossRef] [Scilit] [PubMed]
- Chen, L. Vacant Land and Neighborhood Sustainability in Chicago: Analyzing Spatially Varying Associations. GeoJournal 2024, 89, 220. [Google Scholar] [CrossRef] [Scilit]
- Song, X.Q.; Ma, Z.H.; Zhao, G.S.; Wu, Z.F. Urban vacant land: Rethinking the mushrooming urbanization. Acta Geogr. Sin. 2018, 73, 1033–1048. [Google Scholar]
- Wang, H.X.; Meng, W.H.; Xiong, S.Y. Research on Idle Urban Land based on CiteSpace: Characteristics and Research Hotspots Evolution (1990–2015). China Land Sci. 2016, 30, 54–62. [Google Scholar]
- Kraut, D.T. Hanging out the No Vacancy Sign: Eliminating the Blight of Vacant Buildings from Urban Areas. N. Y. Univ. LAW Rev. 1999, 74, 4. [Google Scholar]
- Song, X.; Wen, M.; Shen, Y.; Feng, Q.; Xiang, J.; Zhang, W.; Zhao, G.; Wu, Z. Urban Vacant Land in Growing Urbanization: An International Review. J. Geogr. Sci. 2020, 30, 669–687. [Google Scholar] [CrossRef] [Scilit]
- Xu, S.; Ehlers, M. Automatic Detection of Urban Vacant Land: An Open-Source Approach for Sustainable Cities. Comput. Environ. Urban Syst. 2022, 91, 101729. [Google Scholar] [CrossRef] [Scilit]
- Zhou, J.J.; Lu, J. Policy effect evaluation of the Disposal Measures for Idle Land. China Land 2017, 22–24. [Google Scholar] [CrossRef]
- Németh, J.; Langhorst, J. Rethinking Urban Transformation: Temporary Uses for Vacant Land. Cities 2014, 40, 143–150. [Google Scholar] [CrossRef] [Scilit]
- Carruthers, A.; Tretter, E. Creative Re-Uses: The Promises and Challenges of Temporary Land Use in Calgary. Cities 2022, 123, 103562. [Google Scholar] [CrossRef] [Scilit]
- Newman, G.; Gu, D.; Kim, J.-H.; Bowman, A.O.M.; Li, W. Elasticity and Urban Vacancy: A Longitudinal Comparison of U.S. Cities. Cities 2016, 58, 143–151. [Google Scholar] [CrossRef] [Scilit]
- Li, W.; Zhou, W.; Bai, Y.; Pickett, S.T.A.; Han, L. The Smart Growth of Chinese Cities: Opportunities Offered by Vacant Land. Land Degrad. Dev. 2018, 29, 3512–3520. [Google Scholar] [CrossRef] [Scilit]
- Li, W.; Wang, D.; Li, H.; Wang, J.; Zhu, Y.; Yang, Y. Quantifying the Spatial Arrangement of Underutilized Land in a Rapidly Urbanized Rust Belt City: The Case of Changchun City. Land Use Policy 2019, 83, 113–123. [Google Scholar] [CrossRef] [Scilit]
- Freire Trigo, S. Vacant Land in London: A Planning Tool to Create Land for Growth. Int. Plan. Stud. 2020, 25, 261–276. [Google Scholar] [CrossRef] [Scilit]
- Kim, G. An Integrated System of Urban Green Infrastructure on Different Types of Vacant Land to Provide Multiple Benefits for Local Communities. Sustain. Cities Soc. 2018, 36, 116–130. [Google Scholar] [CrossRef] [Scilit]
- Song, X.Q.; Li, X.Y. Urban Vacant Land: Connotation and Research Direction. China Land Sci. 2019, 33, 71–79. [Google Scholar]
- Gebru, M.A.; Abebe, T.; Zewale, H.L.; Enyew, F.F.; Asnakew, M.B.; Nega, W. Drivers and Socio-Economic Implications of Vacant Urban Land: A Case Study of Debre Markos City, Ethiopia. Cities 2026, 170, 106623. [Google Scholar] [CrossRef] [Scilit]
- Chen, Y.; Gu, Y.; Luo, J.; Cao, L. Achieving Optimal Cooling Effects from Urban Vacant Land Re-Greening Using Interpretable Machine Learning and Multi-Objective Optimization. Urban For. Urban Green. 2026, 119, 129354. [Google Scholar] [CrossRef] [Scilit]
- Ferreri, M.; Vasudevan, A. Vacancy at the Edges of the Precarious City. Geoforum 2019, 101, 165–173. [Google Scholar] [CrossRef] [Scilit]
- Newman, G.; Kim, Y.; Kim, G.; Lee, R.J.; Gu, D.; Forghanparast, K.; Goldberg, D. A Python Script for Longitudinally Measuring the Duration of Vacant Land Uses. J. Spat. Sci. 2022, 67, 129–141. [Google Scholar] [CrossRef] [Scilit]
- Qu, Y.; Jiang, G.; Li, Z.; Shang, R.; Zhou, D. Understanding the Multidimensional Morphological Characteristics of Urban Idle Land: Stage, Subject, and Spatial Heterogeneity. Cities 2020, 97, 102492. [Google Scholar] [CrossRef] [Scilit]
- Newman, G.; Park, Y.; Bowman, A.O.M.; Lee, R.J. Vacant Urban Areas: Causes and Interconnected Factors. Cities 2018, 72, 421–429. [Google Scholar] [CrossRef] [Scilit]
- Shi, M.; Wu, H.; Fan, X.; Jia, H.; Dong, T.; He, P.; Baqa, M.F.; Jiang, P. Trade-Offs and Synergies of Multiple Ecosystem Services for Different Land Use Scenarios in the Yili River Valley, China. Sustainability 2021, 13, 1577. [Google Scholar] [CrossRef] [Scilit]
- Qin, Y.; Yan, Y.; Dong, J.; Zhao, Z.; Li, S.; Cao, J.; Xiao, J. Scenario-Driven Modeling of Mountain Ecosystems: Land Use-Carbon Dynamics Simulation Based on the Coupled SD-FLUS-InVEST Framework. Ecol. Model. 2025, 510, 111293. [Google Scholar] [CrossRef] [Scilit]
- Wang, Q.; Bai, X.; Zhang, D.; Wang, H. Spatiotemporal Characteristics and Multi-Scenario Simulation of Land Use Change and Ecological Security in the Mountainous Areas: Implications for Supporting Sustainable Land Management and Ecological Planning. Sustain. Futures 2024, 8, 100286. [Google Scholar] [CrossRef] [Scilit]
- Niu, F.F.; Guo, J.; Luo, J.; Gou, X.P.; Liu, X.W.; Zhang, R.P. Simulation of land use change and prediction of carbon storage in Xinjiang based on GeoSOS-FLUS and InVEST models. Arid. Land Geogr. 2025, 48, 2169–2182. [Google Scholar]
- Liu, X.; Liang, X.; Li, X.; Xu, X.; Ou, J.; Chen, Y.; Li, S.; Wang, S.; Pei, F. A Future Land Use Simulation Model (FLUS) for Simulating Multiple Land Use Scenarios by Coupling Human and Natural Effects. Landsc. Urban Plan. 2017, 168, 94–116. [Google Scholar] [CrossRef] [Scilit]
- Liang, X.; Guan, Q.; Clarke, K.C.; Liu, S.; Wang, B.; Yao, Y. Understanding the drivers of sustainable land expansion using a patch-generating land use simulation (PLUS) model: A case study in Wuhan, China. Comput. Environ. Urban Syst. 2021, 85, 101569. [Google Scholar] [CrossRef] [Scilit]
- Li, Z.; Jiang, W.; Peng, K.; Wang, X.; Deng, Y.; Yin, X.; Ling, Z. Comparative analysis of land use change prediction models for land and fine wetland types: Taking the wetland cities Changshu and Haikou as examples. Landsc. Urban Plan. 2024, 243, 104975. [Google Scholar] [CrossRef] [Scilit]
- Liang, X.; Liu, X.; Li, X.; Chen, Y.; Tian, H.; Yao, Y. Delineating multi-scenario urban growth boundaries with a CA-based FLUS model and morphological method. Landsc. Urban Plan. 2018, 177, 47–63. [Google Scholar] [CrossRef] [Scilit]
- Liang, Y.D.; Zhang, S.Q.; Zhu, D.M.; Li, Y.P. Delimitation of urban development boundary by coupling Markov chain and PLUS model from the perspective of major function oriented zoning. J. Geo-Inf. Sci. 2024, 26, 1702–1716. [Google Scholar]
- Zhang, W.; Li, Y.; Zheng, C. The Distribution Characteristics and Driving Mechanism of Vacant Land in Chengdu, China: A Perspective of Urban Shrinkage and Expansion. Land Use Policy 2023, 132, 106812. [Google Scholar] [CrossRef] [Scilit]
- Yang, J.; Huang, X. The 30 m Annual Land Cover Dataset and Its Dynamics in China from 1990 to 2019. Earth Syst. Sci. Data 2021, 13, 3907–3925. [Google Scholar] [CrossRef] [Scilit]
- Zhang, Y.; Zhao, H.; Long, Y. CMAB: A Multi-Attribute Building Dataset of China. Sci. Data 2025, 12, 430. [Google Scholar] [CrossRef] [Scilit]
- Didan, K. MODIS/Terra Vegetation Indices 16-Day L3 Global 500m SIN Grid V061 [Data Set]; NASA Land Processes Distributed Active Archive Center: Sioux Falls, SD, USA, 2021. [Google Scholar] [CrossRef]
- Wang, C.; Wang, J. Kilometer Grid Dataset of China’s Historical GDP Spatial Distribution (1990–2015); National Tibetan Plateau/Third Pole Environment Data Center: Beijing, China, 2022. [Google Scholar] [CrossRef]
- Zhu, Z.; Yang, Y.; Zhang, Y.; Qiu, L.; Gao, T. Spatiotemporal Dynamics and Projections of Carbon Storage Using Integrated PLUS-InVEST Modeling: A Case Study of the Guanzhong Plain Urban Agglomeration, China. Land 2026, 15, 142. [Google Scholar] [CrossRef] [Scilit]
- Zou, B. The Transformation from Greenfield-Based Planning to Redevelopment Planning: Theoretical Analysis and Practical Strategies. Urban Plan. Forum 2015, 12–19. [Google Scholar] [CrossRef]
- Zou, B. Practices, Effects, and Challenges of the Inventory Development Pattern: The Assessments and Extended Thoughts of Urban Renewal Implementation in Shenzhen. City Plan. 2017, 41, 89–94. [Google Scholar]
- Wu, X.; Zhang, T.Y.; Wang, Y.G. Multi-scenario simulation of land cover in Leshan City based on Markov-PLUS model. J. Hubei Minzu Univ. Nat. Sci. Ed. 2024, 42, 293–300. [Google Scholar] [CrossRef]
- Jin, Y.N.; Huang, Y.Z.; You, F.; Guo, L.Y. Simulation of land use and ecosystem service value in Shiyang River Basin based on Markov-PLUS model. J. Arid. Land Resour. Environ. 2024, 38, 130–139. [Google Scholar] [CrossRef]
- Li, Y.J.; Wang, Y.; Li, Q.; Shao, J.A.; Yang, X.; Yao, X.Y.; Zou, M.; Wang, W.D. Multi-scenario simulation of land use change in Longxi River Basin based on PLUS model. J. Southwest Univ. Nat. Sci. Ed. 2025, 47, 136–151. [Google Scholar] [CrossRef]
- Li, C.; Gao, B.P.; Wu, Y.M.; Zheng, K.J.; Wu, Y. Dynamic simulation of landscape ecological risk in mountain towns based on PLUS model. J. Zhejiang AF Univ. 2022, 39, 84–94. [Google Scholar] [CrossRef] [Scilit] [PubMed]
- Zhang, J.Q.; Shi, W.B.; Xiu, C.L. Application of POI data in urban research in China. Geogr. Sci. 2021, 41, 140–148. [Google Scholar] [CrossRef]
- Zhao, H.B.; Yu, D.F.; Miao, C.H.; Li, G.H.; Feng, Y.B.; Bie, Q.L. Location distribution characteristics and influencing factors of cultural facilities in Zhengzhou City based on POI data. Geogr. Sci. 2018, 38, 1525–1534. [Google Scholar] [CrossRef]
- Xu, Z.N.; Gao, X.L. A method for identifying urban built-up area boundaries based on POI data from electronic maps. Acta Geogr. Sin. 2016, 71, 928–939. [Google Scholar]
- Anselin, L. Local Indicators of Spatial Association-LISA. Geogr. Anal. 1995, 27, 93–115. [Google Scholar] [CrossRef] [Scilit]
- Yao, X.; Zeng, J.; Li, W. Spatial correlation characteristics of urbanization and land ecosystem service value in Wuhan Urban Agglomeration. Trans. Chin. Soc. Agric. Eng. 2015, 31, 249–256. [Google Scholar]
- Mo, H.B.; Luo, K.; Wang, S.J.; Zhou, C.S. Spatial heterogenicity and mechanism difference of restaurant in the central urban area of Guangzhou: A comparison between traditional restaurant and take-out restaurant. Geogr. Res. 2022, 41, 3318–3334. [Google Scholar]
- Newman, G.D.; Bowman, A.O.; Jung Lee, R.; Kim, B. A Current Inventory of Vacant Urban Land in America. J. Urban Des. 2016, 21, 302–319. [Google Scholar] [CrossRef] [Scilit]
- Zecca, C.; Laing, R. Reading Underused Urban Spaces: Aberdeen Views. Sustain. Cities Soc. 2020, 56, 102108. [Google Scholar] [CrossRef] [Scilit]
- Bigon, L.; Langenthal, E. Urban Renewals: Learning from a Country’s Recent Experience for Enhancing Socially-Sustainable Global Planning Policy. Urban Sci. 2023, 7, 109. [Google Scholar] [CrossRef] [Scilit]
- Arruñada, B. Evolving Practice in Land Demarcation. Land Use Policy 2018, 77, 661–675. [Google Scholar] [CrossRef] [Scilit]
- Zheng, Y.; Cheng, L.; Wang, J.; Wang, Y.; Cui, H. Spatial Conflict of Land Use Based on “Element-Pattern-Effect”: Logical Main Lines and Coordination Paths. J. Nat. Resour. 2025, 40, 316–329. [Google Scholar] [CrossRef] [Scilit]
- Cahn, A.L. Supporting Our Land Stewards: Building a Constituency to Change Policy and Preserve Philadelphia’s Gardens. Cities Environ. CATE 2015, 8, 16. [Google Scholar] [CrossRef]
- Esq, S.; Paula, Z. From Open Data to Open Space: Translating Public Information into Collective Action. Cities Environ. 2015, 8, 14. [Google Scholar]
- Li, Z.Q.; Qian, Y.G.; Zhou, W.Q.; Wang, J. From “increment expansion” to “inventory optimization”: Internal dynamics and optimization of landscape pattern in Shenzhen. Acta Ecol. Sin. 2021, 41, 1738–1746. [Google Scholar] [CrossRef] [Scilit]
- Liu, X.Y.; Zhang, R.; Ni, K.J. From incremental expansion to stock optimization: A study on the transformation path for the high-quality development of small cities. Zhejiang Acad. J. 2025, 236, 182–191. [Google Scholar] [CrossRef]



Disclaimer/Publisher’s Note: The statements, opinions and data contained in all publications are solely those of the individual author(s) and contributor(s) and not of MDPI and/or the editor(s). MDPI and/or the editor(s) disclaim responsibility for any injury to people or property resulting from any ideas, methods, instructions or products referred to in the content. |
© 2026 by the authors. Licensee MDPI, Basel, Switzerland. This article is an open access article distributed under the terms and conditions of the Creative Commons Attribution (CC BY) license.