


Abstract
In the context of advancing manufacturing, production systems are shifting toward human-centric and personalized production. However, accurately quantifying subjective user needs into precise product specifications remains a challenge. Taking child companion robots as an example, this paper proposed a novel product innovation design framework based on Extenics and Kansei engineering to optimize the texture design of smart products. By systematically integrating synergistic relationships among colour, material, and surface processing technology, the framework aimed to enhance the sustainable value and social sustainability of products by more precisely meeting users’ perceptual and emotional needs. The research methodology employed the semantic differential method to quantify user perception and utilized the K-means clustering algorithm to construct a chromatic colour sample library for smart products. Subsequently, by combining the multi-criteria decision-making tool grey relational analysis with statistical verification, the optimal design scheme was selected from the generated alternatives. Experimental results demonstrated that this method significantly reduced design subjectivity and ambiguity. By bridging the gap between user expectations and engineering solutions, the framework provides a systematic solution for mass customization and process optimization that promotes resource efficient and sustainable production, while also reducing the resource waste associated with traditional trial and error design processes.
1. Introduction
The sustainable development of the manufacturing industry relies on the critical role of product design in reducing environmental impact and improving resource efficiency [1]. Currently, product design is also increasingly shifting toward a consumer-oriented approach [2]. The product design process no longer focuses solely on functional improvements; it must also meet the perceptual needs of users [3]. Research shows that products capable of accurately capturing users’ perceptual preferences and satisfying their psychological needs tend to gain particular favour among specific consumer groups [4,5]. Therefore, understanding these preferences bridges the gap between designers and users, ensuring products align with emotional needs. This alignment not only fosters immediate user satisfaction but also lays the foundation for sustainable consumption by promoting longer product attachment and reducing premature replacement.
The growing adoption of smart products has made user perception a critical factor in product acceptance [6]. Addressing perceptual needs enhances human–product relationships and extends product lifespans, particularly in home and educational applications. Generally, user satisfaction with products largely depends on external elements such as colour and material [7], with colour, material, and surface treatment technology being the three main components that constitute the texture of a product [8]. In smart product design, systematically integrating these perceptual elements, including colour schemes, material selection, and surface processing technology, enables innovation beyond basic functionality and aesthetics. This multidimensional approach enriches texture design expression while creating more engaging user experiences.
Product texture serves as a crucial medium for users’ psychological perception and experiential interaction, exhibiting distinct interdisciplinary characteristics in contemporary design research. This field can explore key technologies such as interactive haptic texture modelling [9], haptic texture rendering [10], and haptic design tools with creativity support systems starting from the sense of touch [11]. Additionally, in product appearance design, texture expression can be used to achieve the perceptual design of products. Notably, the texture expression of a product’s appearance, due to its intuitiveness and implement ability, has become the most direct and efficient application approach in industrial design practice, effectively communicating designers’ intentions during the design process and fully embodying their ingenuity and craftsmanship [12].
As a product’s external manifestation, texture features significantly influence user perception [13] and purchase decisions [14,15,16,17], while preventing product homogenization. In today’s market, beyond commercial success, product texture design, as a crucial component of user experience, not only influences users’ perceptual needs but also contributes to extending product lifespan [18]. Product texture design transforms products from disposable commodities into meaningful, long-lasting companions, thereby supporting the transition towards a more circular and emotionally sustainable economy. Based on this context, this study addresses the following four research questions:
- How can we effectively align smart product texture design with users’ perceptual needs in consumer-oriented design?
- How can one develop a systematic texture design framework catering to specific user groups’ emotional needs?
- How can one quantify perceptual vocabulary into material, colour and surface processing technology parameters for accurate affective preference capture?
- What evaluation method can one use to objectively identify texture solutions that best match users’ perceptual needs?
The structure of this paper is organized as follows: Section 2 reviews relevant literature. Section 3 introduces the research methodology. Section 4 conducts texture design research for child companion robots. Section 5 discusses the research findings. Section 6 concludes the paper with future prospects.
2. Literature Review
2.1. Kansei Engineering
To explore the user’s preferences and cognition regarding product texture, Kansei engineering is typically employed to analyse the effects of product texture design. It also serves as a reliable quantitative method for assessing user perception [19,20,21]. Kansei engineering utilizes experimental methods to obtain and analyse the psychological feelings evoked by users’ expectations. Furthermore, it facilitates the discovery and expression of the relationship between design elements and users’ emotional responses [22]. This approach is often used to analyse various product features, including shape, colour, and material, which are closely related to the factors of production, manufacturing, innovation, and aesthetics. The design goals can be more accurately achieved through data quantification [23].
Yang et al. [24] proposed a product form design method based on a diffusion model and Kansei engineering, involving a generation, scoring, and filtering process. The effectiveness of this approach in meeting users’ emotional needs was validated using an ear thermometer as an example. Kang [25] proposed a bionic design method that integrates Kansei engineering and the associative creative thinking method, validated through an electronic scale case study to enhance product emotional value effectively. Tang et al. [26] introduced a decomposition-based multi-objective evolutionary algorithm, combined with a Kansei engineering prediction model and the TOPSIS method, to optimize a product form so as to meet users’ multidimensional emotional needs and then validated its effectiveness and applicability through a case study.
To explore users’ perceptual characteristics of different aluminium cabinet textures, Shen et al. [8] used the semantic difference method to analyse the correlation between texture and perceptual images of aluminium cabinets based on Kansei engineering, providing a new idea for the texture design of aluminium cabinets. Chu et al. [27] proposed a design method for aircraft cabin texture and colour based on Kansei engineering to enhance passenger comfort on planes, assigning different emotional expressions to colour and texture. Effendi et al. [28] employed Kansei engineering to investigate consumers’ material selection tendencies for mint hard candy packaging to boost the sales volume of mint hard candy.
2.2. The Theory of Extenics
Extenics is an emerging interdisciplinary field that focuses on transforming incompatible problems into compatible ones and identifying effective solutions [29]. Through Extenics, the target object can be analysed using extension analysis to explore its multidimensional variation space, which enables expansion and innovation in various aspects.
Li et al. [30] innovatively designed the powertrain architecture of a distributed hybrid electric tractor by integrating axiomatic design and Extenics methods, achieving energy-saving and emission-reduction objectives while providing new insights for greening agricultural machinery. Ren et al. [31] developed an Extenics-based contradiction resolution model and applied it to low-carbon vacuum pump design, effectively generating innovative solutions and demonstrating the superiority of Extenics in resolving design contradictions. Chen et al. [32] proposed a feature transfer-based bionic design model that effectively transforms biological systems into engineering systems using Extenics and TRIZ theory and validated its effectiveness through a case study of a bulk bag outlet folding device.
In the process of product texture design, contradictions or ambiguity may arise in the selection of product colour, material, and surface processing technology. Extenics can address these contradiction problems and use them as research objects to create a new design method. Therefore, Extenics is widely used in product design and contributes innovative power to product design [30]. Based on Extenics, innovative designs for product shape, material, and colour can be proposed, and the output design scheme can also be evaluated. Zhang et al. [33] studied the formal expression of automobile texture by using Kansei engineering and Extenics and established an extension reasoning method for automobile interior texture. Chen and Wu [34] utilized the design method of Extenics, combined with the corresponding regional cultural characteristics, to conduct relevant design research on the shape of trams. Li et al. [35] integrated extension semantics and fuzzy evaluation methods to study the relationship between subway train appearance design and regional cultural characteristics, verifying the feasibility of cultural representation, scheme design, and evaluation in the study.
As mentioned in the cited literature, integrating Extenics and Kansei engineering into product texture design enables user perception-oriented solutions. While existing studies extensively explore product texture design, research specifically addressing smart products remains limited, particularly regarding how combinations of colour, material, and surface processing technology profoundly affect users’ perceptual needs in intelligent devices.
Unlike previous studies that apply Kansei engineering to analyse individual texture elements [8,27] or combine it with Extenics primarily for formal expression [33], this paper focuses specifically on smart products and the synergistic optimization of colour, material, and surface processing technology. Based on Kansei engineering and Extenics, and integrating methods such as the K-means clustering algorithm and grey relational analysis, a systematic design framework is constructed. This framework helps uncover users’ perceptual needs for product texture, enhancing product durability and reducing resource waste.
3. Method
This study is conducted using the following methods: First, an extension model is established through Extenics theory, and extension analysis is performed. Next, texture somatosensory evaluation vocabularies are collected through literature review, online platform searches, and user feedback, resulting in a set of representative vocabularies. Subsequently, based on these representative vocabularies, reasoning criteria for different texture elements are constructed. Finally, under the premise of determining the target somatosensory evaluation vocabularies, we generate texture design schemes based on different texture elements’ reasoning criteria. We utilize grey relational analysis and statistical analysis to evaluate and determine the optimal solution. We validate the reliability of the texture design scheme through children’s perception experiment. The specific methodological process is illustrated in Figure 1.
Figure 1.
Research framework.
3.1. Extenics
3.1.1. Establish an Extension Model
Extenics is a discipline established by Professor Wen Cai and others, encompassing mathematics, philosophy, and engineering [36]. It explains innovative design problems through formal methods and analyses the quantitative and qualitative changes in materials by establishing extension models to describe the problem-solving process.
The basic element of Extenics consists of the matter element, affair element, and relation element, collectively referred to as the logical cell of Extenics [37]. The matter element describes the characteristics of things, the affair element captures the changes in their dynamic processes, and the relation element outlines the relationships between different primitives [38]. These elements have a synergistic effect on one another, and by addressing problems through integrated analysis and transformation, suitable strategies and methods can be identified. The extension primitive theory articulates the subjective analysis and objective judgment of the target object through the target object, the object feature, and the feature value [39]. By examining the correlation between the matter element, the affair element, and the relation element, the extension primitive can be analysed to illustrate the relationships among things.
The primitive model can be expressed as follows:
where represents the primitive; represents the research target object, which is also the matter element; represents the object feature, which is also the affair element; and represents the feature value, which is also the relation element.
3.1.2. Extension Analysis of Primitive
Things possess the characteristics of extensibility and convergence; under certain conditions, any object can be extended, and the extended object can, in turn, be converged. This is a key methodological feature of Extenics. In the process of resolving contradictions, the use of a divergence–convergence thinking model enables effective problem-solving. This approach is known as the diamond-shaped thinking method [40].
The diamond-shaped thinking model aligns with the iterative process of product innovation design, which involves “divergence–convergence–divergence–convergence” stages. It clearly describes the process of design innovation thinking and serves as a formalized tool for creative thinking. According to the principle of divergence analysis, a single element can be extended into multiple identical object elements, and the set of identical object elements is always a non-empty set. This principle reflects the divergence of one object, multiple features [29].
where represents the primitive set; represents the research target object; represents the different object feature; and represents the different feature value.
3.1.3. Extension Transformation Analysis
Extension transformation is a creative tool to solve contradictory problems, one which can transform unknown problems into knowable problems. Using the extension transformation theory in Extenics, the texture features and values of products are transformed based on perceptual engineering, and the basic extension transformation table is made. As shown in Table 1 and Table 2, the feature set of design elements is obtained, and the innovative design of product texture is realized.
Table 1.
Extension basic transformation Table 1.
Table 2.
Extension basic transformation Table 2.
3.2. Collection and Screening of Texture Evaluation Vocabulary
At this stage, Octoparse version 8.7.4 was used to collect user feedback on the target product from publicly available online platforms, gathering texture somatosensory evaluation vocabulary and reviewing relevant literature for additional vocabulary acquisition. This stage consisted of three parts: the first part involved the initial collection of relevant somatosensory evaluation vocabularies; the second part involved a secondary screening of the collected vocabulary; and the third part included a questionnaire survey based on the screened vocabulary, followed by statistical analysis to identify representative somatosensory evaluation vocabularies.
First Part: This phase involves the use of a legitimate web crawler tool to extract user comments and feedback related to the texture of the target product from public online platforms such as social media, forums, and shopping websites. At the same time, a systematic review of relevant academic and field literature is conducted to supplement and expand the vocabulary pool, aiming to collect as many descriptive vocabularies as possible that users employ to express their visual perception of texture.
Second Part: This part mainly focuses on cleaning and refining the initially collected vocabulary, including removing duplicates, eliminating irrelevant or semantically ambiguous vocabulary, and grouping semantically similar words. Students and teachers in the field of design are invited to filter the vocabulary to ensure that the retained vocabularies effectively reflect users’ true perceptions in texture experiences.
Third Part: A questionnaire is designed to invite users to rate the vocabulary. Subsequently, statistical analysis is conducted on the total scores, mean values, and standard deviations of the survey results. Ultimately, the most representative and widely recognized somatosensory evaluation vocabularies are selected. These vocabularies serve as the foundation for subsequent texture design analysis and decision-making.
3.3. Construction Reasoning Criteria for Different Texture Elements
Texture elements can be divided into colour element, material element, and surface processing technology element. Different methods can be selected based on the different elements, and reasoning criteria for texture elements are developed from the perspective of the user’s visual perception.
In this experiment, the colour analysis method was carried out by establishing a chromatic colour sample library. The main method was to collect product samples and perform K-means clustering on the colour of product samples to form a reliable chromatic colour sample library, which provided a guarantee for product colour selection.
K-means is a distance-based clustering algorithm that works by randomly initializing K cluster centres, then iteratively assigning data points to the nearest centre and updating the centroids until they stabilize, or a stopping condition is met, ultimately partitioning the data into K compact clusters [41]. Applying the K-means clustering algorithm to colour analysis can allow one to further explore the application of product colours and their coordination schemes. The specific steps are as follows:
Initial Clustering: Import the original image and set the number of cluster centres k. The extracted colour quantities from each image should remain consistent.
Secondary Clustering: Combine all extracted colour clusters and compute the Euclidean distance between non-centroid points and their respective cluster centres.
where , , represent the r, g, b values of the cluster centres respectively and , , represent the r, g, b values of any pixel within the group respectively.
Cluster Centre Selection: Update each cluster centre by taking the mean of all non-centroid points assigned to it.
Final Colour Determination: Iterate Steps 2 and 3 until the colour clusters converge (no further changes occur).
To extract an appropriate number of representative and distinguishable chromatic categories during the secondary colour clustering, the elbow method is commonly employed to determine the optimal number of clusters K [42]. The elbow method is a straightforward and effective clustering evaluation technique. Its core principle involves plotting the relationship between the number of clusters K and the clustering errors, specifically, the sum of squared errors (SSE) and observing the trend of error reduction. When the increase in K leads to only marginal improvements in SSE, forming a visible “elbow” in the curve, the corresponding K value can be considered the optimal number of clusters. The relevant formula is shown as follows:
where is the number of clusters; represents the th cluster; denotes any sample point in cluster ; is the centroid (mean) of cluster ; and is the squared Euclidean distance from the sample point to its cluster centre.
The analysis of materials and surface processing technology was carried out by means of an online questionnaire survey. The questionnaire data were summarized, and the data under different somatosensory evaluation conditions of materials and surface processing technology were sorted. Finally, a somatosensory evaluation grade table of product materials and surface processing technology was established. Furthermore, heat maps were employed to illustrate the texture evaluation results of different materials and surface processing technologies under various somatosensory evaluations.
3.4. Grey Relational Analysis
The grey relational analysis was proposed by Chinese scholar Julong Deng in 1982. It is often used to analyse the uncertain correlation between things, or the uncertain correlation between system factors and main factor [43], and has been widely involved in machinery, economy, design, and other fields. The grey relational analysis can make a decision on the product texture design, determine the optimal product that meets the user’s somatosensory evaluation, and provide a reference for the designer. The main steps are as follows:
Step 1: Determine the decision matrix
where is the decision matrix, which represents the mean value of user’s somatosensory evaluation of the product texture scheme; is the product texture scheme; denotes an adjective word; and is the th product texture scheme corresponding to the th individual somatosensory evaluation value, .
Step 2: Standardized decision matrix.
The range transformation of Formula (5) is carried out to obtain Formula (6), as follows:
Then the normalized matrix is .
Step 3: Determine the ideal solution of the matrix.
The user scores adjectives for each product texture scheme, a total of product texture schemes, and takes the maximum value of the same adjective vocabulary score in each product texture scheme as the ideal solution, as follows:
where .
Step 4: Calculate the grey relational coefficient of the matrix, as follows:
where is the resolution coefficient, and is generally 0.5.
Step 5: Calculate the grey relational degree.
It is necessary to set the weight of emotional images as . According to Equation (8), the grey relational degree of the ideal solution in the corresponding sequence of each descriptive vocabulary of the th product texture scheme can be obtained, and can be expressed as follows:
The grey relational degree values of each product texture scheme are summarized, and the priority of the product texture scheme is obtained by sorting the values from high to low.
3.5. One-Way Anova and Post Hoc Test
To accurately determine the ranking results of the design solutions, systematic statistical analysis is required to enhance the reliability of conclusions. One-way ANOVA is a parametric test method used to compare whether the differences in means among multiple independent groups are statistically significant [44]. Its core principle involves decomposing the total variation into between-group variation and within-group variation, thereby determining whether the between-group differences are significantly greater than random error.
In this phase of analysis, a one-way ANOVA is first conducted on all group data under the target evaluation criteria, followed by homogeneity of variance test. A p-value less than 0.05 indicates a heteroscedasticity test, while a p-value greater than 0.05 suggests a test for homogeneity of variances. When the p-value is less than 0.05, this demonstrates that the between-groups are statistically significant, with smaller p-values indicating stronger evidence for rejecting the null hypothesis [45]. A subsequent post-hoc test is then performed for multiple comparisons: LSD results are referenced for data with a test for homogeneity of variances, while Tamhane’s T2 results are used for data with a heteroscedasticity test.
Finally, the statistical results are cross validated with the scheme ranking outcomes. Design schemes that rank highly in grey relational analysis and simultaneously show statistically significant superiority over other alternatives in the tests will have their optimal conclusions reinforced. Conversely, schemes performing poorly in both assessments will be conclusively identified as inferior options.
3.6. Application of Texture Design in Child Companion Robot
In the texture design process of child companion robots under the target somatosensory evaluation system, it is necessary to systematically select appropriate texture elements based on multi-dimensional reasoning criteria. This process begins with the filtering of texture elements from various reasoning criteria to form multiple combinations of texture design schemes. Parametric modelling is then conducted using Rhino software version 7.0, and multi-physical scene rendering is performed with Keyshot software version 2023. By simulating material optical properties and visual feedback through advanced visualization techniques, the texture expression of the child companion robot is optimized in terms of visual realism and emotional interactivity.
To effectively explore whether different approaches align with design goals, it is necessary to experimentally verify these approaches. As the research target of this study is a child companion robot, the target group for experimental verification is chosen to be children, so as to obtain real perception needs data from them, thereby proving the effectiveness and feasibility of the solutions.
According to the 2024–2030 China Service Robot Market Analysis and Investment Prospects Research Report, the primary target user group for child companion robots is children under 12 years old. Based on Piaget’s theory of cognitive development, children aged 7 to 11 are in the concrete operational stage, which is a critical period for the development of their thinking characteristics. Additionally, children in this age range have a better understanding of language expression and word meanings, ensuring the accuracy and reliability of experimental data. Therefore, this study sets the target age range for the children’s perception experiment at 7 to 12 years old. This study will conduct subsequent texture design perception experiments targeting this specific age group to obtain representative and reliable user perception data, providing a scientific basis for optimizing the design of child companion robots.
4. Case Study
Companion robots have become one of the main research directions in the home robotics industry [46]. In this field, most manufacturers target children as primary users [47]. This is mainly due to the increasing demands of parents’ work, which results in reduced time spent with their children. Consequently, toys often take on the role of companionship. With the rapid development of society, traditional toys are gradually being replaced by intelligent toys or robots, in order to better meet children’s needs for entertainment and emotional connection. Children’s perception of companion robots plays a critical role in their design [48], particularly in terms of appearance and interaction. The development of interactive functionalities in companion robots for children has enabled applications such as guided reading activities [49], chronic disease treatment interventions [50], and foreign language vocabulary learning [51]. To enhance trust during human–robot interaction, Pinney et al. [52] identified that certain facial aesthetics are perceived as more trustworthy than others—notably, cartoon-like faces were found to inspire greater credibility than human-like counterparts. In addition to visually engaging forms, the texture design of robots can further enhance children’s affection and sense of closeness toward them.
4.1. Texture Analysis for Child Companion Robot Based on Extenics
4.1.1. Establishment of an Extension Model for Child Companion Robot
When users evaluate the texture of a product, they will make a judgment through the visual sense of the product material, colour and surface processing technology embodied in the texture of the product, such as roughness, temperature, softness or hardness and other sensations. The user can then use perceptual vocabulary to evaluate the texture, that is, for the user’s evaluation of the product’s somatosensory evaluation.
In this work, the product texture extension primitive is called the somatosensory primitive, that is, the user’s somatosensory evaluation primitive of the product, which is recorded as . The child companion robot is taken as the research object, and its somatosensory primitives include the somatosensory evaluation of the child companion robots’ texture given by users, such as “roughness sense, temperature sense, hardness sense”. There is a correlation between the user somatosensory evaluation primitive and the material element primitive of the child companion robot, which is recorded as ; there is a correlation between the user somatosensory evaluation primitive and the colour primitive of the child companion robot, which is recorded as ; and there is a correlation between the user somatosensory evaluation primitive and the surface processing technology primitive of the child companion robot, which is recorded as .
can be expressed as follows:
can be expressed as follows:
can be expressed as follows:
can be expressed as follows:
Things are multifaceted, and one thing can have multiple features. The matter element model of product perceptual design can reflect one or more design features of the product. Product texture will produce different somatosensory evaluations by users under different combinations of colour, material, and surface processing technology. To obtain more possibilities for product texture design, it is necessary to summarize the features of colour, material, and surface processing technology, and to quantify the correlation between users’ perceptual need and colour, material, and surface processing technology, in order to carry out extension analysis [53]. According to Formula (1), the relevant formula can be obtained as follows:
The matter-element model of somatosensory evaluation can be expressed as follows:
The matter-element model of material elements can be expressed as follows:
The matter-element model of colour elements can be expressed as follows:
The matter-element model of surface processing technology elements can be expressed as follows:
4.1.2. Extension Analysis of Somatosensory Evaluation
The somatosensory influencing factors of the child companion robots can include the colour, material, and surface processing technology of the appearance of the child companion robots. The warmth and coolness of the colour, the softness and hardness of the material, and the roughness of the surface processing technology all affect the user’s feeling of the product. Through market research, the materials and surface processing technology of child companion robot products are extended, and the materials and surface processing technology elements that meet the user’s somatosensory evaluation are excavated. The materials and surface processing technologies that meet the requirements are summarized, as shown in Table 3 and Figure 2.
Table 3.
Material elements composition table.
Figure 2.
Surface processing technology elements composition.
In colour analysis, each colour is composed of three basic attributes: hue, saturation, and brightness. The HSB colour model can intuitively reflect the relationship between the three elements of colour and is composed of hue H, saturation S, and brightness B [54]. Based on the HSB colour mode, this paper extends and analyses the hue, saturation, and brightness of the appearance colour of the child companion robots and explores the influence of the three elements of colour on their colour matching by establishing their chromatic colour sample library.
4.1.3. Establishment of an Extended Model of Somatosensory Elements
Using the diamond-shaped thinking method of Extenics, the somatosensory evaluation features, material features, colour features, and surface processing technology features are extended. The formula is as follows:
4.1.4. Extension Transformation of Child Companion Robot
According to the theory of extension analysis, an object or feature can be extended and transformed into another object or feature, or an object or feature can be decomposed into several objects, features, and values, and finally, multiple feasible schemes can be formed. By integrating extension analysis theory and extension transformation methods, specific elements of child companion robots can be effectively modified and optimized. For example, when a user sees a product texture that exhibits a sense of hardness, the user makes a hierarchical judgment of the sense of hardness. Use of the extension transformation symbol can be expressed as follows:
4.2. Collection and Screening of Somatosensory Evaluation Vocabulary
A legitimate web crawler tool was employed to extract and filter 50 somatosensory evaluation vocabularies describing child companion robots from public online platforms, including social media, forums, and shopping websites. After that, 20 teachers and students majoring in design were convened to pre-screen the collected somatosensory evaluation vocabulary, replacing or eliminating inappropriate and synonymous somatosensory evaluation vocabularies, to allow access to accurate vocabularies. Finally, the 20 most appropriate somatosensory evaluation vocabularies for child companion robots were selected, and the corresponding vocabularies were selected to form somatosensory evaluation vocabulary pairs, as shown in Table 4.
Table 4.
Somatosensory evaluation vocabulary statistics.
Then, the initial screened vocabulary was subjected to a third screening. The semantic difference method was used to screen out the representative vocabulary of the child companion robot somatosensory sense vocabulary by making a questionnaire. The selected 20 pairs of somatosensory sense vocabulary were randomly arranged, and the participants were scored according to the five-level scale method, in which 1 to 5 points respectively correspond to unimportant, general, important, very important, and most important. A total of 153 questionnaires were distributed, and 141 valid questionnaires were collected. The collected data were imported into Statistical Package for the Social Sciences (SPSS) version 25.0 for data analysis, and the total score, mean, and standard deviation of each vocabulary were obtained. SPSS is an easy-to-use statistical software that combines data organization and data analysis functions [55]. The appropriate data are obtained by importing the data file into SPSS and selecting descriptive statistical analysis for total score, mean, and standard deviation calculations. The data results are shown in Table 5. The scatter plot in Figure 3 is generated using the mean values of each somatosensory evaluation metric as data points.
Table 5.
Child companion robot somatosensory evaluation vocabulary results.
Figure 3.
Scatter plot of mean values for somatosensory evaluation metrics.
According to the data of Table 5 and Figure 3 in the experiment, the mean value of “warm” vocabulary is 3.532, which is the highest level, thus indicating that “warm” is the most appropriate vocabulary to describe the human body feelings of the child companion robot; secondly, the corresponding mean values of “smooth”, “soft” and “light” are 3.448, 3.427 and 3.412 respectively, and the three words are almost at the same level. According to the mean value of somatosensory evaluation vocabulary, four groups of representative somatosensory evaluation vocabulary can be analysed: warm–cold, smooth–rough, soft–hard, and light–heavy, which also confirms that the main influencing factors of somatosensory can be summarized as temperature sense, smoothness sense, hardness sense, and volume sense. To fully realize the texture expression of child companion robots, the perception of them in terms of colour, material, and surface processing technology can be analysed from the temperature sense, smoothness sense, hardness sense, and volume sense of product texture, to provide help for their texture design.
4.3. Establishment of Texture Element Reasoning Criteria
This section focuses on analysing three key texture elements of child companion robots: colour, material, and surface processing technology, to establish respective reasoning criteria for each element. In this experiment, the colour analysis was carried out by establishing a chromatic colour sample library. The main method was to collect product samples and perform K-means clustering on the colour of product samples to form a reliable chromatic colour sample library, which provided a guarantee for product colour selection. The analysis of materials and surface processing technology was carried out using an online questionnaire survey. The questionnaire data were summarized, and the data under different somatosensory evaluation conditions of materials and surface processing technology were sorted. Finally, a somatosensory evaluation grade table of product materials and surface processing technology was established.
4.3.1. Colour Element Reasoning Criteria
In the analysis of colour elements, the hue, saturation, and brightness of colour correspond to the temperature sense, hardness sense, and volume sense of colour respectively [53] Because colour has little effect on the roughness of products, it is difficult to reflect the smoothness of products, so the correlation between colour and smoothness is not considered.
The temperature sense of colour is mainly reflected in the hue, which can be roughly divided into very warm (orange), warmer (red, mauve, yellow, yellow green), neutral colour (magenta, green), very cold (cyanine blue), colder (purple, blue, cyan, turquoise). To research the temperature sense of colours in child companion robots, 104 product samples of child companion robots were collected from online shopping platforms and product websites. To accurately capture the colour representation of these robots, the K-means clustering algorithm was employed to cluster the colours of the 104 samples, with the clustering process illustrated in Figure 4.
Figure 4.
K-means clustering process.
First, each product sample underwent initial clustering, extracting five colours per image. Then, the obtained colours were consolidated and subjected to secondary clustering. To determine the number of cluster centres K for the second round of clustering, the elbow method was employed for preliminary evaluation. As the purpose of this clustering is to extract chromatic colours from the samples, using a small K value may result in an insufficient number of identifiable chromatic colours, thereby compromising the comprehensiveness of the chromatic colour analysis. Therefore, the selection of K must consider not only the error convergence trend but also the quantity and distinguishability of the extracted chromatic colours.
As shown in the elbow plot in Figure 5, the curve begins to level off around K = 15, and the curve becomes nearly flat after K = 30. To further assess the distinguishability of the clustered colours, colour centres were extracted at K = 15, 20, 25, and 30. Among these, K = 30 produced the largest number of distinguishable chromatic colours, which was 17, with good separation between them. While the elbow point typically suggests selecting a smaller number of clusters (e.g., K = 3–6), the goal of this study was not to minimize SSE alone, but rather to maximize the number and separability of chromatic colours relevant for the design context. Therefore, K = 30 was ultimately selected.
Figure 5.
Elbow plot.
To better visualize the distribution of these chromatic colours, a colour centre distribution plot was generated. As the L*a*b* colour space is generally more suitable for visualization, the RGB cluster centres obtained at K = 30 were converted to L*a*b* space, as shown in Table 6. The a* and b* channels of the L*a*b* values were used as the x- and y-axes, respectively, to produce a two-dimensional distribution plot. As shown in Figure 6, the 17 chromatic colour points are widely distributed and do not overlap, indicating a high degree of colour separability, and the central hollow point is in black, white, and grey. This confirms the effectiveness of the clustering results and supports the selection of K = 30 as the optimal number of clusters for this study.
Table 6.
Colour RGB and L*, a*, b* values.
Figure 6.
Colour centre distribution plot.
As this experiment aimed to establish a chromatic colour sample library for child companion robots, the selected colour samples needed to cover a variety of colours (excluding black, white, and grey). When the secondary clustering yielded 30 colours, the number and quality of the colour samples were deemed most suitable. The entire colour extraction process is illustrated in Figure 7.
Figure 7.
Colour extraction process.
After excluding black, white, and grey, a total of 17 chromatic colours were left, and a colour proportion chart was drawn, as shown in Figure 8. According to the HSB value, the clustered colours were divided into hue rings to realize the establishment of the chromatic colour sample library of the child companion robot, as shown in Figure 9.
Figure 8.
Colour proportional chart.
Figure 9.
Child companion robot chromatic colour sample library.
Children like bright colours, so children’s products can choose colours with higher brightness and higher saturation according to product characteristics [56]. According to the HSB mode, the brightness range can be determined to be 41–100%, and the saturation range is 41–100%. The higher the saturation, the stronger the colour hardness, the higher the brightness, and the lighter the colour volume [53]. In terms of colour matching, children’s product colour matching can be too complex, or too much will confuse children’s thinking, resulting in anxiety, boredom and other emotions about the product; therefore, children’s products can be based on the principle of simple colour matching, so that it is simple and bright [57].
4.3.2. Material Element Reasoning Criteria
Based on the representative somatosensory evaluation vocabularies, a total of 129 participants were recruited to fill out the online semantic difference method questionnaire on the perception of the two design elements of product material and surface processing technology. The target age groups were the post-00s, post-90s, and post-80s generations, as most individuals in these cohorts are parents who not only frequently purchase children‘s products but also have a certain level of familiarity with smart products. Among them, the post-90s and post-80s generations currently represent the primary group of parents. A total of 129 valid questionnaires were collected, comprising 32 post-00s, 51 post-90s, and 46 post-80s respondents, with 62 males and 67 females.
The questionnaire used a five-point scale ranging from −2 to 2, with higher scores indicating stronger perceptions of the corresponding perceptual dimension (e.g., smoothness). Based on the questionnaire results, the mean evaluation scores for each material across the dimensions of smoothness, volume, hardness, and temperature were summarized. Prior to data analysis, reliability and validity tests were conducted. As the questionnaire aimed to collect users’ perceptual ratings of target elements, which differ from traditional psychometric scales, the intraclass correlation coefficient (ICC) was employed to assess inter-rater reliability. For validity, KMO measure, Bartlett’s test of sphericity, cumulative variance contribution rate, and the Friedman test were used to evaluate construct validity and discriminant validity. The detailed results are presented in Table 7. Table 7 shows that the average ICC value is 0.644 (ICC > 0.5), indicating good intra-rater consistency. The KMO value is 0.752, and Bartlett‘s test of sphericity is significant, with a cumulative variance contribution rate of 81.877%, suggesting that the data have a certain degree of construct validity. The Friedman test is also significant (p < 0.05), indicating that participants are able to effectively distinguish between different materials across the perceptual dimensions.
Table 7.
Reliability and validity analysis of material element.
To explore the rating patterns of different materials, the mean values of each perceptual dimension for the materials were extracted, as shown in Table 8. We analysed the data presented by the questionnaire results and classified the materials according to the average score of each material. The results are shown in Table 9 and Table 10. Based on Table 8, Table 9 and Table 10, four material heatmaps for the child companion robot are generated, as shown in Figure 10.
Table 8.
Mean value of material somatosensory evaluation.
Table 9.
Material somatosensory evaluation grade Table 1.
Table 10.
Material somatosensory evaluation grade Table 2.
Figure 10.
(a) Heatmap of smoothness sense. (b) Heatmap of volume sense. (c) Heatmap of hardness sense. (d) Heatmap of temperature sense.
4.3.3. Surface Processing Technology Element Reasoning Criteria
The somatosensory evaluation features of surface processing technology elements are mainly smoothness sense, volume sense, and hardness sense. The effect of temperature sense on surface processing technology is the lowest, and it can have a greater impact when combined with other design elements. Therefore, the research on temperature sense is not carried out in the somatosensory evaluation of surface processing technology elements. The format of the surface processing technology elements questionnaire was consistent with that of the material elements questionnaire. The reliability and validity test results are presented in Table 11, indicating that participants were able to effectively distinguish between different surface processing technologies across the perceptual dimensions. The mean somatosensory evaluation values for each surface processing technology were obtained, as shown in Table 12. The results of the questionnaire were analysed, and the somatosensory evaluation grade of the surface processing technology was divided according to the average score of the process somatosensory evaluation. The results are shown in Table 13. Based on Table 12 and Table 13, three heatmaps of surface processing technology for the child companion robot are generated, as shown in Figure 11.
Table 11.
Reliability and validity analysis of surface processing technology element.
Table 12.
Mean value of somatosensory evaluation of surface processing technology.
Table 13.
Surface processing technology somatosensory evaluation grade.
Figure 11.
(a) Heatmap of smoothness sense. (b) Heatmap of volume sense. (c) Heatmap of hardness sense.
4.3.4. Analysis of Texture Elements in Child Companion Robot
According to the reasoning criteria of colour elements, to ensure the accurate expression of the colour of child companion robots, the main colours of child companion robots in the market can be obtained by establishing a product chromatic colour sample library. Then, from the perspective of children’s product colour matching, the principle of simplification is used. Through the design method of white as the main colour and with different brightnesses and saturations of a single colour as the supplement, children’s products are made lighter and simpler so as to improve the fit between product colour and the user’s somatosensory evaluation, and to improve children’s experience. In the subsequent output of the texture design scheme for the child companion robot, colour matching can be selected based on the colour distribution of the child companion robot colour sample library obtained in Section 4.3.1.
In Table 9 and Table 10, and Figure 10 of the material element reasoning criteria, it can be seen that the alloy is in the position of grade 1, grade 5, grade 5, and grade 1 in the respective senses of hardness, volume, smoothness, and temperature. When the user purchases a child companion robot with such texture, it will produce a hardest, very light, smooth, and very cold somatosensory evaluation. The user’s somatosensory evaluation level of plastic is after the alloy. The somatosensory evaluation grades of TPU and PC polycarbonates are at the other end of alloys and plastics. When users see TPU and PC polycarbonates, they will have soft, heavy, rough, and warm somatosensory evaluations.
The somatosensory evaluation level of surface processing technology includes hardness, volume, and smoothness. According to Table 13 and Figure 11, wire drawing and polishing will have users make a hard, light, and smooth somatosensory evaluation of product materials; sand blasting will have users produce a heavy and rough somatosensory evaluation; while spray coating will have users produce an extremely soft somatosensory evaluation. The somatosensory evaluation data of the material element and the surface processing technology element were compiled into radar charts, as shown in Figure 12 and Figure 13.
Figure 12.
Material element somatosensory evaluation radar chart.
Figure 13.
Surface processing technology element somatosensory evaluation radar chart.
In the four texture evaluations, silicone and TPU effectively reflect the visual perception of temperature sense and the hardness sense, while alloy and ABS plastic are more prominent in representing smoothness sense and volume sense, especially alloy. Although PC polycarbonate shows a relatively balanced performance in smoothness sense, volume sense, and hardness sense, it stands out in temperature sense, where it demonstrates a very warm somatosensory evaluation.
In the radar chart of the somatosensory evaluation of the surface processing technology element, it can be observed that polishing and wire drawing reflect the smoothness and volume senses, while sand blasting, matte, and spray coating distinctly represent the hardness sense. Among all of the surface processing technology elements, only sand blasting maintains a relatively balanced state across the three somatosensory evaluations.
Based on the above analysis, after determining the appropriate colour scheme for the child companion robot, a corresponding material and surface processing technology can be selected according to different somatosensory evaluation dimensions to generate suitable texture design schemes for the child companion robot. This will provide diversified design options to meet the design objectives and improve design efficiency. In the subsequent output of texture design schemes, multiple texture solutions can be generated based on the colour element reasoning criteria, material element reasoning criteria, and surface processing technology element reasoning criteria.
4.4. Texture Design of Child Companion Robot
The somatosensory evaluation target of the texture design scheme of the child companion robot was determined from the four individual sensory evaluation vocabularies. According to the product colour matching principle, the material somatosensory evaluation grade and surface processing technology somatosensory evaluation grade obtained from the colour element reasoning criteria, and the material element reasoning criteria and surface processing technology element reasoning criteria, the scheme materials and surface processing technology were selected, and the somatosensory evaluation targets were matched with the colour matching and the material and surface processing technology that met the requirements. Finally, the texture design schemes were formed. Then, a questionnaire survey was conducted on the design scheme, and the grey relational analysis was used to compare the obtained design scheme data with the ideal solution, and the best product texture performance scheme was obtained. Finally, the statistical analysis of texture design scheme and children’s perception experiment were carried out to verify the effectiveness of the results.
4.4.1. Texture Design of Child Companion Robot Based on Somatosensory Evaluation
The somatosensory evaluation targets are selected as “light” and “smooth” in the design of the child companion robot. We chose a colour from the colours presented in the children’s chromatic colour sample library and colour proportion and followed the simple colour matching principle as the colour matching scheme of the design scheme. According to the somatosensory evaluation targets, the appropriate schemes are selected in the equivalent division of the material and surface processing technology elements. Finally, the base colour, material, and surface processing technology of the design scheme of the child companion robot are obtained, as shown in Table 14.
Table 14.
Somatosensory evaluation design element.
The extension transformation operation of the somatosensory evaluation design elements can present the following design scheme:
A child companion robot scheme can be composed of multiple texture schemes, which makes the final design scheme’s material texture more abundant. The specific schemes are as follows:
To make the design more accurate and the texture fuller, the texture superposition method is selected to realize the design. Based on the analysis of relevant data and reasoning criteria in Table 14, the colour matching of the final scheme can be based on the simplification principle of grey and white colour matching. A colour with an RGB value of (150, 219, 233) is randomly selected from the chromatic colour sample library of the child companion robot. The “light” perceptual vocabulary corresponds to the volume sense of colour, that is, the brightness of colour. A proportion of 91% is randomly selected from the brightness range of 41–100%. The material process collocation method is the same as material surface processing technology collocation and is different from material surface processing technology collocation. Based on the previous analysis, the appearance model of the child companion robot is designed in a cartoon style. Finally, a total of six child companion robots with different textures are designed, as shown in Figure 14.
Figure 14.
Child companion robot texture design schemes.
4.4.2. Product Texture Evaluation Based on Grey Relational Analysis
In this section, a total of 169 participants were invited to conduct a questionnaire survey on the texture design of child companion robots, which were mainly completed online. Taking the design of the child companion robot scheme in Figure 14 as an example, the target users are determined to be post-00s, post-90s, and post-80s, and the somatosensory evaluation vocabulary is determined to be “light” and “smooth”. A questionnaire survey was conducted based on the Likert 7 scale, as shown in Table 15. We summarized the collected questionnaire data, calculated the evaluation mean of each sample, and established the product image evaluation mean decision matrix of six design schemes, as shown in Table 16.
Table 15.
Child companion robot design scheme questionnaire.
Table 16.
Child companion robot decision matrix.
According to the normalized matrix of Formula (6), we can obtain the following:
According to Formula (7), the ideal solution of Formula (23) is obtained as follows:
When , the grey relational coefficient of the matrix is calculated according to Formula (8), and the following can be obtained:
The weight values of the two somatosensory evaluation adjectives were set to 0.5 and 0.5, respectively, to ensure equal importance and balance between both perceptual dimensions in the texture design evaluation. According to Formula (9), the values in Formula (25) are calculated, and the grey relational degree of each colour scheme to the ideal solution is obtained. This can be expressed as follows:
According to the numerical results of the grey relational degree obtained by Formula (26), the ranking results of the design schemes of the child companion robot are finally obtained: Scheme 3 > Scheme 1 > Scheme 2 > Scheme 4 > Scheme 6 > Scheme 5.
4.4.3. One-Way Anova and Post-Hoc Test for Texture Design Schemes
In Section 4.4.2, the preliminary ranking of different design solutions was established through grey relational analysis. To enhance the scientific rigor and validity of these solutions, we conducted statistical verification to determine whether the observed differences between solutions were statistically significant. The one-way ANOVA method was employed to examine potential significant differences among multiple sample means, followed by appropriate post-hoc test procedures.
The research collected 169 valid questionnaires, with the compiled dataset presented in Table 17. The first column identifies participant numbers, with each respondent providing evaluations for all six texture design schemes (coded as 1–6 in the second column). The third and fourth columns document the corresponding scores for the “heavy–light” and “rough–smooth” semantic differential scales.
Table 17.
Scheme data.
Statistical analysis of the data in Table 17 using SPSS yielded the descriptive statistics shown in Table 18 and the one-way ANOVA results shown in Table 19. Both evaluation dimensions demonstrated highly significant differences (p < 0.001), confirming that the observed variations between solutions represented genuine differences rather than random fluctuations.
Table 18.
Descriptive statistics table.
Table 19.
Anova data.
To validate the reliability of the initial scheme rankings from Section 4.4.2 and identify specific pairwise differences, a homogeneity of variance test, as shown in Table 20, was conducted to determine the appropriate multiple comparison methodology (LSD or Tamhane’s T2). The significant results (p < 0.05 for both dimensions) indicated heteroscedasticity, necessitating the use of Tamhane’s T2 for post-hoc analysis.
Table 20.
Homogeneity of variance test data.
As shown in Appendix A, the post-hoc test results revealed consistent findings across both evaluation dimensions: Scheme 3 emerged as statistically superior while Scheme 5 performed significantly worse than other schemes, results that perfectly align with the initial grey relational ranking. Non-significant differences were observed between Schemes 4 and 6 (“heavy–light” dimension) and between Schemes 1 and 2 (“rough–smooth” dimension), with all findings supporting the robustness of the original solution rankings.
From the data analysis results in the previous section, it can be seen that the ranking of the schemes obtained in Section 4.4.2 is reliable. Under different evaluation vocabularies, based on the ranking results of the schemes, the optimal solution that can demonstrate target preference can be selected, avoiding the situation were incorrect schemes selection deviates from user perception.
4.4.4. Child Companion Robot Perception Experiment
Based on previous analysis, this study identified six texture design schemes for child companion robots. To verify whether these designs meet children’s perception needs, this section aims to validate their effectiveness through a children’s perception experiment. According to Section 3.6, the target group for child companion robots is children aged 7 to 12, so the experiment recruited 48 children of this age group to participate.
To ensure that children can clearly perceive the content of the texture design scheme presentation, an online survey was conducted for the experiment. The specific process involves inviting target children, who then have their parents assist in opening the questionnaire link. During both the initial explanation phase and the subsequent operation phase, all children completed the experiment with the full accompaniment of their parents. The experiment thus obtained informed consent from guardians. The experiment responses are anonymous and do not involve privacy issues. Parents could help children open the questionnaire link and provide guidance on any unclear parts, but the questionnaires were answered independently by the children.
From previous sections, it is known that the somatosensory evaluation targets “heavy–light” and “rough–smooth” have been obtained. According to the Chinese Compulsory Education Chinese Curriculum Standards and Piaget’s theory of cognitive development, children aged 7–12 have fully grasped the semantic concepts of basic tactile vocabulary such as “heavy–light” and “rough–smooth”. The language comprehension ability of this age group is sufficient to support the lexical cognition required for the experiment. To help children better understand the meanings of target vocabularies during questionnaire design, the questions were presented metaphorically to vividly illustrate the connotations of the words, allowing children to fill out the questionnaires through imagination. The experimental site is shown in Figure 15, and the experimental questionnaire is shown in Figure 16. A total of 48 valid questionnaires were ultimately obtained, and the experimental results are shown in Figure 17.
Figure 15.
Experimental site.
Figure 16.
Experimental questionnaire.
Figure 17.
Vote count for schemes.
As shown in Figure 17, the children participating in the experiment found that Scheme 3 was the “lightest” and “smoothest”, while Scheme 5 was the “heaviest” and “roughest”. This result aligns with the previous ranking of the schemes, indicating that the combination of ABS plastic polishing and alloy polishing makes children feel the “lightest” and “smoothest”, whereas PC polycarbonate sand blasting and spray coating make children feel the “heaviest” and “roughest”. Under ranking 2, children believe that the number of votes ranking Schemes 1 and 2 behind Scheme 3 is relatively close, with Scheme 1 receiving only four more votes than Scheme 2. This indicates that the texture design used in Scheme 1, ABS plastic polishing, and the texture design in Scheme 2, which includes ABS plastic polishing and alloy wire drawing, give children a feeling of being “light” and “smooth”. Children voted most for Scheme 4, which is ranked fourth, indicating that the combination of ABS plastic polishing and sand blasting gives a relatively neutral impression, being both “light” and “smooth” as well as “heavy” and “rough”. Scheme 6 comes after Scheme 4, indicating that children perceive both Schemes 6 and 4 as “heavy” and “rough”, though Scheme 6 exhibits a stronger intensity.
In summary, the experiments of this section can effectively validate the results obtained in Section 4.4.2 and Section 4.4.3. The texture design schemes obtained from this study can serve as a reference for texture design in child companion robots, meeting the perception needs of children.
5. Discussion
Based on the theory of Extenics, this paper used Kansei engineering to take child companion robots as the research object, analysed the influences of colour, material, and surface processing technology of the child companion robots on their texture expression and studied the perception and aesthetics of product texture. Product texture research has always been a topic of research in the design field, and texture experience research has also been an area of concern in recent years. Through the quantitative method of perceptual engineering, this study explored the relationship between product texture and user perception and studied the psychological feelings of users on different product textures.
Through the results obtained from Section 4.3, it can be seen that the chromatic colour sample library of child companion robots could clearly show their colour use range, and that the colour matching principle could also reflect the design direction of children’s products. The somatosensory evaluation grade table, based on the reasoning criteria of material elements and surface processing technology elements, could reflect the user’s perception of the child companion robot on the material elements and surface processing technology elements. From three reasoning criteria, the user’s psychological feelings about texture can be explored, and the product texture design expression that meets the user’s psychological needs can be accurately captured. In practical industrial applications, designers can quickly construct or update chromatic colour sample libraries and somatosensory evaluation grade tables for target product categories by updating user data. Subsequently, through user testing, the somatosensory evaluation targets are determined, and the corresponding materials and surface processing technologies are matched from the grade tables to generate preliminary design schemes. This method comprehensively considers industrial procurement costs and the maturity of surface processing technologies, enabling seamless integration into existing product development workflows, thereby significantly shortening traditional trial and error design cycles.
In the experimental verification of the texture design scheme of the child companion robot in Section 4.4, it was shown that different texture performance schemes brought different perceptions to users. In the texture design schemes, the combination of the texture design scheme of ABS plastic and the alloy polishing phase was found to be the best scheme to meet the somatosensory evaluation target, which was consistent with the alloy grade in the somatosensory evaluation grade of the material in Section 4.3 and the polishing grade in the somatosensory evaluation of the surface processing technology. However, the combination of PC polycarbonate sand blasting and spraying is a texture design scheme that could not meet the goal of somatosensory evaluation, something which echoes the PC polycarbonate grade in the material somatosensory evaluation grade in Section 4.3 and the spraying and sand blasting grade in the surface processing somatosensory evaluation grade. The selection of the optimal scheme using grey relational analysis demonstrates the practical application of a multi-criteria decision-making tool to resolve conflicts between perceptual attributes and manufacturing parameters, ensuring that the chosen solution aligns with both user expectations and production feasibility. According to the above experimental results, the designer can, from the texture performance, select the corresponding material after determining the somatosensory evaluation target of the product and then determine the surface processing technology that meets the somatosensory evaluation target according to the characteristics of the material, before finally creating a sense of harmony that meets the design requirements and ultimately realizing the aesthetic expression of the product texture.
In the children’s perception experiment, children were surveyed on six texture design schemes to explore whether the texture design schemes obtained in Section 4.4.2 and Section 4.4.3 meet the children’s perception needs. The results obtained from Section 4.4.4 indicate that children perceive the product texture of Scheme 3, which combines ABS plastic polishing and alloy polishing, as the “lightest” and “smoothest”. In contrast, Scheme 5, which uses PC polycarbonate sand blasting and spray coating, gives children the perception of the “heaviest” and “roughest” texture. The perceptual evaluations of Schemes 1, 2, 4, and 6 are sequentially between Schemes 3 and 5. This ranking result is consistent with the research conclusions of Section 4.4.2 and Section 4.4.3. This study validated, through children’s experiments, that the proposed texture design direction can effectively meet children’s perception needs. By bridging user perception with precise design specifications, this method enhances the product’s social sustainability through improved user satisfaction and emotional attachment, which can potentially extend the product’s lifespan and reduce premature replacement waste. This not only provides a basis for the design of child companion robots but also offers references for the texture design of other smart products.
This study proposes a texture design framework based on Extenics and Kansei engineering, providing designers with a systematic solution. The framework not only accurately captures user perception needs but also extends design elements through Extenics theory, effectively enhancing the innovativeness of texture design. Specifically, for common perceptual need conflicts during the design process (such as requiring both “heavy” and “rough” or “light” and “heavy”), the framework provides an evaluation grade table for texture elements. Designers can select suitable texture elements within the appropriate range based on perceptual needs, while combining the extension transformation method for overlapping different texture elements. When designers need to balance conflicting perceptual needs (such as “light” versus “heavy”), they can achieve this through zonal material strategies and differentiated surface processing technologies. Specifically, by dividing a product into functional zones based on its morphological characteristics and adjusting material selection, surface processing technology, and visual proportions in each area, designers can ultimately achieve a harmonious unity of contrasting textures throughout the design. Finally, grey relational analysis is used to achieve optimal solution selection. Additionally, the modular reasoning criteria design supports adapting to changing user needs through regular user surveys and preference data re-clustering, ensuring the continued effectiveness of the method while maintaining the stability of the core framework. This framework offers practical tools for addressing perceptual need conflicts and preference evolution under the current user-centred design context. The proposed framework can also be extended to a wider range of multi-criteria decision-making problems. For example, in supply chain supplier selection, criteria such as cost, quality, and delivery time can be quantified and grey relational analysis can be used to rank schemes. In green material evaluation, this helps balance environmental impact, performance, and cost. In summary, the method proposed in this study provides a direction for solving complex decision-making problems in manufacturing and other fields. It is worth noting that, while other well-established multi-criteria decision-making methods such as AHP and PROMETHEE can also be applied within the proposed framework, grey relational analysis offers advantages in handling small samples and uncertain information with lower subjectivity. Unlike PROMETHEE, which requires preference function selection, the method presented in this paper provides a more straightforward ranking process.
In recent years, research on colour, material, and surface processing technology has addressed perceptual design. Associating product colour with emotion; exploring users’ perceptual needs arising from multiple colours; revealing users’ perceptual expressions from a multi-dimensional perspective [58,59]; and perceptual studies of material properties [60,61,62], such as the echoing relationship between the roughness of a product’s metal and its appearance and lustre [63], as well as combining craftsmanship and product materials to solve the uncertainty of a product’s style [64]. The difference of this paper is in its attempt to combine the colour, material and surface processing technology to realize the texture research. Firstly, we carry out research on each of the three features and then carry out somatosensory evaluation experiments as a whole, before finally realizing the holistic texture performance design so as to explore the different texture performances of the texture program somatosensory evaluation of the impact degree. More importantly, this holistic approach is formalized within a multi-criteria decision-making framework that explicitly considers the synergistic effects among colour, material, and surface processing technology elements to achieve sustainable value. It provides a systematic method for optimizing resource allocation in design, thereby reducing resource waste. The schemes influence the somatosensory evaluation of the degree of texture design, reflecting the value of texture design in the design of child companion robots.
Furthermore, the application of Extensics in product innovation design has gradually expanded, such as in the shape design of trams [34], the appearance design of subway trains [35] and children’s balance bikes [65], cultural and creative product design [66], and office chair design [67]. These applications offer new approaches to resolving various design conflicts. However, existing research mostly focuses on optimizing single functions or solving technical contradictions, failing to systematically integrate the complex relationship between user perception and engineering parameters. This study innovatively combines Extenics with Kansei engineering by establishing reasoning criteria from user semantics to material properties and using grey relational analysis for multi-attribute coordinated optimization, significantly enhancing the perceptual accuracy and engineering feasibility of design solutions. Specifically, the study constructs a chromatic colour sample library through K-means clustering, establishes material process selection criteria based on questionnaire data, and uses multi-criteria decision-making methods for scheme evaluation, forming a complete system for texture design. Compared with previous studies, this method demonstrates significant advantages in reducing design subjectivity and improving user demand matching, providing new methodological guidance for the sensuous design of intelligent products. The framework can be flexibly applied to different product domains. The chromatic colour sample library, material and surface processing technology criteria, and evaluation method can all be independently adjusted or replaced. For example, in medical device design, the somatosensory evaluation vocabulary could be replaced with safety and comfort-related vocabulary, and the material library could be updated to include medical grade materials, while the core decision-making logic remains unchanged. This modular design ensures the framework’s applicability across diverse multi-criteria decision-making scenarios.
This study proposes a texture design scheme for child companion robots that effectively addresses key manufacturing constraints while significantly enhancing the product’s perceptual experience. The selected materials (alloy, ABS plastic, PC polycarbonate, silicone, and TPU) are all sourced from industrialized mass-production supply chains. Market research confirms the widespread application of these materials, demonstrating their market stability and procurement convenience, while also complying with international safety standards for children’s products (ISO 8124-3:2020, EN 71-3:2019) [68,69]. The chosen surface processing technology (wire drawing, polishing, sand blasting, matte, and spray coating) not only ensure product durability but also achieve significant optimization of tactile experience [70]. The conscious selection of industrially prevalent materials and processes ensures that the proposed design solutions are not only perceptually superior but also readily integrable into existing sustainable manufacturing systems, avoiding the resource intensity often required for bespoke or novel material adoption. To further facilitate industrial adoption and make the method accessible to broader users, future work could digitize this multi-criteria decision-making process into a computer-aided design tool. By integrating the chromatic colour sample library, material and surface processing technology tables, and grey relational analysis into a unified platform, designers could input user keywords and automatically receive optimal scheme recommendations with cost and feasibility reports. Such digitalization would lower the technical barrier for applying this innovative method, enabling seamless support from user research to engineering implementation and allowing designers with varying expertise to efficiently leverage the framework in practice.
To thoroughly investigate the cost-effectiveness of the obtained texture design schemes, this study conducted a cost analysis of these texture schemes. First, the current market standard thickness of 2.5 mm for child companion robot shells was determined. Subsequently, detailed material price data were obtained through market research: ABS plastic (about ¥0.003675/cm2), PC polycarbonate (about ¥0.0066/cm2), and alloy (about ¥0.0071875/cm2), along with processing costs for surface processing technologies including ABS plastic polishing (about ¥0.06–0.10/cm2), alloy wire drawing (about ¥0.09–0.16/cm2), alloy polishing (about ¥0.07–0.11/cm2), ABS plastic sand blasting (about ¥0.05–0.09/cm2), PC polycarbonate sand blasting (about ¥0.06–0.11/cm2), and spray coating (about ¥0.18–0.30/cm2). Within the maximum head dimensions of the model scheme (26.15 cm × 18.52 cm × 21.15 cm) and the maximum body dimensions (19.40 cm × 15.31 cm × 12.66 cm), using Rhino software version 7.0 for precise area analysis of the scheme models, the cost ranges for six design schemes were derived: Scheme 1 (about ¥135.62–220.81), Scheme 2 (about ¥157.17–261.29), Scheme 3 (about ¥144.54–229.74), Scheme 4 (about ¥129.31–214.50), Scheme 5 (about ¥217.58–368.26), and Scheme 6 (about ¥161.55–280.66). The texture design schemes developed in this study can effectively enhance children’s perception experience, making them particularly suitable for mid-to-high-end product categories. According to the 2023 White Paper on the Development of China’s Educational Robotics Industry, the casing costs for mid-to-high-end child companion robots range from ¥200–400 per unit. When compared with the cost ranges of the proposed schemes, these texture design schemes demonstrate remarkable cost-effectiveness advantages. This study can help designers reduce the number of design iterations to achieve sustainable design goals. Although the framework implies resource waste reduction through minimized design iterations, material savings were not quantitatively calculated, as iteration counts vary considerably depending on factors such as designer experience and project complexity. However, the cost analysis presented above demonstrates the economic sustainability of the framework. By providing a data-driven method to achieve premium perceptual quality within standardized cost brackets, the framework facilitates resource-efficient production and enhances the commercial viability of sustainable product lines. The framework not only avoids material waste by reducing the number of iterations but also enhances user satisfaction and emotional attachment to extend product lifespan, thereby promoting sustainable development.
In-depth analysis demonstrates that, through scientific material selection and a combination of surface processing technology, significant cost optimization can be achieved while ensuring product quality. In mass production, these texture schemes not only effectively reduce material waste in the pre-production phase but also demonstrate notable cost advantages compared with traditional design methods [71]. Thus, the proposed multi-criteria decision-making approach directly contributes to the environmental and economic pillars of sustainable manufacturing by promoting right-first-time design and optimal resource utilization. Future research will integrate cost-benefit modelling methods to further achieve dynamic optimization of design solutions [72].
6. Conclusions
This study innovatively integrates Extenics theory with Kansei engineering to propose a systematic method to produce texture design. Based on this methodology, the research constructs a comprehensive extensible model of product texture and establishes reasoning criteria for colour elements, material elements, and surface processing technology within the Extenics framework. This design process not only effectively addresses the limitations of traditional methods in acquiring user perceptual data but also significantly enhances the adaptability and diversity of smart product texture design. By incorporating grey relational analysis, one-way ANOVA, and a children’s perception experiment, we find that the perceptual dimensions presented by the generated design solutions, based on the texture element reasoning criteria, are consistent with user preferences, achieving precise quantification of the relationship between user perception and design elements and providing a new technical pathway for accurately capturing users’ emotional needs and translating them into product texture characteristics. Through this design method, designers can not only accurately capture users’ perceptions of product texture and improve design efficiency, but also bridge the gap between user expectations and engineering solutions. This directly reduces the resource waste and iterative prototyping associated with the traditional trial-and-error paradigm, thereby advancing the goal of resource-efficient production. By ensuring that product texture and functionality resonate with users, the framework enhances user satisfaction and emotional attachment. This not only achieves sustainability from the perspective of user emotions by delaying the need for replacement, but also reduces the subjectivity of designers.
Against the backdrop of the widespread adoption of smart products, current research in this field primarily focuses on the development of functional attributes. However, the visual quality of smart products significantly influences users’ perceptual preferences. This indicates that texture design aligned with user preferences can not only enhance purchase intention but also extend product lifespan. Therefore, achieving consistency between designer intention and user perception becomes a key pathway to improving product competitiveness and user satisfaction.
However, this study still has certain limitations. First, emerging eco-friendly materials and innovative processes were not fully considered. Second, the proposed framework was validated only on child companion robots, and its applicability to other smart product categories requires further validation. In addition, this study did not conduct a systematic comparison with other multi-criteria decision-making methods. Finally, the somatosensory evaluation in this study was primarily based on visual representations rather than actual tactile contact, which may not fully capture the multisensory experience of physical touch. It should also be noted that this study does not provide quantitative evidence of environmental benefits through life-cycle assessment (LCA) or direct measurement of material/energy savings. However, the primary aim of this research is to explore users’ perceptual needs for product texture, helping designers avoid resource waste caused by design solutions that fail to meet user expectations. To some extent, this contributes to material savings and reduced design iterations.
Future work will incorporate a screening or full life-cycle assessment (LCA) and record prototyping iterations and material consumption to quantitatively validate the environmental impact. In addition, further research could integrate actual tactile experience studies and sustainable material system analysis to enhance users’ texture experience through material technology innovation under cost control.
Author Contributions
Writing—review and editing, writing—original draft, conceptualization, methodology, data curation, funding acquisition, project administration, resources, supervision, Z.D.; writing—review and editing, writing—original draft, conceptualization, data curation, formal analysis, methodology, software, validation, visualization, Y.R.; writing—review and editing, writing—original draft, conceptualization, data curation, formal analysis, investigation, methodology, software, W.X.; writing—review and editing, conceptualization, funding acquisition, project administration, resources, supervision, W.G. All authors have read and agreed to the published version of the manuscript.
Funding
This research was funded by the National Natural Science Foundation of China grant number 51875171; University–Industry Collaborative Education Program, grant number 220705329284309; the Fundamental Research Funds for the Central Universities, grant number BC220207017.
Institutional Review Board Statement
Ethical review and approval were waived for this study by Institution Committee as per Measures for the Ethical Review of Biomedical Research Involving Humans.
Informed Consent Statement
Informed consent was obtained from all subjects involved in the study.
Data Availability Statement
The datasets used during the current study are available from the corresponding author upon reasonable request.
Conflicts of Interest
The authors declare no conflicts of interest.
Appendix A
Table A1.
Multiple comparison table for schemes.
References
- Salminen, K.; Kostia, S.; Ijas, M.; Siivonen, J.; Kiviniemi, E.; Aho, M. Boosting resource efficiency and circular economy of the manufacturing companies in Finland. In Sustainable Manufacturing as a Driver for Growth; Lecture Notes in Mechanical Engineering; Springer: Berlin/Heidelberg, Germany, 2025; pp. 363–371. [Google Scholar] [CrossRef] [Scilit]
- Zuo, Y.X.; Wang, Z.Y. Subjective product evaluation system based on Kansei engineering and analytic hierarchy process. Symmetry 2020, 12, 1340. [Google Scholar] [CrossRef] [Scilit]
- Hsiao, S.W.; Ko, Y.C. A study on bicycle appearance preference by using FCE and FAHP. Int. J. Ind. Ergon. 2013, 43, 264–273. [Google Scholar] [CrossRef] [Scilit]
- Qu, Q.X.; Guo, F. Can eye movements be effectively measured to assess product design?: Gender differences should be con-sidered. Int. J. Ind. Ergon. 2019, 72, 281–289. [Google Scholar] [CrossRef] [Scilit]
- Kim, W.; Ko, T.-H.; Rhiu, I.; Yuan, M.H. Mining affective experience for a Kansei design study on a recliner. Appl. Ergon. 2019, 74, 145–153. [Google Scholar] [CrossRef] [Scilit] [PubMed]
- Fricke, A.; Pieper, N.; Woisetschlager, D.M. Smartness unleashed: A multi-level model for understanding consumers’ percep-tions and adoption across a myriad of smart offerings. J. Serv. Theory Pract. 2024, 34, 163–190. [Google Scholar] [CrossRef] [Scilit]
- Guo, F.; Qu, Q.-X.; Nagamachi, M.; Duffy, V.G. A proposal of the event related potential method to effectively identify Kansei words for assessing product design features in Kansei engineering research. Int. J. Ind. Ergon. 2020, 76, 102940. [Google Scholar] [CrossRef] [Scilit]
- Shen, H.J.; Zhang, F.W.; Su, Y.W.; Cheng, Y.; Zhu, D.G. Quantitative analysis of perceptual image of surface material of all-aluminum cabinet. Furnit. Inter. Des. 2022, 11, 72–77. [Google Scholar]
- Lu, S.H.; Zheng, M.L.; Fontaine, M.C.; Nikolaidis, S.; Culbertson, H. Preference-driven texture modeling through interactive generation and search. IEEE Trans. Haptics. 2020, 15, 508–520. [Google Scholar] [CrossRef] [Scilit] [PubMed]
- Hassan, W.; Abdulali, A.; Jeon, S. Authoring new haptic textures based on interpolation of real textures in affective space. IEEE Trans. Ind. Electron. 2019, 67, 667–676. [Google Scholar] [CrossRef] [Scilit]
- Theivendran, K.; Wu, A.; Frier, W.; Schneider, O. RecHap: An interactive recommender system for navigating a large number of mid-air haptic designs. IEEE Trans. Haptics. 2023, 17, 165–176. [Google Scholar] [CrossRef] [Scilit]
- Zeng, D.; Zhou, Z.; Cheng, H.F.; Li, K.G.; Qiu, S.P. Tactile experience in product design. Packag. Eng. 2020, 2, 134–141. [Google Scholar]
- Sousa, E.; Sampaio, R.; Sotgiu, E.; Riberio, G.; Silva, C.; Vieira, J. Tactile and visual perception of plastic textures for car in-teriors: Psychophysical and affective dimensions. Int. J. Ind. Ergon. 2022, 92, 103369. [Google Scholar] [CrossRef] [Scilit]
- Choi, K.; Jun, C.A. A systematic approach to the Kansei factors of tactile sense regarding the surface roughness. Appl. Ergon. 2007, 38, 53–63. [Google Scholar] [CrossRef] [Scilit]
- Ranaweera, A.T.; Martin, B.A.S.; Jin, H.S. What you touch, touches you: The influence of haptic attributes on consumer product impressions. Psychol. Mark. 2020, 38, 183–195. [Google Scholar] [CrossRef] [Scilit]
- Schifferstein, H.N.J. The perceived importance of sensory modalities in product usage: A study of self-reports. Acta Psychol. 2006, 121, 41–64. [Google Scholar] [CrossRef] [Scilit]
- Sonneveld, M.H.; Schifferstein, H.N.J. The tactual experience of objects. Prod. Exp. 2008, 1, 41–67. [Google Scholar] [CrossRef] [Scilit]
- Maldini, I.; Klepp, I.G.; Laitala, K. The environmental impact of product lifetime extension: A literature review and research agenda. Sustain. Prod. Consum. 2025, 56, 561–578. [Google Scholar] [CrossRef] [Scilit]
- Jindo, T.; Hirasago, K.; Nagamachi, M. Development of a design support system for office chairs using 3-D graphics. Int. J. Ind. Ergon. 1995, 15, 49–62. [Google Scholar] [CrossRef] [Scilit]
- Matsubara, Y.; Nagamachi, M. Hybrid Kansei engineering system and design support. Int. J. Ind. Ergon. 1997, 19, 81–92. [Google Scholar] [CrossRef] [Scilit]
- Rosen, B.G.; Eriksson, L.; Bergman, M. Kansei, surfaces and perception engineering. Surf. Topogr. Metrol. Prop. 2016, 4, 033001. [Google Scholar] [CrossRef] [Scilit]
- Li, Z.; Tian, Z.G.; Wang, J.W.; Wang, W.M. Dynamic mapping of design elements and affective responses: A machine learning based method for affective design. J. Eng. Des. 2018, 29, 358–380. [Google Scholar] [CrossRef] [Scilit]
- Yang, C.C. A classification-based Kansei engineering system for modeling consumers’ affective responses and analyzing product form features. Expert Syst. Appl. 2011, 38, 11382–11393. [Google Scholar] [CrossRef] [Scilit]
- Yang, C.X.; Liu, F.; Ye, J.N. A product form design method integrating Kansei engineering and diffusion model. Adv. Eng. Inf. 2023, 57, 102058. [Google Scholar] [CrossRef] [Scilit]
- Kang, X.H. Biologically inspired product design combining Kansei engineering and association creative thinking method. Adv. Eng. Inf. 2024, 62, 102615. [Google Scholar] [CrossRef] [Scilit]
- Tang, W.Y.; Xiang, Z.R.; Ding, T.C.; Zhao, X.; Zhang, Q.; Zou, R. Research on multi-objective optimisation of product form design based on Kansei engineering. J. Eng. Des. 2024, 35, 1023–1048. [Google Scholar] [CrossRef] [Scilit]
- Chu, J.J.; Zhang, M.X.; Wang, L.; Wang, J.Y.; Ju, Y.F. Research on color and material design of aircraft cabin seat based on Kansei image. J. Mach. Des. 2020, 2, 126–130. [Google Scholar]
- Effendi, M.; Anggraeni, D.; Astui, R. Peppermint hard candy packaging design with kansei engineering. In IOP Conference Series: Earth and Environmental Science; IOP Publishing: Philadelphia, PA, USA, 2020; Volume 475, p. 012061. [Google Scholar] [CrossRef] [Scilit]
- Chen, Q.L.; Li, C.L.; Lu, L.; Ke, Y.; Kang, K.; Mao, S.Y.; Liao, Z.Z.Y. Optimization of fresh produce supply chain resilience capacity: An extension strategy generation method. Symmetry 2025, 17, 272. [Google Scholar] [CrossRef] [Scilit]
- Li, J.F.; Wu, X.H.; Zhang, X.M.; Song, Z.H.; Li, W.J. Design of distributed hybrid electric tractor based on axiomatic design and Extenics. Adv. Eng. Inf. 2022, 54, 101765. [Google Scholar] [CrossRef] [Scilit]
- Ren, S.D.; Gui, F.Z.; Zhao, Y.W.; Zhan, M.; Wang, W.L.; Zhou, J.Q. An extensics-based scheduled configuration methodology for low-carbon product design in consideration of contradictory problem solving. Sustainability 2021, 13, 5859. [Google Scholar] [CrossRef] [Scilit]
- Chen, H.; Zhang, J.H.; Hu, X.T. Enhancing biological system engineering realization through advanced feature transfer and Extenics: A bionic design approach. J. Eng. Des. 2024, 36, 375–404. [Google Scholar] [CrossRef] [Scilit]
- Zhang, C.; Wei, X.; Zou, F.Z. Extension reasoning method for perceptual design of automobile interior material quality. J. Mach. Des. 2020, 9, 120–127. [Google Scholar]
- Chen, X.; Wu, J.B. Tramcar modeling design based on extension semantic analysis. J. Mach. Des. 2018, 3, 119–123. [Google Scholar]
- Li, W.L.; Xiang, Z.R.; Li, R.; Gou, R.; Deng, M.X. Study on the approach to exterior design for metro trains based on extension semantics and fuzzy comprehensive evaluation. J. Graph. 2020, 5, 814–823. [Google Scholar]
- Li, W.J.; Suh, C.S.; Xu, X.Y.; Song, Z.H. Extenics enhanced axiomatic design procedure for AI applications. Artif. Intell. Eng. Des. Anal. Manuf. 2023, 36, e23. [Google Scholar] [CrossRef] [Scilit]
- Zheng, G.Z.; Jing, Y.Y.; Huang, H.X.; Zhang, X.T.; Gao, Y.F. Application of life cycle assessment (LCA) and Extenics theory for building energy conservation assessment. Energy 2009, 34, 1870–1879. [Google Scholar] [CrossRef] [Scilit]
- Qian, Z.H.; Hong, Y.; Xu, C.Y.; Ren, L.Q. A biological coupling extension model and coupling element identification. J. Bionic Eng. 2009, 6, 186–195. [Google Scholar] [CrossRef] [Scilit]
- Chen, X.; Yang, R. Intelligent speaker modeling design based on extension semantic analysis. Packag. Eng. 2020, 14, 168–173. [Google Scholar]
- Cai, W.; Yang, C.Y. Study on extension engineering. Eng. Sci. 2000, 2, 90–96. [Google Scholar]
- Han, J.; Kamber, M.; Pei, J. Data Mining: Concepts and Techniques, 2nd ed.; Morgan Kaufmann: San Francisco, CA, USA, 2006. [Google Scholar]
- López-Rubio, E.; Palomo, E.J.; Ortega-Zamorano, F. Unsupervised learning by cluster quality optimization. Inf. Sci. 2018, 436, 31–55. [Google Scholar] [CrossRef] [Scilit]
- Sun, Z.X. Multiple image selection of product color schemes based on grey relational analysis. J. Mach. Des. 2015, 1, 120–122. [Google Scholar]
- Stahle, L.; Wold, S. Analysis of variance (ANOVA). Chemom. Intell. Lab. Syst. 1989, 6, 259–272. [Google Scholar] [CrossRef] [Scilit]
- Wasserstein, R.L.; Lazar, N.A. The ASA statement on p-values: Context, process, and purpose. Am. Stat. 2016, 70, 129–133. [Google Scholar] [CrossRef] [Scilit]
- Zhang, T.; Tang, W. Research on interaction design of children’s compani-on robot based on cognitive psychology theory. In Intelligent Human Systems Integration; Springer: Berlin/Heidelberg, Germany, 2020; pp. 1250–1255. [Google Scholar] [CrossRef] [Scilit]
- Belpaeme, T.; Baxter, P.; Greeff, J.D.; Kennedy, J.; Read, R.; Looije, R.; Neerincs, M.; Baroni, I.; Coti, M. Child-robot interaction: Perspectives and challenges. In Social Robotics; Springer: Berlin/Heidelberg, Germany, 2013; pp. 452–459. [Google Scholar] [CrossRef] [Scilit]
- Pearson, Y.; Borenstein, J. Creating ‘companions’ for children: The ethics of designing esthetic features for robots. AI Soc. 2014, 29, 23–31. [Google Scholar] [CrossRef] [Scilit]
- Michaelis, J.E.; Bilge, M. Reading socially: Transforming the in-home reading experience with a learning-companion robot. Sci. Robot. 2018, 3, eaat5999. [Google Scholar] [CrossRef] [Scilit]
- Ali, M.; Shariati, A.; Alemi, M.; Nobaveh, A.A.; Khamooshi, M.; Mozaffari, B. Design performance characteristics of a social robot companion ‘arash’ for pediatric hospitals. Int. J. Hum. Robot. 2018, 15, 1850019. [Google Scholar] [CrossRef] [Scilit]
- Zinina, A.; Kotov, A.; Arinkin, N.; Zaidelman, L. Learning a foreign language vocabulary with a companion robot. Cogn. Syst. Res. 2023, 77, 110–114. [Google Scholar] [CrossRef] [Scilit]
- Pinney, J.; Carroll, F.; Newbury, P. Human-robot interaction: The impact of robotic aesthetics on anticipated human trust. PeerJ Comput. Sci. 2022, 8, e837. [Google Scholar] [CrossRef] [Scilit] [PubMed]
- Zhang, C. Research on Product Perceptual Design of Material Quality Based on Extenics Method. Ph.D. Thesis, Guangdong University of Technology, Guangzhou, China, 2018. [Google Scholar]
- Zhou, C.Y.; Lv, Y.X.; Zhan, X.X.; Jia, H.L.; Kang, M.H. Research on color sensitive image of wooden door user based on HSB. For. Prod. Ind. 2020, 12, 40–44. [Google Scholar]
- Raeva, E.; Mihova, V.; Nikolaev, L. Using SPSS for solving engineering problems. In Proceedings of the 2019 29th Annual Conference of the European Association for Education in Electrical and Information Engineering (EAEEIE), Ruse, Bulgaria, 4–6 September 2019; IEEE: New York, NY, USA, 2019; pp. 27–29. [Google Scholar] [CrossRef] [Scilit]
- Luo, B.J. Analysis of color design for children product. Packag. Eng. 2008, 1, 177–178+186. [Google Scholar]
- Li, L.T. Beauty of ‘purity’—Talk about application of principles on simple matching of colors in design. Art Des. 2005, 12, 95–96. [Google Scholar]
- Wang, S.; Yao, M.; Liu, J.Y.; Jiang, Y.J.; Wei, J. Human perceptual responses to multiple colors II: A study of the correlation between multiple colors and emotion. Color Res. Appl. 2022, 47, 1242–1258. [Google Scholar] [CrossRef] [Scilit]
- Ding, M.; Zhao, L.Y.; Pei, H.N.; Song, M.J. An XG Boost based evaluation methodology of product color emotion design. J. Adv. Mech. Des. Syst. Manuf. 2021, 15, JAMDSM0075. [Google Scholar] [CrossRef] [Scilit]
- Ettwein, F.; Rohrer-Vanzo, V.; Langthaler, G.; Werner, A.; Stern, T.; Moser, O.; Leitner, R.; Regenfelder, K. Consumer’s per-ception of high gloss furniture: Instrumental gloss measurement versus visual gloss evaluation. Eur. J. Wood Prod. 2017, 75, 1009–1016. [Google Scholar] [CrossRef] [Scilit]
- Gigilashvili, D.; Shi, W.Q.; Wang, Z.Y.; Pedersen, M.; Hardeberg, J.Y.; Holly, R. The role of subsurface scattering in glossiness perception. ACM Trans. Appl. Percept. 2021, 18, 1–26. [Google Scholar] [CrossRef] [Scilit]
- Wang, C.; Lu, W.; Ohno, R.; Gu, Z.C. Effect of wall texture on perceptual spaciousness of indoor space. Int. J. Environ. Res. Public Health 2020, 17, 4117. [Google Scholar] [CrossRef] [Scilit] [PubMed]
- Fleming, R.W.; Nishida, S.Y.; Gegenfurtner, K.R. Perception of material properties. Vision Res. 2015, 115, 157–162. [Google Scholar] [CrossRef] [Scilit]
- Zhou, H.H.; Chen, L.; Hu, W.F. On selection of texture image and surface craft under target form image. China Mech. Eng. 2012, 22, 2671–2675. [Google Scholar]
- Wu, S.L. Research on toy design for special children based on sensory integration training, D-S theory, and Extenics: Taking physical toys for ADHD children as an example. Sci. Program. 2022, 2022, 1395265. [Google Scholar] [CrossRef] [Scilit]
- Wu, F.; Lin, F. A study on the innovative design of the Blue Jiaxie pattern integrating extension semantics and fuzzy com-prehensive evaluation. Results Eng. 2025, 27, 105989. [Google Scholar] [CrossRef] [Scilit]
- Zeng, P.P. Research on the application of TRIZ and extension theory in office chair design. Furnit. Inter. Des. 2022, 29, 36–40. [Google Scholar]
- ISO 8124-3:2020; Safety of Toys—Part 3: Migration of Certain Elements. ISO: Geneva, Switzerland, 2020.
- EN 71-3:2019; Safety of Toys—Part 3: Migration of Certain Elements. CEN: Brussels, Belgium, 2019.
- Lu, P.L.; Lewis, S.R.; Fretwell-Smith, S.; Engelberg, D.L.; Fletcher, D.I.; Lewis, R. Laser cladding of rail; the effects of depositing material on lower rail grades. Wear 2019, 438–439, 203045. [Google Scholar] [CrossRef] [Scilit]
- Boothroyd, G. Product design for manufacture and assembly. Comput.-Aided Des. 1994, 26, 505–520. [Google Scholar] [CrossRef] [Scilit]
- Saaty, T.L. Decision making with the Analytic Hierarchy Process. Int. J. Serv. Sci. 2008, 1, 83–98. [Google Scholar] [CrossRef] [Scilit]
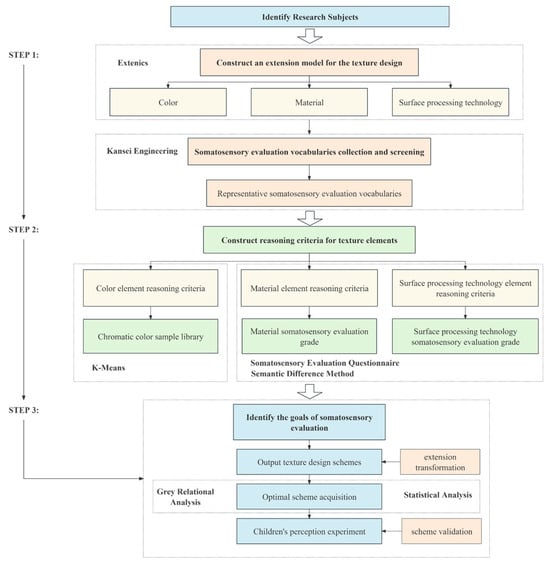
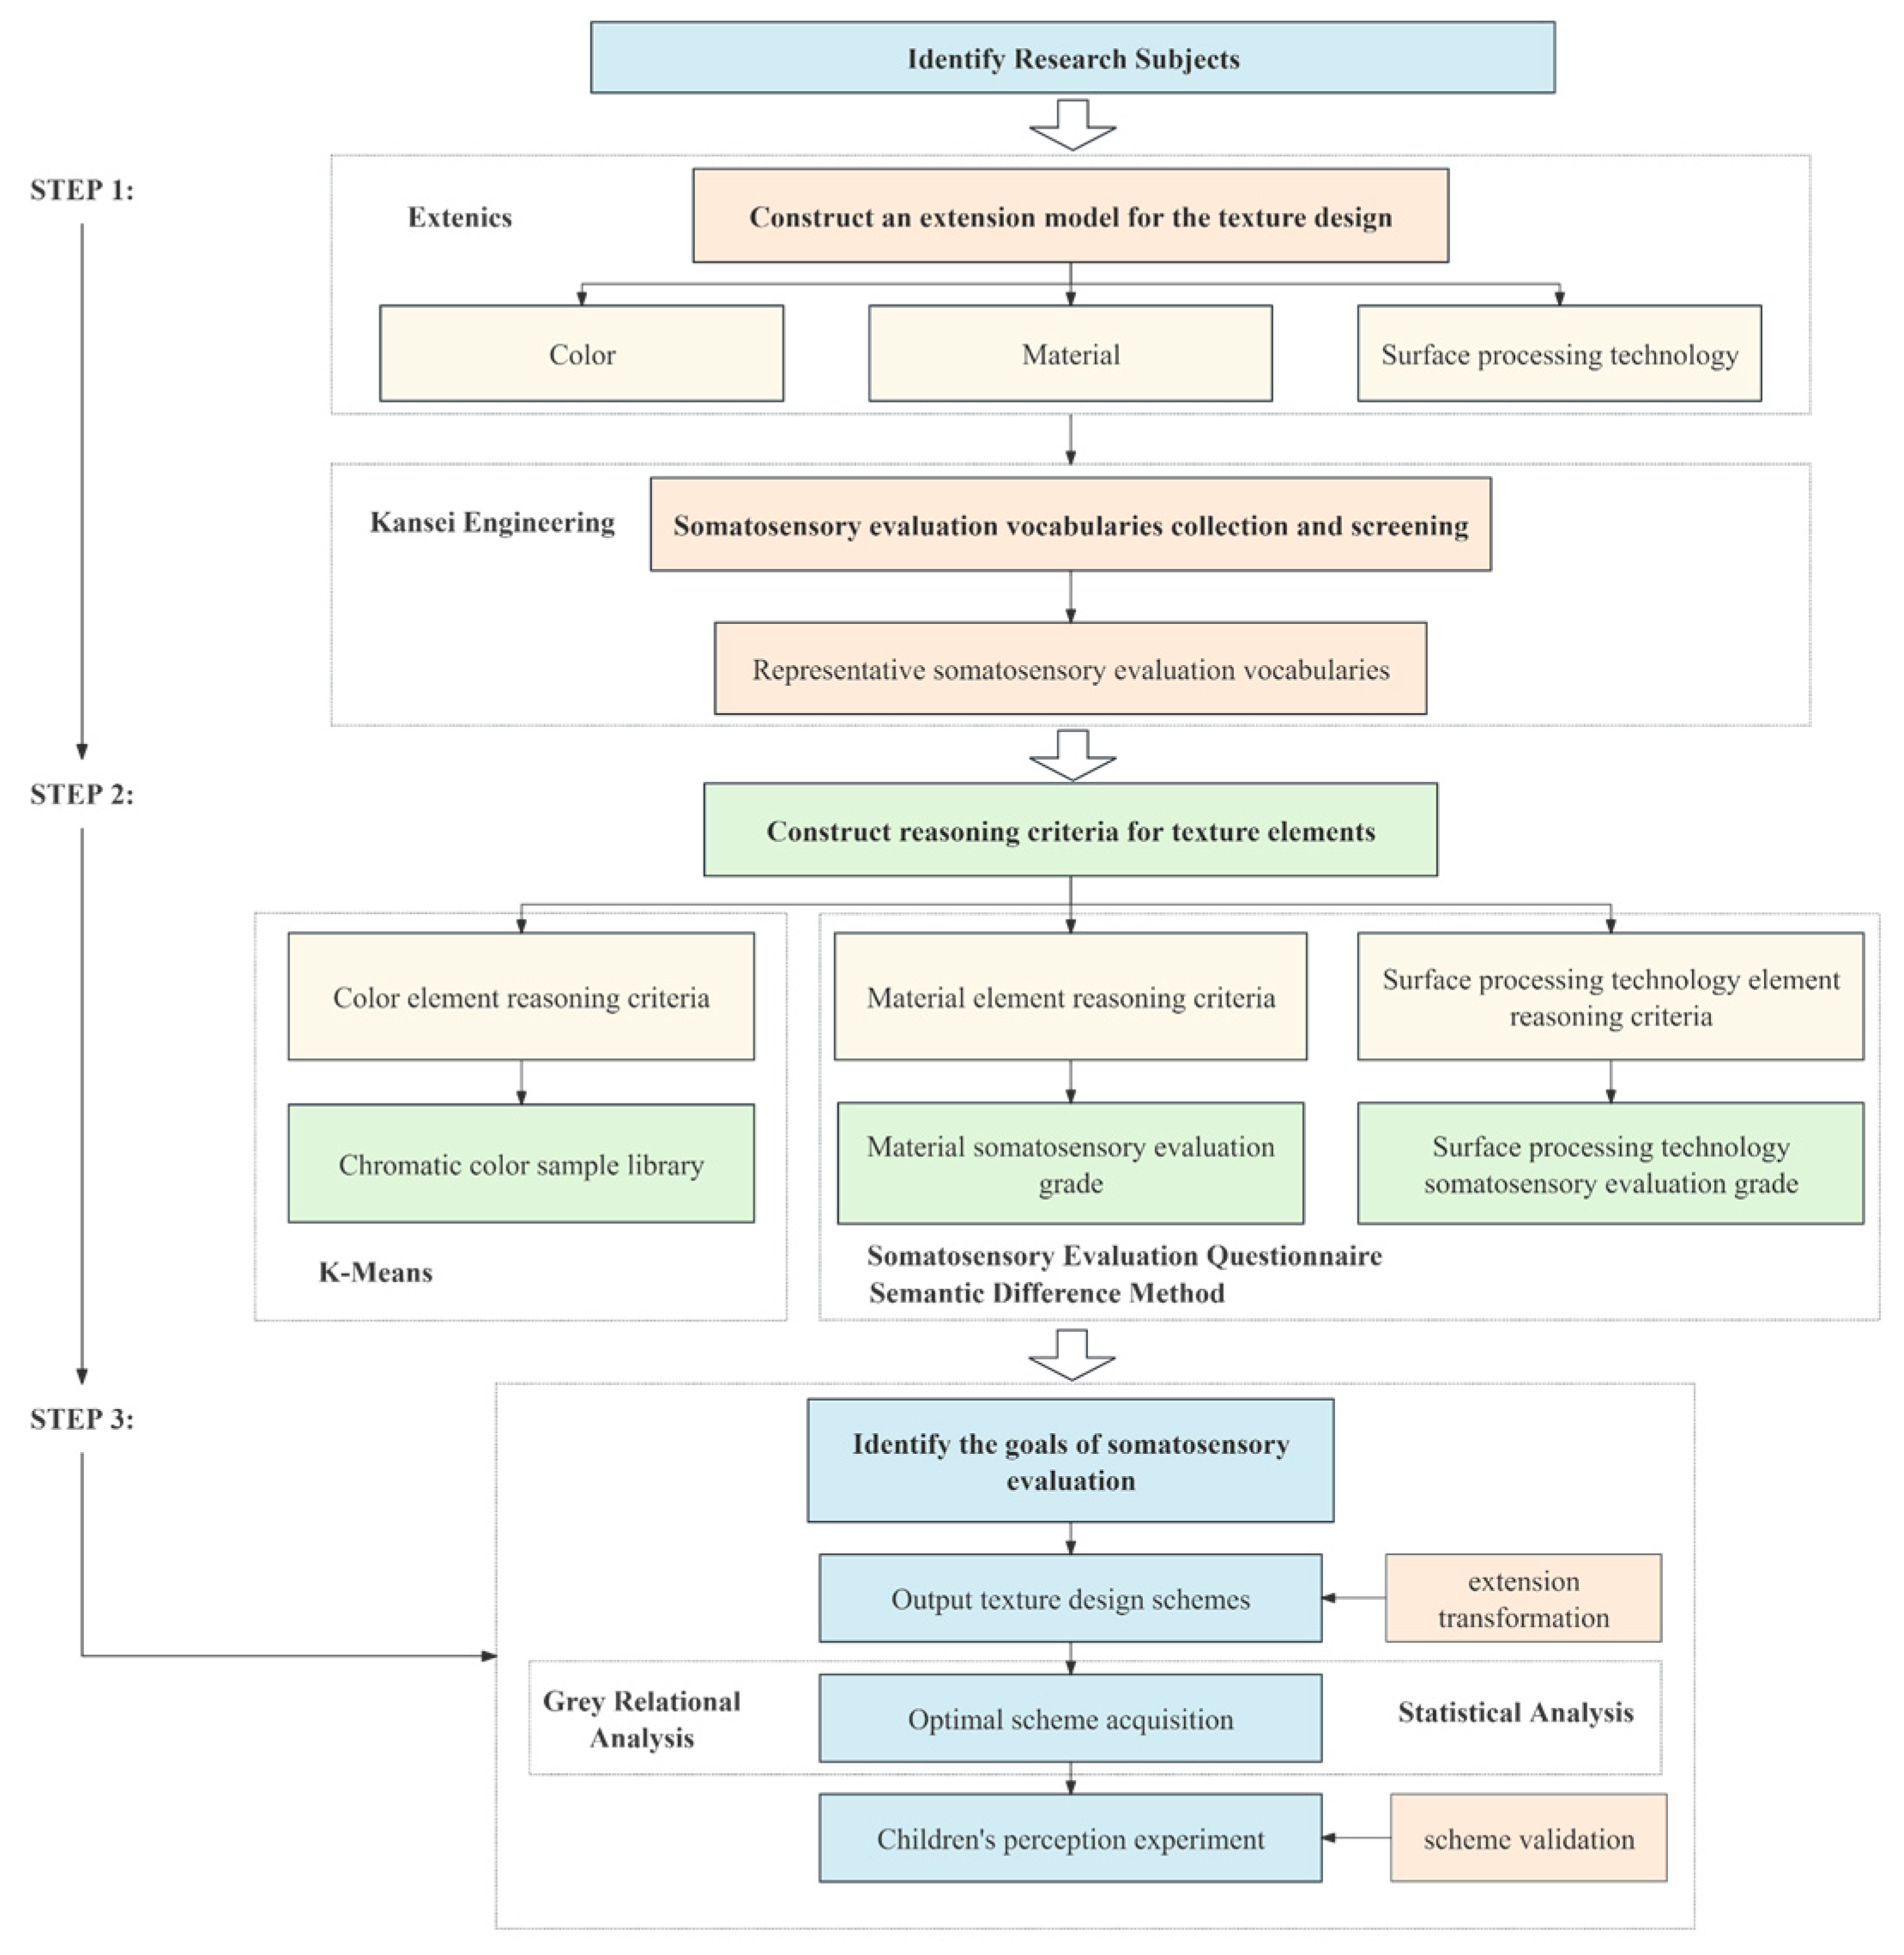
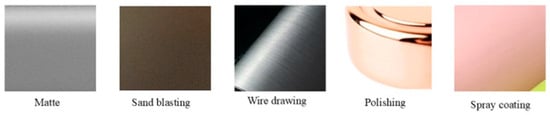
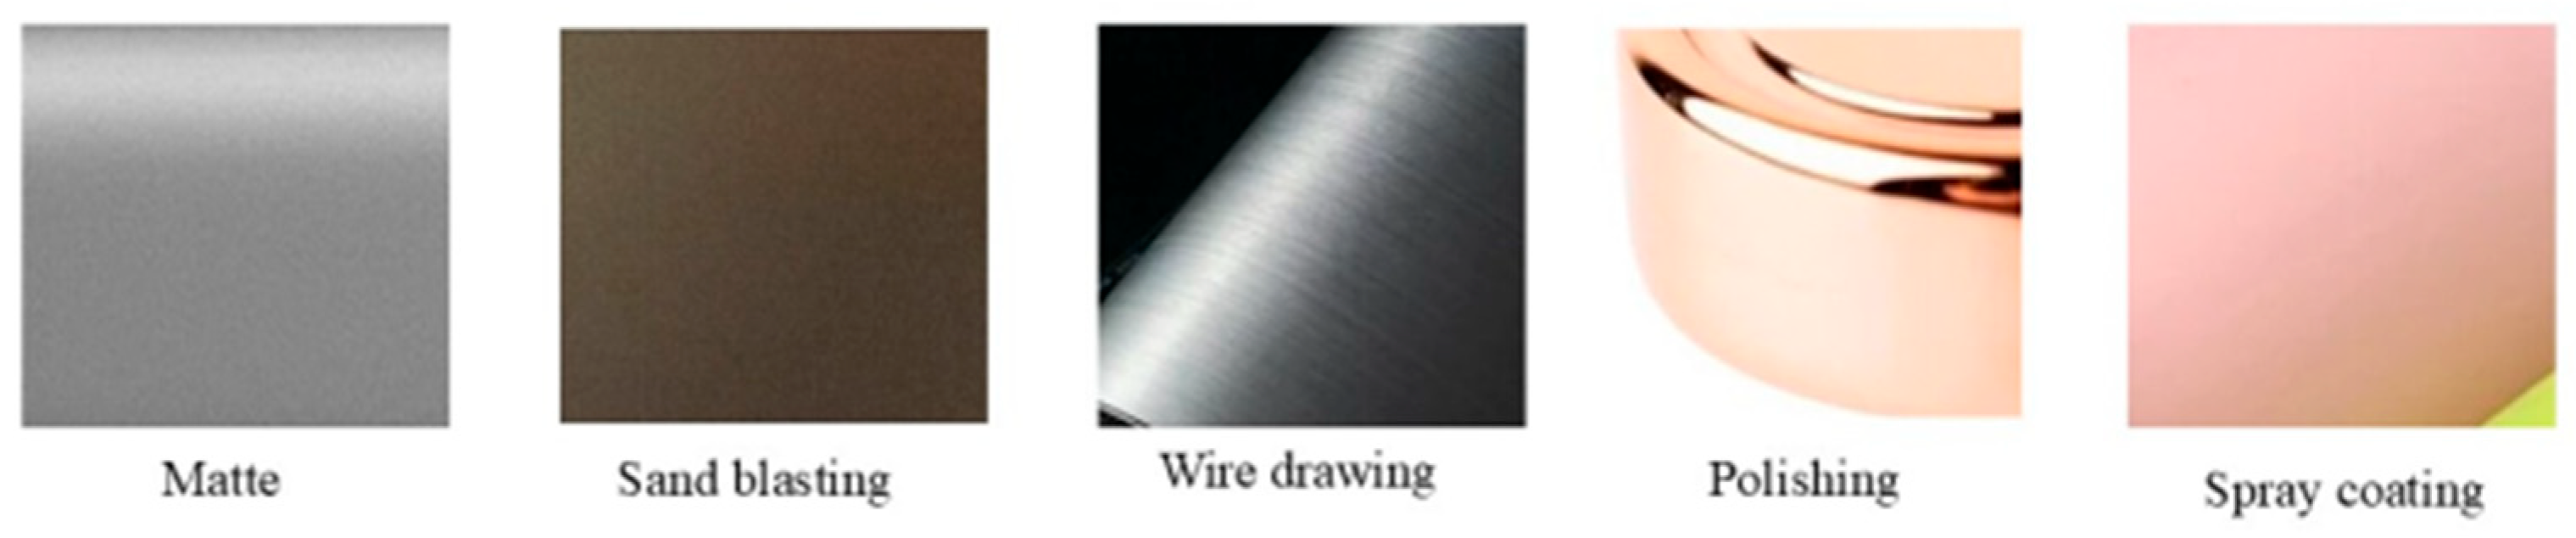
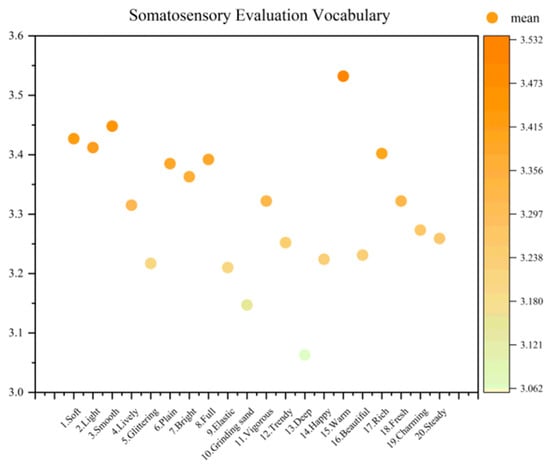
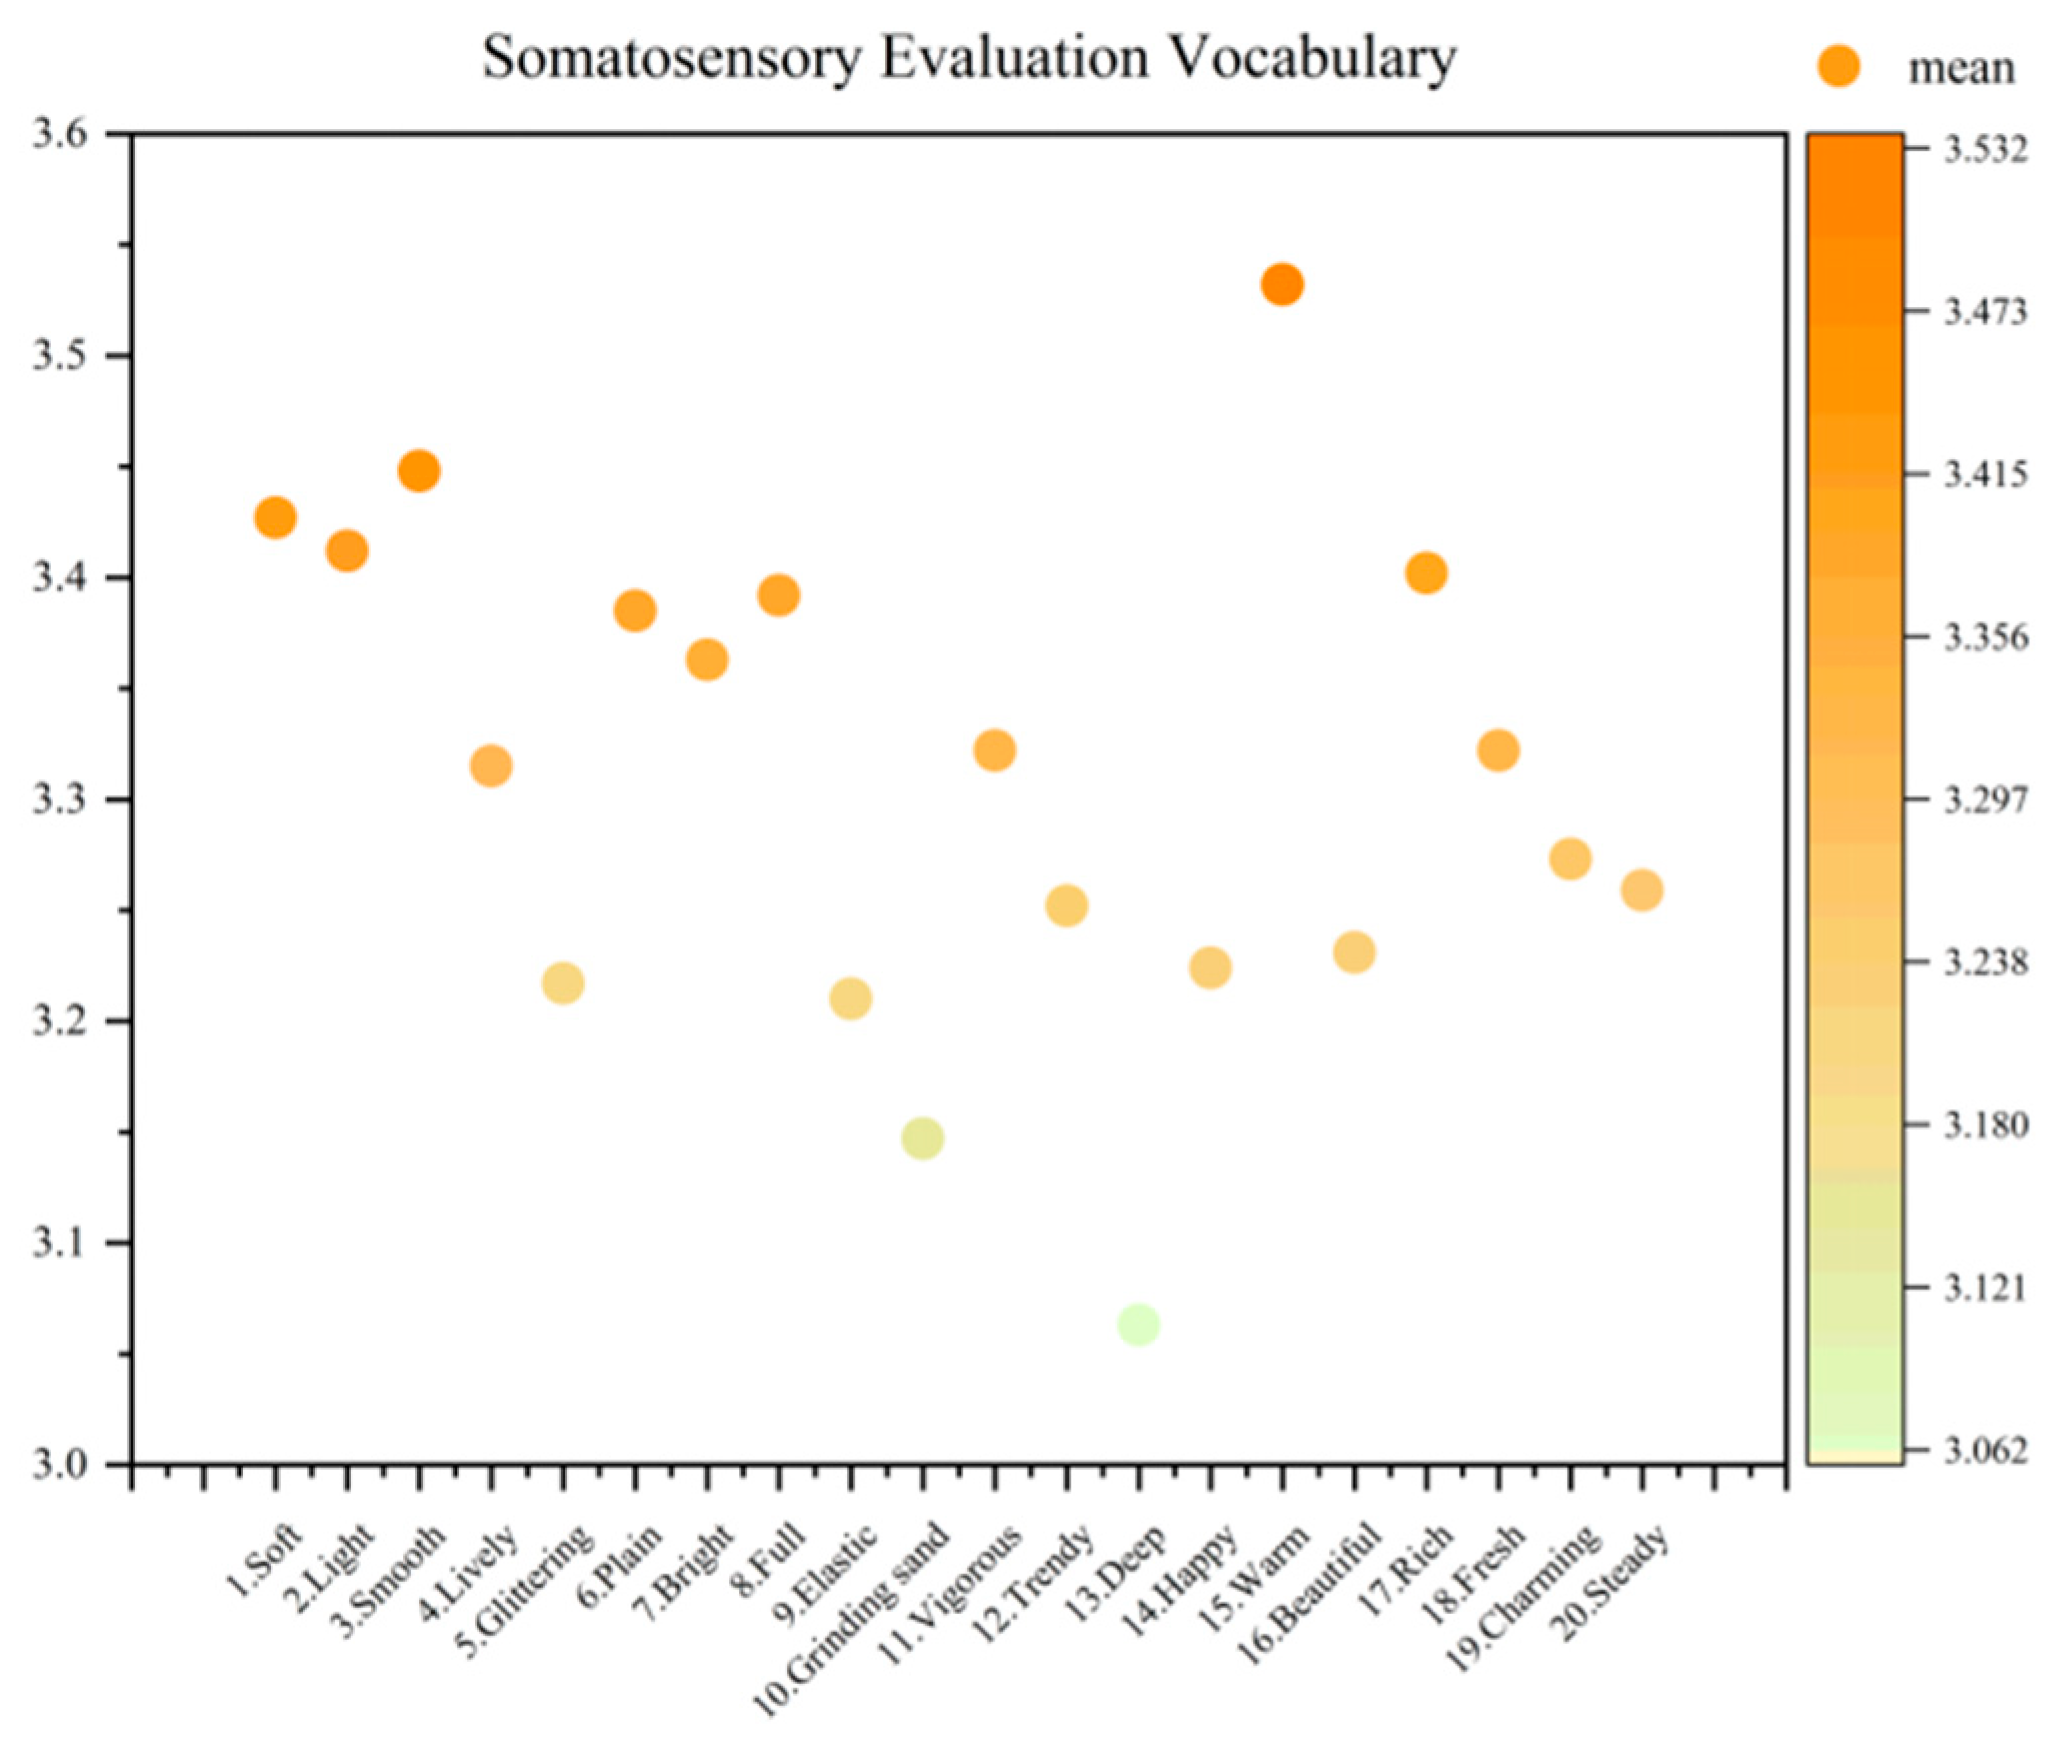
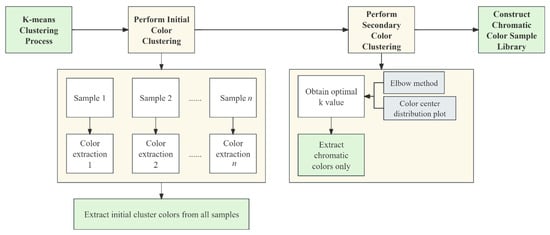
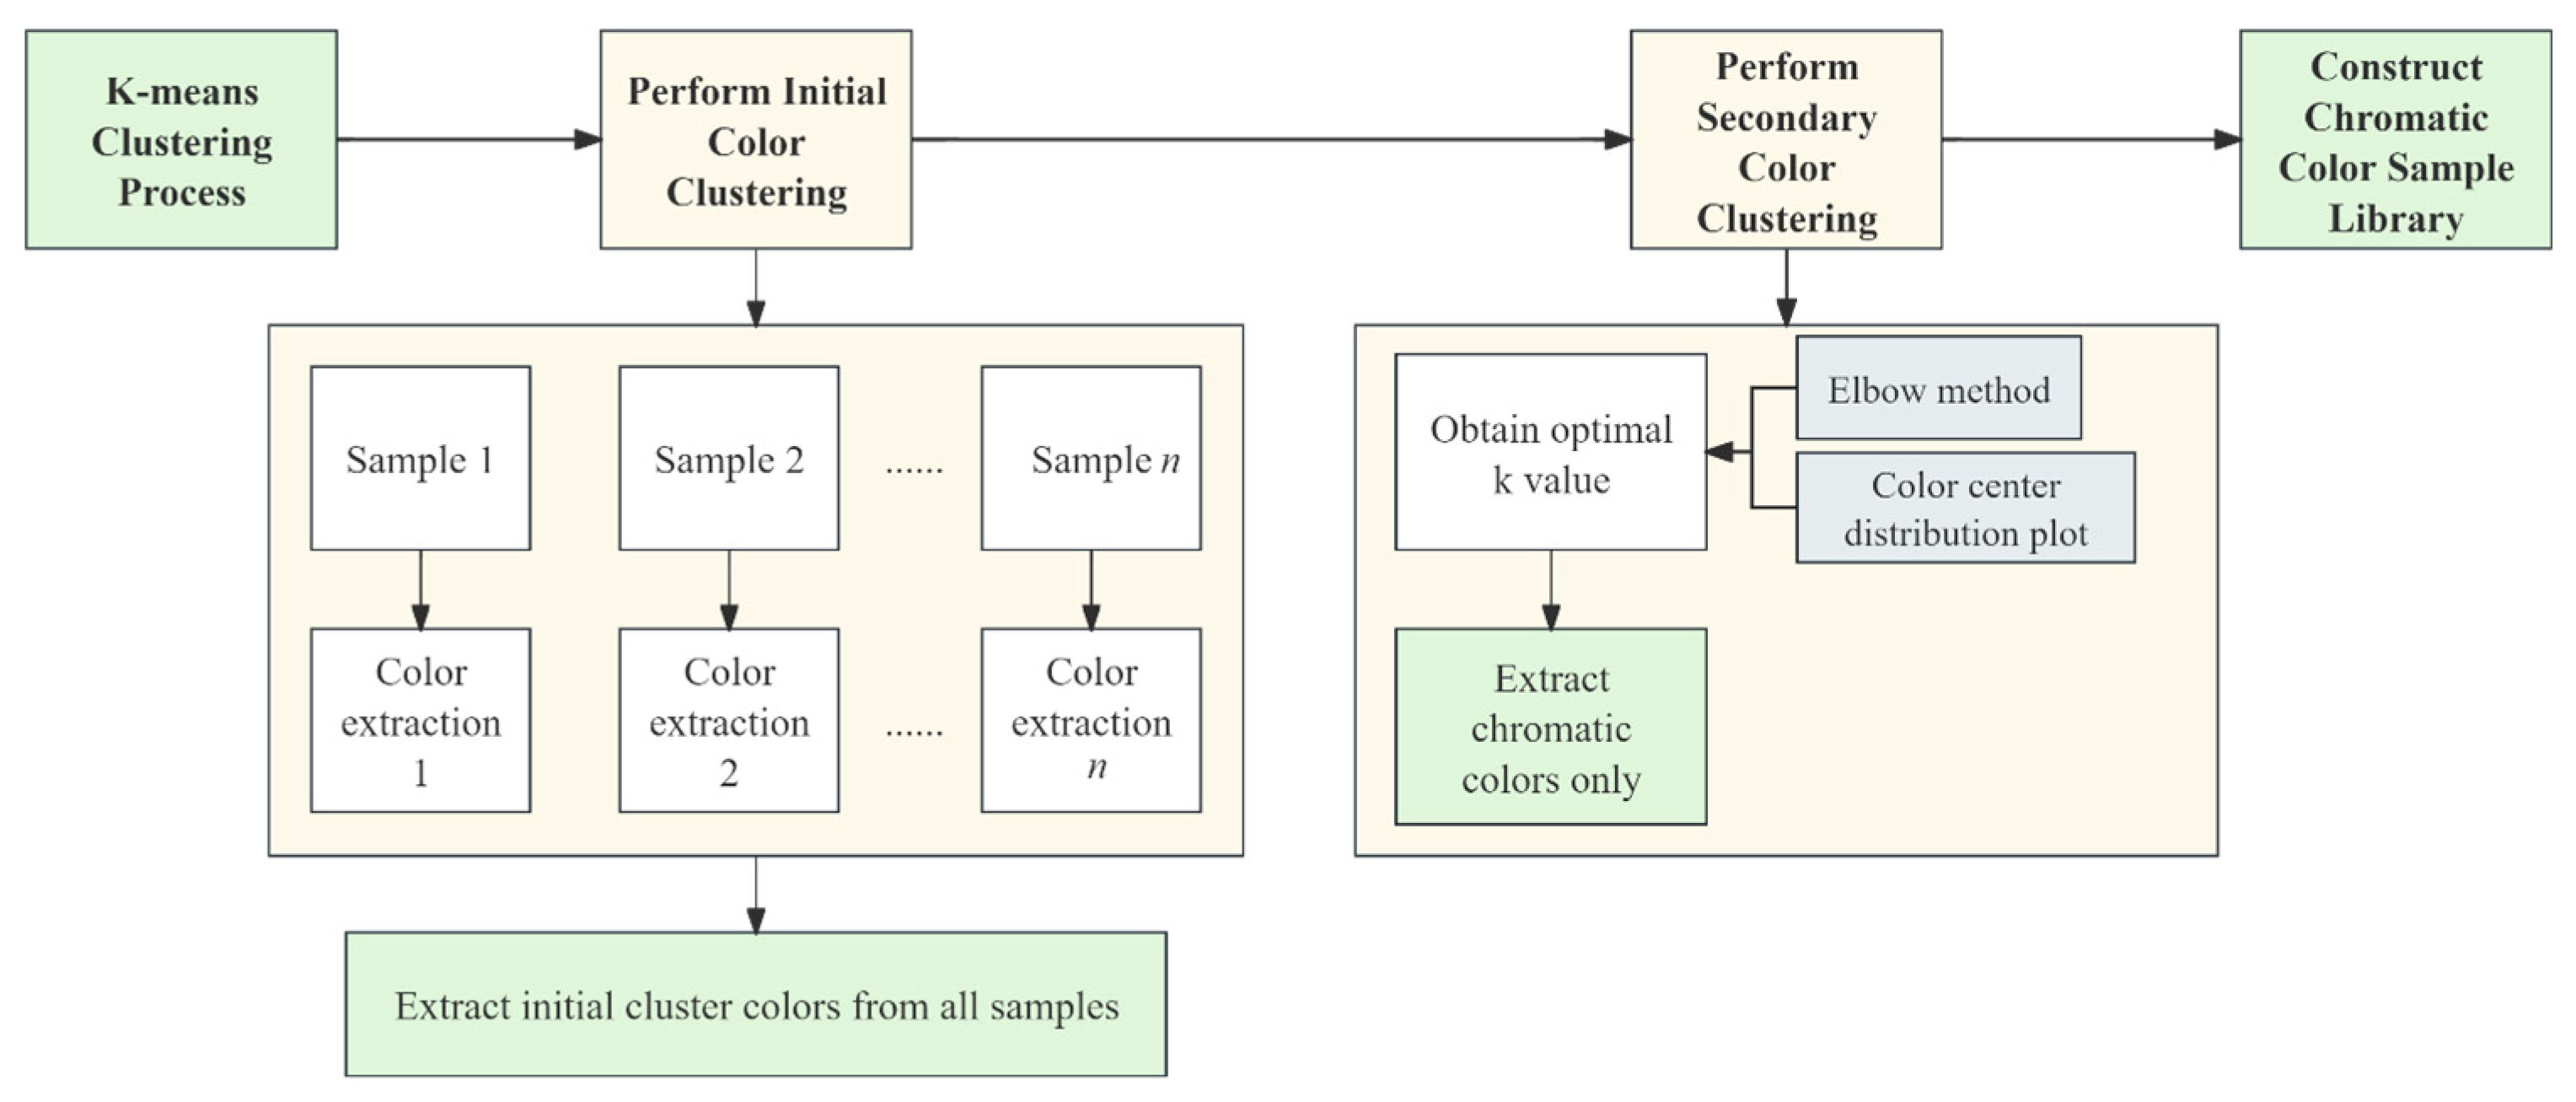
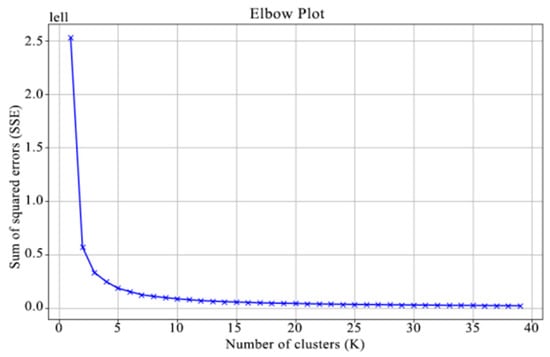
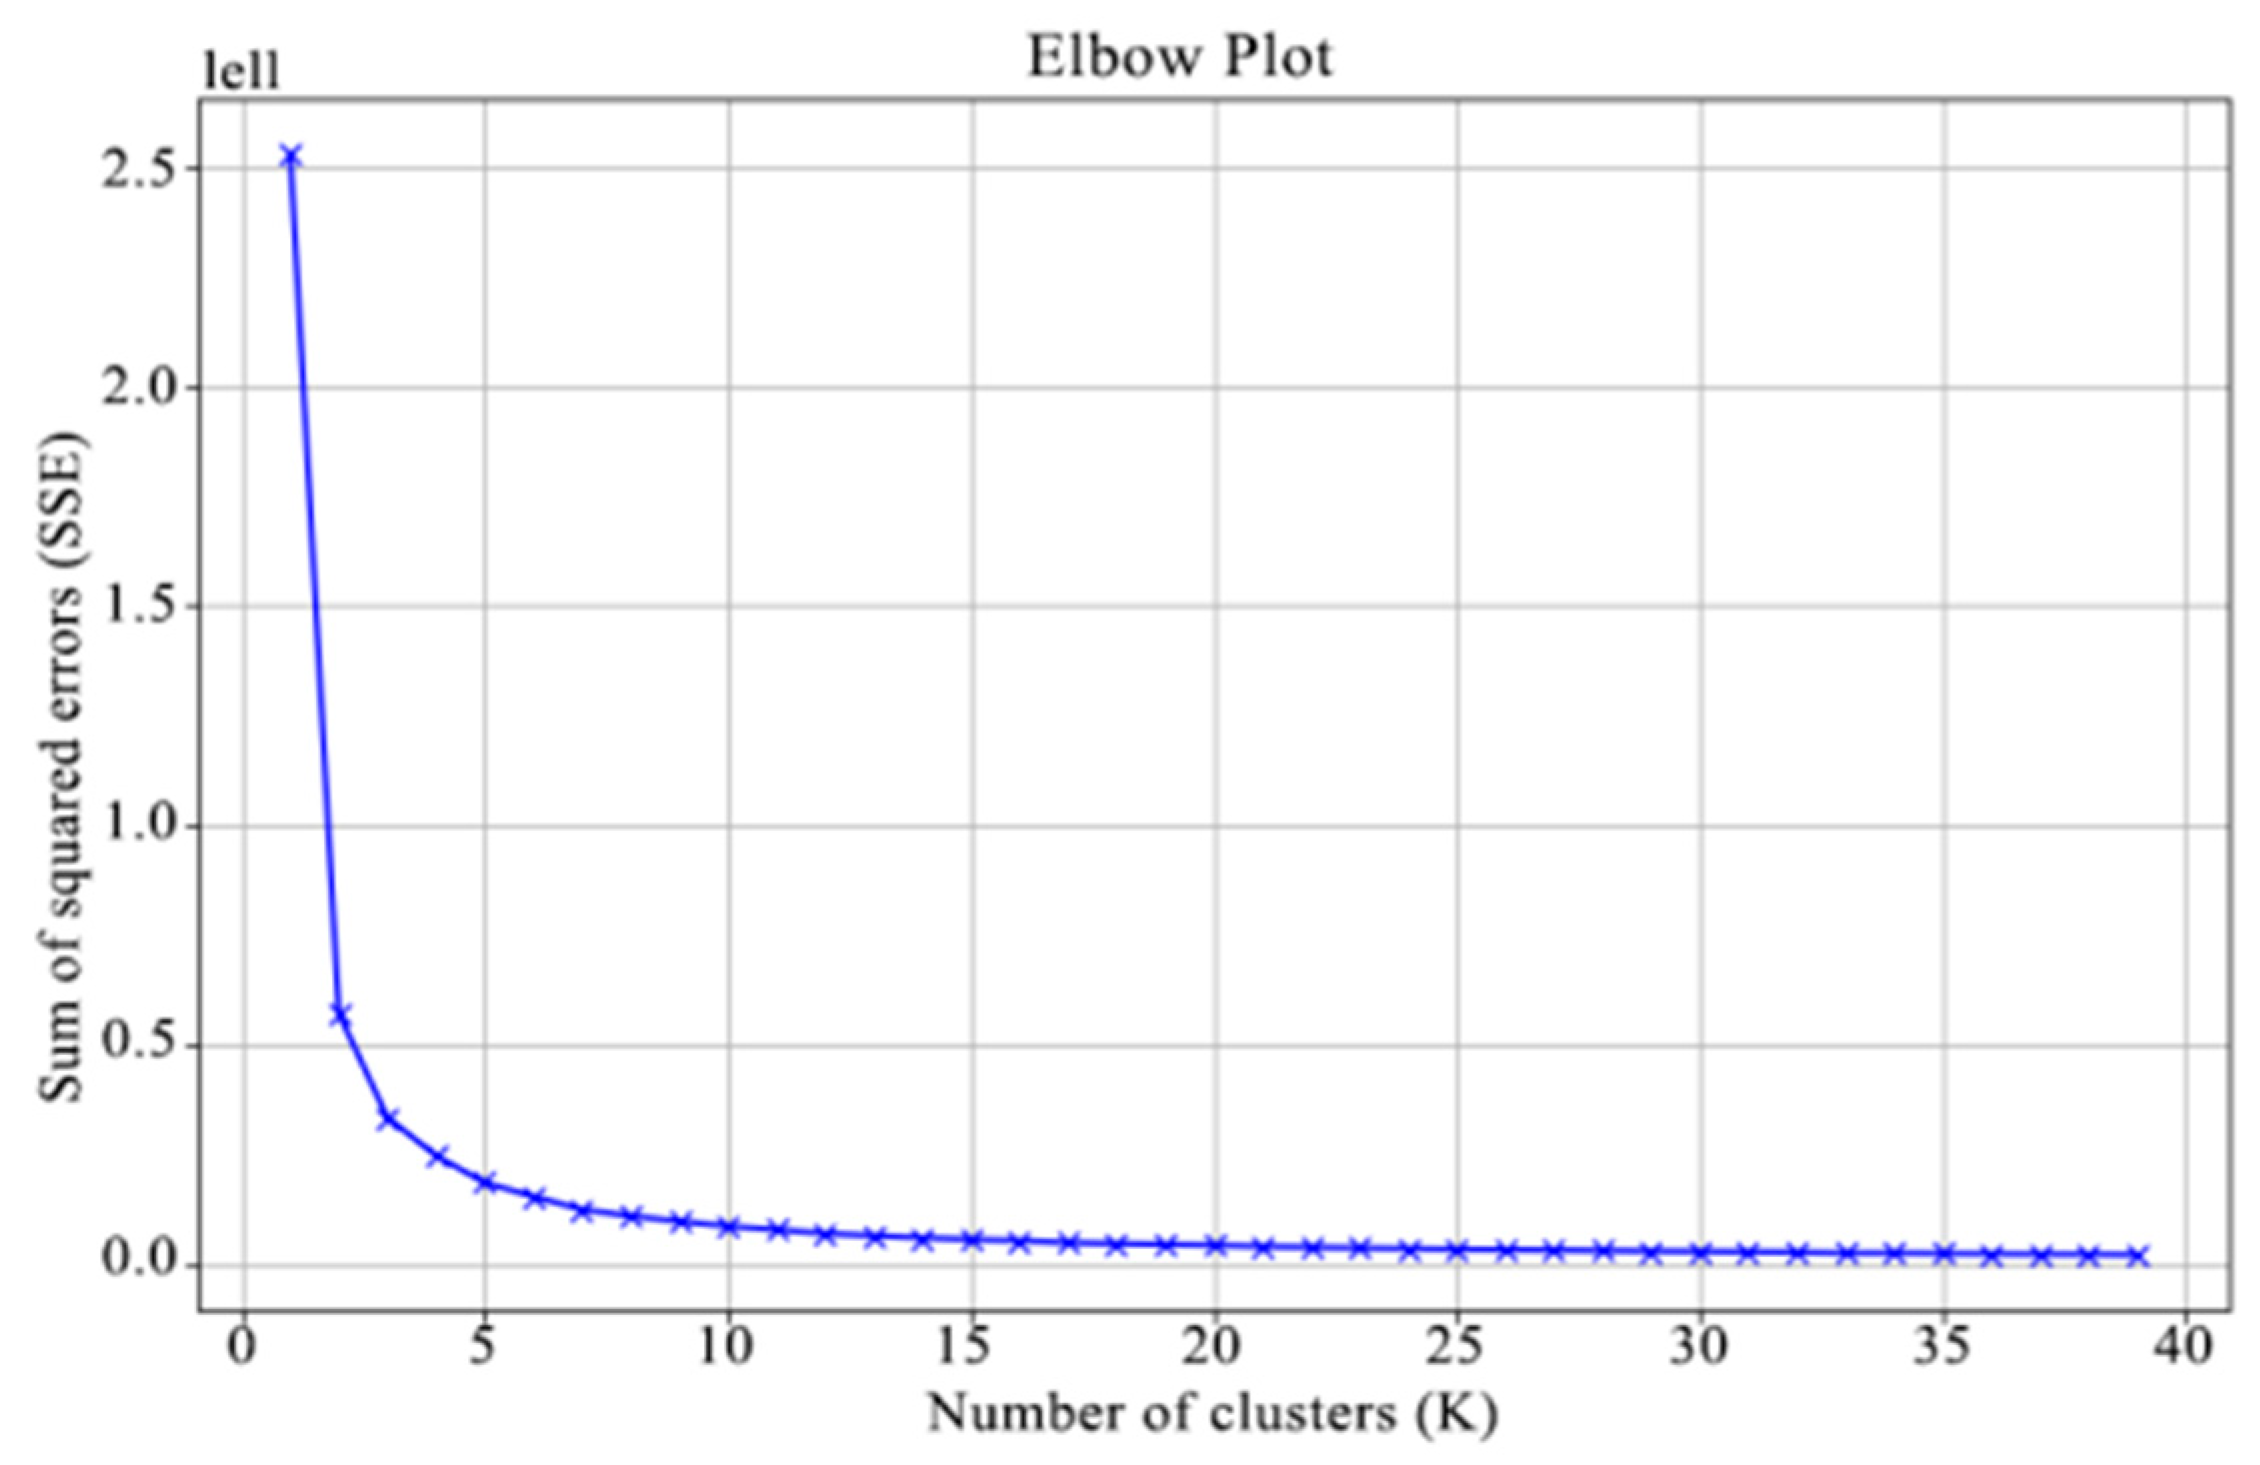
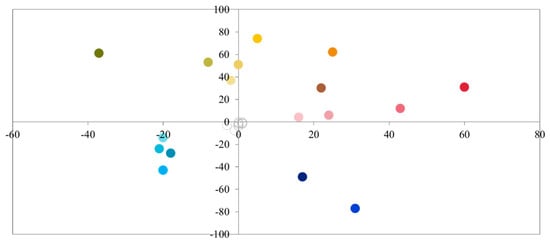
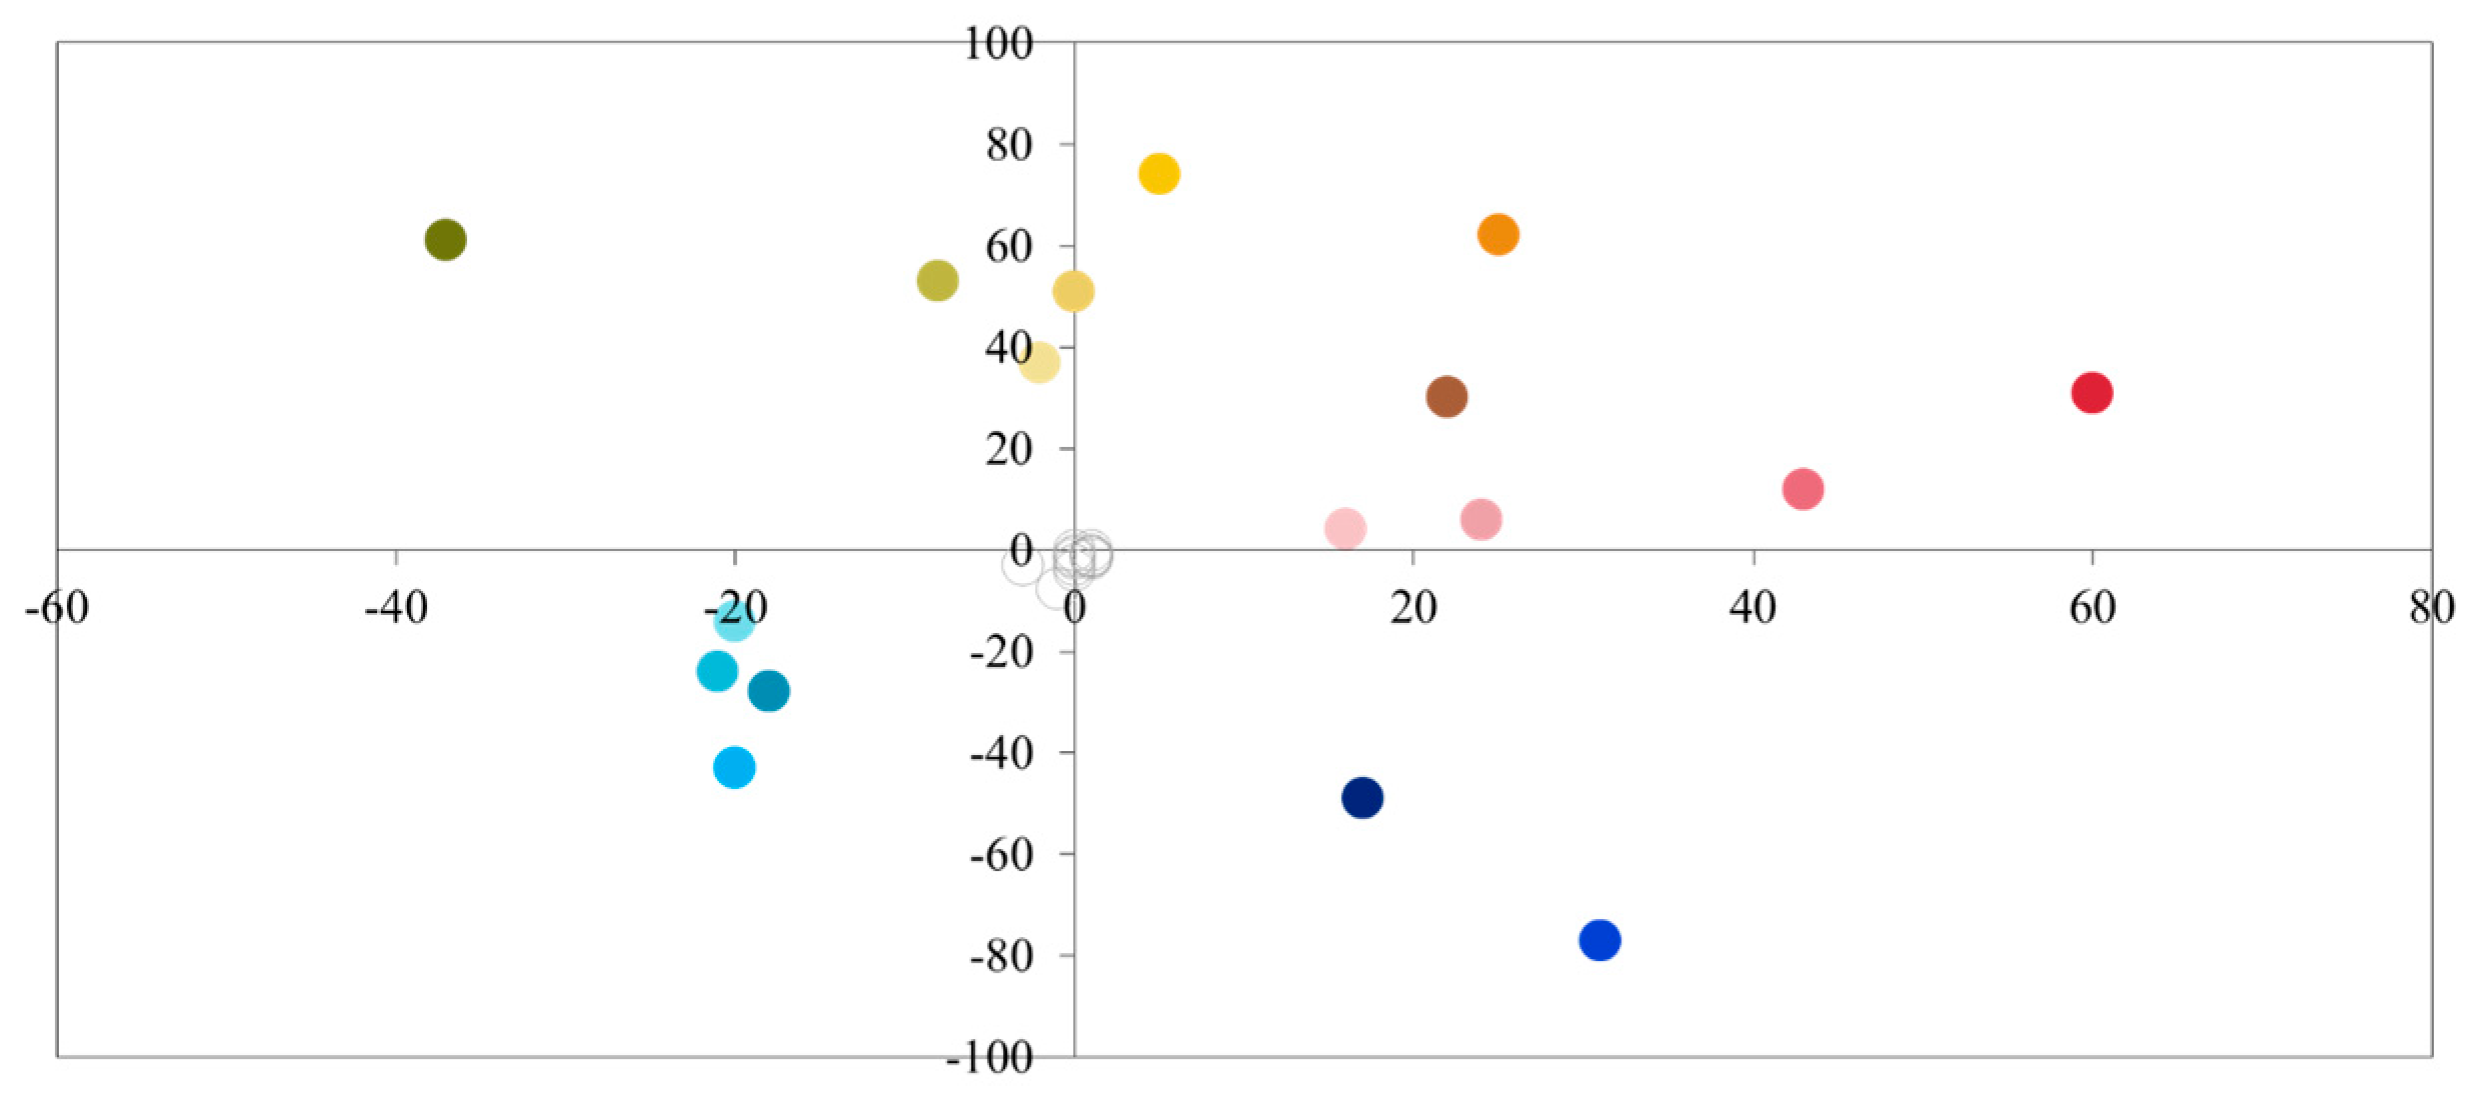
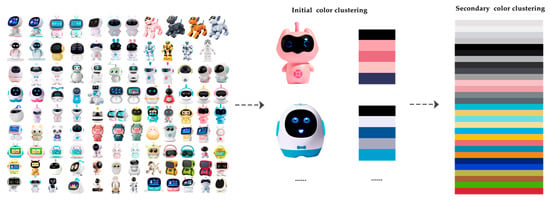
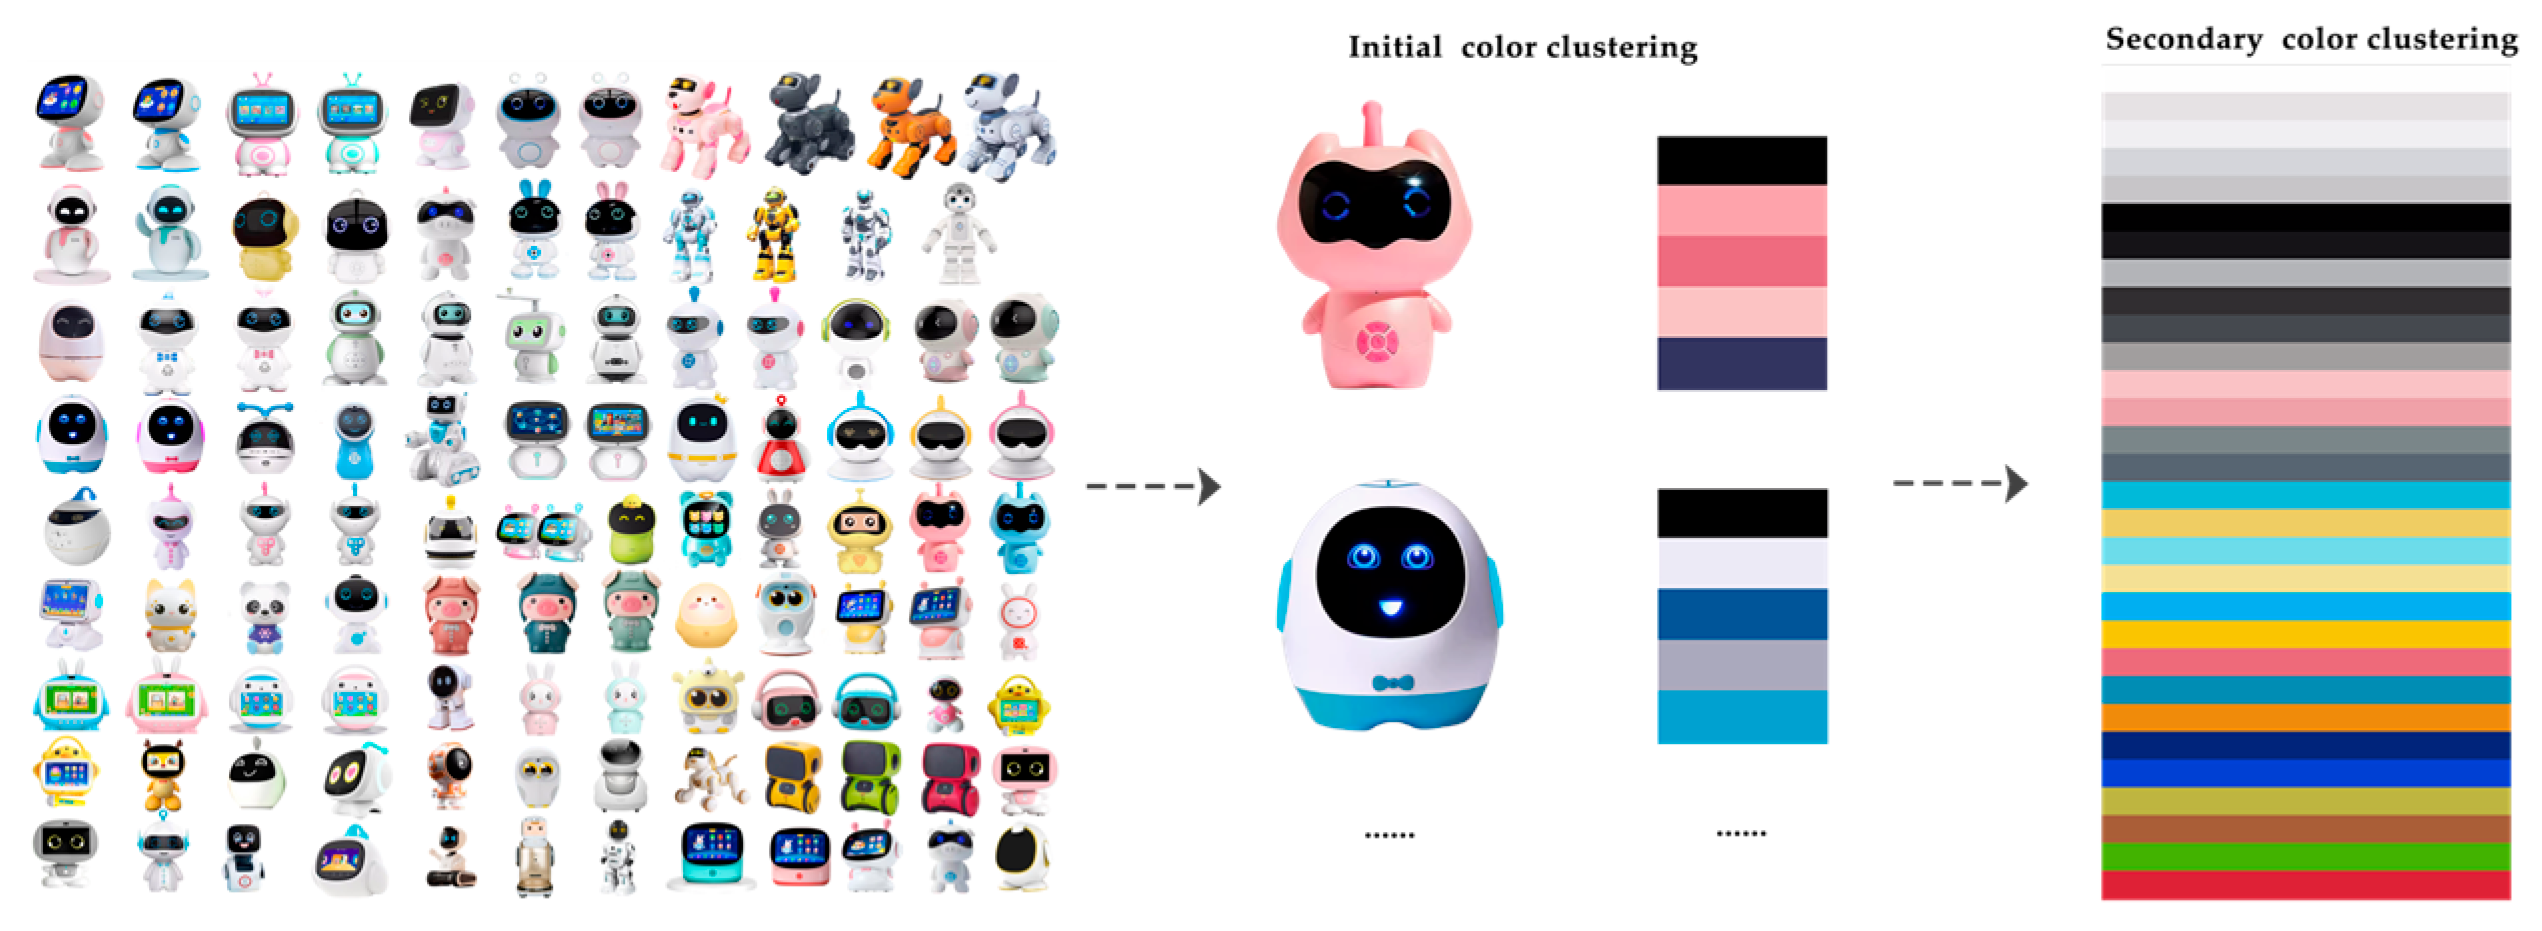
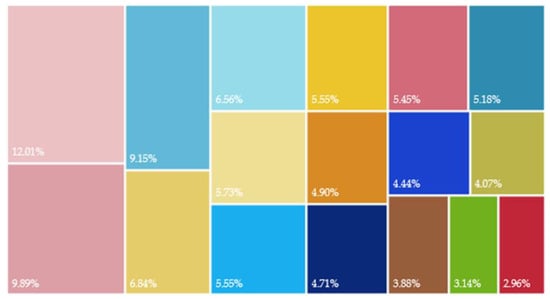
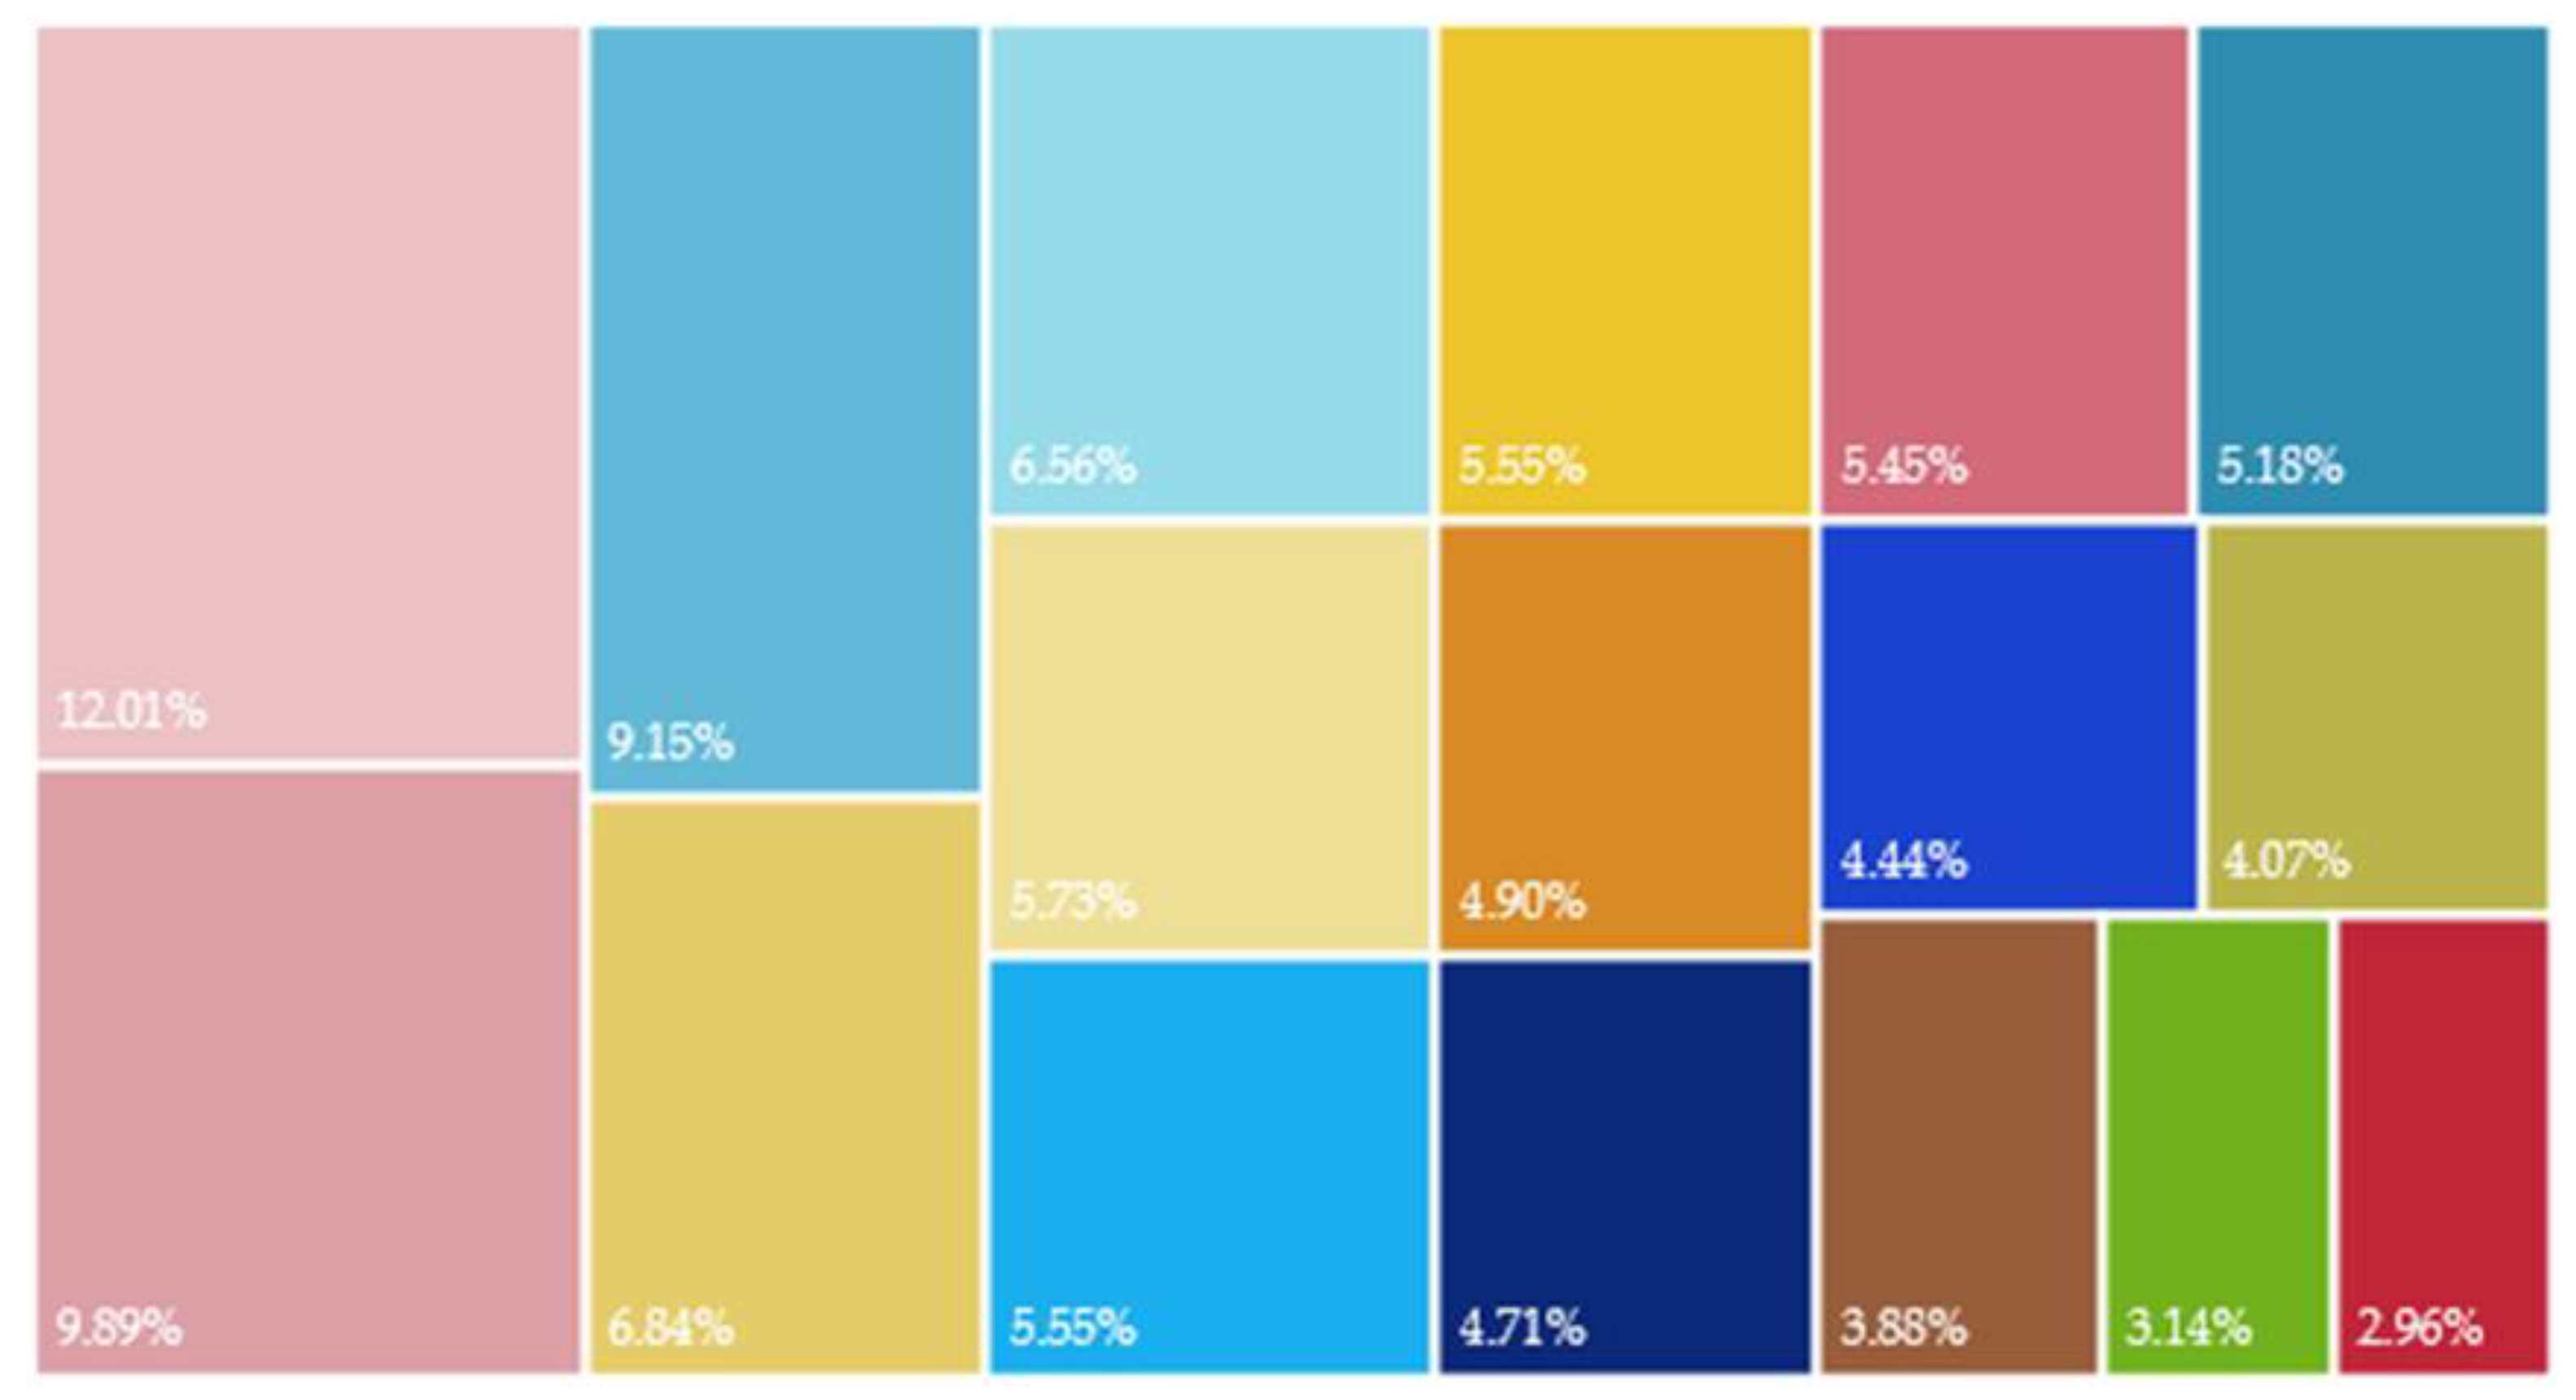
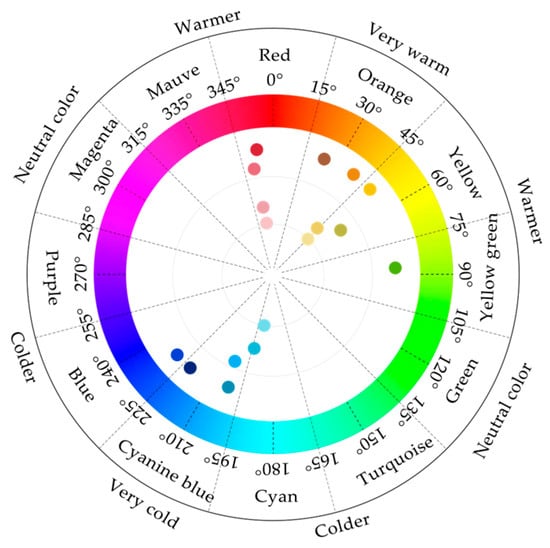
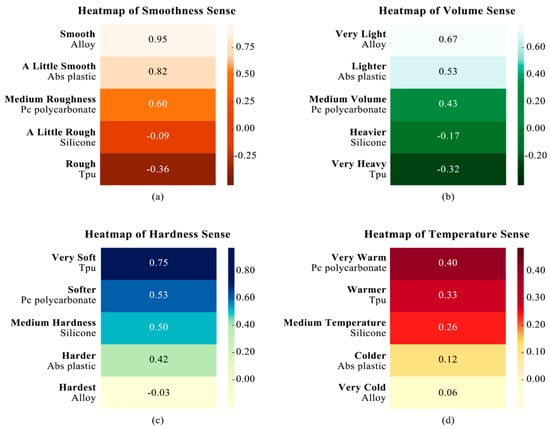
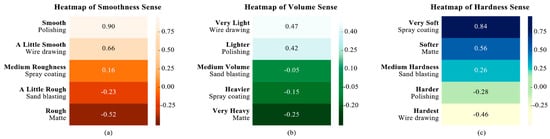
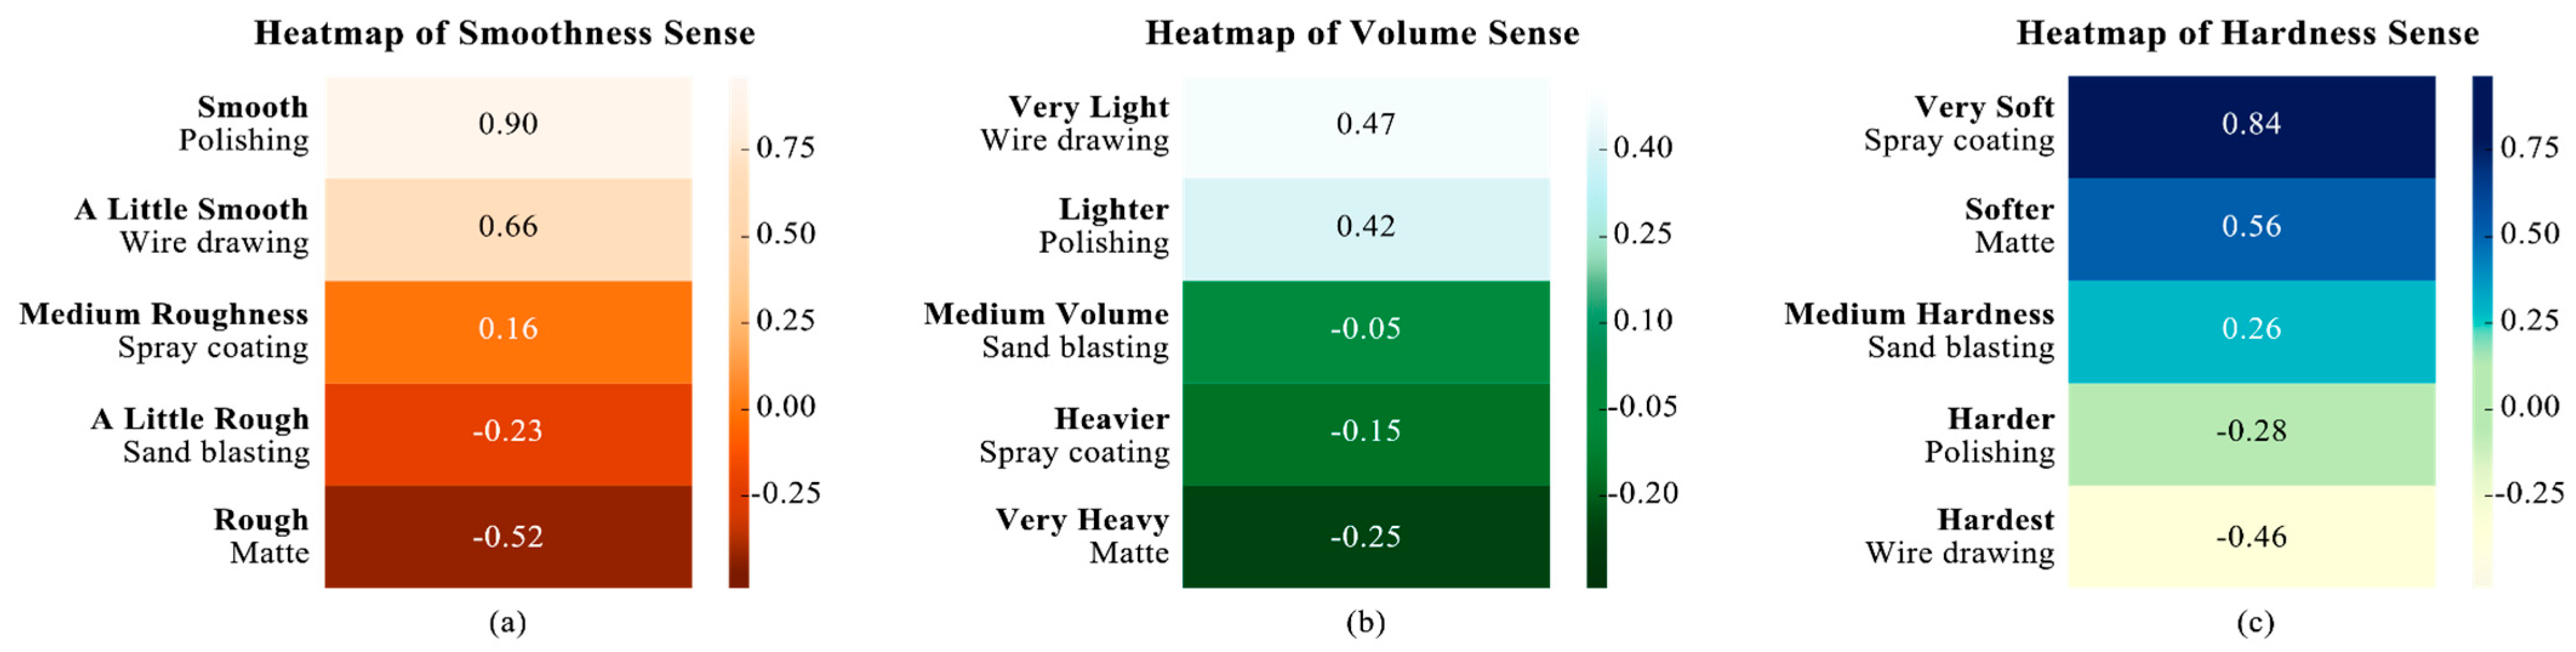
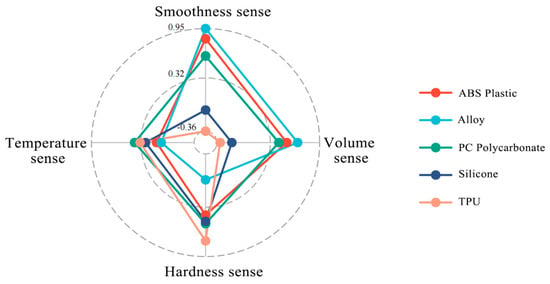
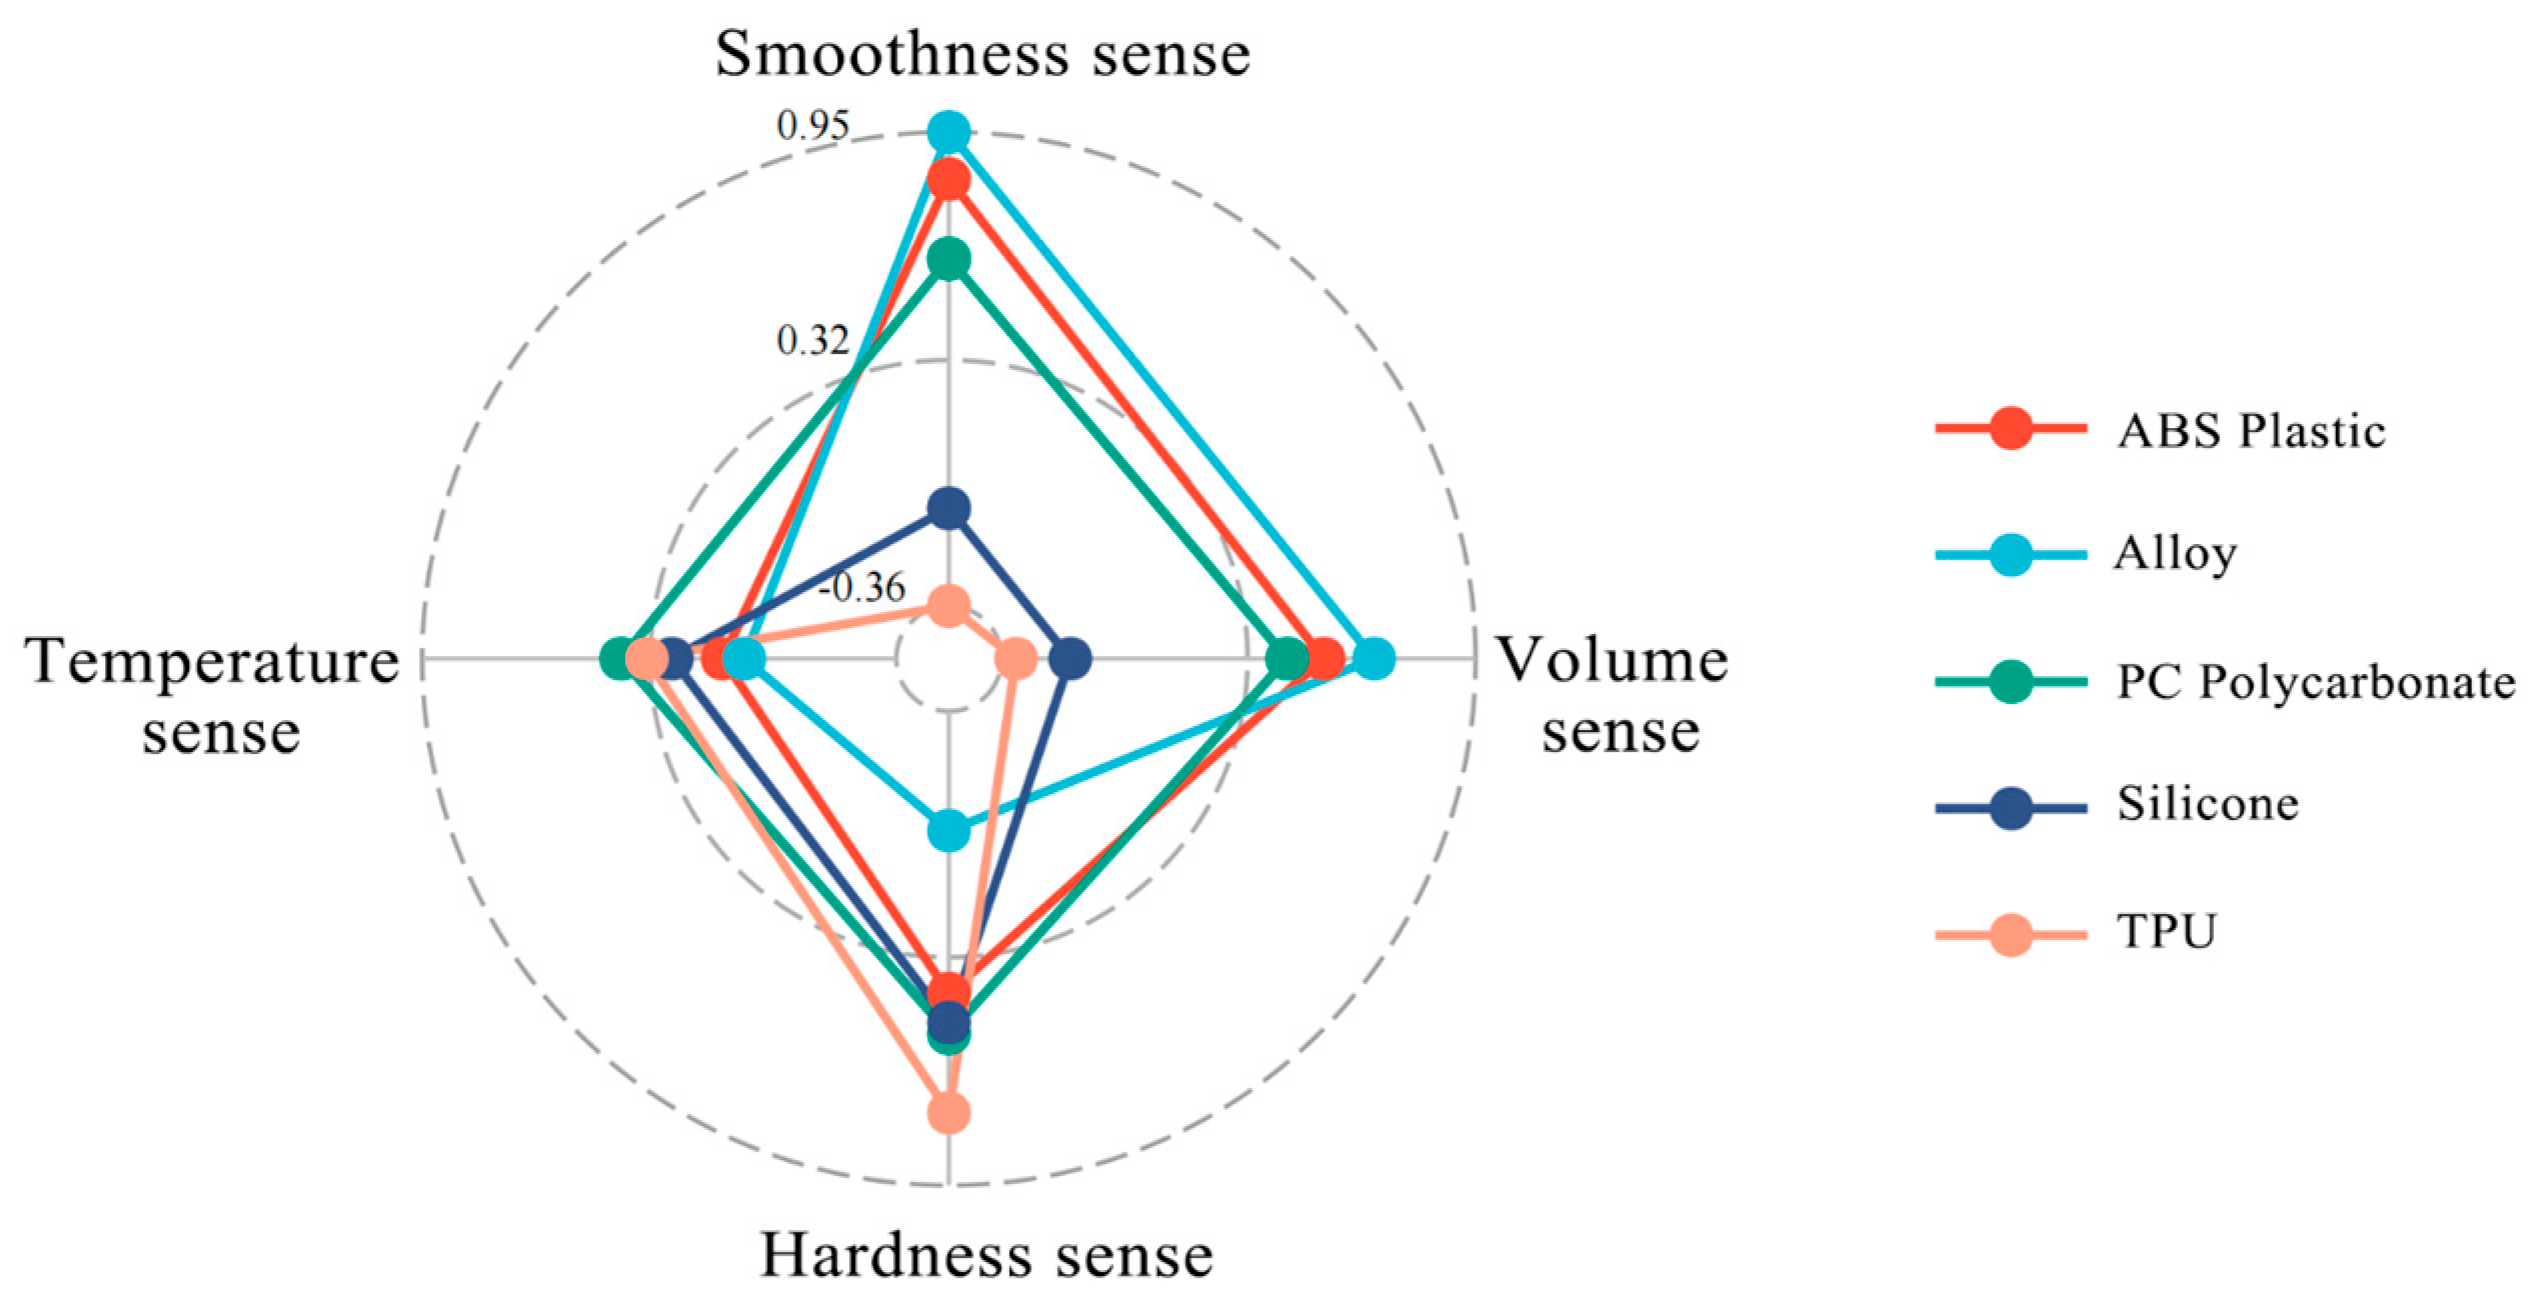
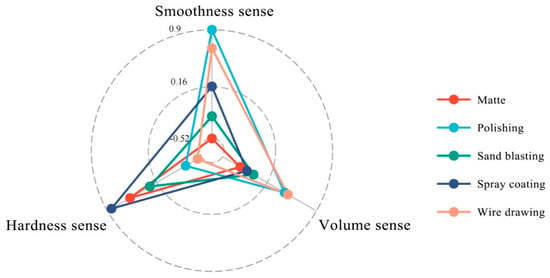
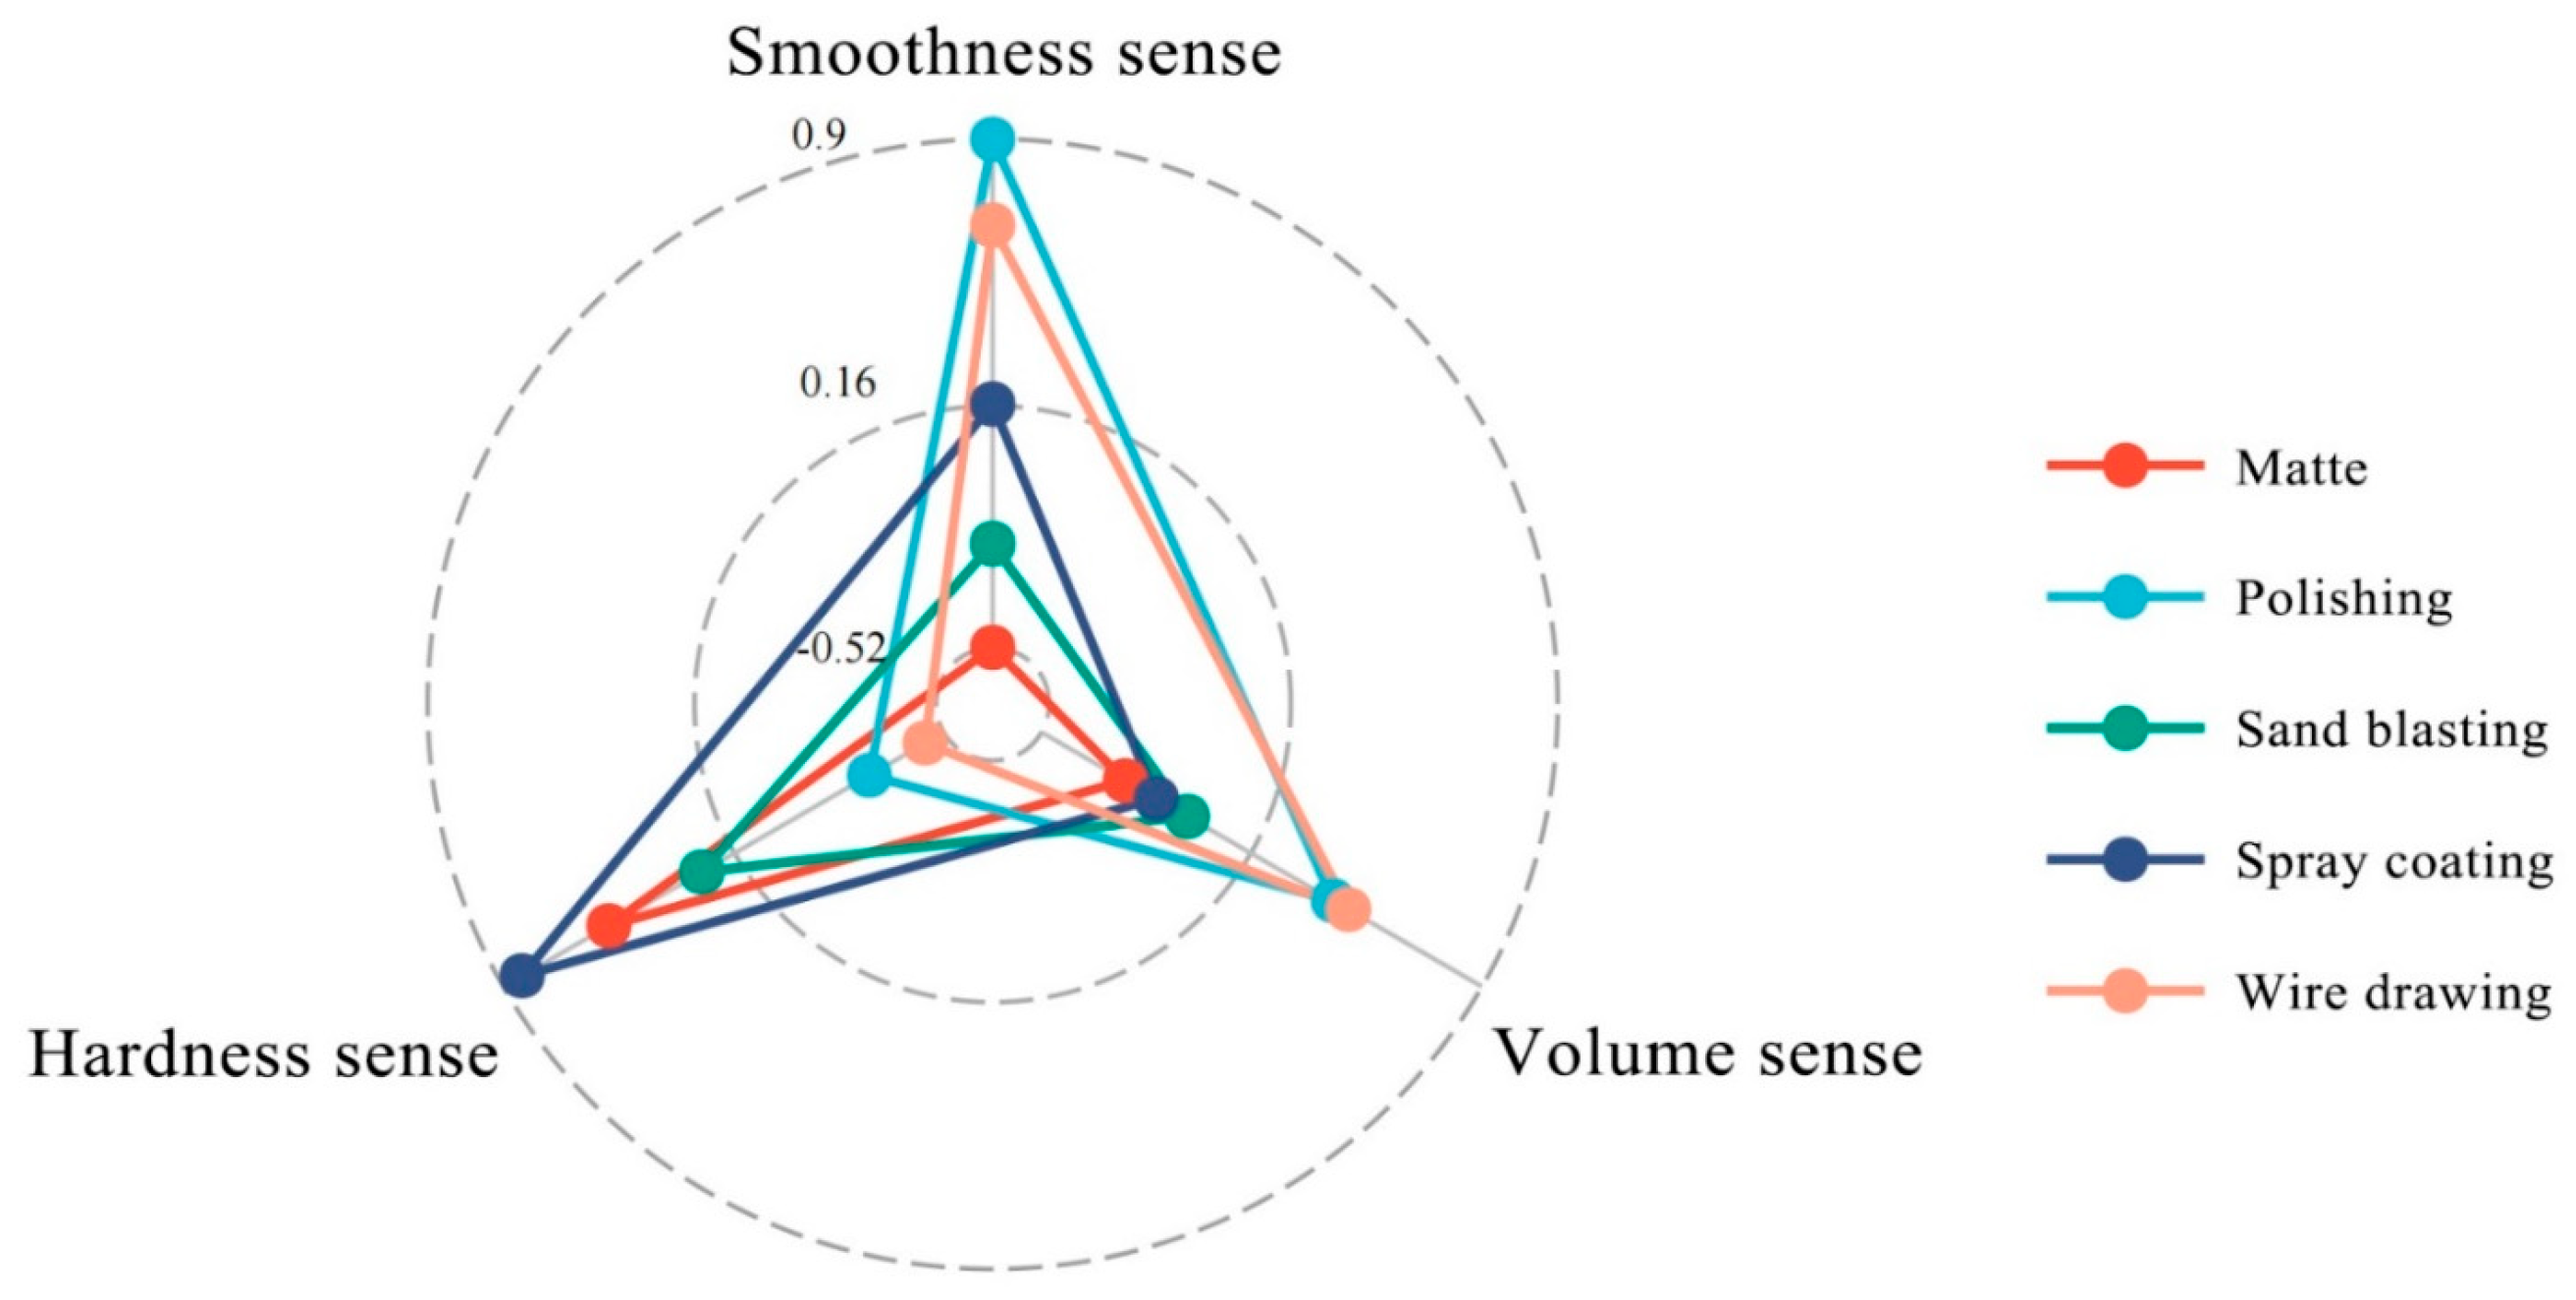
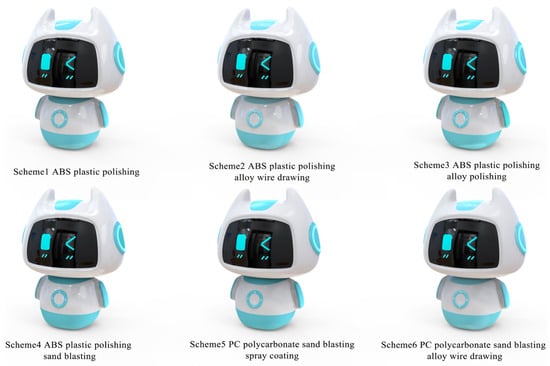
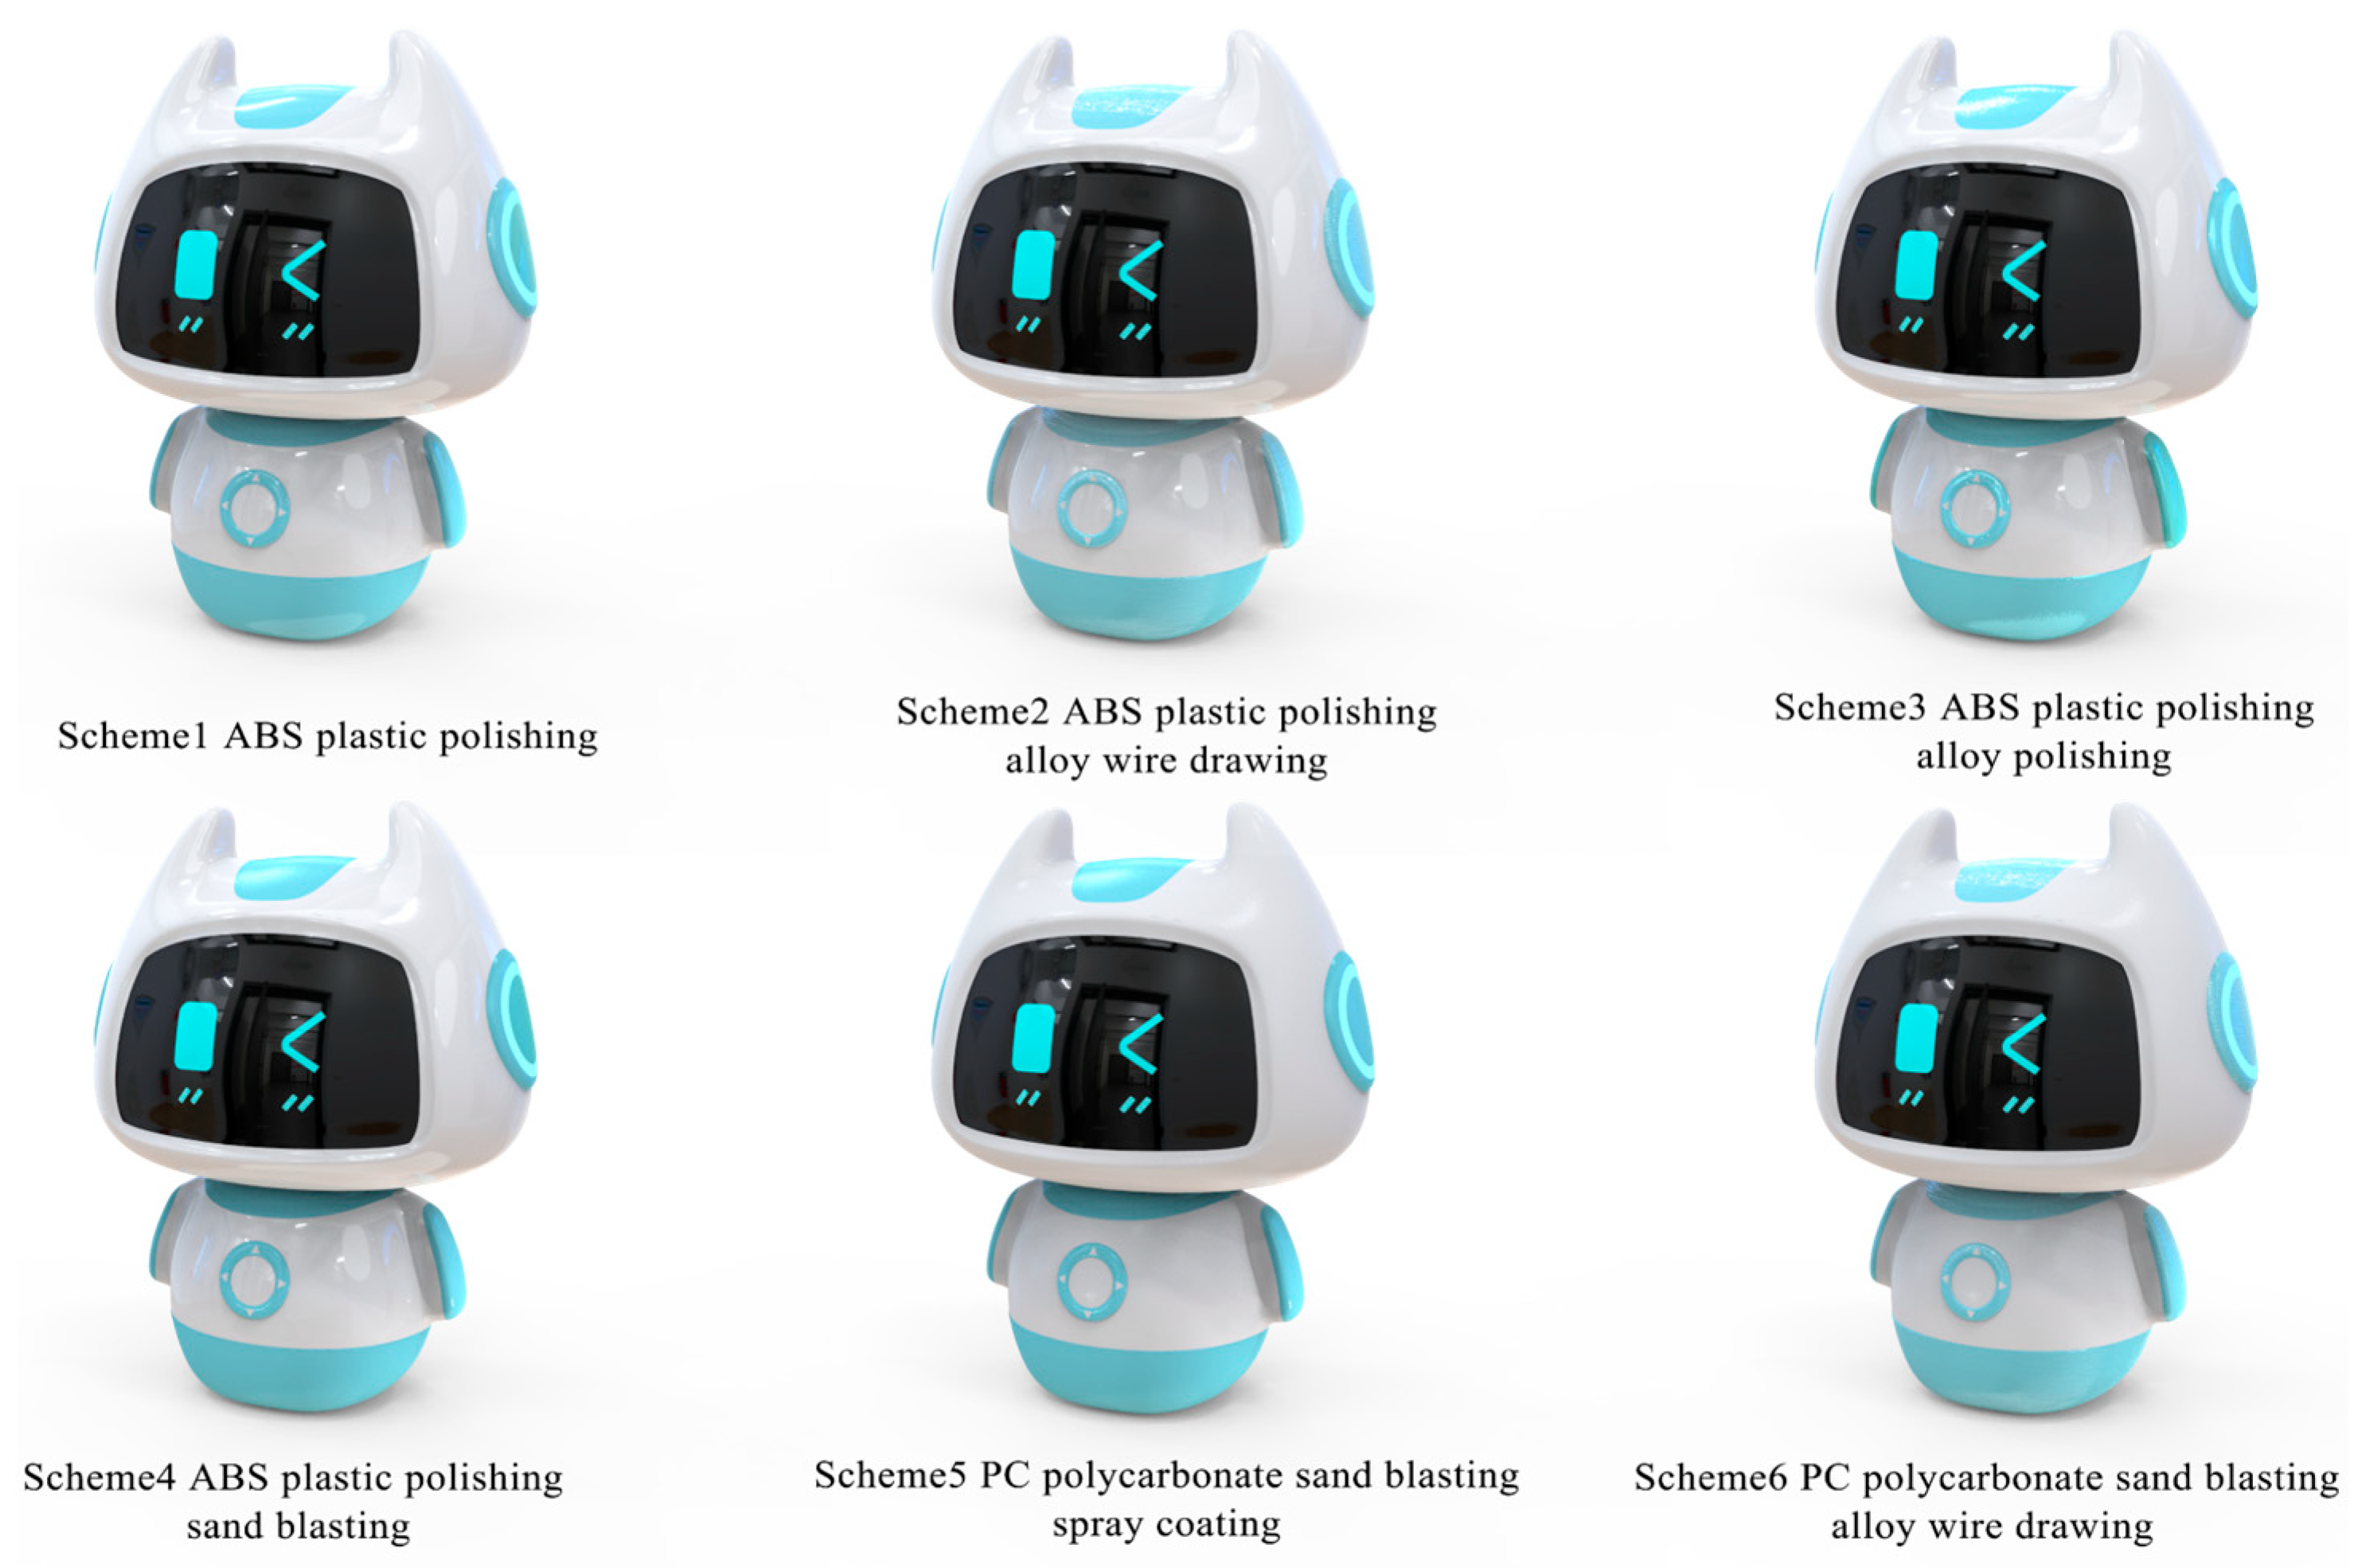
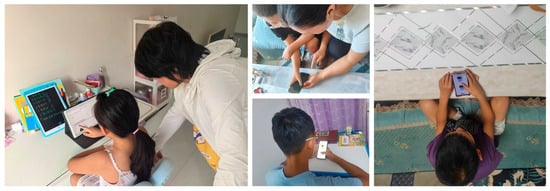
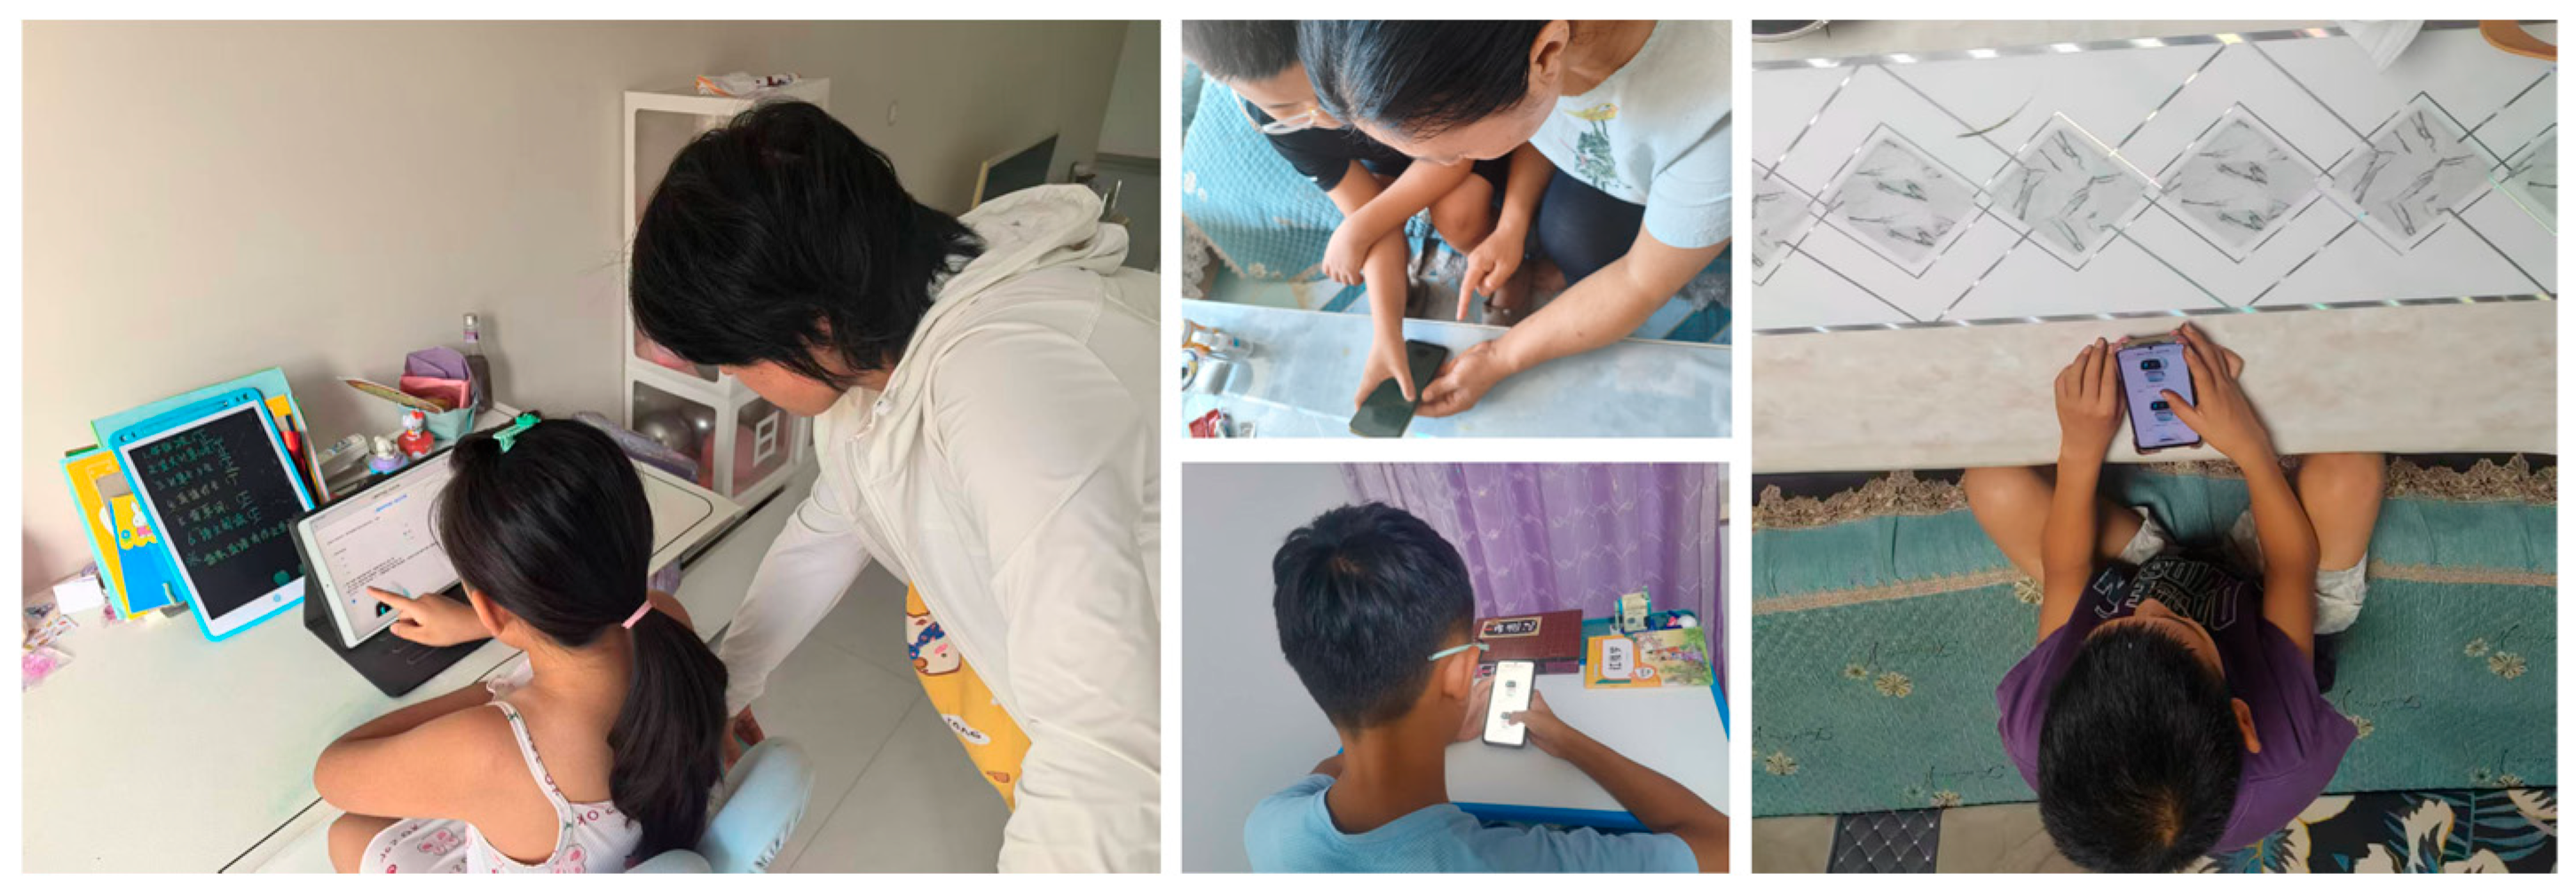
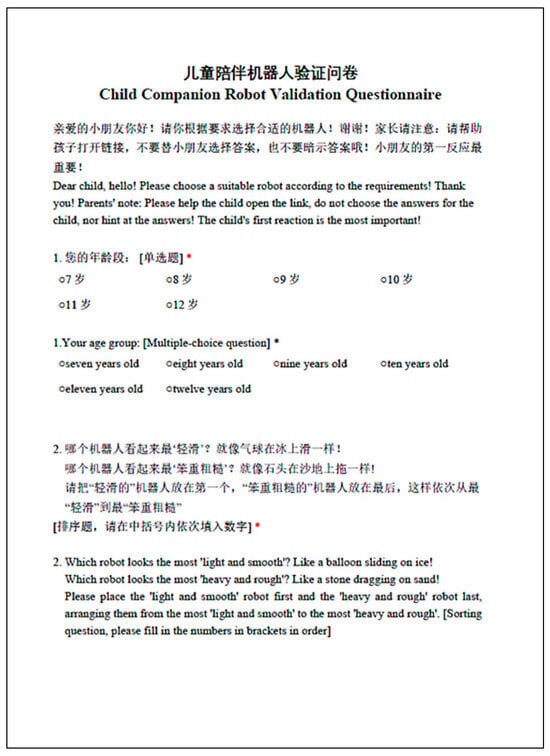
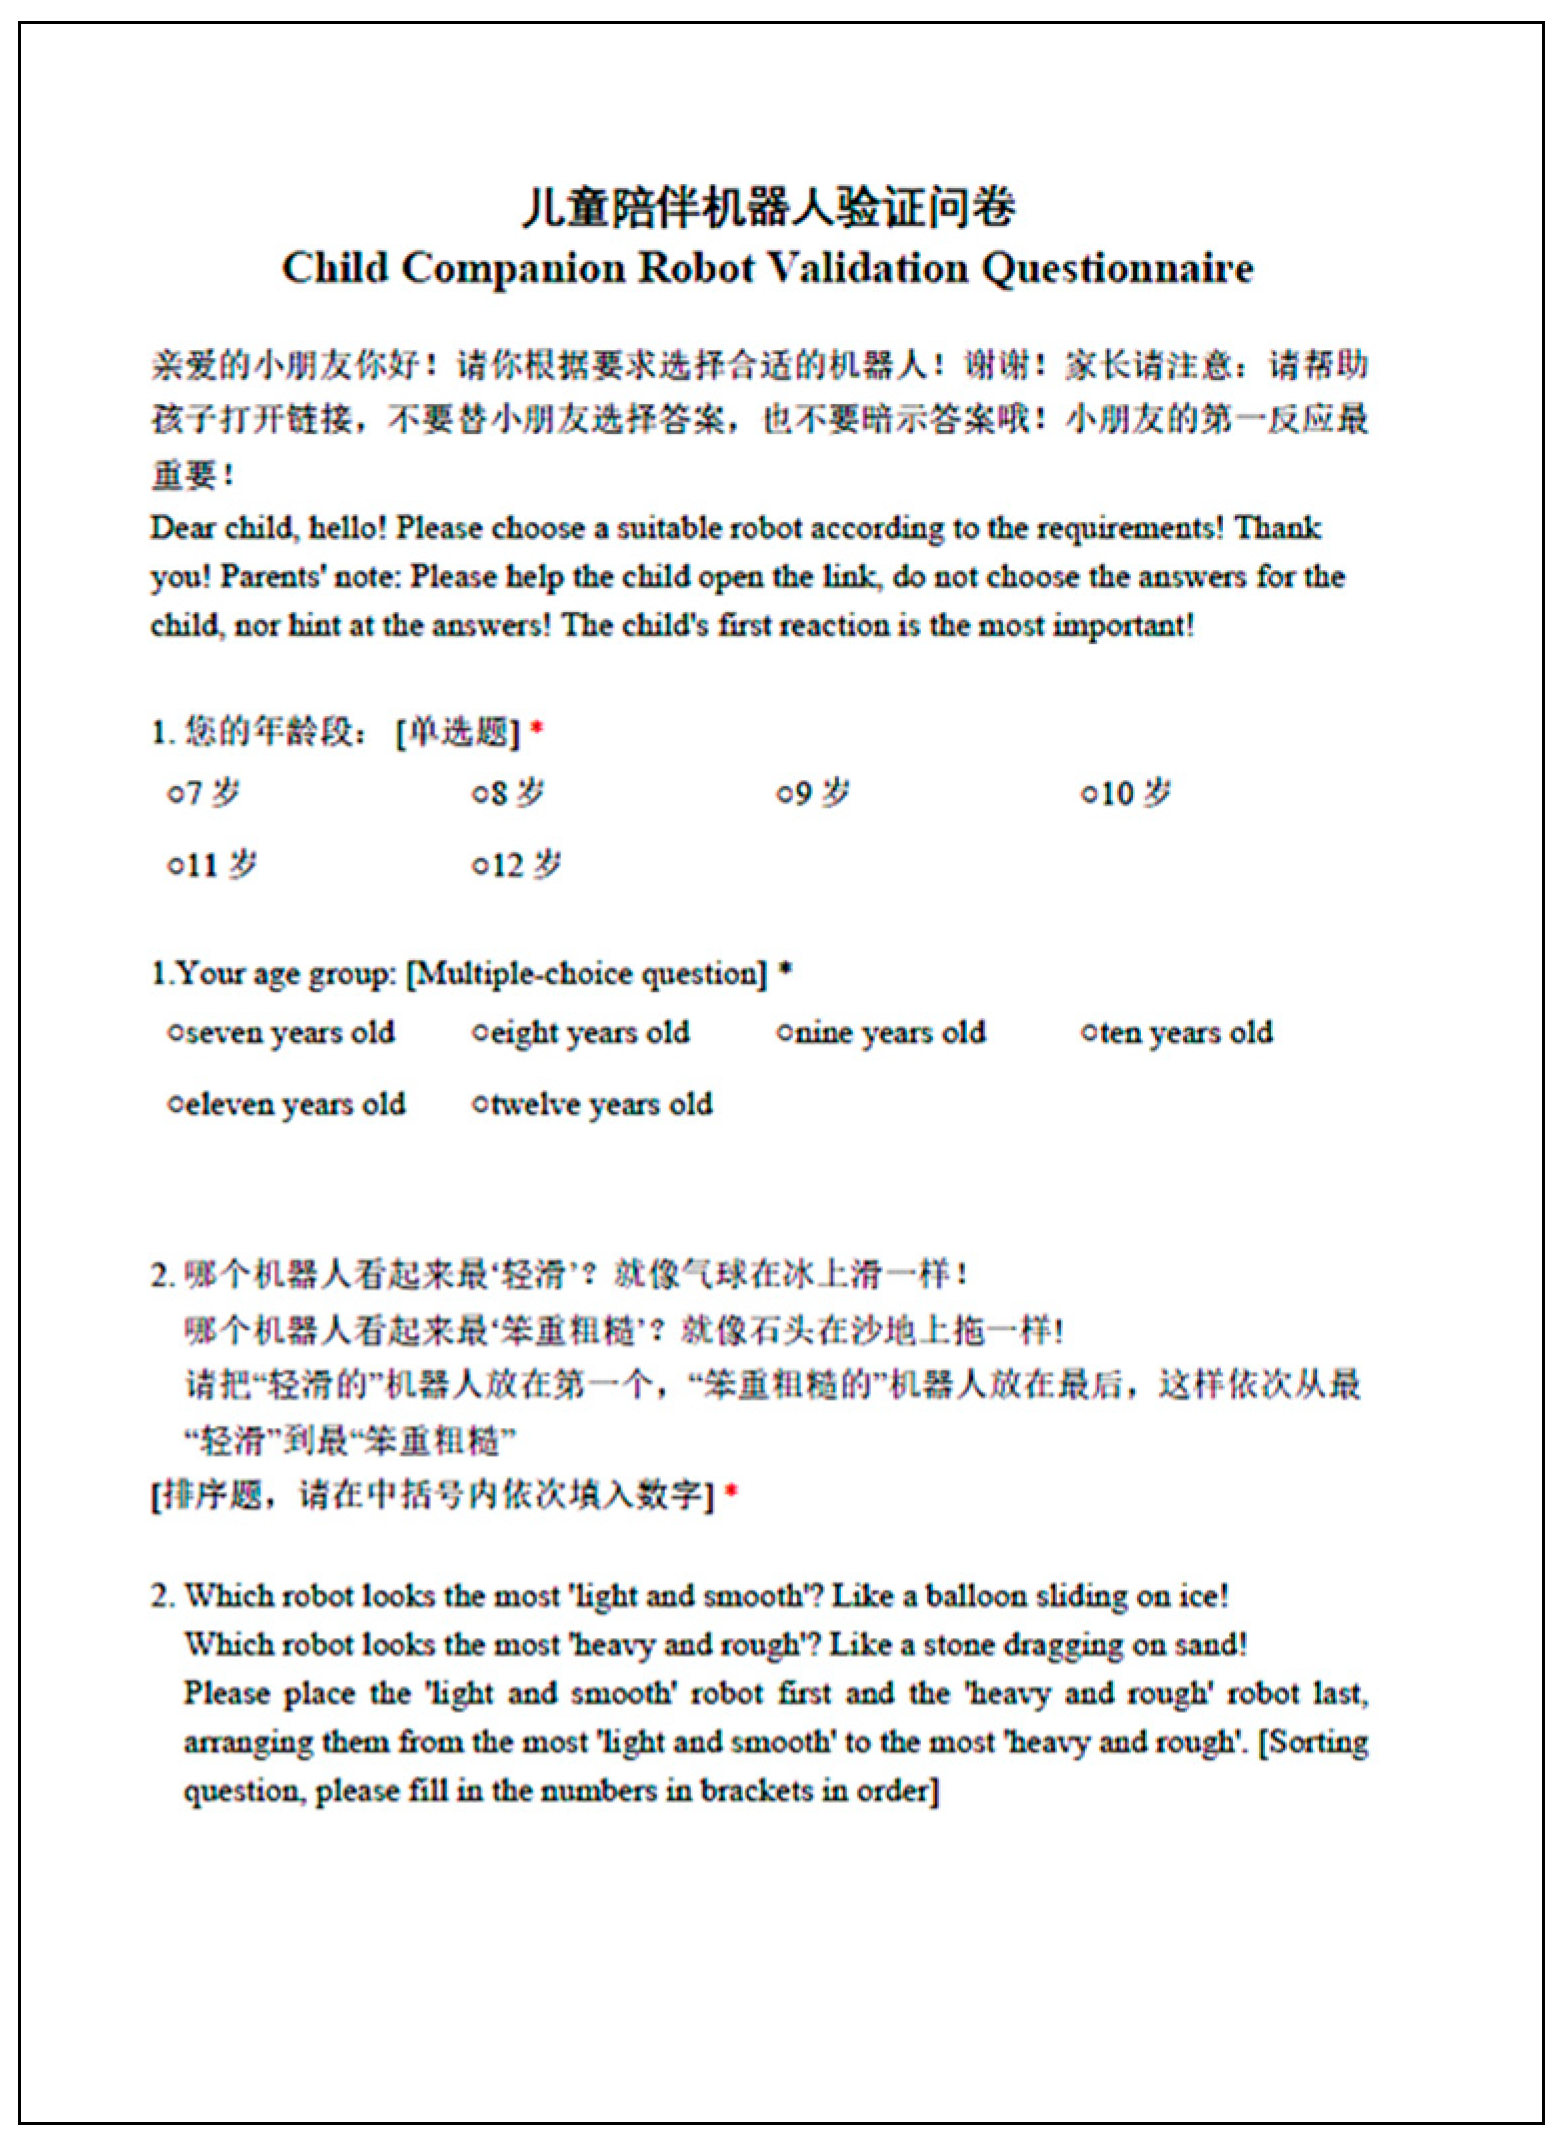
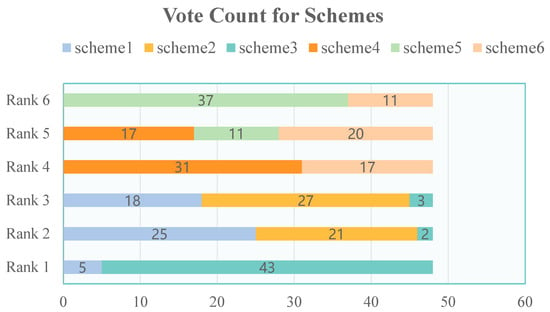

Disclaimer/Publisher’s Note: The statements, opinions and data contained in all publications are solely those of the individual author(s) and contributor(s) and not of MDPI and/or the editor(s). MDPI and/or the editor(s) disclaim responsibility for any injury to people or property resulting from any ideas, methods, instructions or products referred to in the content. |
© 2026 by the authors. Licensee MDPI, Basel, Switzerland. This article is an open access article distributed under the terms and conditions of the Creative Commons Attribution (CC BY) license.