


Abstract
Environmental pressure in Nigeria persistently escalates despite several development efforts, prompting questions about the structural factors contributing to the nation’s ecological vulnerability. Considering this, the study employs a time-series research design that synthesizes collective theoretical perspectives to elucidate the interplay between income inequality (GINI), institutional quality (INST), trade in services (TO), and population density (POPd) in shaping Nigeria’s ecological footprint (ECF), utilizing data for the aforementioned variables from 1960 to 2024. The analysis shows time-varying dynamics across pollution regimes using Quantile-on-Quantile Regression (QQR) and Wavelet Quantile Correlation (WQC). The result reveals notable asymmetries across the ECF distribution. GINI and POPd intensify ecological pressure mainly at higher ECF quantiles. While INST serves as a key mitigating factor of ECF, particularly in a long-term pollution scenario. TO exhibits a regime-dependent effect, aligning with the Pollution Haven expectation in poor environments. These findings suggest that environmental outcomes in emerging economies are shaped by structural inequality and institutional strength. Highlighting the necessity of building institutional capacity to decouple inequality that drives ecological degradation. Thus, connecting national strategies with the Sustainable Development Goals (SDGs) 1, 8, 10, 11, 12, 13, 15, 16, and 17. These provide actionable insights into an inclusive and resilient environment.
1. Introduction
In recent years, there has been a proliferation of worldwide environmental issues, and in Nigeria, as one of the largest African nations, it is afflicted by this predicament. The present situation stems from multiple forms of social inequality, which developed because of urban development, fossil fuel dependence, weak government control, and extensive land consumption. The data indicate that ECF levels keep increasing, while Nigeria faces ongoing biodiversity decline, its air quality deteriorates, and its marine ecosystems become more damaged. The research data indicate that Nigeria’s ECF exceeds its biocapacity because of population growth, unregulated production activities, and insufficient government control [1]. In connection with GINI, wealth and opportunities are progressively centralized, resulting in a significant welfare disparity between urban and rural communities. These difficulties raised a key question: What is the method by which Nigeria’s GINI structure affects environmental stress? Studies on environmental economics in Nigeria have mostly concentrated on carbon dioxide emissions (CO2), energy usage, commerce, and growth, covering only a portion of the ecological forces.
On the other hand, research from both local and global sources has begun to show how GINI uses a nonlinear strategy to influence environmental outcomes. For instance, Ref. [2] found that GINI intensifies the CO2 outcome, implying that GINI reduces environmental quality in Turkey. Similarly, [3], opined that an uneven society has a restricted voice for disadvantaged economies, more regulatory consequences, and a weaker demand for environmental protection. Adding that, GINI may skew access to green technologies and renewable energy. Furthermore, research by [4] for Sub-Saharan Africa (SSA) emphasized that GINI can increase emissions and reduce the efficacy of financial and environmental initiatives. In Nigerian-specific literature, Ref. [5] found that GINI reduces CO2 emissions by reducing energy consumption.
Therefore, it is important for Nigeria to prioritize ECF above CO2. To evaluate expanding ecological constraints, the ECF indicator combines pressures on agriculture, grazing land, fishing grounds, forests, built-up land, and carbon absorption capacity into a single biophysical indicator. According to some research on the dynamics of the ECF in the African economy, the indicator is significantly shaped by trade arrangements, population pressures, INST, and energy systems [6]. Nevertheless, limited research has rigorously examined the interaction between Nigeria’s GINI coefficient and other indicators over time. Ref. [7] confirmed that INST and GINI circumstances strongly influence the ECF trajectories. Nonetheless, these ideas have not been thoroughly investigated in Nigeria using rigorous models and nonlinear empirical techniques.
In this scenario, the study employs a quantitative and time-series methodology that synthesizes various theoretical frameworks to analyze the collective influence of GINI, INST, TO, and POPd on Nigeria’s ECF. The study collected data specifically for the above variable from 1960 to 2024 from various secondary data sources. The main research gap addressed in this study is the absence of nuanced, country-specific evidence on how GINI influences environmental sustainability, as suggested by Ozturk et al. [2]. Ref. [2] also suggested that future studies could be advanced in other developing countries, such as Nigeria. Furthermore, there are limited studies that measure environmental pressure with ECF and analyze it through robust methods such as Quantile-on-Quantile Regression (QQR) and Wavelet Quantile Correlation (WQC). These methods allow for asymmetric distributions, varying distributions, and time-varying outputs. The model was introduced in this study because we found that existing studies on Nigeria primarily focused on linear mean-effect estimators, like the study of [8], some focused on CO2 emissions as a single pollutant, similar to [9], while others treated inequality, trade, population, and institutions as separate secondary determinants, like the study of [10]. Environmental studies have moved towards non-linear approaches such as Nonlinear Autoregressive Distributed Lag (NARDL), QQR, and other advanced techniques. For example, in GINI, CO2 studies for Turkey [2] and studies on SSA [4]. However, there is still no dedicated study applying a QQR and WQC framework to the Nigerian GINI and ECF nexus.
Building on these gaps and guided by theoretical frameworks such as the pollution haven hypothesis (PHH) [11], political economy of the environment (PEE) [12], and the Environmental Kuznets Curve (EKC) [13], the study set its interrelated objectives: 1, to examine the nonlinear and distribution sensitive effects of GINI on Nigeria’s ECF; 2, to investigate how TO, POPd and INST interact with GINI in shaping ECFs in Nigeria; 3, To model the GINI-environmental relationship by applying the QQR method. Thus, capturing how different quantiles of GINI affect different quantiles of ECF rather than taking a single average; 4, To explore the time frequency and quantile-dependent co-movement through the WQC method, revealing whether the effect of GINI, TO, INST, and POPd on ECF is persistent or periodic in short and long-run horizons. This set of objectives addresses the gaps mentioned above.
The concern of addressing these gaps is both analytical and practical. Minding the fact that Nigeria is committed to the United Nations (UN) Agenda 2030, and the African Union 2063 climate Agenda. Without paying attention to how GINI and institutional limitations shape ecological outcomes, policy may mis-specify the indicators of transformation by overemphasizing some insignificant factors, while undervaluing the role of income distribution, accountability, and support for vulnerable populations. In emphasizing ECF, the study aligns with current sustainability criteria to assess if development trajectories adhere to agreed thresholds and whether nations such as Nigeria are converging or diverging from sustainable consumption and production models. Finally, the research advances multiple UN SDGs, including SDG 1, 8, 10, 11, 12, 13, 15, 16, and 17. Table 1 below illustrates the study’s contributions to the enumerated SDGs.
Table 1.
Contributions to SDGs.
With this connected framework, the study identifies GINI not merely as a social issue but also as a significant factor influencing Nigeria’s ecological results. Hence, the contributions constitute the study’s novelty to the emerging conversation on environmental and inequality studies. An integrated perspective that is limited to empirical studies in Nigeria. The rest of the study is divided into five parts: the introduction, the literature review, the data and methodology, the empirical results, the discussion, the conclusion, and the policy recommendation.
Contribution of the Study
- Replaces prior Nigerian CO2 -based and linear studies.
- ECF specific to Nigerian unlike regional ECF studies using panel data.
- Prior studies relied on linear or mean-based estimators; this research employs QQR and WQC to uncover joint distributional and time-frequency heterogeneity.
- Integrating GINI, INST, TO and POPd within a unified framework, the study advances understanding of regime-dependent environmental dynamics in an emerging economy context.
2. Literature Review
2.1. GINI and ECF Nexus
The relationship between ECF and GINI is a complex factor that has extended beyond CO2 to a broader ecological impact. Recent country-specific nonlinear research by [2] shows GINI can asymmetrically raise pollution when the dynamics are modeled with NARDL, motivating distribution-aware approaches beyond linear means. Furthermore, several other studies have applied different mechanisms to explain the GINI and environmental nexus. Most studies have highlighted that high GINI can increase emissions into the environment through greater consumption by the wealthy and status-driven consumption among lower-income groups, while reducing public demand for environmental quality due to power imbalances [14,15,16]. Conversely, in some contexts, a higher GINI may reduce emissions in the environment if the marginal propensity to emit decreases as income rises [17,18]. Implying that wealth concentration often leads to political resistance against environmental regulation, further exacerbating ecological degradation [19,20]. A study by [21] added that GINI and poverty significantly contribute to environmental pollution, with GINI mitigating emissions in high-income countries, but aggravating them in middle-income countries. This proves a point that the impact of GINI varies by country income level, distribution, and population. High-income countries, characterized by significant GINI coefficients, frequently produce more emissions, although in certain poor nations, the relationship may be ambiguous or even inverted [16,22,23]. Beyond emissions, several country ECF studies highlight INST as a pivotal determinant, using panel LIML and related estimators; they opine that positive governance effects improve ECF, suggesting that GINI-environmental imprint likely runs through INST channels too [7].
In sum, GINI is closely related to environmental pressure with outcomes that are context-dependent and nonlinear. While studies suggest that GINI generally increases emissions and ECF, especially in middle-income countries, the relationship can reverse in country-specific contexts. Hence, gaps remain in the context of Nigeria. Therefore, the study employs a new approach in addressing both GINI and environmental sustainability in a specific country context.
2.2. TO and ECF Nexus
While GINI shapes environmental pressure through distributional mechanisms, TO serves as the geographical link between where goods are consumed and the environmental costs of their production. Recent research has shown that one of the factors that influences ECF in an economy is TO. Ref. [24] evaluated the interrelation between TO and ECF in Mexico, Indonesia, Nigeria, and Turkey (MINT) countries from 1961 to 2018. The study found that TO drives ECF positively for Nigeria and Turkey. In global examination, most studies find that TO often increases ECF, especially in emerging and industrialized economies, as greater trade can drive resource use, industrial activity, and environmental degradation [25,26,27]. However, in some cases, regions and under certain conditions, TO can reduce ecological pressure by facilitating access to cleaner technologies and more efficient resource use [28,29,30,31]. Similarly, Ref. [29] emphasized that one main driver of environmental degradation is trade in the study of 31 Organization of Economic Co-operation and Development (OECD) countries over the period of 2007 to 2017. The studies suggested green trade and service to the countries studied. From the studies, we can deduce that TO generally increases the ECF; however, its impact varies by region, governance, and trade composition. Hence, policies that promote green trade, strong environmental regulation, and renewable energy adoption are essential to ensure that TO supports, rather than undermines, environmental sustainability. Most studies on TO and ECF focus on industrialized or emerging economies, often overlooking regional differences, governance quality, and trade composition. Hence, this study addresses that gap by highlighting how TO’s impact on ECF varies across contexts and by emphasizing the role of green trade and environmental regulation in mitigating ecological pressure.
2.3. INST and ECF Nexus
INST, encompassing governance, regulatory effectiveness, transparency, and anti-corruption, plays an important role in shaping the ECF in an economy. Research has demonstrated that INST are linked with environmental degradation. The research by [32] used econometric methods to analyze environmental and economic data, which they collected from developing countries throughout 1984–2017. The research shows that developing nations can protect their environment while achieving sustainable economic development through the establishment of strong INST systems. Similarly, Ref. [33] examined the synergistic impact of green INST and ICT. They proposed that both factors might reduce ECF by 0.0748%, indicating an urgent necessity for actions to address green INST and ICT to alleviate environmental degradation. Several other studies have contributed that high INST leads to lower ECF by enforcing environmental laws, minimizing corruption, enhancing transparency in governance, and supporting sustainable resource management [7,34,35,36,37]. Some other studies further added that effective INST ensures compliance with pollution controls, facilitates the adoption of renewable energy, and fosters accountability in both public and private sectors [34,38]. Dimensions such as transparency and participation are especially influential, with transparency often exercising more impact [7]. New Nigeria relevant studies on INST and sustainability using time-series casualty and structural modeling with uncertainty indices showed heterogeneous effects and underscore policy uncertainty in Nigeria [39]. In a broader perspective, like in SSA, the threshold of INST is above Foreign Direct Investment (FDI) and trade, which have less damaging ECF effect, implying that the stronger INST can mitigate ECF better than FDI and trade in SSA; consistent with the PHH mechanism that is moderated by governance [40]. Thus, the association of ECF and INST has contextual and regional variations. The effect is stronger across diverse settings, including G20, OECD, and BRICS countries; however, the strength of the relationship can differ [36,41,42]. In some cases, the impact is heterogeneous depending on the country level, with a stronger effect in countries like China, Russia, and India [42]. In SSA, the threshold effect manifests only after a specific amount of INST, at which point the ECF commences its fall [41]. The implementation of enhanced INST leads to lower ECF levels because it enhances governance systems, which enable better environmental policy execution and promote operational transparency. The system achieves its highest impact when INST demonstrates enough strength to protect both economic growth and patterns of energy consumption. The establishment of specific policy changes becomes necessary to enhance INST frameworks that protect environmental sustainability.
Although numerous studies link INST to lower ECF, most focus on global or large economies, leaving limited evidence on regional thresholds, heterogeneity, and policy effectiveness in Sub-Saharan Africa (SSA) and countries like Nigeria. Thus, we address the gap by emphasizing how INST’s impact on ECF varies across contexts and becomes significant only beyond certain governance thresholds, highlighting the role of targeted policy interventions.
2.4. POPd and ECF Nexus
The influence of POPd on the ECF varies significantly across nations and circumstances. Research studies show that population density creates environmental stress, but multiple investigations demonstrate that the relationship between density and environmental stress depends on economic systems, urban planning, and resource distribution methods. Multiple developing and industrializing nations have large populations, leading to larger ecological footprints because their growth requires additional resources, which generate more pollution and require better infrastructure. This pattern appears in regions that experience rapid urban growth and industrial development because of insufficient environmental protection regulations. A South Asian research study analyzed ECF and POPd data from 1971 to 2019 through panel ARDL methods to show that POPd creates positive effects on ECF in the long run. The research conducted by [43] studied ten leading countries based on population size, which included Nigeria, through analysis of their economic data from 1990 to 2020 using Panel ARDL and MMQR methods. The findings highlighted that POPd adversely affects environmental quality by elevating EC.F. The outcomes are close to those of [44], which suggests that POPs had adverse effects on ECF in the long term throughout the Asia Pacific nations. Although the aforementioned literature identified significant detrimental effects of high POPd on ECF, including in Nigeria, other studies, particularly within OECD and certain Asian nations, indicated that elevated POPd may enhance ECF, potentially attributable to more efficient infrastructure, resource sharing, and denser urban living [45,46,47,48,49]. Several other analyses report an inverted U-shaped relationship, where ECF rises with density up to a threshold, then declines as density enables efficiencies and better environmental management [50,51]. Lastly, distribution-aware work, using WQC techniques tailored to Nigeria and applying data from 1961 to 2020, found that urbanization (POPd) can lower ECF in the short and medium term, however, raise it in the long run, reflecting transitional efficiency gains followed by congestion effects [52]. Therefore, POPD’s impact on the ECF is context-dependent: it can intensify environmental pressure in rapidly growing or weak institution regions, hence, may reduce it where urban planning, technology, and policy support sustainable living. Effective management and infrastructure are key factors to turning POPd into an environmental asset rather than a liability. Conversely, the Gaps in the literature and the studies’ contributions are explained as follows: Prior research establishes that POPd affects ECF, most studies overlook the context-dependent nuances, such as thresholds, urban planning quality, and regional governance, especially in African countries like Nigeria. This study addresses the gap by highlighting how POPd’s impact on ECF varies across time, regions, and institutional settings, emphasizing transitional effects and the conditions under which density can either exacerbate or mitigate environmental pressure. By integrating these dynamics, it provides a more comprehensive understanding of population-driven environmental impacts and policy implications for sustainable urban management.
While several studies have examined the GINI and environmental pollution effects using linear models, Ref. [2] motivated nonlinearity in the subject, hence, this study extends this to QQR and WQC methods on Nigeria’s ECF, incorporating GINI, TO, POPd, and INST, an angle that Nigerian literature has been missing. Additionally, Studies have shown that TO. is frequently associated with higher ECF in Nigeria and peers, especially at higher quantiles, unless offset by strong institutions and cleaner techniques [24]. Yet some studies suggested the INST generally improves sustainability in panel ECF studies [7], however, Nigeria-specific evidence on distribution-aware governance effects remains thin. On Demography, urbanization effects are horizon and dependent, with long-term pressure outweighing the short-run efficiency in Nigeria [52]. Thus, the study ignores the role of GINI, INST, and TO in moderating the effect. Lastly, SSA panel evidence ties GINI to higher emissions (moderated by institutions and finance) [4], yet Nigeria-specific studies rarely model GINI and ECF with QQC and WQC.
Hence, this study fills the above gaps by examining the distribution and horizon-sensitive analysis of GINI and ECF, with interactions through TO, INST, and POPd, estimated with QQR and WQC in the Nigerian-specific context—a model not yet established in the Nigerian literature. Although previous studies have attempted to address these relationships. There are three important gaps in the previous literature, which form the contribution of this paper. First, most previous studies have used CO2 emissions, which represent a partial measure of environmental degradation and ignore other dimensions of environmental resource demand. Second, most previous studies have used linear and conventional quantile approaches, which provide limited information about the joint distributional effects of explanatory variables on environmental degradation. Finally, most previous studies have yielded scattered results for Nigeria, an important country in terms of demographic, institutional, and trade transformations. This study extends previous literature by using ecological footprint as a holistic measure of sustainability and introducing Quantile-on-Quantile Regression and Wavelet Quantile Correlation to examine regime-dependent and time-frequency heterogeneity in the inequality and environmental degradation relationship.
3. Data and Methodology
This study adopts a quantitative, time-series research design that integrates multiple theoretical perspectives to explain how income inequality, institutional quality, trade in services, and demographic pressure jointly shape Nigeria’s ecological footprint. The study collected data specifically for the above variable from 1960 to 2024 from various secondary data sources. Table 2 below shows the data sources and measurements. The ECF variable represents Nigeria’s total ecological footprint of consumption measured in global hectares (EFConsTotGHA). It is obtained from the Global Footprint Network and reflects aggregate national ecological demand rather than per capita footprint. To ensure consistency, all data were drawn from internationally harmonized sources that employ standardized definitions and backward series data reconstruction techniques. Although initial results, especially those from before 1980, may be influenced by the limited statistical resources common to developing economies, it is recognized that the respective data sources attempt backward revisions and methodological harmonization to improve temporal comparability. Nevertheless, it is recognized that Nigeria has experienced significant economic and policy transformations, including structural adjustment and institutional reform, and thus, a possibility for structural regime changes is conceded. Hence, the nonlinear QQR and WQC methodologies used in this study are advantageous in this regard, as they are less dependent on constant parameter assumptions and can accommodate distribution-sensitive and time-frequency dynamics.
Table 2.
Variable sources.
Three interlinked theoretical foundations guide the methodological choices of the variables
- First, the PEE framework [12,56] which argues that unequal societies experience greater environmental degradation because powerful economic groups externalize ecological costs onto poorer communities, weakening environmental protection. This framework supports the inclusion of GINI as a primary explanatory variable and INST as a moderator in the study. GINI influences the environment through political capture and unequal exposure to ecological risk. In this environment, regulation may be weakened where economic elites exert policy influence disproportionately. Thus, in a low ecological pressure, GINI may exert limited observable environmental consequences. However, under high ecological conditions, distributive may intensify environmental degradation through weak regulations and overexploitation of resources.
- Second, the EKC hypothesis [13], which contends that environmental pressure rises in early development and later declines as structural transformation, cleaner technologies, and stronger institutions emerge. Furthermore, structural dynamics of the EKC hypothesis emphasize that demographic pressure, consumption intensity, and openness can shift the environmental turning point. The framework aligns with the regressed variable (ECF), which emphasizes broader environmental pressure rather than a single pollutant. ECF incorporates carbon uptake, cropland, grazing land, forestland, fishing ground, and built-up area, which fully capture structural environmental stress as economies evolve. The EKC also explains how environmental pressure evolves through structural changes, urbanization, and economic expansion, forming the ground for inclusion of POPd. The EKC hypothesis describes a nonlinear relationship between economic development and environmental degradation, which has been traditionally modeled by an inverted-U curve. Nevertheless, the EKC model implicitly assumes transitions between regimes in terms of environmental performance as a result of changes in structural conditions. Instead of imposing a quadratic form on the model, this paper follows the EKC logic in a more flexible way: Environmental responses can vary depending on the conditional distribution of environmental pressure itself.
- Third, the PHH [11,57], a framework that suggests that weak environmental regulations in developing countries attract pollution-intensive activities, especially through trade and investment flows. In Nigeria’s context, trade in services is growing; thus, weak enforcement structures may allow environmentally harmful activities to occur through digital infrastructure, logistics, and service-related energy consumption activities. Hence, it justifies the inclusion of TO in the model. Although trade openness can facilitate cleaner technologies and efficiency effects, it can also sustain environmentally intensive production structures in the absence of institutional oversight. Therefore, the environmental effects of trade openness depend on the governance capacity. The conditionality of environmental effects suggests that trade openness can have asymmetric effects on different environmental regimes and over time.
These frameworks collectively imply a multidirectional, nonlinear, and time-varying relationship between the variables. Therefore, a methodological approach capable of detecting heterogeneity across pollution levels, inequality regimes, and temporal frequencies is essential.
Given the theoretical and empirical justification for the variables and taken together, the integrated framework predicts that the determinants of ECF are inherently nonlinear and distribution sensitive. Average-based estimators may mask these asymmetries by imposing homogeneous effects across ecological states. Thus, this study employs two complementary nonlinear estimation methods (QQR and WQC). The QQR estimation is conducted over quantile grids τ, θ ∈ {0.1, 0.2, …, 0.9}. Separate bivariate QQR models are estimated for each explanatory variable in relation to ECF, rather than a multivariate QQR specification. This approach allows clear visualization of distributional asymmetries across ecological regimes. QQR demonstrates how various quantiles of regressors impact different quantiles of the dependent variable. The research uses these methods instead of traditional mean-based estimation techniques, which include Ordinary Least Squares (OLS), ARDL, and Vector Autoregression (VAR), because these models fail to account for the complete range of environmental outcome distributions. Since ECF behavior differs widely across low and high-pollution regimes, and GINI does not exert identical effects at all levels. The QQR captures these varying GINI effects on environmental pressure. The model (QQR) is applied separately for each explanatory variable in relation to ECF. Each estimation presents a bivariate quantile-on-quantile association and concludes with a joint presentation of the QQR outcomes. These separate estimations are integrated in the discussion to assess their relative magnitudes and distributional heterogeneity. Thus, the QQR aligns with PEE, EKC, and PHH simultaneously. It is important to state the difference between Quantile Regression (QR) and QQR. QR estimates the relationship between a response variable and one or more predictor variables at specific quantiles, while QQR compares the distribution of two variables. It plots the quantiles of one variable against the quantiles of another variable. Conversely, WQC decomposes the dependence between variables across time and frequency bands while allowing quantile variation. The WQC implementation employs Short-, medium-, and long-run scales corresponding approximately to 2–4 years, 4–8 years, and 8+ years, respectively. This dual quantile structure is where environmental and socioeconomic variables exhibit non-uniform behavior.
The QQR model is expressed as:
where denotes the Quantile of the explained variable. GINIθ,t, TOθ,t, POPdθ,t, and INSTθ,t denote the Quantile of the explanatory variables. The WQC between variables at scale s and quantile is stated as:
where W is the wavelet transform. S denotes scales (short run; long run) and denotes quantile. The above approaches are directly in the theoretical logic of environmental inequality, institutional capacity, trade dynamics, and demographic stress.
4. Results and Discussion
4.1. Descriptive Statistics
The descriptive statistics in Table 3 above indicate considerable heterogeneity among the research variables. The ECF shows a large average value of 107.9 million while its standard deviation reaches 50.7 million, which indicates major changes in environmental pressure throughout the period. The population density of POPd shows major fluctuations (Range = 200) because the area continues to experience growing numbers of people who live in close proximity to each other. The INST shows relative stability because its values stay within a small range (0.37) while its coefficient variation remains low, which indicates that institutional frameworks remain stable with no significant governance improvements during the entire period. The GINI index shows an average value of 46.6, which indicates that social inequality exists at a moderate level but shows no signs of decline. The TO index shows a middle value of 5.4 while its data points spread out widely (Coefficient of Variation = 0.46), which might suggest periodic changes in economic openness or new trade policy approaches.
Table 3.
Descriptive Statistics values.
4.2. ADF Unit Root Test
Table 4 illustrates that the Augmented Dickey–Fuller (ADF) test findings reveal that the majority of variables are non-stationary in their initial state. Specifically, ECF and GINI do not reject the null hypothesis across all specifications (none, drift, and trend), so affirming the presence of unit roots and indicating that these series are I (1). The model achieves stability when researchers add both trend and drift components to the system because these deterministic elements represent the mean-reverting behavior, which occurs throughout time. The “none” specification shows POPd remains stationary by itself, but INST requires the drift model to achieve stationarity, which indicates its stability level is between its mean and other values. Although the ADF results indicate a mixture of I (0) and I (1) processes, this does not invalidate the nonlinear framework adopted in this study. Unlike conventional linear regression models that require strict cointegration conditions to avoid spurious inference in levels, QQR is a semi-parametric, distribution-based estimator that examines conditional quantile relationships rather than relying on constant-parameter mean dynamics. As such, it is less sensitive to integration order provided that variables are not integrated beyond I (1). Similarly, WQC decomposes relationships across time-frequency scales, allowing short-, medium-, and long-run co-movements to be assessed without imposing a single long-run equilibrium constraint. Consequently, the mixed integration structure does not compromise the validity of the nonlinear estimations.
Table 4.
Augmented Dickey–Fuller (ADF) Unit Root Test Results.
4.3. BDS Test
The BDS test results in Table 5 show that linearity is rejected for most variables, which indicates ECF, GINI, TO, and POPd follow nonlinear patterns throughout all dimensions and neighborhoods. The studied variables show complex patterns of interaction between them, and possible breaks in their structure, and random, unpredictable patterns. The INST model shows partial nonlinearity only in its lower dimensions and when ε is reduced, which results in a smooth transition pattern. The results show that ECF, GINI, TO, and POPd exhibit strong non-linear relationships, but INST shows only partial non-linearity, which limits the effectiveness of linear modeling approaches. The analysis requires nonparametric methods, which include QQR and WQC, to study how variable relationships change through time and between different quantile levels and domain areas.
Table 5.
Results of the Brock–Dechert–Scheinkman (BDS) Nonlinearity Test.
4.4. QQ Analysis
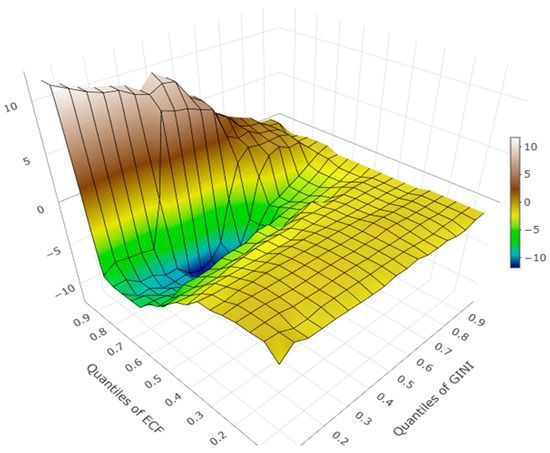
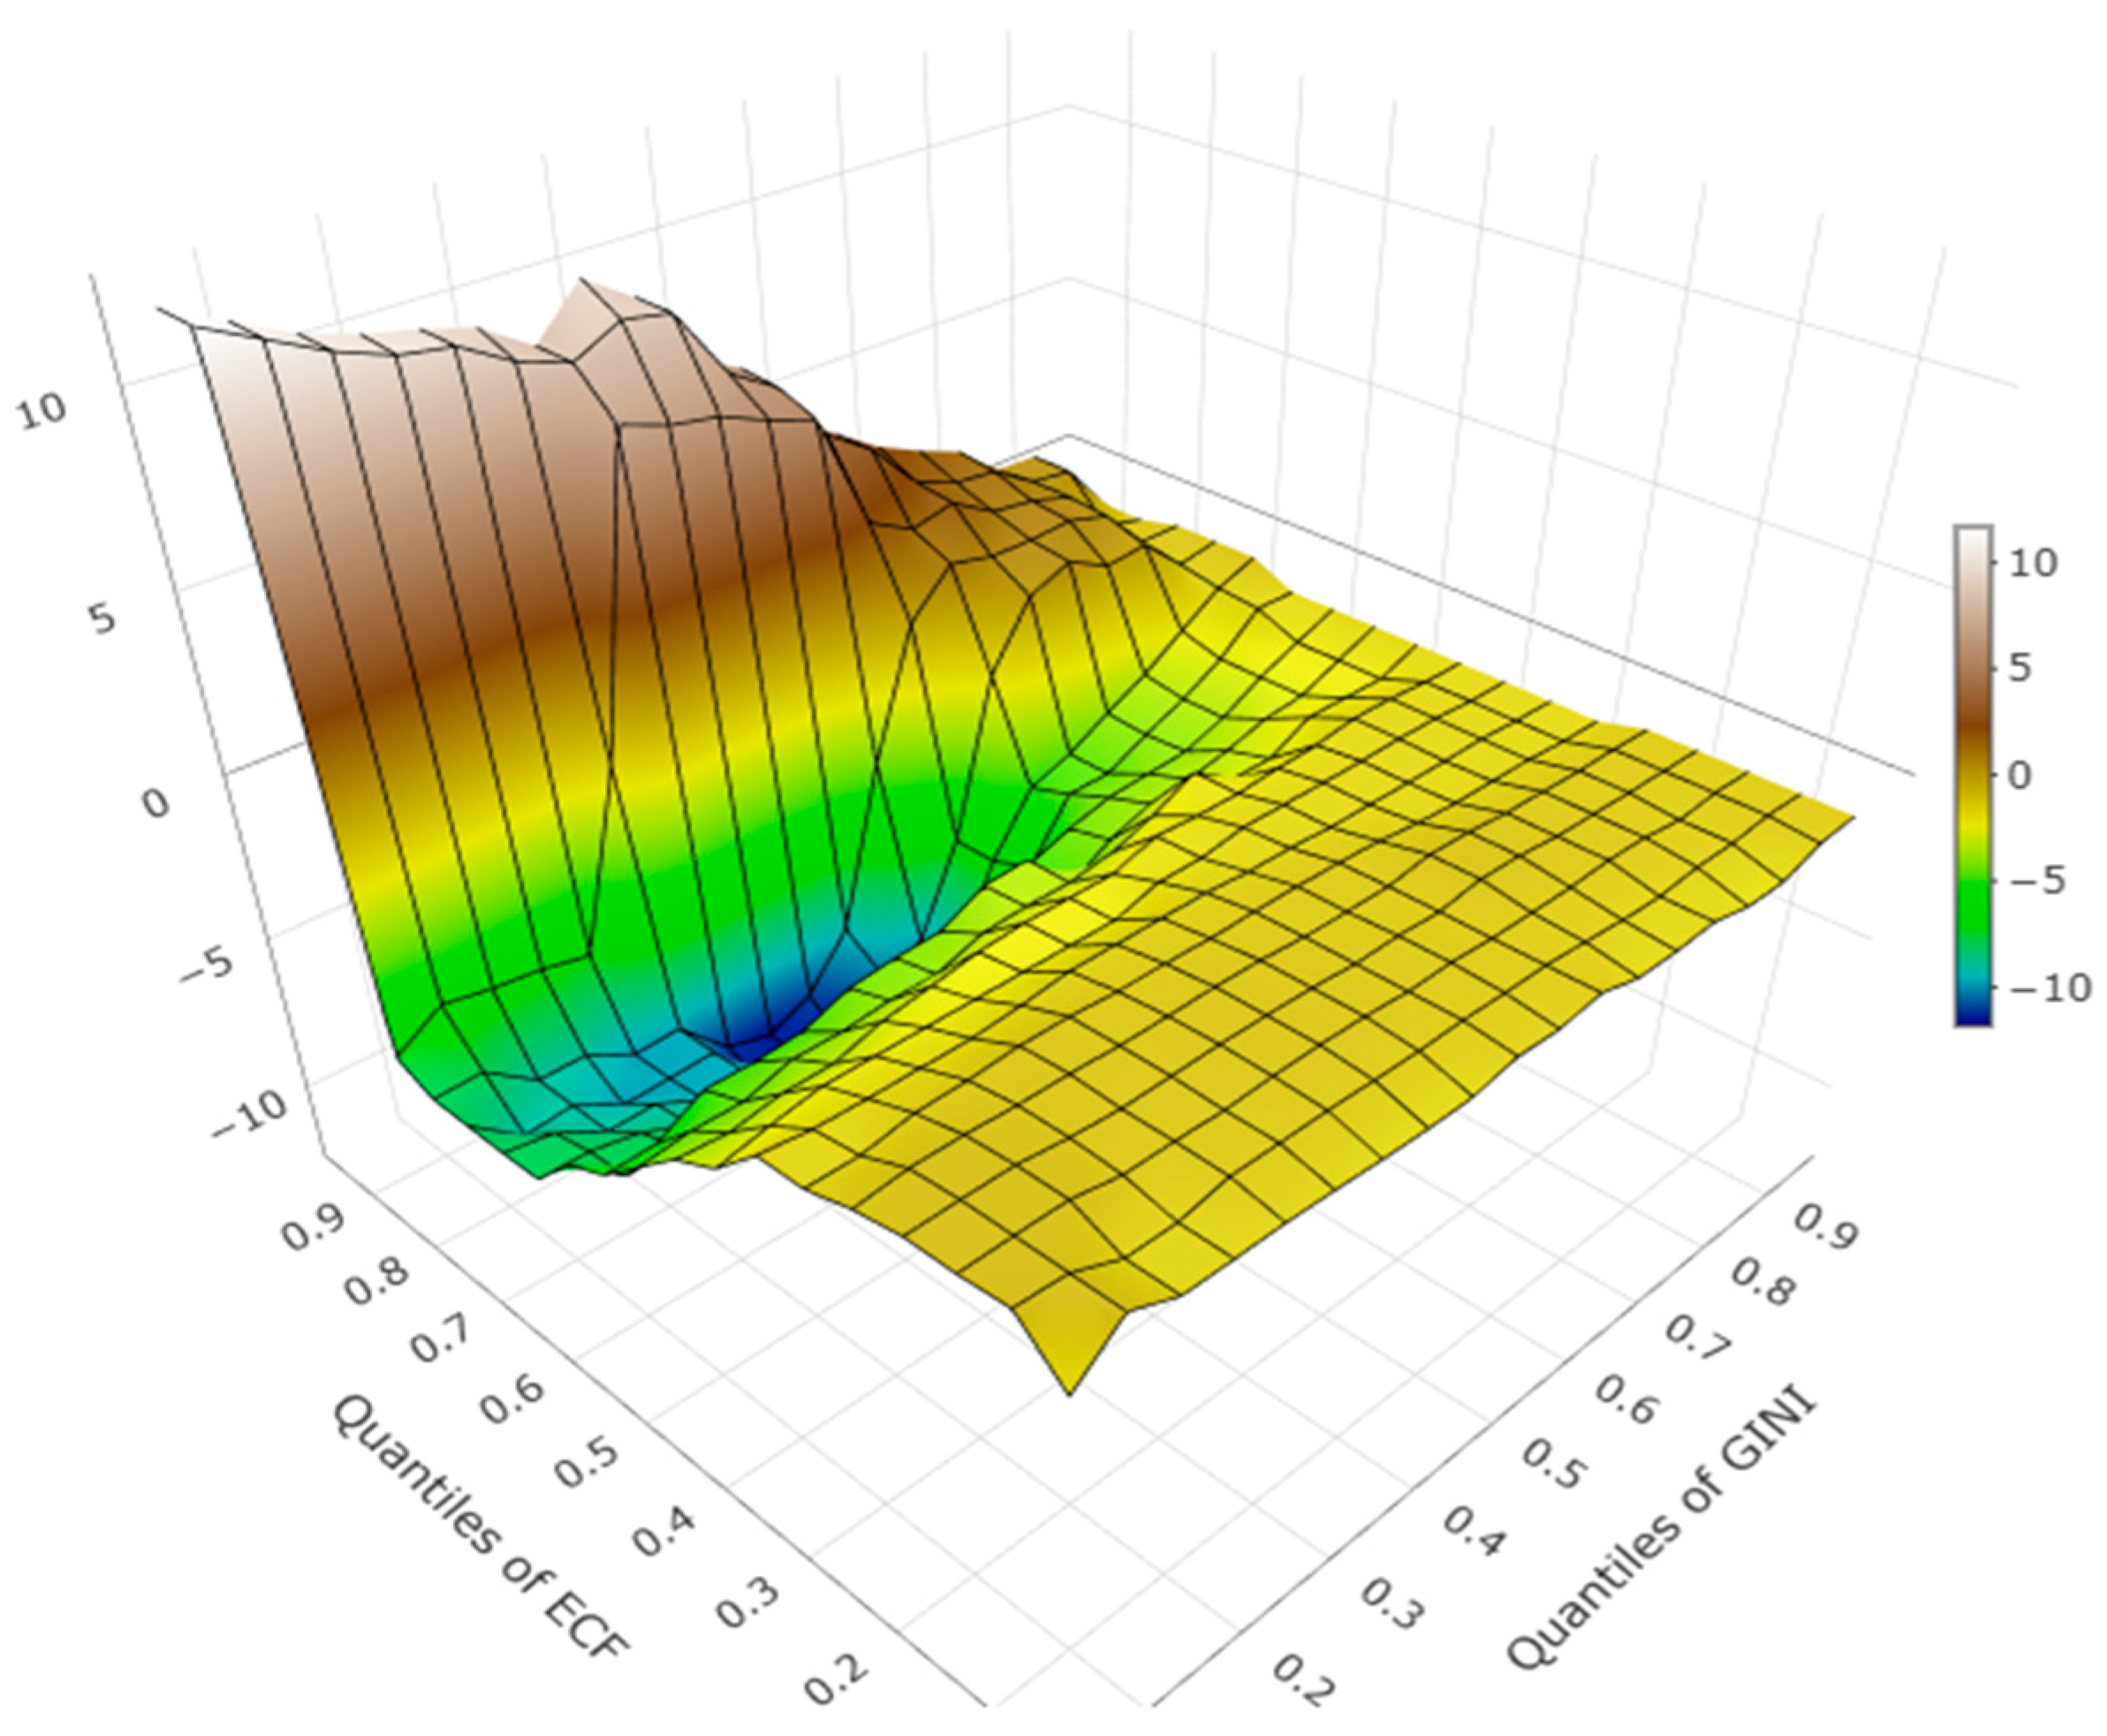
The QQR surface in Figure 1 illustrates the relationship between the ECF and GINI outcomes. Significant differences were observed across three quantile groups: low (0.1–0.3), medium (0.4–0.6), and high (0.7–0.9). In the lower GINI quantiles (0.1–0.3), there was no significant impact on environmental degradation, suggesting that minor income inequality does not affect the ECF. The medium quantiles (0.4–0.6) showed a slight negative relationship, indicating that moderate inequality might slightly improve ecological outcomes due to better resource distribution. However, in the higher quantiles (0.7–0.9), a steep upward trend indicated significant increases in ecological footprints due to income inequality. The effects of GINI on the ECF were asymmetric, with no effect on the lower quantiles, slight negative slopes in the middle, and substantial positive effects in the higher quantiles, indicating that environmental stress worsens with increased inequality.
Figure 1.
QQR between GINI and ECF.
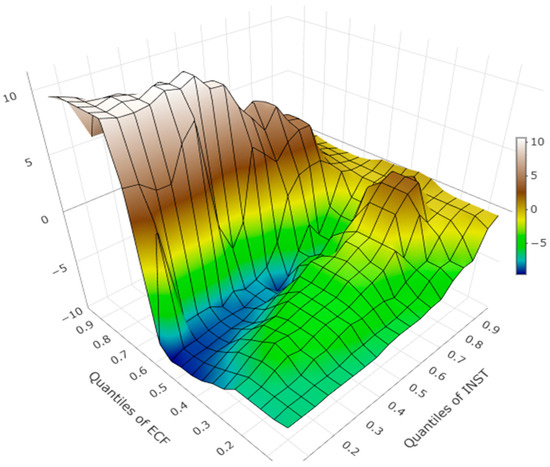
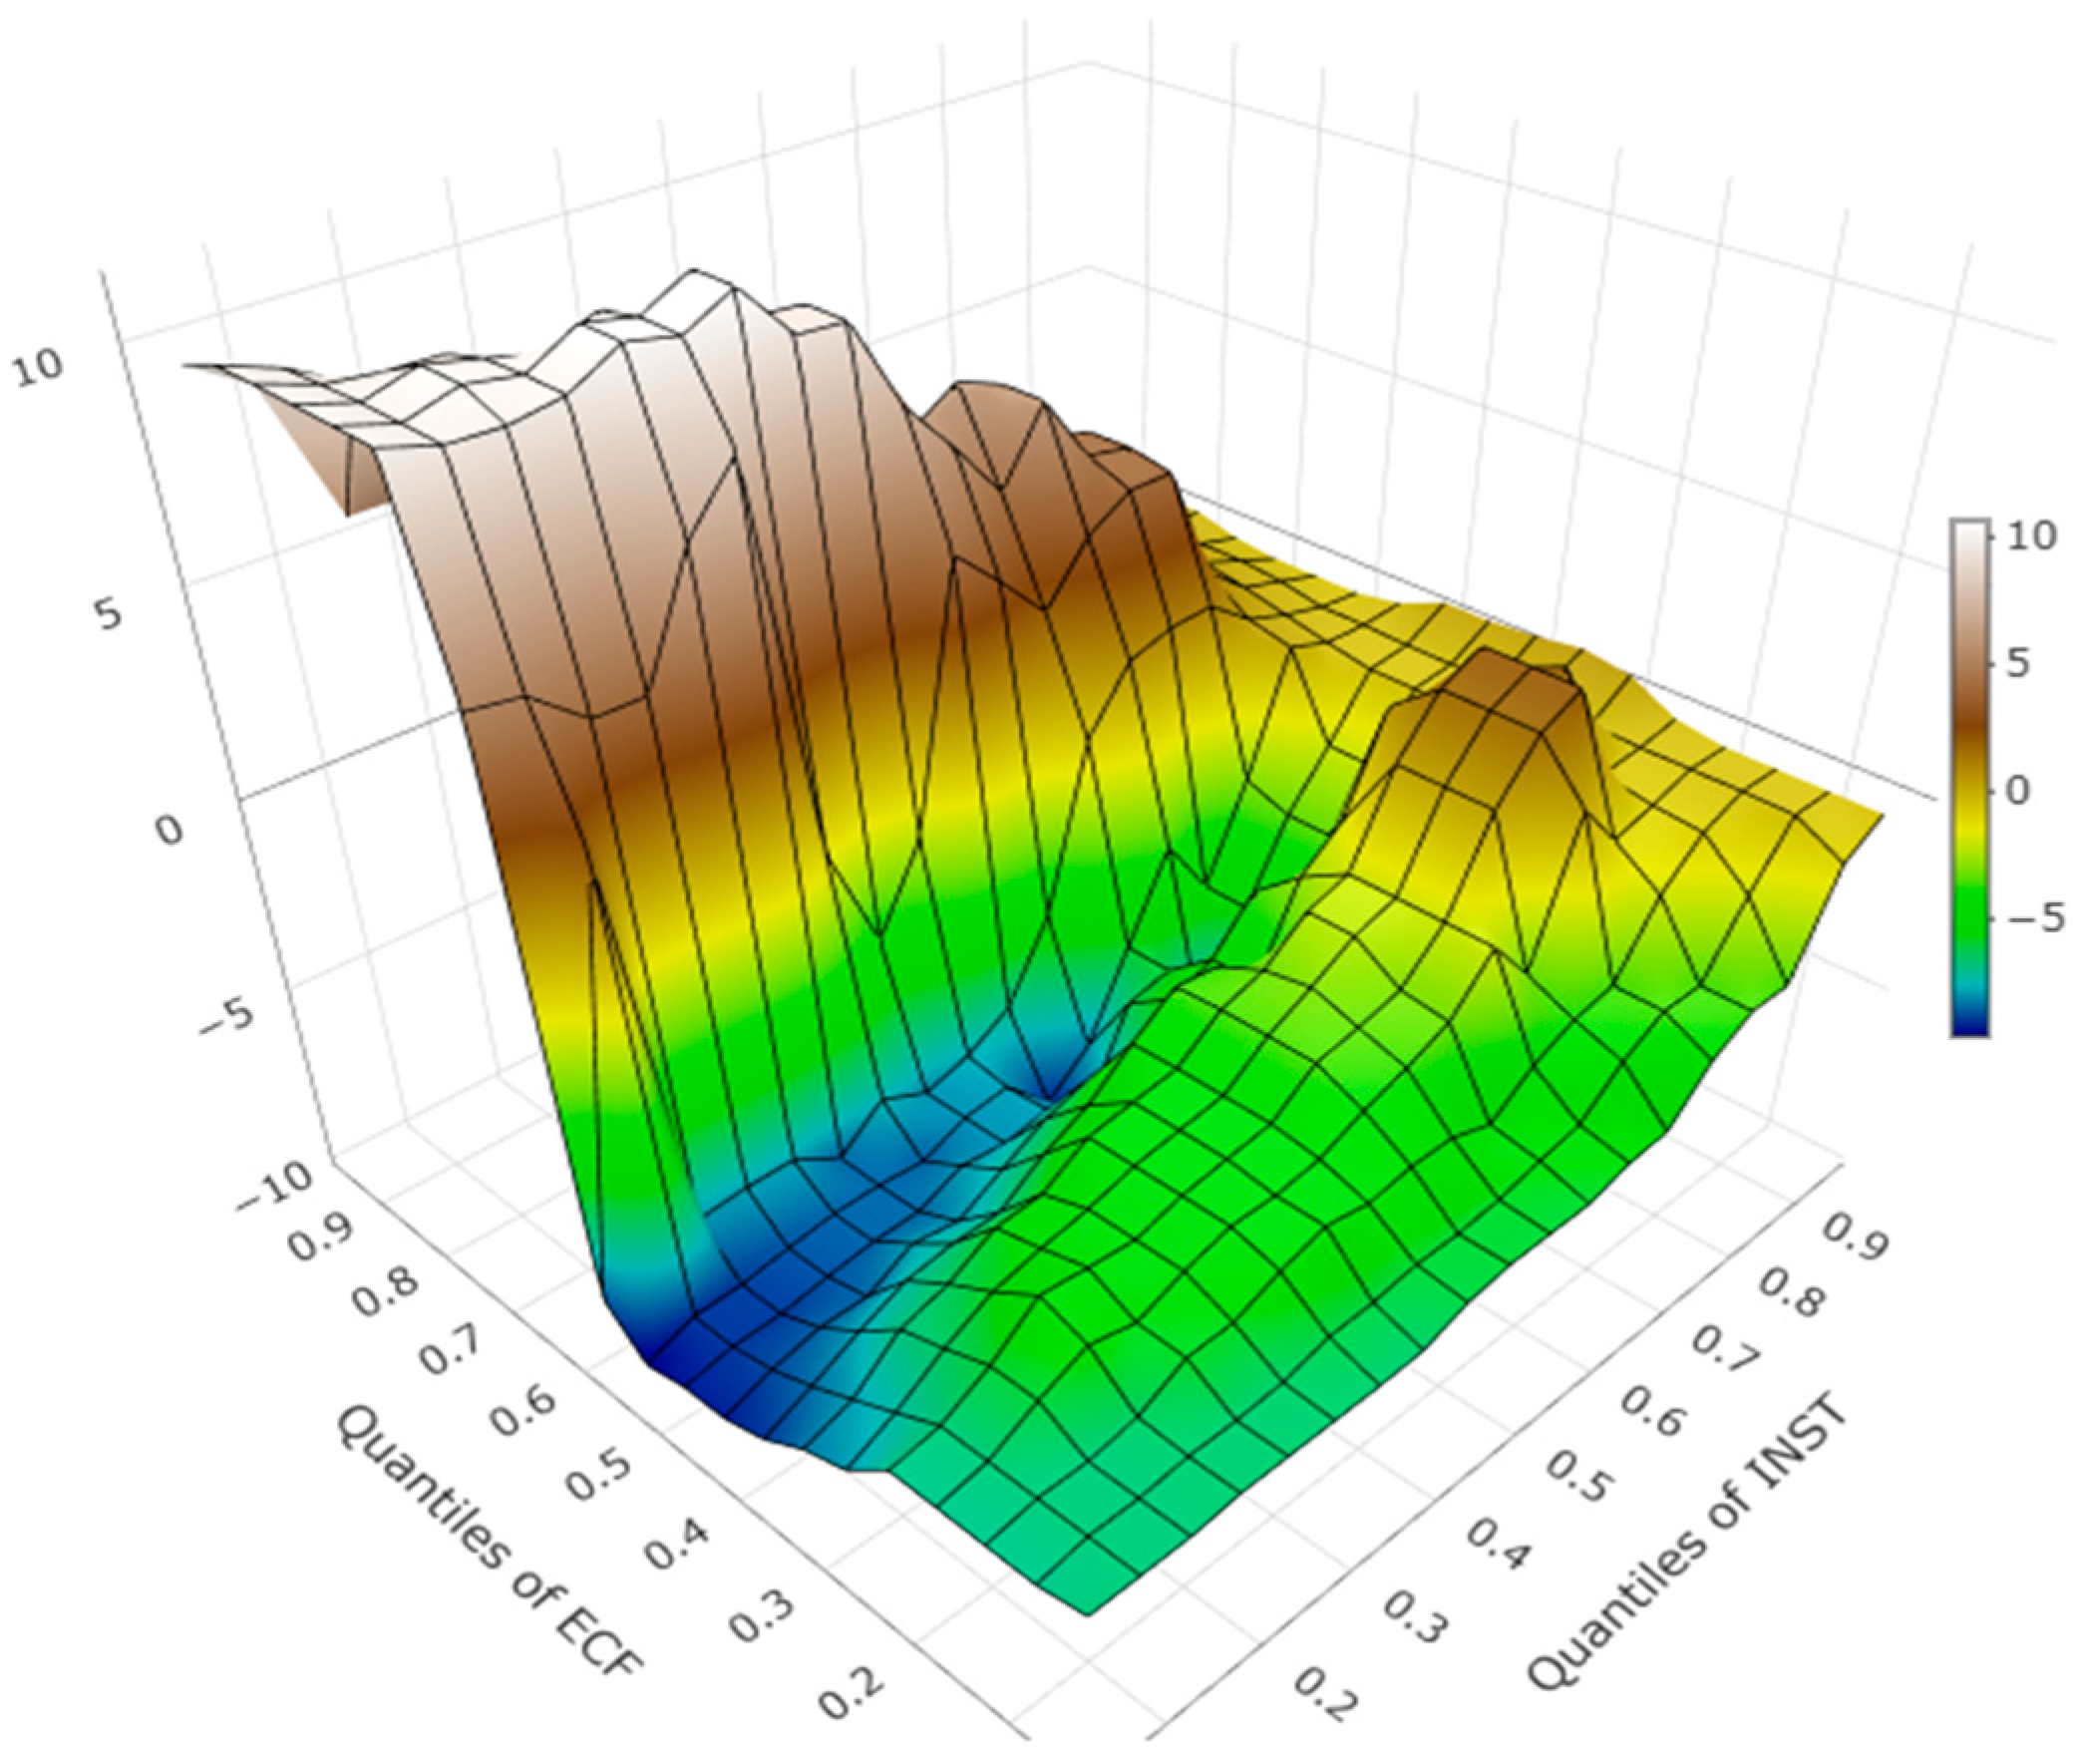
The relationship between the ecological footprint (ECF) and institutional quality (INST), as shown in Figure 2, is nonlinear. At lower quantiles of INST, weak governance leads to environmental degradation and unsustainable resource management. This weak institutional framework results in significant ecological pressures and reduced sustainability. Conversely, at high levels of INST, there is a strong positive correlation with sustainable ecological outcomes, as efficient institutions promote effective environmental regulations and responsible leadership. In median quantiles, no relationship is observed, indicating that improvements in institutional quality may yield environmental benefits in the future.
Figure 2.
QQR between INST and ECF.
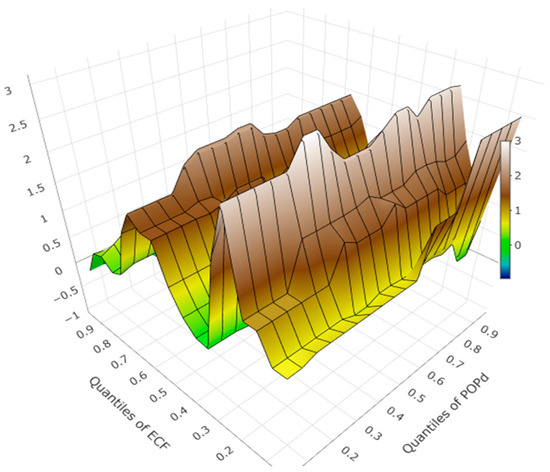
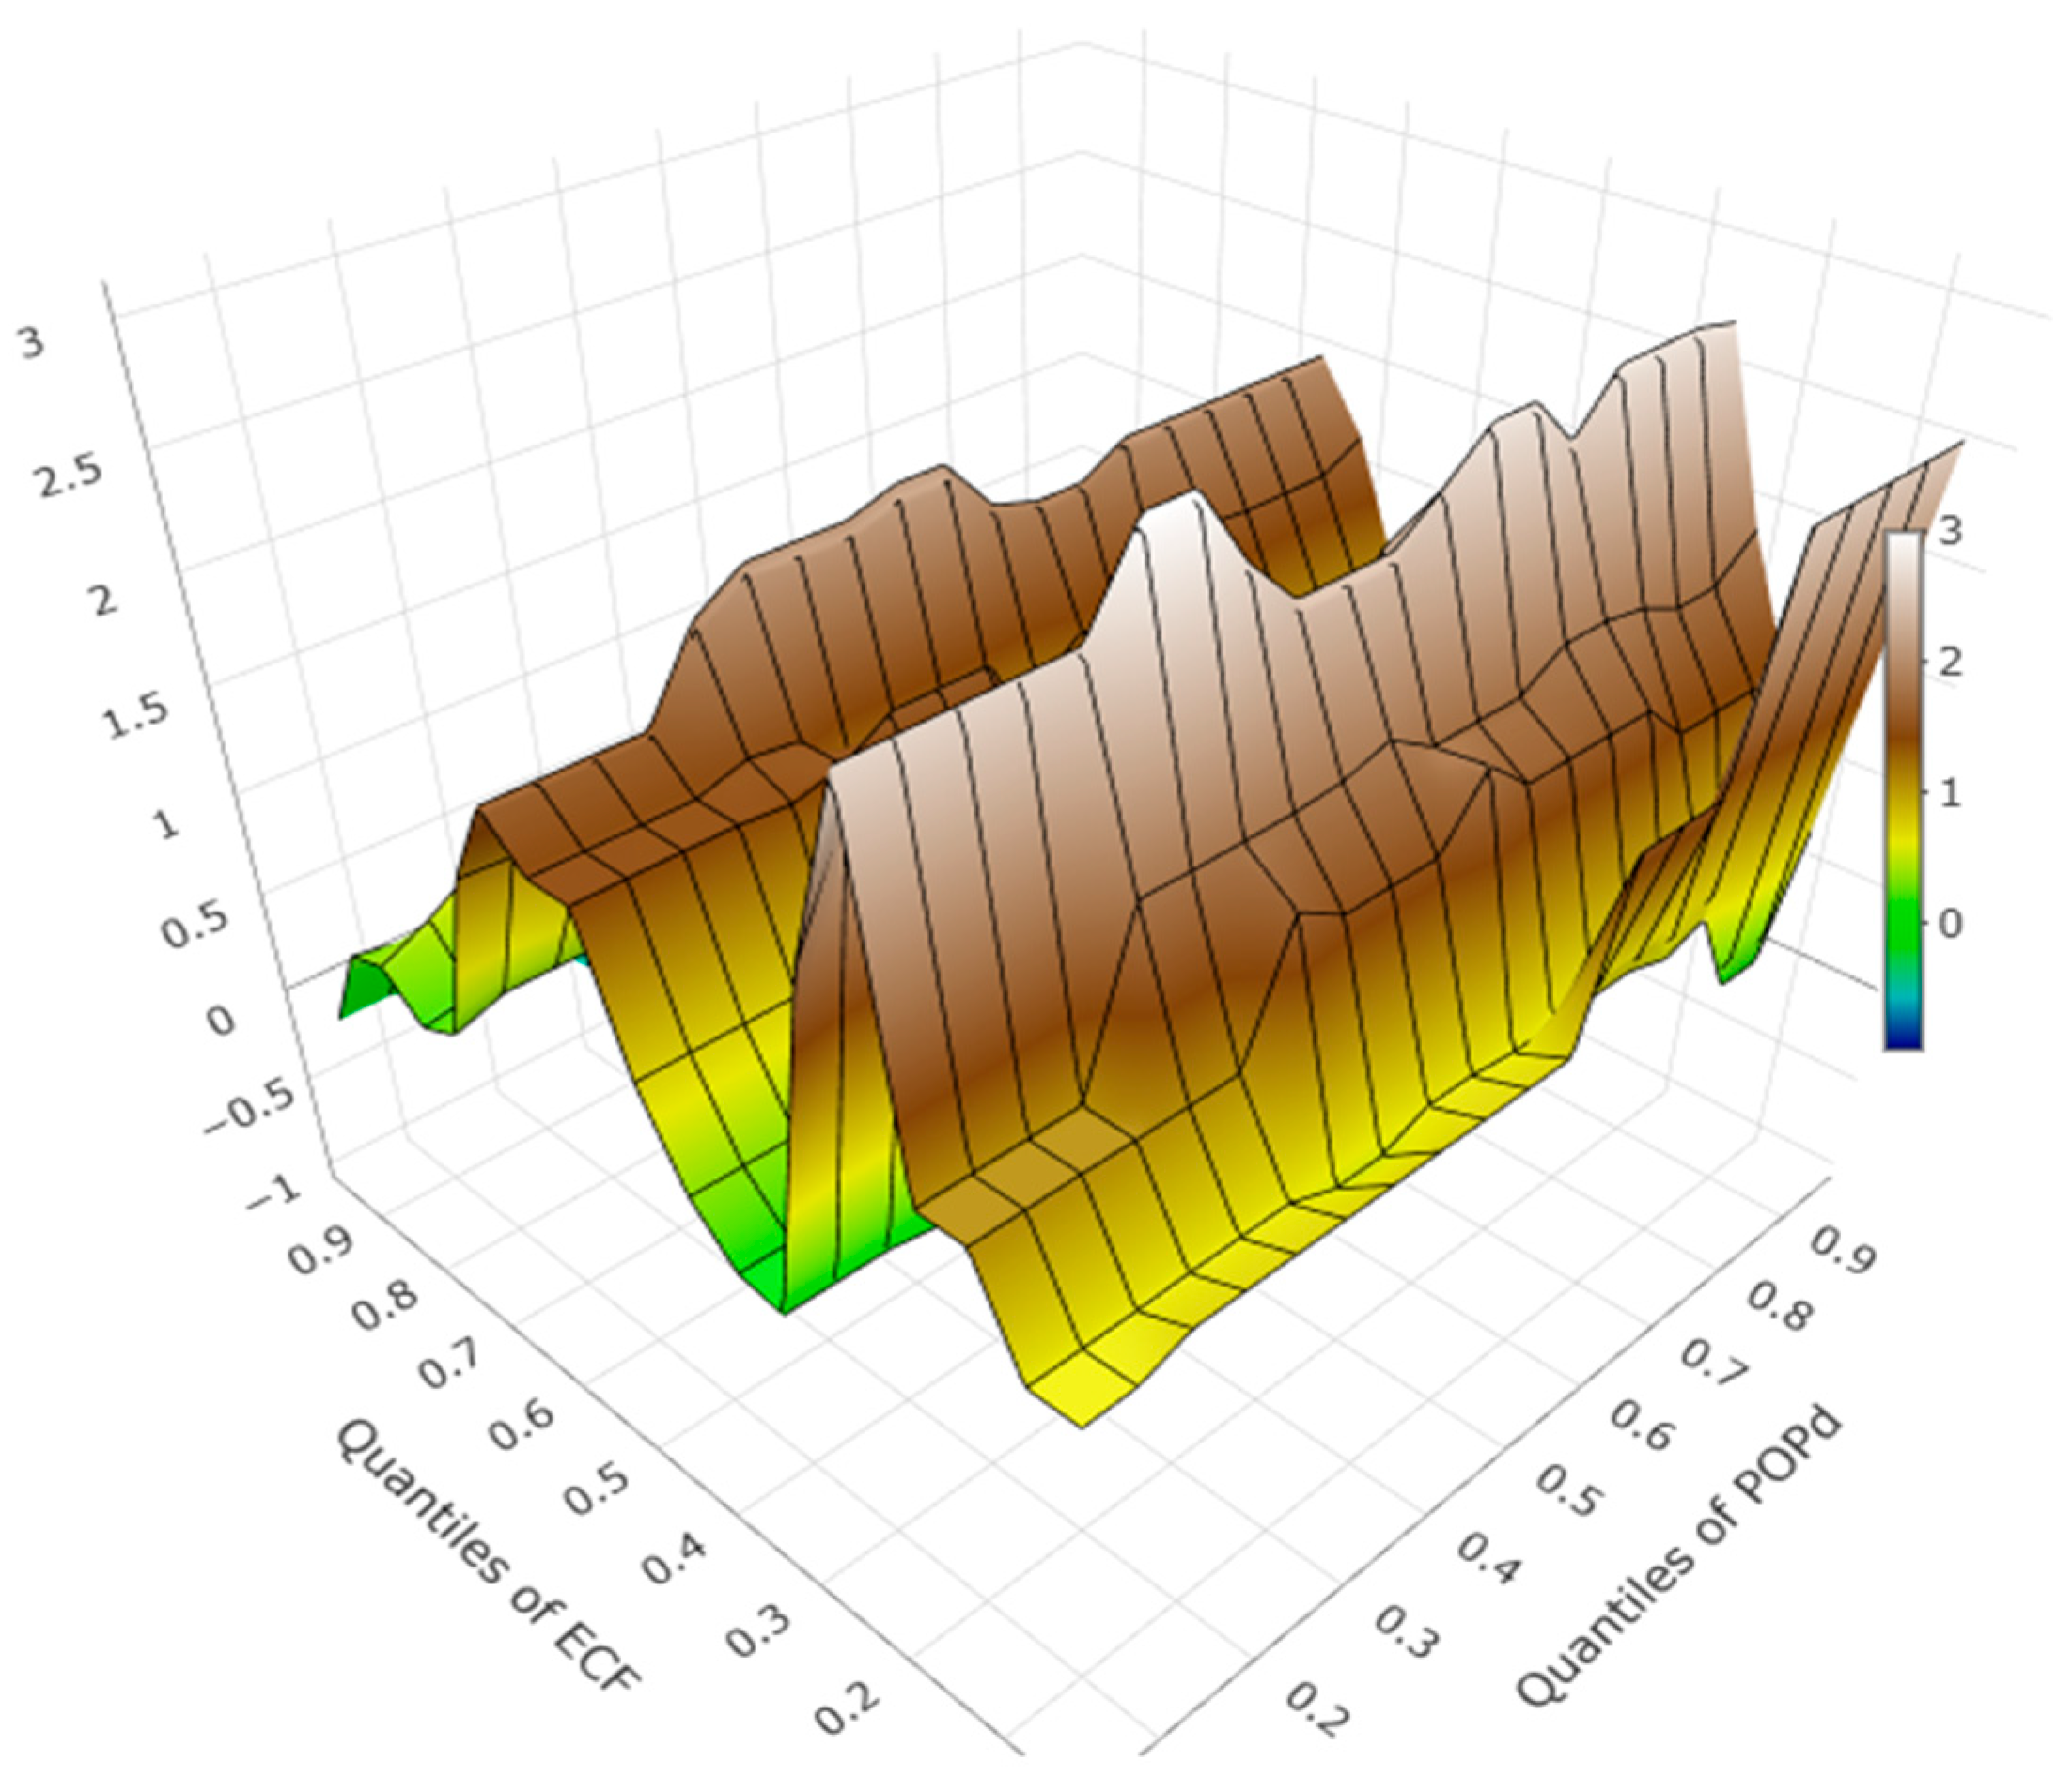
Figure 3 shows an uneven distribution across quantiles. In sparsely populated areas, the ecological footprint is minimal or slightly inverse, indicating little environmental impact from human activities. Reduced industrialization, energy use, and land management support sustainable conditions. Lower quantiles show small changes, suggesting that minor density increases cause specific environmental effects from new infrastructure and resource extraction. The ECF correlates positively with population density at higher levels, meaning environmental pressures intensify as density rises. Urbanization, economic activity, and resource use combine to increase ecological pressure. Middle quantiles show moderate changes from population growth that remain below levels causing significant damage.
Figure 3.
QQR between POPd and ECF.
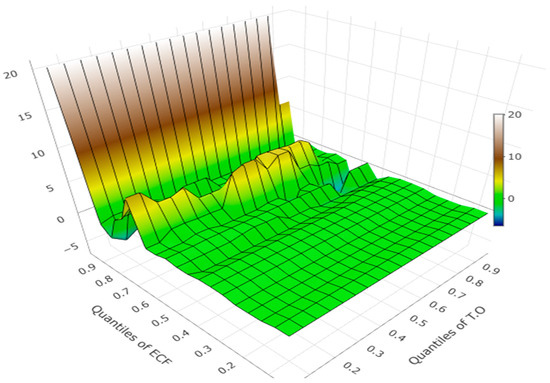
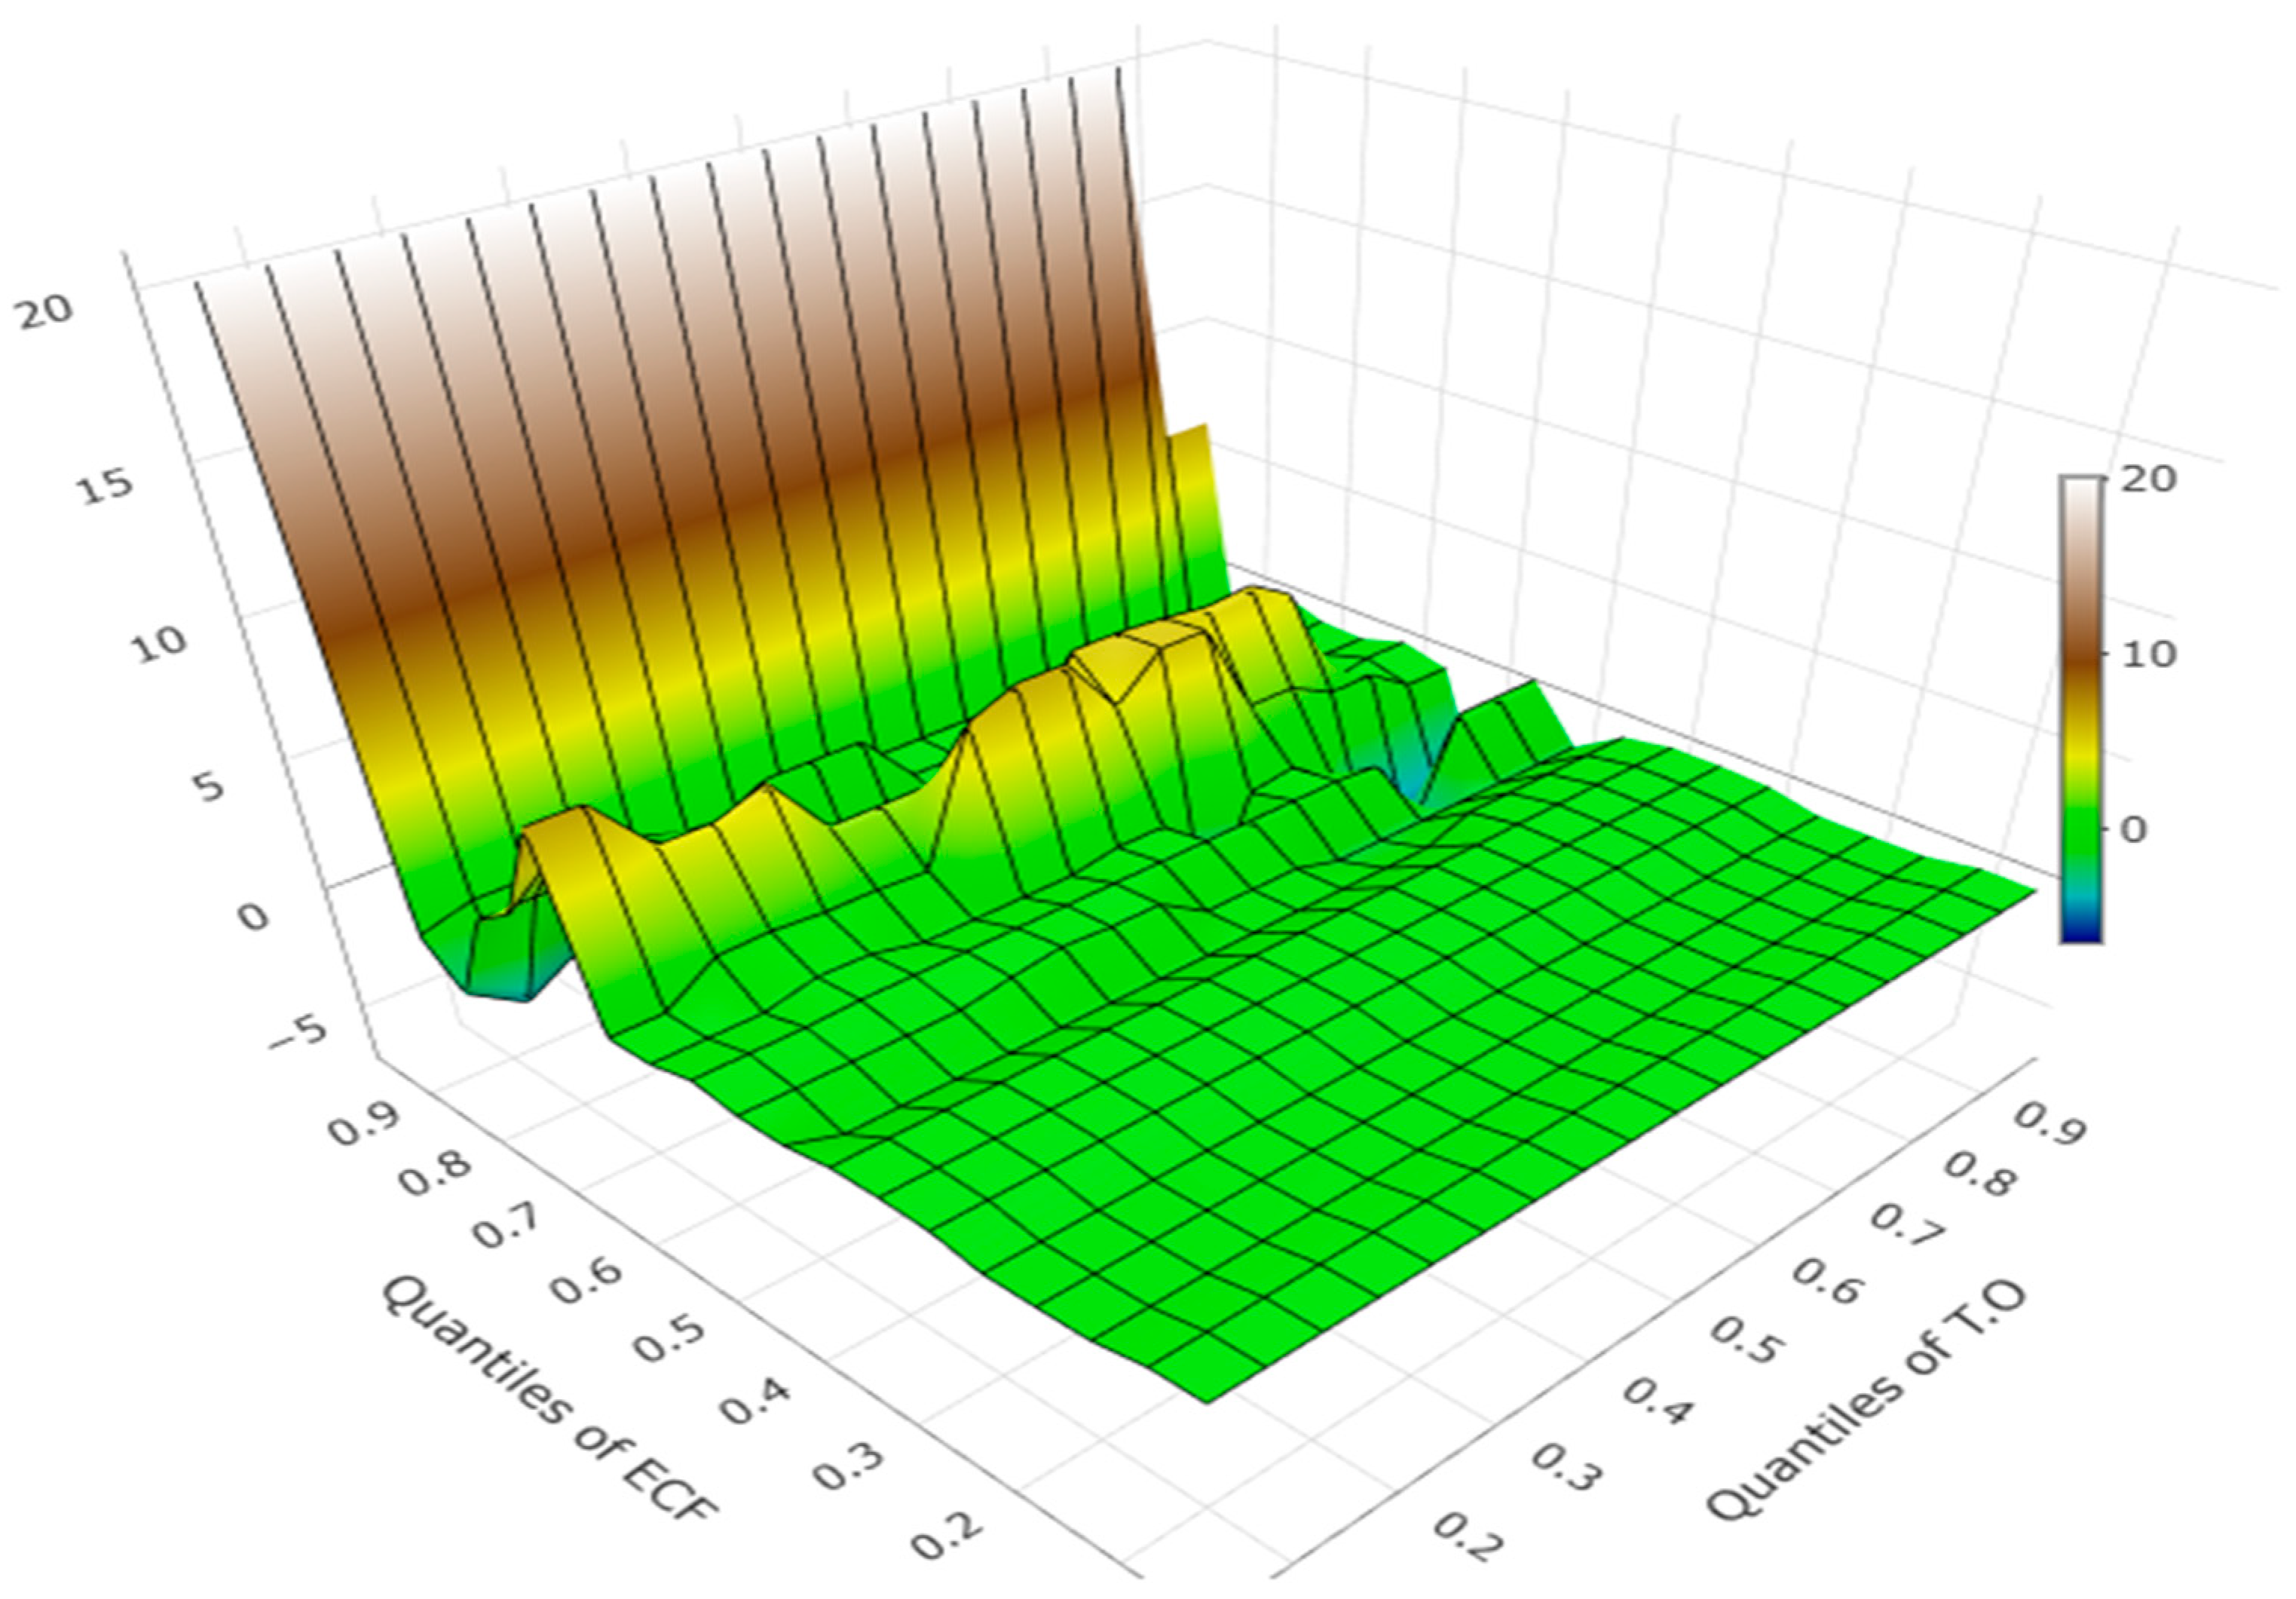
Figure 4’s QQR estimation shows a highly asymmetric, nonlinear link across quantiles for ECF and TO. ECF remains zero at the lowest TO, as limited-service trade causes minimal environmental damage, possibly due to reliance on less resource-intensive industries. Small increases in ECF suggest that minor trade growth can impact the environment through transportation and infrastructure. Upper quantiles of service trade correlate with sharply rising ecological footprints, driven by digital development, transportation, and power use. Median quantiles show minor changes, indicating service trade begins to affect ecosystems but has not caused major environmental issues.
Figure 4.
QQR between TO and ECF.
4.5. Comparative QQR Effects
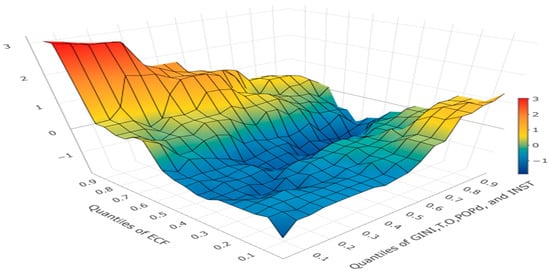
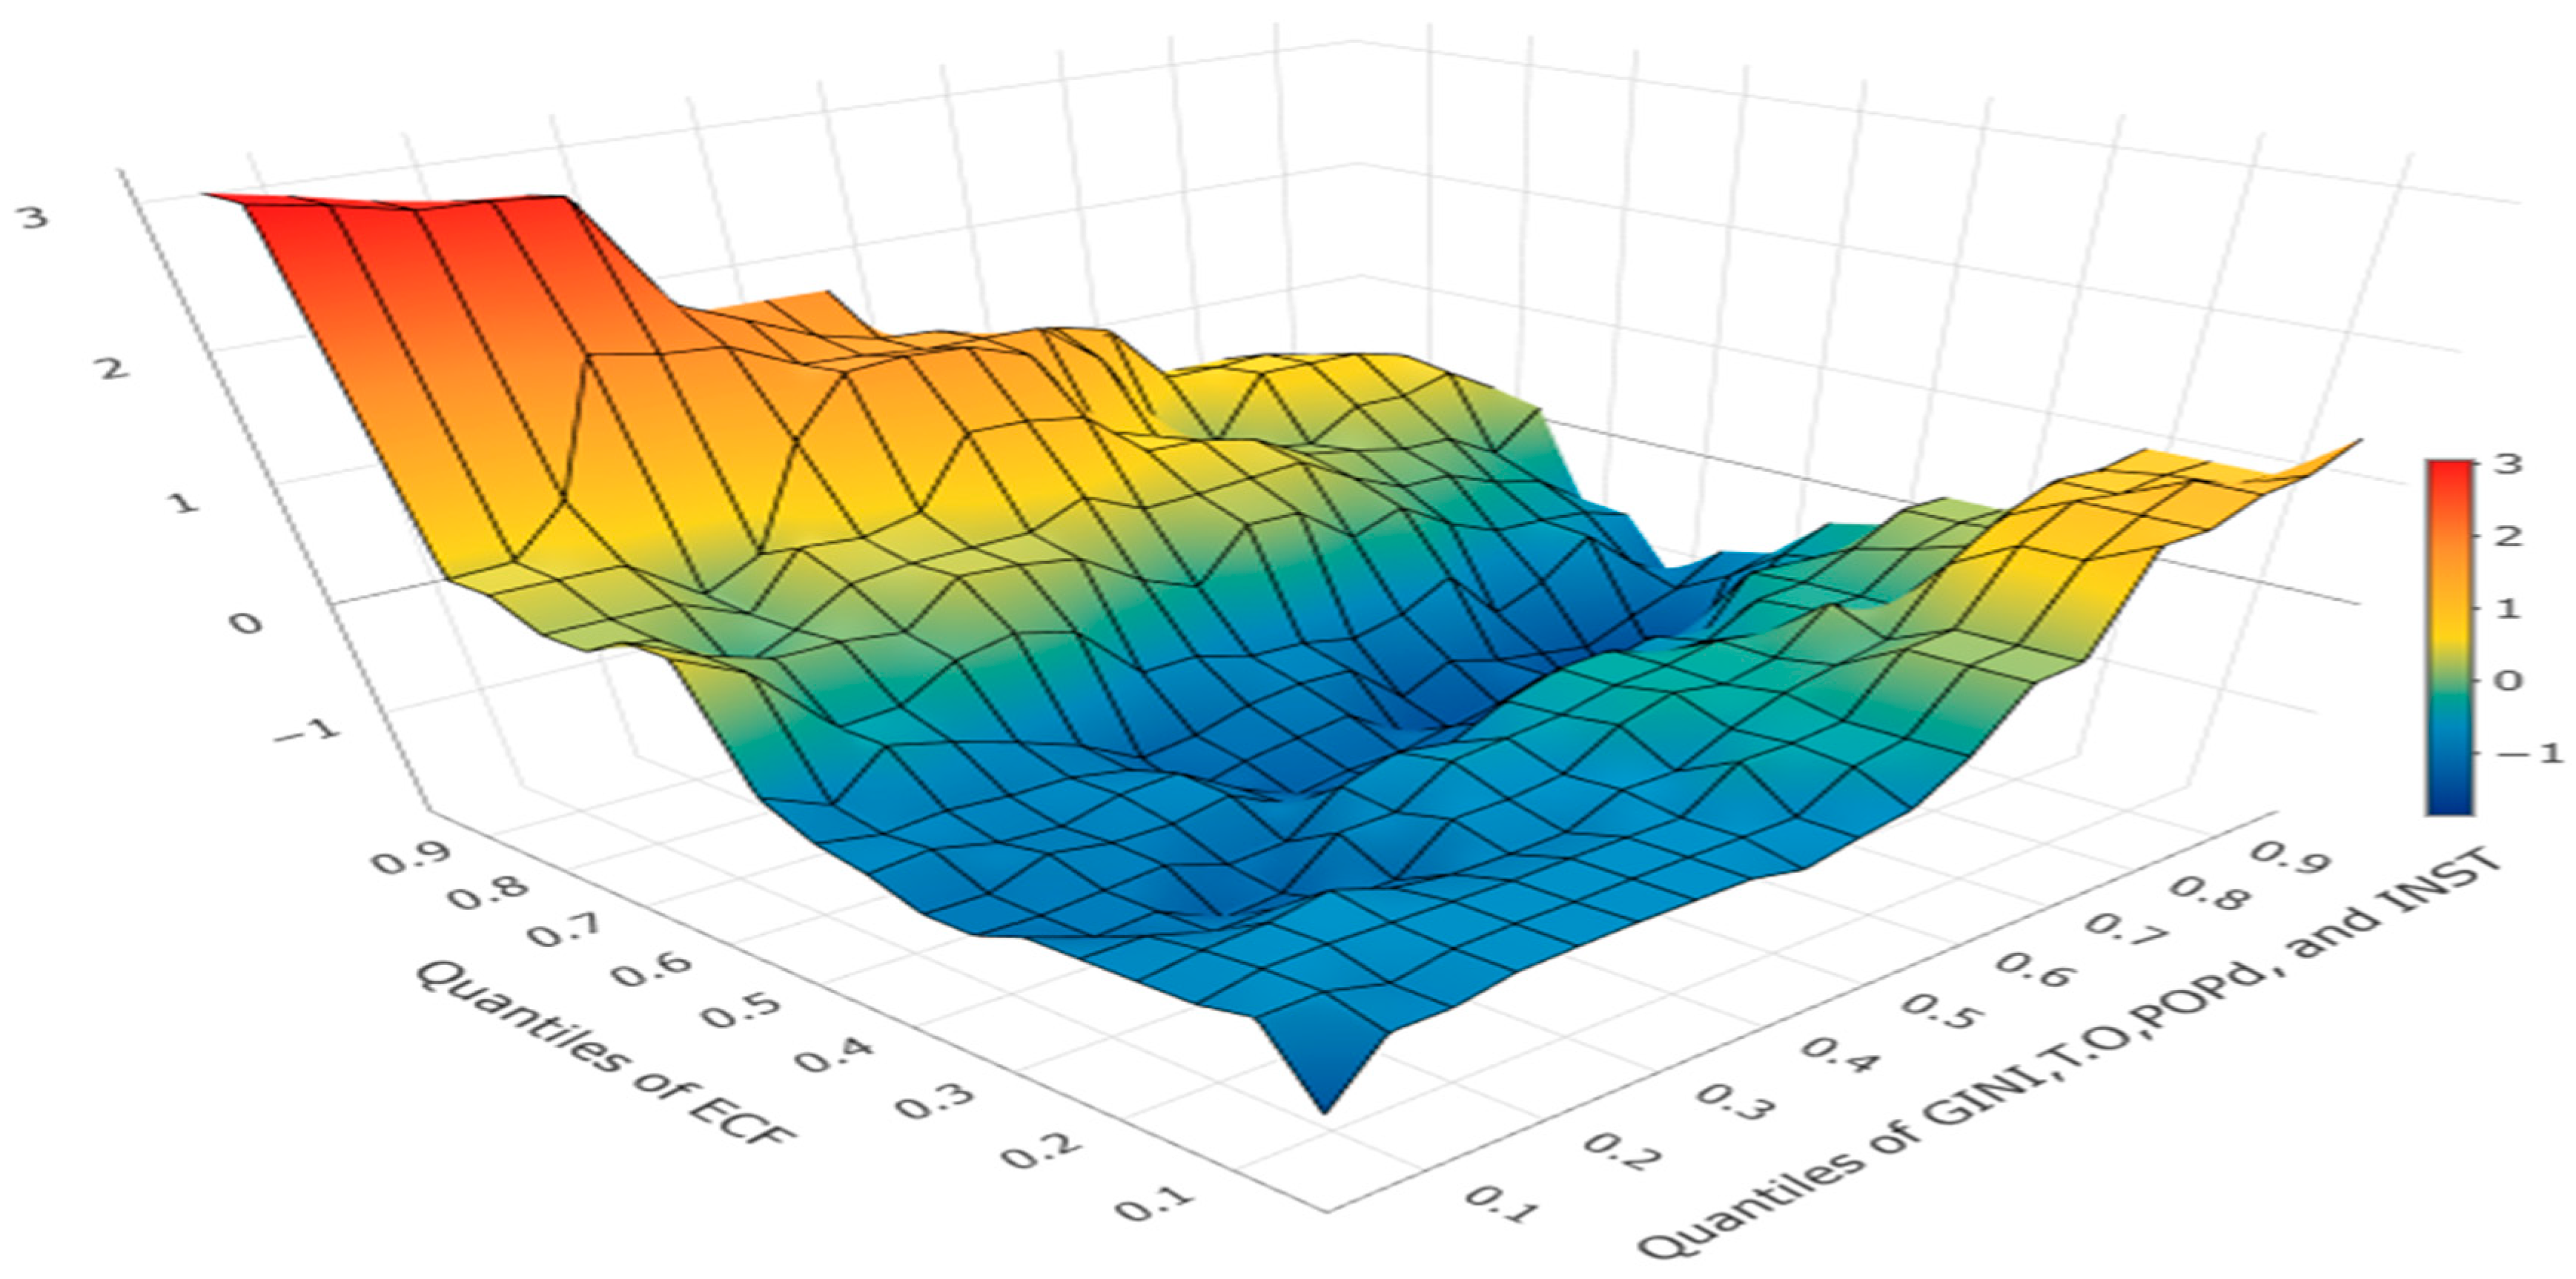
The quantile-on-quantile analysis in Figure 5 shows how GINI, TO, POPd, and INST affect the ECF. It illustrates responses to variables via quantiles, indicating distribution-wide shifts. Median quantiles show a decreasing pattern, suggesting that middle-range impacts of these variables reduce the ECF, possibly due to combined socio-economic and institutional efforts to protect the environment. Surface quantiles vary, with the highest and lowest dataset values increasing surface values. Data indicate that ecological pressure intensifies when inequality, trade, or institutional quality deviates beyond the average. The non-linear pattern reveals that socio-economic factors influence environmental outcomes actively and unevenly. Sustainability policies should consider different quantiles, as the ecological footprint reacts differently across social, economic, and institutional points of distribution.
Figure 5.
QQR effects of regressors on ECF.
4.6. WQC Outcome
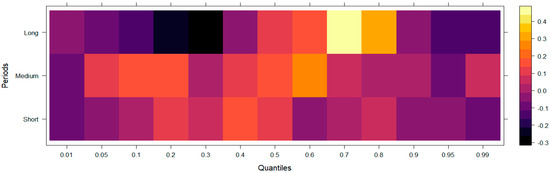
The heatmap in Figure 6 highlights WQC outcomes between GINI and ECF across quantiles and time horizons (short, medium, long). Darker colors indicate stronger negative relationships. The study finds that GINI influences ecological sustainability differently depending on the quantile and time frame. Negative associations in most quantiles suggest rising income inequality increases environmental pressure over time. The correlation remains moderately stable in the medium term, as these systems need more time to reach equilibrium. In the long run, variability increases, showing positive relations at lower values and negative at higher ones. The results indicate that current income distribution patterns shape how inequality impacts ecological systems long-term.
Figure 6.
WQC between GINI and ECF.
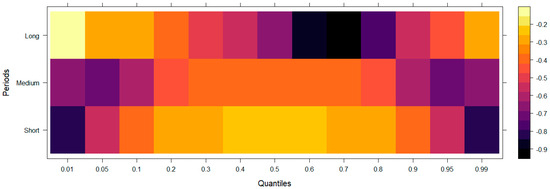
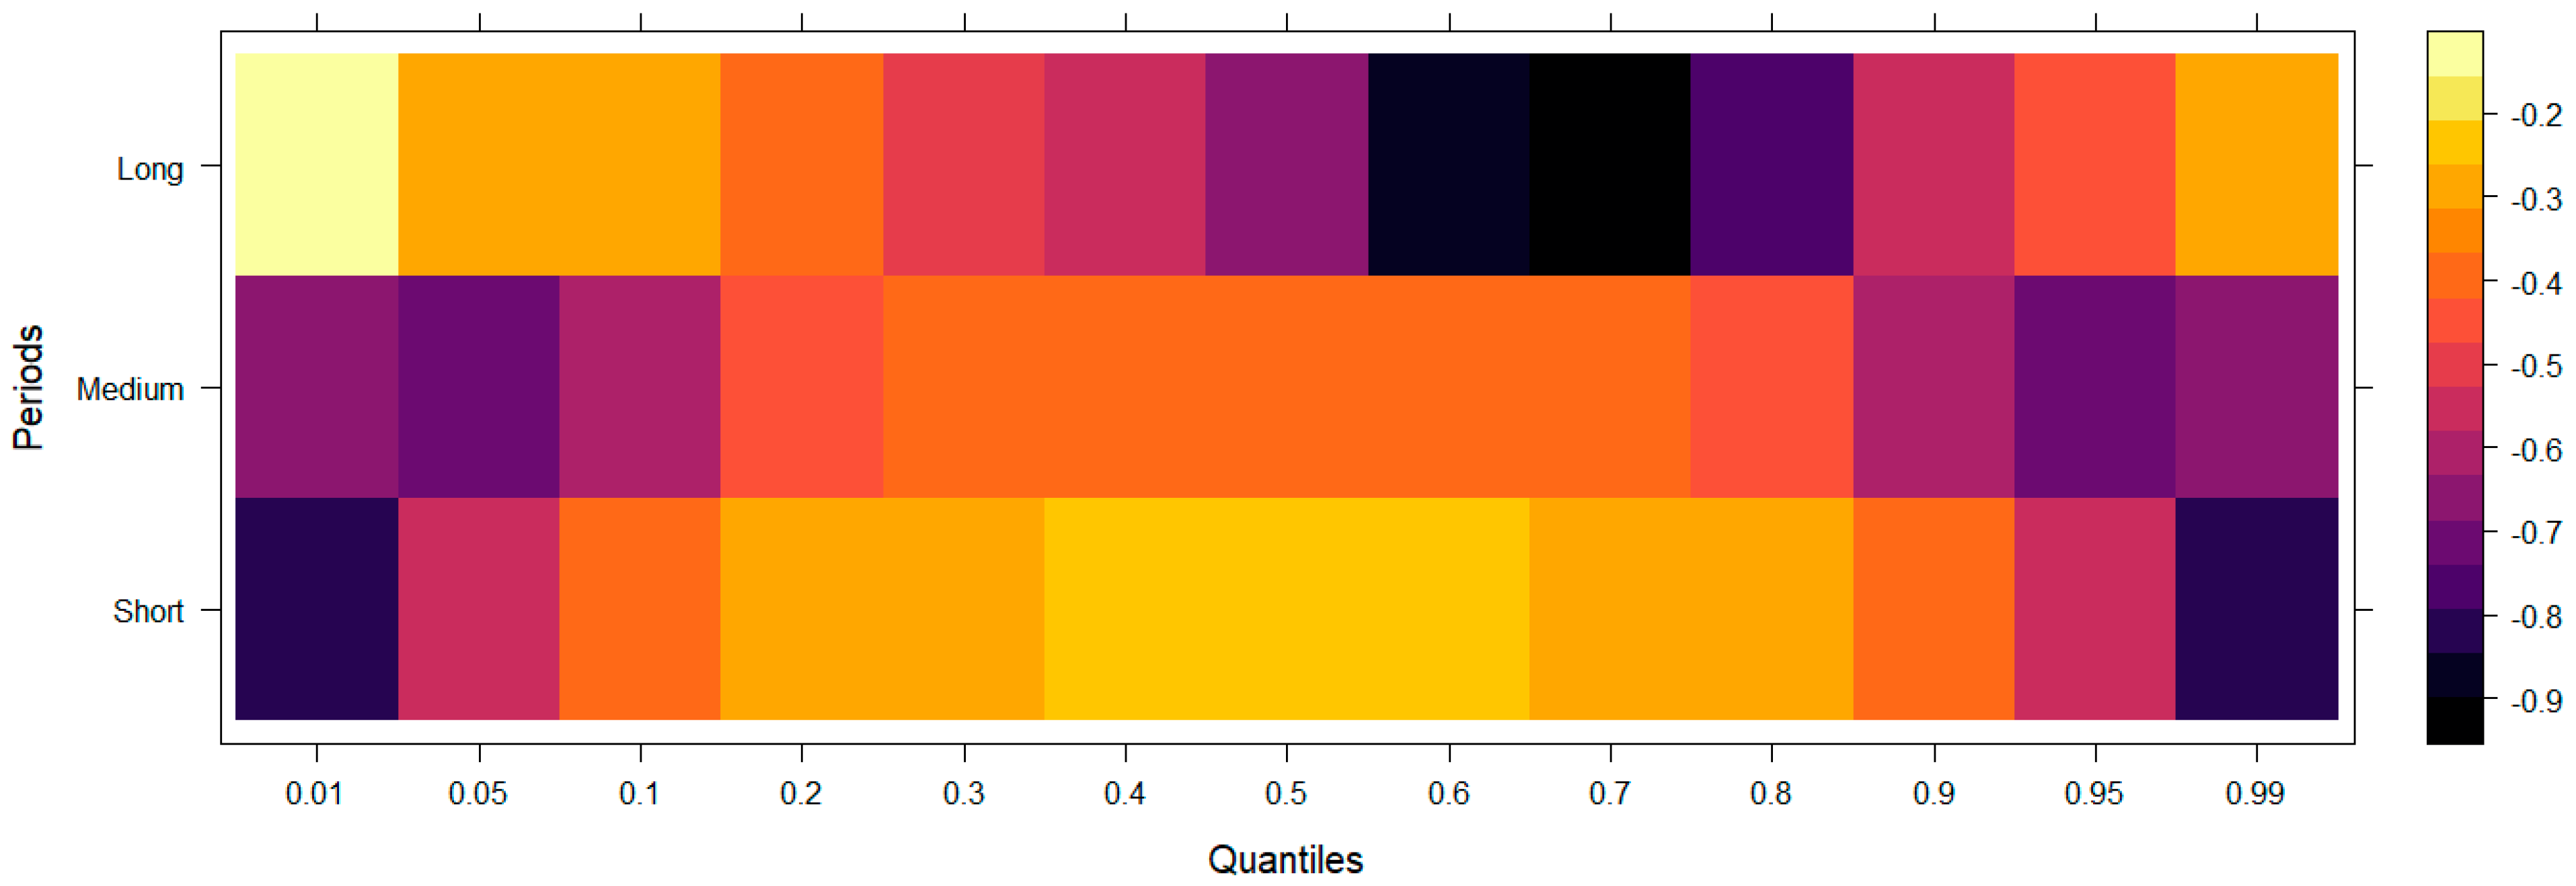
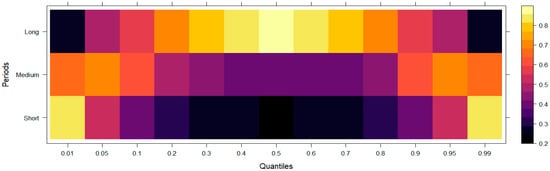
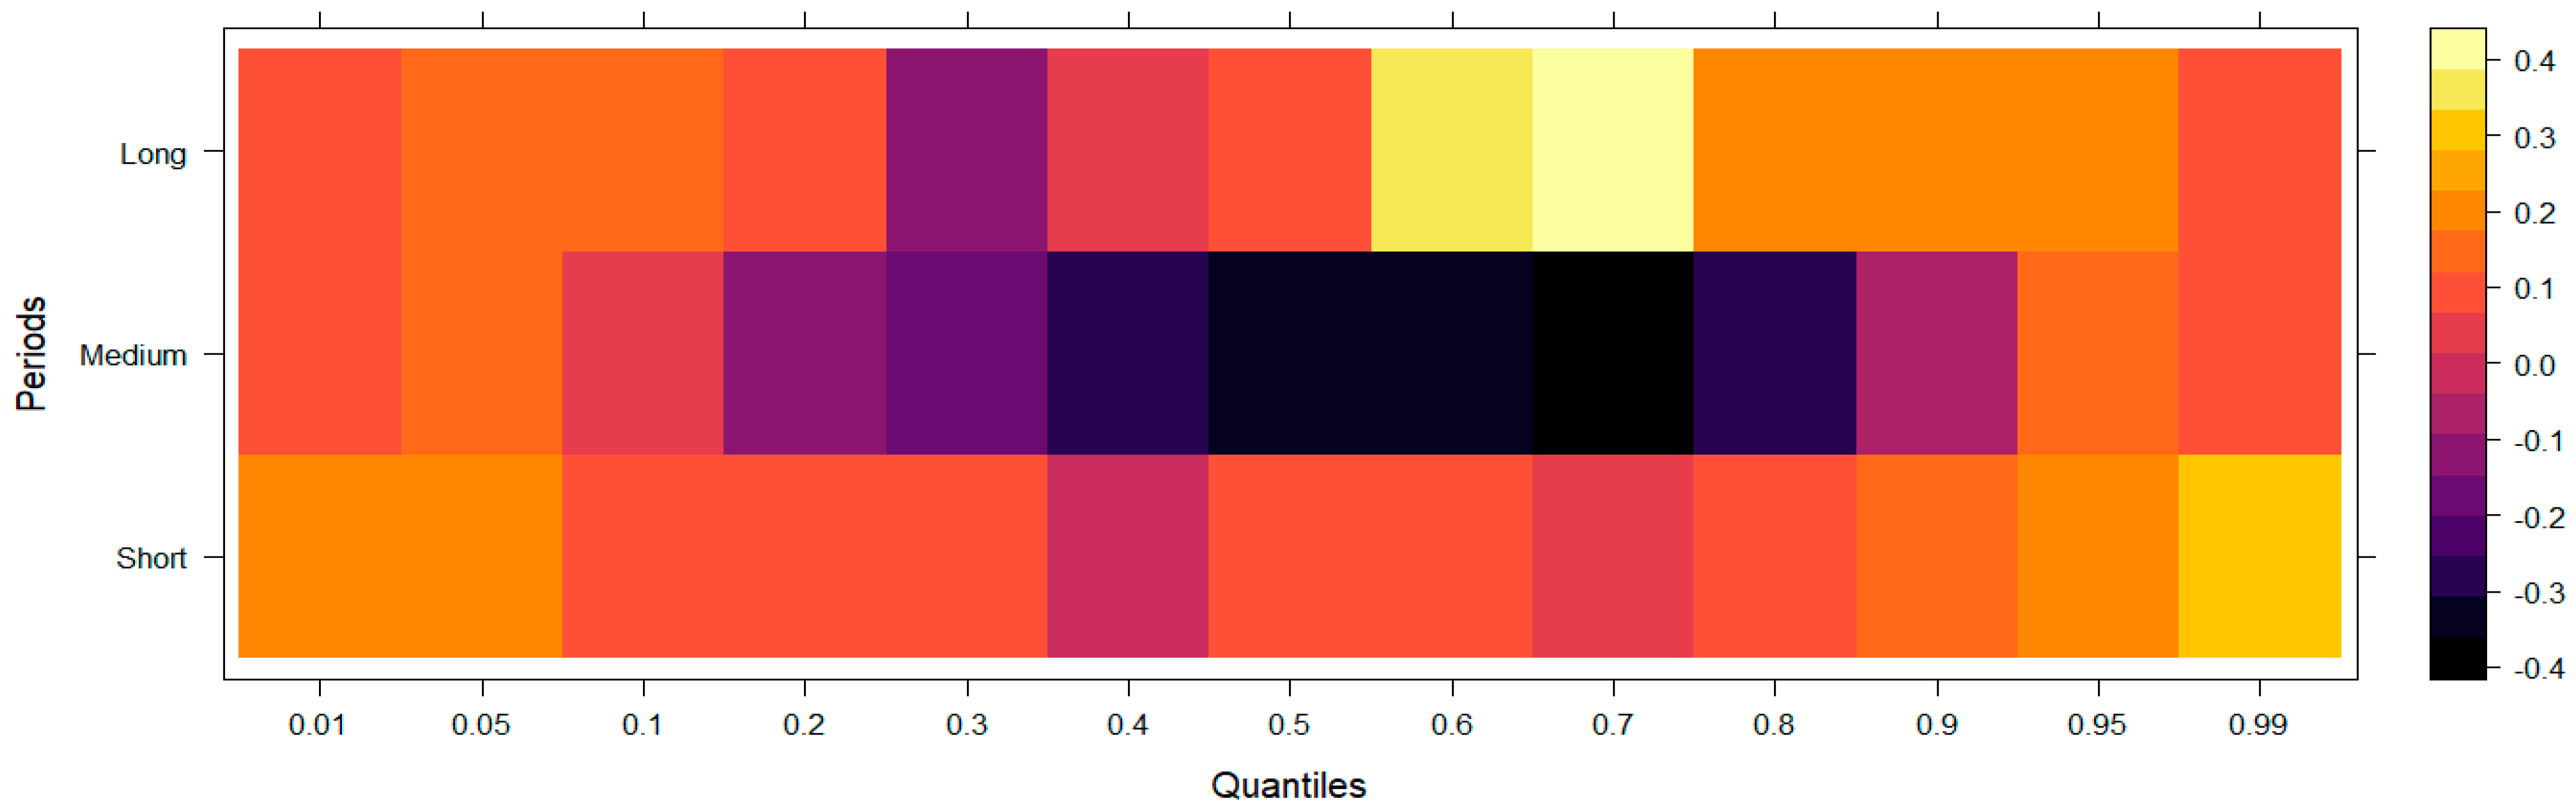
Figure 7 displays wavelet quantile correlation between INST and the ECF across various quantiles and timeframes (short-, medium-, and long-term). The color scale indicates the strength and direction of relationships, with yellow for strong positive and purple to black for weak or negative. The study reveals that INST influences environmental sustainability through time-dependent and quantile-specific links stemming from different economic and environmental conditions. Strong governance, regulatory efficiency, and rule of law in institutions lead to better environmental outcomes at all quantile levels over several years. Correlation data indicate increasing variability until reaching a threshold, causing the pattern to switch between positive and negative phases. Overall, institutional quality shows positive relations with ecological footprint between quantiles 0.7 and 0.8. Strong institutions combined with significant environmental impact enhance their ability to promote eco-friendly policies.
Figure 7.
WQC between INST and ECF.
Figure 8 illustrates the wavelet quantile correlation between POPd and the ECF over several quantiles and temporal intervals (short-, medium-, and long-term). The right-hand color bar shows correlation strength through its color scheme, which uses yellow for strong positive correlations and purple to black for weak or negative correlations. The chart shows that population density and environmental pressure have a positive relationship in most data points and periods, but the strength of this relationship changes based on the observed time. The short-term analysis shows that POPd maintains a positive relationship with ECF across all values from 0.01 to 0.99. The ECF reaches its highest point when POPd reaches either its lowest or highest value. The first signs of urbanization, together with resource concentration, might lead to this situation. The system reaches a stable point at average values during the medium time period, which shows that POPd matches the available ecological resources. The research shows that population growth creates big environmental changes, which become more pronounced throughout all statistical measurement points.
Figure 8.
WQC between POPd and ECF.
Figure 9 illustrates the wavelet quantile correlation between TO and ECF across various quantiles and timeframes. The color gradient from yellow to black indicates stronger positive relationships to weaker ones. The study finds that service trade’s environmental effects vary across quantiles and over time, revealing a complex relationship with trade openness and environmental outcomes. The short-term relationship is mainly positive across all quantiles, likely due to increased environmental impact from service trade expansion and higher energy consumption in the sector. In the medium term, the link weakens and diverges among countries, with some showing negative relationships. Positive links between service trade and economic growth strengthen at higher levels, but this may cause environmental issues if sustainable practices are not adopted.
Figure 9.
WQC between TO and ECF.
Table 6 above integrates distributional and time-frequency evidence, demonstrating strong consistency between QQR and WQC results. Variables (GINI, POPd) that intensify across higher ecological footprint quantiles also exhibit stronger long-run correlations, confirming structural rather than transitory environmental effects. Inequality and population density display both quantile amplification and long-run persistence, suggesting regime-dependent environmental vulnerability. INST shows increasing mitigation across high ecological stress states and sustained long-run effectiveness. TO exhibits moderate but persistent amplification, consistent with gradual structural accumulation effects. The convergence of nonlinear and wavelet evidence substantially strengthens the empirical credibility of the study.
Table 6.
QQR and WQC coefficient Table.
Beyond statistical significance, the economic magnitudes indicate substantial environmental implications. The QQR results indicate that a 1% increase in GINI increases ecological footprint by approximately 0.11% in low ecological regimes; however, the elasticity rises to nearly 0.49% in high ecological pressure states. This suggests that GINI becomes more than four times as environmentally elastic when ecological stress intensifies. INST exhibits a mitigating elasticity ranging from about −0.08% in low regimes to −0.35% in high regimes, implying that a 1% improvement in institutional quality reduces ECF by up to 0.35% under severe ecological conditions. TO shows a moderate but increasing elasticity, moving from roughly 0.07% to 0.28% across quantiles, consistent with cumulative environmental effects. POPd displays the largest elasticity, rising from approximately 0.13% to 0.59%, indicating that demographic pressures exert increasingly strong proportional impacts as ecological burden deepens. The wavelet quantile correlations further confirm that these elasticities are not short-lived but persist over longer time horizons. Overall, the results reveal regime-dependent environmental elasticities rather than constant average effects.
4.7. Discussions
The empirical study employed data from 1960 to 2024 concerning Nigeria’s economy to analyze and elucidate the collective influence of GINI, TO, INST, and POPd on ECF outcomes. The QQR and WQC estimation methods showed that these connections follow nonlinear patterns, which depend on distribution patterns and show time-dependent behavior. The analysis uses the PEE, PHH and EKC frameworks to support its findings, which match results from specific empirical studies. The model presents its results through the following analysis.
First, the QQR surface (Figure 1) indicates that the impact of GINI on ECF is minimal at low quantiles but becomes significantly positive at high quantiles. The research shows that environmental damage remains minimal when GINI coefficients stay low, but the situation becomes severe when GINI coefficients rise. The PEE concept finds support in this evidence because societies with unequal distribution of resources experience increased environmental pressure when powerful groups create environmental damage, but powerless groups cannot obtain environmental protection. The research results match what scientists have discovered through their worldwide studies, as [2,58] demonstrated that GINI creates worse environmental problems, which lead to increased emissions throughout developing countries. The WQC (Figure 6) shows that GINI maintains a powerful negative relationship with ECF throughout all quantile levels during the short-term period, which indicates GINI growth will make ecological conditions worse. The short-term dynamics demonstrate how different access to clean technology and poor energy usage and resource depletion create immediate effects. The correlation shows no signs of change during the medium-term period, which suggests that the system needs more time to reach its equilibrium state. The effects of time on the system depend on specific quantile values because environmental stress worsens when inequality increases at higher quantile levels, thus requiring permanent institutional frameworks, which link economic inequality to environmental damage. The findings correspond with the quantile regression analysis of the shadow economy and environmental degradation in Africa, indicating that an increase in the GINI coefficient exacerbates environmental degradation from low to mid quantiles [59,60]. This contrasts with the study of [61], who identify a favorable correlation in some ASEAN-6 nations. The GINI index shows negative effects on environmental degradation, but it creates positive outcomes in specific environmental situations.
The QQR results for INST (Figure 2) show that institutions that lack strength lead to increasing ECF, while institutions that have strong foundations create better sustainability outcomes. This corresponds with the notion that effective governance, transparency, and enforcement mitigate environmental stress by shaping the impact of economic expansion and consumption on environmental outcomes. The observed uneven distribution of pollution across different quantiles matches previous research from worldwide and Sub-Saharan African settings, which indicates that institutional frameworks determine how pollution spreads. The WQC (Figure 7) analysis supports QQR results by showing that better INST performance leads to better environmental results during the first few years of governance improvement. The relationship between INST levels and environmental stress shows enduring patterns, yet Nigeria will achieve its best results through elevated INST levels, which produce superior mitigation effects when facing severe ecological stress. The research findings confirm EKC-level theories because they demonstrate that institutional development needs to happen before sustainability transitions can start.
The QQR results (Figure 4) show a strong positive relationship between TO and ECF, which becomes more pronounced when analyzing data from higher quantiles. The results show that service trade volume directly affects the level of environmental pressure, which increases when service trade volumes rise. The PHH supports this research finding because unregulated economies will use more resources, which leads to higher logistical emissions and digital infrastructure usage. The study confirms that worldwide data shows TO creates elevated ECF levels, which occur in both developing and developed countries, because increased economic activities lead to better resource management and industrial growth and environmental damage. The correlation between trade expansion and environmental stress becomes weaker at lower quantile levels before reaching zero, which shows that trade expansion starts with minimal environmental pressure. The median quantiles show different results, which indicate that globalization of the service sector produces transitional effects that could lead to better technology and more efficient operations. The WQC (Figure 9) data show that TO creates short-term ECF increases, which affect all measurement points except one. The rising market and service activity levels create immediate ecological pressure, which affects all quantiles according to the WQC data. The association between these elements becomes less defined during the middle time period, which shows that better operational performance and advanced service delivery systems might create short-term reductions in environmental impacts. The expanded research shows that TO expansion creates multiple beneficial links, which will result in major environmental changes throughout Nigeria unless Nigeria develops strong regulatory systems to control these effects.
The QQR surface (Figure 3) outcome indicates that POPd creates minimal negative effects when analyzing lower quantile values, yet produces rising positive effects when analyzing higher quantile values. The data shows that environmental pressure remains limited when density levels are low, but it strongly increases when density rises, which matches the effects of urban growth, land transformation, traffic congestion, and rising consumer activities. The WQC data (Figure 8) show detailed information, which shows a mainly positive relationship between different time periods, especially during extreme quantile periods, thus showing how population density affects environmental pressure in Nigeria. The persistent positive long-term correlations indicate that demographic growth is a fundamental driver of Nigeria’s ECF. The discovery is corroborated by the demographic aspect of the EKC and is consistent with evidence from developing nations, indicating that POPd is a significant factor in ecological stress [43,62,63].
The research findings show that GINI, INST, and TO and POPd variables in Nigeria follow non-linear patterns of relationship, which produce different results based on both data quantiles and time periods. The combination of high economic inequality with weak institutional systems makes economic performance worse. The combination of high service trade levels with weak institutions shows strong patterns of PHH operations. The increasing number of people, together with insufficient environmental protection laws, has resulted in deteriorating ecological conditions. The most stable factor, which supports long-term stability, appears to be institutional development. The research results confirm that QQR and WQC methods produce reliable results because they show patterns that other statistical methods fail to detect. Coherently, GINI’s uneven impact on groups with higher environmental impacts aligns well with the concept of PEE, which suggests that unequal distribution of power can shape the implementation of regulations and environmental protection policies. The impact of TO on the ecological footprint is influenced by both political and institutional factors, indicating that countries’ interactions with global markets can either spread cleaner technologies or cause more pollution, depending on their institutions’ strength and effectiveness. Hence, the nature of environmental changes can vary greatly depending on the structures and methods used to manage them. In addition, the increased significance of INST in higher ecological settings supports the political economy idea that the power to control behavior reduces environmental effects from inequality, population growth, and exposure to trade. Demonstrating that environmental damage in Nigeria is not caused by a single economic factor.
5. Conclusions
This study examined the factors influencing Nigeria’s ecological footprint from 1960 to 2024, focusing on how distributional aspects interplay. It combines concepts from the Political Economy of the Environment (PEE), Environmental Kuznets Curve (EKC), and Pollution Haven Hypothesis (PHH) within a nonlinear econometric framework. Employing Quantile-on-Quantile Regression (QQR) and Wavelet Quantile Correlation (WQC), the research shows how income inequality, institutional quality, trade openness, and population density interact with ecological pressures across different environmental conditions and time frames.
The findings demonstrate that ecological degradation in Nigeria is not driven by uniform, linear relationships but by asymmetric, regime-specific dynamics. Income inequality and population density exert stronger ecological pressure in states with higher ecological footprints, suggesting that environmental stress intensifies when structural inequalities and demographic pressures coincide with fragile ecological conditions. In contrast, institutional quality exhibits a mitigating role that becomes more pronounced in high ecological pressure regimes, highlighting the importance of governance capacity in moderating environmentally degradation growth patterns. Finally, trade openness displays context-dependent effects consistent with PHH arguments, where institutional enforcement mechanisms are weak. These nonlinear patterns provide an important refinement to conventional EKC narratives. Rather than a simple income–environment trade-off, the results suggest that structural inequality and institutional effectiveness condition environmental outcomes in ways that vary across the ECF distribution. The study contributes to the PEE literature by demonstrating that distributional factors and governance quality are not peripheral controls but central determinants of environmental sustainability in emerging economies. In addition, the evidence underscores that environmental management strategies in Nigeria must be regime-sensitive. Institutional strengthening should precede trade expansion to prevent environmentally harmful trade patterns. Furthermore, addressing income inequality is highly critical for ecological sustainability, as unequal economic structures appear to amplify environmental degradation under high-pressure conditions. Lastly, population dynamics require integrated urban planning and resource governance frameworks capable of mitigating density-induced ecological strain.
5.1. Limitations and Future Research
Despite the robustness of the nonlinear and time-frequency framework, this study is not without limitations. First, the analysis focuses exclusively on Nigeria, which may limit cross-country generalizability. Second, while QQR and WQC capture distributional asymmetries and persistence across time scales, they do not explicitly model structural breaks or potential endogeneity beyond nonlinear dependence. Third, the absence of sectoral decomposition of ECF and reliance on secondary aggregate data. Future research could extend the analysis to a panel of African economies, incorporate structural break or regime-switching models, and explore additional environmental indicators such as biodiversity loss or resource depletion. Further investigation into causal mechanisms using instrumental-variable or dynamic nonlinear approaches would also strengthen policy inference. In addition, the study can employ microdata, sectoral and regional analysis within Nigeria.
5.2. Policy Recommendations
Empirical evidence shows Nigeria faces ecological sustainability issues due to structural GINI, weak regulation, rapid population growth, and damaging trade. These interconnected issues need a policy approach combining local knowledge with global data. Several measures can be proposed for Nigerian policymakers.
- Research shows INST has the strongest long-term effect on ECF, so Nigeria must strengthen governance to boost regulation, cut corruption, and improve public administration. The government should empower environmental regulatory bodies, fund scientific R&D, and develop digital monitoring systems for pollution control. Without institutional strength, ongoing trade and urban growth will keep increasing Nigeria’s ECF, driving PHH adoption. Strengthening institutional quality promotes SDG 16 (Peace, Justice and Strong Institutions) and enhances environmental governance under SDG 13 (Climate Action). Sustainable trade practices contribute to SDG 8 (Decent Work and Economic Growth) and SDG 17 (Partnerships for the Goals), provided environmental safeguards are enforced.
- GINI reduction improves ecological and climate policies, especially as quantiles rise. Hence, environmental policies can be linked to social programs. Nigeria should adopt redistributive policies combining progressive taxes, energy subsidies, and equal access to renewable energy. Inclusion methods help close consumption gaps, enhancing sustainability and environmental resilience. Reducing income inequality supports SDG 10 (Reduced Inequalities) while simultaneously advancing SDG 12 (Responsible Consumption and Production).
- The QQR and WQC models indicate service trade boosts ECF both short- and long-term. Nigeria should promote renewable energy for data centers, develop low-emission delivery, establish a circular economy, create waste reduction platforms, and enhance telecom environmental standards. These address the PHH effect by linking growth to sustainability, recognizing institutions’ vital role.
- The POPd impacts ECF long-term, emphasizing the need for environmental protection amid urban expansion. Nigeria should fund sustainable cities through affordable transportation and support walking and cycling. Key actions include land use changes to prevent deforestation and uncontrolled growth, building vertically to conserve land, and establishing systems to recycle water and energy. Our strategies combine smart planning to reduce ECF with community resistance methods. Nigeria’s development plans should embed environmental justice, creating fair distribution of costs and benefits, aligning with SDGs 8, 10, 11, 12, 13, 15, and 16.
- Nigeria must tackle social inequality, weak institutions, and environmental limits with unified solutions. Research shows environmental laws alone cannot ensure sustainability; reforms in governance, inequality reduction, green growth in services, and urban planning are needed. Policymakers, civil society, and international partners should prioritize equality, accountability, and environmental stewardship. Nigeria must adopt collaborative, transformative initiatives aligned with global sustainability standards.
Author Contributions
Conceptualization, O.C.I. and O.A.S.; methodology, O.A.S. and M.M.; software, M.M.; validation, O.C.I., O.A.S. and M.M.; formal analysis, O.A.S. and M.M.; investigation, O.A.S. and M.M.; resources, O.C.I., O.A.S., M.M. and H.O.; data curation, O.C.I.; writing—original draft preparation, O.C.I., O.A.S. and M.M.; writing—review and editing, O.C.I., O.A.S. and M.M.; visualization, M.M.; supervision, O.A.S. and H.O.; project administration, O.A.S. and H.O. All authors have read and agreed to the published version of the manuscript.
Funding
This research received no external funding.
Institutional Review Board Statement
Not applicable.
Informed Consent Statement
Not applicable.
Data Availability Statement
The original data presented in this study are included in the article. Further inquiries can be directed to the corresponding author.
Conflicts of Interest
The authors declare no conflicts of interest.
References
- Obekpa, H.O.; Alola, A.A.; Adejo, A.M.; Echebiri, C. Examining the drivers of ecological footprint components: Is pursuing food security environmentally costly for Nigeria? Ecol. Indic. 2025, 170, 113009. [Google Scholar] [CrossRef] [Scilit]
- Ozturk, S.; Cetin, M.; Demir, H. Income inequality and CO2 emissions: Nonlinear evidence from Turkey. Environ. Dev. Sustain. 2022, 24, 11911–11928. [Google Scholar] [CrossRef] [Scilit]
- Ofori, P.E.; Ofori, I.K.; Annan, K. The role of energy equity and income inequality in environmental sustainability. J. Clean. Prod. 2024, 470, 143183. [Google Scholar] [CrossRef] [Scilit]
- Ogede, J.S.; Oduola, M.O.; Tiamiyu, H.O. Income inequality and carbon dioxide (CO2) in sub-Saharan Africa countries: The moderating role of financial inclusion and institutional quality. Environ. Dev. Sustain. 2024, 26, 18385–18409. [Google Scholar] [CrossRef] [Scilit]
- Reuben, O.; Ekemezie, E. Analyzing the impact of energy consumption and income inequality on environmental degradation in Nigeria. Ekalaya J. Ekon. Akunt. 2025, 3, 63–76. [Google Scholar] [CrossRef] [Scilit]
- Farouq, I.; Sulong, Z. Investigating the Effects of Financial Development and Inflation on the Ecological Footprint in Five Selected Leading African Economies. Fudan J. Humanit. Soc. Sci. 2025. [Google Scholar] [CrossRef] [Scilit]
- Azimi, M.N.; Rahman, M.M. Impact of institutional quality on ecological footprint: New insights from G20 countries. J. Clean. Prod. 2023, 423, 138670. [Google Scholar] [CrossRef] [Scilit]
- Agala, F.B.; Eke, F. Income Inequality, Environmental Degradation and Economic Development nexus in Nigeria: Reassessing the Kuznets Hypothesis. Int. J. Innov. Appl. Stud. 2019, 27, 1014–1023. [Google Scholar]
- Cosmas, N.C.; Chitedze, I.; Mourad, K.A. An econometric analysis of the macroeconomic determinants of carbon dioxide emissions in Nigeria. Sci. Total. Environ. 2019, 675, 313–324. [Google Scholar] [CrossRef] [Scilit] [PubMed]
- Maduka, A.C.; Ogwu, S.O.; Ekesiobi, C.S. Assessing the moderating effect of institutional quality on economic growth—Carbon emission nexus in Nigeria. Environ. Sci. Pollut. Res. 2022, 29, 64924–64938. [Google Scholar] [CrossRef] [Scilit]
- Copeland, B.R.; Taylor, M.S. Trade, Growth, and the Environment. J. Econ. Lit. 2004, 42, 7–71. [Google Scholar] [CrossRef]
- Boyce, J.K. Inequality as a cause of environmental degradation. Ecol. Econ. 1994, 11, 169–178. [Google Scholar] [CrossRef] [Scilit]
- Grossman, G.M.; Krueger, A.B. Economic Growth and the Environment. Q. J. Econ. 1995, 110, 353–377. [Google Scholar] [CrossRef] [Scilit]
- Wan, G.; Wang, C.; Wang, J.; Zhang, X. The income inequality-CO2 emissions nexus: Transmission mechanisms. Ecol. Econ. 2022, 195, 107360. [Google Scholar] [CrossRef] [Scilit]
- Yang, B.; Ali, M.; Hashmi, S.H.; Shabir, M. Income Inequality and CO2 Emissions in Developing Countries: The Moderating Role of Financial Instability. Sustainability 2020, 12, 6810. [Google Scholar] [CrossRef] [Scilit]
- Alataş, S.; Akın, T. The impact of income inequality on environmental quality: A sectoral-level analysis. J. Environ. Plan. Manag. 2022, 65, 1949–1974. [Google Scholar] [CrossRef] [Scilit]
- Hailemariam, A.; Dzhumashev, R.; Shahbaz, M. Carbon emissions, income inequality and economic development. Empir. Econ. 2020, 59, 1139–1159. [Google Scholar] [CrossRef] [Scilit]
- Wu, R.; Xie, Z. Identifying the impacts of income inequality on CO2 emissions: Empirical evidences from OECD countries and non-OECD countries. J. Clean. Prod. 2020, 277, 123858. [Google Scholar] [CrossRef] [Scilit]
- Knight, K.W.; Schor, J.B.; Jorgenson, A.K. Wealth Inequality and Carbon Emissions in High-income Countries. Soc. Curr. 2017, 4, 403–412. [Google Scholar] [CrossRef] [Scilit]
- Millward-Hopkins, J.; Oswald, Y. ‘Fair’ inequality, consumption and climate mitigation. Environ. Res. Lett. 2021, 16, 034007. [Google Scholar] [CrossRef] [Scilit]
- Ehigiamusoe, K.U.; Majeed, M.T.; Dogan, E. The nexus between poverty, inequality and environmental pollution: Evidence across different income groups of countries. J. Clean. Prod. 2022, 341, 130863. [Google Scholar] [CrossRef] [Scilit]
- Andersson, F.N. Economic inequality and the ecological footprint: Time-varying estimates for four developed economies, 1962–2021. Ecol. Econ. 2024, 220, 108185. [Google Scholar] [CrossRef] [Scilit]
- Yang, B.; Ali, M.; Hashmi, S.H.; Jahanger, A. Do Income Inequality and Institutional Quality affect CO2 Emissions in Developing Economies? Sci. Pollut. Res. 2022, 29, 42720–42741. [Google Scholar] [CrossRef] [PubMed]
- Adebayo, T.S.; Sevinç, H.; Sevinç, D.E.; Ojekemi, O.S.; Kirikkaleli, D. A wavelet-based model of trade openness with ecological footprint in the MINT economies. Energy Environ. 2024, 35, 2178–2197. [Google Scholar] [CrossRef] [Scilit]
- Abdullahi, N.M.; Ibrahim, A.A.; Zhang, Q.; Huo, X. Dynamic linkages between financial development, economic growth, urbanization, trade openness, and ecological footprint: An empirical account of ECOWAS countries. Environ. Dev. Sustain. 2024, 27, 25103–25130. [Google Scholar] [CrossRef] [Scilit]
- Ali, S.; Yusop, Z.; Kaliappan, S.R.; Chin, L. Trade-environment nexus in OIC countries: Fresh insights from environmental Kuznets curve using GHG emissions and ecological footprint. Environ. Sci. Pollut. Res. 2021, 28, 4531–4548. [Google Scholar] [CrossRef] [Scilit]
- Sun, J.; Qamruzzaman, M. Technological innovation, trade openness, natural resources, clean energy on environmental sustainably: A competitive assessment between CO2 emission, ecological footprint, load capacity factor and inverted load capacity factor in BRICS+T. Front. Environ. Sci. 2025, 12, 1520562. [Google Scholar] [CrossRef] [Scilit]
- Ansari, M.A.; Khan, N. Decomposing the trade-environment nexus for high income, upper and lower middle income countries: What do the composition, scale, and technique effect indicate? Ecol. Indic. 2021, 121, 107122. [Google Scholar] [CrossRef] [Scilit]
- Can, M.; Ben Jebli, M.; Brusselaers, J. Can green trade save the environment? Introducing the Green (Trade) Openness Index. Environ. Sci. Pollut. Res. 2022, 29, 44091–44102. [Google Scholar] [CrossRef] [Scilit]
- Lu, W.-C. The interplay among ecological footprint, real income, energy consumption, and trade openness in 13 Asian countries. Environ. Sci. Pollut. Res. 2020, 27, 45148–45160. [Google Scholar] [CrossRef] [Scilit]
- Manulusi, M.R.; Rahmatia, R.; Madris, M.; Saudi, N.D.S. Sustainable Development and Environmental Impacts: Insights from Economic Activities in ASEAN-5 Economies. Int. J. Energy Econ. Policy 2025, 15, 68–75. [Google Scholar] [CrossRef] [Scilit]
- Ahmad, M.; Ahmed, Z.; Majeed, A.; Huang, B. An environmental impact assessment of economic complexity and energy consumption: Does institutional quality make a difference? Environ. Impact Assess. Rev. 2021, 89, 106603. [Google Scholar] [CrossRef] [Scilit]
- Opoku-Mensah, E.; Chun, W.; Ofori, E.K.; Ampofo, S.A.; Chen, W.; Appiah-Otoo, I. Revisiting the role of ICT and green institutional governance in environmental sustainability and proposing an ecological footprint mitigation pathway using a volatility-driven model. J. Clean. Prod. 2024, 434, 139824. [Google Scholar] [CrossRef] [Scilit]
- Li, Q.; Zhang, S. Impact of globalization and industrialization on ecological footprint: Do institutional quality and renewable energy matter? Front. Environ. Sci. 2025, 13, 1535638. [Google Scholar] [CrossRef] [Scilit]
- Makhdum, M.S.A.; Usman, M.; Kousar, R.; Cifuentes-Faura, J.; Radulescu, M.; Balsalobre-Lorente, D. How Do Institutional Quality, Natural Resources, Renewable Energy, and Financial Development Reduce Ecological Footprint without Hindering Economic Growth Trajectory? Evidence from China. Sustainability 2022, 14, 13910. [Google Scholar] [CrossRef] [Scilit]
- Zakari, A.; Khan, I.; Tawiah, V.; Alvarado, R. Reviewing the ecological footprints of Africa top carbon consumer: A quantile on quantile analysis. Int. J. Environ. Sci. Technol. 2022, 19, 11475–11486. [Google Scholar] [CrossRef] [Scilit]
- Zhu, Z.-G.; Zhang, Y.; Obuobi, B. The Impact of Forest Rents on Ecological Footprints in China: The Moderating Role of Government Effectiveness. Forests 2025, 16, 415. [Google Scholar] [CrossRef] [Scilit]
- Christoforidis, T.; Katrakilidis, C. The dynamic role of institutional quality, renewable and non-renewable energy on the ecological footprint of OECD countries: Do institutions and renewables function as leverage points for environmental sustainability? Environ. Sci. Pollut. Res. 2021, 28, 53888–53907. [Google Scholar] [CrossRef] [Scilit]
- Iormom, B.I.; Jato, T.P.; Ishola, A.; Diyoke, K. Economic Policy Uncertainty, Institutional Quality, and Renewable Energy Transitioning in Nigeria. Energy Res. Lett. 2025, Vol 7. [Google Scholar] [CrossRef] [Scilit]
- Aminu, T.A.; Alabi, M.K. Investigating the role of institutions in the FDI-ecological footprint linkage in Sub-Saharan Africa: Is there a threshold for institutional quality? Ilorin J. Econ. Policy 2024, 11, 1–18. [Google Scholar] [CrossRef] [Scilit]
- Bambi, P.D.R.; Batatana, M.L.D.; Appiah, M.; Tetteh, D. Governance, institutions, and climate change resilience in Sub-Saharan Africa: Assessing the threshold effects. Front. Environ. Sci. 2024, 12, 1352344. [Google Scholar] [CrossRef] [Scilit]
- Uzar, U. The relationship between institutional quality and ecological footprint: Is there a connection? Nat. Resour. Forum 2021, 45, 380–396. [Google Scholar] [CrossRef] [Scilit]
- Rahman, M.M.; Khan, Z.; Khan, S.; Abbas, S. Disaggregated energy consumption, industrialization, total population, and ecological footprint nexus: Evidence from the world’s top 10 most populous countries. Environ. Sci. Pollut. Res. 2023, 30, 119069–119083. [Google Scholar] [CrossRef] [Scilit] [PubMed]
- Usman, M.; Hammar, N. Dynamic relationship between technological innovations, financial development, renewable energy, and ecological footprint: Fresh insights based on the STIRPAT model for Asia Pacific Economic Cooperation countries. Environ. Sci. Pollut. Res. 2021, 28, 15519–15536. [Google Scholar] [CrossRef] [Scilit]
- Çabaş, M.; Beşer, N.Ö.; Ayaydın, H.; Barut, A.; Magazzino, C. Greening the OECD: Unravelling the Complex Relationship Between Natural Resource Efficiency, Technological Innovation and Population Density on Ecological Footprint. Geol. J. 2024, 60, 2621–2633. [Google Scholar] [CrossRef] [Scilit]
- Hussain, M.; Usman, M.; Khan, J.A.; Tarar, Z.H.; Sarwar, M.A. Reinvestigation of environmental Kuznets curve with ecological footprints: Empirical analysis of economic growth and population density. J. Public Aff. 2022, 22, e2276. [Google Scholar] [CrossRef] [Scilit]
- Kongbuamai, N.; Zafar, M.W.; Zaidi, S.A.H.; Liu, Y. Determinants of the ecological footprint in Thailand: The influences of tourism, trade openness, and population density. Sci. Pollut. Res. 2020, 27, 40171–40186. [Google Scholar] [CrossRef] [Scilit]
- Husain, S.A.; Alim, W.; Gull, H.; Azeem, M. Financial Development and Population Growth as Drivers of Environmental Change: Evidence from South Asia. Indus J. Soc. Sci. 2025, 3, 526–536. [Google Scholar] [CrossRef] [Scilit]
- Warsame, A.A.; Daror, H.O.; Abdullahi, A.M. Unraveling the environmental Kuznets curve in IGAD countries: Interplay between ecological footprint, economic growth, renewable energy, and globalization. Environ. Res. Commun. 2025, 7, 015031. [Google Scholar] [CrossRef] [Scilit]
- Anser, M.K.; Yousaf, Z.; Nassani, A.A.; Abro, M.M.Q.; Zaman, K.; Kabbani, A. Evaluating Ecological Footprints through Inbound Tourism, Population Density, and Global Trade. Pol. J. Environ. Stud. 2020, 30, 555–560. [Google Scholar] [CrossRef] [Scilit]
- Chen, Y.; Lee, C.-C.; Chen, M. Ecological footprint, human capital, and urbanization. Energy Environ. 2022, 33, 487–510. [Google Scholar] [CrossRef] [Scilit]
- Somoye, O.A.; Ayobamiji, A.A.; Akinwade, T.S. Wavelet Quantile Evidence on Urbanisation, Human Capital and Economic Growth Impacts on Nigeria’s Ecological Footprint. J. Contemp. Urban Aff. 2025, 9, 256–269. [Google Scholar] [CrossRef] [Scilit]
- ECF. Available online: https://data.footprintnetwork.org/#/ (accessed on 20 November 2025).
- WIID. Available online: https://www.wider.unu.edu/project/world-income-inequality-database-wiid (accessed on 20 November 2025).
- World Bank. Available online: https://databank.worldbank.org/source/world-development-indicators (accessed on 20 November 2025).
- Torras, M.; Boyce, J.K. Income, inequality, and pollution: A reassessment of the environmental Kuznets Curve. Ecol. Econ. 1998, 25, 147–160. [Google Scholar] [CrossRef] [Scilit]
- Asteriou, D.; Price, S. Uncertainty, Investment and Economic Growth: Evidence from a Dynamic Panel. Rev. Dev. Econ. 2005, 9, 277–288. [Google Scholar] [CrossRef] [Scilit]
- Wang, Q.; Yang, T.; Li, R. Does income inequality reshape the environmental Kuznets curve (EKC) hypothesis? A nonlinear panel data analysis. Environ. Res. 2023, 216, 114575. [Google Scholar] [CrossRef] [Scilit] [PubMed]
- Dada, J.T.; Ajide, F.M.; Arnaut, M. Income inequality, shadow economy and environmental degradation in Africa: Quantile regression via moment’s approach. Int. J. Dev. Issues 2023, 22, 214–240. [Google Scholar] [CrossRef] [Scilit]
- Khan, S.; Yahong, W. Income inequality, ecological footprint, and carbon dioxide emissions in Asian developing economies: What effects what and how? Environ. Sci. Pollut. Res. 2022, 29, 24660–24671. [Google Scholar] [CrossRef] [Scilit]
- Nurrachmi, R.; Duasa, J.; Arifin, M.I.; Afroz, R. The Nexus Between Income Inequality and Environmental Degradation in ASEAN-6 Countries During 1992–2015 from Islamic Perspective. Al-Muzara’ah 2024, 12, 159–175. [Google Scholar] [CrossRef] [Scilit]
- Kihombo, S.; Vaseer, A.I.; Ahmed, Z.; Chen, S.; Kirikkaleli, D.; Adebayo, T.S. Is there a tradeoff between financial globalization, economic growth, and environmental sustainability? An advanced panel analysis. Environ. Sci. Pollut. Res. 2022, 29, 3983–3993. [Google Scholar] [CrossRef] [Scilit]
- Sharma, R.; Sinha, A.; Kautish, P. Does renewable energy consumption reduce ecological footprint? Evidence from eight developing countries of Asia. J. Clean. Prod. 2021, 285, 124867. [Google Scholar] [CrossRef] [Scilit]

Disclaimer/Publisher’s Note: The statements, opinions and data contained in all publications are solely those of the individual author(s) and contributor(s) and not of MDPI and/or the editor(s). MDPI and/or the editor(s) disclaim responsibility for any injury to people or property resulting from any ideas, methods, instructions or products referred to in the content. |
© 2026 by the authors. Licensee MDPI, Basel, Switzerland. This article is an open access article distributed under the terms and conditions of the Creative Commons Attribution (CC BY) license.