


Abstract
The giant panda holds a critical position in global biodiversity conservation, yet the ongoing fragmentation of its habitat poses a severe threat to the long-term viability of its survival. This study focused on the giant panda habitat in the Xiangling region and systematically analyzed the mechanisms through which human socioeconomic activities drive habitat fragmentation. The analysis was based on data from 2000 to 2023, encompassing land use, population density, transportation networks, mining activities, and nighttime light emissions, utilizing a methodology that integrated Principal Component Analysis, the Moving Window method, trend analysis, and the Geodetector model. The findings reveal the following: First, the degree of habitat fragmentation has intensified over time with significant spatial heterogeneity, exhibiting a pattern of “low fragmentation in the core areas and high fragmentation in the periphery,” where areas of very high fragmentation have expanded markedly along the habitat edges. Second, the trend in fragmentation demonstrates an overall improvement in the core zones, particularly within the Giant Panda National Park, where over 70% of the area shows reduced fragmentation; conversely, nearly 30% of the peripheral areas continue to degrade. Third, the driving factors of habitat fragmentation exhibit bi-factor enhancement and nonlinear enhancement effects, with land use identified as the dominant factor. The study recommends enhancing the overall connectivity and ecological functionality of the habitat through measures such as refining land-use planning, constructing ecological corridors, implementing hierarchical management, and promoting community co-management.
1. Introduction
The giant panda (Ailuropoda melanoleuca) is a flagship species for global biodiversity conservation. Its survival status directly reflects the health and stability of the ecosystem, making it significant for maintaining regional biodiversity and promoting the integrity of ecological service functions [1]. However, under the dual pressures of natural habitat contraction and human activity disturbances, the ongoing fragmentation of giant panda habitat remains a key factor threatening the long-term survival of its populations [2].
Habitat fragmentation refers to the process by which human socioeconomic activities divide originally connected habitats into multiple isolated patches [3]. By blocking gene flow, compressing core habitats, and intensifying edge effects, it undermines ecosystem stability, ultimately leading to biodiversity loss [4]. Habitat fragmentation is currently the greatest threat to the long-term survival of wild giant pandas [5]. According to population viability analysis, habitat fragmentation divides wild giant panda populations into many small sub-populations. For these local, small populations, the risk of extinction increases over time [6]. Therefore, revealing the driving mechanisms of habitat fragmentation and proposing targeted conservation strategies are core issues for giant panda protection and regional ecological security.
From a landscape ecology perspective, the fragmentation process is driven by both natural succession and human activities, with the latter becoming the dominant factor due to rapid socioeconomic development. Human activities such as transportation network expansion [7], mining and industrial development [8], land use transformation [9], and population aggregation [10] exacerbate the spatial division of habitats by directly dissecting them or indirectly altering land cover. Previous studies have found that, road construction increased the degree of habitat fragmentation for giant pandas, with its influence diminishing as the spatial scale increased; the closer to the road, the higher the fragmentation degree [11]; population growth, agricultural expansion, and tourism led to a rapid decline in giant panda numbers, severely restricting their distribution range [12]; human grazing can cause degradation of giant panda habitat quality, seriously affecting the long-term sustainable survival of giant panda populations [13]. While prior research has established a link between human activities and giant panda habitat decline, such studies are often constrained by simplistic metrics or limited geographical scope.
While prior research has linked human activities to giant panda habitat decline, such studies are often constrained by simplistic metrics or limited geographical scope, failing to capture the complex, multi-scale mechanisms driving fragmentation. Landscape-scale analyses are essential, as fragmentation processes transcend administrative boundaries and exhibit spatial heterogeneity that fine-scale studies cannot reveal. Conducting this study at a broad landscape scale is therefore critical for disentangling these complex interactions and informing effective, region-wide conservation planning.
To address this gap, we focus on the Xiangling region of China—a critical area where human–wildlife coexistence is particularly complex. Our primary objective is to systematically reveal the spatiotemporal mechanisms through which human socioeconomic activities drive habitat fragmentation from 2000 to 2023. We hypothesize that fragmentation is not driven by any single factor, but rather by synergistic interactions among multiple human activities, with land use change playing a dominant and amplifying role. To test this, we construct a comprehensive Landscape Fragmentation Index (LFI) using Principal Component Analysis, examine spatiotemporal trends with Theil–Sen Median and Mann–Kendall methods, and apply the Geodetector model to dissect driving mechanisms and interaction effects. Our findings provide a scientific foundation for targeted conservation strategies in the Xiangling region and offer a transferable methodological framework for studying other endangered species worldwide facing similar anthropogenic pressures.
2. Methods
2.1. Overview of the Study Area
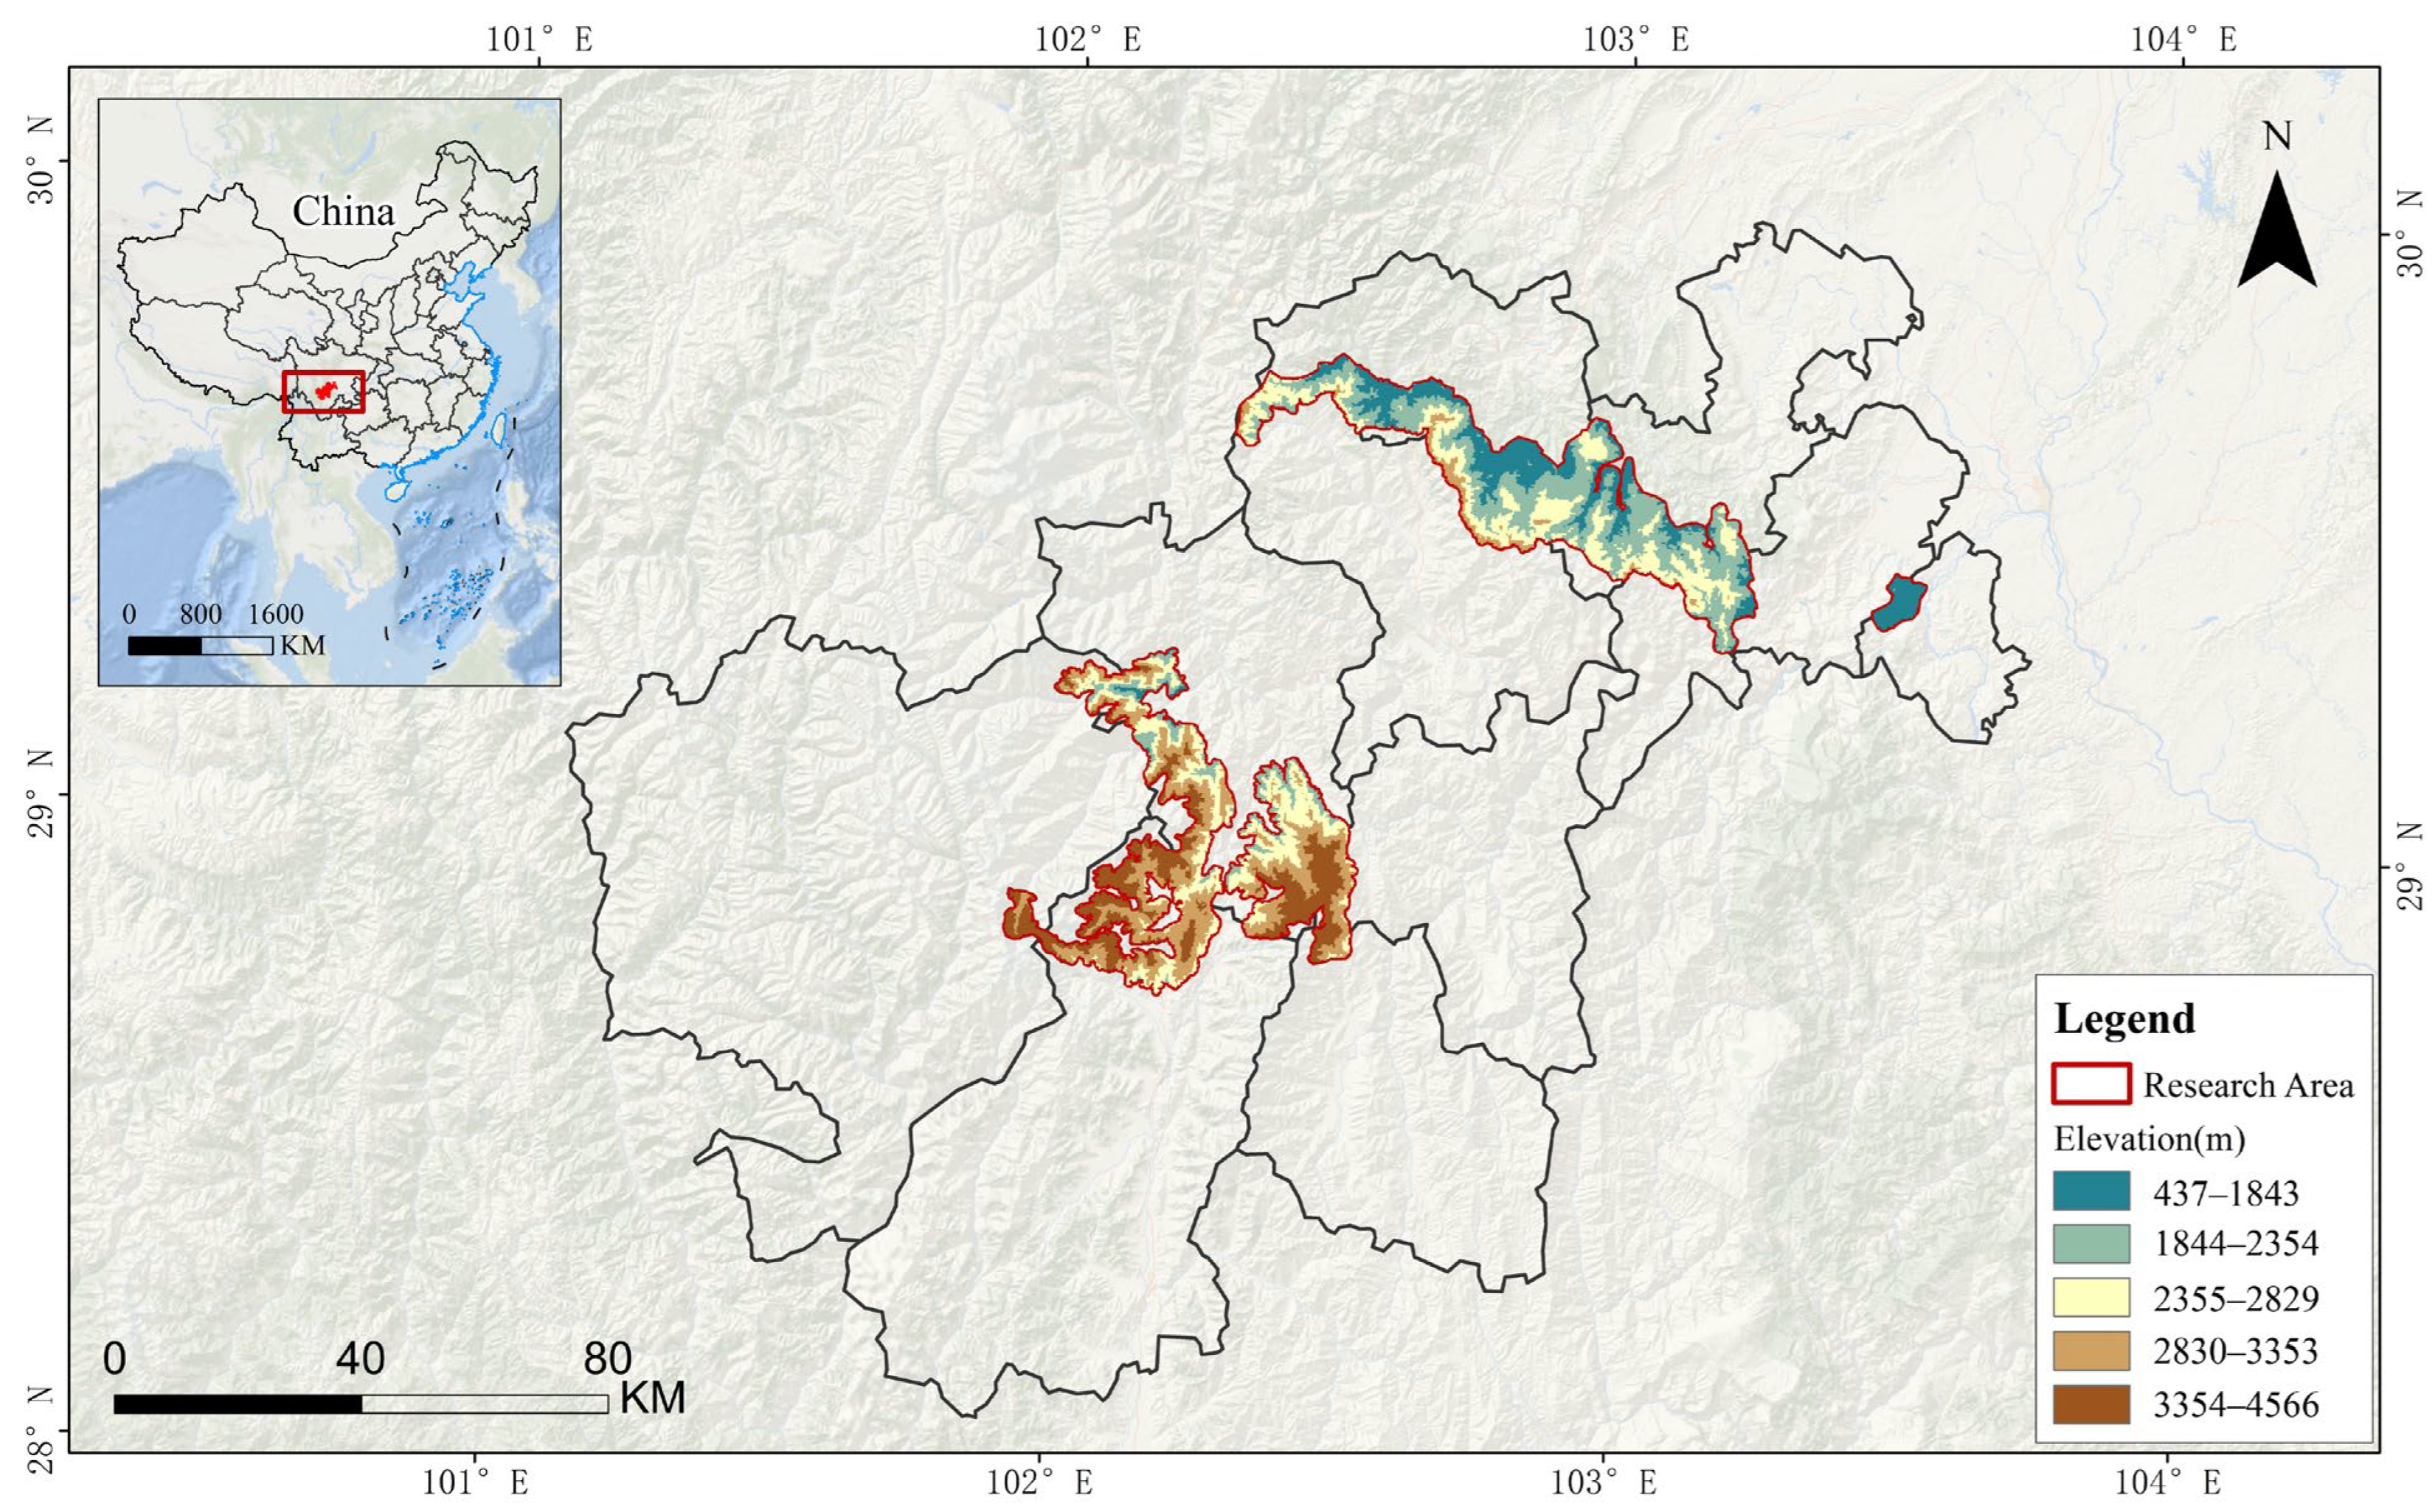
The study area is in the Daxiangling and Xiaoxiangling mountain systems located in central Sichuan Province, geographically situated between 101°55′–103°29′ E and 28°50′–29°59′ N, which is one of the critical distribution areas for wild giant panda populations in China (Figure 1) [1]. The Daxiangling mountain system, situated on the southwestern edge of the Sichuan Basin, contains tributaries of the Jinsha River, Minjiang River, Dadu River, and Qingyi River [14]. The Xiaoxiangling mountain system, located west of the Daliang Mountains, serves as the upstream and headwater area for the Yuexi River and Anning River [15]. The climate in this region is classified as a subtropical monsoon type, characterized by mild and humid conditions [16]. The complex habitat structure and well-preserved forest cover make this region a refuge for diverse wildlife, underscoring its significant ecological conservation value. In addition to giant pandas, the area hosts numerous nationally protected Class I wild animals and plants in China, including the golden snub-nosed monkey (Rhinopithecus roxellana), leopard (Panthera pardus), Chinese yew (Taxus chinensis), dove tree (Davidia involucrata), and Zhejiang butterfly orchid (Phalaenopsis zhejiangensis) [17]. Socioeconomically, residents primarily engage in agriculture, forestry, and animal husbandry as their main livelihoods. In recent years, regional economic development has intensified various human activities, including transportation infrastructure construction, hydropower development, mining operations, and tourism [18,19]. While contributing to local development, these socioeconomic activities pose potential threats to the integrity and connectivity of giant panda habitats. Therefore, selecting this region as a case study is both typical and representative for elucidating the mechanisms of habitat fragmentation driven by human activities.
Figure 1.
Habitat range map for giant panda in Xiangling region of China.
2.2. Data Collection
The spatial boundary of the study area was primarily derived from the giant panda habitat distribution range vector data provided in the Report of the Fourth National Giant Panda Survey published by the National Forestry and Grassland Administration [1]. Administrative boundary vector data was obtained from the Resource and Environment Science and Data Center, Chinese Academy of Sciences (https://www.resdc.cn/). The land use data for this study was obtained from the Chinese Multi-period Land Use/Land Cover Remote Sensing Monitoring Database developed by the Chinese Academy of Sciences, with an original spatial resolution of 30 m [20]. Using ArcGIS 10.8 reclassification techniques, the land use data was reclassified into several types, including rural settlements, urban land, industrial and mining construction land, cropland, reservoirs/ponds, grassland, water bodies, and unused land. Population density data was sourced from the LandScan Global Population Database (https://landscan.ornl.gov/, accessed on 12 January 2025). Road and Mining site data was obtained from the Resource and Environment Science and Data Center, Chinese Academy of Sciences (https://www.resdc.cn/). This study performed projection transformation and clipping on these data. Due to the lack of mining site data for 2023, data from 2020 was used as a substitute, and projection transformation and clipping were also applied to this dataset. Nighttime light data was derived from the dataset developed by Chen et al. [21].
2.3. Quantification of Human Socioeconomic Activity Intensity
Considering the actual conditions within the giant panda habitat in the Xiangling region, existing research findings, and data availability, this study selects five factors directly related to human socioeconomic activities to quantitatively assess the intensity of these activities within the habitat. These factors are land use intensity, population density, transportation accessibility, mining activities, and nighttime lights [22].
2.3.1. Land Use Status
This study assigns values to land use status based on relevant research [23,24,25,26]. Among these, urban land, rural residential areas, and other construction land are most affected by human socioeconomic activities and are assigned 10 points. Reservoirs/ponds are assigned 8 points. As the Xiangling region is mostly mountainous with relatively extensive crop production methods, cropland is assigned 7 points. Sichuan is one of China’s five major pastoral areas, where high-coverage grassland (coverage > 50%) has the highest grazing potential, medium-coverage grassland (coverage between 20–50%) is next, and low-coverage grassland (coverage < 20%) has the lowest potential; these are assigned 2, 1, and 0 points, respectively. All other land use types are assigned a value of 0.
2.3.2. Population Density
Population density data were resampled to a 30 m resolution raster using the Inverse Distance Weighting (IDW) method [27,28], and grid cells with a population density greater than 1000 people/km2 were assigned a value of 10 [29]. For grid cells with less than 1000 people/km2, values were calculated using a logarithmic equation. The specific equation is shown in Equation (1).
where represents the reassigned score for the grid cell, and represents the population density value of each grid cell.
2.3.3. Roads
The maximum influence distance of roads was set to 5000 m [25,30,31]. Euclidean distance analysis was performed for each road type using ArcGIS 10.8, and scores were assigned in the range of 0 to 10 based on the distance from the road, with higher scores indicating greater disturbance intensity (Table 1). The scores from all transportation roads in each grid cell were summed to obtain an overall traffic disturbance intensity score. The traffic road pressure was then standardized to derive the traffic disturbance intensity [32]. The standardization formula is shown in Equation (2).
where represents the standardized score of the overlaid raster data, represents the value of the overlaid raster data, represents the maximum value in the overlaid raster data, and represents the minimum value in the overlaid raster data.
Table 1.
Assignment of transportation accessibility.
2.3.4. Mining Development
The maximum influence distance of mining activities on the habitat ecological environment was set to 10,000 m [30] (Table 2). The scores from all mining activities in each grid cell were summed to obtain an overall mining activity disturbance intensity score. The mining activity pressure was then standardized (using the same formula as above) to derive the mining activity disturbance intensity [32].
Table 2.
Assignment of mineral activities.
2.3.5. Nighttime Lights
The 2023 nighttime light data was used as the benchmark; grid cells with a DN value of 0 in the 2023 data were assigned a score of 0, and those with a value greater than 0 were divided into 10 equal parts using the quantile method and assigned scores from 1 to 10 in ascending order [33]. Data for other years were processed similarly: grid cells with DN values greater than 0 were assigned scores from 1 to 10 based on the decile ranges established for 2023, and grid cells with DN values equal to 0 were assigned a score of 0. Additionally, the nighttime light data were resampled to a 30 m resolution raster using the Inverse Distance Weighting (IDW) method [27,28].
2.4. Quantification of Landscape Fragmentation
2.4.1. Selection of Landscape Fragmentation Indices
Landscape fragmentation restricts various ecological processes and is closely linked to the stability, integrity, and biodiversity of ecosystems [34]. Landscape pattern indices serve as a fundamental tool for analyzing landscape structure, function, and processes, and have been extensively employed in the assessment of landscape fragmentation [35,36]. Based on ecological principles, this study employed a suite of four landscape indices, Landscape Division Index (DIVISION), Edge Density (ED), Patch Density (PD), and Shannon’s Diversity Index (SHDI), to characterize the fragmentation degree of giant panda habitat in the Xiangling region, capturing the spatial attributes of patch dispersion, shape complexity, area subdivision, and landscape heterogeneity, respectively [37,38,39]. The formulas for each index are detailed in Table 3.
Table 3.
Landscape pattern indices.
2.4.2. Optimal Scale Analysis of Landscape Fragmentation Indices
Identifying an appropriate spatial scale is critical for accurately understanding the relationships among landscape structure, heterogeneity, and ecological processes, while landscape fragmentation also exhibits scale dependency in the evolution of landscape patterns [40]. This study employed the moving window method to examine the spatial scale effects of landscape indices, while applying inflection point analysis to comprehensively assess the trends of these indices across varying spatial scales, thereby determining the optimal spatial scale based on distinct scale transition points [41,42]. The procedure involved using a square moving window with radii set at 500 m, 750 m, 1000 m, 1250 m and 1500 m. The 1000 m window was determined as the optimal spatial scale through inflection point analysis.
2.4.3. Principal Component Analysis
This study developed a comprehensive Landscape Fragmentation Index (LFI) to assess habitat fragmentation in the Xiangling region. And conducted Principal Component Analysis (PCA) on four landscape indices for 2000, 2008, 2015, and 2023 using SPSS 27 and ArcGIS 10.8, synthesizing them into a composite variable [37]. The LFI values were then rescaled from 0 to 1, creating a standardized scale where increases directly correspond to progression in fragmentation severity, thereby enabling direct temporal comparison. As shown in Table 4, the Kaiser-Meyer-Olkin (KMO) measure of sampling adequacy values for the four years were 0.781, 0.784, 0.782, and 0.763 respectively, indicating good correlation, suitability for Principal Component Analysis, and convincing results.
Table 4.
Principal component analysis of habitat landscape index of giant panda in Xiangling region.
The year 2008, which had a relatively high KMO value, was selected for further analysis. The first and second principal components explained 90.329% and 6.751% of the original variables’ variance, respectively. The cumulative contribution rate of these two principal components reached 97.080% for the influence weight on the degree of landscape fragmentation. This indicates that the selection of the first and second principal components can reasonably represent the landscape fragmentation characteristics of the Xiangling region, and the results of the Principal Component Analysis are highly convincing [43]. Therefore, the first two principal components were selected for the calculation of the composite variable. The formula for calculating the comprehensive landscape fragmentation variable is shown in Equations (3)–(5).
where the coefficients for each principal component in the composite variable are determined by the ratio of each principal component’s influence weight to the total influence weight of the two principal components. The coefficients for each landscape index in the principal componentsand are calculated based on the principal component loadings matrix divided by the arithmetic square root of the principal component eigenvalues. are the standardized values of the landscape indices.
To quantitatively reflect the habitat fragmentation in the Xiangling region from temporal and spatial perspectives, and to further highlight the grade differences in habitat landscape fragmentation, we classified the LFI using the Natural Breaks method into five grades: Grade I (0–0.15), Grade II (0.15–0.3), Grade III (0.3–0.45), Grade IV (0.45–0.6), and Grade V (0.6–1), representing very low, low, medium, high, and very high degrees of habitat fragmentation, respectively [37].
2.5. Theil–Sen Median Trend Analysis and Mann–Kendall Test
Theil–Sen Median trend analysis is a robust non-parametric trend estimation algorithm. Its core lies in characterizing the overall trend by calculating the median of the slopes of all possible pairwise combinations of data points (a total of combinations). This computational approach effectively reduces the impact of outliers on the final trend estimate [44]. In practical application, a positive value indicates an improving trend in , while a negative value indicates a degrading trend. The formula is given by Equation (6).
The Mann–Kendall test is also a non-parametric statistical method specifically used to determine the statistical significance of trends in a time series [45]. The formulas are as shown in Equations (7)–(10).
where is the number of years; is the sign function; denotes variance; and are test statistics; , are the pixel values in year and year , respectively. Combining Theil–Sen Median trend analysis and the Mann–Kendall test can effectively reflect the spatial distribution characteristics of the change trends in the of the giant panda habitat in the Xiangling region from 2000 to 2023.
2.6. Geodetector
The analysis of driving factors was conducted using the Geodetector, drawing on its Factor and Interaction Detectors to quantify the individual and joint effects of various factors on habitat fragmentation in the Xiangling region [46].
2.6.1. Factor Detector
To assess the influence of an independent variable (X) on the spatial differentiation of a dependent variable (Y), the Factor Detector utilizes the -statistic, a quantitative measure whose calculation is given in Equation (11) [47].
where is the number of strata or categories of the independent variable X. is the number of units in stratum . is the variance of Y within stratum . is the total number of units. is the total variance of Y across the entire region. The value of ranges between [0, 1]. A larger value indicates a stronger explanatory power of X on Y. A value close to 0 or a non-significant p-value indicates a weak influence of the factor on Y. The Factor Detector uses an F-test or Monte Carlo simulation to determine whether the value is significant (e.g., p < 0.05). It does not require Y to follow a normal distribution, nor does it assume a linear relationship between X and Y, making it suitable for complex geographical data.
2.6.2. Interaction Detector
The Interaction Detector is used to assess the interaction effect of two independent variables (X1 and X2) on the spatial differentiation of the dependent variable Y [48,49].
3. Results
3.1. Analysis of Structural Changes in Habitat Landscape Fragmentation
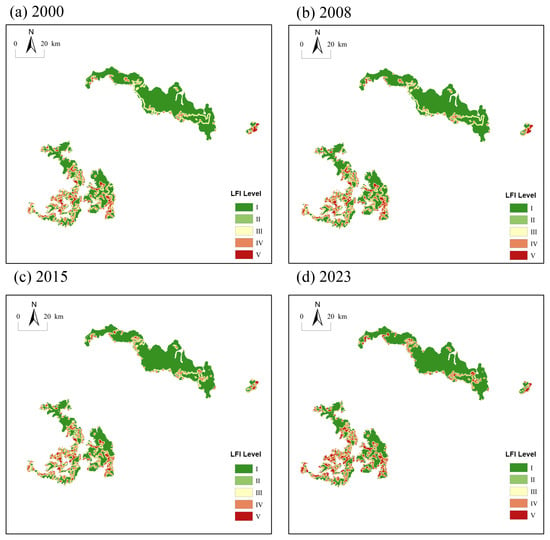
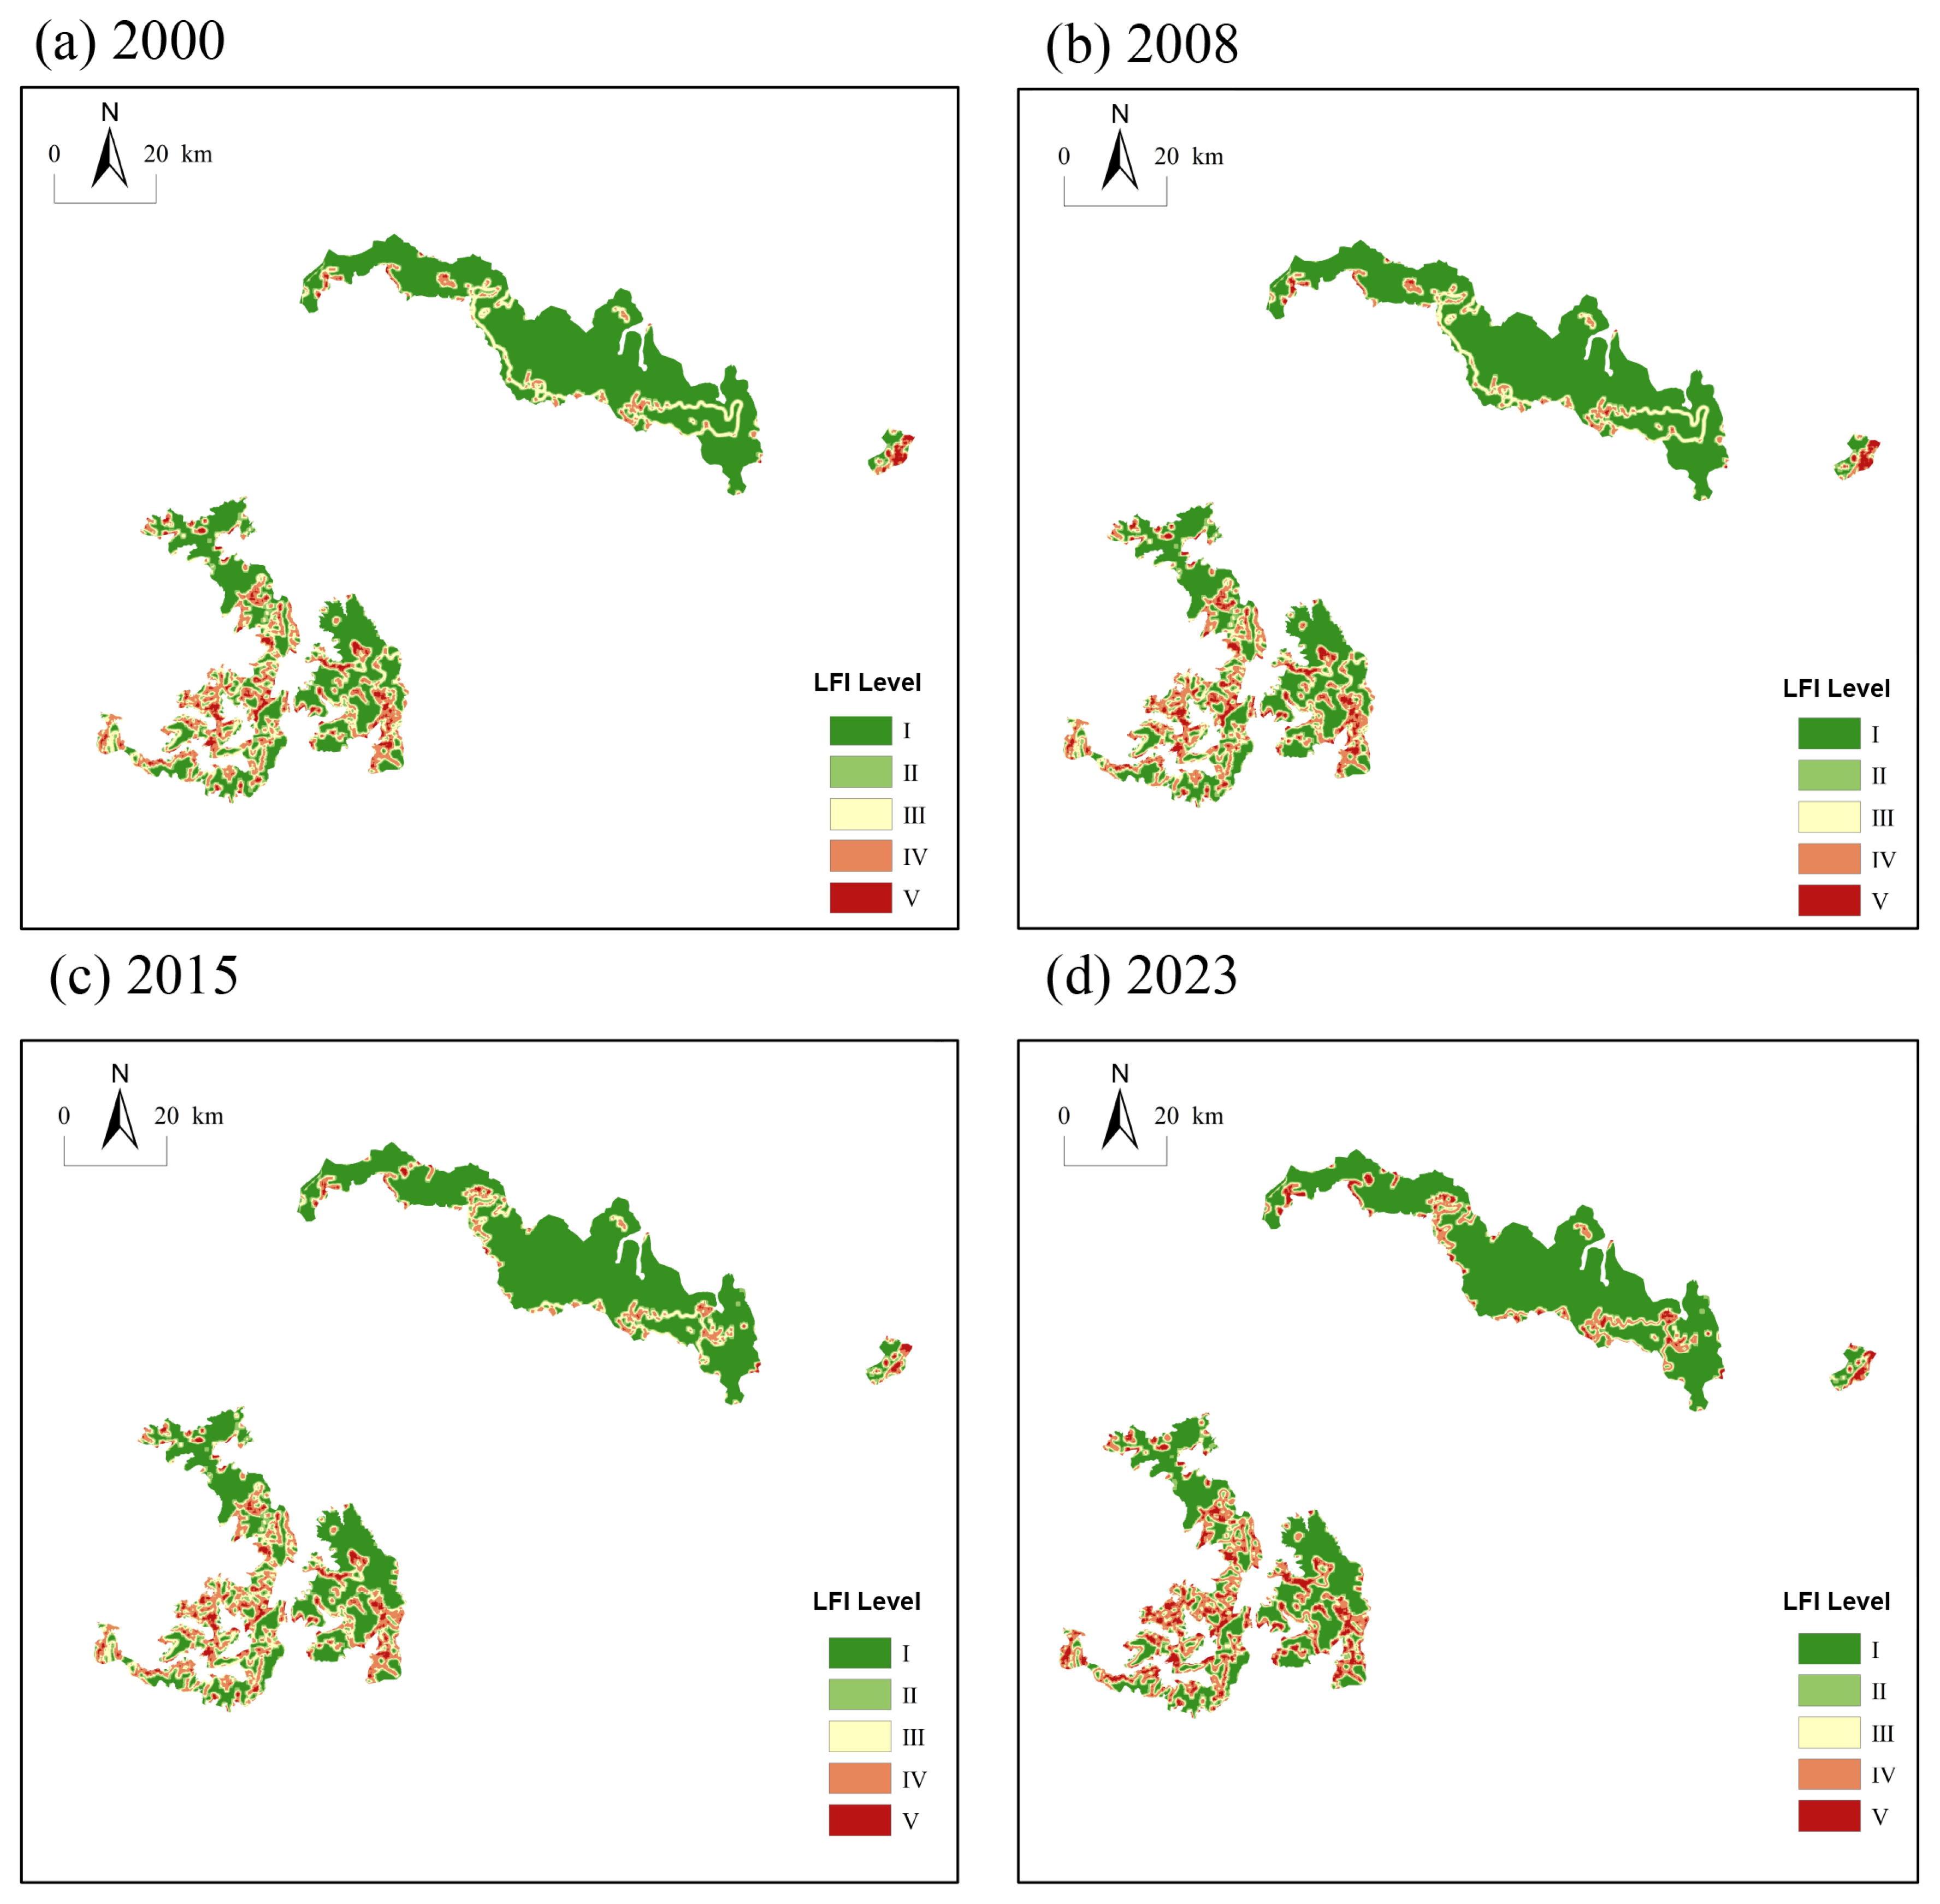
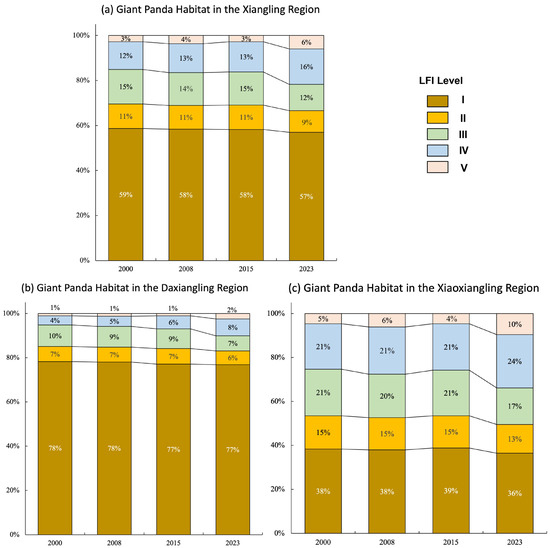
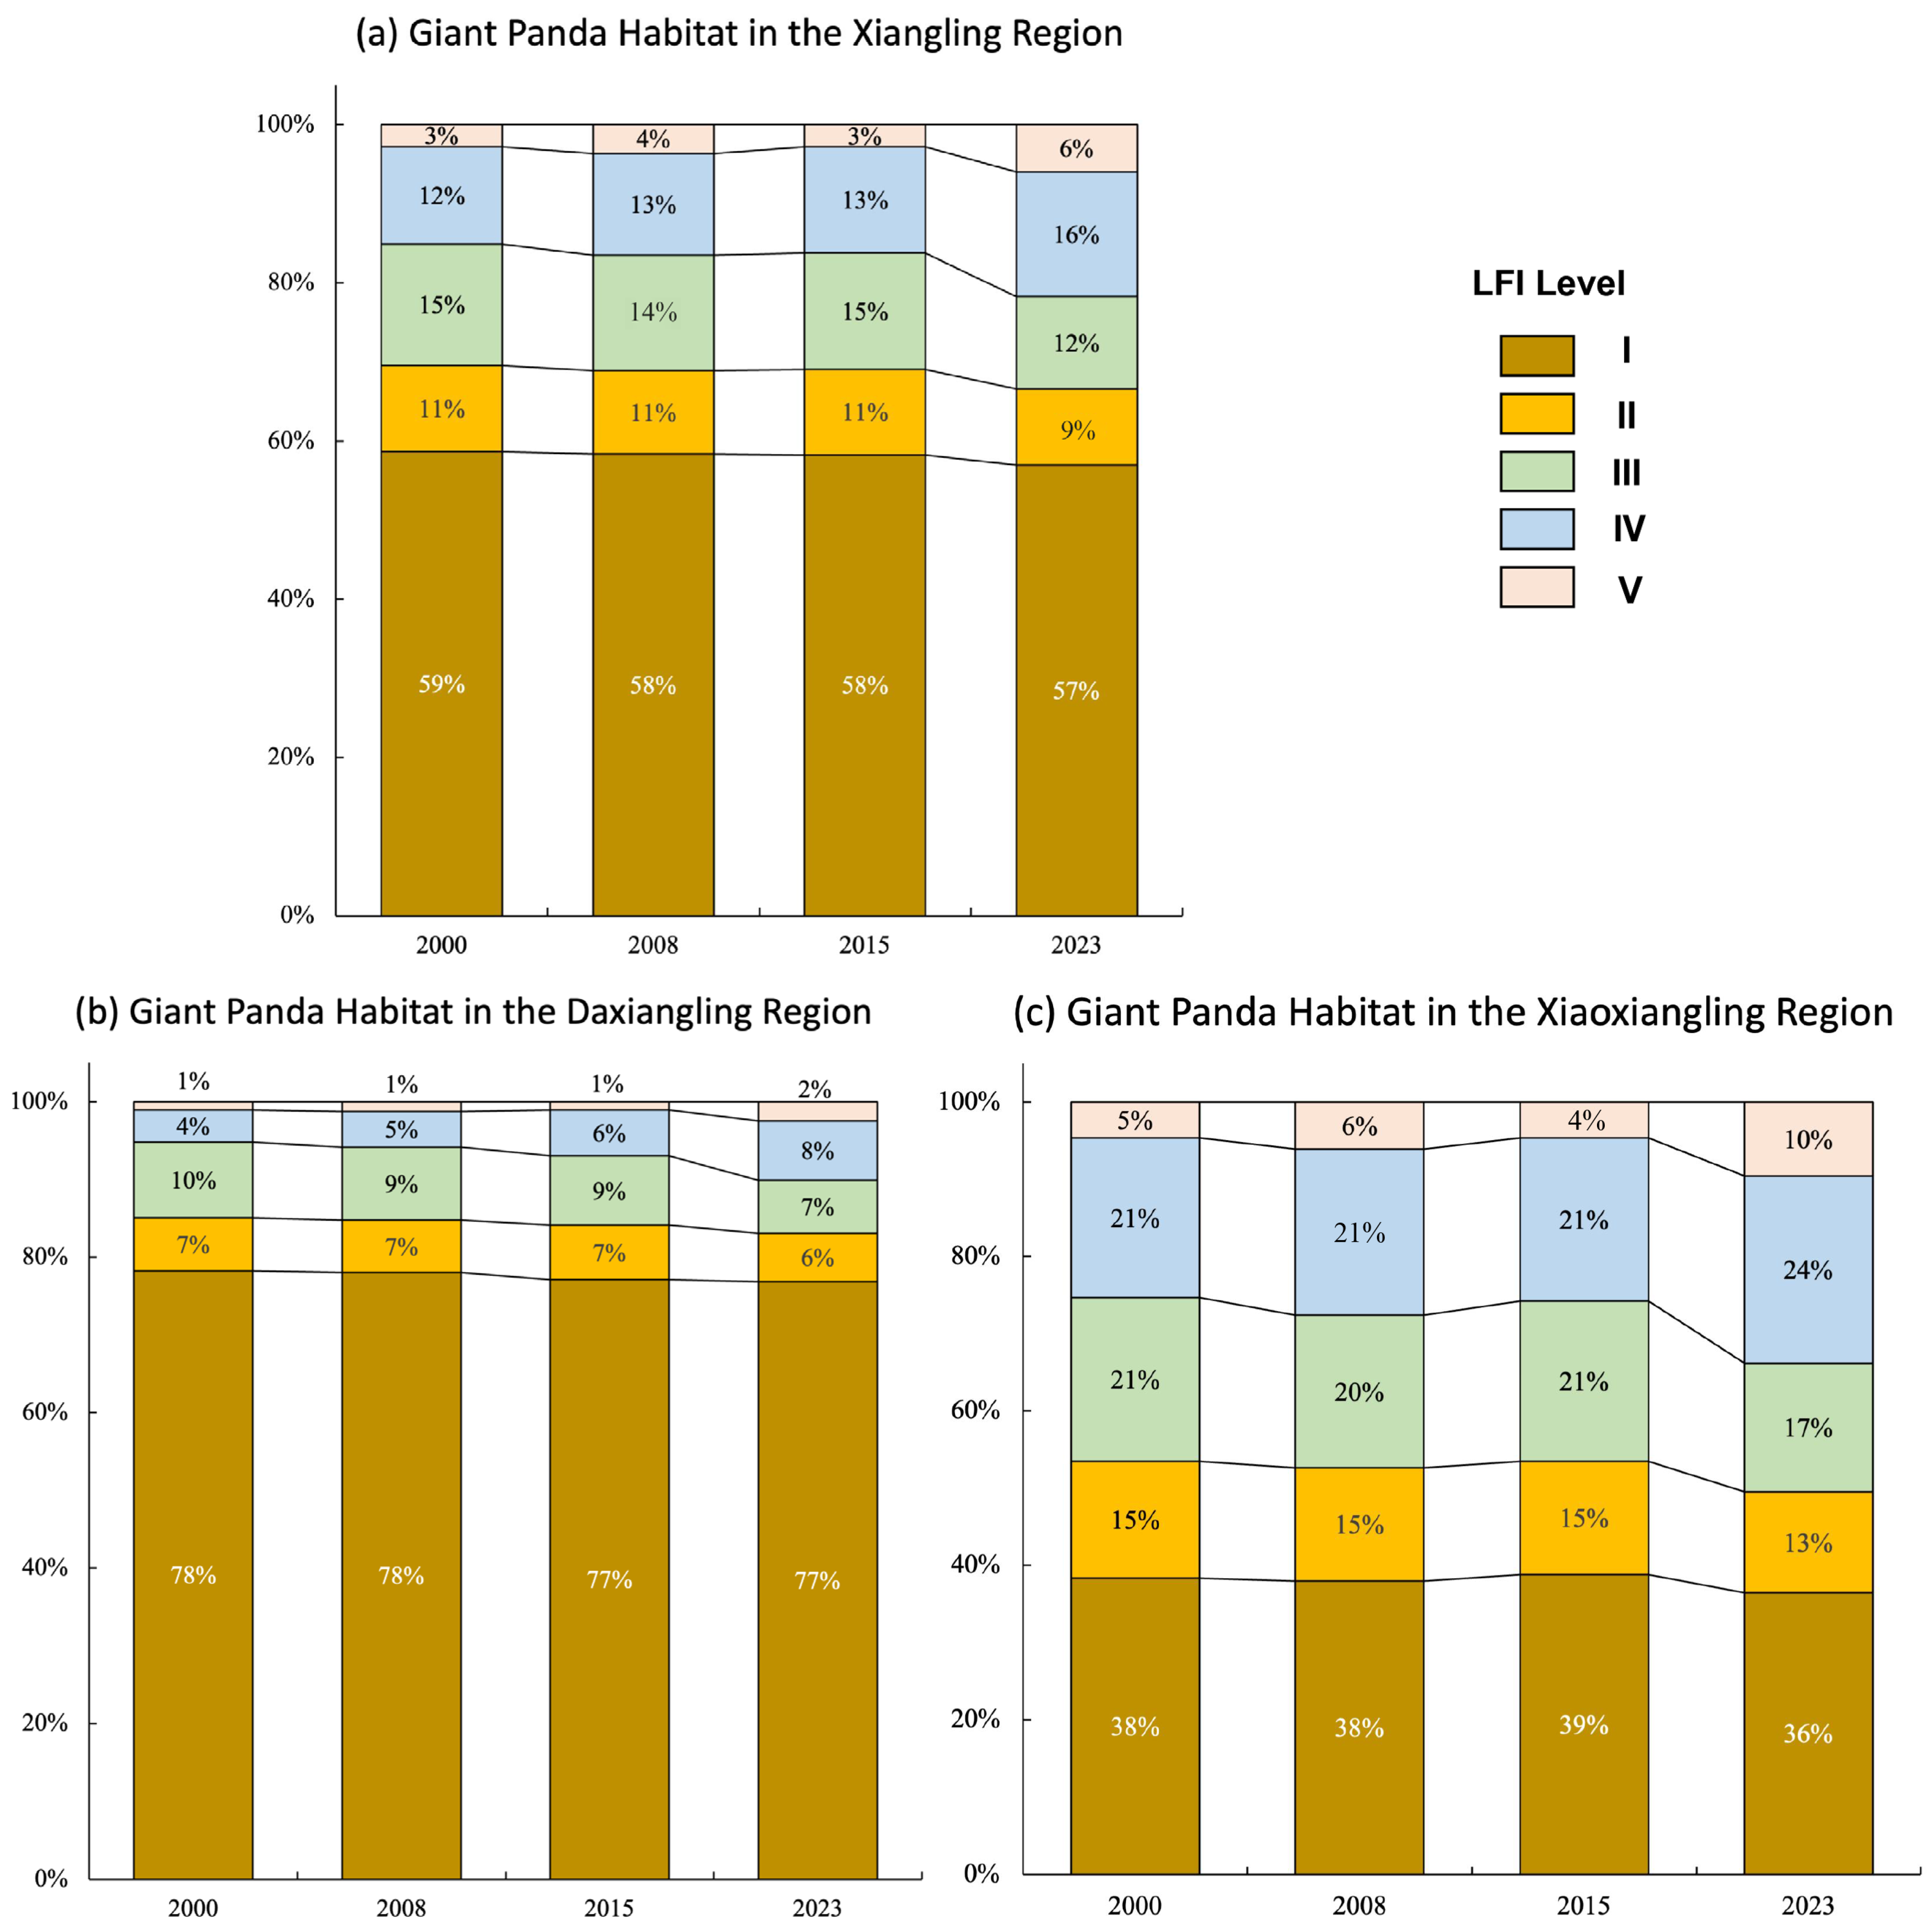
The proportions of different grades for each year are shown in Figure 2. Between 2000 and 2023, the landscape fragmentation of the giant panda habitat in the Xiangling region showed an overall trend of continuous intensification. The analysis reveals a clear transition in habitat configuration, characterized by a marked expansion of Grade V (very high fragmentation) area and a concurrent contraction of Grade I (very low fragmentation) area. Initially in 2000, the habitat was predominantly composed of Grades I and III (medium fragmentation), covering 1421.91 km2 and 372.29 km2, respectively. By 2023, this pattern had shifted significantly, with the landscape increasingly dominated by the most severely fragmented category. This change indicates that the further expansion of human activities, especially factors such as transportation and land development, has led to a gradual intensification of the fragmentation degree of the giant panda habitat.
Figure 2.
Spatial distribution of landscape fragmentation (LFI) of giant panda habitat in the Xiangling region. (a) 2000; (b) 2008; (c) 2015; (d) 2023.
The degree of habitat fragmentation increased to varying degrees in both the Daxiangling and Xiaoxiangling regions (Figure 3), with intensification particularly pronounced in the edge zones. The gradual reduction in very low fragmentation (Grade I) indicates that originally relatively intact habitats are gradually being subjected to external disturbances.
Figure 3.
Classification distribution of landscape fragmentation (LFI) in giant panda habitat in the Xiangling region. (a) Entire Xiangling region; (b) Daxiangling region; (c) Xiaoxiangling region.
3.2. Analysis of Habitat Landscape Fragmentation Trend Changes
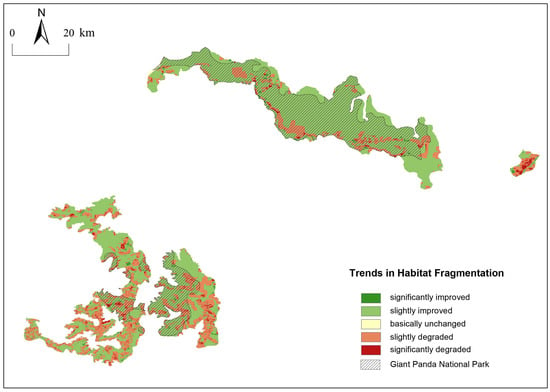
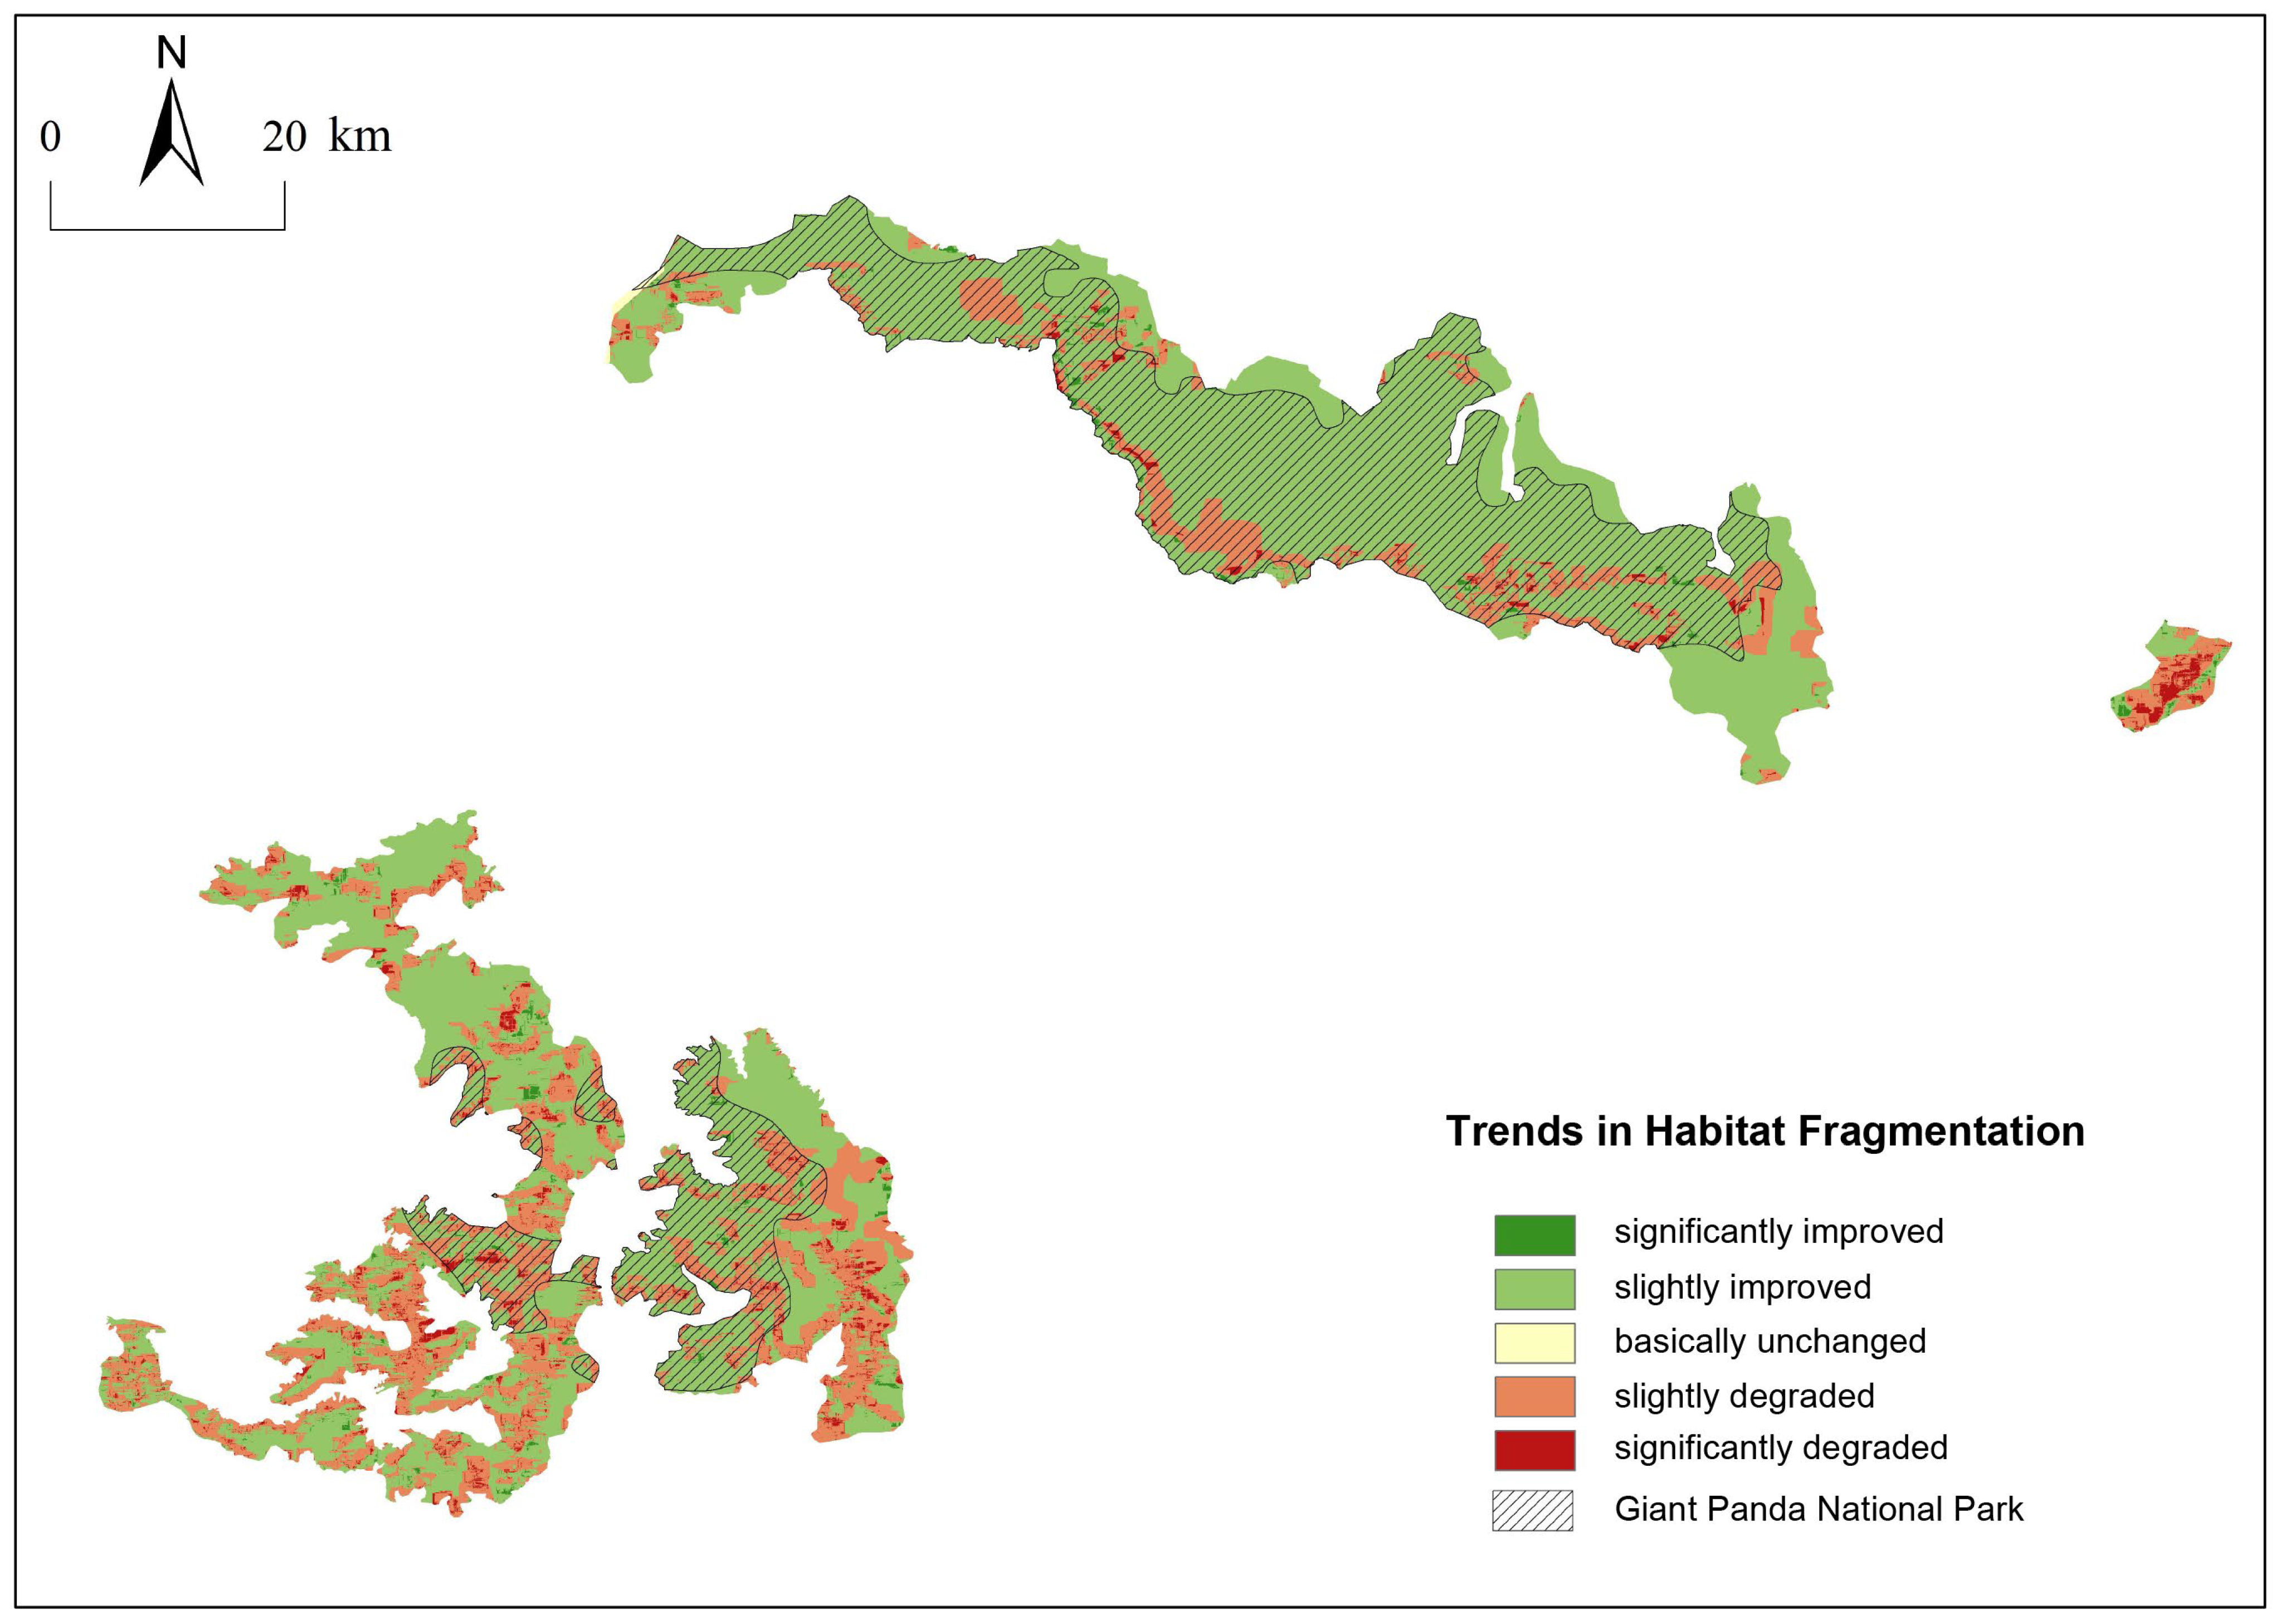
This study utilized the Theil–Sen Median trend analysis method and the Mann–Kendall test method to analyze the spatiotemporal trend changes in habitat fragmentation in the Xiangling region giant panda habitat from 2000 to 2023. Based on the actual situation of the and Z values, values greater than 0.0005 and less than −0.0005 were classified as improving and degrading trends, respectively, while values between −0.0005 and 0.0005 were categorized as basically unchanged. |Z| values less than 1.65 and greater than 1.65 correspond to slight and significant changes, respectively. By overlaying the and Z values, the LFI change trends in the study area were divided into five categories: significantly degraded, slightly degraded, basically unchanged, slightly improved, and significantly improved (Figure 4).
Figure 4.
Trend of giant panda habitat LFI changes from 2000 to 2023 in the Xiangling region.
From 2000 to 2023, the landscape fragmentation of the giant panda habitat in the Xiangling region exhibited an overall pattern of “improvement dominated—localized degradation, improvement in the core—degradation at the edges.” The area showing improvement in landscape fragmentation in the Xiangling region giant panda habitat from 2000 to 2023 was far greater than the area showing degradation (Figure 4), and from 2000 to 2023, 70.96% of the giant panda habitat area in the Xiangling region showed an improving trend in LFI (Table 5). Among these, the significantly improved areas were mainly concentrated in the core areas of the habitat, while the significantly degraded areas were mostly distributed in the edge areas of the habitat.
Table 5.
Spatial variation trend area of LFI in giant panda habitats in Xiangling region.
After the establishment of the Giant Panda National Park, 923.9 km2 within the National Park boundaries inside the habitat showed an improving trend (Table 6). The National Park area within the habitat accounts for 49% of the total giant panda habitat area in the Xiangling region. The area of LFI improvement within its boundaries accounts for more than half of the total improved area in the entire habitat, while the degraded area accounts for only 37% of the total degraded area in the entire habitat. This indicates the key conservation effectiveness of the establishment of the Giant Panda National Park, proving that the systematic conservation management of the National Park has effectively curbed the habitat fragmentation process. However, although the National Park policy has alleviated the habitat fragmentation trend, the edge areas continue to degrade, and the conservation effectiveness still shows a spatial differentiation of “strong in the core, weak at the edges.”
Table 6.
The spatial change trend area of LFI in the habitat of the Giant Panda National Park.
3.3. Analysis of Driving Factors of Habitat Fragmentation
3.3.1. Factor Detector Analysis
The Factor Detector measures the independent explanatory power of independent variables on landscape fragmentation through the -statistic, where the ranges from 0 to 1; a larger value indicates a stronger influence. The p is used to determine significance (p < 0.05 is considered significant). Combining the data from the four periods, the explanatory power of each factor on the fragmentation of the giant panda habitat in the Xiangling region is shown in Table 7.
Table 7.
Factor detection results of habitat fragmentation of giant pandas in the Xiangling region.
Analysis of the Factor Detector results shows that, except for the insignificant influence of nighttime lights on habitat fragmentation in 2000, all other factors passed the hypothesis test at the 1% significance level (p < 0.01). This indicates that the fragmentation of the giant panda habitat in the Xiangling region is driven by the combined effects of multiple human activity factors, and the degree of influence of different factors on habitat fragmentation varies significantly. Overall, the influence of the driving factors changed significantly over time. Land use status occupied the dominant position and increased annually; the influence of transportation accessibility increased; the influences of mining activities and population density gradually weakened, with mining activities being significantly affected by policy constraints; the influence of nighttime lights was the weakest but also showed an upward trend.
3.3.2. Interaction Detector Analysis
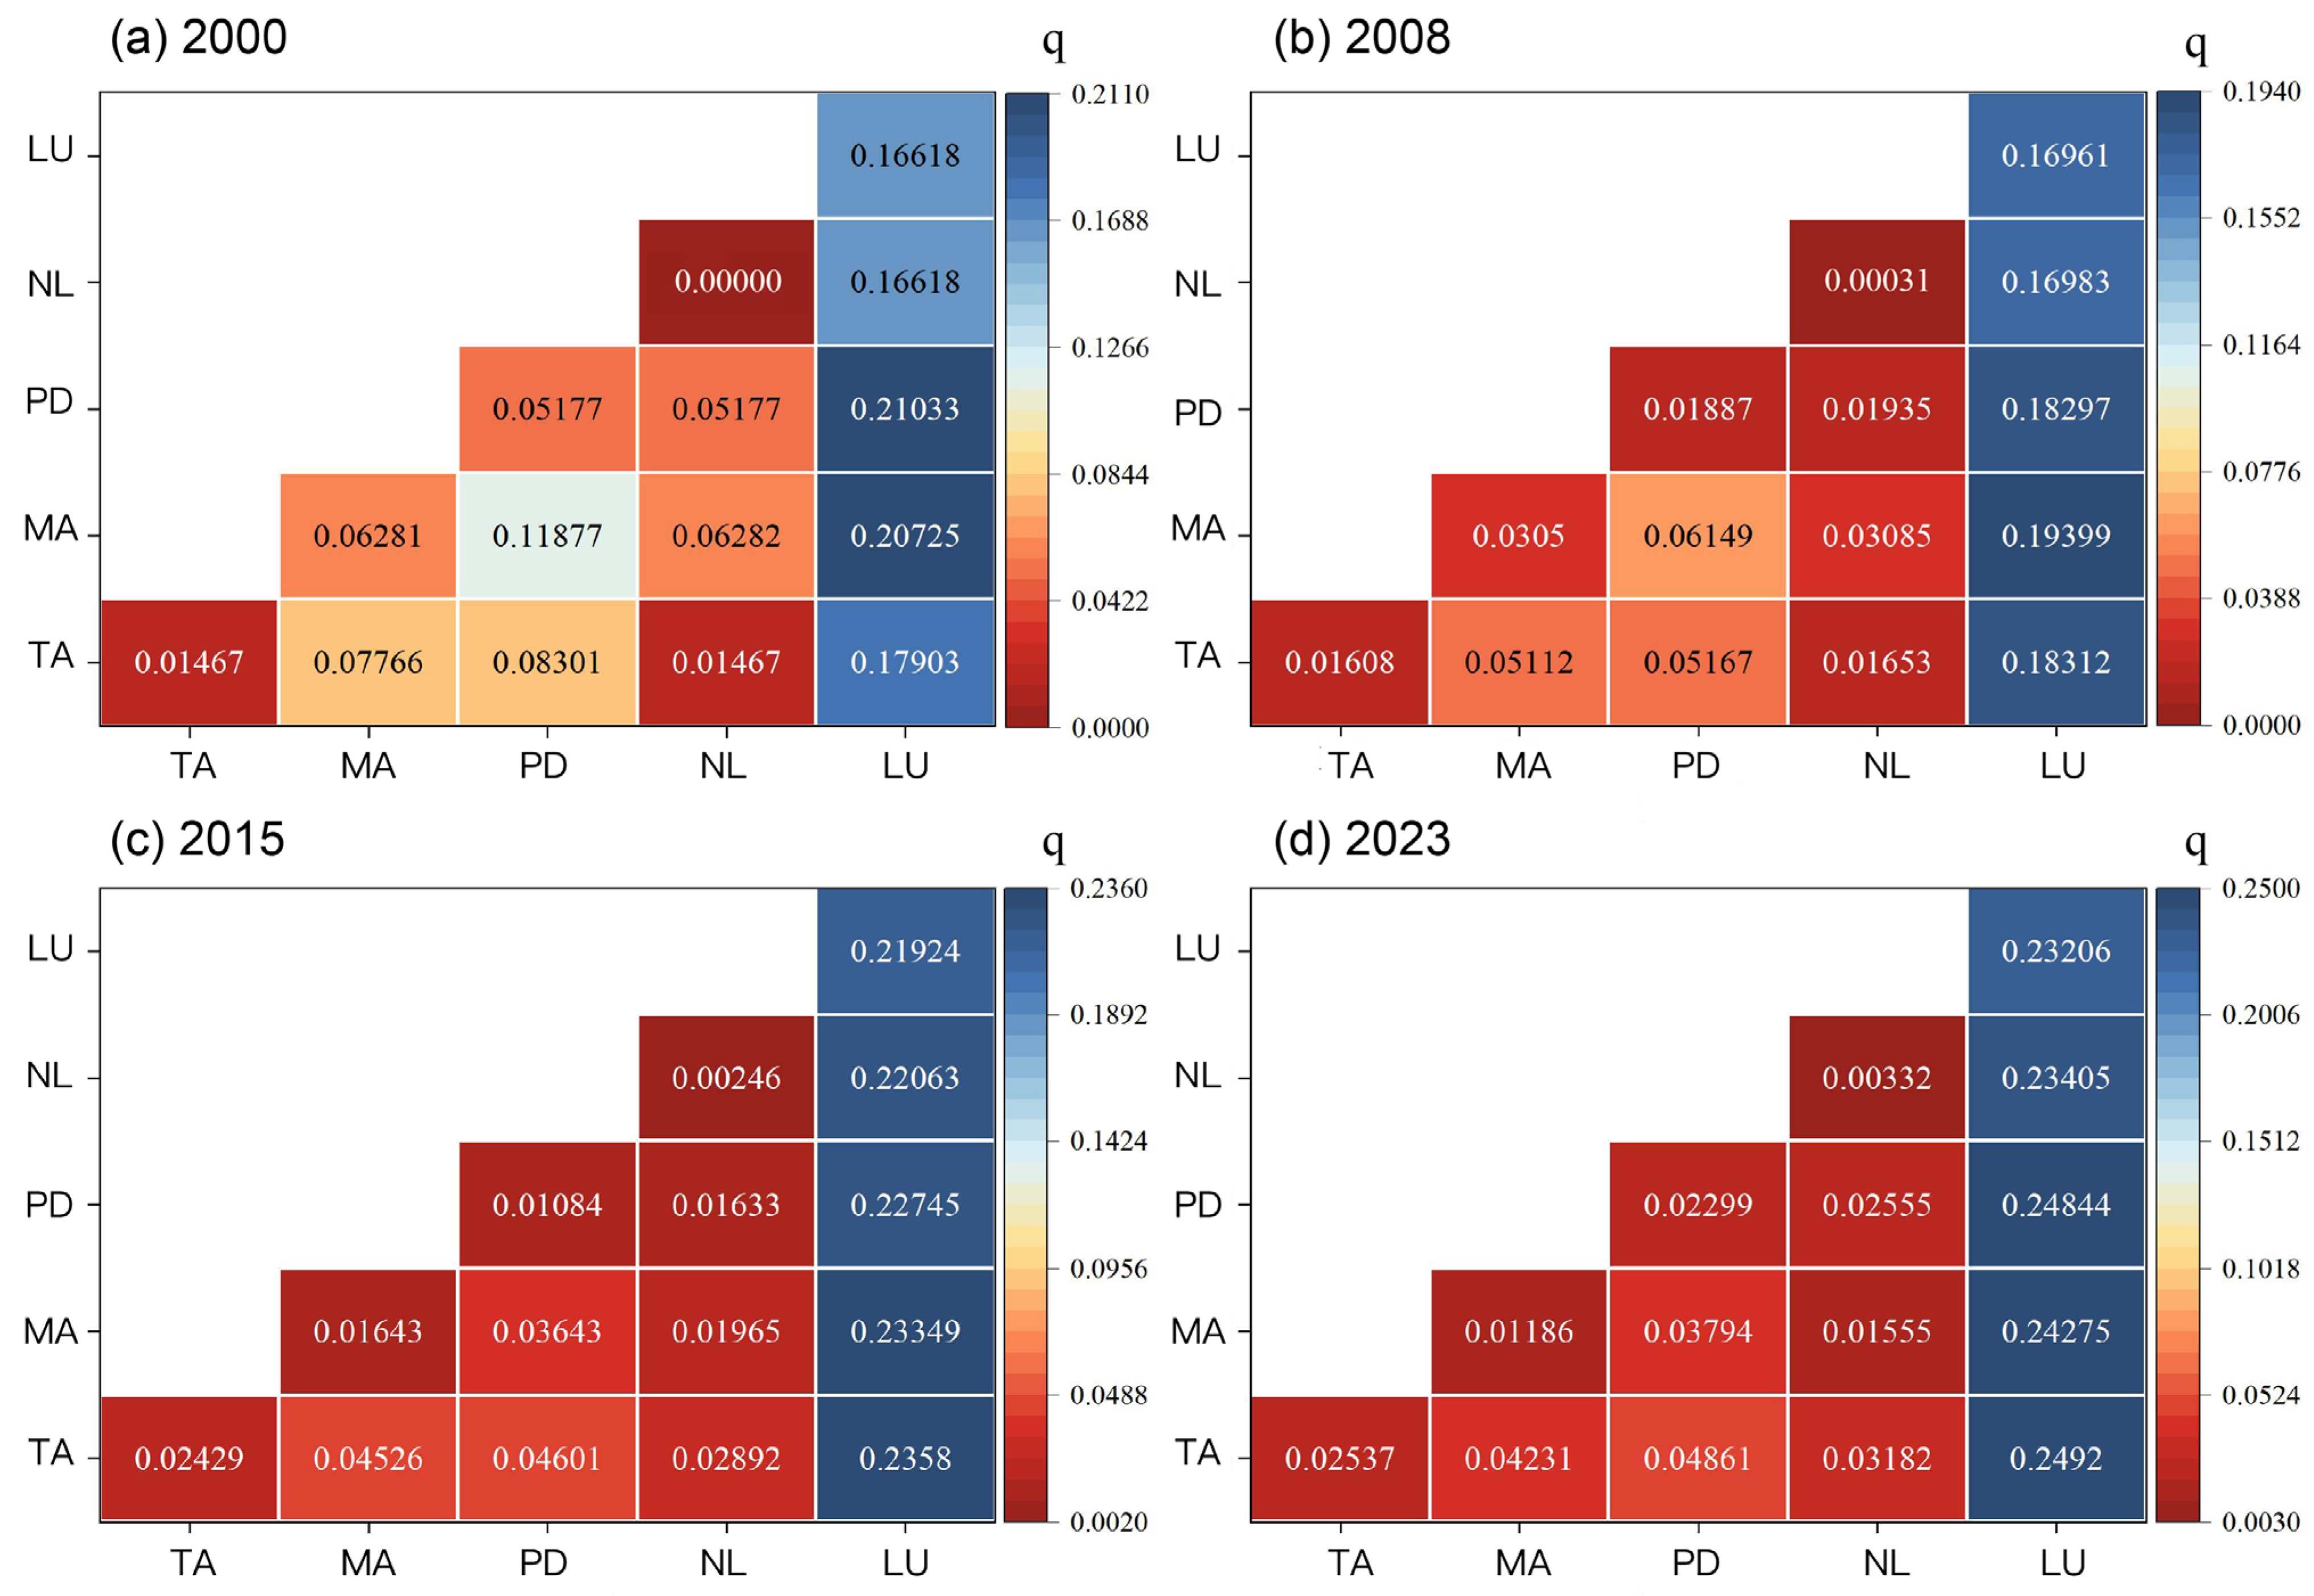
Given the complex interactions among multiple factors that collectively influence the spatial distribution pattern of habitat fragmentation, this study used the Interaction Detector to quantitatively identify the interactions of different human activities on habitat fragmentation. The results are shown in Figure 5; all factor pairs exhibit either bi-factor enhancement or nonlinear enhancement effects, with interactions involving land use status consistently yielding the highest q-values.
Figure 5.
Interaction of driving factors of habitat fragmentation of giant panda in the Xiangling region. (a) 2000; (b) 2008; (c) 2015; (d) 2023. TA: Transportation Accessibility; MA: Mining Activities; PD: Population Density; NL: Nighttime Lights; LU: Land Use Status.
During all time periods, the combined effect of any two driving factors on the fragmentation of the giant panda habitat in the Xiangling region exceeded the effect of a single driving factor, and all showed bi-factor enhancement and nonlinear enhancement effects. This indicates that the driving factors are not independent entities but have complex interactions. Based on the analysis of the four periods of data, the interaction between land use status and transportation accessibility, mining activities, and population density consistently formed the core driving combination for landscape fragmentation. The interaction q between land use status and other factors increased significantly over time, and the interaction type was predominantly “bi-factor enhancement,” indicating that the superimposed effect of land development and human activities continuously dominated the fragmentation process. The observed increase in “nonlinear enhancement” interactions signals an evolution in how human activities drive habitat fragmentation, which is from straightforward spatial overlaps to intricate, nonlinear relationships. This transition is exemplified by the changing role of transportation networks: initially, linear infrastructure expansion directly coincided with land development, fragmenting habitats through clear dissection. In later stages, road-adjacent development permeated deeper into habitats, generating fragmentation patterns of greater spatial complexity [50]. These dynamics underscore the central role of land use, whose synergistic effects with other factors now function as a primary amplifier of fragmentation across the habitat.
4. Discussion
This study reveals a pronounced spatial pattern of “core improvement versus peripheral degradation” in the giant panda habitat of the Xiangling region, reflecting distinct socio-ecological mechanisms. In the core areas, particularly within the Giant Panda National Park designated by the Chinese government, over 70% of the area exhibited an improving trend in fragmentation, providing strong evidence that stringent, centralized conservation policies can effectively curb habitat loss [51]. The establishment of the National Park has likely facilitated concrete measures such as the decommissioning of small hydropower stations, closure of illegal mines, and strict regulation of infrastructure construction, thereby alleviating direct anthropogenic pressures. Conversely, the persistent degradation in peripheral areas highlights a critical limitation of current habitat conservation: the “edge effect” of protected areas. These peripheral zones often become convergence areas for spillover effects from human activities in adjacent non-protected lands. As core areas receive strict protection, developmental pressures—including road expansion, tourism, infrastructure construction, and agriculture—are displaced toward habitat edges. From a sustainable development perspective, this phenomenon cannot be overlooked, as the ecological benefits of core protection are gradually eroded by boundary degradation, ultimately compromising the functional connectivity of the entire habitat network. Therefore, isolated protection of core areas while neglecting functional connectivity with surrounding landscapes will make long-term habitat sustainability difficult to achieve. Future conservation strategies should prioritize the management and restoration of peripheral buffers, such as implementing hierarchical zoning management [52,53]. This includes strictly protecting very low fragmentation (Grade I) areas by prohibiting development activities; strengthening monitoring and disturbance control in Grades II–III to prevent progression to higher levels; and prioritizing ecological corridor construction in Grades IV–V areas to connect fragmented patches, incorporating artificial restoration techniques such as soil stabilization and vegetation reconstruction.
Factor detector results indicate that land use status is the dominant driver of habitat fragmentation, a dominance that is not coincidental. Land use serves as the spatial carrier and resource foundation of human socioeconomic activities, directly reflecting regional development intensity and resource allocation patterns [2,54]. As a critical link connecting economic development and ecological protection, it not only supports various human activities such as urban and rural construction, agricultural production, transportation networks, and industrial mining development, but also directly manifests human intervention in natural ecosystems. In the Xiangling region, we identify three primary drivers of land use change. First, land conversion induced by infrastructure development, where transportation network expansion directly occupies habitat. Second, extractive land use: although mining activities have shown a weakening trend due to policy constraints, they have historically created permanent, high-intensity disturbance patches that fragment the landscape. Third, agricultural development: driven by local livelihood needs, forest edges are readily converted to farmland or pasture, progressively encroaching upon habitat boundaries.
The study also reveals a persistently strengthening interaction between land use and transportation accessibility, indicating a strong positive feedback mechanism between land development and transportation network expansion. Road construction provides access and impetus for land development, while roadside development further exacerbates habitat dissection and infiltration, ultimately forming more spatially heterogeneous fragmentation patterns. Furthermore, the evolution of interaction types from “bi-factor enhancement” to “nonlinear enhancement” signals increasing complexity in fragmentation mechanisms. As socioeconomic activities become deeply intertwined and mutually catalytic in space, they generate synergistic effects where combined impacts exceed the sum of individual factors. This nonlinearity necessitates systematic thinking in conservation decision-making; linear prediction models relying on historical data or single scenarios may underestimate future fragmentation risks. Therefore, developing spatially explicit models that integrate multifactor nonlinear interactions is crucial for accurately predicting future changes, identifying potential conflict areas, and implementing proactive conservation.
Although this study systematically analyzed the mechanisms by which five types of human activity factors drive habitat fragmentation, it did not incorporate natural factors such as topography and climate, leaving limitations in indicator comprehensiveness and in-depth revelation of causal mechanisms. Therefore, future research is recommended to further refine multi-source indicator systems and integrate spatially explicit models with genetic methods to more accurately simulate fragmentation evolution pathways and their potential impacts on population gene flow.
5. Conclusions
The Xiangling region serves as a critical ecological corridor connecting giant panda populations and represents one of the most prominent areas of conflict between human activities and wildlife protection in China. By systematically revealing the evolution patterns and driving mechanisms of giant panda habitat fragmentation in the Xiangling region from 2000 to 2023, this study provides scientific evidence for understanding ecological response processes in coupled human–natural systems, offering important theoretical and practical value for optimizing National Park functional zoning and coordinating regional development with biodiversity conservation. The study yields the following conclusions:
Habitat fragmentation intensified with significant spatial heterogeneity. The Landscape Fragmentation Index (LFI) increased continuously throughout the study period, exhibiting a pattern of “low fragmentation in core areas, high fragmentation at the periphery.” Areas of very high fragmentation (Grade V) expanded markedly along habitat edges, indicating that anthropogenic pressures are progressively encroaching upon habitat margins.
Fragmentation trends exhibited core–periphery divergence. Trend analysis revealed that 70.96% of the habitat area showed improving LFI trends, predominantly concentrated within the Giant Panda National Park, demonstrating the effectiveness of strict protection. Conversely, nearly 30% of peripheral areas continued to degrade, highlighting the inadequacy of focusing solely on core area protection and the necessity of integrated landscape-scale management.
Land use status was the dominant driver, with synergistic interactions amplifying fragmentation effects. Factor detector analysis confirmed land use as the primary driving factor, with its influence strengthening over time. Interaction detector analysis revealed that all factor pairs exhibited either bi-factor enhancement or nonlinear enhancement effects, with land use consistently forming the core of synergistic combinations. This indicates that fragmentation is not the product of isolated pressures but emerges from complex interactions among multiple human activities, with land use serving as an amplifier.
Conservation effectiveness exhibited spatial differentiation. The establishment of the Giant Panda National Park curtailed fragmentation trends within its boundaries, yet peripheral degradation persisted. This underscores the necessity of extending conservation interventions from core areas to peripheral buffers and connectivity zones.
Based on the above conclusions, we propose the following policy recommendations: (1) Adopt hierarchical zoning management strategies for the entire habitat landscape. Management must extend beyond core protected areas to include peripheral regions, with ecological connectivity incorporated as a core objective in land use planning. (2) Establish cross-sectoral coordination mechanisms involving forestry, transportation, mining, and agriculture departments to conduct cumulative impact assessments before major projects involving land use. (3) Strengthen community co-management to buffer peripheral degradation. Degradation in edge zones often stems from local community livelihood needs, necessitating conservation strategies that emphasize community participation. (4) Establish dynamic monitoring and adaptive management systems. The spatial heterogeneity and temporal trends in fragmentation underscore the necessity of continuous monitoring.
Author Contributions
Conceptualization, C.H., H.W. and C.W.; methodology, C.H., H.W. and C.W.; software, H.W. and C.W.; validation, H.W.; formal analysis, H.W.; investigation, C.W.; resources, C.W.; data curation, H.W. and C.W.; writing—original draft preparation, H.W., C.W. and C.H.; writing—review and editing, C.H. and H.W.; visualization, C.H. and H.W.; supervision, C.H.; project administration, C.H.; funding acquisition, C.H. All authors have read and agreed to the published version of the manuscript.
Funding
This research was supported by the National Forestry and Grassland Administration Commissioned Project: Study on the Impact of Socioeconomic Development on Giant Pandas and Their Habitat in the Daxiangling and Xiaoxiangling Regions, grant number 2017-115.
Institutional Review Board Statement
Not applicable.
Informed Consent Statement
Not applicable.
Data Availability Statement
Data can be provided upon request.
Acknowledgments
We would like to thank the participants for providing data support.
Conflicts of Interest
The authors declare no conflicts of interest.
References
- NFGA (National Forestry and Grassland Administration). The 4th National Survey Report on Giant Panda in China; Science Press: Beijing, China, 2021. [Google Scholar]
- Zhang, H.; Feng, B.; Qi, D.; Zhang, J.; Wang, B.; Yin, H.; Mao, Z.; Pu, G.; Fu, L.; Hull, V. Habitat status and feasibility of constructing corridors for a vulnerable population of giant pandas. Glob. Ecol. Conserv. 2024, 54, e03190. [Google Scholar] [CrossRef] [Scilit]
- Fletcher, R.J.; Didham, R.K.; Banks-Leite, C.; Barlow, J.; Ewers, R.M.; Rosindell, J.; Holt, R.D.; Gonzalez, A.; Pardini, R.; Damschen, E.I.; et al. Is habitat fragmentation good for biodiversity? Biol. Conserv. 2018, 226, 9–15. [Google Scholar] [CrossRef] [Scilit]
- Connor, T.; Qiao, M.; Scribner, K.; Zhang, J.; Hull, V.; Bai, W.; Shortridge, A.; Li, R.; Zhang, H.; Liu, J. Complex effects of habitat amount and fragmentation on functional connectivity and inbreeding in a giant panda population. Conserv. Biol. 2022, 36, e13828. [Google Scholar] [CrossRef] [Scilit]
- Loucks, C.J.; Zhi, L.; Dinerstein, E.; Wang, D.; Fu, D.; Wang, D. The giant pandas of the Qinling Mountains, China: A case study in designing conservation landscapes for elevational migrants. Conserv. Biol. 2003, 17, 558–565. [Google Scholar] [CrossRef] [Scilit]
- Yan, X. Status, challenges and prospects of wild giant pandas. Acta Theriol. Sin. 2005, 25, 402–406. [Google Scholar]
- Zhang, X.Y.; Ning, X.G.; Wang, H.; Liu, Y.F.; Liu, R.W. Impact of human footprint on landscape fragmentation in Northeast China Tiger and Leopard National Park. Acta Ecol. Sin. 2022, 42, 4688–4702. [Google Scholar]
- Wanghe, K.; Guo, X.; Hu, F.; Ahmad, S.; Jin, X.; Khan, T.U.; Xiao, Y.; Luan, X. Spatial coincidence between mining activities and protected areas of giant panda habitat: The geographic overlaps and implications for conservation. Biol. Conserv. 2020, 247, 108600. [Google Scholar] [CrossRef] [Scilit]
- Hu, L.; Feng, B.; Zhang, J.; Dong, X.; Tang, J.; Zhou, C.; Qi, D.; Bai, W. Impacts of land-use change on the habitat suitability and connectivity of giant panda. Glob. Ecol. Conserv. 2024, 53, e03019. [Google Scholar] [CrossRef] [Scilit]
- Liu, J.; Ouyang, Z.; Taylor, W.W.; Groop, R.; Tan, Y.; Zhang, H. A framework for evaluating the effects of human factors on wildlife habitat: The case of giant pandas. Conserv. Biol. 1999, 13, 1360–1370. [Google Scholar] [CrossRef] [Scilit]
- Fan, J.T.; Li, J.S.; Quan, Z.J.; Luo, J.W.; Hu, L.L.; Xiao, N.W.; Wu, X.P. Impact of Yangtao Highway on the landscape pattern of giant panda habitat in Qinling Mountains. Chin. J. Ecol. 2009, 28, 2082–2087. [Google Scholar]
- Yan, Z.; Dayananda, B.; Qin, W.; Gao, J.; Wang, X.; Popovic, I. System evolution model of human disturbances in panda habitats. Ecol. Model. 2023, 484, 110483. [Google Scholar] [CrossRef] [Scilit]
- Tian, H.W.; Zeng, Y.; Zhang, Z.J.; Lu, M.; Wei, W. Grazing-Induced Habitat Degradation: Challenges to Giant Panda Survival Resulting from Declining Bamboo and Soil Quality. Animals 2025, 15, 202. [Google Scholar] [CrossRef] [Scilit] [PubMed]
- Xu, W.H.; Ouyang, Z.Y.; Jiang, Z.Y.; Zheng, H.; Liu, J.G. Assessment of giant panda habitat and conservation strategy in the Daxiangling mountain range. Biodivers. Sci. 2006, 14, 223–231. [Google Scholar] [CrossRef] [Scilit]
- Wei, C.K.; Zhao, Y.K.; He, C. Analysis of land use landscape pattern changes and socioeconomic influencing factors in giant panda habitat of the Xiangling region. J. Beijing For. Univ. (Soc. Sci.) 2025, 24, 78–89. [Google Scholar]
- Li, C.; Hou, R.; Bao, Z.Q.; Wu, W.; Owens, J.R.; Bi, W.; Xu, Q.; Gu, X.; Xiang, Z.; Qi, D. Measuring ecosystem services and ecological sensitivity for comprehensive conservation in Giant Panda National Park. Conserv. Biol. 2024, 38, e14215. [Google Scholar] [CrossRef] [Scilit]
- Wang, M.; Chen, Q.Y.; Deng, J.; Wang, Y.Y.; Tan, Q.W.; He, Q.L.; Huang, Y.Y. Spatiotemporal variation characteristics of ecological environment quality in the Qionglai-Daxiangling sector of Giant Panda National Park. J. China West Norm. Univ. (Nat. Sci.) 2026, 47, 27–33. [Google Scholar]
- Qin, Q.; Wang, S.; Liu, Y.Q.; Zhang, Y.; Tan, H.L.; Yu, X.O. Analysis of disturbance factors and landscape pattern characteristics in giant panda nature reserves of Sichuan Province. Resour. Dev. Mark. 2025, 41, 1012–1020. [Google Scholar]
- Yang, B.; Qin, W.R.; Fu, M.X.; Xu, Y.; Zhu, L.; Pan, H.; Chen, Z.; Dai, Q.; Yang, Z.; Gu, X.; et al. A conceptual framework for conserving giant panda habitat: Restoration and connectivity. Biol. Rev. 2025, 100, 2299–2311. [Google Scholar] [CrossRef] [Scilit]
- Shen, F.; Yang, L.; He, X.; Zhou, C.; Adams, J.M. Understanding the spatial–temporal variation of human footprint in Jiangsu Province, China, its anthropogenic and natural drivers and potential implications. Sci. Rep. 2020, 10, 13316. [Google Scholar] [CrossRef] [Scilit]
- Chen, Z.; Yu, B.; Yang, C.; Zhou, Y.; Yao, S.; Qian, X.; Wang, C.; Wu, B.; Wu, J. An extended time series (2000–2018) of global NPP-VIIRS-like nighttime light data from a cross-sensor calibration. Earth Syst. Sci. Data 2021, 13, 889–906. [Google Scholar] [CrossRef] [Scilit]
- Wang, X.; Liu, G.; Xiang, A.; Qureshi, S.; Li, T.; Song, D.; Zhang, C. Quantifying the human disturbance intensity of ecosystems and its natural and socioeconomic driving factors in urban agglomeration in South China. Environ. Sci. Pollut. Res. 2022, 29, 11493–11509. [Google Scholar] [CrossRef] [Scilit]
- Sanderson, E.W.; Jaiteh, M.; Levy, M.A.; Redford, K.H.; Wannebo, A.V.; Woolmer, G. The human footprint and the last of the wild. BioScience 2002, 52, 891–904. [Google Scholar] [CrossRef] [Scilit]
- Gassert, F.; Venter, O.; Watson, J.E.M.; Brumby, S.P.; Mazzariello, J.C.; Atkinson, S.C.; Hyde, S. An operational approach to near real time global high resolution mapping of the terrestrial Human Footprint. Front. Remote Sens. 2023, 4, 1130896. [Google Scholar] [CrossRef] [Scilit]
- Yin, L.; Dai, E.; Zheng, D.; Wang, Y.; Ma, L.; Tong, M. Spatio-temporal analysis of the human footprint in the Hengduan Mountain region: Assessing the effectiveness of nature reserves in reducing human impacts. J. Geogr. Sci. 2020, 30, 1140–1154. [Google Scholar] [CrossRef] [Scilit]
- Li, S.; Wu, J.; Gong, J.; Li, F. Human footprint in Tibet: Assessing the spatial layout and effectiveness of nature reserves. Sci. Total Environ. 2018, 621, 18–29. [Google Scholar] [CrossRef] [Scilit]
- Xiang, N.; Dong, K.H.; Yao, Y.W.; Wang, G.; Wang, M.X. A method for delineating priority protected areas in river headwaters based on water resources supply-demand relationship: A case study of Moyang River Basin in Guangdong Province. J. Environ. Eng. Technol. 2025, 15, 29–37. [Google Scholar]
- Guo, X.X.; Liu, G.B.; Zhang, H.R.; Liu, X.Z.; Zeng, J. Influencing factors and distribution characteristics of soil organic carbon in South Asian tropical forests of China. Acta Ecol. Sin. 2025, 45, 2669–2681. [Google Scholar]
- Venter, O.; Sanderson, E.W.; Magrach, A.; Allan, J.R.; Beher, J.; Jones, K.R.; Possingham, H.P.; Laurance, W.F.; Wood, P.; Fekete, B.M.; et al. Sixteen years of change in the global terrestrial human footprint and implications for biodiversity conservation. Nat. Commun. 2016, 7, 12558. [Google Scholar] [CrossRef] [Scilit]
- Woolmer, G.; Trombulak, S.C.; Ray, J.C.; Doran, P.J.; Anderson, M.G.; Baldwin, R.F.; Morgan, A.; Sanderson, E.W. Rescaling the human footprint: A tool for conservation planning at an ecoregional scale. Landsc. Urban Plan. 2008, 87, 42–53. [Google Scholar] [CrossRef] [Scilit]
- He, K.; Dai, Q.; Gu, X.; Zhang, Z.; Zhou, J.; Qi, D.; Gu, X.; Yang, X.; Zhang, W.; Yang, B.; et al. Effects of roads on giant panda distribution: A mountain range scale evaluation. Sci. Rep. 2019, 9, 1110. [Google Scholar] [CrossRef] [Scilit]
- Ai, M.; Chen, X.; Yu, Q. Spatial correlation analysis between human disturbance intensity (HDI) and ecosystem services value (ESV) in the Chengdu-Chongqing urban agglomeration. Ecol. Indic. 2024, 158, 111555. [Google Scholar] [CrossRef] [Scilit]
- Duan, Q.T.; Luo, L.H. A dataset of human footprint on the Qinghai-Tibet Plateau during 1990–2015. China Sci. Data 2020, 5, 303–312. [Google Scholar] [CrossRef] [Scilit]
- Mitchell, M.G.E.; Suarez-Castro, A.F.; Martinez-Harms, M.; Maron, M.; McAlpine, C.; Gaston, K.J.; Johansen, K.; Rhodes, J.R. Reframing landscape fragmentation’s effects on ecosystem services. Trends Ecol. Evol. 2015, 30, 190–198. [Google Scholar] [CrossRef] [Scilit]
- Zhao, R.F.; Jiang, P.H.; Zhao, H.L.; Xie, Z.L.; Jin, J.L. The impact of land use/cover change on Zhangye Heihe Wetland National Nature Reserve’s landscape fragmentation. J. Nat. Resour. 2013, 28, 583–595. [Google Scholar]
- Cao, C.C.; Su, F.L.; Li, H.F.; Wei, C.; Sun, D. Landscape fragmentation and driving mechanisms of Suaeda salsa wetlands in the Liaohe Estuary. Acta Ecol. Sin. 2022, 42, 581–589. [Google Scholar] [CrossRef] [Scilit]
- Zhang, R.F.; Xiao, M.; Liu, Z.C. Spatiotemporal heterogeneity and driving factors of landscape fragmentation in the Beijing-Tianjin-Hebei region. Ecol. Environ. Sci. 2025, 34, 461–473. [Google Scholar]
- Shen, R.; Shi, Z.T.; He, G.X; Lin, Y.H.; Xu, R. Construction and optimization of ecological security pattern in Xishuangbanna based on landscape fragmentation index. Trop. Geogr. 2022, 42, 1363–1375. [Google Scholar]
- Xia, H.; Lu, F.; Li, J. Spatial Correlation of Landscape Fragmentation and Ecological Sensitivity in China’s Giant Panda National Park and Surrounding Areas. Sustainability 2024, 16, 7371. [Google Scholar] [CrossRef] [Scilit]
- Wu, J. Effects of changing scale on landscape pattern analysis: Scaling relations. Landsc. Ecol. 2004, 19, 125–138. [Google Scholar] [CrossRef] [Scilit]
- Hu, C.; Wu, W.; Zhou, X.; Wang, Z. Spatiotemporal changes in landscape patterns in karst mountainous regions based on the optimal landscape scale: A case study of Guiyang City in Guizhou Province, China. Ecol. Indic. 2023, 150, 110211. [Google Scholar] [CrossRef] [Scilit]
- Fu, G.; Wang, W.; Li, J.; Xiao, N.; Qi, Y. Prediction and selection of appropriate landscape metrics and optimal scale ranges based on multi-scale interaction analysis. Land 2021, 10, 1192. [Google Scholar] [CrossRef] [Scilit]
- Li, J.; Wang, J.; Du, Y.; Hou, X.; Xi, R.; Yang, Y. Assessing landscape fragmentation and its driving factors in arid regions: A case study of the Manas River, China. Ecol. Indic. 2025, 171, 113253. [Google Scholar] [CrossRef] [Scilit]
- Guo, Z.; Shi, Y.; Liu, T.M.; Zhang, Y.X.; Yan, Y.Z. Analysis of the spatiotemporal pattern and driving factors of NPP in the northern foothills of the Qinling Mountains from 2001 to 2020. Ecol. Environ. Sci. 2025, 34, 401–410. [Google Scholar]
- Tosunoglu, F.; Kisi, O. Trend analysis of maximum hydrologic drought variables using Mann–Kendall and Şen’s innovative trend method. River Res. Appl. 2017, 33, 597–610. [Google Scholar] [CrossRef] [Scilit]
- Wang, J.F.; Xu, C.D. Geodetector: Principle and prospective. Acta Geogr. Sin. 2017, 72, 116–134. [Google Scholar]
- Li, S.Q.; Shen, J.Q.; Huang, X.; Zhang, K.Z. Accounting of water resources assets and analysis of driving factors in the Yangtze River Economic Belt based on a “quantity-value” framework. J. Nat. Resour. 2025, 40, 550–568. [Google Scholar]
- Yin, J.; Jiang, H.T.; Jiao, L.; Zhang, B.; Ding, Y.; Huang, J.Y. Spatiotemporal evolution and influencing factors of industrial carbon emission efficiency in Guizhou based on Geodetector and MGWR. Sci. Geogr. Sin. 2024, 44, 1217–1227. [Google Scholar]
- Liu, H.L.; Zhang, L.P.; Wang, W.Q.; Zhang, Y.; Wang, Z.L.; Tang, F.; Guo, X.J. Spatial pattern and influencing factors of county urbanization in inter-provincial border areas of China. Acta Geogr. Sin. 2023, 78, 1408–1426. [Google Scholar]
- Xu, Y.; Tang, J. Examining the rationality of Giant Panda National Park’s zoning designations and management measures for habitat conservation: Insights from interpretable machine learning methods. Sci. Total Environ. 2024, 920, 170955. [Google Scholar] [CrossRef] [Scilit]
- Ma, Y.; Wang, B.; Tu, W.; Bu, C.; Yan, K.; Zhang, Y.; Jiang, H. Ecosystem services in giant panda habitats and the Giant Panda National Park: A decade of insight (2011–2021). Environ. Sustain. Indic. 2025, 27, 100731. [Google Scholar] [CrossRef] [Scilit]
- Hull, V.; Xu, W.; Liu, W.; Zhou, S.; Viña, A.; Zhang, J.; Tuanmu, M.-N.; Huang, J.; Linderman, M.; Chen, X.; et al. Evaluating the efficacy of zoning designations for protected area management. Biol. Conserv. 2011, 144, 3028–3037. [Google Scholar] [CrossRef] [Scilit]
- Li, C.; Yu, J.; Wu, W.; Hou, R.; Yang, Z.; Owens, J.R.; Gu, X.; Xiang, Z.; Qi, D. Evaluating the efficacy of zoning designations for national park management. Glob. Ecol. Conserv. 2021, 27, e01562. [Google Scholar] [CrossRef] [Scilit]
- Foley, J.A.; DeFries, R.; Asner, G.P.; Barford, C.; Bonan, G.; Carpenter, S.R.; Chapin, F.S.; Coe, M.T.; Daily, G.C.; Gibbs, H.K.; et al. Global consequences of land use. Science 2005, 309, 570–574. [Google Scholar] [CrossRef] [Scilit] [PubMed]

Disclaimer/Publisher’s Note: The statements, opinions and data contained in all publications are solely those of the individual author(s) and contributor(s) and not of MDPI and/or the editor(s). MDPI and/or the editor(s) disclaim responsibility for any injury to people or property resulting from any ideas, methods, instructions or products referred to in the content. |
© 2026 by the authors. Licensee MDPI, Basel, Switzerland. This article is an open access article distributed under the terms and conditions of the Creative Commons Attribution (CC BY) license.