LightGBM–SHAP-Based Study of the Threshold and Synergistic Effects of Physical and Perceptual Scene Elements on Spatial Vitality in Historic Cultural Districts

Abstract
1. Introduction
2. Materials and Methods
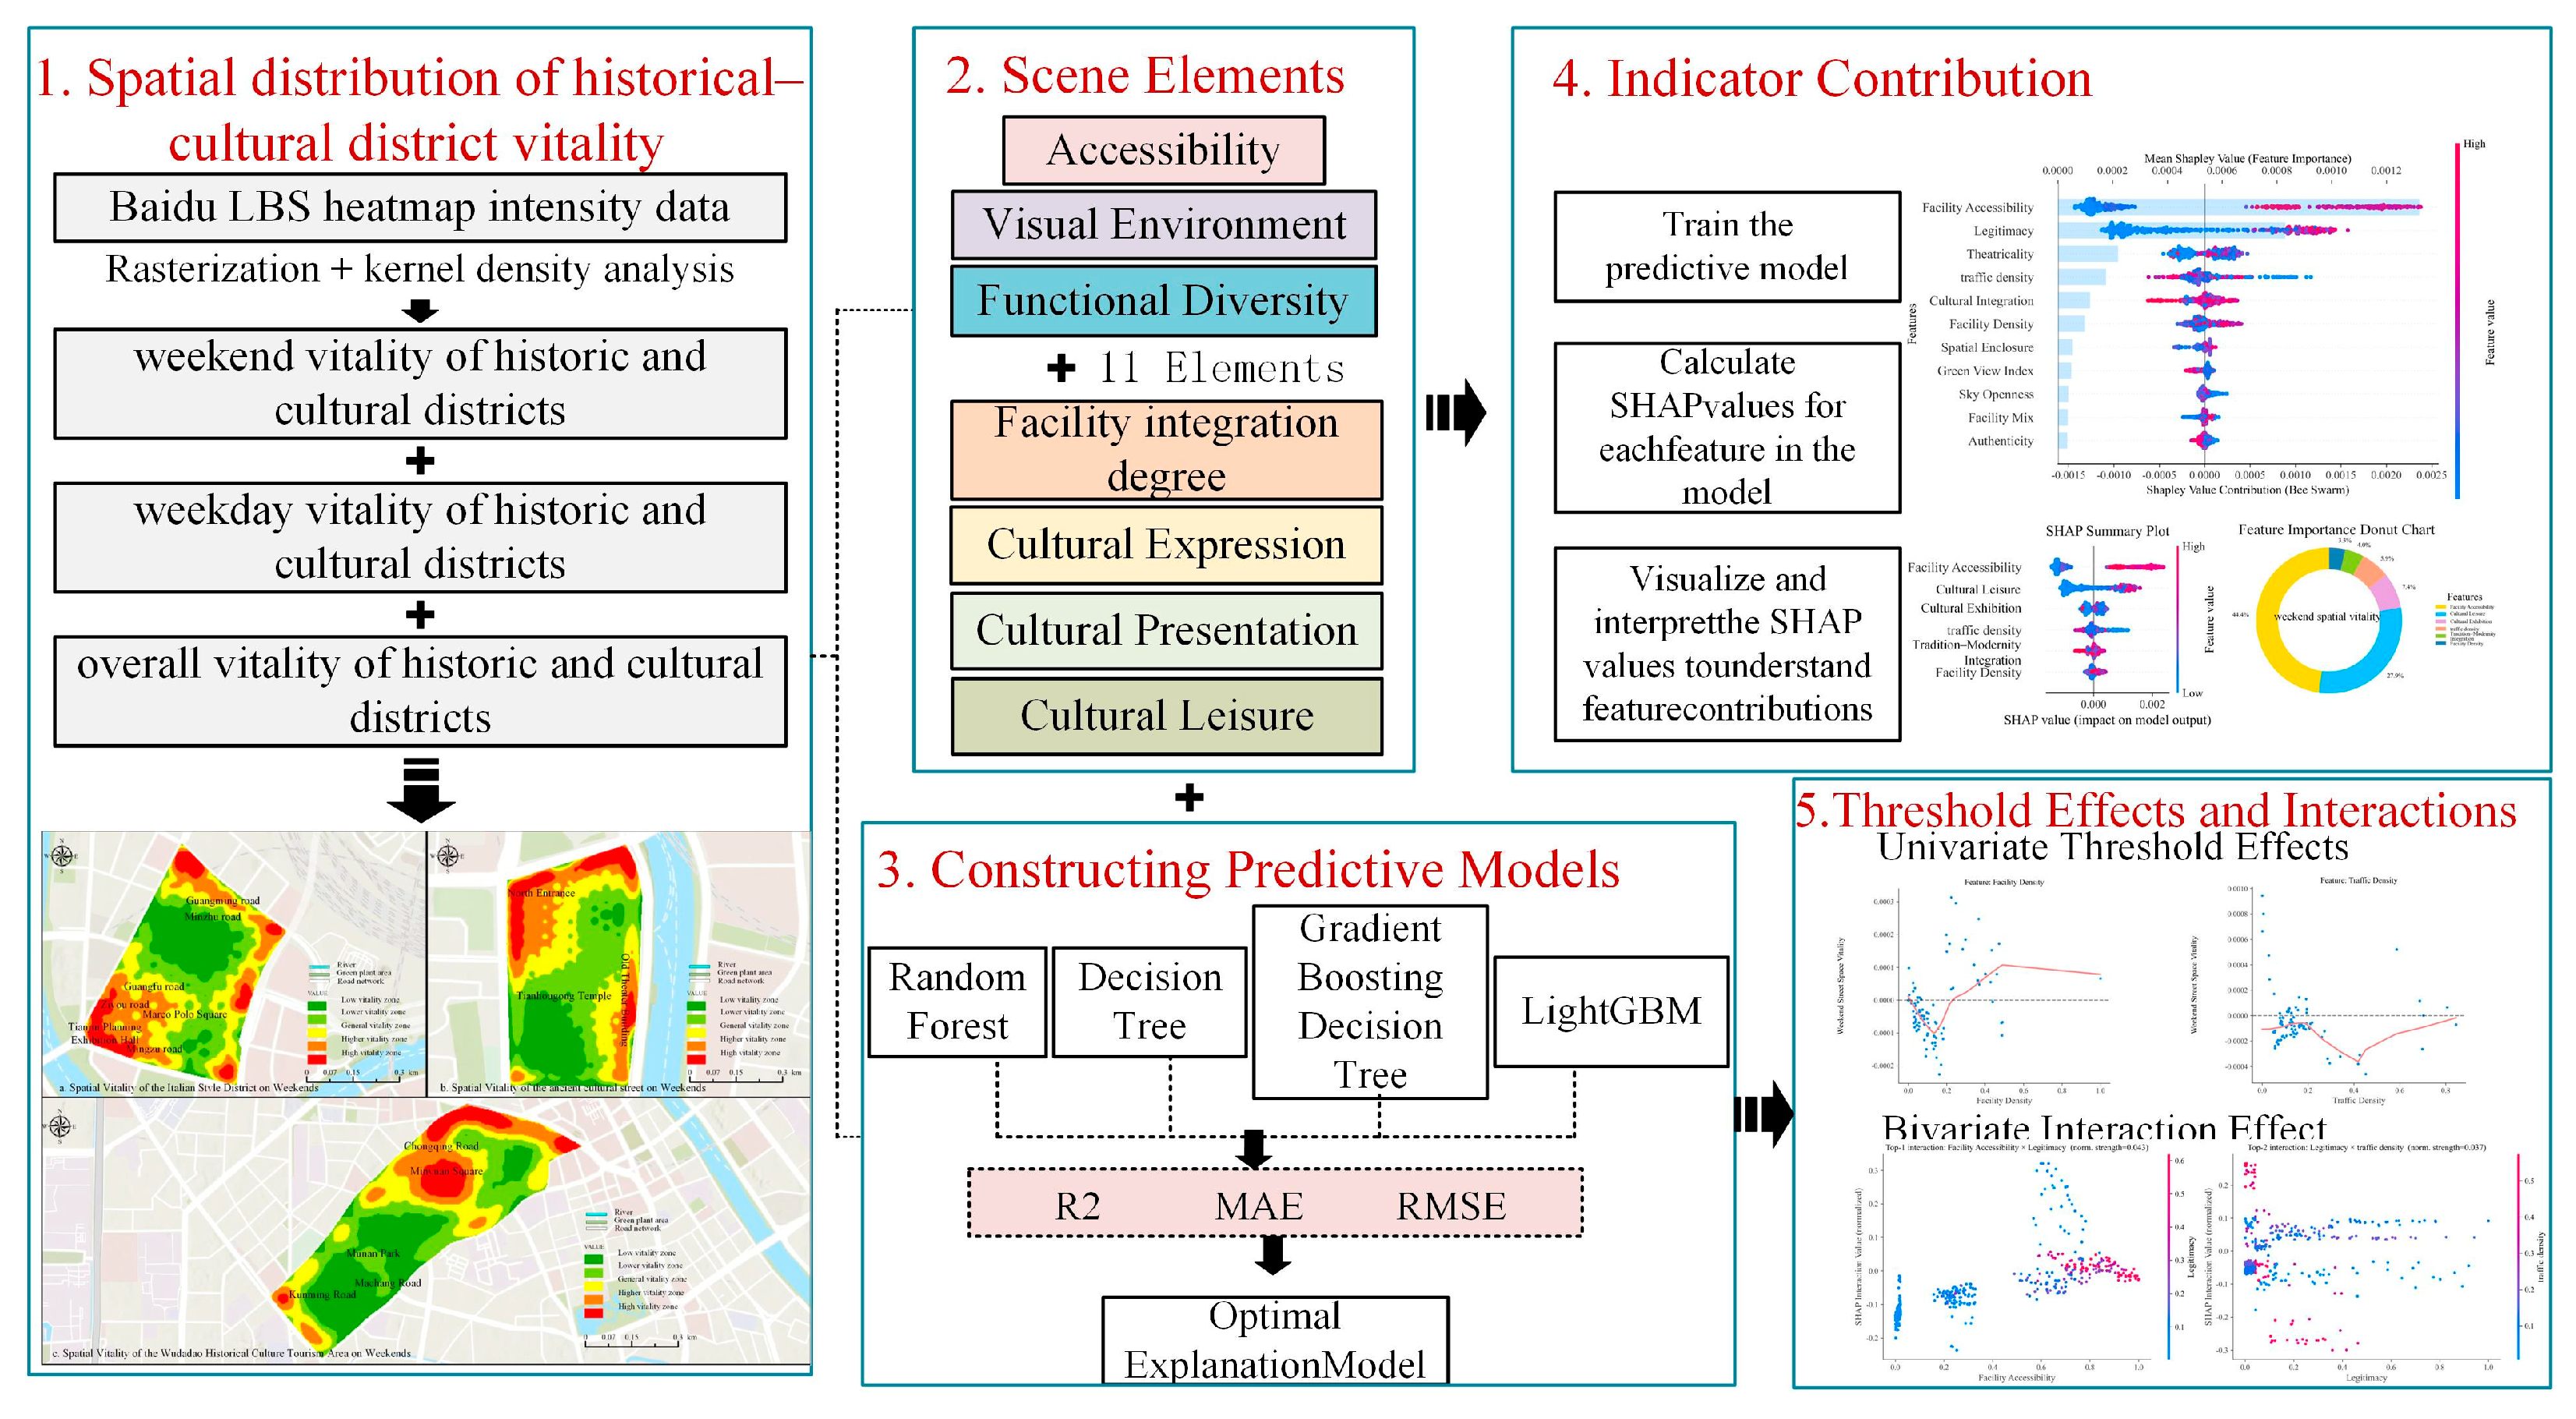
2.1. Research Framework
2.2. Data Sources and Methods
- (1)
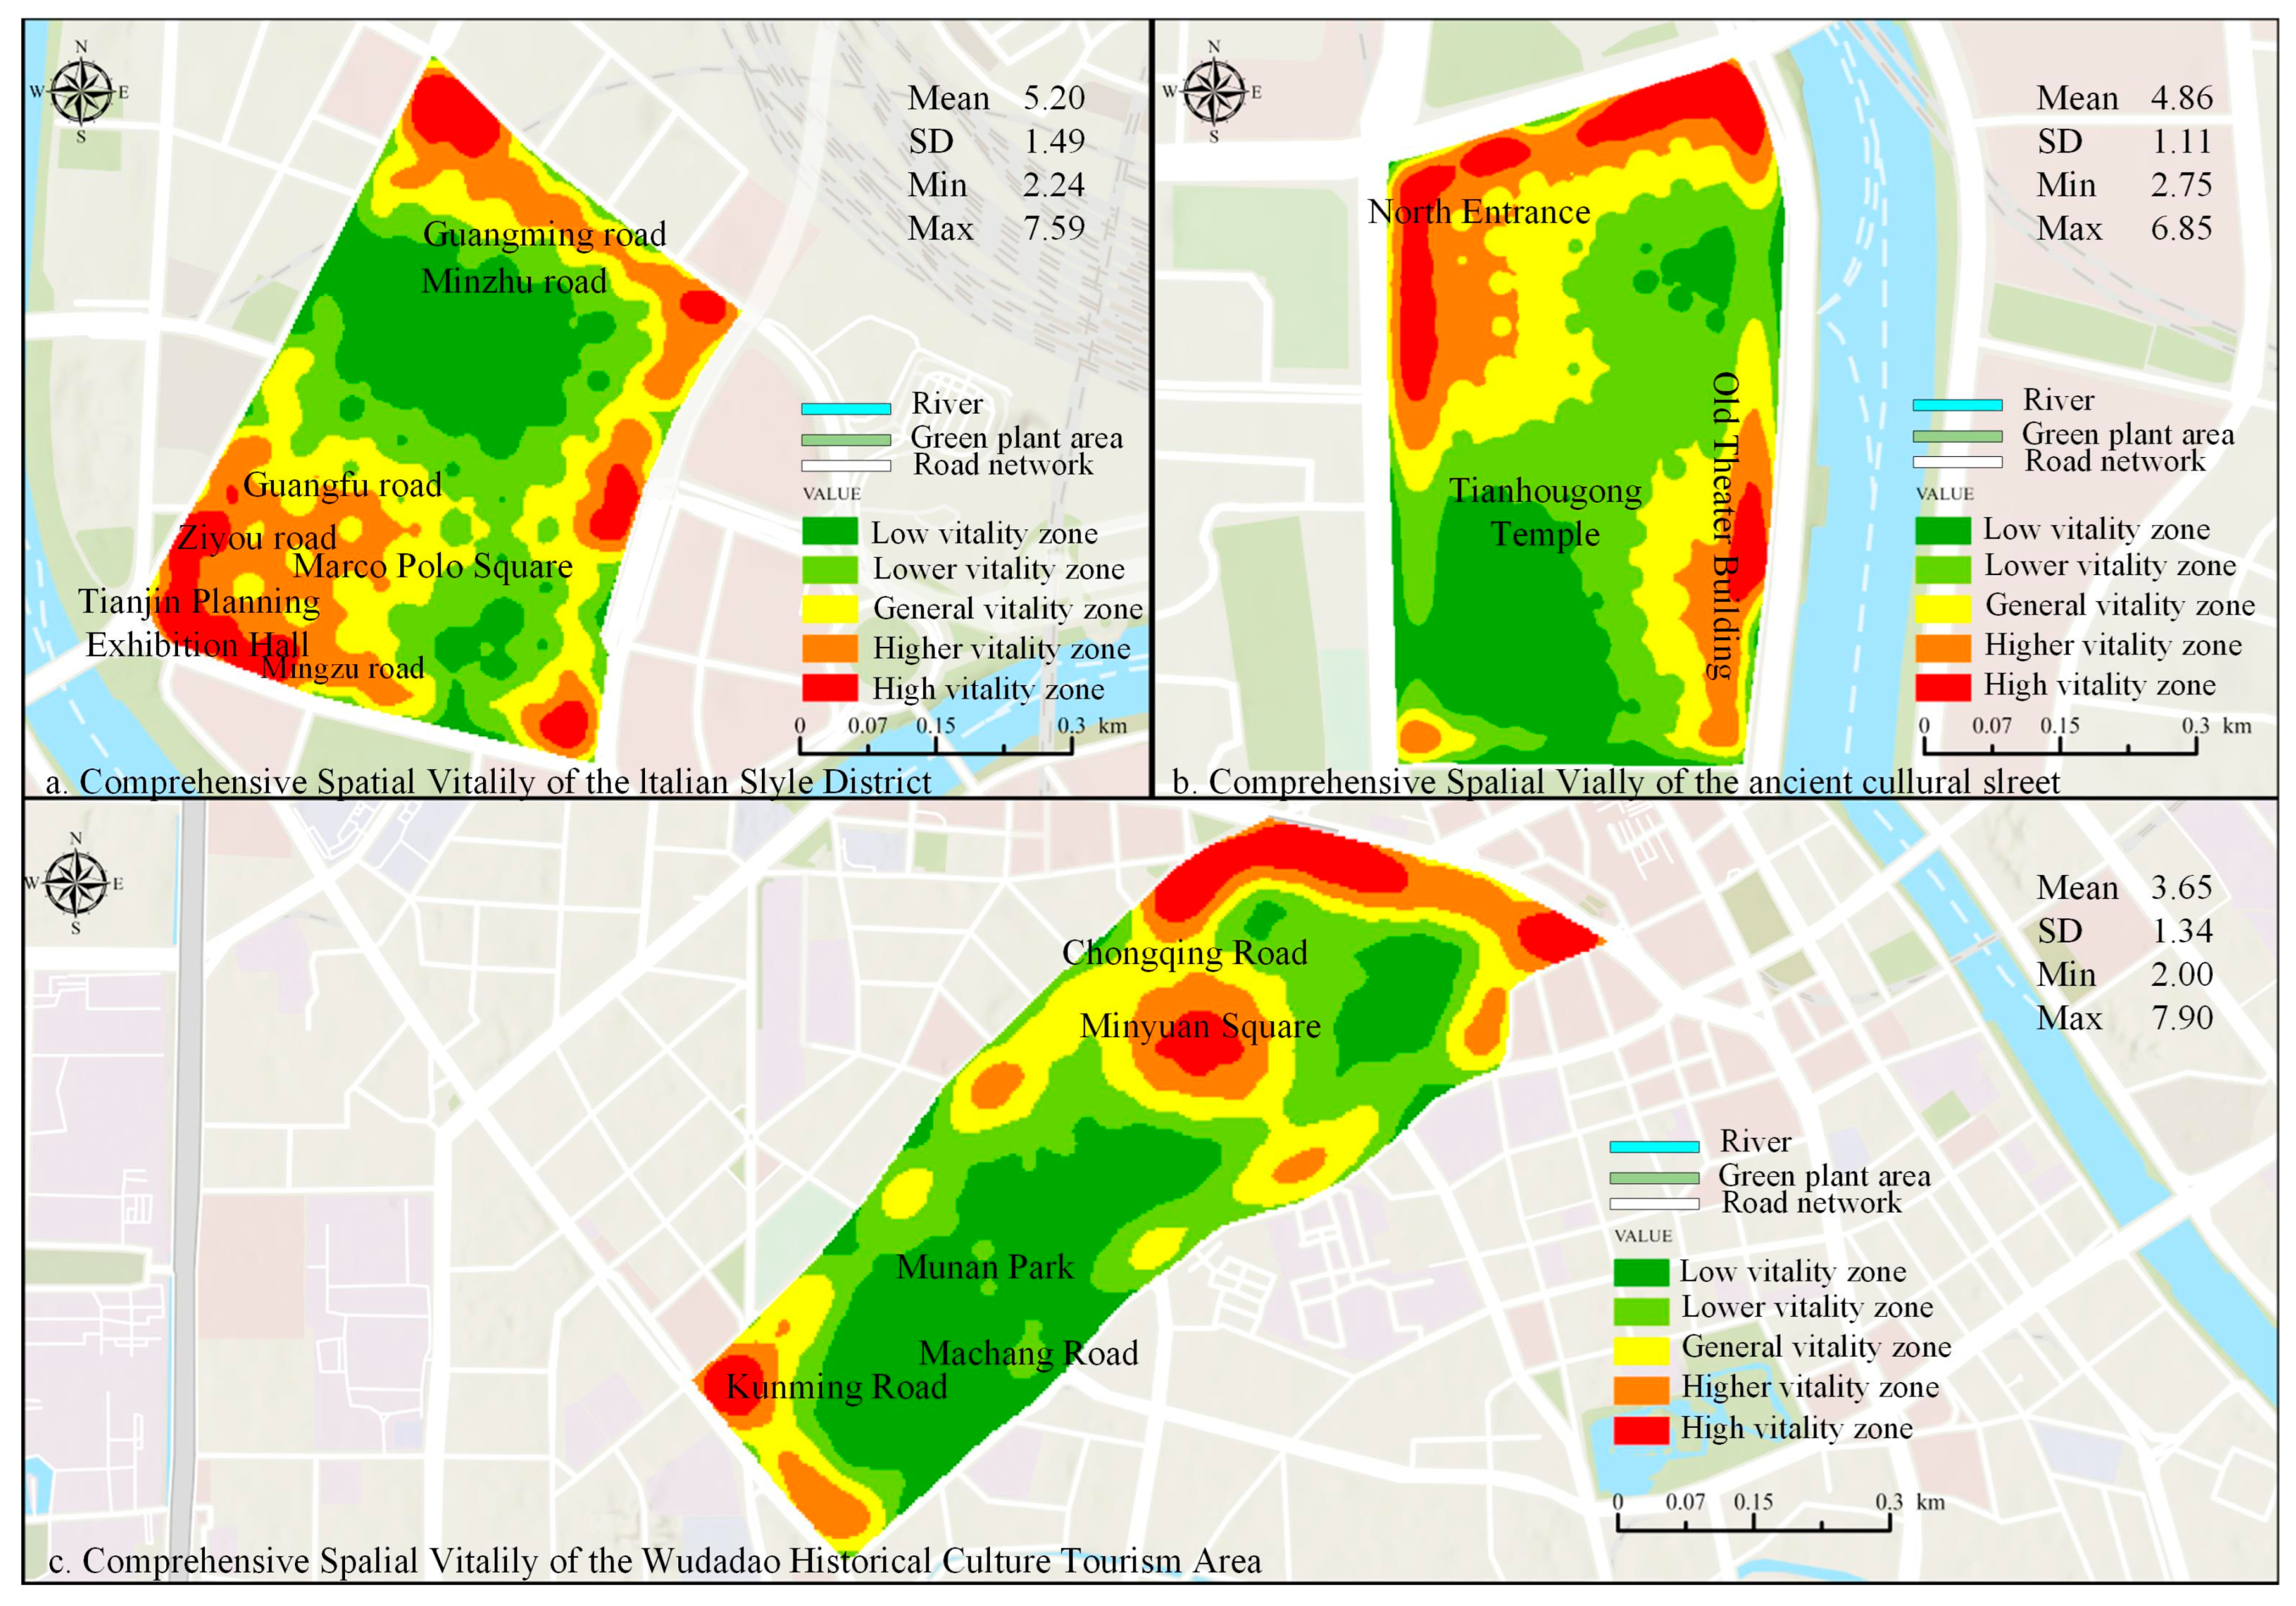
- Vitality data. Previous studies have indicated that, under normal conditions, the relative spatial distribution of vitality in historic districts tends to remain stable over short periods. Therefore, selecting one weekday and one weekend day for sampling can, to a certain extent, represent the district’s vitality characteristics under two typical states: routine work-related activities and leisure-oriented activities. Using the Baidu Maps API, we obtained heatmap data for 25 May 2025 (weekend) and 28 May 2025 (weekday). Data collection was conducted under clear weather from 10:00 to 22:00 at two-hour intervals, yielding 12 Baidu heatmap images in total. Following standard processing, we used the ArcGIS Raster Calculator to compute mean vitality values, classified them into seven levels with Jenks natural breaks, and overlaid the results on district maps to produce spatial distributions for weekend, weekday, and comprehensive scenarios.
- (2)
- Functional-facility data. We acquired Baidu Maps POIs for 2024 via the Baidu Maps API, with preliminary ground-truthing through field surveys.
- (3)
- Street-network data. Street-network layers were collected from OSM and then merged, simplified, and topologically cleaned.
- (4)
- Street-view imagery. Sampling points were generated along the street network, and BSVIs were fetched via Python using the Baidu Street View API. We applied the semantic-segmentation model SegNet to segment the BSVIs and extract street visual elements and their percentage features.
- (5)
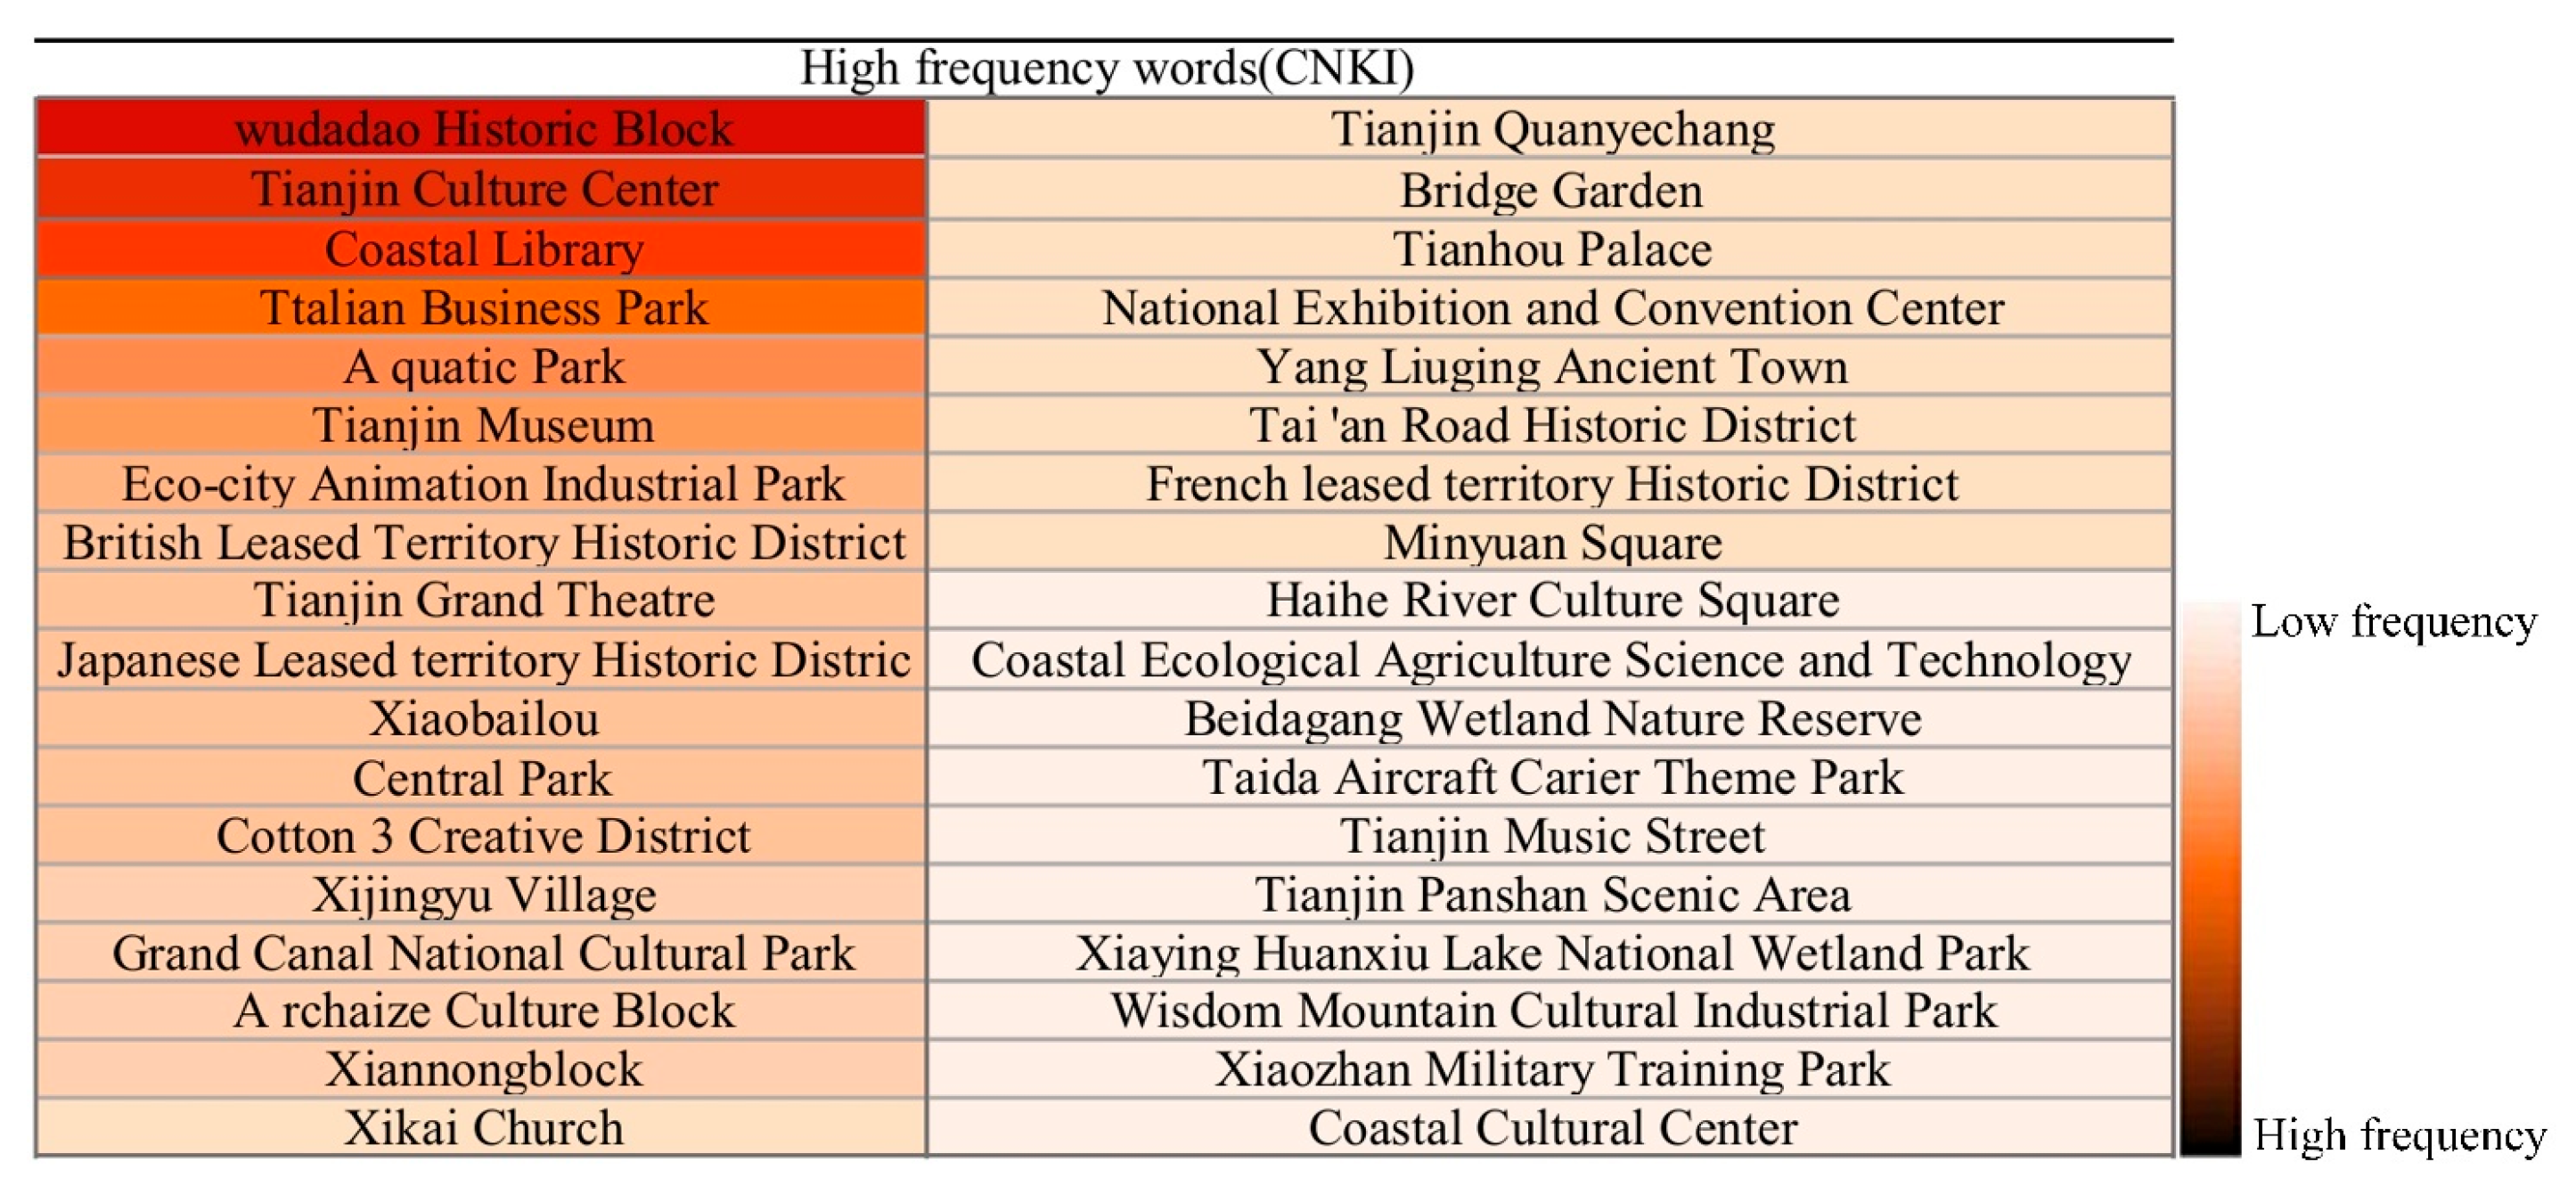
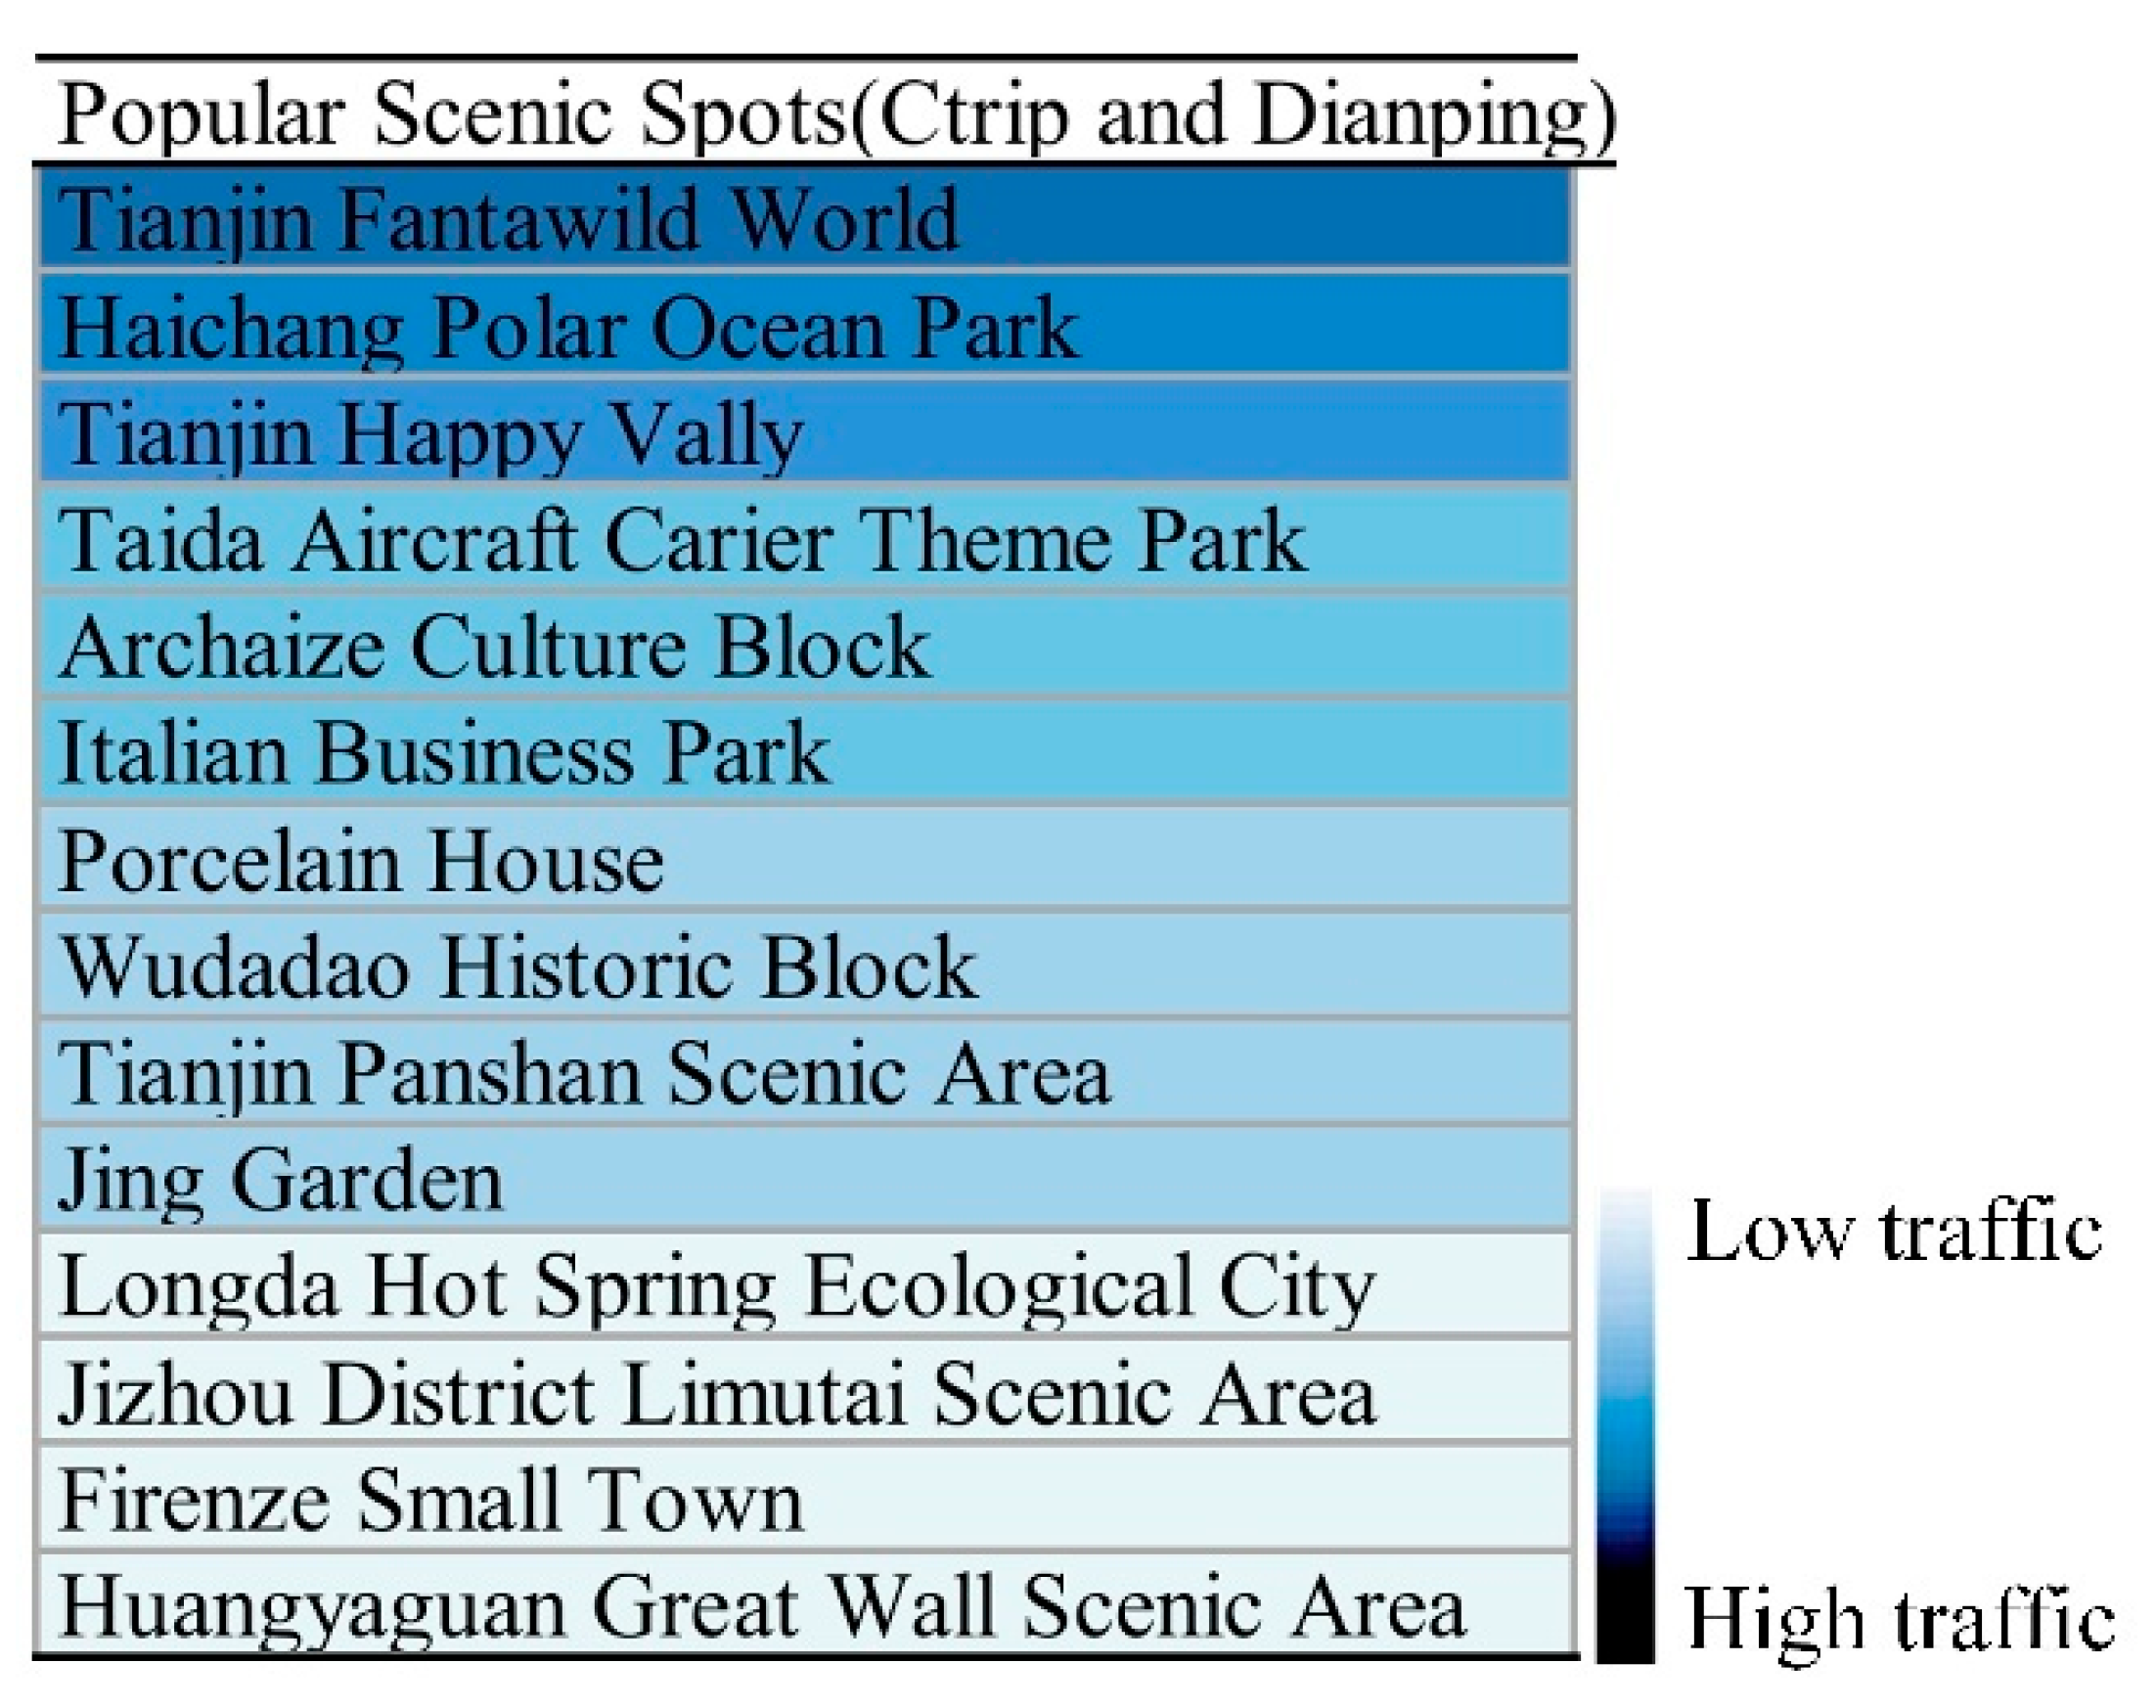
- Review data. Using Octoparse and the keywords “Tianjin Wudadao”, “Ancient Culture Street”, and “Italian-Style Street”, we scraped user reviews from Dianping, Ctrip, and WeChat public accounts for the period May 2022 to May 2025.
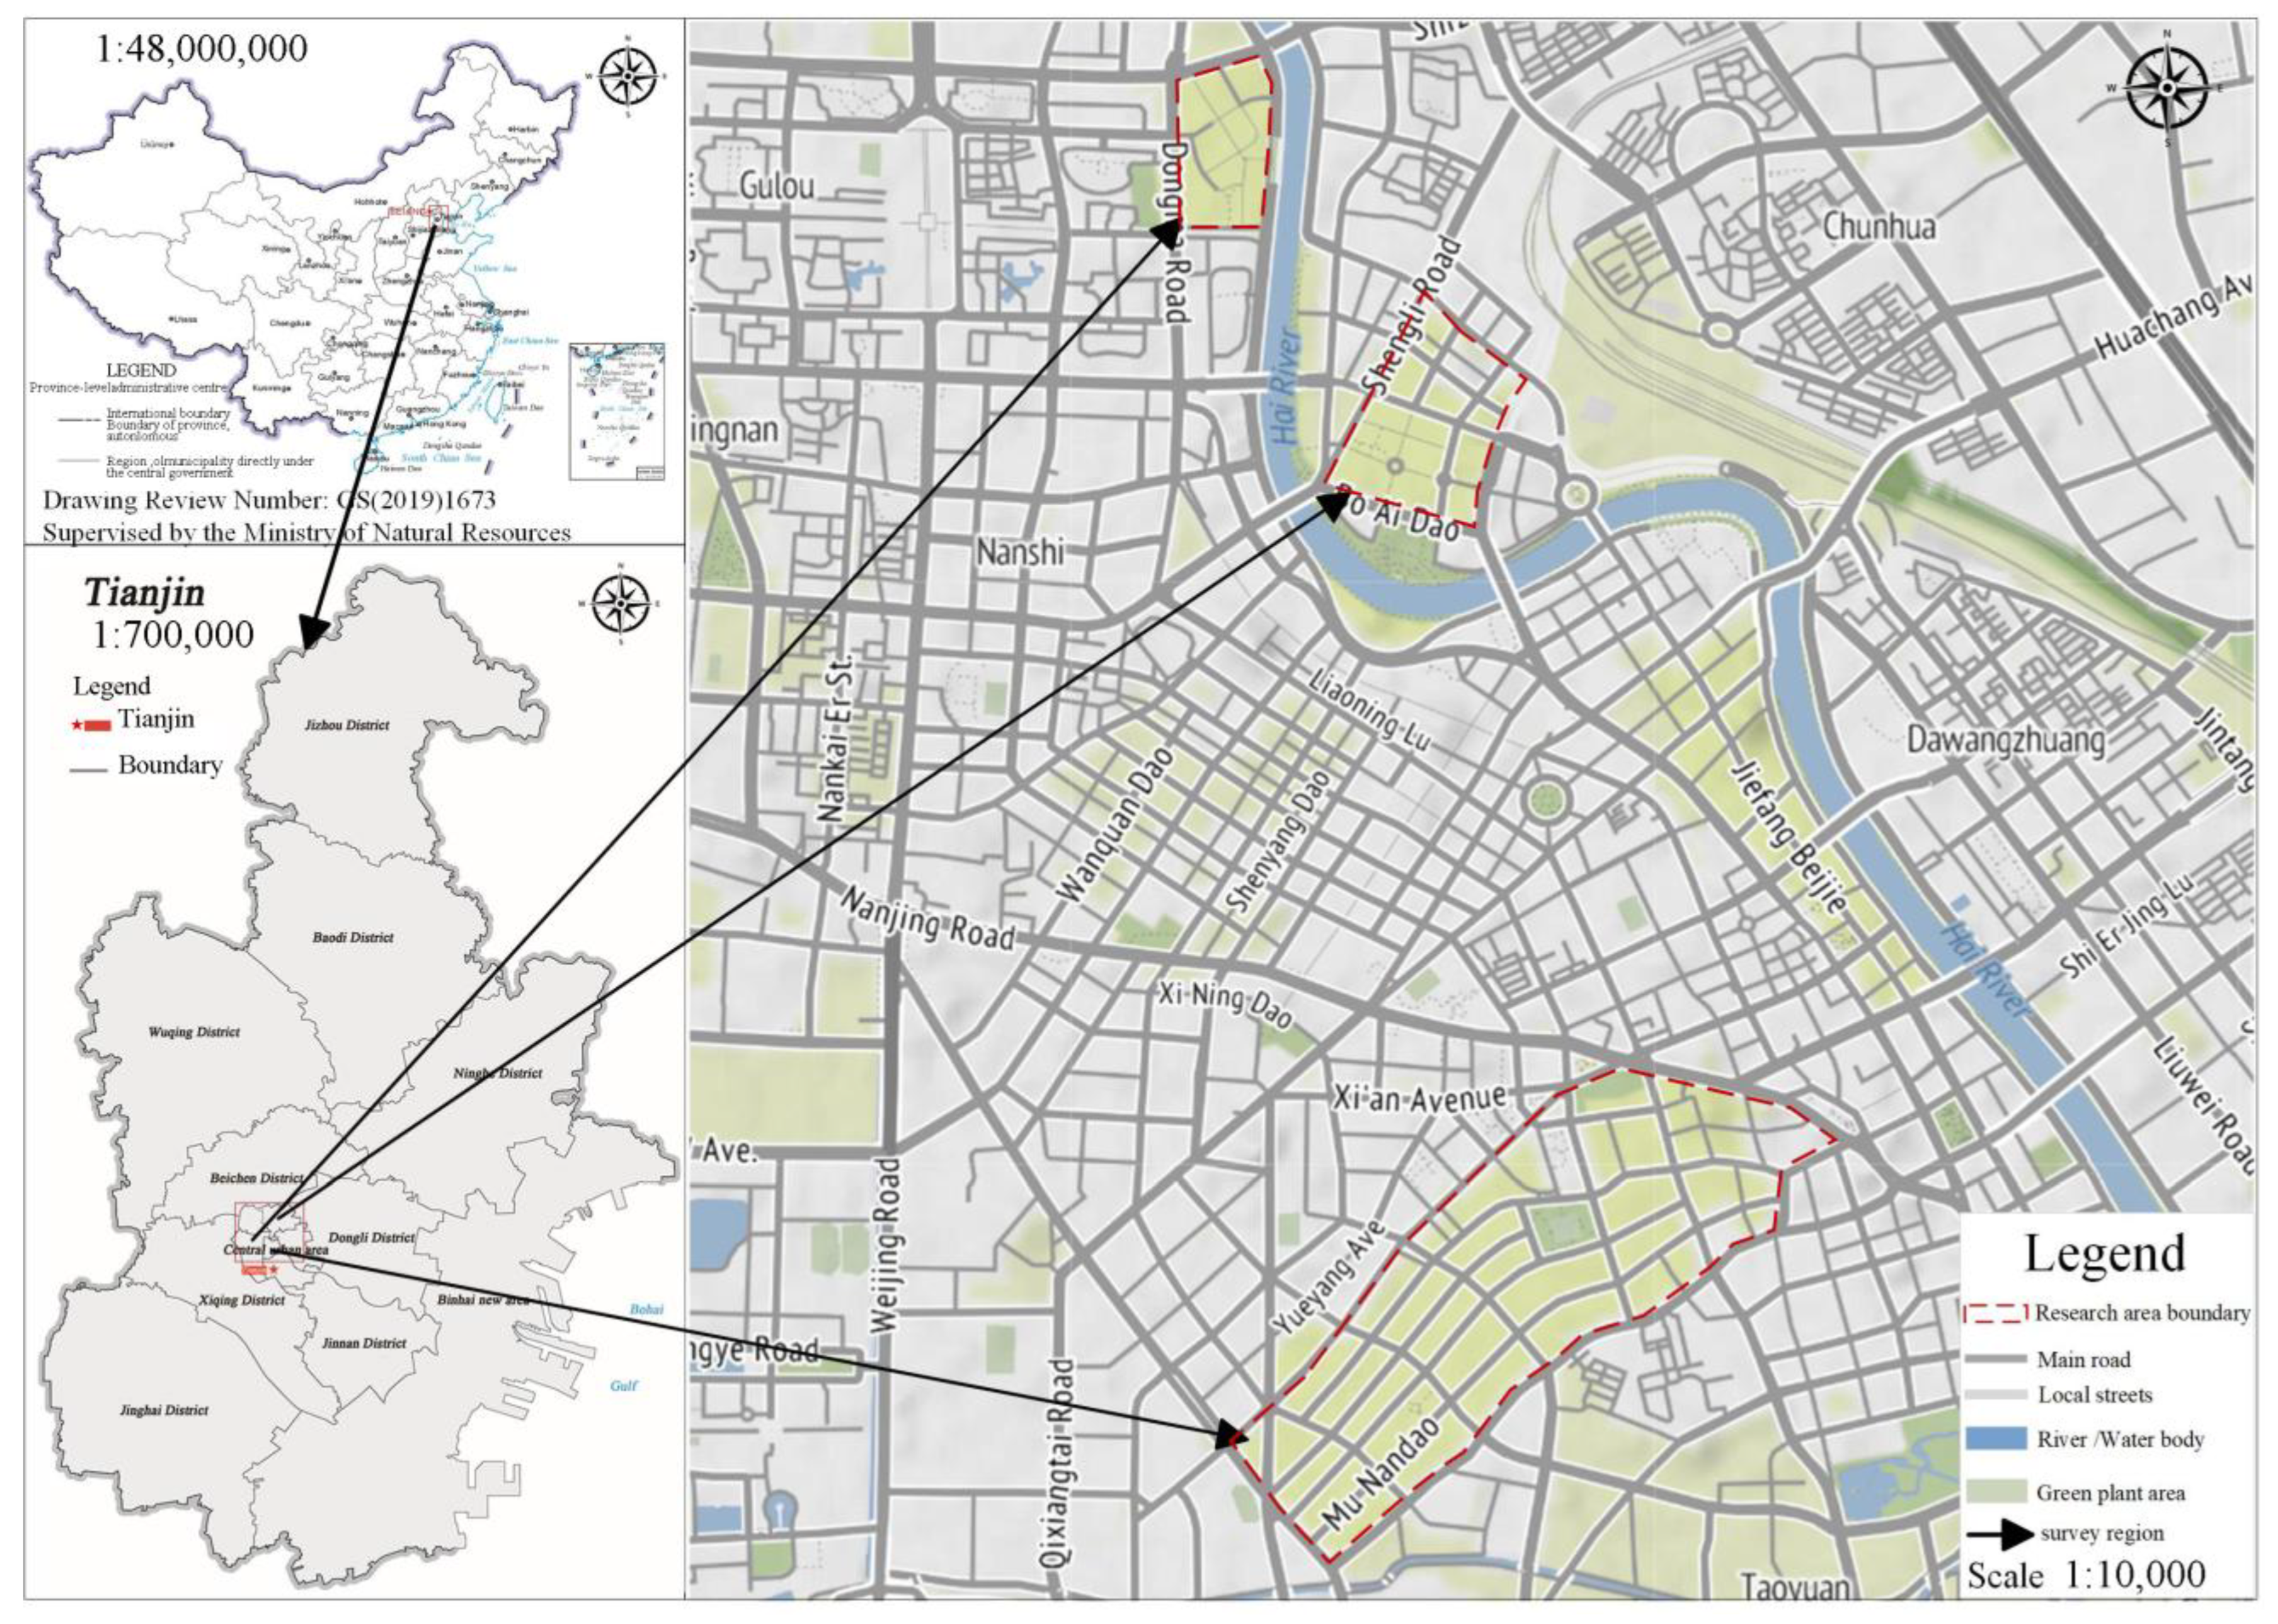
2.3. Study Area
2.4. Explanatory Framework for Vitality in Historic Cultural Districts
2.5. Machine-Learning Models
2.5.1. Model Training
2.5.2. LightGBM Model
2.5.3. SHAP
3. Results
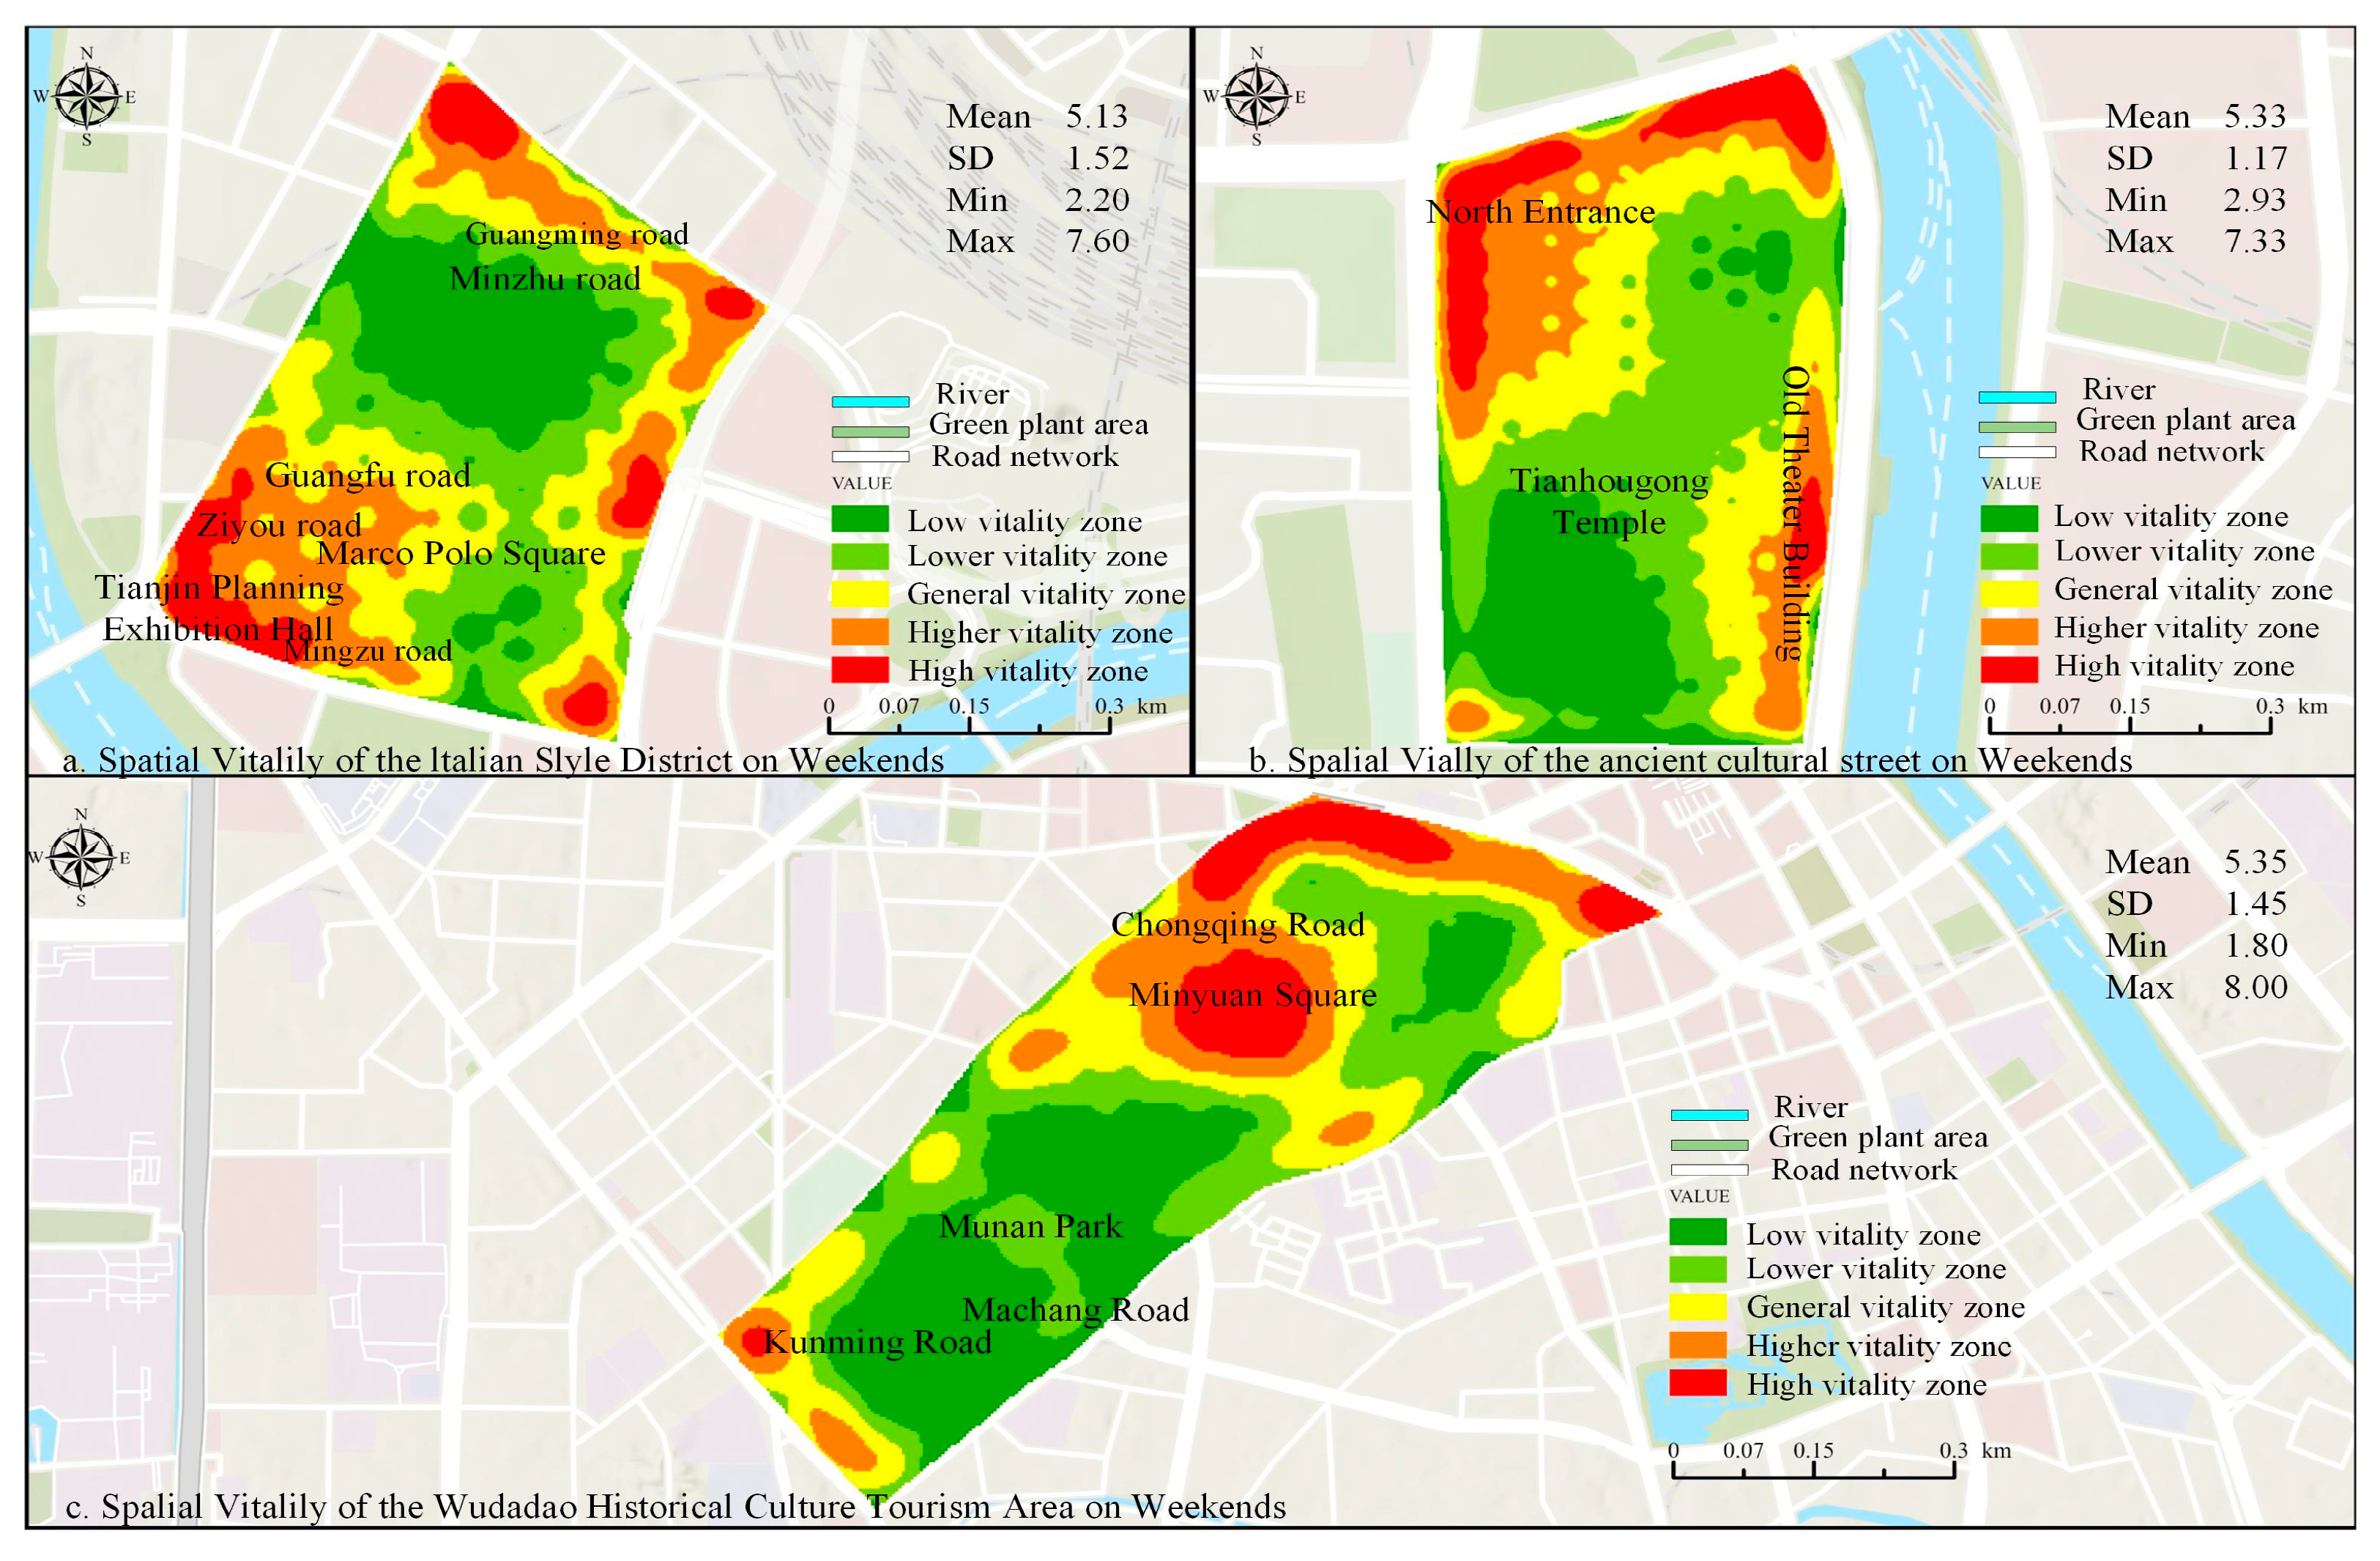
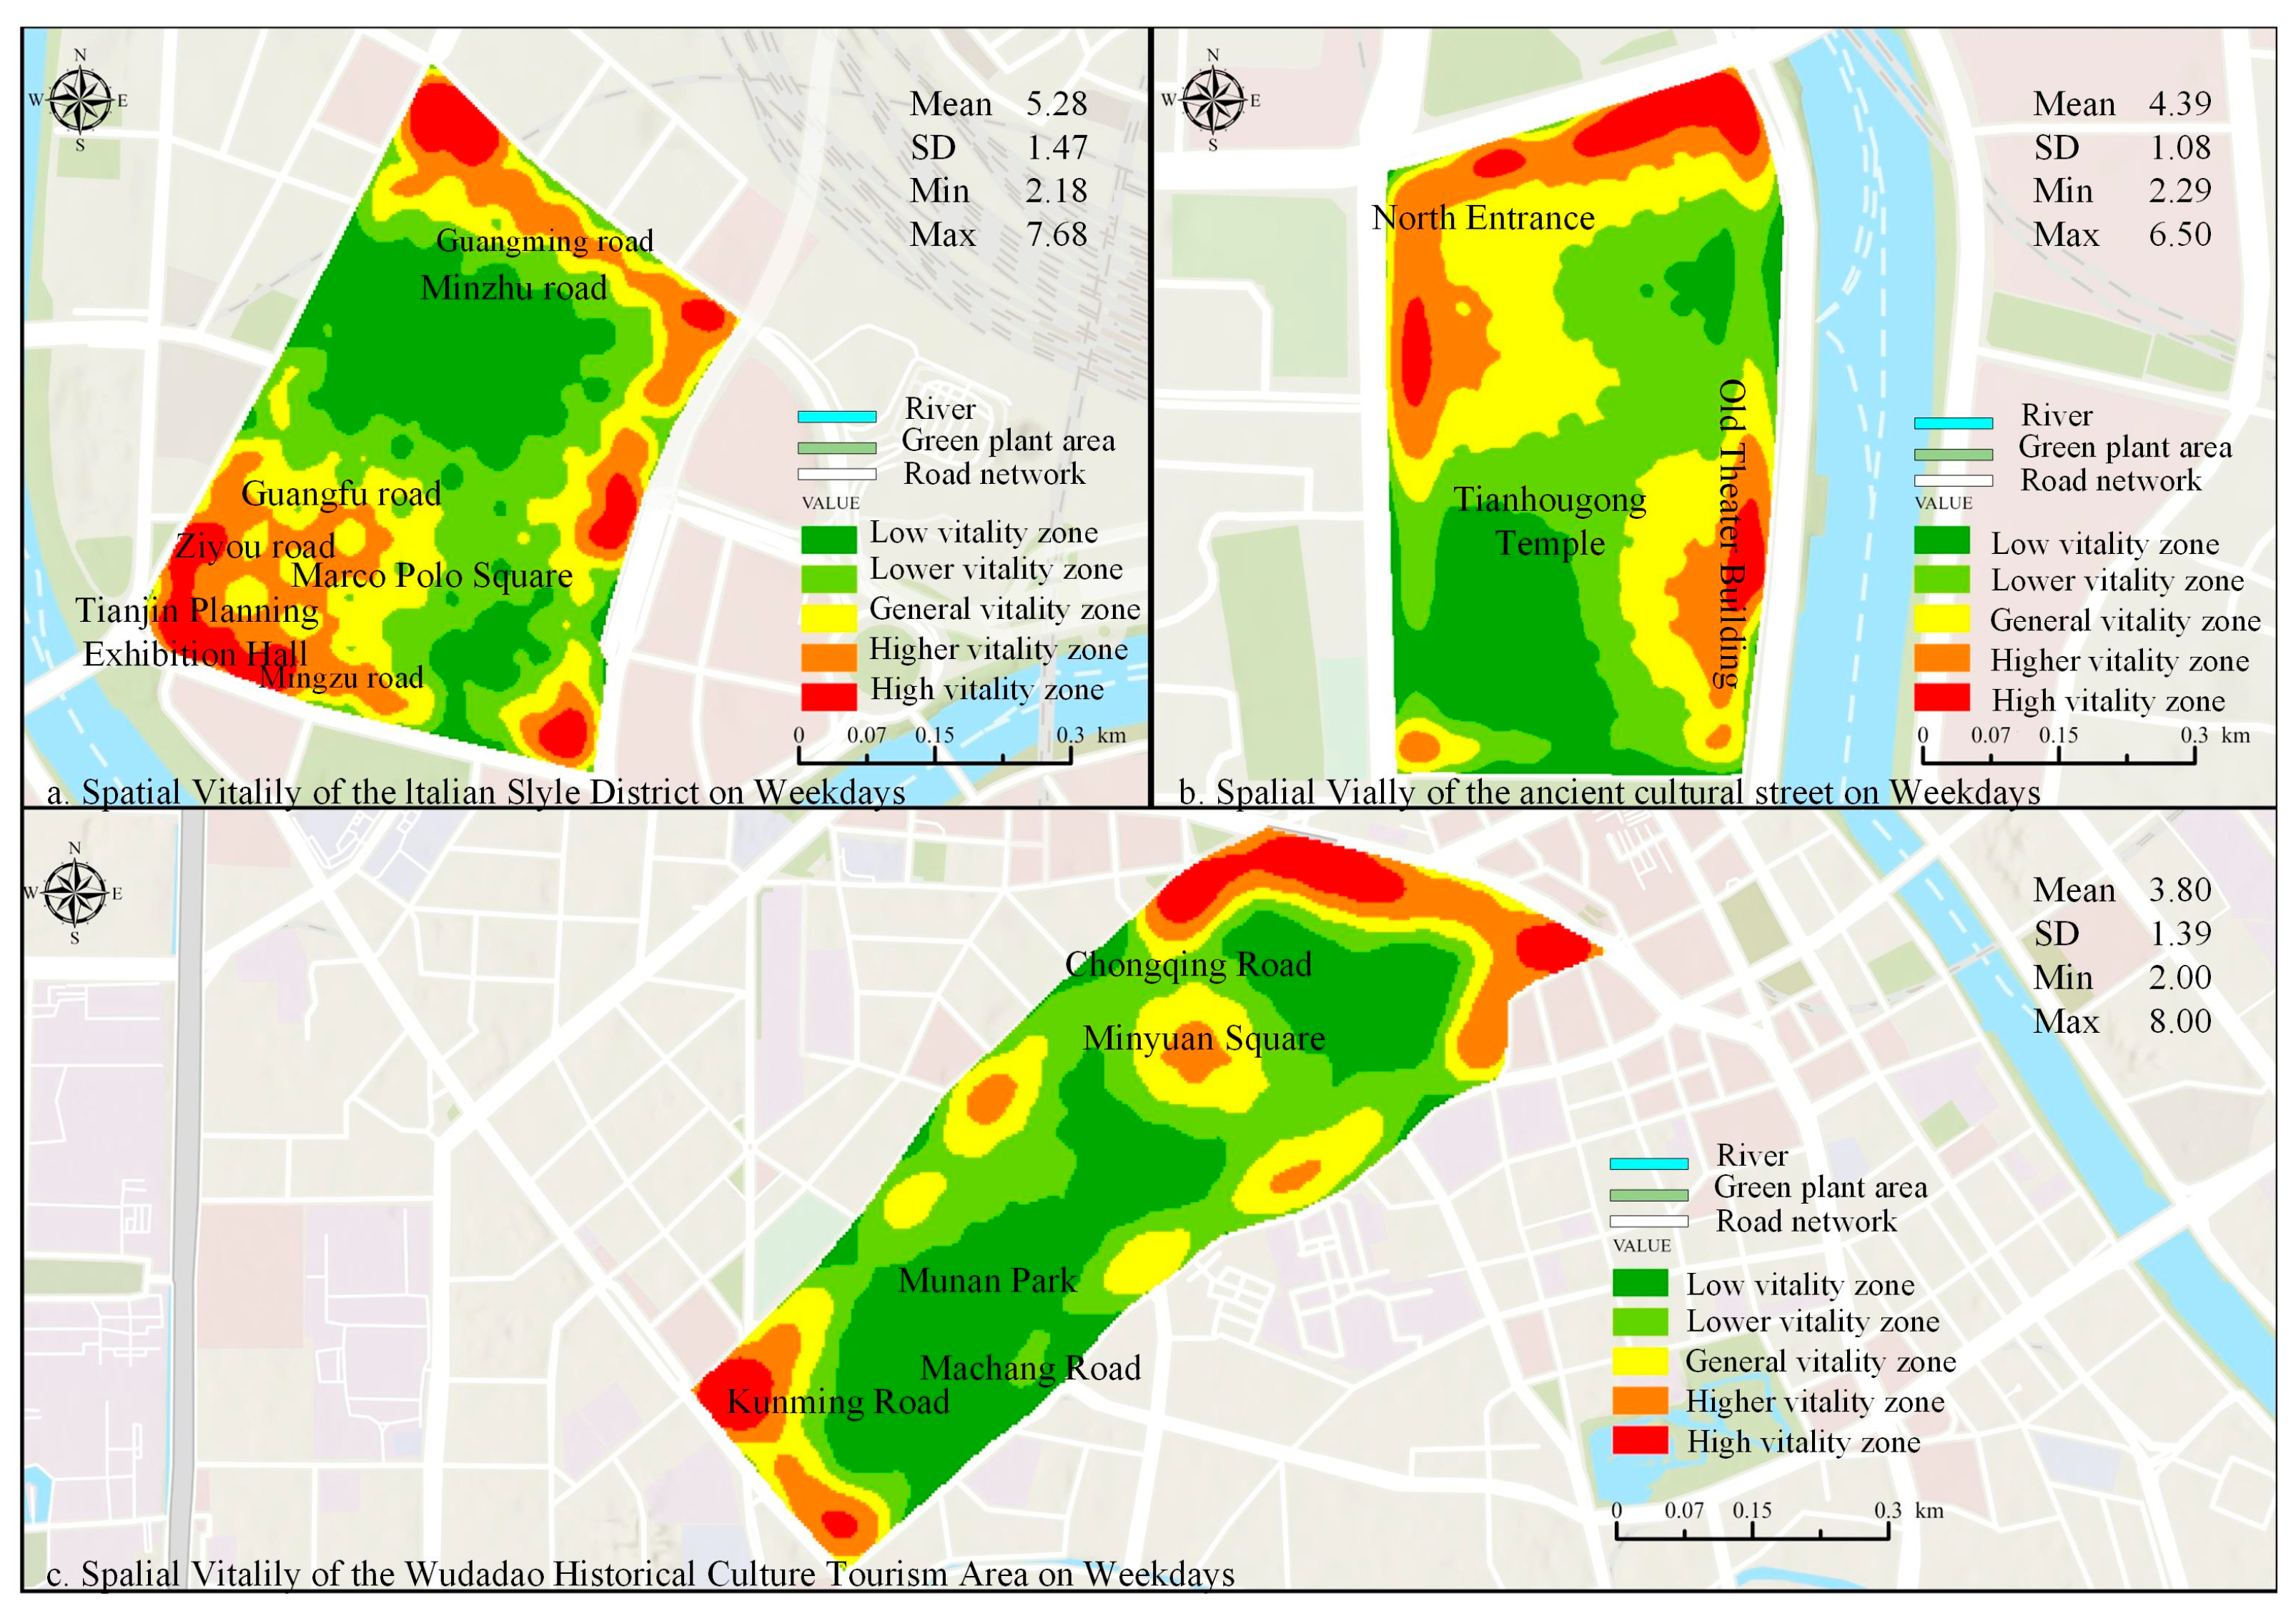
3.1. Spatial Vitality of Historic Cultural Districts
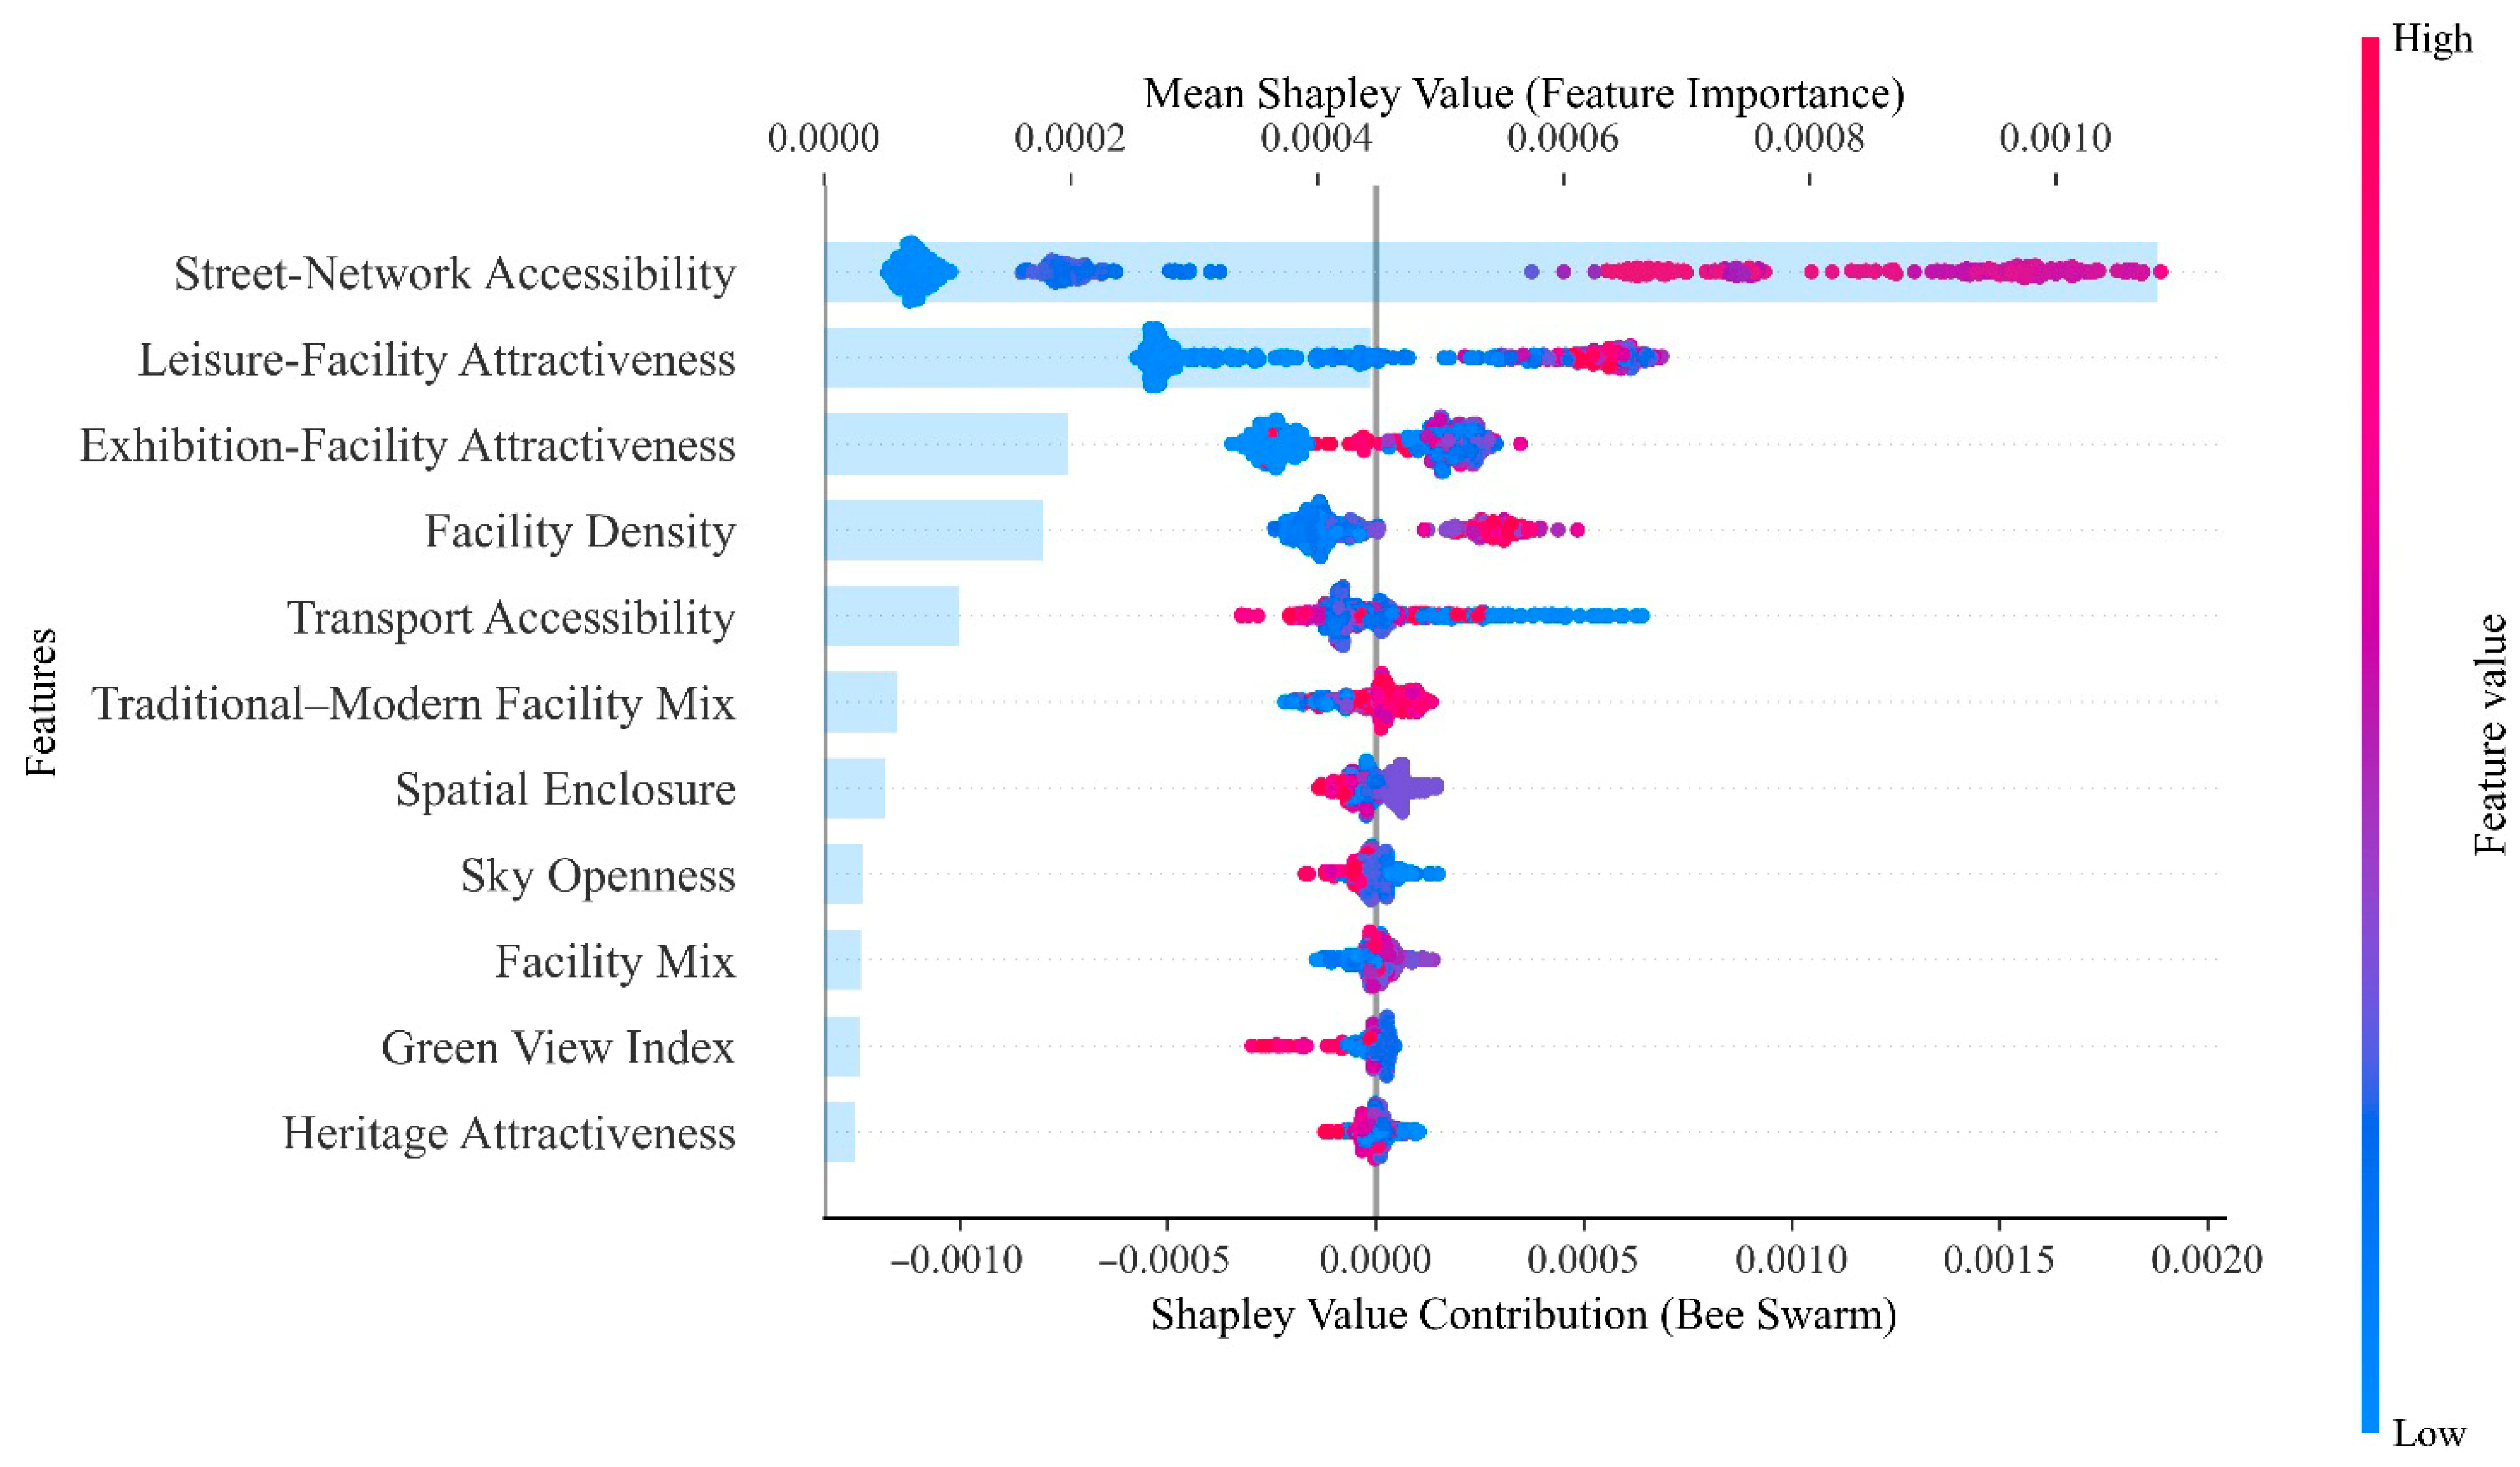
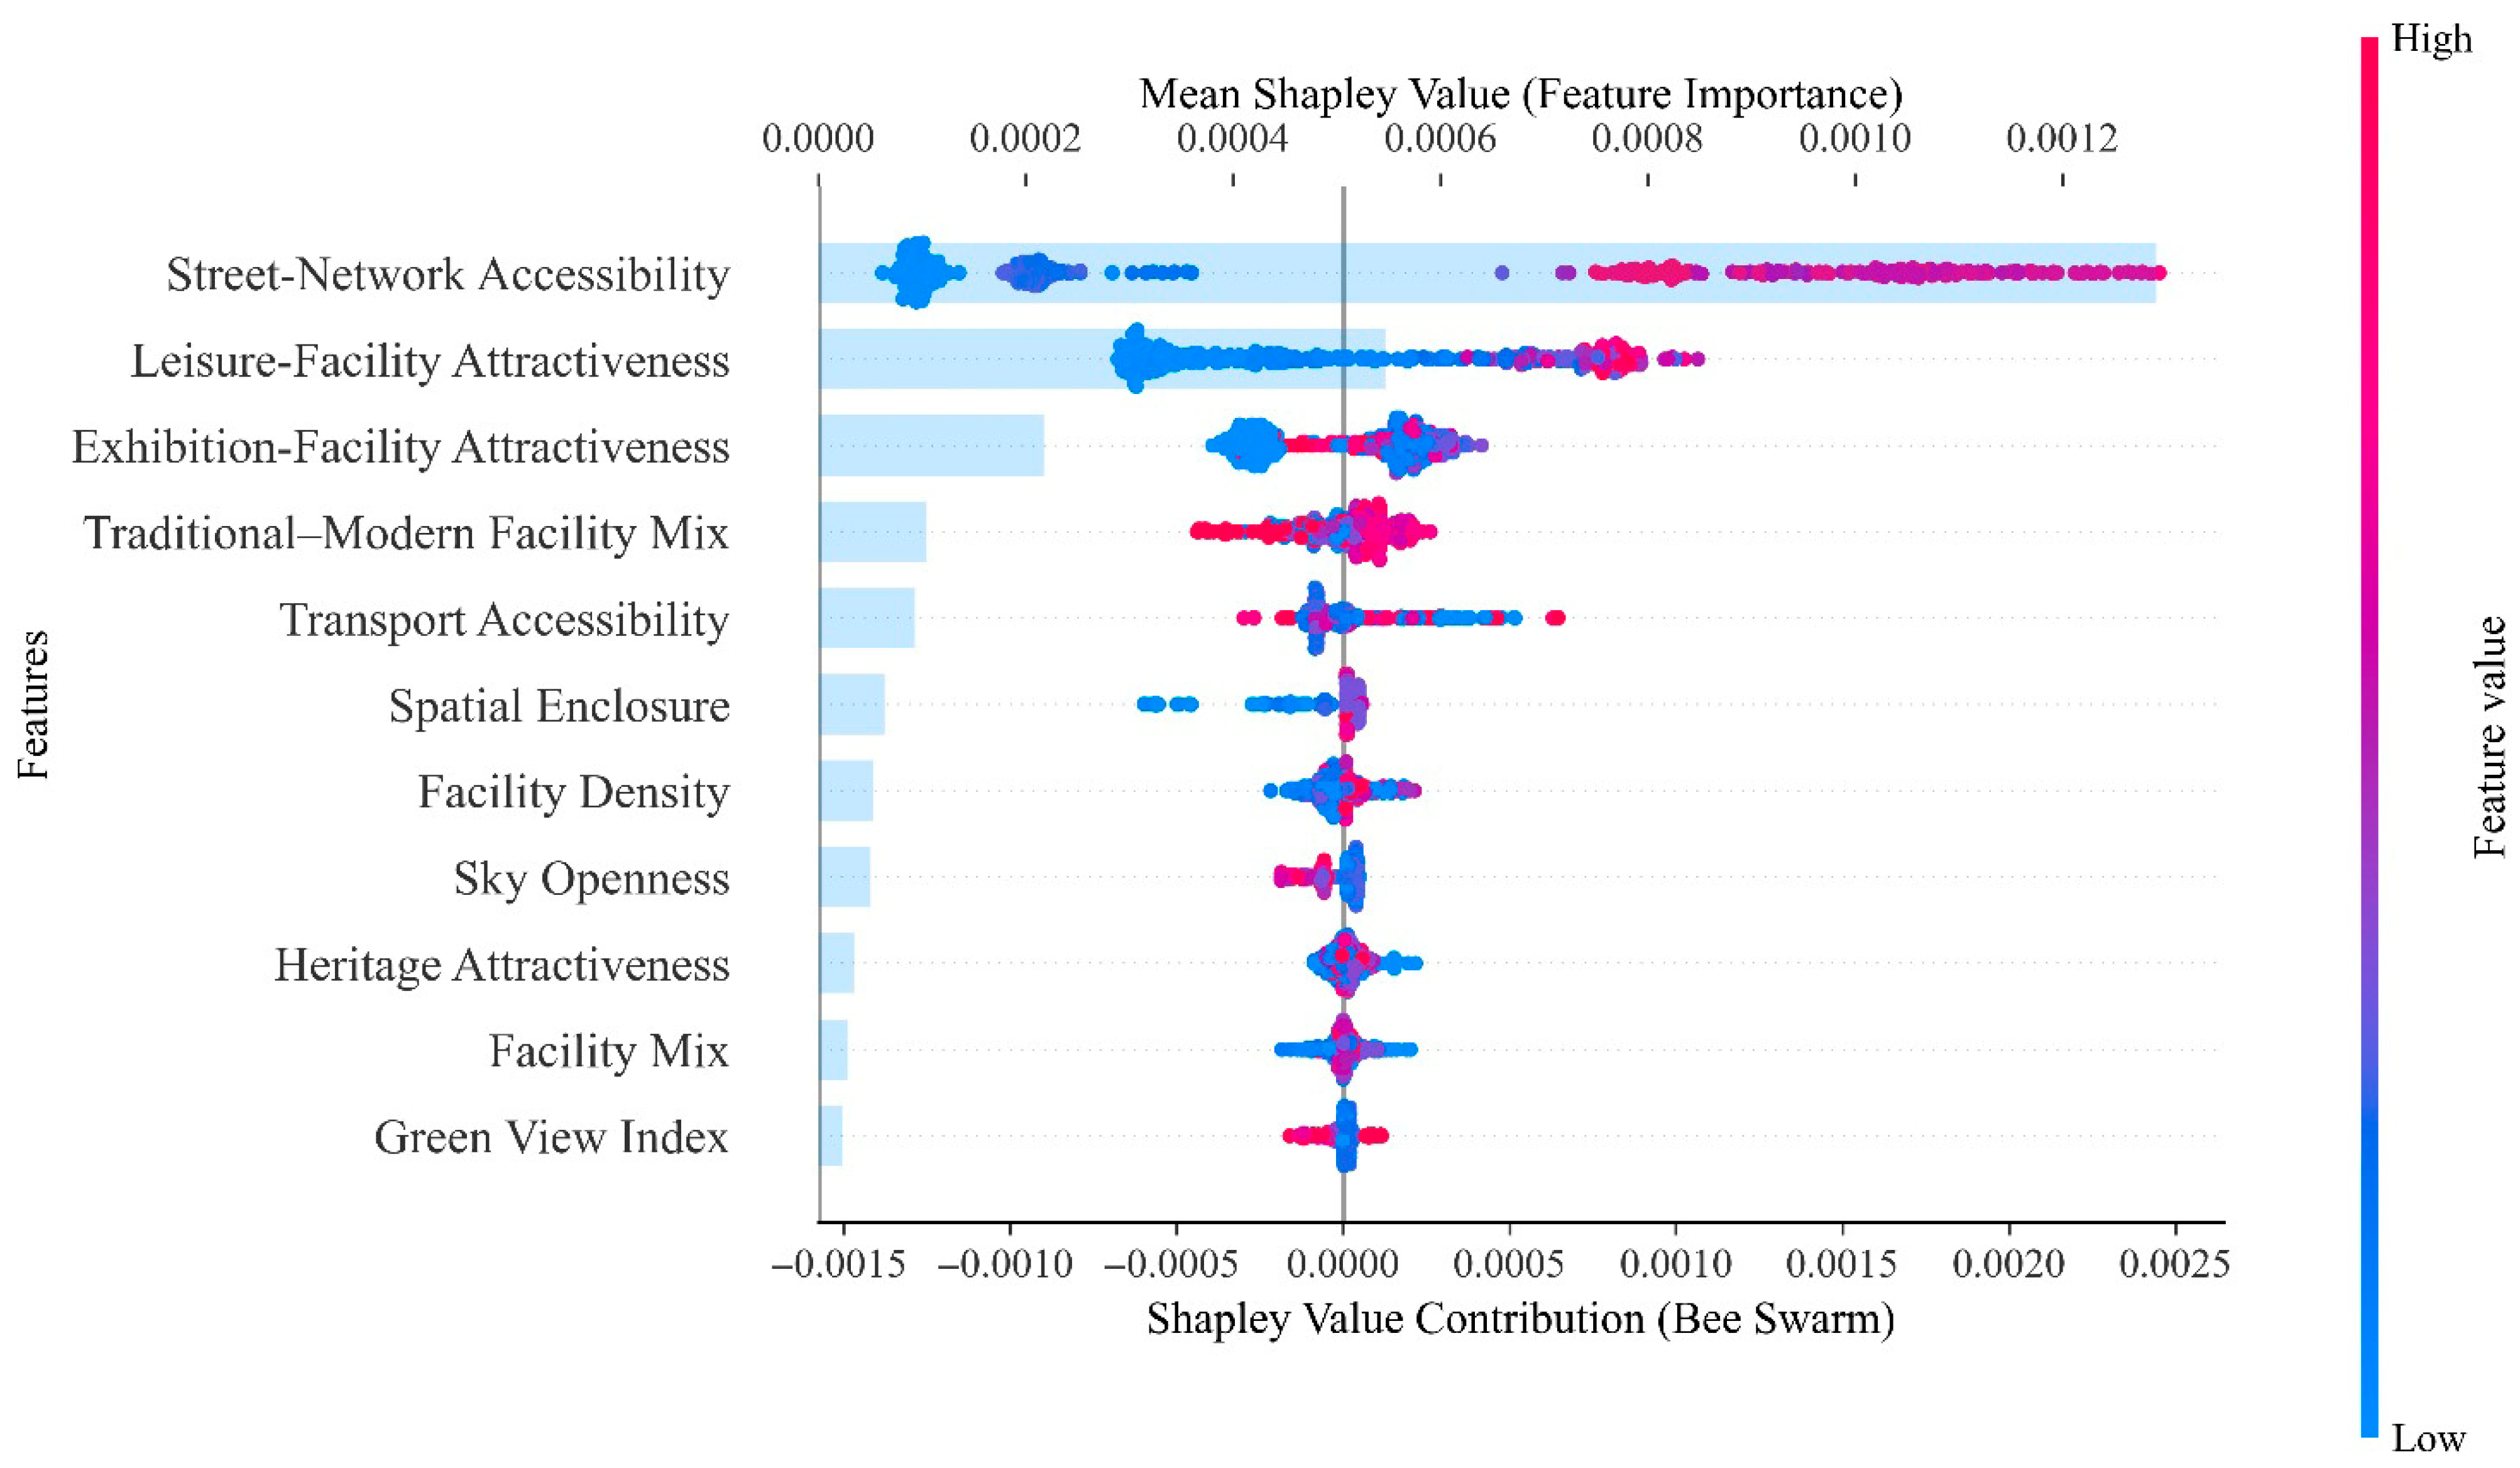
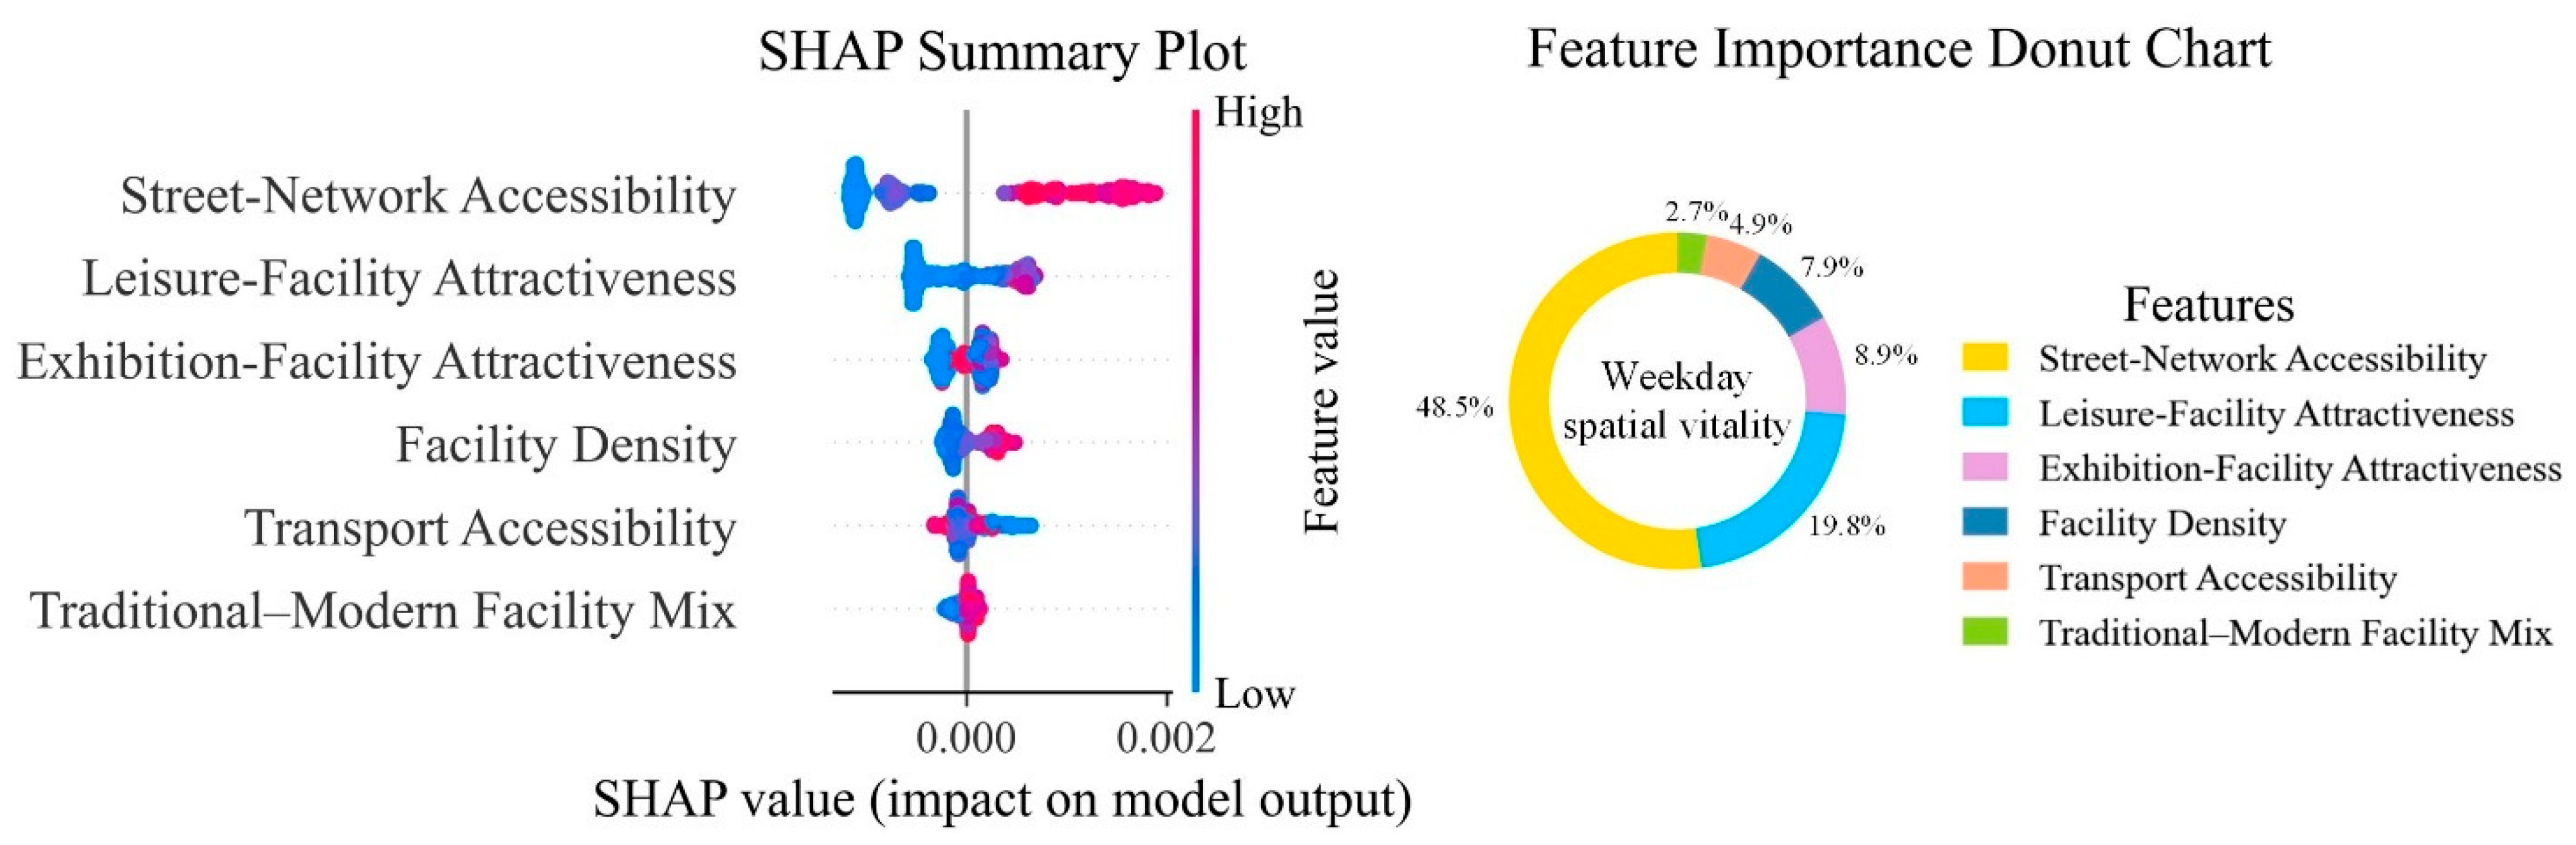
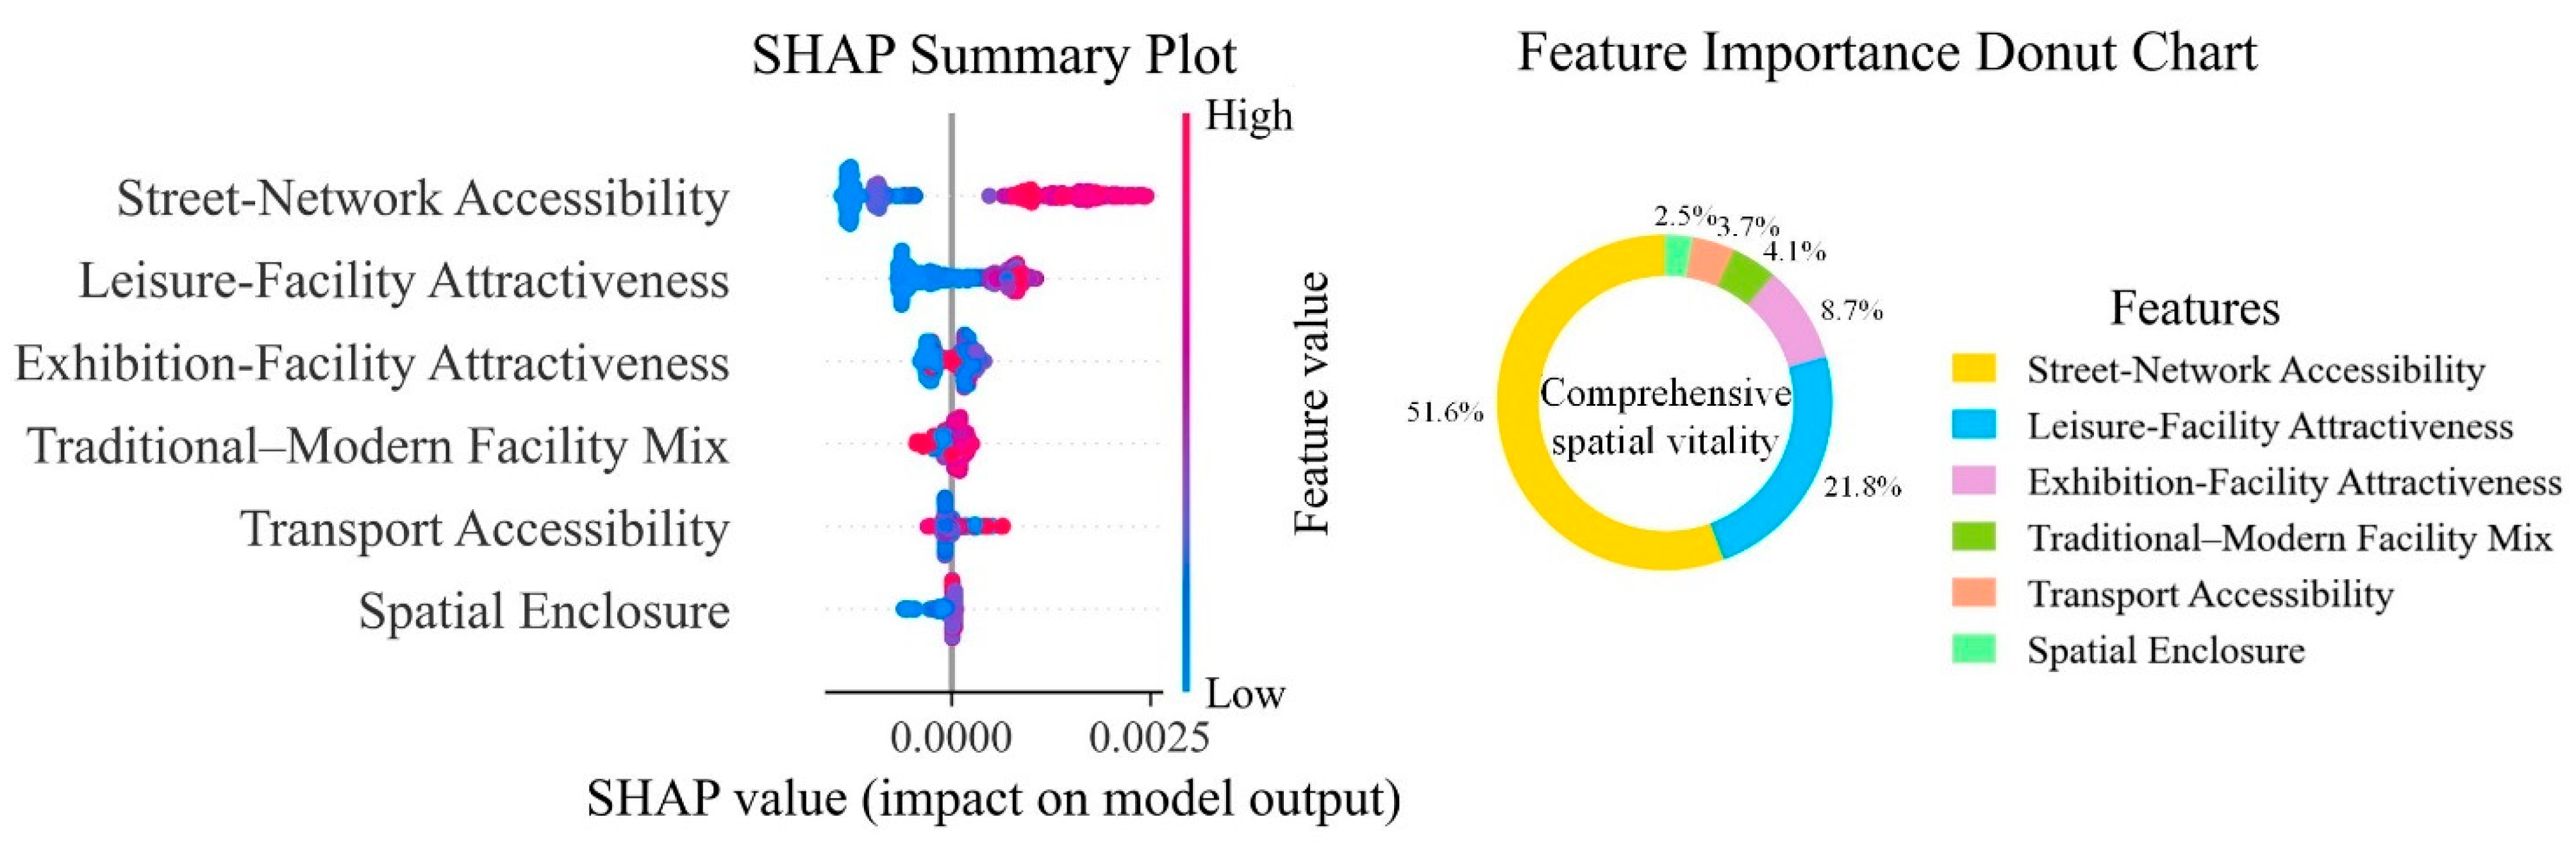
3.2. Relative Importance of Scene Elements for District Spatial Vitality
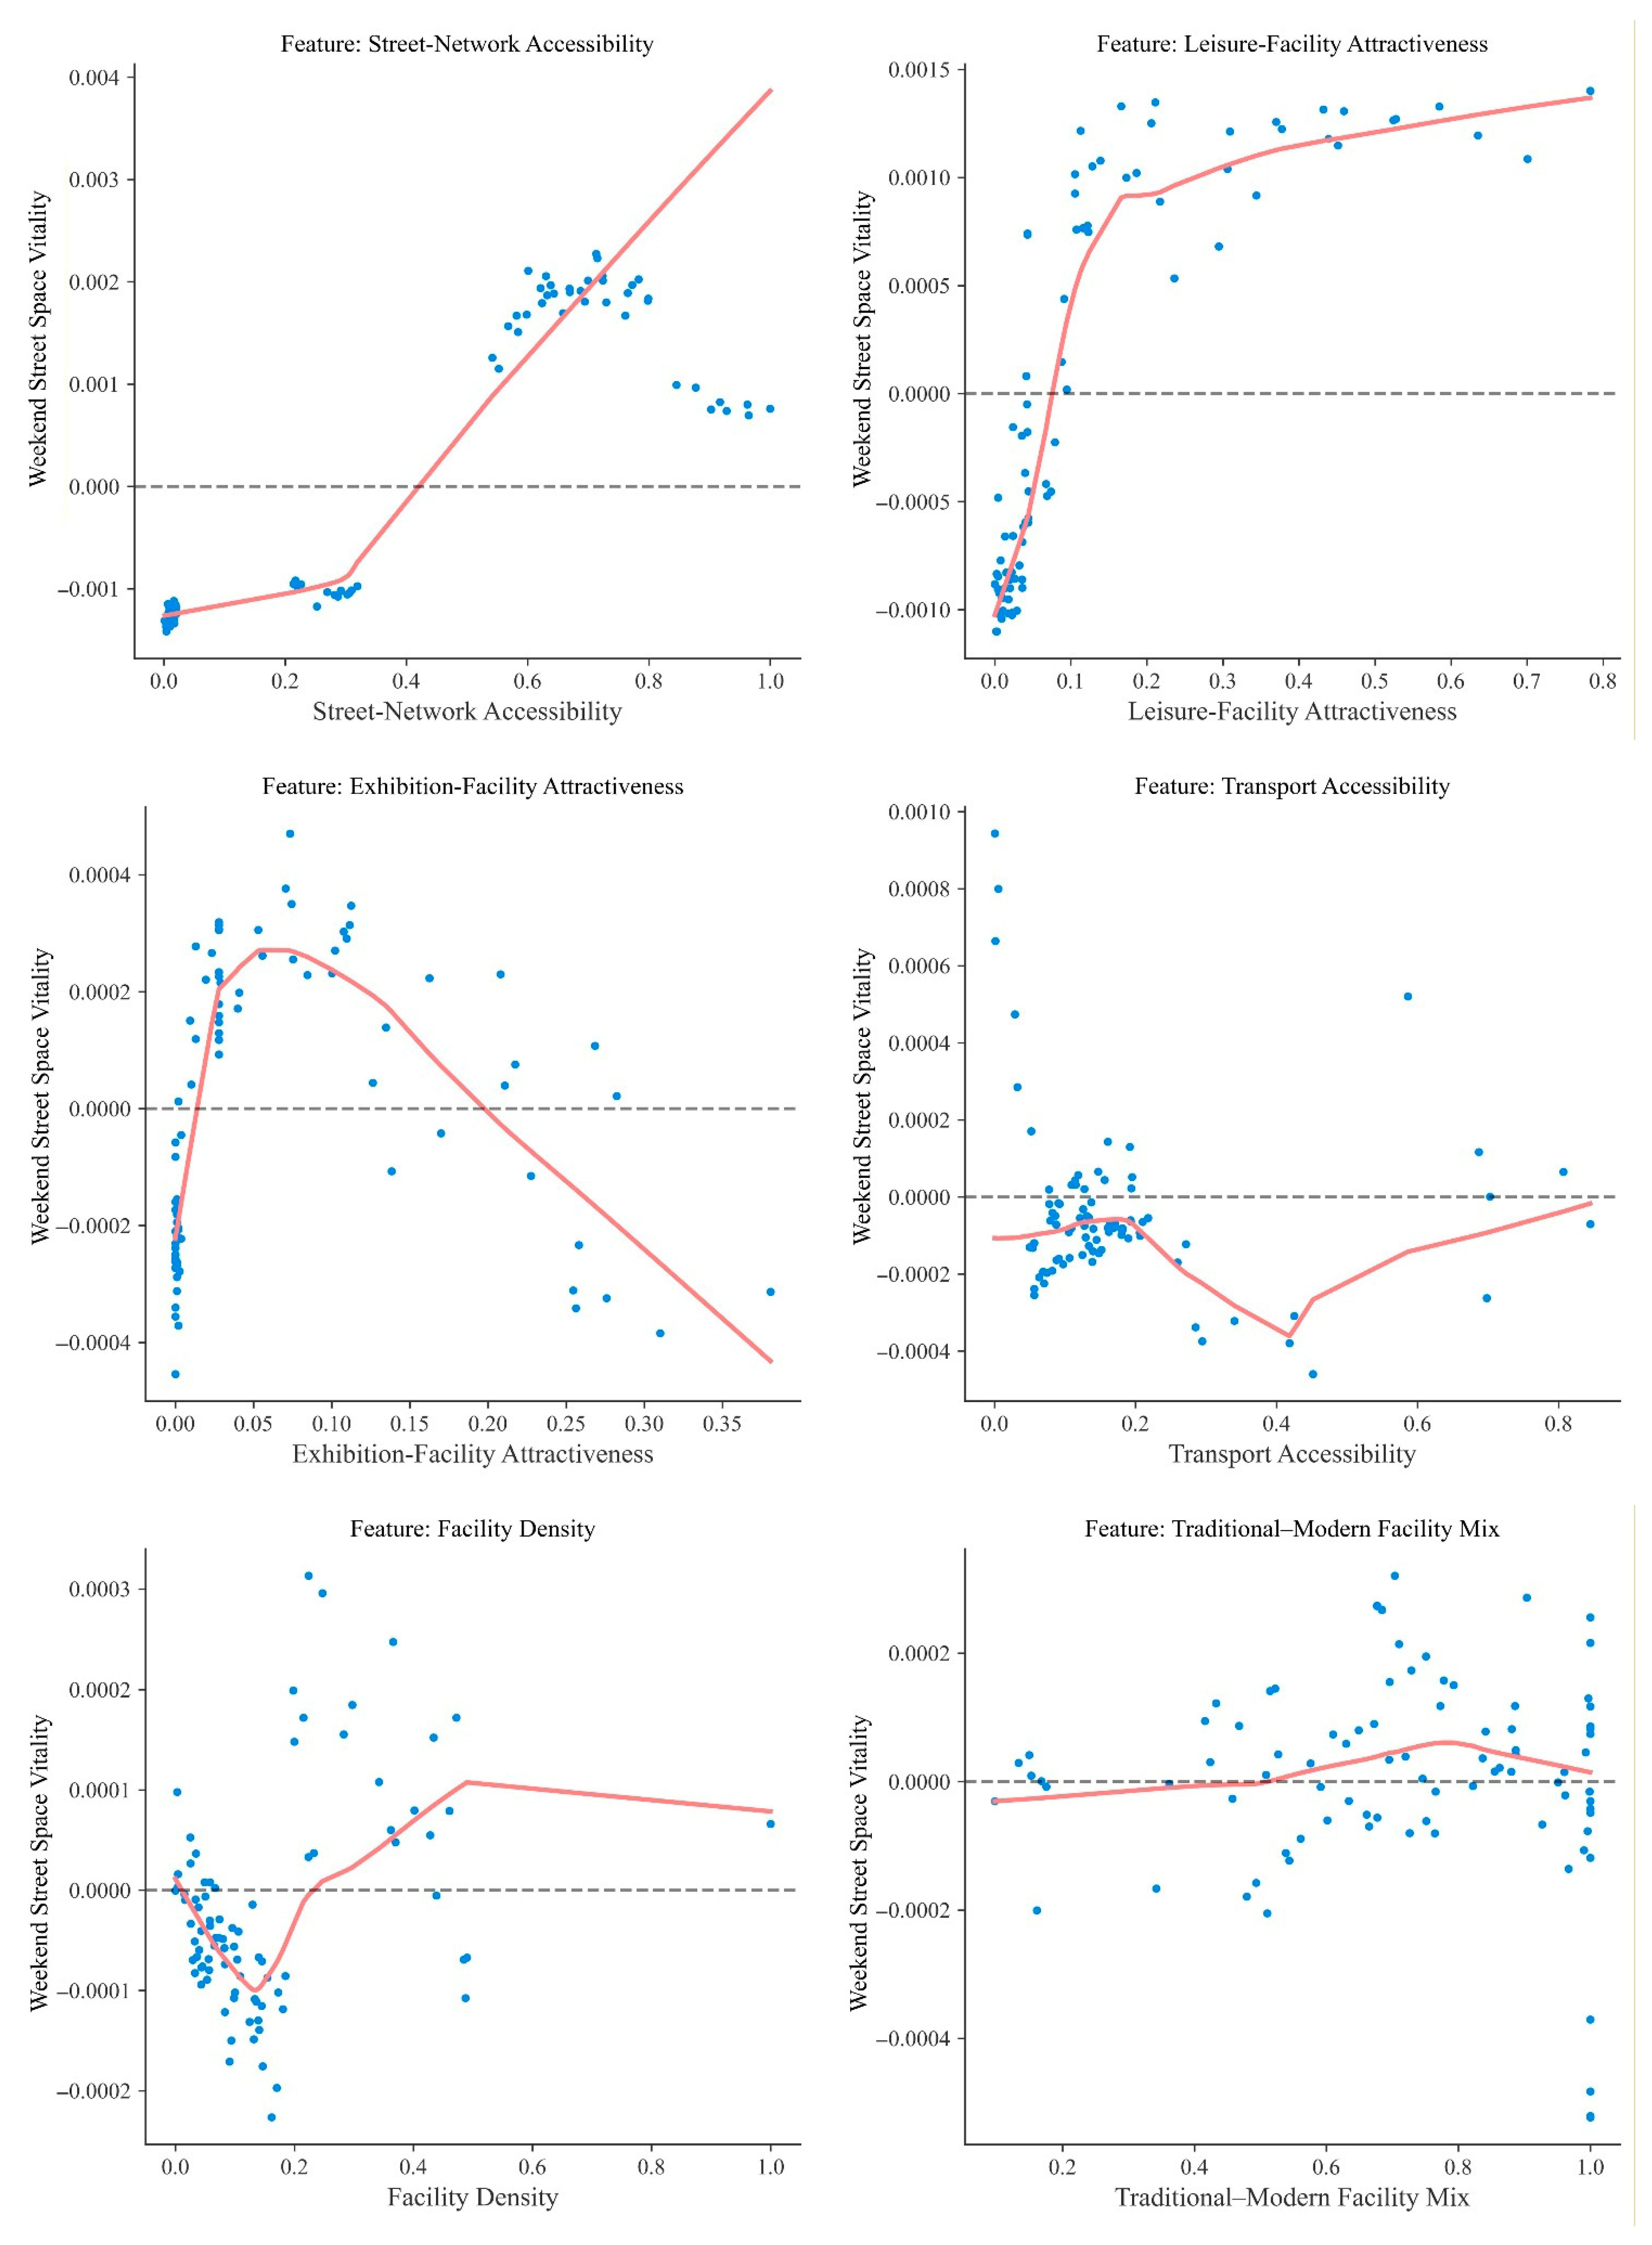
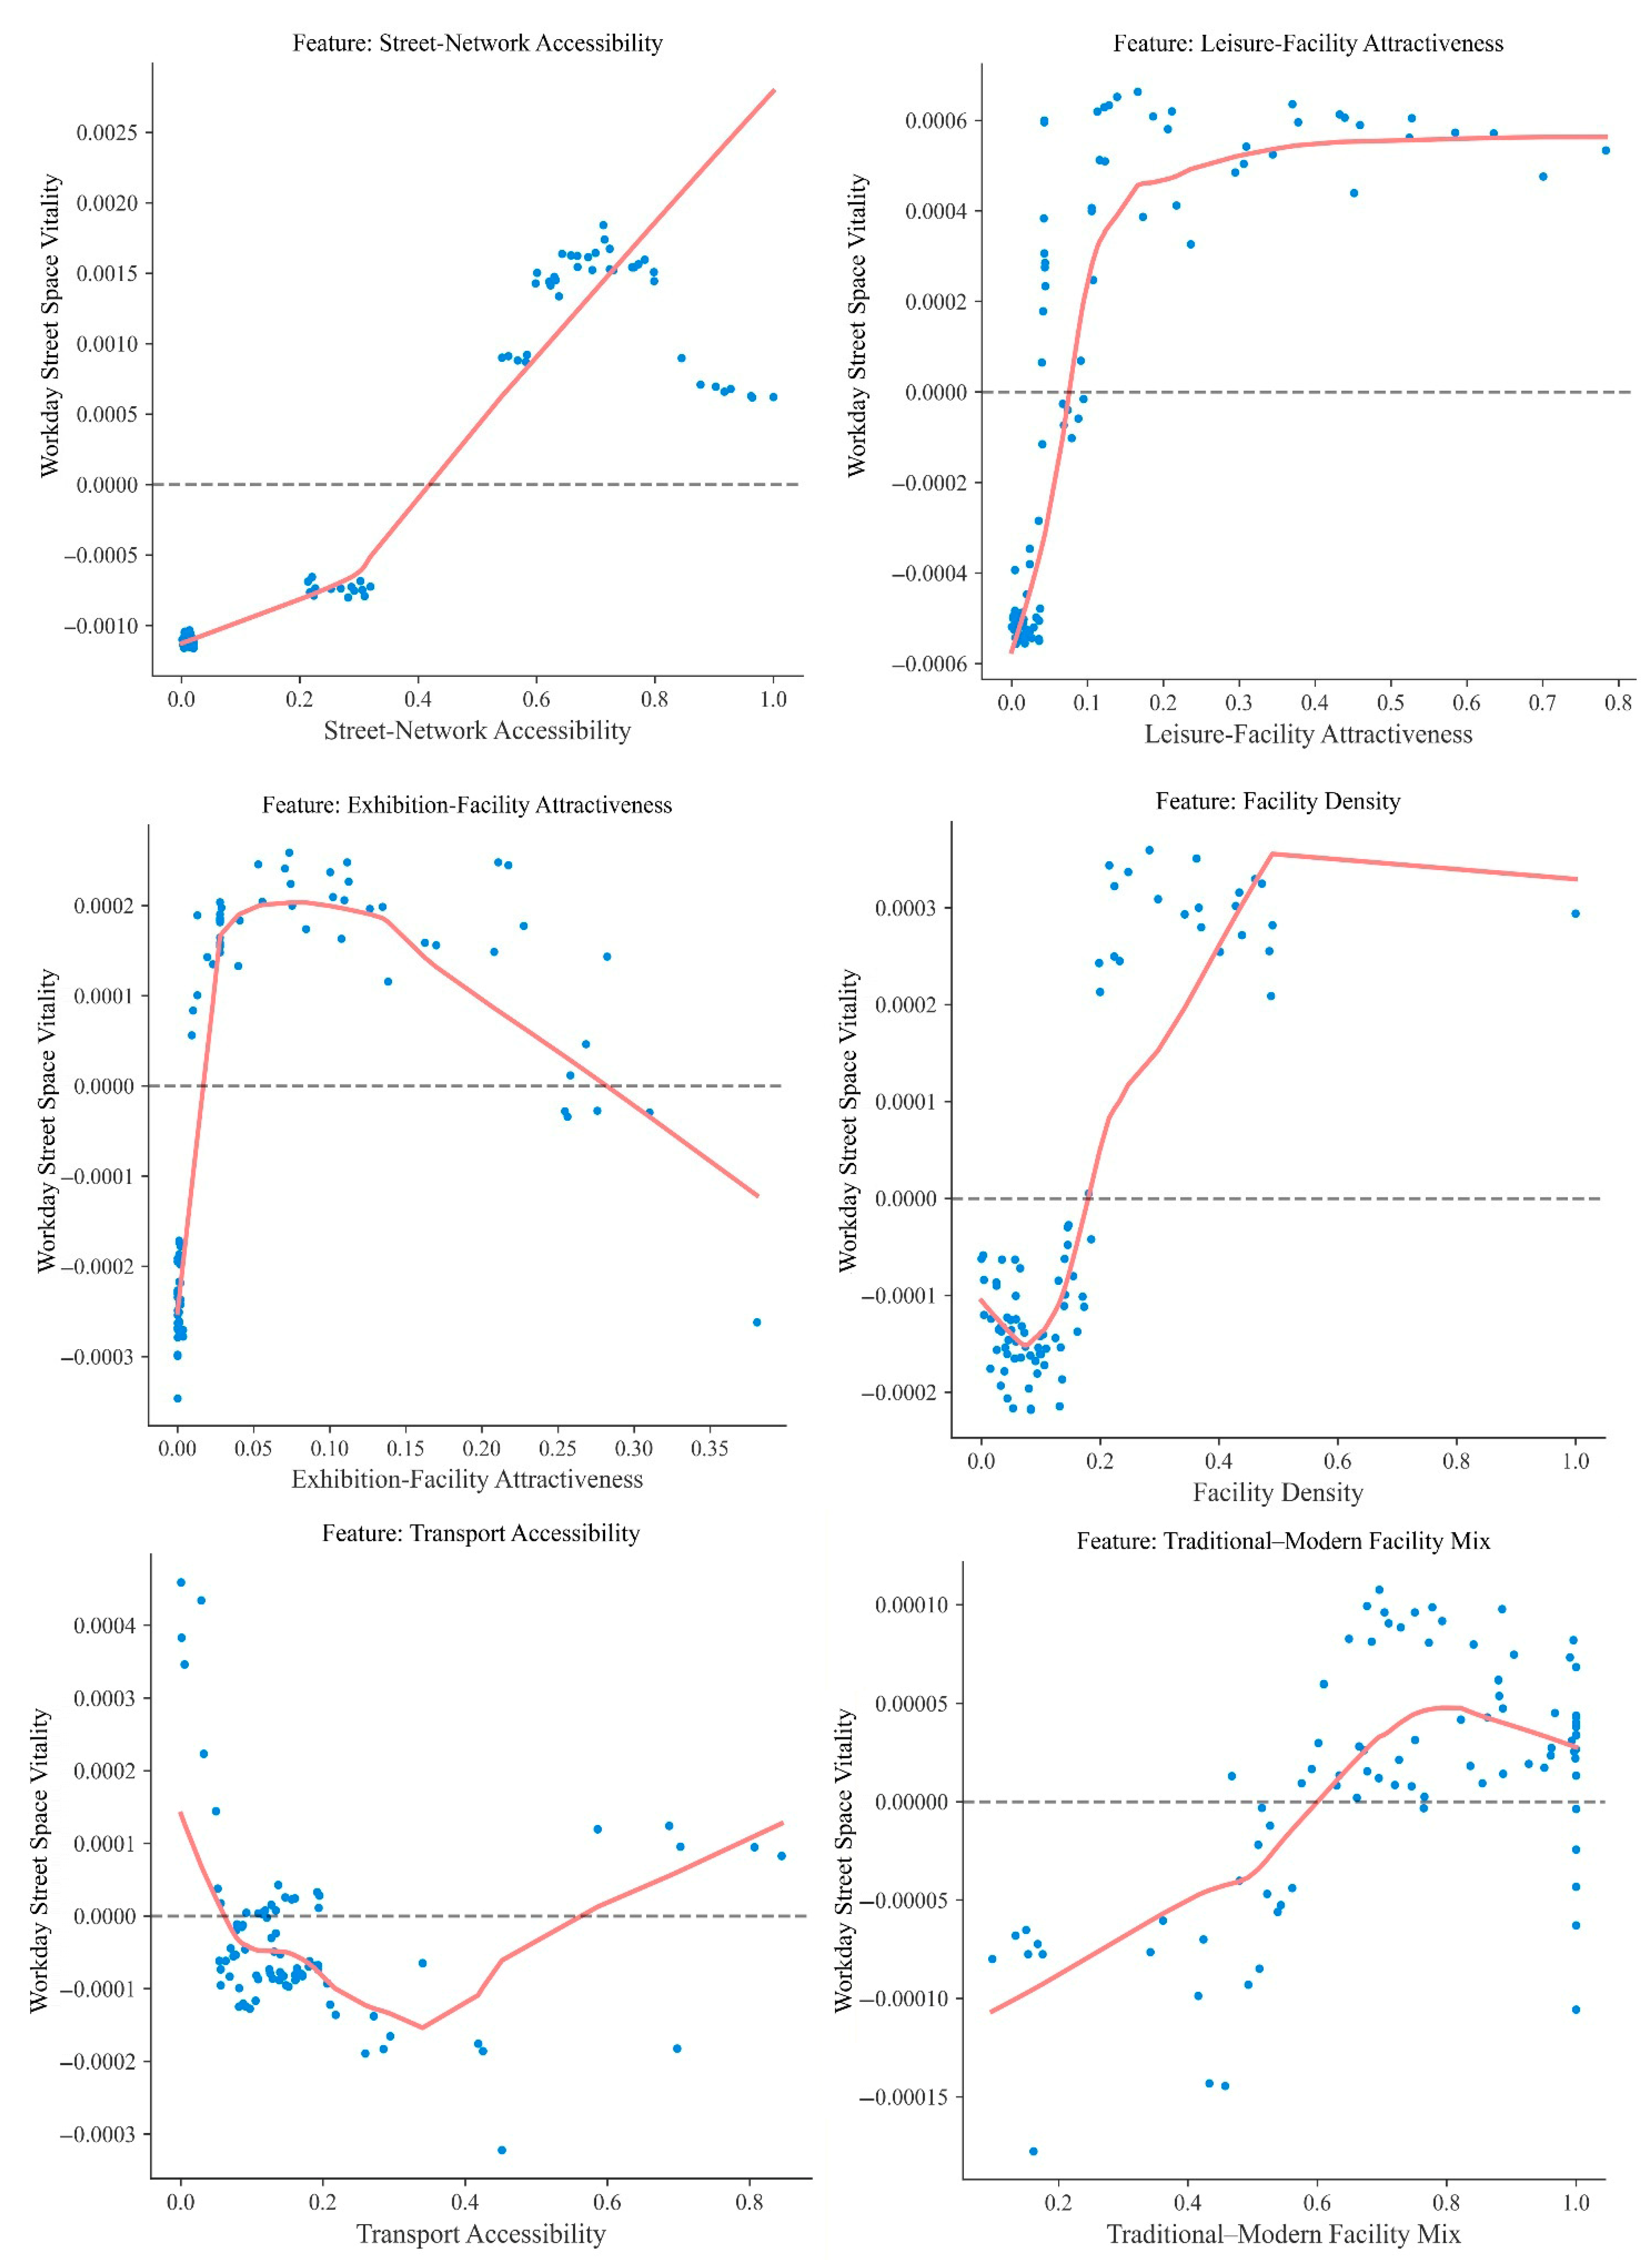
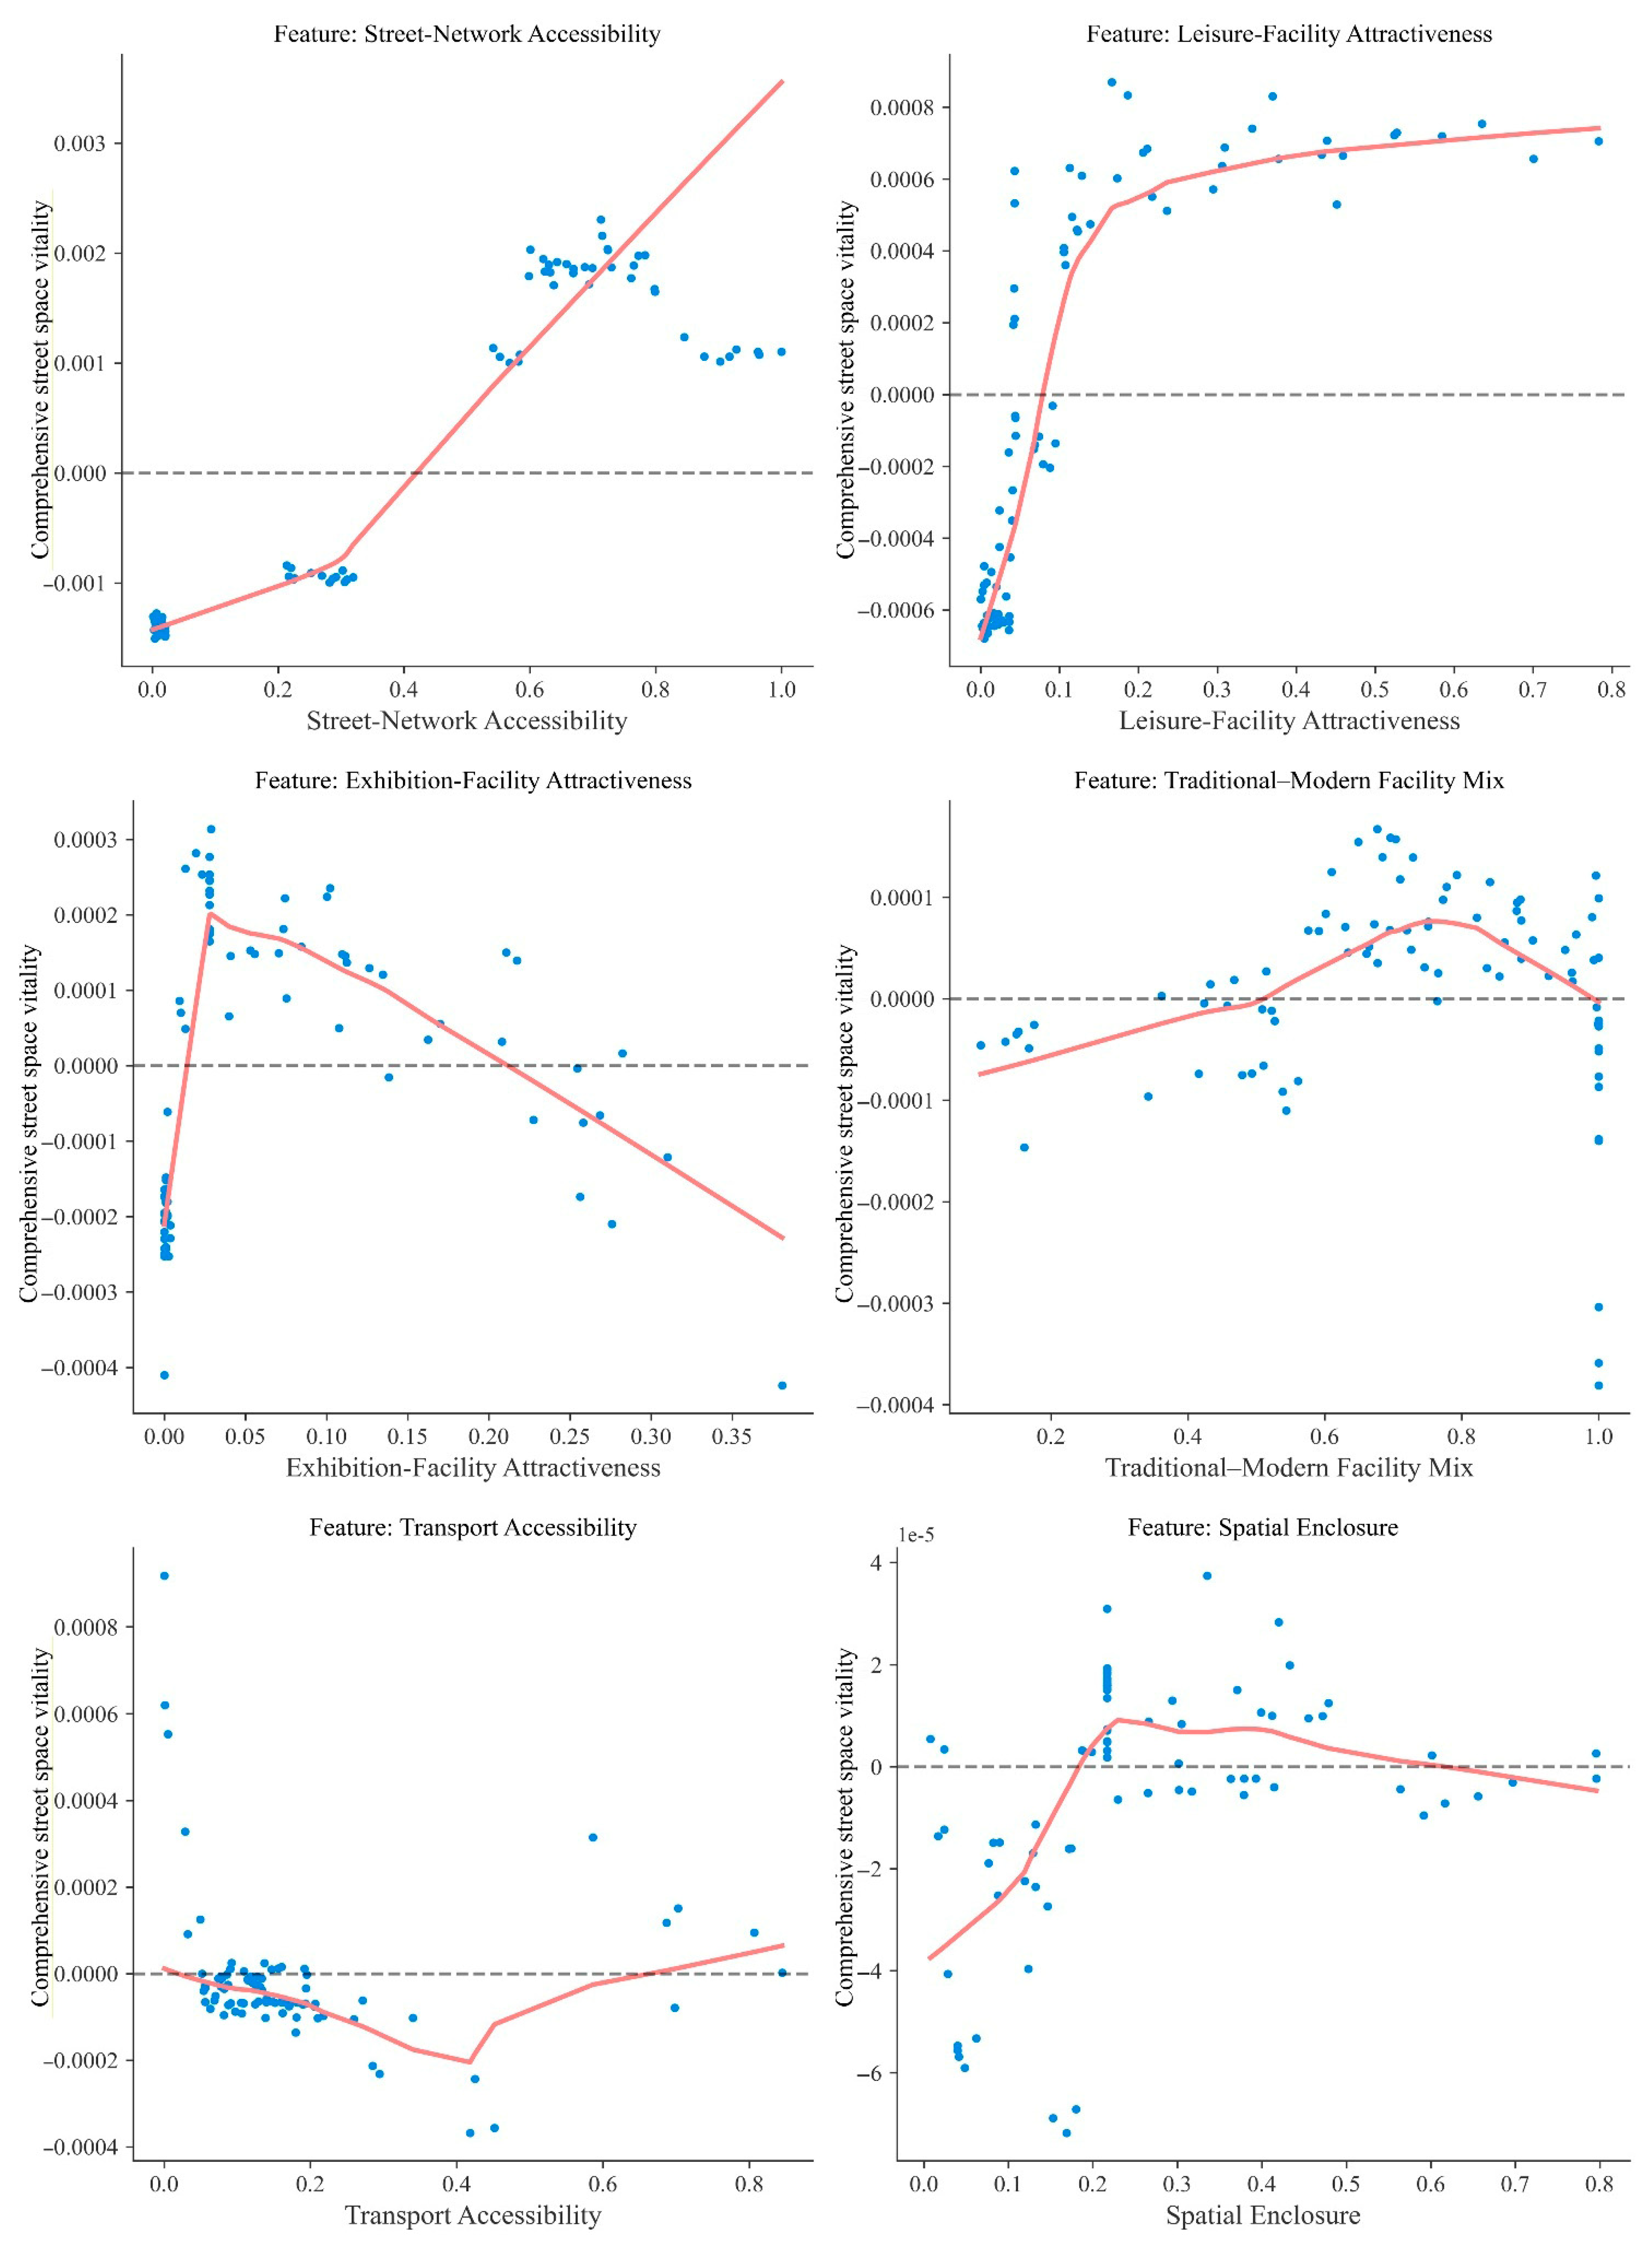
3.3. Threshold Effects of Scene Elements
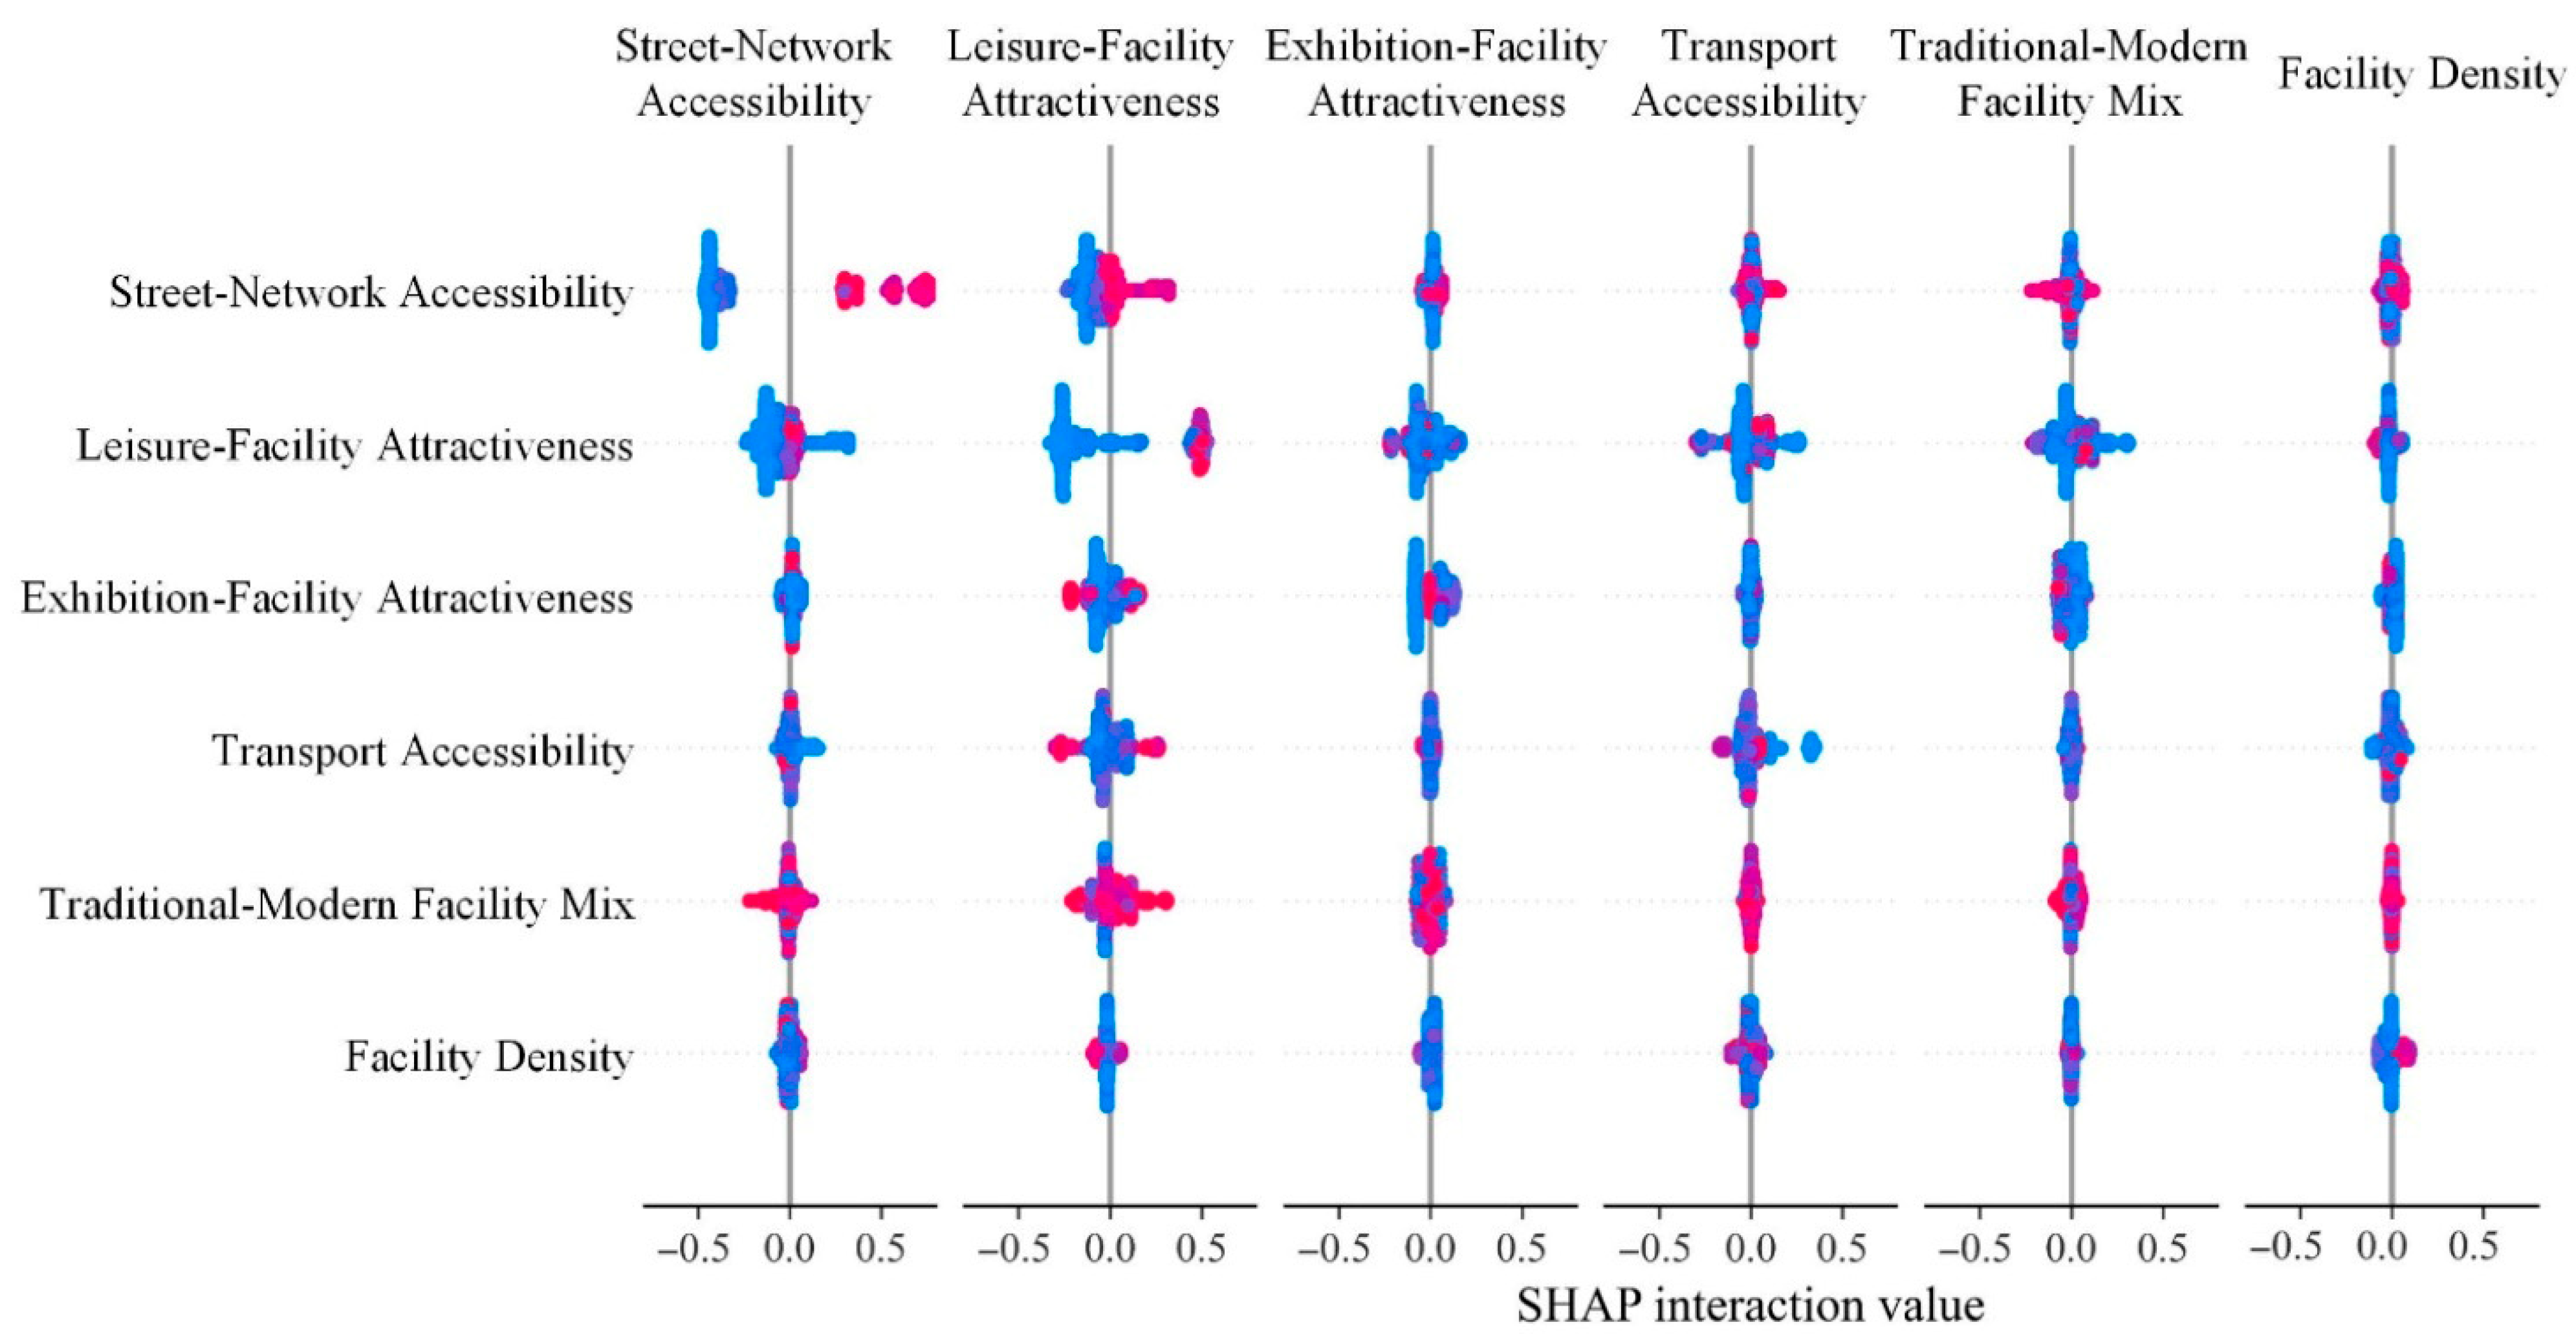
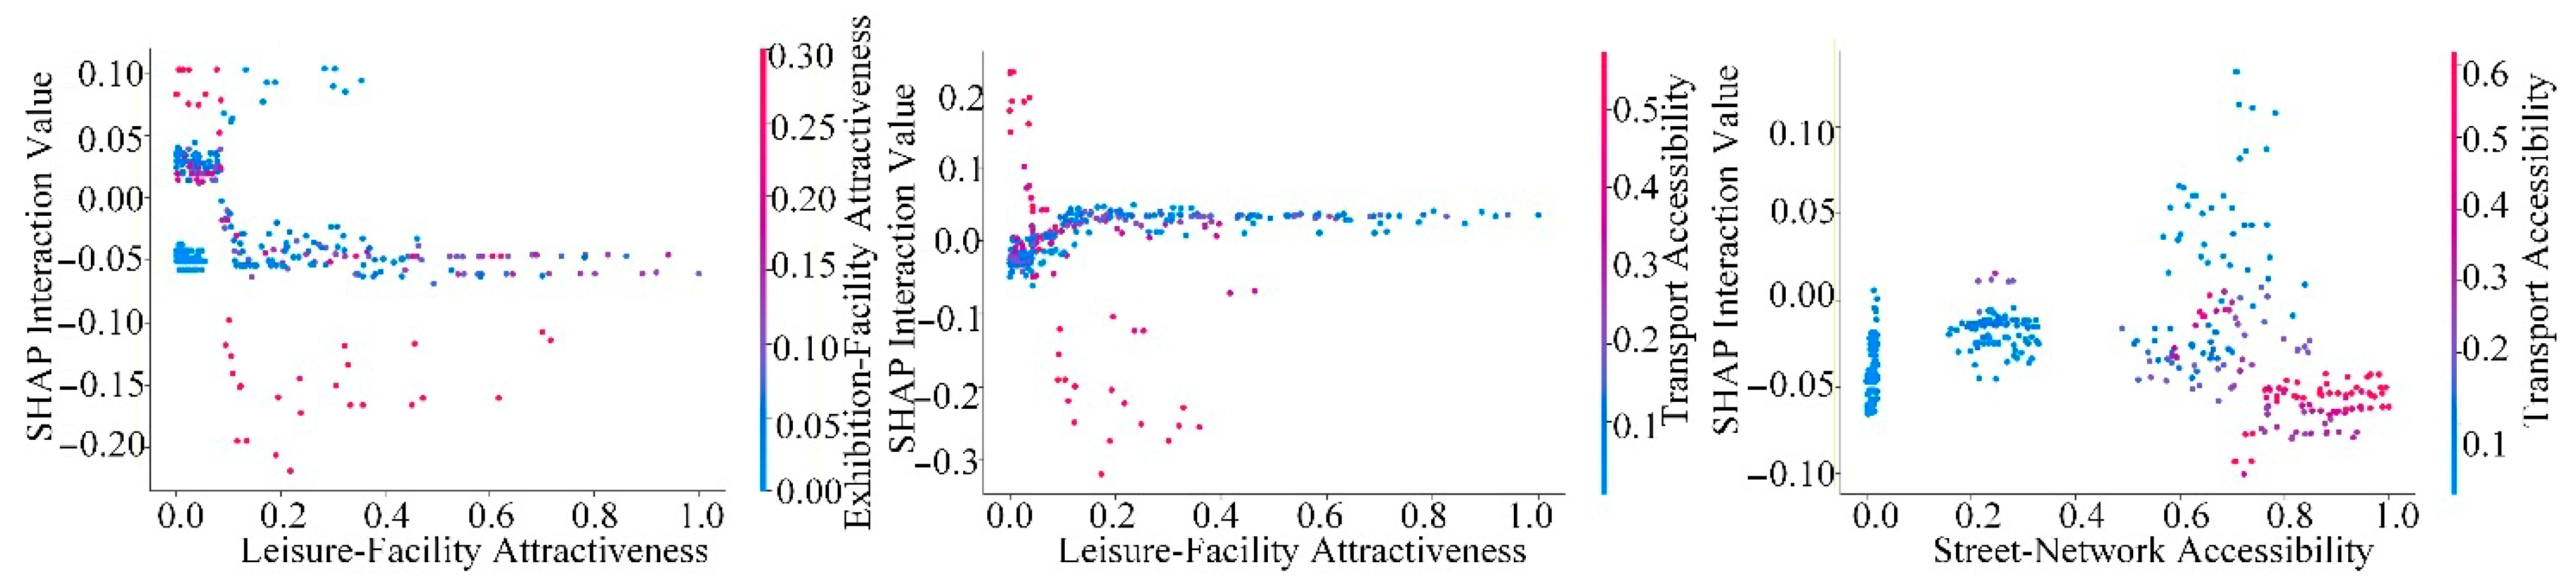
3.4. Interaction Effects Among Scene Elements
4. Discussion
4.1. Thresholds and Synergies of Scene Elements for District Spatial Vitality
4.1.1. Threshold Effects of Individual Scene Elements
4.1.2. Synergistic Effects of Scene Element Combinations
4.2. Optimization Recommendations and Insights for Scene Elements Driving District Spatial Vitality
4.3. Limitations and Future Directions
5. Conclusions
Author Contributions
Funding
Institutional Review Board Statement
Informed Consent Statement
Data Availability Statement
Conflicts of Interest
Appendix A


References
- AlHasawi, M.; Maatouk, M.M.H.; Qurunfulah, E. Key Success Factors of Urban Infill Development: A Conceptual Framework. Eur. J. Archit. Urban Plan. 2024, 3, 9–17. [Google Scholar] [CrossRef] [Scilit]
- Pulles, K.; Conti, I.A.; de Kleijn, M.B.; Kusters, B.; Rous, T.; Havinga, L.; Kaya, D.I. Emerging strategies for regeneration of historic urban sites: A systematic literature review. City Cult. Soc. 2023, 35, 100539. [Google Scholar] [CrossRef] [Scilit]
- Chan, S.H.G.; Lee, W.H.H.; Tang, B.M.; Chen, Z. Legacy of culture heritage building revitalization: Place attachment and culture identity. Front. Psychol. 2024, 14, 1314223. [Google Scholar] [CrossRef] [Scilit] [PubMed]
- Phetsuriya, N.; Heath, T. Defining the distinctiveness of urban heritage identity: Chiang Mai old city, Thailand. Soc. Sci. 2021, 10, 101. [Google Scholar] [CrossRef] [Scilit]
- Cervero, R.; Kockelman, K. Travel demand and the 3Ds: Density, diversity, and design. Transp. Res.-D 1997, 2, 199–219. [Google Scholar] [CrossRef] [Scilit]
- Ewing, R.; Cervero, R. Travel and the built environment: A synthesis. Transp. Res. Rec. 2001, 1780, 87–114. [Google Scholar] [CrossRef] [Scilit]
- Silver, D.A.; Clark, T.N. Scenescapes: How Qualities of Place Shape Social Life; Social Sciences Academic Press: Beijing, China, 2016. [Google Scholar]
- Zhang, Y.; Han, Y. Vitality evaluation of historical and cultural districts based on the values dimension: Districts in Beijing City, China. Herit. Sci. 2022, 10, 137. [Google Scholar] [CrossRef] [Scilit]
- Zhang, F.; Liu, Q.; Zhou, X. Vitality evaluation of public spaces in historical and cultural blocks based on multi-source data, a case study of Suzhou Changmen. Sustainability 2022, 14, 14040. [Google Scholar] [CrossRef] [Scilit]
- Tang, S.; Ta, N. How the built environment affects the spatiotemporal pattern of urban vitality: A comparison among different urban functional areas. Comput. Urban Sci. 2022, 2, 39. [Google Scholar] [CrossRef] [Scilit] [PubMed]
- Jin, A.; Ge, Y.; Zhang, S. Spatial characteristics of multidimensional urban vitality and its impact mechanisms by the built environment. Land 2024, 13, 991. [Google Scholar] [CrossRef] [Scilit]
- Zheng, J.; He, J.; Tang, H. The vitality of public space and the effects of environmental factors in Chinese suburban rural communities based on tourists and residents. Int. J. Environ. Res. Public Health 2022, 20, 263. [Google Scholar] [CrossRef] [Scilit]
- Wu, J.; Liu, Y.; Gao, H.; Wang, M. Cultivating historical heritage area vitality using urban morphology approach based on big data and machine learning. Comput. Environ. Urban Syst. 2022, 91, 101716. [Google Scholar] [CrossRef] [Scilit]
- Han, C.; Zhang, Z. Nonlinear effects of built environment perception and objective features on street vitality in historic districts. Front. Archit. Res. 2025, in press. [Google Scholar] [CrossRef] [Scilit]
- Fang, K.; Wu, Y. The importance of integrating historic context and activities into heritage district: Enhancing attraction and vitality. NPJ Herit. Sci. 2025, 13, 434. [Google Scholar] [CrossRef] [Scilit]
- Wang, Z.; Liu, Y.; Luo, X.; Tong, Z.; An, R. Nonlinear relationship between urban vitality and the built environment based on multi-source data: A case study of the main urban area of Wuhan City at the weekend. Prog. Geogr. 2023, 42, 716–729. [Google Scholar] [CrossRef] [Scilit]
- Fang, Q.; Inoue, T.; Li, D.; Liu, Q.; Ma, J. Transit-oriented development and sustainable cities: A visual analysis of the literature based on CiteSpace and VOSviewer. Sustainability 2023, 15, 8223. [Google Scholar] [CrossRef] [Scilit]
- Li, C.; Zhou, Y.; Wu, M.; Xu, J.; Fu, X. Exploring Nonlinear Threshold Effects and Interactions Between Built Environment and Urban Vitality at the Block Level Using Machine Learning. Land 2025, 14, 1232. [Google Scholar] [CrossRef] [Scilit]
- Doan, Q.C.; Ma, J.; Chen, S.; Zhang, X. Nonlinear and threshold effects of the built environment, road vehicles and air pollution on urban vitality. Landsc. Urban Plan. Forum 2025, 253, 105204. [Google Scholar] [CrossRef] [Scilit]
- Ewing, R.; Cervero, R. Travel and the built environment: A meta-analysis. J. Am. Plan. Assoc. 2010, 76, 265–294. [Google Scholar] [CrossRef] [Scilit]
- Kim, S. Urban vitality, urban form, and land use: Their relations within a geographical boundary for walkers. Sustainability 2020, 12, 10633. [Google Scholar] [CrossRef] [Scilit]
- Liu, W.; Yang, Z.; Gui, C.; Li, G.; Xu, H. Investigating the Nonlinear Relationship Between the Built Environment and Urban Vitality Based on Multi-Source Data and Interpretable Machine Learning. Buildings 2025, 15, 1414. [Google Scholar] [CrossRef] [Scilit]
- Li, Q.; Lv, S.; Chen, Z.; Cui, J.; Li, W.; Liu, Y. Traditional Villages’ Cultural Tourism Spatial Quality Evaluation. Sustainability 2024, 16, 7752. [Google Scholar] [CrossRef] [Scilit]
- Xie, Q.; Hu, L.; Wu, J.; Shan, Q.; Li, W.; Shen, K. Investigating the influencing factors of the perception experience of historical commercial streets: A case study of Guangzhou’s Beijing road pedestrian street. Buildings 2024, 14, 138. [Google Scholar] [CrossRef] [Scilit]
- Chen, L.; Jiang, X.; Tan, L.; Chen, C.; Yang, S.; You, W. Analysis of Spatial Vitality Characteristics and Influencing Factors of Old Neighborhoods: A Case Study of Ya’an Xicheng Neighborhood. Buildings 2024, 14, 3348. [Google Scholar] [CrossRef] [Scilit]
- Ren, X.; Ren, H.; Hao, W.; Zhao, Y. Comparative Study on the Vitality of Typical Historical Districts in Beijing from the Perspective of Scene Theory. Acad. J. Archit. Geotech. Eng. 2024, 6, 1–7. [Google Scholar]
- Silver, D.; Clark, T.N.; Rothfield, L. A Theory of Scenes; University of Chicago: Chicago, IL, USA, 2007. [Google Scholar]
- Liu, S.; Long, Y.; Zhang, L.; Yang, J.; Dong, W. Quantitative measurement of urban spatial vitality by integrating physical built environment and subjective perception dimensions. Environ. Plan. B Urban Anal. City Sci. 2025, 52, 131–149. [Google Scholar] [CrossRef] [Scilit]
- Liang, P.; Cui, X.; Ma, J.; Song, W.; Xu, Y. Exploring the Determinants of Spatial Vitality in High-Speed Rail Station Areas in China: A Multi-Source Data Analysis Using LightGBM. Land 2025, 14, 1262. [Google Scholar] [CrossRef] [Scilit]
- Wang, Q.; Jiang, Y. Leisure time prediction and influencing factors analysis based on LightGBM and SHAP. Mathematics 2023, 11, 2371. [Google Scholar] [CrossRef] [Scilit]
- Tu, H.; Zhao, Y.; Cui, J.; Lu, W.; Sun, G.; Xu, X.; Hu, Q.; Hu, K.; Wu, M.; Wu, X. Improving Lung Cancer Risk Prediction Using Machine Learning: A Comparative Analysis of Stacking Models and Traditional Approaches. Cancers 2025, 17, 1651. [Google Scholar] [CrossRef] [Scilit]
- Li, N.; Yao, L. Exploring the vitality of Tianjin’s downtown based on the Light GBM-SHAP model. Comput. Urban Sci. 2024, 4, 48. [Google Scholar] [CrossRef] [Scilit]
- Chen, W.; Wu, A.N.; Biljecki, F. Classification of urban morphology with deep learning: Application on urban vitality, Computers. Environ. Urban Syst. 2021, 90, 101706. [Google Scholar] [CrossRef] [Scilit]
- Ke, G.; Meng, Q.; Finley, T.; Wang, T.; Chen, W.; Ma, W.; Ye, Q.; Liu, T.-Y. Lightgbm: A highly efficient gradient boosting decision tree. In Advances in Neural Information Processing Systems; ACM: New York, NY, USA, 2017; Volume 30. [Google Scholar]
- Xu, Z.; Chen, J.; Shen, J.; Xiang, M. Recursive long short-term memory network for predicting nonlinear structural seismic response. Eng. Struct. 2022, 250, 113406. [Google Scholar] [CrossRef] [Scilit]
- Duan, S.; Zhang, M.; Xiong, J.; Qiu, S.; Xie, Z.; Jiang, Q.; Kou, Y. DSYOLO: A dynamic snake convolution-based segmentation model for tunnel lining cracks in complex environments. Eng. Struct. 2025, 344, 121325. [Google Scholar] [CrossRef] [Scilit]
- Lundberg, S.M.; Lee, S.-I. A unified approach to interpreting model predictions. In Advances in Neural Information Processing Systems; ACM: New York, NY, USA, 2017; Volume 30. [Google Scholar]
- Lundberg, S.M.; Erion, G.; Chen, H.; DeGrave, A.; Prutkin, J.M.; Nair, B.; Katz, R.; Himmelfarb, J.; Bansal, N.; Lee, S.-I. From local explanations to global understanding with explainable AI for trees. Nat. Mach. Intell. 2020, 2, 56–67. [Google Scholar] [CrossRef] [Scilit] [PubMed]
- Ponce-Bobadilla, A.V.; Schmitt, V.; Maier, C.S.; Mensing, S.; Stodtmann, S. Practical guide to SHAP analysis: Explaining supervised machine learning model predictions in drug development. Clin. Transl. Sci. 2024, 17, e70056. [Google Scholar] [CrossRef] [Scilit]
- Yang, J.; Wang, E. Exploring the Nonlinear Impacts of Built Environment on Urban Vitality from a Spatiotemporal Perspective at the Block Scale in Chongqing. ISPRS Int. J. Geo-Inf. 2025, 14, 225. [Google Scholar] [CrossRef] [Scilit]
- Chen, Y.; Yu, B.; Shu, B.; Yang, L.; Wang, R. Society, Exploring the spatiotemporal patterns and correlates of urban vitality: Temporal and spatial heterogeneity. Sustain. Cities 2023, 91, 104440. [Google Scholar] [CrossRef] [Scilit]
- Xia, X.; Zhang, Y.; Zhang, Y.; Rao, T. The spatial pattern and influence mechanism of urban vitality: A case study of Changsha, China. Front. Environ. Sci. 2022, 10, 942577. [Google Scholar] [CrossRef] [Scilit]
- Gehl, J.; Svarre, B. How to Study Public Life; Island Press: Washington, DC, USA, 2013. [Google Scholar]
- Zhang, T.; Yin, P.; Peng, Y. Effect of commercialization on tourists’ perceived authenticity and satisfaction in the cultural heritage tourism context: Case study of Langzhong ancient city. Sustainability 2021, 13, 6847. [Google Scholar] [CrossRef] [Scilit]
- Wu, Y.; Xie, C.; Zhang, A.; Zhao, T.; Cao, J. Spatiotemporal analysis of urban vitality and its drivers from a human mobility perspective. ISPRS Int. J. Geo-Inf. 2025, 14, 167. [Google Scholar] [CrossRef] [Scilit]
- Juliana, J.; Pramezwary, A.; Djakasaputra, A.; Anwar, M.M.; Jie, F. The missing link in urban tourism: Connecting leisure, accessibility and resident participation for enhanced value. Cogent Soc. Sci. 2025, 11, 2556473. [Google Scholar] [CrossRef] [Scilit]
- Li, X.; Wang, P.; Zhou, J.; Zhao, J. Exploring the Impact of Musealization on Spatial Vitality and Tourist Experience in the Historic Center of Macau. Buildings 2025, 15, 2512. [Google Scholar] [CrossRef] [Scilit]
- Huang, J.; Hu, X.; Wang, J.; Lu, A. How diversity and accessibility affect street vitality in historic districts? Land 2023, 12, 219. [Google Scholar] [CrossRef] [Scilit]








| Data Type | Data Source | Data Collection Method |
|---|---|---|
| Tianjin Baidu heatmap data | https://lbsyun.baidu.com/, accessed on 25 May 2025 | Sampling dates: 25 May 2025 (weekend) and 28 May 2025 (weekday); every two hours from 10:00 to 22:00; 12 heatmap images in total; clear-weather conditions. |
| POI data for Tianjin central urban districts | https://lbs.amap.com/, accessed on 29 May 2025 | District POI data obtained via API, covering commercial, transport, and leisure facilities. |
| Street-network data for Tianjin central urban districts | https://www.openstreetmap.org/, on 18 May 2025 | Street-network layers acquired and subsequently simplified, topologized, and format-standardized. |
| Street-view imagery for Tianjin central urban districts | https://lbsyun.baidu.com/, accessed on 25 May 2025 | Sampling points generated along the street network; BSVIs collected and semantically segmented to extract visual elements and their percentage features. |
| Online text (review) data | https://www.bazhuayu.com/, accessed on 2 January 2025 | User reviews on street experiential perception scraped; time span: May 2022–May 2025. |
| Category | Dimension | Indicator | Indicator Meaning | Measurement Method |
|---|---|---|---|---|
| Physical elements | Accessibility | Street-Network Accessibility | Ease of walking and internal circulation within the district. | Using ArcGIS, compute the average distance from each district grid cell’s centroid to transport, convenience stores, and other POIs. |
| Transport Accessibility | Density/aggregation of public-transport stops (bus/metro) supporting external connection. | Using ArcGIS, compute the mean kernel density of nearby bus- and metro-station POIs for each historic district. | ||
| Visual environment | Green View Index | Proportion of visible greenery in the street view. | Using semantic segmentation of Baidu street-view images, calculate the proportion of vegetation pixels relative to the total number of pixels for each sampling point. | |
| Spatial Enclosure | Degree of enclosure formed by building façades along streets. | Using semantic segmentation of Baidu street-view images, calculate the proportion of building façade/interface pixels relative to the total number of pixels for each sampling point. | ||
| Sky Openness | Visible-sky proportion in street view. | Using semantic segmentation of Baidu street-view images, calculate the proportion of sky pixels relative to the total number of pixels for each sampling point. | ||
| Functional diversity | Facility Mix | Diversity of facility categories within a grid (land-use/POI mixing). | Using ArcGIS, compute the proportions of each POI category within the historic district. | |
| Facility Density | Overall concentration/intensity of facilities. | Using ArcGIS, compute the kernel density values for each POI category within the district. | ||
| Subjective-perception elements | Facility integration | Traditional–Modern Facility Mix | Share/coordination between traditional and modern formats. | Using ArcGIS, compute the ratio of traditional to modern facilities by dividing the kernel density of traditional-facility POIs (weighted by heritage grade: national = 5, provincial = 3, ordinary = 1) by the kernel density of modern facilities (weighted by rating: 5 = 5, 3 = 3, 1 = 1). The weighting values follow established grading standards reported in the prior literature, and the resulting ratio was further normalized (Min–Max) to improve comparability and mitigate potential subjectivity in indicator construction. |
| Cultural expression | Heritage Attractiveness | Perceived attention/knowledge regarding historic remains. | Using ArcGIS, compute the kernel density of heritage-related POIs within each grid cell and multiply it by the visitor-attention weight for the heritage attractiveness dimension, derived from the proportion of heritage attractiveness-related high-frequency words in the overall review word-frequency statistics. | |
| Cultural display | Exhibition-Facility Attractiveness | Perceived attention to exhibition/display facilities. | Using ArcGIS, compute the kernel density of exhibition-facility-related POIs within each grid cell, and multiply it by the visitor-attention weight for the Exhibition-Facility Attractiveness dimension, derived from the proportion of Exhibition-Facility Attractiveness-related high-frequency words in the overall review word-frequency statistics. | |
| Cultural leisure | Leisure-Facility Attractiveness | Emotional engagement with leisure facilities and activities. | Using ArcGIS, compute the kernel density of Leisure-Facility Attractiveness-related POIs within each grid cell and multiply it by the visitor-attention weight for the Leisure-Facility Attractiveness dimension, derived from the proportion of Leisure-Facility Attractiveness-related high-frequency words in the overall review word-frequency statistics. |
| Model Type | Learning Rate | Max Depth | MAE | RMSE | R2 |
|---|---|---|---|---|---|
| RF | 0.05 | 10 | 0.0008 | 0.0012 | 0.72 |
| DT | 0.05 | 17 | 0.0009 | 0.0014 | 0.62 |
| GDBT | 0.05 | 6 | 0.0008 | 0.0011 | 0.74 |
| LightGBM | 0.05 | 16 | 0.0005 | 0.0010 | 0.85 |
Disclaimer/Publisher’s Note: The statements, opinions and data contained in all publications are solely those of the individual author(s) and contributor(s) and not of MDPI and/or the editor(s). MDPI and/or the editor(s) disclaim responsibility for any injury to people or property resulting from any ideas, methods, instructions or products referred to in the content. |
© 2026 by the authors. Licensee MDPI, Basel, Switzerland. This article is an open access article distributed under the terms and conditions of the Creative Commons Attribution (CC BY) license.
Share and Cite
Zhang, G.; Huang, Z. LightGBM–SHAP-Based Study of the Threshold and Synergistic Effects of Physical and Perceptual Scene Elements on Spatial Vitality in Historic Cultural Districts. Sustainability 2026, 18, 2778. https://doi.org/10.3390/su18062778
Zhang G, Huang Z. LightGBM–SHAP-Based Study of the Threshold and Synergistic Effects of Physical and Perceptual Scene Elements on Spatial Vitality in Historic Cultural Districts. Sustainability. 2026; 18(6):2778. https://doi.org/10.3390/su18062778
Chicago/Turabian StyleZhang, Gaojie, and Zhongshan Huang. 2026. "LightGBM–SHAP-Based Study of the Threshold and Synergistic Effects of Physical and Perceptual Scene Elements on Spatial Vitality in Historic Cultural Districts" Sustainability 18, no. 6: 2778. https://doi.org/10.3390/su18062778
APA StyleZhang, G., & Huang, Z. (2026). LightGBM–SHAP-Based Study of the Threshold and Synergistic Effects of Physical and Perceptual Scene Elements on Spatial Vitality in Historic Cultural Districts. Sustainability, 18(6), 2778. https://doi.org/10.3390/su18062778