Article

Hydroclimatic Variability and Topographic Mediation of Wetland Resilience in a Semi-Arid Mountain of the Waterberg Mountain Complex


1
Department of Biodiversity, University of Limpopo, Private Bag X1106, Polokwane 0727, South Africa
2
Directorate of Foundational Biodiversity Sciences, South African National Biodiversity Institute, P.O. Box 754, Pretoria 0001, South Africa
3
Centre for Global Change, Department of Plant Production, Soil Science and Agricultural Engineering, University of Limpopo, Private Bag X1106, Polokwane 0727, South Africa
*
Author to whom correspondence should be addressed.
Sustainability 2026, 18(6), 2769; https://doi.org/10.3390/su18062769
Submission received: 22 September 2025 / Revised: 23 December 2025 / Accepted: 28 December 2025 / Published: 12 March 2026

Abstract

Wetlands are vital ecosystems that regulate water, store carbon and support biodiversity, but they are highly vulnerable to climate variability and human pressures. In semi-arid South Africa, montane wetlands remain understudied despite their ecological and socioeconomic importance. The study analyzed 1996–2023 climate variability and vegetation response across the Waterberg Mountain Complex (WMC) using station temperature/precipitation, Rainfall Anomaly Index (RAI), 6-month wet-season Standardized Precipitation Index (SPI) and site-level Normalized Difference Vegetation Index (NDVI) for 11 wetlands. Maximum temperatures increased at all stations, led by Warmbath (0.009 °C/month). No statistically significant changes in minimum temperature were detected. Precipitation trajectories diverged, Mokopane exhibited a statistically significant wetting trend whereas Lephalale and Marken experienced progressive drying. ENSO-driven droughts (2002/2003, 2015/2016 and 2019/2020) intensified hydroclimatic stress and shortened wetland hydroperiods. NDVI trends revealed strong coupling with rainfall variability, with high-altitude wetlands demonstrating greater resilience, while lowland systems declined in greenness. These findings highlight topography as a determinant of wetland vulnerability, positioning upland wetlands as potential climate refugia. Site-specific adaptation and conservation strategies are essential to safeguard ecosystem services and biodiversity, contributing to global sustainability goals (SDGs 6, 13 and 15).

1. Introduction

Wetlands are crucial ecosystems providing numerous ecological services including water filtration, flood mitigation, carbon sequestration and habitat provision for diverse biota [1,2,3]. Wetlands are areas where water covers the soil or is present either at or near the surface of the soil all year or for varying periods of time during the year [4]. These systems sustain over 40% of global biodiversity and underpin the livelihoods of over 1 billion people through fisheries, agriculture and cultural services [5,6]. Despite their critical role, more than 50% of global wetlands have been degraded since the 1900s primarily due to agricultural expansion, urbanization, pollution and resource extraction [7,8]. This degradation has had severe consequences for biodiversity as over 25% of wetland species globally are threatened with extinction. There are especially severe regional declines in sub-Saharan Africa and Southeast Asia driven by habitat loss, pollution and climate change [9].
Climate change is accelerating wetland loss by altering hydrological regimes through shifting precipitation patterns, rising temperatures, more frequent droughts and extreme floods [10]. Semi-arid regions where wetlands act as lifelines during droughts face acute threats with losses exacerbating water scarcity and biodiversity collapse [10,11,12]. For instance, the Okavango Delta wetland has experienced significant reductions in inundation area since 2000, directly linked to climate shifts [13]. While wetlands are threatened by climate change, they also play a vital role in regulating the climate and therefore mitigating impacts on ecosystems [14]. This is because wetlands and climate change are closely interlinked and have a direct impact on each other.
By 2100, rising temperatures could reduce wetland carbon storage by 20%, accelerating greenhouse gas emissions [15,16]. In southern Africa, climate models project a 10–20% decline in annual rainfall by 2050 [17]. The effective mitigation of climate change impacts on wetlands relies on systematic monitoring which will allow conservation managers to implement informed and timely measures to promote ecosystem resilience. For South Africa’s semi-arid landscape, tools like the National Wetland Map (NWM) and the South African Inventory of Inland Aquatic Ecosystems (SAIIAE) track ecosystem health [18,19]. These programs integrate remote sensing (Landsat 8 and Sentinel-2 satellite imagery) and field surveys to assess vegetation dynamics, climate data, water quality and hydrological connectivity [20]. However, inconsistent data resolution, funding gaps and limited ground-truthing in rural areas hinder comprehensive national assessments [21]. For example, the NWM5 revealed that most inland wetlands (70%) had a low confidence ranking for designation of extent and typing because they were not mapped by a wetland specialist and not verified in the field [22]. Despite existing national programs (NWM, SAIIAE), the ecological responses of WMC montane wetlands to long-term climate variability remain unquantified. Furthermore, the South African National Biodiversity Assessment (NBA) reported that inland wetlands are under significant pressure from various impacts with a sixth of wetland fauna and flora now classified as threatened [23].
This study was conducted in the Waterberg Mountain Complex (WMC), which is part of the UNESCO Biosphere Reserve (a protected area of global significance) in Limpopo Province. This location represents a unique high-altitude landscape with numerous wetlands that support both ecological integrity and local livelihoods. However, the wetlands remain understudied with limited data on their ecological condition, hydrological dynamics and vulnerability to environmental change despite their ecological and socioeconomic significance. Escalating threats from mining, urbanization, overgrazing and erratic rainfall (2022 floods reduced wetland vegetation cover by 25%) therefore necessitate urgent research [24]. This knowledge gap hinders effective management, restoration and policy development for the area. Identifying the correlations between climatic drivers and ecological dynamics of wetlands and their impacts is essential for understanding how regional atmospheric patterns influence local hydrological regimes and water quality. Therefore, the objective of this study was to analyze temperature and precipitation trends and their impact on wetland ecosystems using statistical methods. The Standardized Precipitation Index (SPI) and Rainfall Anomaly Index (RAI) were used to quantify spatial and temporal variability in meteorological drought by estimating drought frequency and severity across selected periods. The remotely sensed Normalized Difference Vegetation Index (NDVI) provided an integrative indicator of wetland vegetation response to hydroclimatic drivers, complementing station-based temperature, precipitation, RAI and SPI. In semi-arid savanna wetlands, NDVI has previously captured phenological greening and aging linked to rainfall pulses, hydroperiod and heat stress [25]. This study addressed critical data gaps related to the limited availability of site-specific climate records, insufficient analysis of drought variability and the underrepresentation of montane wetlands in national climate and biodiversity planning frameworks.

2. Materials and Methods

2.1. Study Area and Data Collection

The study focused on wetlands within the Waterberg Mountain Complex (WMC), a semi-arid region in the savanna biome (Bushveld) in the Waterberg district of Limpopo Province in South Africa (Figure 1). Geographically, the WMC is centered approximately at −24.075° S, 28.141667° E. This area was chosen due to its ecological significance, susceptibility to climate variability and being understudied. The topography of the WMC exhibits a diverse range of landforms that significantly influence seasonality and ecological dynamics. The area includes flat plains to gentle and rolling hills from around 800 to 2000 m above sea level [26]. The weather station sites used for climate projections were Mokopane which is located in the rolling hills of the Waterberg district and has an elevation of around 1285 m above sea level. Warmbath (Bela Bela) topography ranged from flat plains to gentle hills reaching up to 1362 m. Lephalale had a relatively flat terrain at approximately 831 m, characterized by undulating areas, and was situated within the Limpopo River Basin, also known for its coal mining activities. Thabazimbi was located at the foothills of the Ysterberg surrounded by the iron-rich Kransberg and Witfonteinrand with varied elevation from 916 to 1581 m. Marken was situated to the north of the Waterberg and featured undulating terrain with moderate elevation of around 1100 m with plains and low hills near the Mokolo River [26]. The climate of the area consists of highly seasonal rainfall, 95% of which occurs between November and March with a mid-season dry spell during significant periods of growth. Winters (May to July) are dry and spring (September) has little to no rainfall (10 mm on average). The mean annual temperature ranged from −6 °C (winter) to 39 °C (summer) [27]. The 11 wetlands in the study were all situated within the WMC across five reserves with an altitude range from 921.7 m to 1433.4 m (Table 1).

2.2. Climate and Remote-Sensing Datasets

This study used ground-based observations (rainfall and temperature) from the South African Weather Services (SAWS) and satellite datasets like Climate Hazards Group InfraRed Precipitation with Station data (CHIRPS) (https://www.chc.ucsb.edu/data/chirps, accessed on 27 June 2024) collected between 1970 and 2023. These parameters were recorded across five stations (Lephalale, Marken, Mokopane, Thabazimbi and Warmbath) and covered the Waterberg Mountain Complex study area. The selected and available stations provide acceptable and uniform meteorological information about the region. The temperature data included daily, monthly and annual mean maximum and minimum temperatures for the period January 1970 through December 2023 and daily rainfall data for the same period. The data was analyzed to identify trends and anomalies in temperature and rainfall patterns over the past few decades. After data verification and filtering, the period 1996–2023 was chosen as a continuous, homogeneous window aligned with the modern satellite era. It captured multiple wet-season cycles and major ENSO extremes for robust SPI/RAI and trend testing. Although shorter than a 30-year normal, it is judged more stable and representative than earlier (1970–1995), inhomogeneous records which can overlap with Landsat imagery data. Field surveys were conducted in November 2022 representing the Early Rains (October–December) and March 2023 representing Late Rains (January–March). NDVI rasters for Early Rains (November) 2014, 2015, 2022 and Late Rains (March) 2014, 2015, 2023 were collected from Landsat 8 with images covering the monitoring points (WMC-01–WMC-11) and processed in QGIS based on SPI dry vs. wet years.

Statistical Analysis

The analysis of effects of climate change on wetlands was carried out using data on the weather conditions (rainfall and temperature) from 1996–2023 to assess the potential effects of climate on wetlands. Temperature trend analysis was carried out using linear regression functions (lm function, stats package in r) to assess the general trend assessment and visualized using ggplot2 (v4.5.1). For precipitation trend analysis, the strength and direction relationship between time and precipitation was studied using Pearson correlation (r) (cor.test, stats package) (R v4.5.1) [28].

2.3. Non-Parametric Trend Tests

Monotonic trends were assessed using the Mann–Kendall (MK) test, a non-parametric, rank-based procedure. The MK statistic evaluated whether later observations were inclined to be larger or smaller than earlier ones; ties were corrected in the variance calculation. Two-sided p-values were obtained from the standardized MK statistic with positive values indicating increasing trends and negative values decreasing trends. Trend magnitude was summarized by Sen’s slope, defined as the median rate of change per unit time across all pairwise point-to-point slopes, reported in native units (mm·yr−1 for rainfall, SPI units·yr−1 for SPI) with confidence intervals derived from the Kendall score distribution. Results were reported as trend direction (increasing/decreasing/no trend), MK p-value, Sen’s slope with 95% confidence interval and the implied total change over the study period for interpretability [29]
Hydroclimatic anomalies were quantified interannually using the Rainfall Anomaly Index (RAI), following the classical van Rooy formulation [30] in which deviations from the long-term mean were scaled by the averages of the 10 wettest and 10 driest years in the reference series (RAI10). The index is dimensionless and enables like-for-like comparison across stations and periods. In the equation Pt denotes the annual precipitation in year t, P ¯ the long-term mean, M the mean of the 10 highest annual totals and m the mean of the 10 lowest annual totals (estimated per station). Positive and negative anomalies are computed as:
RAI t ( + )   =   3 P t P ¯ M P ¯
RAI t ( ) = 3   P t P ¯ P ¯ m
Equations (1) and (2) yields positive values for wet years and negative values for dry years (classification: Supplementary Materials: Table S1).

2.4. Drought Metrics

The Standard Precipitation Index (SPI) was calculated using a 6-month window to assess the drought conditions dataset and was calculated to assess precipitation variability. Southern Africa’s principal wet season spans October–March. A 6-month accumulation (m = 6) therefore integrates the seasonal water input that governs wetlands, baseflow and reservoir levels. The calculation smooths short synoptic swings while remaining sensitive to intraseasonal droughts that strongly affect freshwater ecosystems and water supply. Therefore, seasonal wetness/dryness was quantified with the SPI-6months over the October–March wet season and defined as the standard normal deviate where:
Ζ = Φ 1 H Ρ 6
where P(6) are 6-month precipitation totals, H is the zero-adjusted CDF of a gamma distribution fitted to historical totals by end-month and seasonal SPI-6 is the mean of monthly Z for end-months Oct–Mar of each hydrological year [31,32]. To visualize the data, the relationship between SPI and rainfall diversity was analyzed using Pearson and Spearman correlation coefficients.
The SPI and RAI were interpreted ecologically where negative values indicate dry conditions and wetland stress. Positive values indicate wetter conditions and improved vegetation productivity. The combined use links climatic anomalies to wetland responses.

2.5. NDVI Derivation and Modeling

Next, we analyze temporal trends in vegetation indices for the wetlands to assess ecological responses. NDVI was derived from atmospherically corrected surface reflectance as:
NDVI   =   ρ N I R ρ R e d ρ N I R + ρ R e d
where ρNIR and ρRed are near-infrared and red band reflectances, respectively (bounded in [−1, 1]) [33]. Cloud/shadow pixels were masked prior to compositing. The NDVI spatial analysis was focused on three representative Early Rains and Late Rains periods: 2014, 2015, 2022 and 2023 (latter two representing field site visits). These dates were chosen to capture pronounced wet vs. dry extremes. Site–season NDVI was analyzed using a beta mixed-effects regression with a logit link to accommodate the bounded response and repeated observations within sites. Fixed effects included Season (ER and LR), Year, the Season x Year interaction to evaluate interannual variation within seasons and standardized altitude (km). A random intercept for site modeled within-site dependence. Inference focused on pre-specified contrasts: (i) ER versus LR within the same hydrological year and (ii) pairwise year differences within ER and within LR, with multiplicity controlled by adjustment of p-values. Estimated marginal means on the NDVI scale with 95% confidence intervals were reported together with variance components summarizing spatial heterogeneity. Model diagnostics indicated adequate fit; a sensitivity analysis using a Gaussian mixed model applied to logit-transformed NDVI produced congruent results (classification: Supplementary Materials: Table S2) [34]. Lastly, the relations of NDVI and other wetland indices to annual precipitation variability were examined.

3. Results

3.1. Station-Scale Temperature Trends

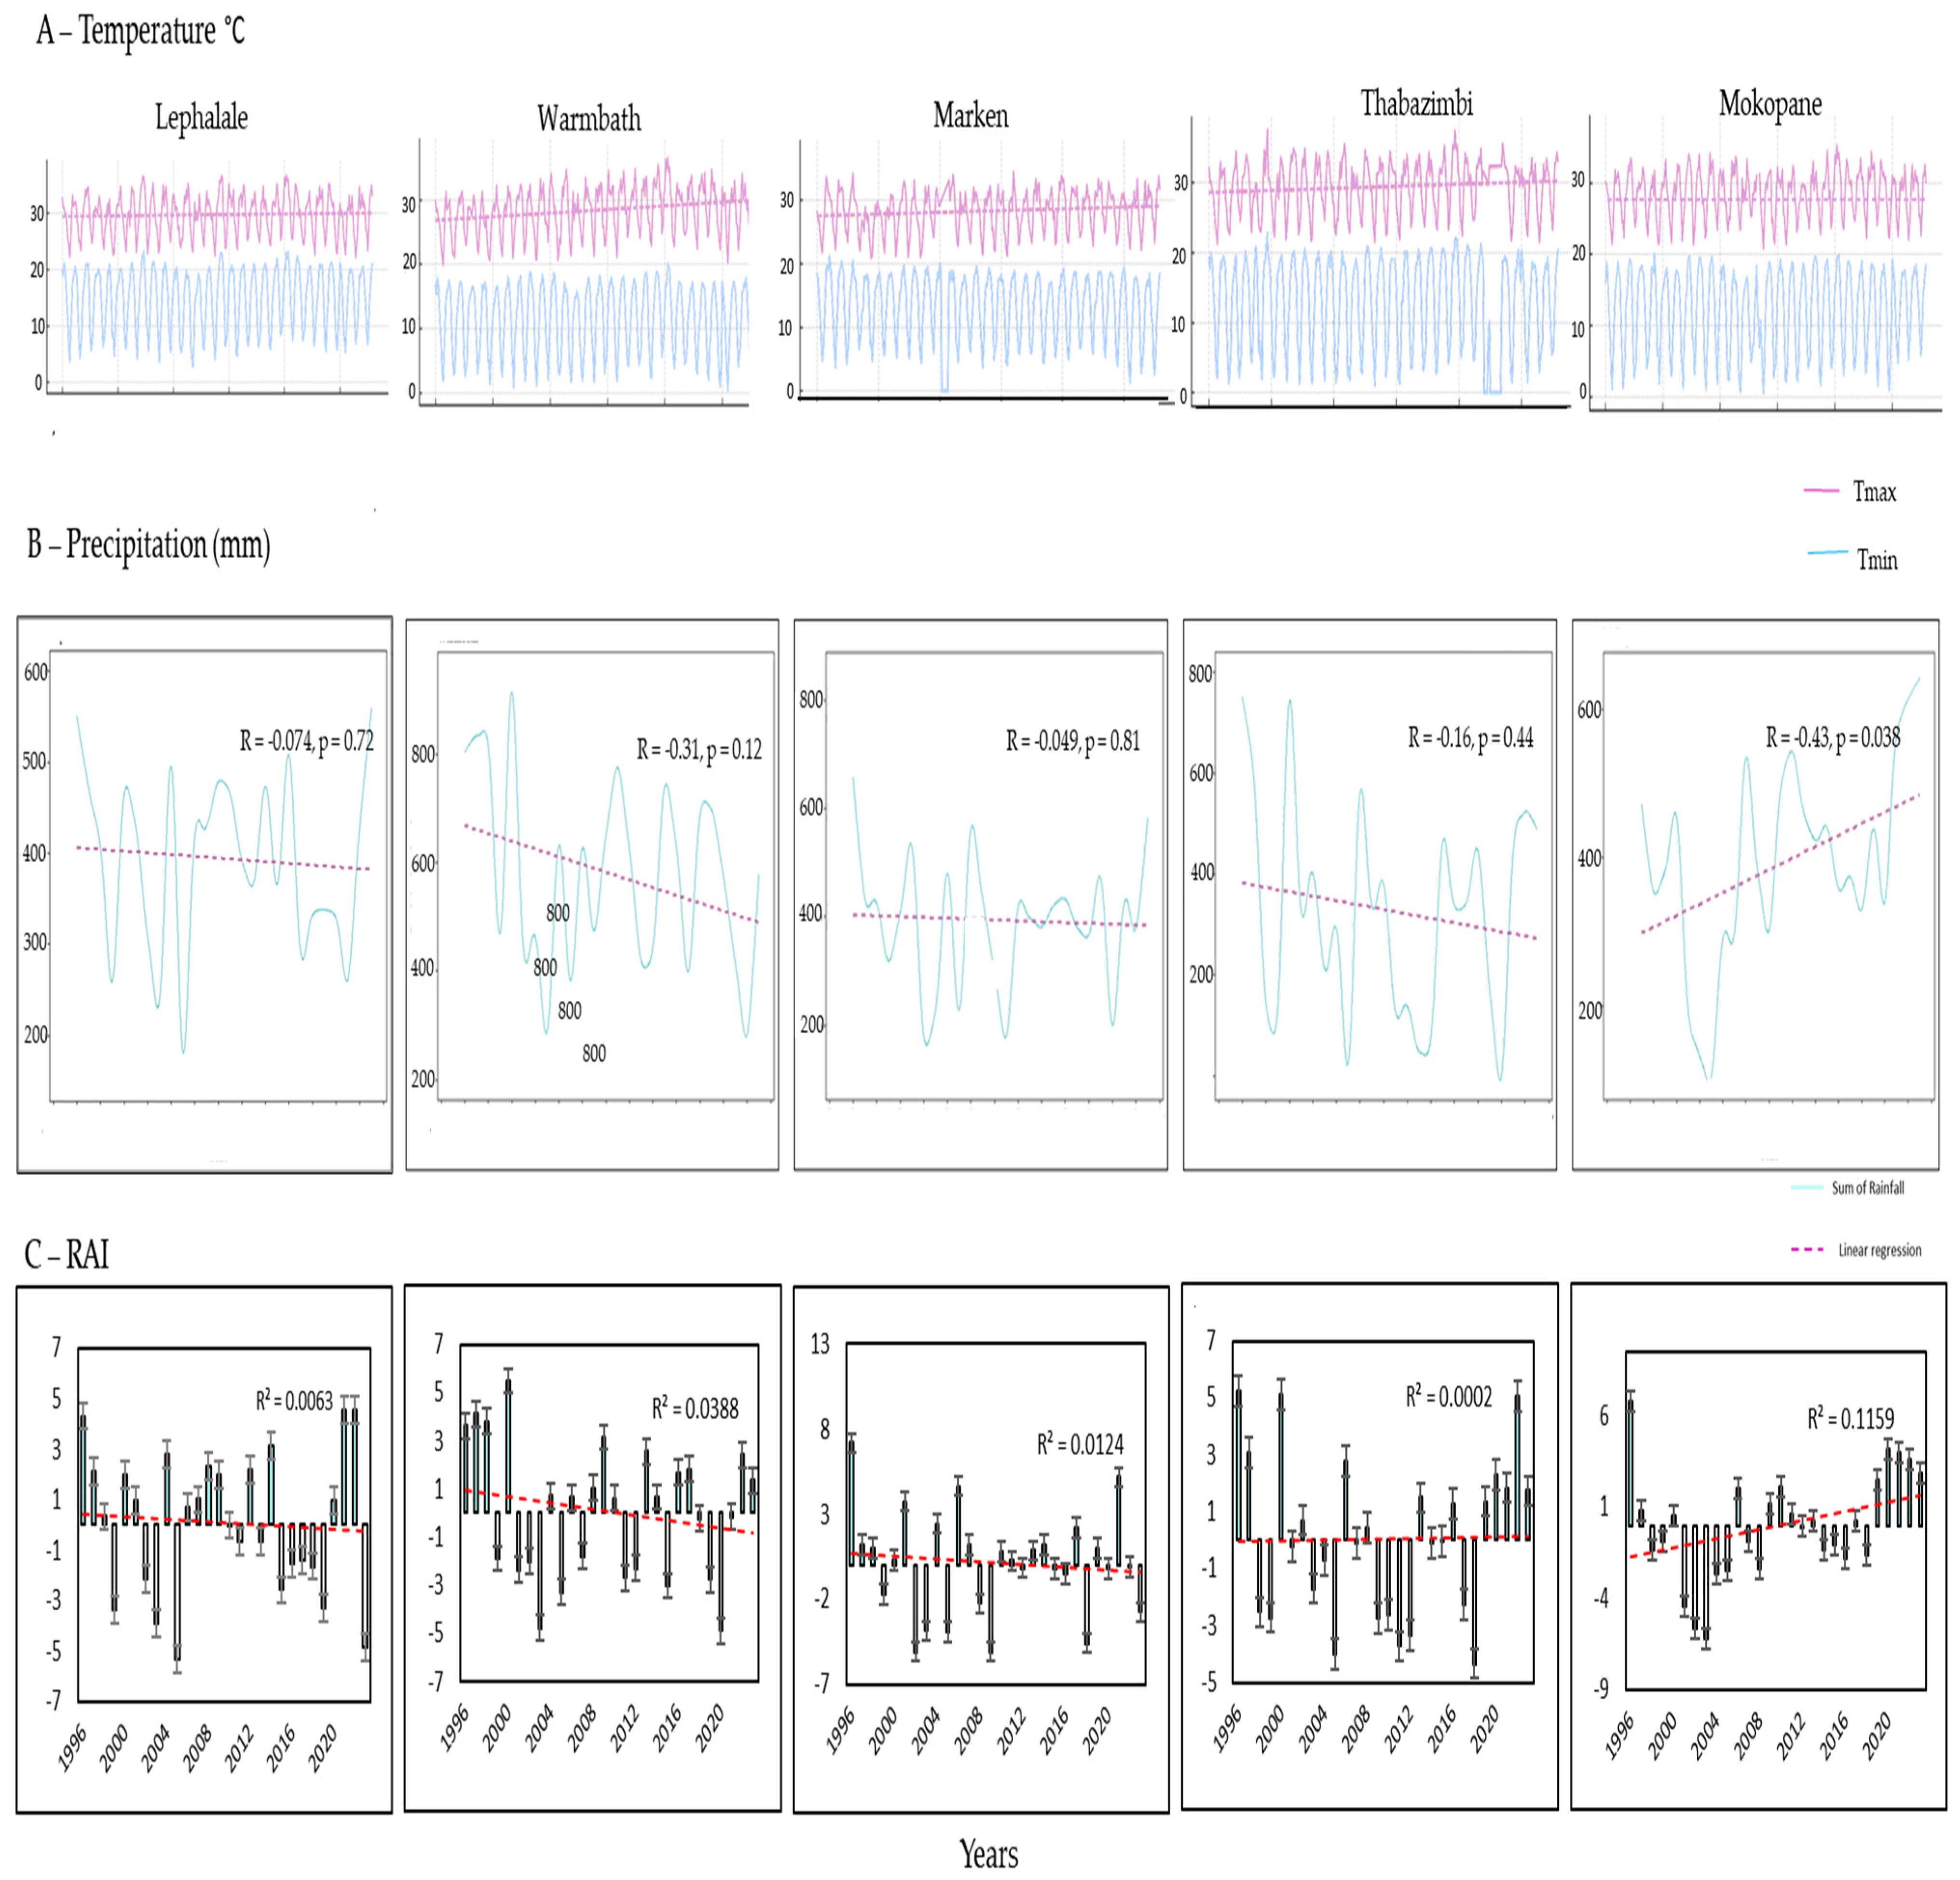
Monthly maximum temperatures (Tmax) increased at all five stations (Figure 2A). Warmbath showed the strongest trend (0.009 °C/month with p < 0.001), followed by Marken with a Tmax of 0.005 °C/month; p = 0.007 and Thabazimbi with 0.004 °C/month; p = 0.083 (Table 2). Mokopane and Lephalale exhibited modest, non-significant increases (0.002 °C/month; p = 0.241 and p = 0.344, respectively). Tmin trends were mixed and non-significant across all sites.

3.2. Interannual Anomalies

Seasonal contrasts between ER and LR months across the 1996–2023 period revealed strong intra-annual variability (Table 3). Thabazimbi cooled from ER to LR with a Tmax of 31.98–25.57 °C and Tmin 18.13–16.90 °C. Lephalale warmed from a Tmax of 28.52–32.30 °C and Tmin 11.09−20.14 °C. Warmbath and Mokopane showed large seasonal Tmin increases from 5.34–15.94 °C and 8.50–17.85 °C, respectively.
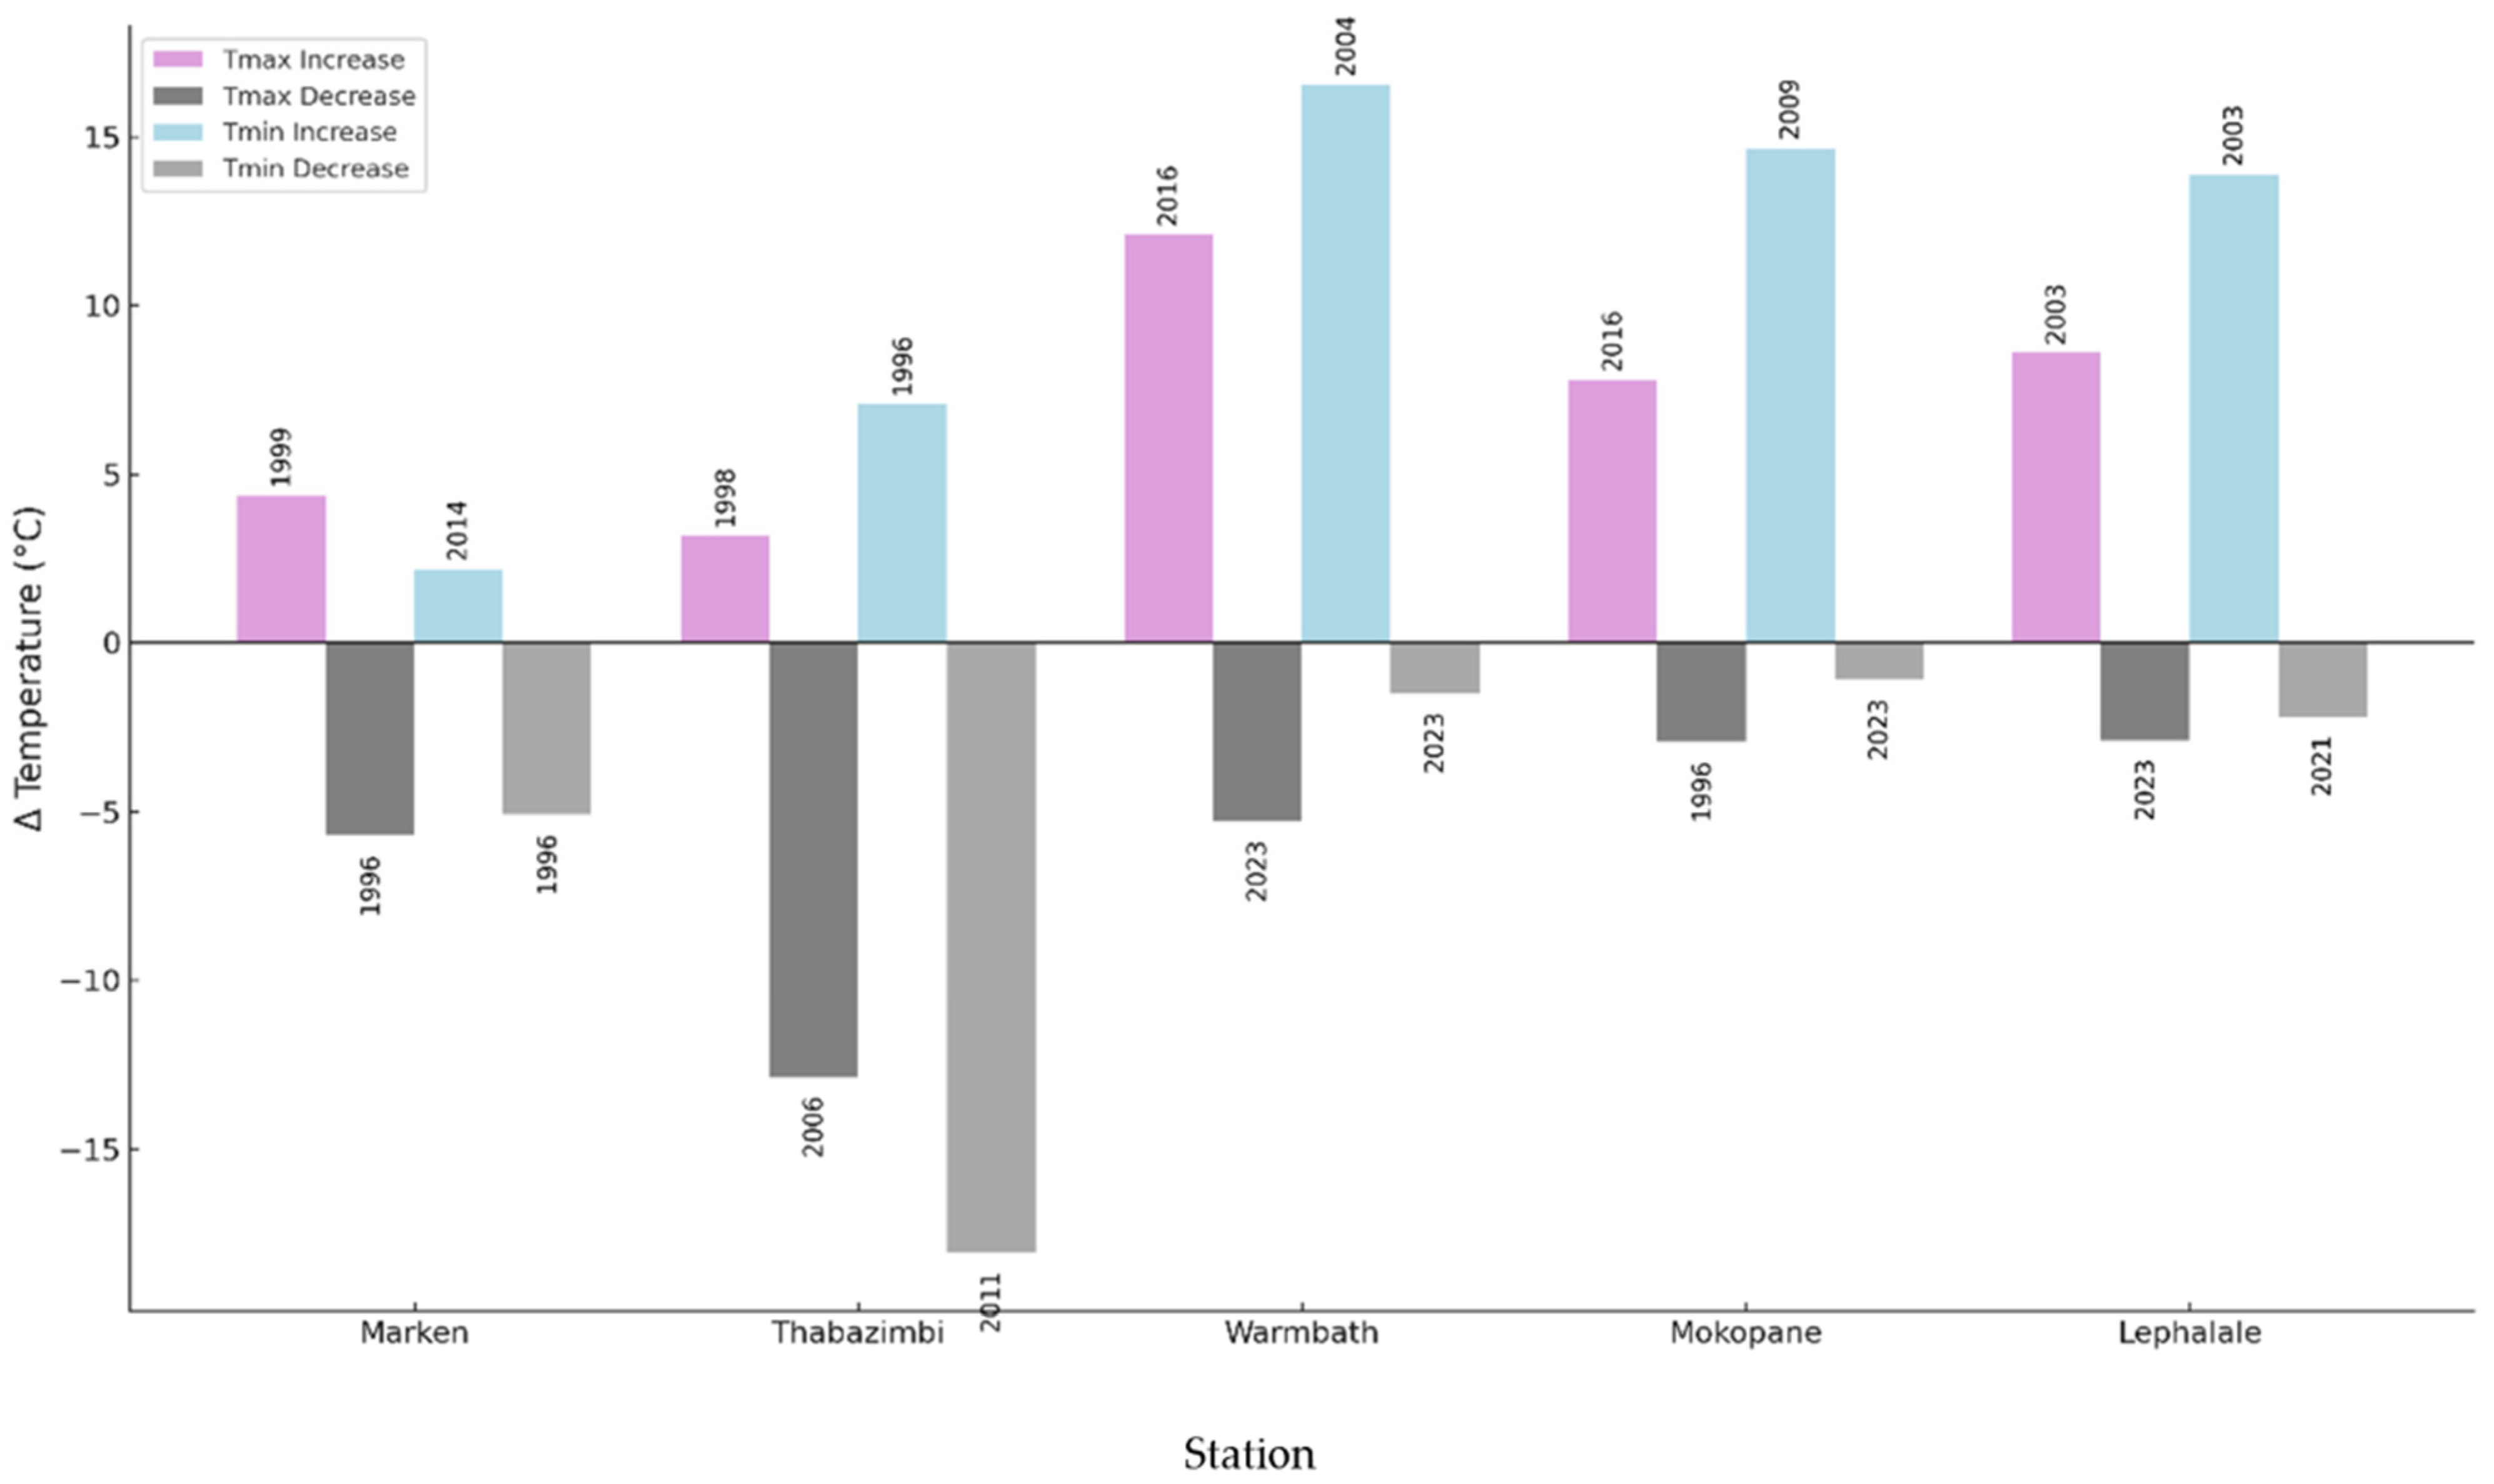
Historical analysis of ER to LR periods further revealed years with exceptional seasonal contrasts (Figure 3). The largest positive shifts in Tmax occurred at Warmbath in 2016 (+12.08 °C), Lephalale in 2003 (+8.59 °C) and Mokopane in 2016 (+7.78 °C). The sharpest Tmax declines occurred at Thabazimbi in 2006 (−12.88 °C) and Marken in 1996 (−5.72 °C). For Tmin, the strongest seasonal warmings were at Warmbath in 2004 (+16.53 °C), Mokopane in 2009 (+14.66 °C) and Lephalale in 2003 (+13.88 °C). The largest Tmin drops were at Thabazimbi in 2011 (−18.06 °C) and Marken in 1996 (−5.08 °C). Notably, 2023 ranked among the coldest seasonal Tmin transitions at three out of the five stations. Warmbath Tmin transition was −1.50 °C, Mokopane −1.10 °C and Lephalale −2.20 °C.

3.3. Precipitation Trajectories by Station

The rainfall time series for annual precipitation data in Thabazimbi from 1996 to 2023 indicated a significant interannual variability, with peaks observed in the late 1990s and early 2000s followed by a decline (Figure 2B). A downward trend was indicated by the dashed regression line, though the correlation coefficient was R = −0.16, suggesting a weak negative trend that is not statistically significant, p = 0.44. For Warmbath, the precipitation trend had fluctuations similar to Thabazimbi with an overall negative trend of R = −0.31 that was also not statistically significant (p = 0.12).
The Lephalale and Marken regions had highly variable annual precipitation with no significant variations in rainfall trends. Lephalale indicated a weak negative correlation, where R = −0.074 (p = 0.72), indicating an almost negligible downward trend, while Marken had an even weaker correlation with R = −0.049 (p = 0.81). Mokopane displayed a statistically significant increasing precipitation trend with R = 0.43 and p = 0.038.

3.4. Rainfall Anomaly Index (RAI) Patterns

The Rainfall Anomaly Index (RAI) revealed pronounced hydroclimatic extremes across the WMC over 1996–2023 (Figure 2). Just as with the rainfall time series, extremely wet years clustered in the late 1990s and again around 2020–2022. Station-specific peaks at Lephalale in 1996, 2014, 2021 and 2022, Mokopane (1996, 2020–2022), Marken (1996, 2000, 2002, 2005–2007, 2020), Thabazimbi (1996, 1998, 2000, 2006, 2021) and Warmbath (1996, 1998, 2000, 2005, 2019) were observed. Extremely dry years were widespread from 1999–2005 and 2015–2020, including Lephalale in 1999, 2003, 2005, 2019 and 2023 and Mokopane in 1999, 2002, 2004 and 2008. Marken experienced extremely dry conditions in the years 2003, 2005, 2015 and 2020, Thabazimbi in 2003, 2005, 2015 and 2020 and Warmbath in 2003, 2005, 2015 and 2020 (detailed RAI in Supplementary Tables S3 and S4).

3.5. SPI-6 Spatial Gradients and ENSO-Linked Drought

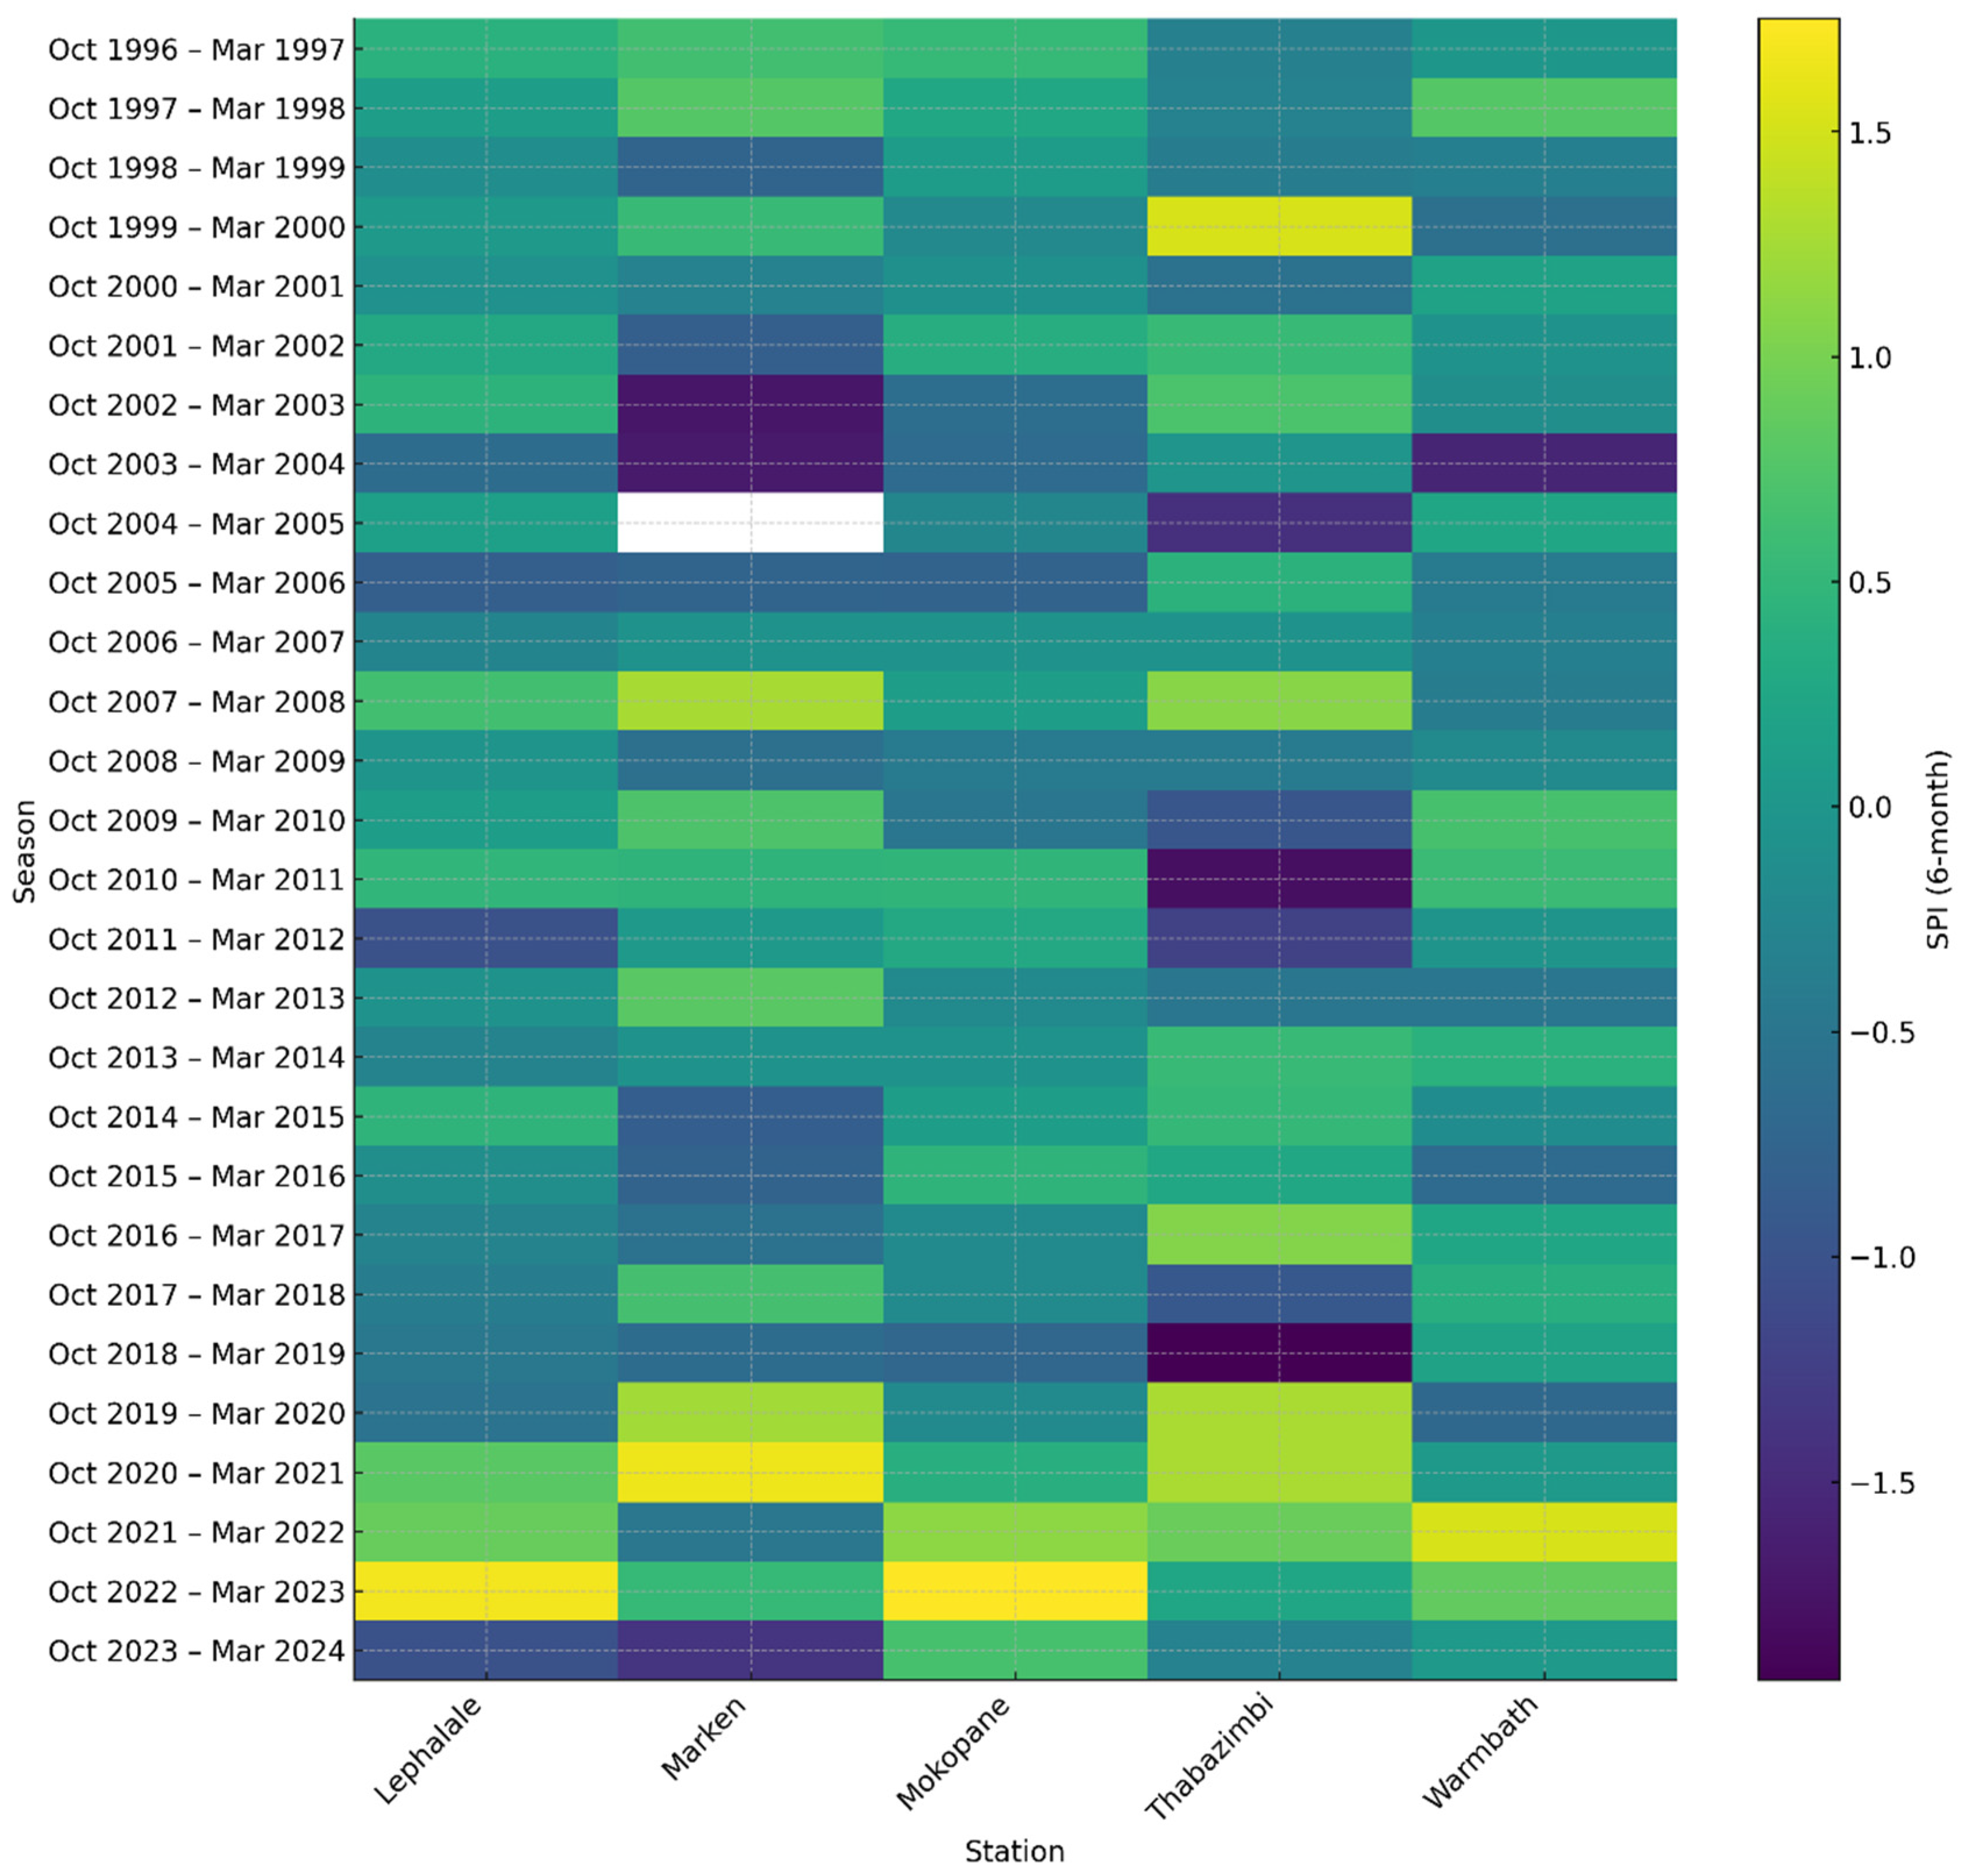
The Oct–Mar SPI heat map showed strong interannual coherence across stations with shared anomaly signs but clear spatial gradients in magnitude. Region-wide drought was evident in 2002/2003, 2015/2016 and 2019/2020. In 2002/2003 (strong El Niño influence), all stations were negative but mostly Lephalale and Thabazimbi with SPI of −1.5 to −2.5. Warmbath was moderately dry (−1.0 to −1.5) and Mokopane/Marken were the least dry (−0.5 to −1.0). The 2015/2016 pattern was similar to RAI because Lephalale and Warmbath were experiencing moderate to severe drought (−1.5 to −2.0), Thabazimbi was near that range and Mokopane/Marken were mildly to moderately dry (−0.5 to −1.0). In 2019/2020, deficits re-emerge and again are strongest at Lephalale and Thabazimbi (−1.5) with Warmbath negative but smaller in magnitude and Mokopane/Marken closer to −0.5 to −1.0. Wet seasons and recovery were most apparent in 2014/2015 and 2021/2022. In 2014/2015, SPI was predominantly positive (+0.5 to +1.5) across the region, largest at Mokopane and Marken with Warmbath and sometimes Thabazimbi near normal to slightly wet. During the 2021/2022 season, broad wetness persisted (+1.0 at Mokopane/Marken) while Warmbath and Thabazimbi were positive but of lower amplitude. Lephalale returned from near-normal to moderately wet conditions. The station topography and exposure coincide because Mokopane and Marken showed dampened drought and enhanced wet responses while Warmbath/Thabazimbi exhibit larger drought excursions. Lephalale recorded the largest negative departures in drought years, consistent with rain-shadow effects, faster drainage and higher evaporative demand (Figure 4).

3.6. NDVI Spatio-Temporal Variability

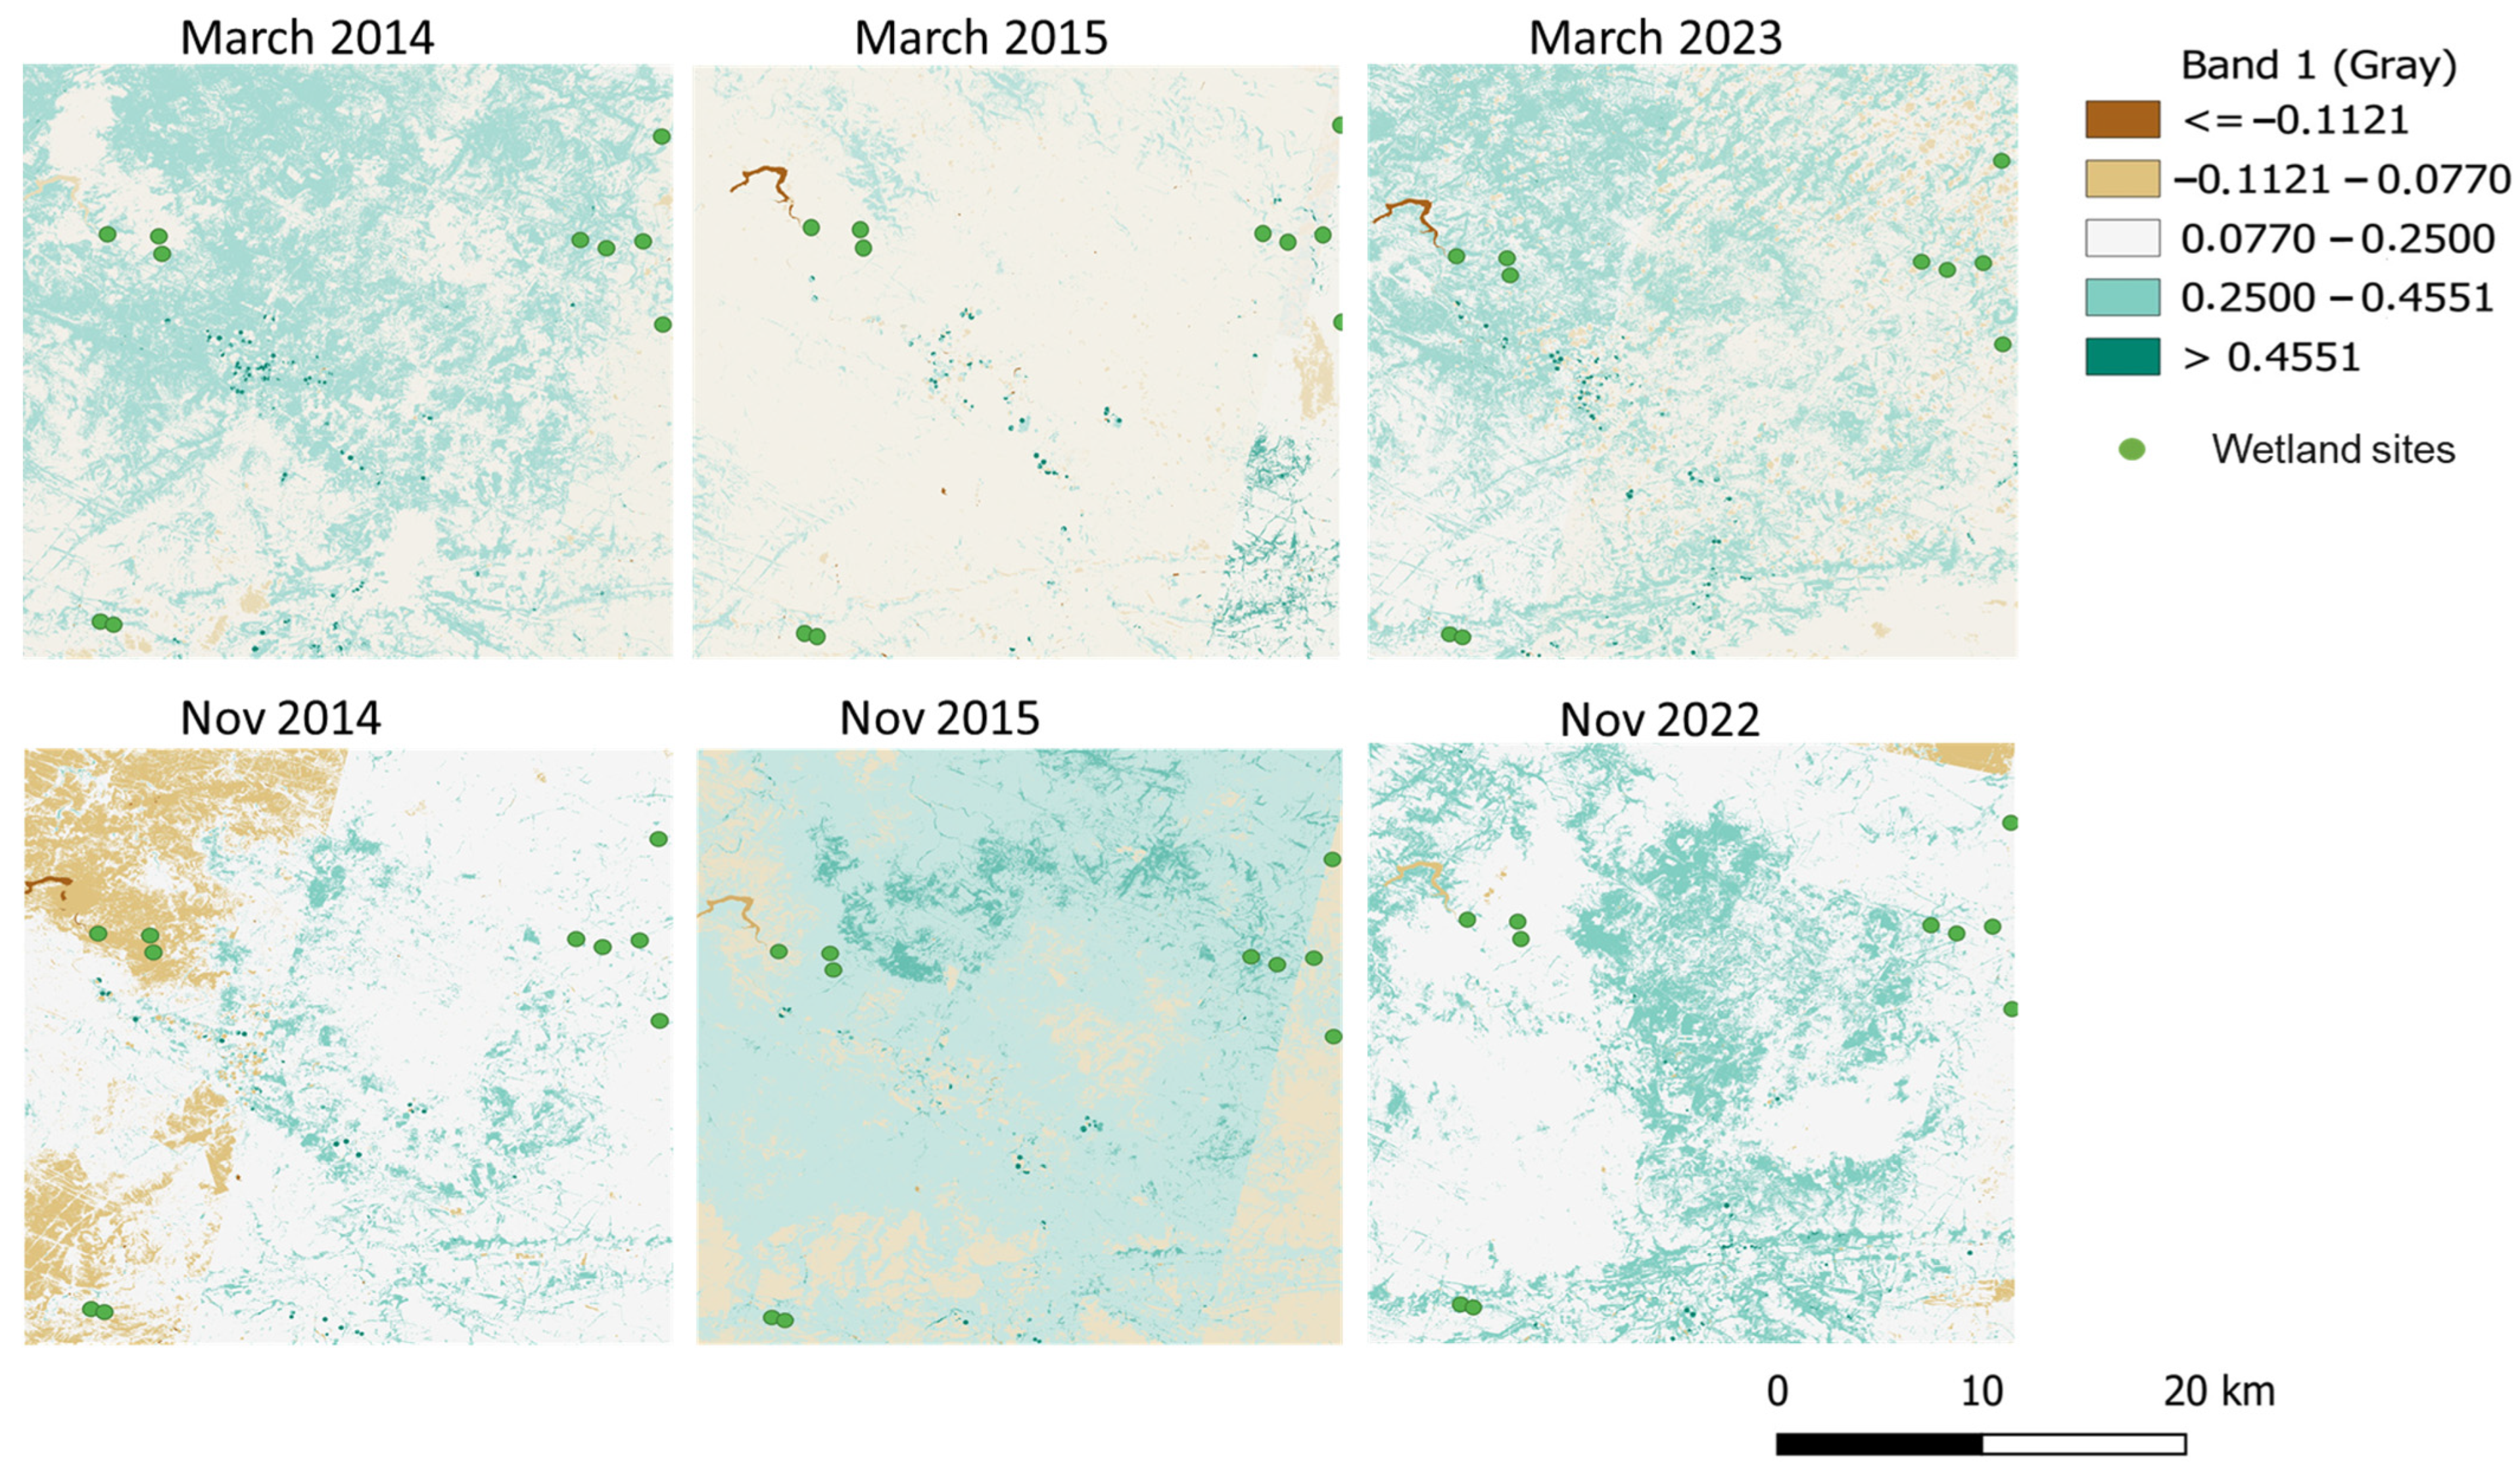
Across the WMC wetlands, NDVI showed marked LR-ER seasonality (Figure 5) with clear spatial structure relative to weather stations. In March 2014, intermediate values (0.0770–0.4551) dominated, especially across the central-eastern corridor from Warmbath through Mokopane and towards Thabazimbi. By March 2015 the few high-NDVI patches (>0.4551) were confined to localized woodland fragments. Much of the landscape then shifted to low–very low classes (≤0.0770), and by March 2023 intermediate NDVI again prevailed but with greater heterogeneity. Alternating bands of moderate and low values were observed around Marken and toward Mokopane, with persistently low NDVI in the western sector toward Lephalale resulting in high-NDVI patches (>0.4551) remaining scarce. In November 2014, moderate NDVI (0.0770–0.2500) was widespread, giving way to substantial areas in the higher range (0.2500–0.4551) by November 2015. Thereafter, ER conditions broadly shifted toward low (−0.1121 to −0.0770) and very low (−0.1121) classes with only sparse higher values (>0.2500). By November 2022 the distribution was more mixed and sizeable, and low-NDVI zones (−0.1121 to −0.0770) persisted and were most evident westward toward Lephalale. The region, including areas around Warmbath, Mokopane, Marken and parts of Thabazimbi, fell within moderate (0.0770–0.2500) to higher (0.2500–0.4551) classes and very high NDVI (>0.4551) remained rare. Overall, 2015 exhibited the lowest greenness across seasons, while 2023 indicated partial recovery with increased spatial patchiness, and woodland areas, particularly near the Thabazimbi and Mokopane uplands, consistently registered the highest NDVI.

3.7. Coupled Climate–Vegetation Responses

The trends in precipitation across different locations in the WMC revealed heterogeneous responses to climate variability as determined using the Mann–Kendall test, Sen’s slope, Pearson correlation, SPI and NDVI (Table 4). Marken and Lephalale showed significant decreasing precipitation trends indicative of potential progressive drying conditions. At Marken, the Mann–Kendall p-value was 0.04 with a Sen’s slope of −4.12 mm·yr−1, while Lephalale exhibited p = 0.03 with a Sen’s slope of −2.54 mm·yr−1. Both sites also had moderate negative Pearson correlations of r = −0.38 and p = 0.05 for Marken while for Lephalale r = −0.41 and p = 0.03. SPI analysis validated these patterns with a p ≤ 0.05. Correspondingly, NDVI declined at both sites, most prominently in LR at Marken, while at Lephalale NDVI decreased consistently across both ER and LR seasons. Despite this, the NDVI precipitation coupling was moderate (Marken r = 0.41, p = 0.08; Lephalale r = 0.49, p = 0.04), reinforcing that vegetation greenness tracked rainfall variability at these sites. Mokopane exhibited a significantly increasing precipitation trend: the Mann–Kendall was p = 0.03 with Sen’s slope = +3.76 mm·yr−1, alongside a strong positive Pearson correlation of r = 0.45 and p = 0.02. SPI values confirmed this trajectory with p = 0.03. NDVI mirrored this response, showing significant increases during both ER and LR, with a robust NDVI–precipitation correlation (r = 0.53, p = 0.01), highlighting strong vegetation and climate coupling. By contrast, Thabazimbi and Warmbath displayed no significant precipitation trends.

3.8. Altitude Effects on Vegetation Greenness

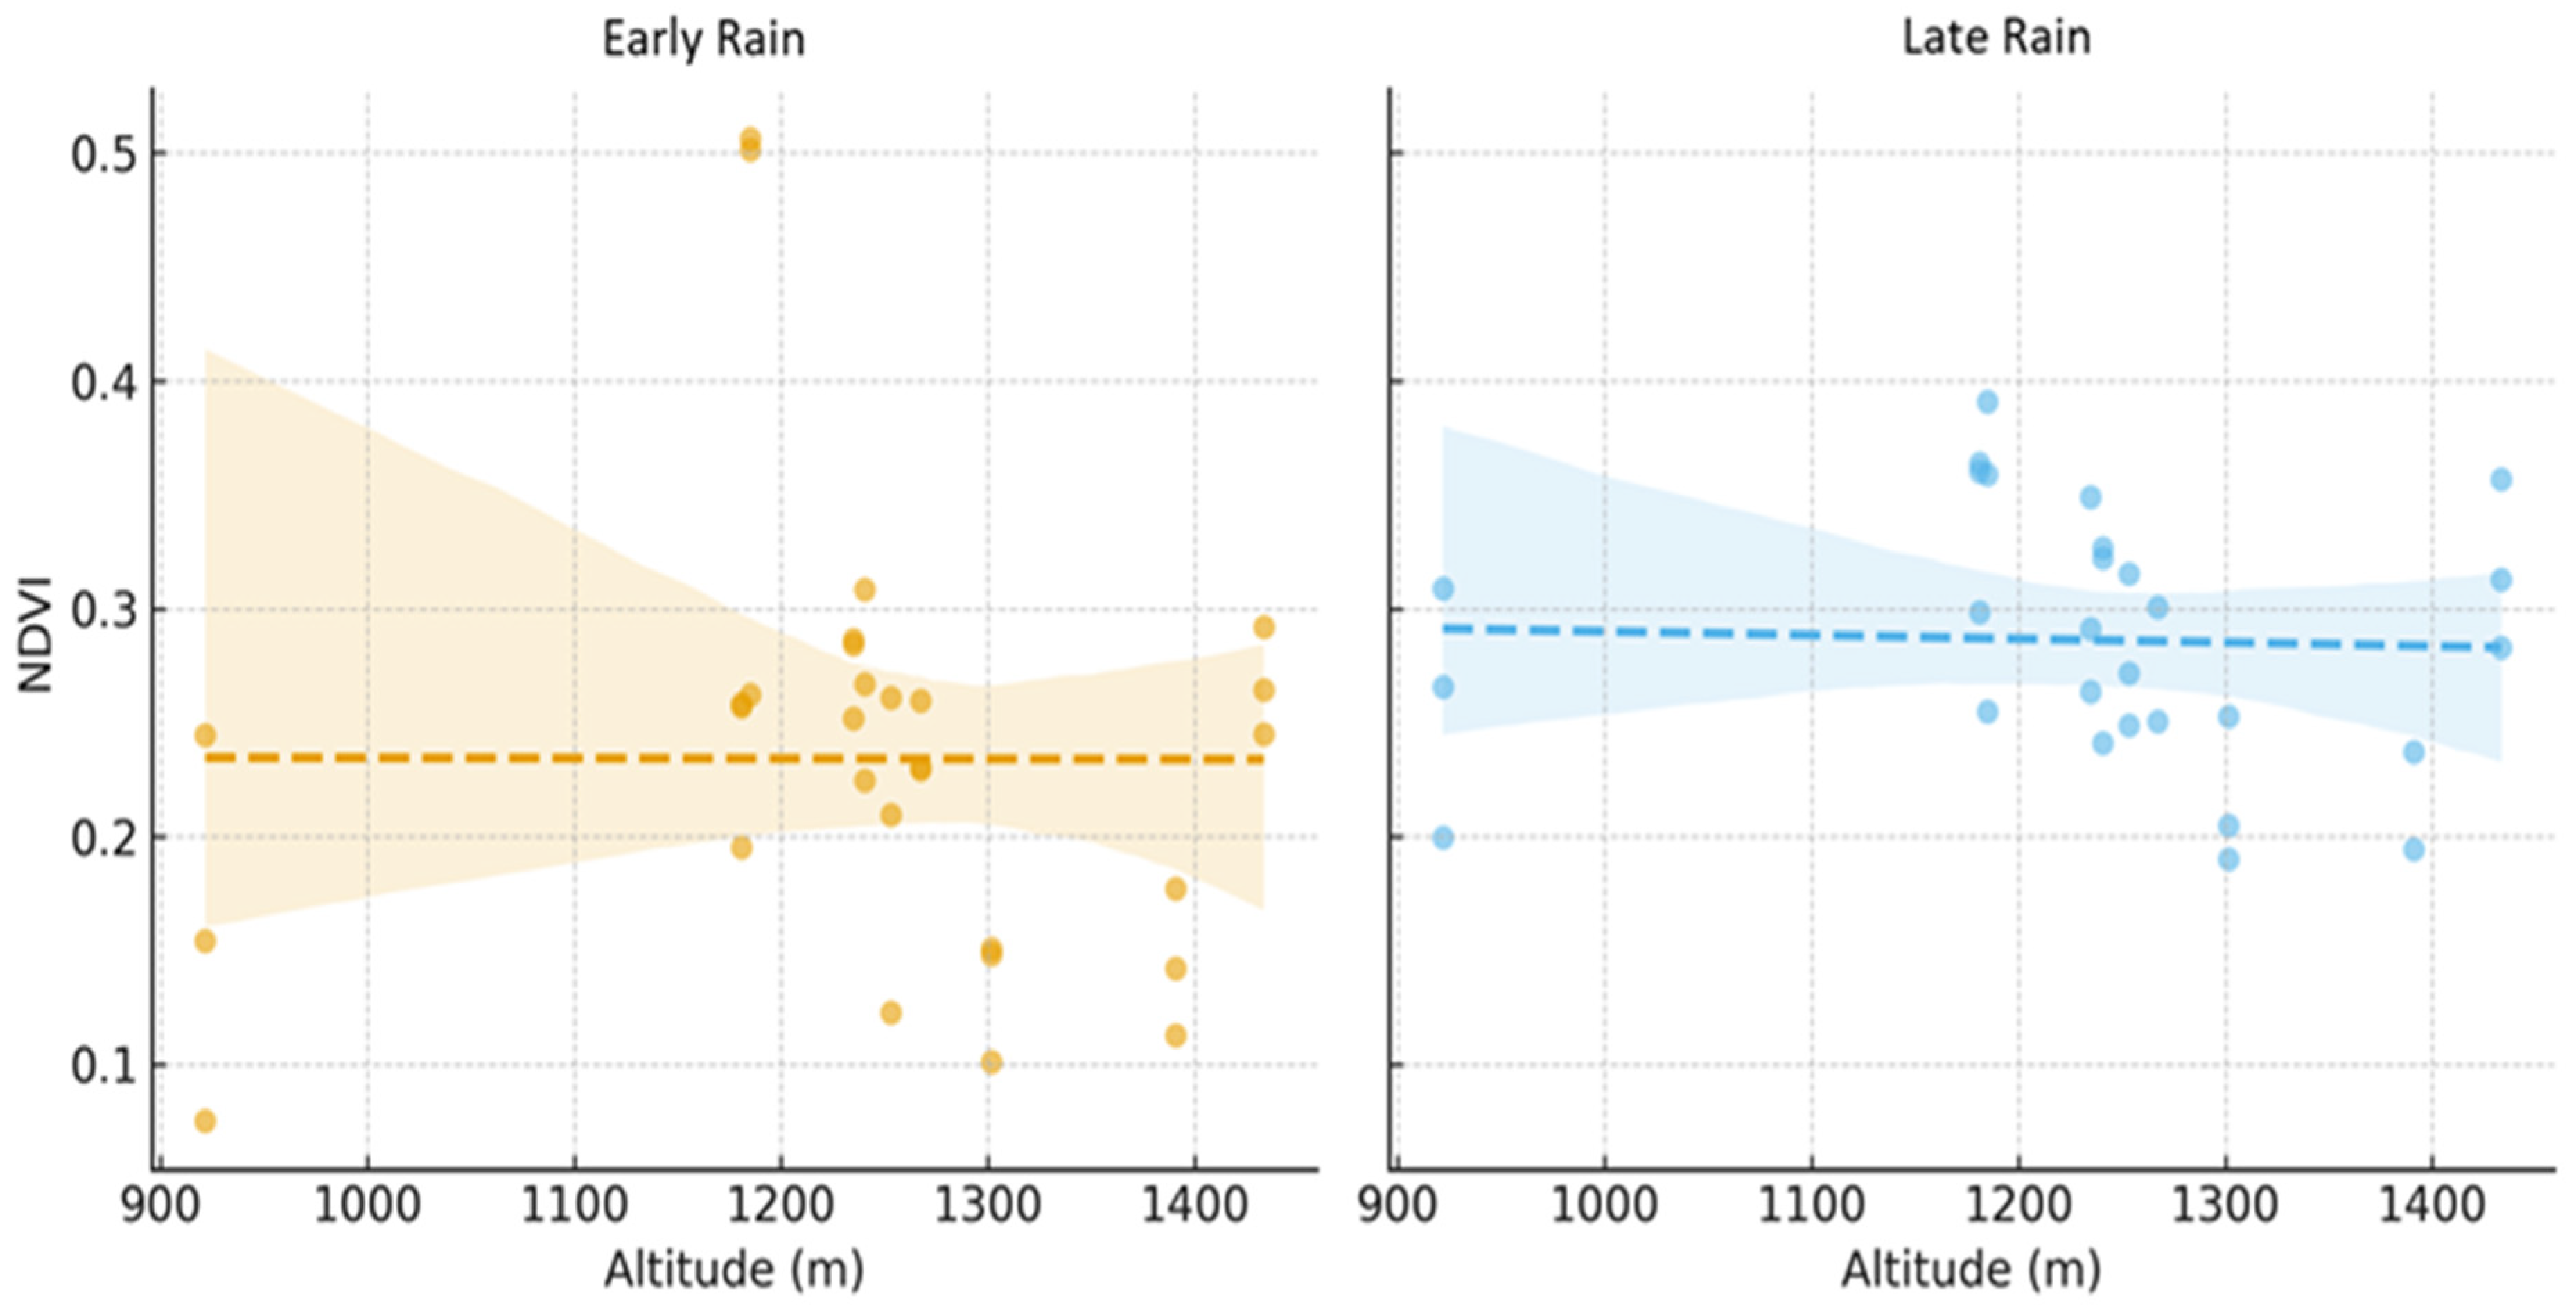
The relationship between altitude and NDVI varied between seasons (Figure 6). The NDVI exhibited a minor negative correlation with elevation during the early wet season with β = −0.0006, SE = 0.0003, z = −2.11 and p = 0.035, suggesting that the vegetation is slightly less green at higher elevations. On the other hand, the NDVI showed a slightly non-significant upward trend with altitude during the late rainy season with β = 0.0004, SE = 0.0002, z = 1.92 and p = 0.056. Seasonal differences in mean NDVI values were also observed with ER having lower overall values of 0.24 and p = 0.06 than those of LR of 0.28 and p = 0.07. These findings may imply that elevation also influences seasonal vegetation productivity in Waterberg wetlands, with higher-altitude wetland sites sustaining productivity in LR and lower-altitude wetlands performing comparatively better during ER.

4. Discussion

Topography appeared to modulate the warming signal across the Waterberg Mountain Complex, shaping both seasonal amplitude and thermal persistence in associated wetlands [35]. Higher-altitude stations like Marken and Thabazimbi exhibited pronounced seasonal variability with more thermally buffered conditions overall, consistent with elevation-driven nocturnal cooling and enhanced atmospheric mixing [36,37,38]. Wetlands such as Kaingo (WMC-01 to WMC-04) and Leobo (WMC-09) therefore experienced a wider range of temperatures but often retained cooler night-time conditions that can support ecological resilience. This pattern was seen in Fitchett et al. [39], who reported that higher-altitude wetlands in South Africa could maintain greater hydrological and thermal stability under climate stress.
In contrast to higher-altitude regions, lower-elevation areas (Lephalale) showed greater thermal persistence and heat accumulation, indicative of reduced nocturnal cooling and shallower diurnal ranges [40,41,42]. Wetlands in these settings tend to be more vulnerable to sustained warming, with implications for evapotranspiration, water balance and habitat suitability for temperature-sensitive taxa [10]. These inferences are congruent with satellite-based analyses on wetlands in the Arctic, which show that wetlands are becoming increasingly susceptible to thermal extremes and drying [43].
Mid-elevation sites (Mokopane and Warmbath) displayed mixed profiles and potential warming signals superimposed on interannual variability, suggesting that moderate elevation does not fully buffer thermal loading under recent climate variability [41]. Collectively, the patterns indicate that elevation mediates both the magnitude and expression of warming across the WMC, with consequent differences in wetland resilience pathways that are contingent on local topography and microclimate. Interestingly, although Warmbath hosts geothermal springs, their effects are highly localized and do not affect regional air temperatures; observed warming reflects regional climatic drivers [44]. Therefore, the hydrothermal system probably fluctuated with drought and recharge during these years [45] but Warmbath’s large Tmax/Tmin anomalies (2004 and 2016) could be attributed to synoptic-scale heatwaves and ENSO forcing rather than geothermal heating [46]. These warming periods were followed by smaller decreases in Tmax in Mokopane and Tmin in Warmbath by 2023, suggesting potential thermal instability [47]. Wetlands in these mid-elevations areas such as Lindani (WMC-05 to WMC-07) and Syringa (WMC-10, WMC-11) are likely to experience seasonal warming pulses that could disproportionately affect wetland systems, which are more thermally exposed [39]. These observations align with a study by Pabón-Caicedo et al. [48] on wetlands at varying altitudes which highlighted the vulnerability of wetlands at varying altitudes to warming-related ecological stress. Overall, the observed Tmax and Tmin changes across all stations reflected a region-wide but uneven warming pattern with topography shaping the direction and magnitude of temperature shifts at different stations [49]. While higher elevations show more extreme but transient fluctuations, lower altitudes exhibit more consistent warming, particularly in Tmin [50].
Warming patterns driven by topography can have direct and significant impacts on wetlands including their ecological structure and functioning. In the high-altitude areas of the WMC, cooler nights and seasonal cold spells help wetlands retain moisture through slowing evaporation and preserving water tables, thereby sustaining plant species that need cooler temperatures [51]. Wetlands in elevated zones, such as those in Kaingo, benefit from this buffering and therefore could serve as climate refugia. In contrast, low-elevation wetlands are at risk and more vulnerable to water loss due to higher temperatures which increase evaporation and transpiration rates [52]. Warmer temperatures can also lower water levels and even cause wetlands to dry seasonally or permanently [35] plus cause hydrological stress especially when compounded by inconsistent rainfall patterns. For example, rising temperatures and drought in semi-arid savanna rivers may drive thermophilization in freshwater macroinvertebrate communities, favoring heat-tolerant, generalist taxa while reducing cold-adapted specialists. This could lead to functional simplification and taxonomic homogenization, with potential long-term impacts on ecosystem resilience and trophic structure. Although not yet demonstrated locally, such outcomes are increasingly observed in analogous systems globally [40,53,54]. Hydrogeomorphic setting reinforced the climatic imprint. Upland catchments typically had shorter flow paths and more frequent orographic storms, which together promote episodic recharge and longer late-season moisture retention. Wetlands there remained more resilient, with shorter dry phases after drought and greater greening in wet years. Lowland/leeward settings combined efficient runoff and fast drainage with higher net radiation and advective heating, accelerating soil-moisture drawdown and shortening wetland hydroperiods during El-Niño-linked shortfalls. Consequently, SPI negative departures are amplified in west lowlands, while positive departures are largest in windward uplands, an internally consistent hydroclimatic–ecological narrative aligning SPI, MK/Sen slopes and NDVI responses across the WMC
One major immediate concern with a warming climate is the heightened risk of wetland desiccation because many wetlands are becoming drier under climate change globally [10]. The observed trend, especially the rising minimum temperature in lower elevation areas, means less night-time relief for wetlands, keeping evaporation running even overnight. In the Arctic, for example, permafrost melt is draining wetlands and increasing drought exposure [43,54]. In the WMC, while permafrost is not a factor the principle is similar as prolonged warmth and sporadic rainfall can convert perennial wetlands into seasonal wetlands. This drying not only shrinks habitat for wetland-dependent species but can lead to more frequent fires in peaty areas and the collapse of ecosystem services (water filtration and flood buffering) [1]. In summary, the uneven warming across the WMC is intense and sustained in the lowlands, extreme yet intermittent in the highlands and could reshape wetland hydrology and ecological functioning. Higher-altitude wetlands may fare better (retaining a degree of stability), whereas lower-altitude wetlands face a “new normal” of long-lasting heat and drying demanding adaptive management to protect these sensitive ecosystems under future climate conditions.
Rainfall across the Waterberg Mountain Complex exhibited marked spatial and interannual variability shaped by elevation and terrain controls. Orographic lifting, rain-shadow effects, and localized convection provide a coherent framework for the observed station contrasts [55]. These mechanisms offer plausible explanations for the spatial rainfall disparities observed in the study. Highland areas (Thabazimbi) showed relatively stable RAI and annual totals over time, consistent with the buffering influence of persistent orographic uplift and more predictable condensation/precipitation cycles [50]. This aligns with findings by Grab and Knight [39], who observed that South African highland areas tend to exhibit buffered hydroclimatic responses due to persistent orographic influence.
By contrast, in low-lying leeward settings (Lephalale), rainfall variability was dominated by a drying trajectory and recurrent drought signals. This is consistent with rain-shadow subsidence and enhanced warming-driven evapotranspiration, reducing effective moisture and wetland recharge [56]. The greater warming observed at lower altitudes (as shown in the temperature analysis) likely exacerbates this drying through enhanced evapotranspiration and reduced soil moisture retention [41]. These combined climatic stressors likely diminish the frequency and intensity of effective rainfall, reducing water availability for wetland recharge in these zones.
Mid-elevation zones revealed mixed behavior: Warmbath showed high variability without a clear long-term trend, plausibly reflecting intermittent convective storm influence and limited orographic stabilization [55]. However, the lack of sustained orographic uplift compared to Thabazimbi might explain the absence of a stabilizing effect. Similarly, Marken, which is also in a moderate elevation zone, experienced a statistically significant decrease in rainfall, highlighting that topography alone does not guarantee rainfall stability [57]. The interplay of elevation, slope orientation and regional air mass circulation likely defined local precipitation regimes [58]. A study by Murungweni et al. [59] in the nearby Nylsvley floodplain similarly found rainfall variability at stations within short distances of each other, emphasizing how subtle topographic differences can drive spatial heterogeneity in rainfall. By contrast, Mokopane presented a sustained wetting signal and the most positive RAI among stations, consistent with its position near a transitional climatic boundary and potential enhancement by converging moist air masses and intensifying convective systems; positive SPI during wetter phases supports this interpretation [59]. Collectively, these patterns indicate that topography mediates both the direction and magnitude of rainfall change across the complex, with leeward lowlands more vulnerable to moisture deficits and uplands comparatively buffered, while mid-elevation responses depend on local terrain–circulation interactions.
The SPI heat map indicates that region-wide droughts coincided with major ENSO phases, but severity varied systematically across the complex. The deepest deficits repeatedly occurred at leeward, low-lying Lephalale and at Thabazimbi, whereas Warmbath tended to be negative but less intense. Mokopane and Marken were comparatively milder in the same seasons. Conversely, pluvial periods were most evident during the mid-2010s and the post-2020 recovery, with the strongest positive departures concentrated in the higher, windward uplands of Mokopane and Marken. This west lowland to east upland gradient is consistent with orographic moisture enhancement and lower evaporative demand at elevated, windward sites. Unlike the greater exposure to heat loads, faster drainage and limited orographic input occur in leeward lowlands [58]. Accordingly, the heat-map evidence refines earlier summaries of uniform regional drought by demonstrating that the late-2010s event was coherent in timing but spatially heterogeneous in magnitude, with the most severe anomalies focused on the leeward lowlands and more moderate deficits or partial buffering at upland stations.
The observed climatic shifts across the WMC over the past decade are already translating into tangible ecological changes within its wetland systems. Climate-induced variability is altering hydroperiods, disrupting the seasonal wetting and drying cycles that define wetland structure and functioning [26]. In sites such as Kaingo (WMC-01–WMC-04) and Leobo (WMC-09), both located at elevations exceeding 1200 m, formerly stable wetlands are experiencing more frequent drying episodes. These wetlands traditionally maintained baseflow contributions from shallow aquifers but now reduced recharge and episodic droughts, especially during ENSO years (2002, 2015/2016, 2020), are lengthening dry phases [60]. For instance, WMC-03 at Kaingo, situated at a lower local elevation (921.7 m), may now transition into a terrestrial state during drought years, reducing its ability to support aquatic life. Conversely, in Lindani (WMC-05–WMC-07) near Mokopane, where rainfall has shown a statistically significant increase, wetlands are potentially receiving prolonged wet phases. This may allow formerly seasonal wetlands such as WMC-07 to retain water year-round, modifying ecological rhythms and potentially favoring more permanent aquatic communities [61]. However, such extended inundation can also disrupt adapted dry–wet cycles, affecting species timing and nutrient cycling.
Across the WMC, precipitation trends translated into site-specific NDVI responses that were further controlled by elevation [62]. Sites within the Marken and Lephalale area like WMC-01, WMC-02 and the southern Thabazimbi areas WMC-10 and WMC-11 showed drying with MK of p ≤ 0.04 and associated NDVI reductions especially in the LR season. By contrast, the wetter trajectory at Mokopane coincided with constant greening at higher-elevation sites such as WMC-09 consistent with positive NDVI–precipitation coupling and the tendency for greenness to follow rainfall pulses with short seasonal lags in southern African savannas [63]. These patterns are congruent with regional evidence that NDVI covaries with rainfall, exhibits month-scale response times and that interannual greening/browning signals are largely moisture-driven in semi-arid systems [64]. Elevation appeared to shape how strongly this climatic forcing is expressed. From the data, ER NDVI declined slightly with altitude whereas LR NDVI was maintained or even weakly increased at higher elevations, suggesting improved late-season moisture retention or cooler thermal regimes upslope [65]. This topographic modulation aligns with studies showing that spatial heterogeneity linked to terrain, possible moisture redistribution and local microclimate explains a substantial share of vegetation response beyond rainfall alone [59,66,67]. Similarly, precipitation-adjusted NDVI trends helped separate climatic from site controls. The inference is supported by established drought and trend tools like SPI (MK with Sen’s slope) widely used in hydroclimatology to detect monotonic change and quantify magnitude. Together, the WMC sites illustrate a coherent climate to vegetation signal strengthened by elevation with stable-climate stations showing correspondingly weak NDVI change.

5. Conclusions

This study demonstrated that climate variability, mediated by topography, was reshaping wetland resilience in the Waterberg Mountain Complex. Over the 1996–2023 period, maximum temperatures rose unevenly across the region, with low-lying sites such as Lephalale experiencing persistent warming and drying, while Mokopane showed a rare wetting trend. ENSO-driven droughts further shortened hydroperiods, intensifying ecological stress. Vegetation responses confirmed that NDVI tracked rainfall variability, with high-altitude wetlands exhibiting greater buffering capacity, whereas lowland systems showed consistent declines. Three key insights emerge: (i) Topography was a critical determinant of climate vulnerability, buffering some wetlands while exposing others to desiccation risk. (ii) Ecosystem services such as water regulation, biodiversity support and carbon storage are increasingly compromised in lowland regions under sustained warming and drying. (iii) Adaptive management strategies must be site-specific, integrating elevation, hydrological monitoring and local climate projections into planning frameworks. By linking long-term climatic trends to ecological responses, this study advances understanding of montane wetland resilience under semi-arid conditions. Protecting Waterberg wetlands is not only essential for biodiversity conservation but also for securing water resources and livelihoods under accelerating climate change. In line with global sustainability goals, these findings emphasize the urgency of embedding wetland conservation within broader climate adaptation and policy agendas.

6. Limitations and Future Research

In the present study, several limitations have been identified. For example, one limitation relates to the NDVI data: the analysis was based on a snapshot approach for selected years due to data availability, which may not capture all nuances of interannual vegetation dynamics. To address this, a continuous NDVI time-series analysis over the entire period is recommended in future research to extend the vegetation record for these wetlands. It is acknowledged that climate data were derived from only five weather stations, which, although covering the region, may not capture microclimatic variability at very fine scales. Future research efforts could include the deployment of more localized sensors and the use of high-resolution climate models to refine the understanding of microclimate effects on wetlands. Another limitation concerns the lack of direct hydrological measurements within the wetlands (e.g., groundwater levels and wetland inundation extent were not monitored). Including such hydrological data in future studies would facilitate the direct linkage of climate variability to changes in wetland water balance. For example, future monitoring of groundwater levels and mapping of inundation extent could provide a more complete understanding of hydrological dynamics in response to climate variability. Future research directions emerging from these findings should investigate biological responses (e.g., faunal or floral changes) in these wetlands under climate stress and expand the study to other mountain complexes to determine whether similar topographic resilience patterns are observed.

Supplementary Materials

The following supporting information can be downloaded at: https://www.mdpi.com/article/10.3390/su18062769/s1, Table S1: Rainfall Anomaly Index (RAI) classification thresholds; Table S2: Normalized Difference Vegetation Index (NDVI) classification thresholds; Table S3: Rainfall Anomaly Index (RAI) positive anomalies across stations in the Waterberg Mountain Complex (WMC), 1996–2023; Table S4: Rainfall Anomaly Index (RAI) negative anomalies across stations in the Waterberg Mountain Complex (WMC), 1996–2023.

Author Contributions

Conceptualization, K.S.M.; methodology, K.S.M. and K.K.A.; validation, K.K.A. and M.M.; investigation, K.S.M. and A.A.-B.; resources, K.K.A., M.M. and A.A.-B.; writing—original draft preparation, K.S.M.; writing—review and editing, K.K.A. and M.M.; visualization, K.S.M.; supervision, A.A.-B., K.K.A. and M.M.; project administration, K.S.M.; funding acquisition, K.S.M., A.A.-B., K.K.A. and M.M. All authors have read and agreed to the published version of the manuscript.

Funding

This research was funded by NRF, grant number MND200623535772. Sampling was funded by the Centre for Global Change—University of Limpopo and FBIP Waterberg Biodiversity Project.

Institutional Review Board Statement

Not applicable.

Informed Consent Statement

Not applicable.

Data Availability Statement

The raw data supporting the conclusions of this article will be made available by the authors on request.

Acknowledgments

The authors would like to acknowledge the following people for assistance with site visits and ground-truthing: The FBIP Waterberg Biodiversity Project, SANBI—National Zoological Garden, UL—Centre for Global Change, Marilize Greyling, Khathutselo Neshunzi, Phumlani Zwane, Kabisheng Mabitsela, Itumeleng Letlojoane and the Property Owners.

Conflicts of Interest

The authors declare no conflicts of interest.

Abbreviations

The following abbreviations are used in this manuscript:
WMCWaterberg Mountain Complex
EREarly Rains
LRLate Rains
SPIStandard Precipitation Index
NDVINormalized Difference Vegetation Index
TminMinimum Temperature
TmaxMaximum Temperature

References

  1. Balwan, W.K.; Kour, S. Wetland- An Ecological Boon for the Environment. East Afr. Sch. J. Agric. Life Sci. 2021, 4, 38–48. [Google Scholar] [CrossRef] [Scilit]
  2. Darrah, S.E.; Shennan-Farpón, Y.; Loh, J.; Davidson, N.C.; Finlayson, C.M.; Gardner, R.C.; Walpole, M.J. Improvements to the Wetland Extent Trends (WET) index as a tool for monitoring natural and human-made wetlands. Ecol. Indic. 2019, 99, 294–298. [Google Scholar] [CrossRef] [Scilit]
  3. Gupta, G.; Khan, J.; Upadhyay, A.K.; Singh, N.K. Wetland as a Sustainable Reservoir of Ecosystem Services: Prospects of Threat and Conservation. In Restoration of Wetland Ecosystem: A Trajectory Towards a Sustainable Environment; Springer: Singapore, 2020; pp. 31–43. [Google Scholar]
  4. Mitsch, W.J.; Gosselink, J.G. Wetlands, 5th ed.; John Wiley & Sons: Hoboken, NJ, USA, 2015. [Google Scholar]
  5. Ramsar Convention Secretariat. The Ramsar Convention Manual: A Guide to the Convention on Wetlands (Ramsar, Iran, 1971), 6th ed.; Ramsar Convention Secretariat: Gland, Switzerland, 2013. [Google Scholar]
  6. UNEP. Global Peatlands Assessment: The State of the World’s Peatlands—Evidence for Action toward the Conservation, Restoration, and Sustainable Management of Peatlands; UNEP: Nairobi, Kenya, 2022. [Google Scholar]
  7. Ballut-Dajud, G.A.; Herazo, L.C.S.; Fernández-Lambert, G.; Marín-Muñiz, J.L.; Méndez, M.C.L.; Betanzo-Torres, E.A. Factors Affecting Wetland Loss: A Review. Land 2022, 11, 434. [Google Scholar] [CrossRef] [Scilit]
  8. Xu, T.; Weng, B.; Yan, D.; Wang, K.; Li, X.; Bi, W.; Li, M.; Cheng, X.; Liu, Y. Wetlands of international importance: Status, threats, and future protection. Int. J. Environ. Res. Public Health 2019, 16, 1818. [Google Scholar] [CrossRef] [Scilit] [PubMed]
  9. Mitchell, S.A. The status of wetlands, threats and the predicted effect of global climate change: The situation in Sub-Saharan Africa. Aquat. Sci. 2013, 75, 95–112. [Google Scholar] [CrossRef] [Scilit]
  10. Finlayson, C.M. Climate Change and Wetlands. In The Wetland Book; Springer: Dordrecht, The Netherlands, 2018; pp. 597–608. [Google Scholar]
  11. Dube, T.; Dube, T.; Marambanyika, T. A review of wetland vulnerability assessment and monitoring in semi-arid environments of sub-Saharan Africa. Phys. Chem. Earth 2023, 132, 103473. [Google Scholar] [CrossRef] [Scilit]
  12. Sharma, S.; Singh, P. Wetlands Conservation; Wiley: Hoboken, NJ, USA, 2021. [Google Scholar]
  13. Gondwe, M.J.; Murray-Hudson, M.; Mazrui, N.M.; Moses, O.; Mosimanyana, E.; Mogobe, O. A review of the limnology of the Okavango Delta, Botswana. Afr. J. Aquat. Sci. 2021, 46, 251–273. [Google Scholar] [CrossRef] [Scilit]
  14. Roy, P.S.; Ramachandran, R.M.; Paul, O.; Thakur, P.K.; Ravan, S.; Behera, M.D.; Sarangi, C.; Kanawade, V.P. Anthropogenic Land Use and Land Cover Changes—A Review on Its Environmental Consequences and Climate Change. J. Indian Soc. Remote Sens. 2022, 50, 1615–1640. [Google Scholar] [CrossRef] [Scilit]
  15. Moomaw, W.R.; Chmura, G.L.; Davies, G.T.; Finlayson, C.M.; Middleton, B.A.; Sutton-Grier, A.E. Wetlands in a Changing Climate: Science, Policy and Management. Wetlands 2018, 38, 183–205. [Google Scholar] [CrossRef] [Scilit]
  16. Neubauer, S.C.; Verhoeven, J.T.A. Wetland Effects on Global Climate: Mechanisms, Impacts, and Management Recommendations. In Wetlands: Ecosystem Services, Restoration and Wise Use; Springer: Cham, Switzerland, 2019; pp. 39–62. [Google Scholar]
  17. Diop, S.; Scheren, P.; Niang, A. Climate Change and Water Resources in Africa: Perspectives and Solutions Towards an Imminent Water Crisis, 1st ed.; Springer: Cham, Switzerland, 2021. [Google Scholar]
  18. van Deventer, H.; van Niekerk, L.; Adams, J.; Dinala, M.K.; Gangat, R.; Lamberth, S.J.; Lötter, M.; Mbona, N.; MacKay, F.; Nel, J.L.; et al. National wetland map 5: An improved spatial extent and representation of inland aquatic and estuarine ecosystems in South Africa. Water SA 2020, 46, 66–79. [Google Scholar] [CrossRef] [Scilit]
  19. van Deventer, H.; Smith-Adao, L.; Petersen, C.; Mbona, N.; Skowno, A.; Nel, J.L. Review of available data for a South African Inventory of Inland Aquatic Ecosystems (SAIIAE). Water SA 2018, 44, 184–199–203. [Google Scholar] [CrossRef] [Scilit]
  20. van Deventer, H.; Naidoo, L.; Cho, M.A.; Job, N. Establishing Remote Sensing Toolkits for Monitoring Freshwater Ecosystems Under Global Change; Water Research Commission: Gezina, South Africa, 2020. [Google Scholar]
  21. Skowno, A.L.; Poole, C.J.; Raimondo, D.C.; Sink, K.J.; Van Deventer, H.; Driver, A. National Biodiversity Assessment 2018: The Status of South Africa’s Ecosystems and Biodiversity; South African National Biodiversity Institute: Silverton, South Africa, 2019. [Google Scholar]
  22. Mandishona, E.; Knight, J. Inland wetlands in Africa: A review of their typologies and ecosystem services. Prog. Phys. Geogr. Earth Environ. 2022, 46, 547–565. [Google Scholar] [CrossRef] [Scilit]
  23. Mashala, J.M. Assessment and Mapping of Wetland Vegetation as an Indicator of Ecological Productivity in Maungani Wetland in Limpopo, South Africa; University of Limpopo: Polokwane, South Africa, 2020. [Google Scholar]
  24. Pool-Stanvliiet, R. The UNESCO MAB Programme in South Africa: Current Challenges and Future Options Relating to the Implementation of Biosphere Reserves; University of Greifswald: Greifswald, Germany, 2014. [Google Scholar]
  25. Saxena, K.G.; Rao, K.S. Climate change and vegetation phenology. In Reproductive Ecology of Flowering Plants: Patterns and Processes; Springer: Singapore, 2020; pp. 25–39. [Google Scholar]
  26. de Necker, L.; Gerber, R.; van Vuren, J.; Wepener, V.; Smit, N.J.; Brendonck, L. Temporal dynamics of a subtropical floodplain pool after 2 years of supra-seasonal drought: A mesocosm study. Hydrobiologia 2022, 849, 795–815. [Google Scholar] [CrossRef] [Scilit]
  27. Higgins, S.I.; Coetzee, M.A.S.; Marnewweck, G.C.; Rogders, K.H. The Nyl River floodplain, South Africa, as a functional unit of the landscape: A review of current information. Afr. J. Ecol. 1996, 34, 131–145. [Google Scholar] [CrossRef] [Scilit]
  28. R Core Team. R: A Language and Environment for Statistical Computing; R Foundation for Statistical Computing: Vienna, Austria, 2020. [Google Scholar]
  29. McLeod, A.I. Kendall Rank Correlation and Mann-Kendall Trend Test. R Package Kendall, 602. 2005. Available online: https://cran.r-project.org/web/packages/Kendall/Kendall.pdf (accessed on 27 June 2024).
  30. Van Rooy, M.P. A rainfall anomally index independent of time and space. Notos 1965, 14, 43–48. [Google Scholar]
  31. Wang, Y.; Lu, Z.; Sheng, Y.; Zhou, Y. Remote sensing applications in monitoring of protected areas. Remote Sens. 2020, 12, 1370. [Google Scholar] [CrossRef] [Scilit]
  32. Guttman, N.B. Accepting the standardized precipitation index: A calculation algorithm. J. Am. Water Resour. Assoc. 1999, 35, 311–322. [Google Scholar] [CrossRef] [Scilit]
  33. Xu, P.; Niu, Z.; Tang, P. Comparison and assessment of NDVI time series for seasonal wetland classification. Int. J. Digit. Earth 2018, 11, 1103–1131. [Google Scholar] [CrossRef] [Scilit]
  34. Doughty, C.L.; Gu, H.; Ambrose, R.F.; Stein, E.D.; Sloane, E.B.; Martinez, M.; Cavanaugh, K.C. Climate drivers and human impacts shape 35-year trends of coastal wetland health and composition in an urban region. Ecosphere 2024, 15, 4832. [Google Scholar] [CrossRef] [Scilit]
  35. Mazibuko, S.; Mukwada, G.; Moeletsi, M. Assessing the frequency of drought/flood severity in the luvuvhu river catchment, limpopo province, south africa. Water SA 2021, 47, 172–184. [Google Scholar] [CrossRef] [Scilit]
  36. Dodds, W.K.; Bruckerhoff, L.; Batzer, D.; Schechner, A.; Pennock, C.; Renner, E.; Tromboni, F.; Bigham, K.; Grieger, S. The freshwater biome gradient framework: Predicting macroscale properties based on latitude, altitude, and precipitation. Ecosphere 2019, 10, e02786. [Google Scholar] [CrossRef] [Scilit]
  37. Mbiriri, M.; Mukwada, G.; Manatsa, D. Influence of altitude on spatiotemporal variations of meteorological droughts in mountain regions of the Free State Province, South Africa (1960–2013). Adv. Meteorol. 2018, 2018, 5206151. [Google Scholar] [CrossRef] [Scilit]
  38. Mupangwa, W.; Chipindu, L.; Ncube, B.; Mkuhlani, S.; Nhantumbo, N.; Masvaya, E.; Ngwira, A.; Moeletsi, M.; Nyagumbo, I.; Liben, F. Temporal Changes in Minimum and Maximum Temperatures at Selected Locations of Southern Africa. Climate 2023, 11, 84. [Google Scholar] [CrossRef] [Scilit]
  39. Grab, S.W.; Knight, J. Southern African montane environments. In Southern African Landscapes; Routledge: London, UK, 2018; pp. 153–180. [Google Scholar]
  40. Fitchett, J.M.; Mackay, A.W.; Grab, S.W.; Bamford, M.K. Holocene climatic variability indicated by a multi-proxy record from southern Africa’s highest wetland. Holocene 2017, 27, 638–650. [Google Scholar] [CrossRef] [Scilit]
  41. Ntirugulirwa, B.; Zibera, E.; Epaphrodite, N.; Manishimwe, A.; Nsabimana, D.; Uddling, J.; Wallin, G. Thermophilisation of Afromontane forest stands demonstrated in an elevation gradient experiment. Biogeosciences 2023, 20, 5125–5149. [Google Scholar] [CrossRef] [Scilit]
  42. Ndlovu, M.; Clulow, A.D.; Savage, M.J.; Nhamo, L.; Magidi, J.; Mabhaudhi, T. An assessment of the impacts of climate variability and change in KwaZulu-Natal province, South Africa. Atmosphere 2021, 12, 427. [Google Scholar] [CrossRef] [Scilit]
  43. Parmesan, C.; Morecroft, M.D.; Trisurat, Y.; Mezzi, D.; Langsdorf, S.; Weyer, N. Climate Change 2022: Impacts, Adaptation and Vulnerability. IPCC WGII Contribution; Cambridge University Press: Cambridge, UK, 2022. [Google Scholar]
  44. Young, K.L.; Brown, L.; Dibike, Y. Arctic Wetlands and Lakes: Dynamics and Linkages. In Arctic Hydrology, Permafrost and Ecosystems; Springer: Cham, Switzerland, 2021; pp. 349–377. [Google Scholar]
  45. Olivier, J.; Jonker, N. Optimal Utilisation of Thermal Springs in South Africa: Report to the Water Research Commission; Water Research Commission: Gezina, South Africa, 2013. [Google Scholar]
  46. Stevens, L.E.; Schenk, E.R.; Springer, A.E. Springs ecosystem classification. Ecol. Appl. 2021, 31, e2218. [Google Scholar] [CrossRef] [Scilit] [PubMed]
  47. Van Der Walt, A.J.; Fitchett, J.M. Exploring extreme warm temperature trends in South Africa: 1960–2016. Theor. Appl. Climatol. 2021, 143, 1341–1360. [Google Scholar] [CrossRef] [Scilit]
  48. Pabón-Caicedo, J.D.; Arias, P.A.; Carril, A.F.; Espinoza, J.C.; Borrel, L.F.; Goubanova, K.; Lavado-Casimiro, W.; Masiokas, M.; Solman, S.; Villalba, R. Observed and Projected Hydroclimate Changes in the Andes. Front. Earth Sci. 2020, 8, 61. [Google Scholar] [CrossRef] [Scilit]
  49. Birhan, D. Impacts of Climate Change and Management Practices on Potato Production in Tropical Highland Regions of Ethiopia; Bahir Dar University: Bahir Dar, Ethiopia, 2022. [Google Scholar]
  50. Pepin, N.C.; Arnone, E.; Gobiet, A.; Haslinger, K.; Kotlarski, S.; Notarnicola, C.; Palazzi, E.; Seibert, P.; Serafin, S.; Schöner, W.; et al. Climate Changes and Their Elevational Patterns in the Mountains of the World. Rev. Geophys. 2022, 60, e2020RG000730. [Google Scholar] [CrossRef] [Scilit]
  51. Hesslerová, P.; Pokorný, J.; Huryna, H.; Harper, D. Wetlands and Forests Regulate Climate via Evapotranspiration. In Wetlands: Ecosystem Services, Restoration and Wise Use; Springer: Cham, Switzerland, 2019; pp. 63–93. [Google Scholar]
  52. Assandri, G. Anthropogenic-driven transformations of dragonfly communities of low elevation mountain wetlands during the last century. Insect Conserv. Divers. 2021, 14, 26–39. [Google Scholar] [CrossRef] [Scilit]
  53. Steffen, H.; Bosch, C.; Wolfaardt, G.; Botha, A. Rising environmental temperatures and polluted surface waters: The prelude to the rise of mycoses in South Africa. Water SA 2022, 48, 199–216. [Google Scholar] [CrossRef] [Scilit]
  54. Kåresdotter, E.; Destouni, G.; Ghajarnia, N.; Hugelius, G.; Kalantari, Z. Mapping the Vulnerability of Arctic Wetlands to Global Warming. Earth’s Future 2021, 9, e2020EF001858. [Google Scholar] [CrossRef] [Scilit]
  55. Ashfaq, M. Topographic Controls on the Distribution of Summer Monsoon Precipitation over South Asia. Earth Syst. Environ. 2020, 4, 667–683. [Google Scholar] [CrossRef] [Scilit]
  56. Van den Hende, C.; Van Schaeybroeck, B.; Nyssen, J.; Van Vooren, S.; Van Ginderachter, M.; Termonia, P. Analysis of rain-shadows in the Ethiopian Mountains using climatological model data. Clim. Dyn. 2021, 56, 1663–1679. [Google Scholar] [CrossRef] [Scilit]
  57. Beltran, Y.R. Characterizing and Understanding Orographic Precipitation over the Mountains of Extratropical South America; University at Albany, State University of New York: New York, NY, USA, 2023. [Google Scholar]
  58. Grenfell, S.; Grenfell, M.; Ellery, W.; Job, N.; Walters, D. A Genetic Geomorphic Classification System for Southern African Palustrine Wetlands. Front. Environ. Sci. 2019, 7, 174. [Google Scholar] [CrossRef] [Scilit]
  59. Lennard, C. Multi-Scale Drivers of the South African Weather and Climate. In The Geography of South Africa; Springer: Cham, Switzerland, 2019; pp. 81–89. [Google Scholar]
  60. Murungweni, F.M.; Mutanga, O.; Odiyo, J.O. Rainfall trend and its relationship with normalized difference vegetation index in a restored semi-arid wetland of South Africa. Sustainability 2020, 12, 8919. [Google Scholar] [CrossRef] [Scilit]
  61. Sorenson, J.P.R.; Davies, J.; Ebrahim, G.Y.; Lindle, J.; Marchant, B.P.; Taylor, R.G. The influence of groundwater abstraction on interpreting climate controls and recharge events. Hydrogeol. J. 2021, 29, 2773–2787. [Google Scholar] [CrossRef] [Scilit]
  62. Tonkin, J.D.; Bogan, M.T.; Bonada, N.; Rios-Touma, B.; Lytle, D.A. Seasonality and predictability shape temporal species diversity. Ecology 2017, 98, 1201–1216. [Google Scholar] [CrossRef] [Scilit]
  63. Davis-Reddy, C. Assessing Vegetation Dynamics in Response to Climate Variability and Change Across Sub-Saharan Africa; Stellenbosch University: Stellenbosch, South Africa, 2018; Available online: https://scholar.sun.ac.za (accessed on 27 June 2025).
  64. Abdi, A.M.; Brandt, M.; Abel, C.; Fensholt, R. Satellite Remote Sensing of Savannas: Current Status and Emerging Opportunities. J. Remote Sens. 2022, 2022, 9835284. [Google Scholar] [CrossRef] [Scilit]
  65. Yang, W.; Qi, W.; Zhou, J. Effects of precipitation and topography on vegetation recovery at landslide sites after the 2008 Wenchuan earthquake. Land Degrad. Dev. 2018, 29, 3355–3365. [Google Scholar] [CrossRef] [Scilit]
  66. Hoylman, Z.H.; Jencso, K.G.; Hu, J.; Holden, Z.A.; Martin, J.T.; Gardner, W.P. The Climatic Water Balance and Topography Control Spatial Patterns of Atmospheric Demand, Soil Moisture, and Shallow Subsurface Flow. Water Resour. Res. 2019, 55, 2370–2389. [Google Scholar] [CrossRef] [Scilit]
  67. Marston, C.G.; Wilkinson, D.M.; Reynolds, S.C.; Louys, J.; O’regan, H.J. Water availability is a principal driver of land cover heterogeneity in sub-Saharan savannahs. Landsc. Ecol. 2019, 34, 131–145. [Google Scholar] [CrossRef] [Scilit]
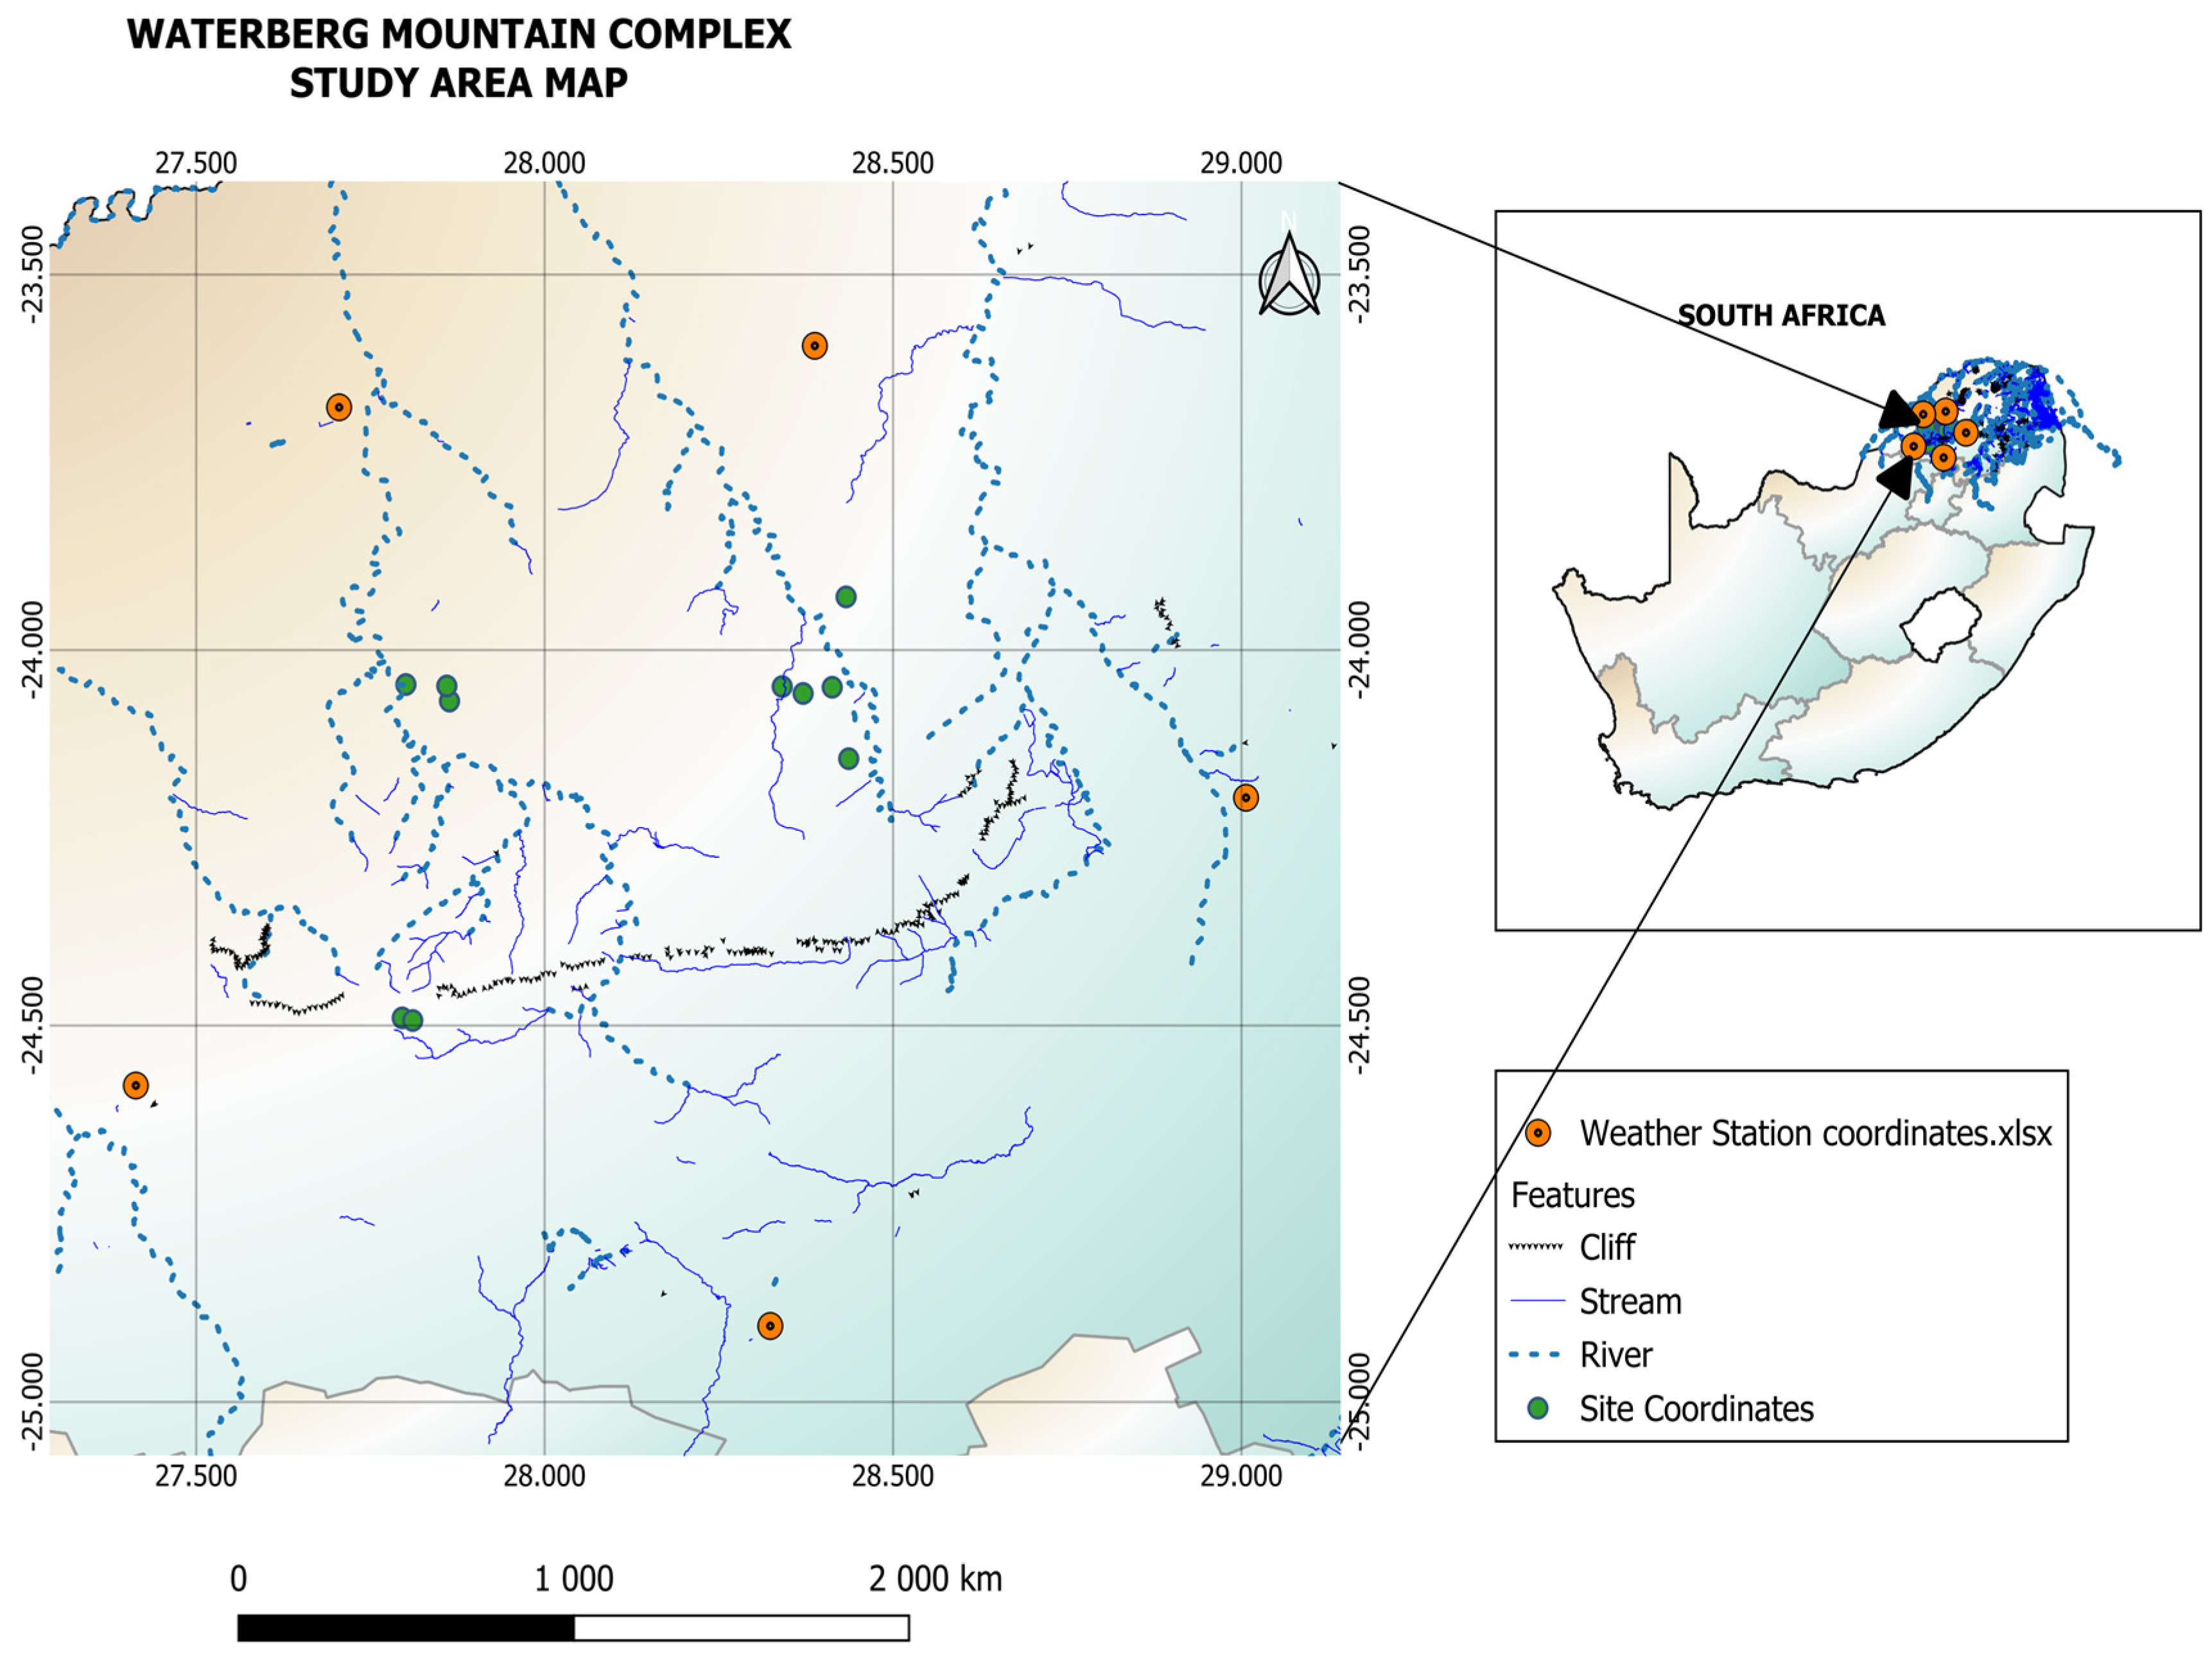
Figure 1. Map of the Waterberg Mountain Complex with five weather stations and wetland sites in the Savanna biome in Limpopo Province, South Africa.
Sustainability 18 02769 g001
Figure 2. (A): Represents temperature trends (1996–2023) of the five weather station locations in the Waterberg Mountain Complex. (B): The rainfall time series (1994–2022) of five locations in the Waterberg Mountain Complex. (C): Rainfall Anomalies Index of Mokopane, Lephalale, Marken, Thabazimbi and Warmbath the Waterberg Mountain Complex.
Sustainability 18 02769 g002
Figure 3. Significant years for ER to LR Tmax and Tmin seasonal differences in the Waterberg Mountain Complex.
Sustainability 18 02769 g003
Figure 4. SPI-6 (Oct–Mar) by Season (rows; year = March end-year) and Station (columns). Colours indicate standardized wetness (positive = wetter, negative = drier).
Sustainability 18 02769 g004
Figure 5. NDVI values across the Waterberg Mountain Complex with wetland monitoring sites shown as green points.
Sustainability 18 02769 g005
Figure 6. Relationship between altitude and mean NDVI across wetlands of the Waterberg Mountain Complex during the Early Rains (left) and Late Rains seasons (right). The shaded band around each dashed regression line is the confidence band (typically 95%) for the fitted mean NDVI at each altitude.
Sustainability 18 02769 g006
Table 1. Wetland sites in the Waterberg Mountain Complex showing site, location, type, coordinates and altitude (m).
Site LocationWetland TypeLatitudeLongitudeAltitude (m)
WMC-01KaingoSeepage−24.06794927.8634571301.5
WMC-02KaingoSeepage−24.04786127.859651234.8
WMC-03KaingoSeepage−24.04588427.800926921.7
WMC-04KaingoPan−24.0778327.799816998.7
WMC-05LindaniChanneled valley bottom−24.04860728.3409691184.9
WMC-06LindaniSeepage−24.05781228.3709621253.2
WMC-07LindaniPan−24.0495328.4127431181.0
WMC-08JembisaPan−23.92919228.4326651267.3
WMC-09LeoboChanneled valley bottom−24.14467828.4364091390.9
WMC-10SyringaPan−24.48987627.7956921240.6
WMC-11SyringaPan−24.49333627.8107531433.4
Table 2. The long-term temperature max and min trends in the Waterberg Mountain Complex from 1996 to 2023.
StationTmax (°C/Month)Tmax (p-Value)Tmin (°C/Month)Tmin (p-Value)
Marken0.0050.007−0.0030.302
Thabazimbi0.0040.083−0.0030.372
Warmbath0.0090.0010.0010.67
Mokopane0.0020.2410.0020.457
Lephalale0.0020.3440.0030.357
Table 3. Early Rains (ER) vs. Late Rains (LR) temperature averages of the Waterberg Mountain Complex from 1996 to 2023.
StationER Tmax_avgLR Tmax_avgER Tmin_avgLR Tmin_avg
Marken30.3730.0017.3916.11
Thabazimbi31.9825.5718.1316.90
Warmbath24.6730.815.3415.94
Mokopane27.3730.878.5017.85
Lephalale28.5232.3011.0920.14
Table 4. Trends in precipitation based on Mann–Kendall, Sen’s slope and NDVI analysis for the five study locations in the Waterberg Mountain Complex.
LocationMK and SPI TrendMK p-ValueSen’s Slope (mm·yr−1)Pearson’s rPearson p-ValueSPI p-ValueNDVI Seasonal Trend (2014–2023)NDVI–Precip Correlation (r)
MarkenDecreasing0.04−4.12−0.380.050.04NDVI decline in LR; stable in ER0.41 (p = 0.08)
ThabazimbiNo trend0.24−1.05−0.180.370.41Weak NDVI variability; no clear trend0.09 (ns)
WarmbathNo trend0.15+1.98+0.220.280.11NDVI increasing slightly in ER; LR stable0.26 (p = 0.20)
MokopaneIncreasing0.03+3.76+0.450.020.03Significant NDVI increase in ER and LR0.53 (p = 0.01)
LephalaleDecreasing0.03−2.54−0.410.030.03NDVI decline across both seasons0.49 (p = 0.04)
ns—non significant.
Disclaimer/Publisher’s Note: The statements, opinions and data contained in all publications are solely those of the individual author(s) and contributor(s) and not of MDPI and/or the editor(s). MDPI and/or the editor(s) disclaim responsibility for any injury to people or property resulting from any ideas, methods, instructions or products referred to in the content.