


Abstract
This paper examines the role of agricultural credit in shaping farm performance and technology-related outcomes in Peru, using nationally representative microdata from the Encuesta Nacional Agropecuaria (ENA). In a context characterized by credit rationing and institutional constraints, access to finance may influence agricultural income, productivity, and the adoption of improved practices through multiple direct and indirect channels. To address the non-random allocation of credit, the analysis employs a quasi-experimental framework that combines propensity score trimming, block-based common support restrictions, entropy balancing, and doubly robust treatment-effect estimators (IPWRA and AIPW). Descriptive evidence documents substantial heterogeneity in credit sources, loan uses, and rejection reasons, highlighting structural barriers related to collateral, land tenure, and risk. Regression results on the balanced sample indicate positive and statistically significant associations between credit access and both real agricultural income and land productivity. However, estimated treatment effects are sensitive to the estimation strategy: while IPWRA estimates suggest economically meaningful gains among credit recipients, AIPW estimates are smaller and not always statistically distinguishable from zero. Exploratory results further suggest that credit access is positively associated with technology adoption and managerial capacity, consistent with, but not identifying, a potential association between credit approval and technological practices. Overall, the findings are consistent with a growing body of evidence showing that the impacts of agricultural credit are modest, heterogeneous, and context dependent. From a sustainability perspective, the results underscore the importance of complementary interventions—such as land tenure security, risk management instruments, and tailored financial services—in enhancing the effectiveness of rural credit programs in agricultural systems characterized by imperfect markets and high production risk.
1. Introduction
Limited and volatile access to credit remains a central constraint to agricultural transformation in low- and middle-income countries. For many farm households, production and investment decisions are made under tight liquidity, imperfect insurance, and high exposure to idiosyncratic and covariate shocks. In this context, credit can relax working capital constraints, enable the timely purchase of modern inputs, and support lumpy investments—potentially increasing productivity and real income. At the same time, the welfare consequences of credit are theoretically ambiguous: borrowing can finance productive investment, but it can also be used for consumption smoothing or debt rollover, and it can increase exposure to downside risk when repayment obligations interact with output volatility [1,2].
Despite strong policy interest, credible evidence on the causal effects of agricultural credit remains mixed. A central empirical challenge is selection: producers who obtain credit often differ systematically from those who do not in ways correlated with outcomes—such as managerial ability, network access, prior wealth, market connectivity, or risk preferences. Many of these factors are partially observed or unobserved in standard surveys, biasing naïve comparisons. Moreover, agricultural performance reflects spatial heterogeneity in agroecological conditions and market access, as well as time-varying macroeconomic and institutional shifts, complicating causal attribution. As a result, identifying impacts requires empirical strategies that explicitly address confounding and ensure overlap between treated and comparison units [3].
This study revisits the relationship between credit and agricultural performance using nationally representative survey data from Peru. We focus on two outcomes centrally on both household welfare and agricultural policy: (i) real agricultural income and (ii) land productivity. Using pooled repeated cross-sections from the Encuesta Nacional Agropecuaria (ENA) for 2022–2024, we estimate the effect of access to credit on deflated agricultural income and (log) land productivity.
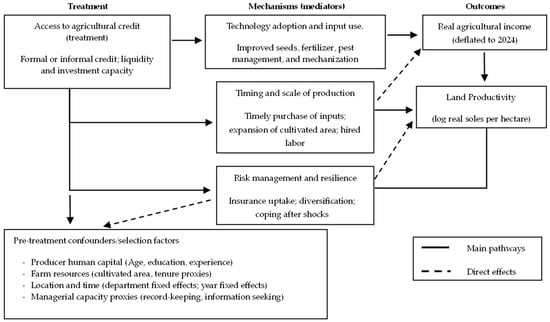
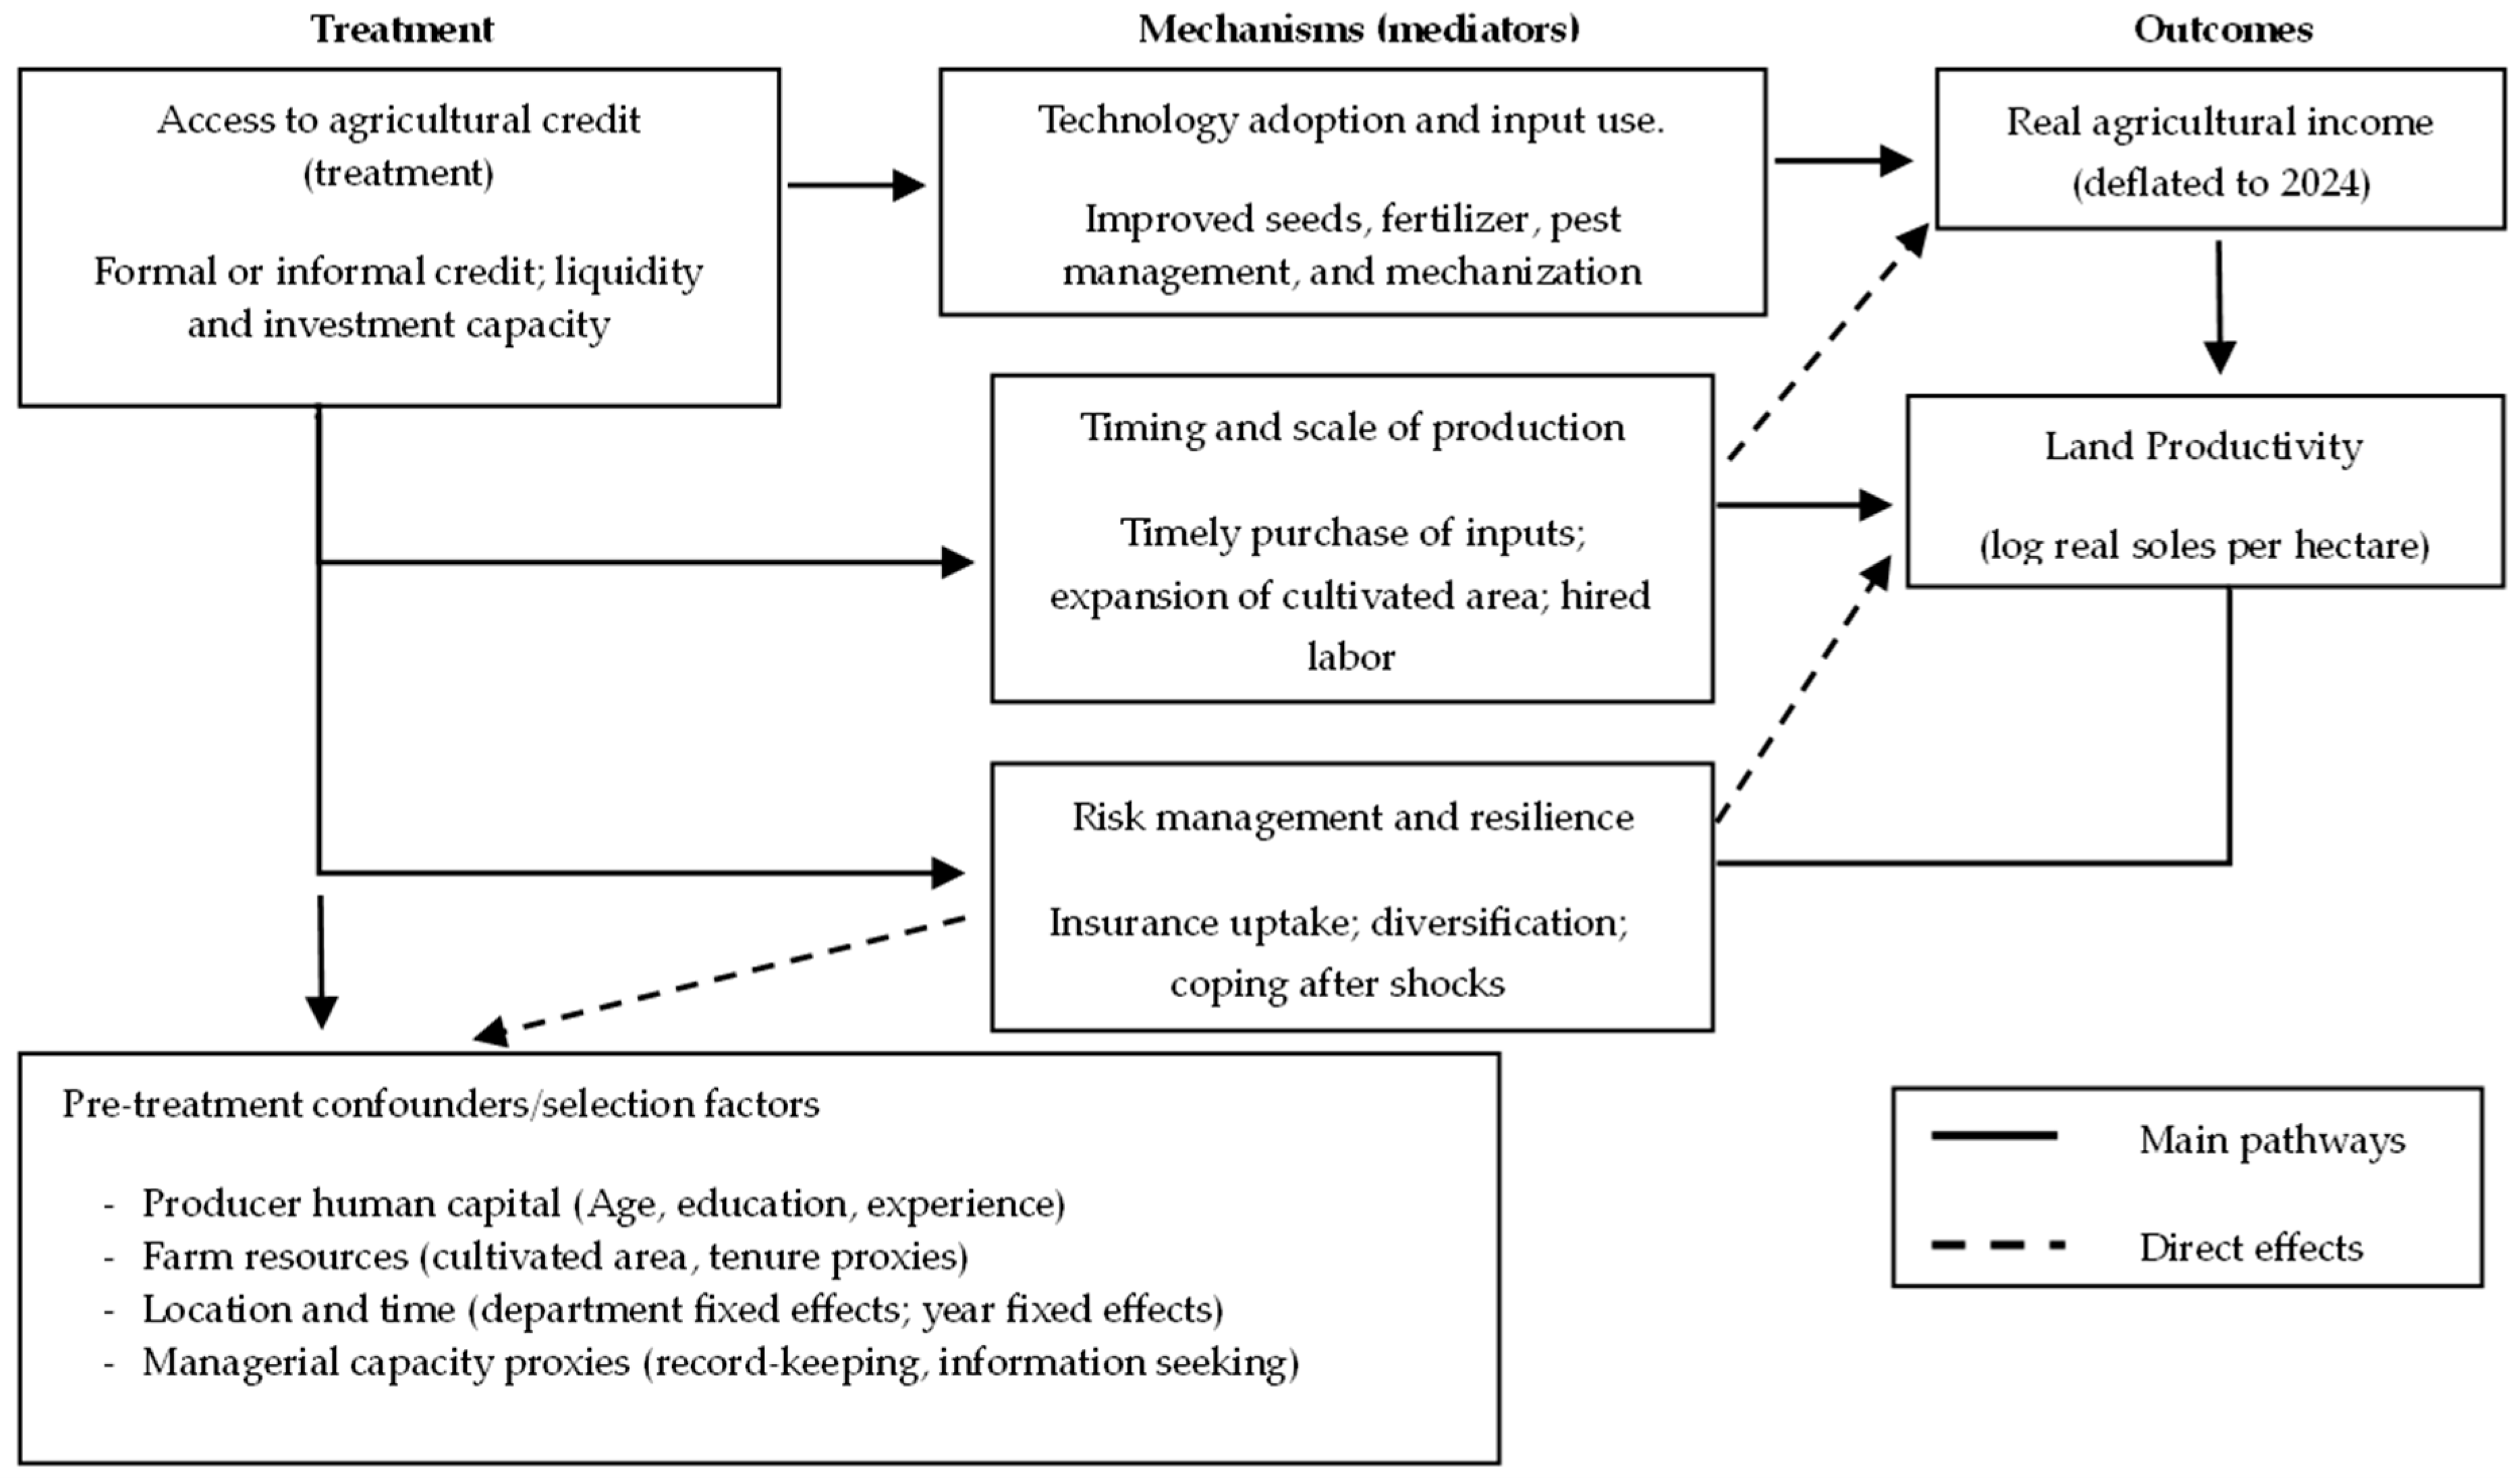
We organize analysis around a simple theory of change in which credit can affect outcomes through multiple channels. A key channel is technology adoption: by easing liquidity constraints, credit may increase the adoption and intensity of improved inputs and production practices, raising productivity and income. Additional channels operate through timing and scale (e.g., timely purchases of inputs and avoidance of distress sales) and through risk management (credit as a smoothing device versus leverage under output risk) [1,4]. Figure 1 summarizes the conceptual framework and clarifies which mechanisms are empirically assessed in this paper.
Figure 1.
Conceptual framework: Credit, Mechanisms, and Agricultural Outcomes.
Our contribution is methodological and empirical. Methodologically, we implement an entropy-balancing strategy to construct a comparison group that is observably similar to credit recipients on a parsimonious set of pre-treatment covariates, while enforcing a common-support restriction based on the estimated propensity-score distribution and block-level overlap. Entropy balancing reweights control observations so that selected moments of the covariate distribution match those of treated observations, thereby improving balance without iterative tuning of the propensity score model [5].
Empirically, we combine these balancing weights with ENA sampling weights and estimate treatment effects using design-based inference under the complex survey design. This approach aims to preserve population representativeness while strengthening internal validity through explicit overlap and balance diagnostics [6].
The main estimate is the average treatment effect on the treated (ATET) for credit recipients within the region of common support. Under selection-on-observables and overlap, we estimate the expected difference between treated outcomes and the counterfactual outcomes credit recipients would have experienced without credit, for units comparable on observed characteristics [3]. To assess robustness, we also report doubly robust estimates based on inverse-probability weighting with regression adjustment (IPWRA) and augmented inverse-probability weighting (AIPW), which remain consistent if either the treatment model or the outcome model is correctly specified [7]. Finally, we treat the technology channel as exploratory: we test whether credit is associated with a technology index, but we do not interpret this as formal causal mediation, given the additional assumptions required for mediation analysis and the repeated cross-sectional nature of the ENA [8]
The remainder of the paper is structured as follows. Section 2 presents the conceptual framework linking credit to farm outcomes and clarifies the identification challenges it creates. Section 3 reviews related empirical evidence with an emphasis on studies using credible causal designs. Section 4 describes the ENA data, variable construction, sample restrictions, and the empirical strategy—including common support diagnostics, entropy balancing, and survey-representative estimation. Section 5 presents the main results and robustness checks, followed by exploratory evidence on the technology channel. Section 6 discusses the implications for the literature. Section 7 outlines limitations. Section 8 concludes.
2. Materials and Methods
Agricultural credit can influence farm outcomes through multiple, interrelated pathways. We frame these pathways as a theory of change linking access to credit to intermediate decisions (input use, technology adoption, timing, and scale), which, in turn, affect production, productivity, and income. The framework also clarifies why credible identification is challenging: the same latent characteristics that increase the likelihood of obtaining credit—such as entrepreneurial ability, managerial capacity, social networks, or risk tolerance—can independently affect outcomes, create selection bias if not adequately address [3].
2.1. Liquidity Constraints and Input Use
A standard mechanism is the relaxation of liquidity constraints. When working capital is limited, producers may underinvest in variable inputs (fertilizer, pesticides, hired labor) or delay purchases until after harvest revenues arrive. Credit can relax these constraints, enabling producers to purchase input at the agronomically optimal time and in adequate quantities. This mechanism predicts increases in yields and, conditional on land area, higher land productivity. Importantly, the sign and magnitude of income effects also depend on the cost of credit and the marginal product of inputs: if returns are low or input markets are distorted, additional borrowing may not translate into net gains.
2.2. Technology Adoption and Lumpy Investments
Credit may also facilitate the adoption of productivity-enhancing technologies that require upfront, sometimes indivisible, costs—such as improved seed varieties, irrigation equipment, machinery services, or post-harvest technologies. Where adoption is constrained by liquidity or savings, credit can shift producers across investment thresholds, leading to structural changes in production practices and potentially persistent productivity gains [4]. However, adoption effects are not guaranteed: when complementary inputs (extension, market access, reliable water) are missing, borrowing may not induce adoption or may produce weak returns.
In this paper, we treat technology adoption as the primary candidate intermediate channel. Conceptually, if credit increases adoption intensity, then we would expect improvements in land productivity and, in turn, higher real agricultural income. Empirically, however, identifying mediation requires stronger assumptions than total-effect estimation (e.g., sequential ignorability), which are difficult to defend in repeated cross-sections. Therefore, we position any analysis of the technology channel as exploratory rather than causal mediation [8].
2.3. Timing, Scale, and Market Participation
Even without changing what is produced, credit can affect when and how much producers produce and sell. By smoothing cash flow, credit can reduce delays in land preparation or input application, mitigate disruptions in labor hiring, and support scale decisions such as renting additional land or expanding cultivated areas. On the commercialization side, credit can reduce the need for distress sales immediately after harvest, potentially improving farm-gate prices if producers can store output or select more efficient marketing channels. These mechanisms imply potentially higher income even with modest yield effects, though they are sensitive to local price dynamics and storage/transaction constraints.
2.4. Risk Management, Insurance, and Downside Exposure
Credit interacts with risk in two opposing ways. On the one hand, it can function as a coping tool, smoothing consumption and production expenses aftershocks (e.g., weather events, pest outbreaks) when households lack formal insurance. On the other hand, debt obligations can increase vulnerability: under high output volatility, repayment requirements may force asset sales or reduce future investment, undermining longer-run productivity and income. This ambiguity is especially relevant in rainfed systems, and where credit is short-term or expensive. Empirically, this motivates attention to observable proxies for risk management and exposure (e.g., insurance coverage) and underscores the possibility that average effects mask substantial heterogeneity.
2.5. Implications for Identification and Empirical Design
The conceptual framework suggests that access to credit may facilitate technology adoption, which in turn could enhance farm productivity. However, given the cross-sectional structure of the data and contemporaneous measurement of credit and technology variables, the following analysis should be interpreted as exploration rather than as a formal mediation test. We do not attempt to identify a dynamic causal pathway from credit to technology to productivity. Instead, we assess whether credit approval is associated with differences in observable technology adoption patterns. Given these concerns, credible estimation requires (i) conditioning on a defensible set of pre-treatment covariates capturing major observable determinants of credit and outcomes, (ii) enforcing overlap so treated units have comparable controls, and (iii) implementing balancing or doubly robust estimators to reduce residual imbalance and sensitivity to functional form assumptions [5,7]. These principles motivate the empirical strategy used in this study.
Methodologically, observational studies increasingly rely on matching, inverse-probability weighting, and doubly robust estimators to address selection on observables [9,10,11]. However, recent methodological advances stress the importance of formally assessing sensitivity to unobserved heterogeneity through bounding approaches [12,13]. In line with this literature, the present study complements reweighting and doubly robust estimation with sensitivity analysis.
3. Literature Review
3.1. Empirical Evidence on Agricultural Credit and Farm Performance
A large empirical literature links access to credit to higher farm income and productivity, yet causal identification is difficult because borrowing is rarely random. Farmers who obtain credit tend to differ systematically from non-borrowers in unobserved ability, risk preferences, social networks, and growth orientation; lenders also screen borrowers using information that is typically not observed by researchers. These selection processes create endogeneity (including reverse causality from performance to credit access), so naïve comparisons often overstate—or occasionally understate—the causal effect of credit on agricultural outcomes.
Importantly, several recent contributions distinguish between access to credit and credit approval conditional on application. In settings where approval rates are high among applicants, estimated effects reflect marginal differences within a screened population rather than broad financial exclusion [14,15,16]. This distinction is particularly relevant in agricultural finance, where self-selection into application may already reflect unobserved entrepreneurial characteristics.
Early evidence on finance and rural welfare emphasizes the transformative potential of expanding access to formal credit at scale. Using policy-driven variation from India’s social banking program, Burgess and Pande [17] show that the expansion of rural bank branches is associated with substantial reductions in rural poverty and broader improvements in rural development outcomes. Their results provide compelling macro- and sector-level evidence that greater access to formal finance can shift welfare trajectories. However, the study does not observe farm-level production decisions and therefore cannot directly identify the mechanisms—such as investment behavior or technology adoption—through which credit affects productivity.
Subsequent work using household-level data examines the effects of large credit injections on economic behavior, highlighting both potential gains and important limitations [18]. Evaluate Thailand’s Million Baht Village Fund using panel data and a structural framework that accounts for general equilibrium effects. They find that expanded local credit increases consumption and investment in the short run and alters households’ occupational choices, with effects that are highly heterogeneous across villages and households. These findings suggest that relaxing liquidity constraints can matter for economic activity, but that broad credit expansions do not automatically translate into uniform or sustained productivity gains, nor do they isolate technology-specific channels in agriculture.
Experimental evidence further underscores the role of complementary constraints—particularly risk—in shaping the credit–technology relationship. In a randomized field experiment with smallholder farmers in Malawi [19] study agricultural loans that require the purchase of rainfall index insurance. They find that making insurance mandatory significantly reduces loan take-up, consistent with limited trust, understanding, or perceived value of the insurance product. This result is directly informative for the risk–credit–technology nexus: easing credit constraints alone may be insufficient to induce input use or technology adoption when production risk remains salient or poorly managed.
Evidence from microcredit literature reinforces a cautious interpretation of expected income effects [20]. Analyzing the randomized expansion of group-lending microcredit in urban and peri-urban India documents modest average impacts. While access to credit increases some forms of business activity, effects on consumption and broader welfare outcomes are limited in the short run. Although this study is not agricultural, it provides an important benchmark, illustrating that credit does not mechanically generate large income gains and that heterogeneity and complementary constraints are central to understanding outcomes.
Recent empirical work using quasi-experimental and experimental designs has produced mixed but increasingly nuanced evidence on agricultural credit impacts, highlighting heterogeneity across contexts, borrower types, and market structures [21,22,23,24]. While some studies document positive effects on productivity and investment, others find limited impacts when credit constraints are not binding or when complementary inputs are absent [25,26].
Finally, country-specific evidence for Peru directly motivates the need for more rigorous causal analysis using nationally representative agricultural data [27] analyze farm households and find that credit-constrained producers exhibit substantially lower productivity, estimating that output could be approximately 26% higher in the absence of credit constraints. Although their approach is non-experimental and subject to endogeneity concerns, the results highlight potentially large productivity costs associated with limited credit access in Peruvian agriculture. At the same time, they underscore the importance of addressing selection bias—precisely the gap that motivates the use of modern doubly robust, quasi-experimental methods applied to national surveys
3.2. Evidence from Policy Expansions and Natural Experiments
One influential strand exploits large-scale policy-driven expansions of formal finance. For example, evidence from India’s social banking expansion shows that expanding rural bank presence can affect rural development outcomes, illustrating that supply-side finance shocks may matter at scale [17]. However, such expansions often operate through multiple channels (credit availability, savings, payments infrastructure, local competition), and impacts can differ across regions, crops, and farmer types—consistent with the idea that credit is productive when it relaxes binding constraints and when complementary conditions are present.
3.3. Evidence from Randomized Evaluations and Field Experiments
Experimental evidence provides clearer identification and repeatedly highlights two patterns that are central to agricultural settings. First, credit can raise investment and profits for specific subgroups, but average effects may be modest when many households either do not borrow, borrow small amounts, or face other binding constraints [24]. Second, when experiments explicitly combine credit with risk management or examine input/technology choices, the technology channel becomes more directly testable.
A prominent example links finance to technology adoption by studying bundled or interrelated constraints. In Malawi, field-experimental evidence shows that financial products that interact with risk (e.g., insurance) can affect the adoption of improved technologies, underscoring that liquidity alone may be insufficient when downside risk is large [19]. Relatedly, experimental work in Ghana demonstrates that relaxing credit and risk constraints can alter agricultural decisions, but the effects depend on initial conditions and the specific constraint relaxed [28]. These findings motivate our decision to treat the technology pathway as a plausible channel, while keeping our mediation exercise explicitly exploration.
3.4. Evidence on Mechanisms: Technology Adoption, Intensification, and Productivity
Across rigorous studies, technology adoption and input intensification are common candidate mechanisms linking credit to yields and profits, but the empirical support is mixed. In settings where farmers face profitable but lumpy investments (improved seed, fertilizer, equipment, irrigation), credit can accelerate adoption and raise productivity. In other settings, adoption does not respond strongly—either because farmers are not constrained by liquidity, because returns are uncertain, or because information/extension and market access are the binding constraints. This aligns with our empirical strategy: we focus on estimating the total effect of credit on agricultural income and land productivity, treating mediation through technology as secondary and exploratory rather than a core causal claim.
3.5. Evidence Gaps and How This Study Is Positioned
Despite important advances, two salient gaps remain in the Andean context. First, much of the strongest causal evidence comes from specific programs or localized settings; external validity to nationally representative agricultural populations is often unclear. Second, even when studies credibly estimate average treatment effects, fewer designs can speak to policy-relevant heterogeneity (e.g., by farm size, region, or baseline capacity) without sacrificing precision.
Our study is positioned to contribute to both fronts by estimating effects using repeated cross-sectional national agricultural survey data and emphasizing representativeness (survey design) while adopting modern reweighting/robustness strategies to mitigate selection on observables. This positioning motivates our careful separation between (i) the main causal estimate for income and land productivity and (ii) an explicitly exploratory assessment of the technology channel.
4. Data and Empirical Strategy
4.1. Data Source, Study Population, and Sample Construction
This study uses pooled repeated cross-sectional microdata from Peru’s Encuesta Nacional Agropecuaria (ENA) for 2022–2024. ENA provides nationally representative information on agricultural producers, their production conditions, economic outcomes, and access to services and financial instruments. Pooling three waves improves precision relative to single-year analysis and allows the empirical strategy to control year-specific shocks while preserving representativeness.
The ENA is conducted annually, and data for a given agricultural year are published the following calendar year. Therefore, information corresponding to the 2024 agricultural cycle is released in 2025. At the time this study was conducted, the ENA 2025 microdata (containing 2025 agricultural information) were not yet publicly available. Consequently, the analysis relies on the most recent accessible waves (ENA 2022–2024). Table 1 summarizes the sample construction and sequential exclusions used to derive the final analytical sample.
Table 1.
Sample construction and exclusions (ENA 2022–2024 pooled).
The analytic sample is restricted to agricultural producers with non-missing information on credit status and the covariates required for adjustment. Observations are further restricted to the common support region defined by propensity-score overlap and an operational block-level support rule (described below). The final estimation is implemented under the ENA complex survey design using sampling weights and a pooled design specification to support population-representative inference.
The regression sample is slightly smaller (N = 1147) due to additional missing values in the outcome variables (real annual income and log land productivity) and selected covariates included in the outcome model. These exclusions arise from item non-response in the ENA survey and are not mechanically related to treatment status. Therefore, the reduction reflects standard complete-case requirements rather than additional sample selection criteria.
4.2. Sample Construction and Common-Support Restrictions
The estimation sample is derived through a sequence of conceptually distinct restrictions. First, the analysis is restricted to producers who report having applied for credit in the previous 12 months (N = 2835). This restriction is inherent to the treatment definition, which compares approved and rejected applicants.
Second, propensity-score common-support restrictions are imposed to ensure overlap between treated and control units. Observations outside the region of support are excluded.
Third, to avoid unstable comparisons driven by extremely small control cells, we retain only blocks with at least 20 control observations.
The final estimation sample (N = 1147, including 104 controls), therefore, represents applicants within the region of credible counterfactual support. The estimates should be interpreted as local treatment effects for this supported applicant population rather than as population-wide effects.
4.3. Treatment, Outcomes, and Covariates
Treatment (credit exposure). The treatment indicator equals 1 if the producer reports receiving agricultural credit (as defined in the ENA instrument) and 0 otherwise. Because ENA is not a panel, treatment status is measured contemporaneously within each wave; the estimate is therefore an association-adjusted effect of credit access during the survey period on outcomes in the same period, under the identifying assumptions stated in Section 4.5. See Table A1 in Appendix A for detailed information.
The treatment variable is defined as credit approval conditional on application. The ENA financial services module first asks all producers whether they applied for any credit in the previous 12 months. Only those who report applying are subsequently asked whether they obtained the credit requested. The analytical sample is restricted to producers who applied for credit. Within this applicant subsample, the treatment indicator equals 1 if the producer reports obtaining the requested credit.
In the full ENA sample (N = 14,586), only a subset of producers has applied for credit. Among applicants (N = 2835), approximately 92% report approval. Thus, the high treated share reflects the approval rate within the applicant pool rather than overall credit access in the agricultural population. A broader comparison of the full ENA sample, the applicant subsample, and the final estimation sample is provided in Appendix A Table A2.
Main outcomes. We focus on two primary outcomes:
- Deflated agricultural income (2024 soles). Agricultural income is deflated to constant 2024 currency units using the general CPI to ensure comparability across years.
- Land productivity (log). is defined as real agricultural sales per hectare. In all baseline and robustness specifications, productivity is expressed in natural logarithms to reduce skewness and allow semi-elasticity interpretation.
Covariates (pre-treatment). The core adjustment set includes producer demographics and farming characteristics plausibly related to both credit approval conditional on application and performance: age, education, gender, farming experience, cultivated area, indicators capturing production/tenure characteristics, and location and year fixed effects. To avoid overfitting, given the limited number of treated observations, the main reweighting step prioritizes a parsimonious covariate set for balance, while additional contextual controls are included in outcome regressions (see Section 4.5).
4.4. Survey Design and Population-Representative Inference
ENA uses a complex survey design with stratification and clustering. All descriptive statistics and regression-based estimates are computed using survey methods. In pooled analyses, primary sampling units (PSUs) and strata are defined within a year and then combined to avoid invalid reuse of PSU/strata identifiers across waves. Standard errors are computed using the linearized variance estimator, and single-unit strata are handled with the centered option. This approach targets external validity: estimates are interpretable as representative of the ENA producer population within 2022–2024. Table 2 shows the survey design of the ENA.
Table 2.
Survey design specification and estimation settings.
4.5. Main Identification Strategy: Entropy Balancing + Survey-Weighted Outcome Regression
The identification strategy relies on selection of observables within a cross-sectional framework. Credit approval and outcome variables are measured contemporaneously within the same agricultural year. As a result, reverse causality cannot be fully ruled out: more productive or higher-income producers may be more likely to obtain credit approval even after conditioning on observed characteristics. The estimates should therefore be interpreted as conditional treatment effects under the maintained assumption of no unobserved confounding, rather than as definitive causal effects.
The primary estimate is the Average Treatment Effect on the Treated (ATT): the expected difference between the observed outcomes of treated producers and their counterfactual outcomes without credit, averaged over the treated group in the common support region.
We implement entropy balancing (EB) to reweight controls so that selected covariate moments match those of treated producers. EB directly enforces balance constraints on the control group while minimally distorting the base weights, yielding stable covariate balance in settings where propensity-score matching can be sensitive to specification and overlap.
Entropy balancing was implemented to match the first moments (means) of pre-treatment covariates between treated and control applicants. Attempts to additionally balance second moments did not converge, given the limited number of control observations. We therefore prioritized mean balance and weight stability. The final entropy weights display moderate dispersion (mean = 10.63, SD = 2.08, range = 6.31–15.39), and detailed entropy balancing weight diagnostics for the control group are reported in Appendix A Table A3, and the effective sample size of the reweighted control group is approximately 100, indicating that results are not driven by extreme reweighting of a small number of units.
Operationally, EB is applied to the common-support sample, conditioning on pre-treatment covariates. The EB weights are then combined with the ENA sampling weights to form a final weight that preserves population representativeness while achieving covariate balance between treated and reweighted controls.
After EB, we estimate survey-weighted regressions of the form:
where is income (deflated) or log land productivity, are year fixed effects, are department fixed effects, and includes a minimal set of additional contextual controls (e.g., local financial access measures and a managerial proxy index) included for precision and to reduce residual confounding.
4.6. Common Support and Overlap Diagnostics
Because credibility hinges on comparing treated producers to observationally similar controls, we impose a two-step support rule:
Propensity score trimming: we estimate a propensity score model and trim observations outside the intersection of the treated and control distributions (i.e., the 1st–99th percentiles within each group), thereby reducing sensitivity to extreme weights and poor overlap.
Block-level support threshold: we further require a minimum number of controls within propensity-score blocks (), ensuring that each treated region has sufficient control support.
These steps define the final analysis sample for EB and robustness estimators.
4.7. Robustness: Doubly Robust Estimators and Alternative Reweighting
To evaluate sensitivity to modeling choices, we complement EB with doubly robust estimators that combine treatment and outcome modeling: Augmented inverse probability weighting (AIPW) and Inverse probability weighted regression adjustment (IPWRA), implemented using the same covariate set as EB, with survey design–consistent inference where feasible. These estimators are consistent if either the treatment model or the outcome model is correctly specified, providing a robust check against misspecification.
We also report weight diagnostics (e.g., dispersion, effective sample size) and post-estimation balance summaries when supported by the estimator, to document whether results are driven by a small number of heavily weighted observations.
The primary parameter of interest is the Average Treatment Effect on the Treated (ATT), as the analysis focuses on producers who applied for credit and evaluates the effect of approval among applicants. Entropy balancing directly identifies the ATT by reweighting controls to match treated covariate distributions. IPWRA is estimated as ATET, aligning with this parameter. In contrast, Stata’s (version 19) implementation of AIPW under survey-consistent settings reports the ATE rather than the ATET. Given the high share of treated producers in the analytical sample, the ATE is numerically close to the ATT. Nevertheless, we report the estimand explicitly for transparency.
4.8. Exploratory Association Analysis: Technology Adoption Channel
A secondary research question assesses whether credit is associated with higher technology adoption. Because this association is not central to identification and may be weakly powered, we treat it as exploratory. We estimate the association between credit and a technology adoption index using the same weighting and fixed-effect structure as the main models. Given the null result in preliminary analysis, we do not pursue formal causal mediation; instead, we report the estimate as evidence on whether technology adoption plausibly mediates any observed total effect.
4.9. Identifying Assumptions and Interpretation
The causal interpretation of the ATT requires:
- Conditional unconfoundedness: after conditioning on the covariates used for reweighting and controls (including time and location fixed effects), treatment assignment is as good as random.
- Overlap: treated producers have comparable controls with similar covariate distributions (supported by common-support diagnostics).
- SUTVA/no interference: one producer’s credit status does not directly affect another’s outcomes in a way that violates individual-level potential outcomes (a strong assumption; we discuss spillovers as a limitation).
Given the observational nature of ENA, the results should be interpreted as causal estimates under these assumptions; we explicitly assess their plausibility in the limitations section.
5. Results
5.1. Descriptive Patterns: Credit Access, Use, and Constraints
Before turning to covariate balance and impact estimates, we document descriptive patterns on credit provision, use, and access constraints.
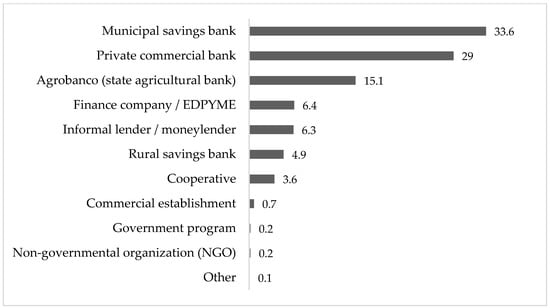
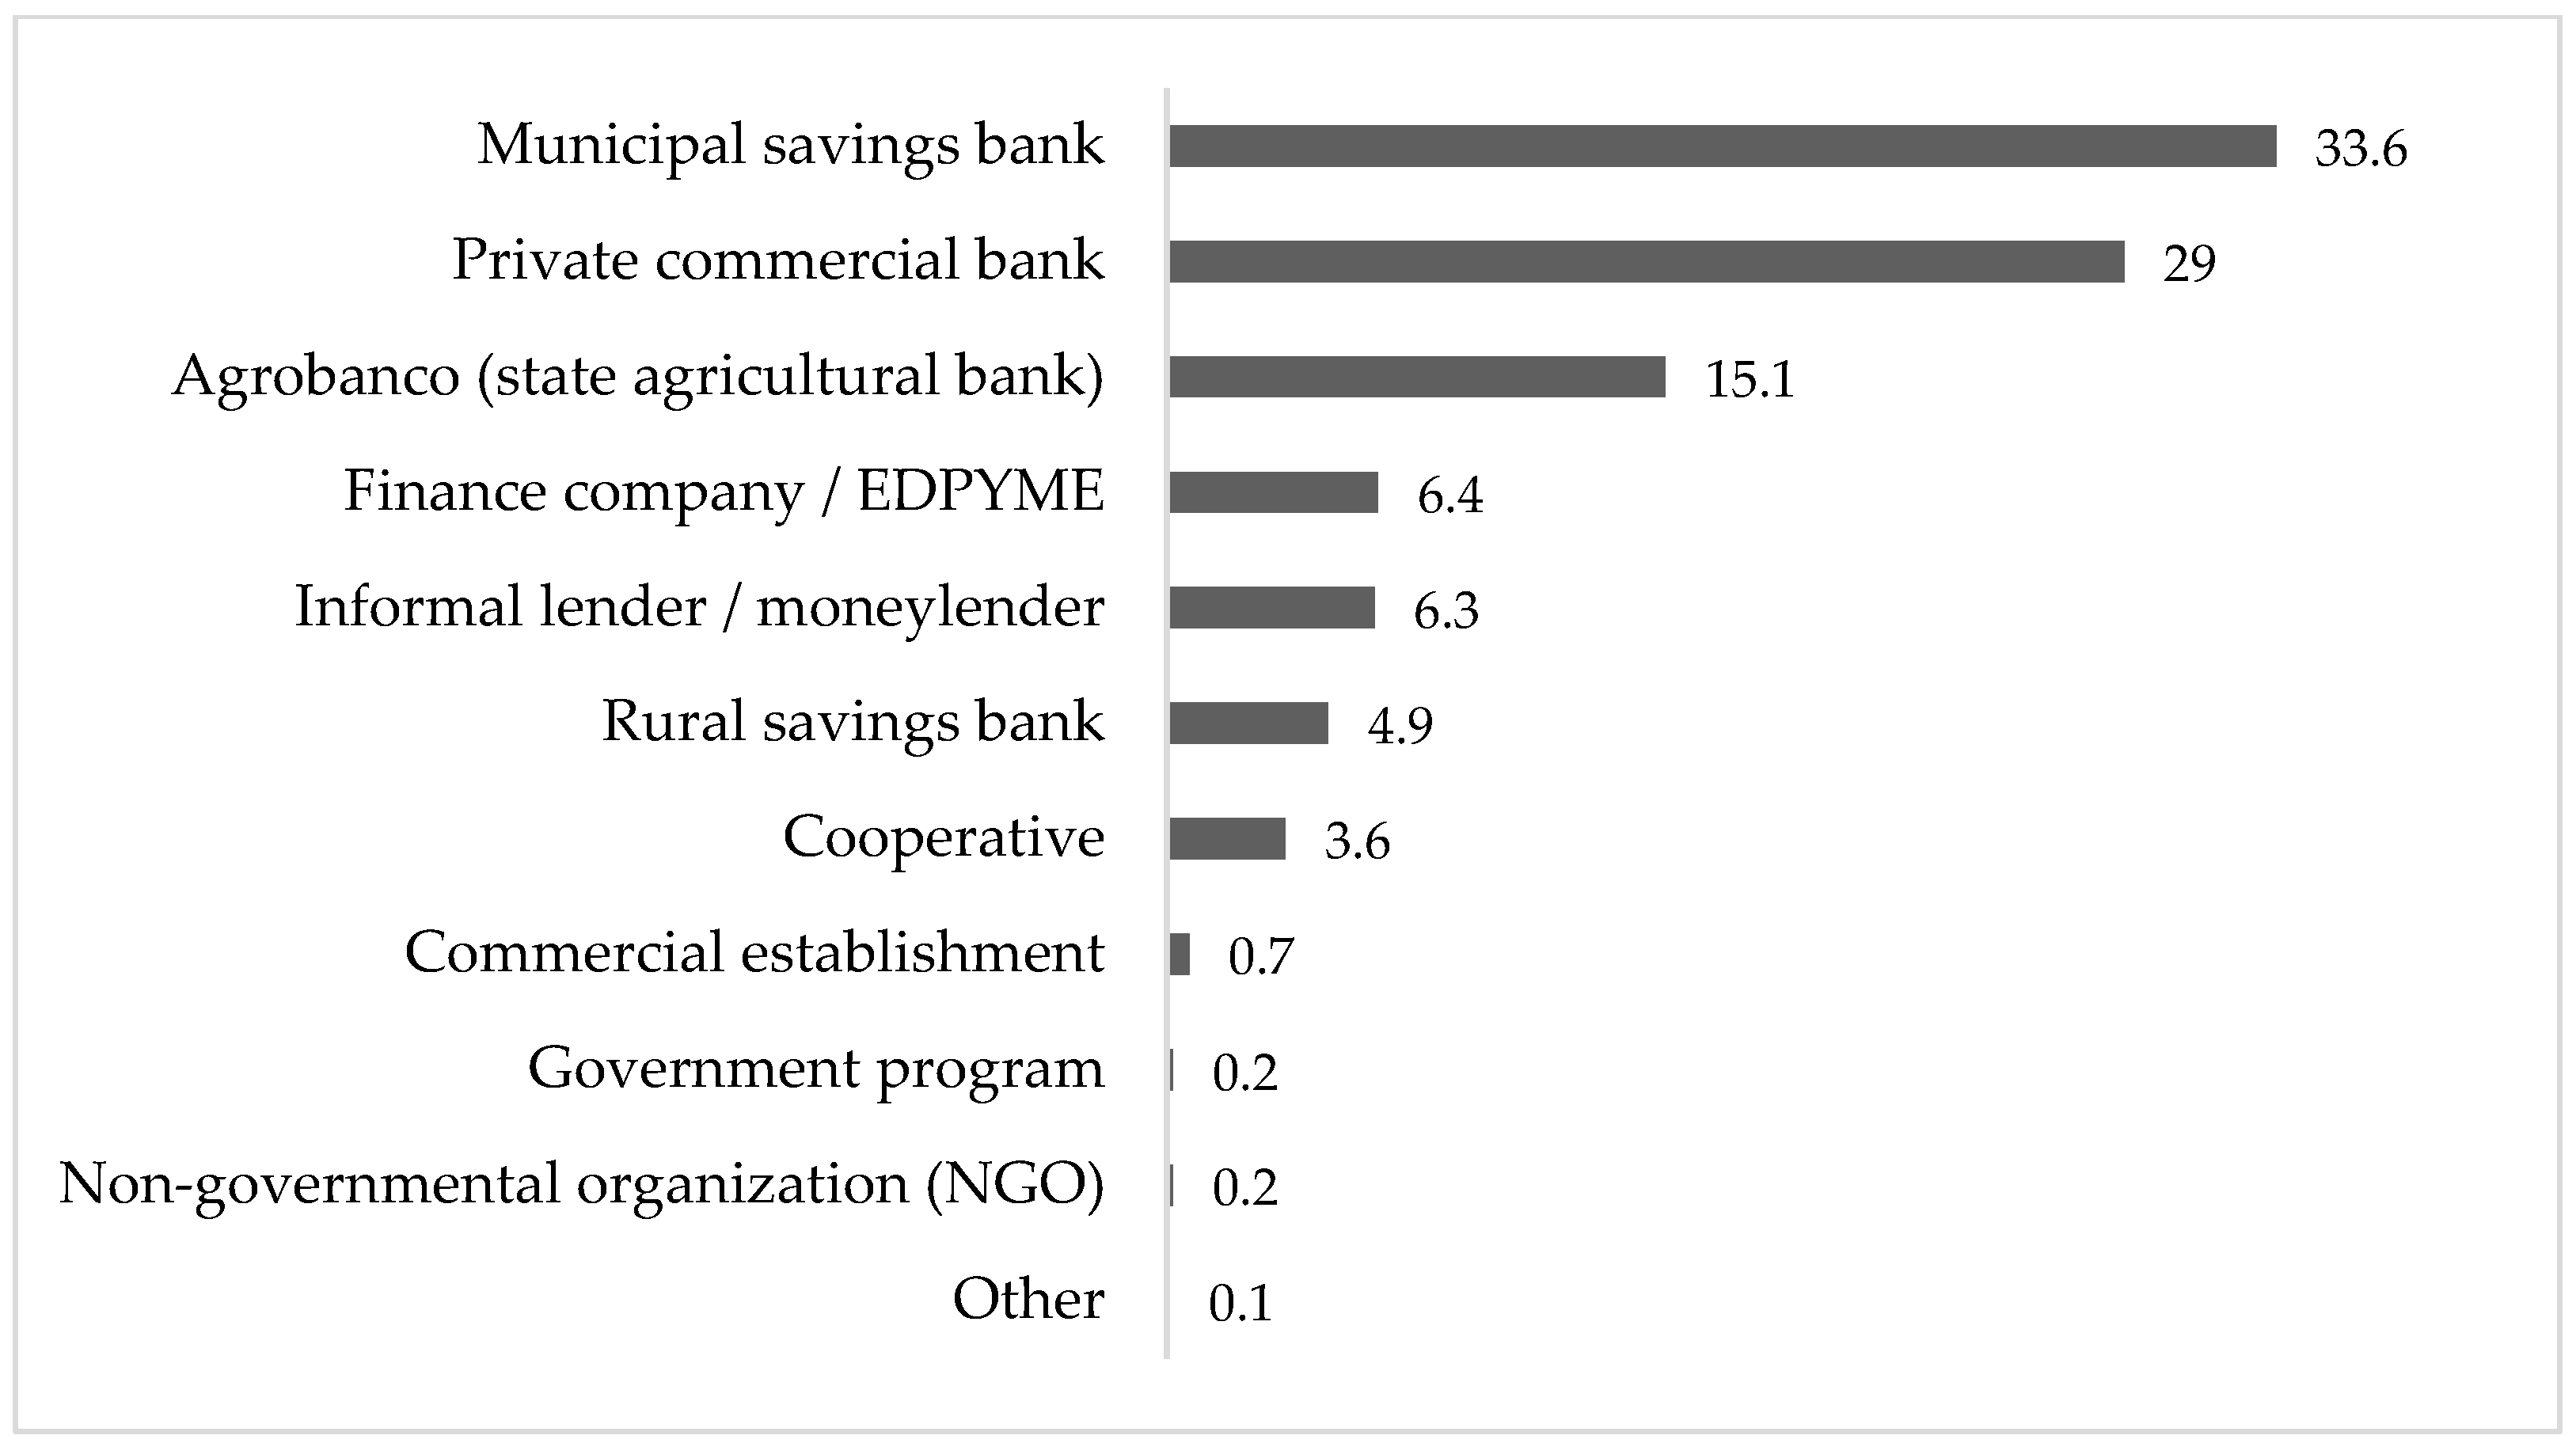
Figure 2 shows the distribution of reported credit providers among agricultural producers who received credit during the survey period. Credit sources include formal financial institutions, semi-formal providers, and informal lenders. The heterogeneous composition of credit providers highlights institutional diversity in agricultural credit access in Peru. Percentages are calculated only for treated producers.
Figure 2.
Credit providers among treated agricultural producers, percentage of treated producers.
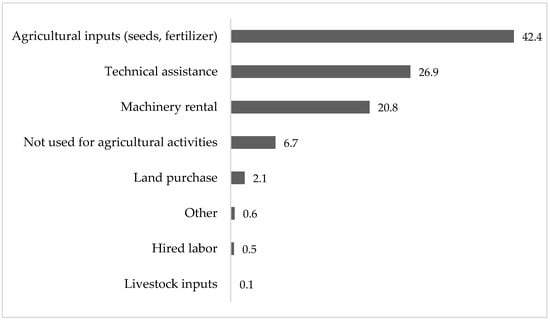
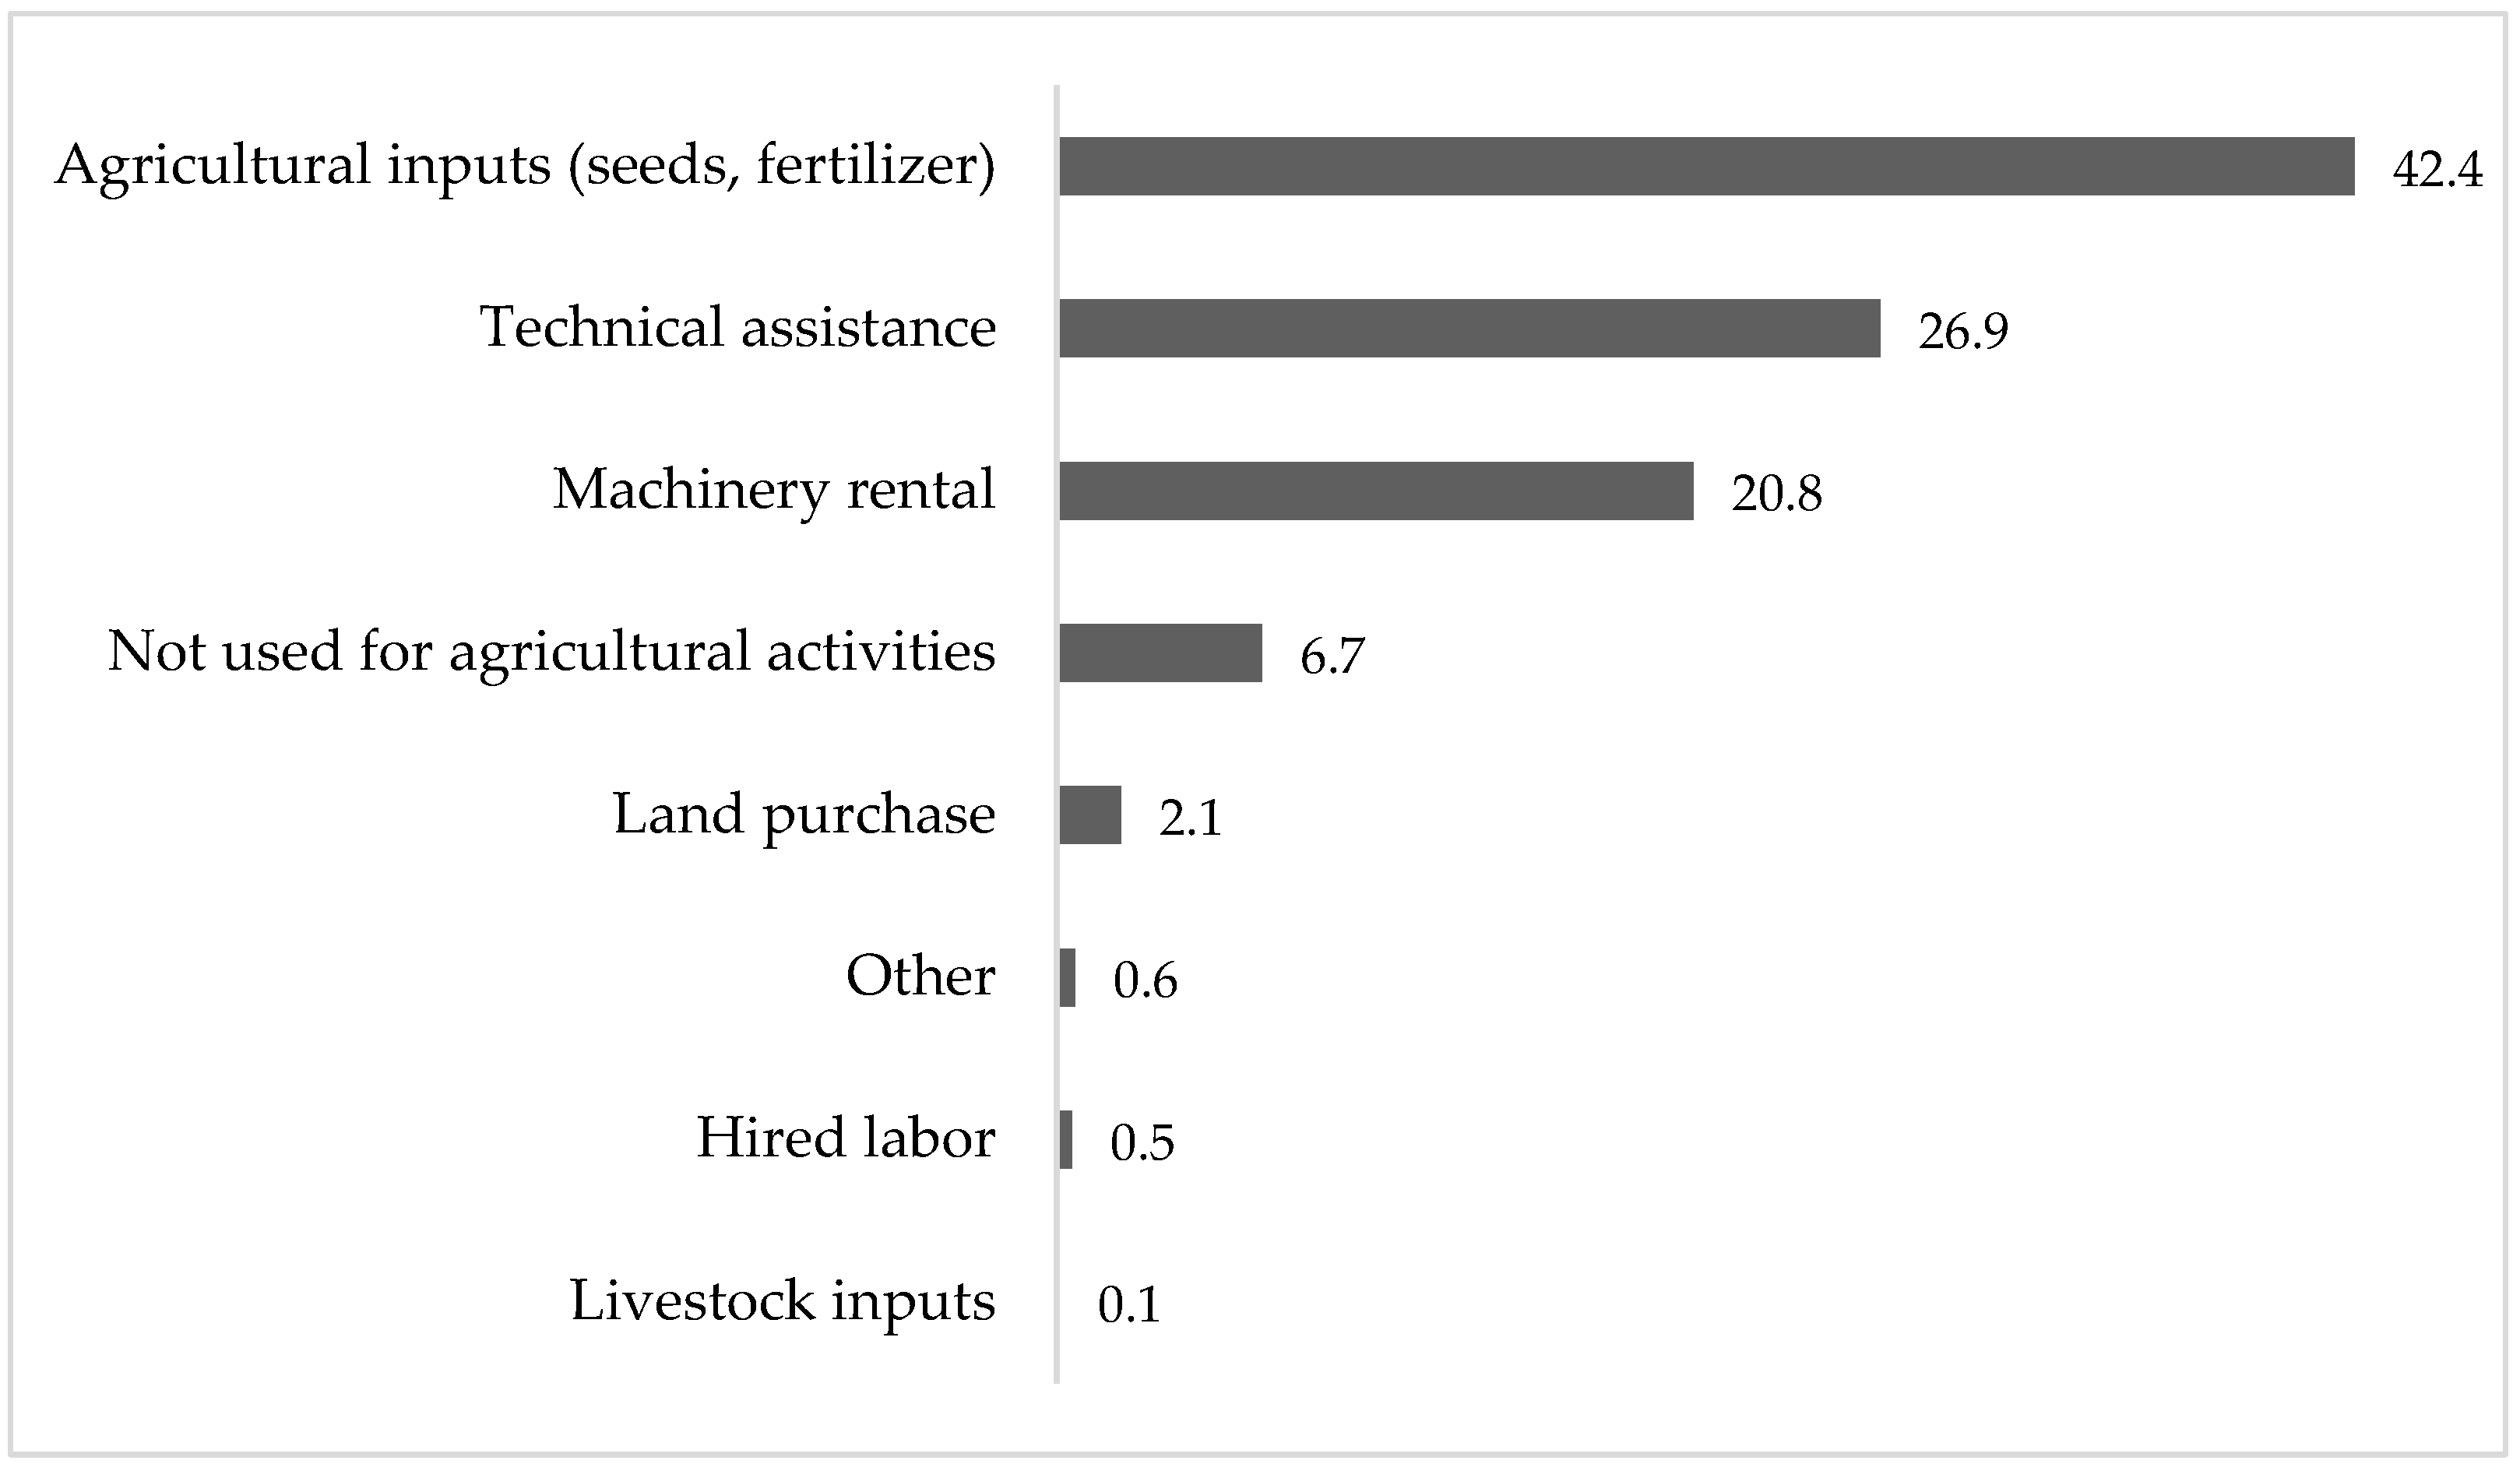
Figure 3 reports the main self-reported uses of agricultural credit among producers who received credit. Credit is primarily used to purchase agricultural inputs, technical assistance, and machinery rental, while long-term investments, such as land acquisition, are less frequent. Percentages are calculated only for treated producers.
Figure 3.
Use of agricultural credit among treated producers.
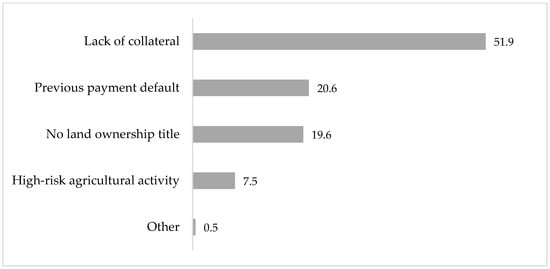
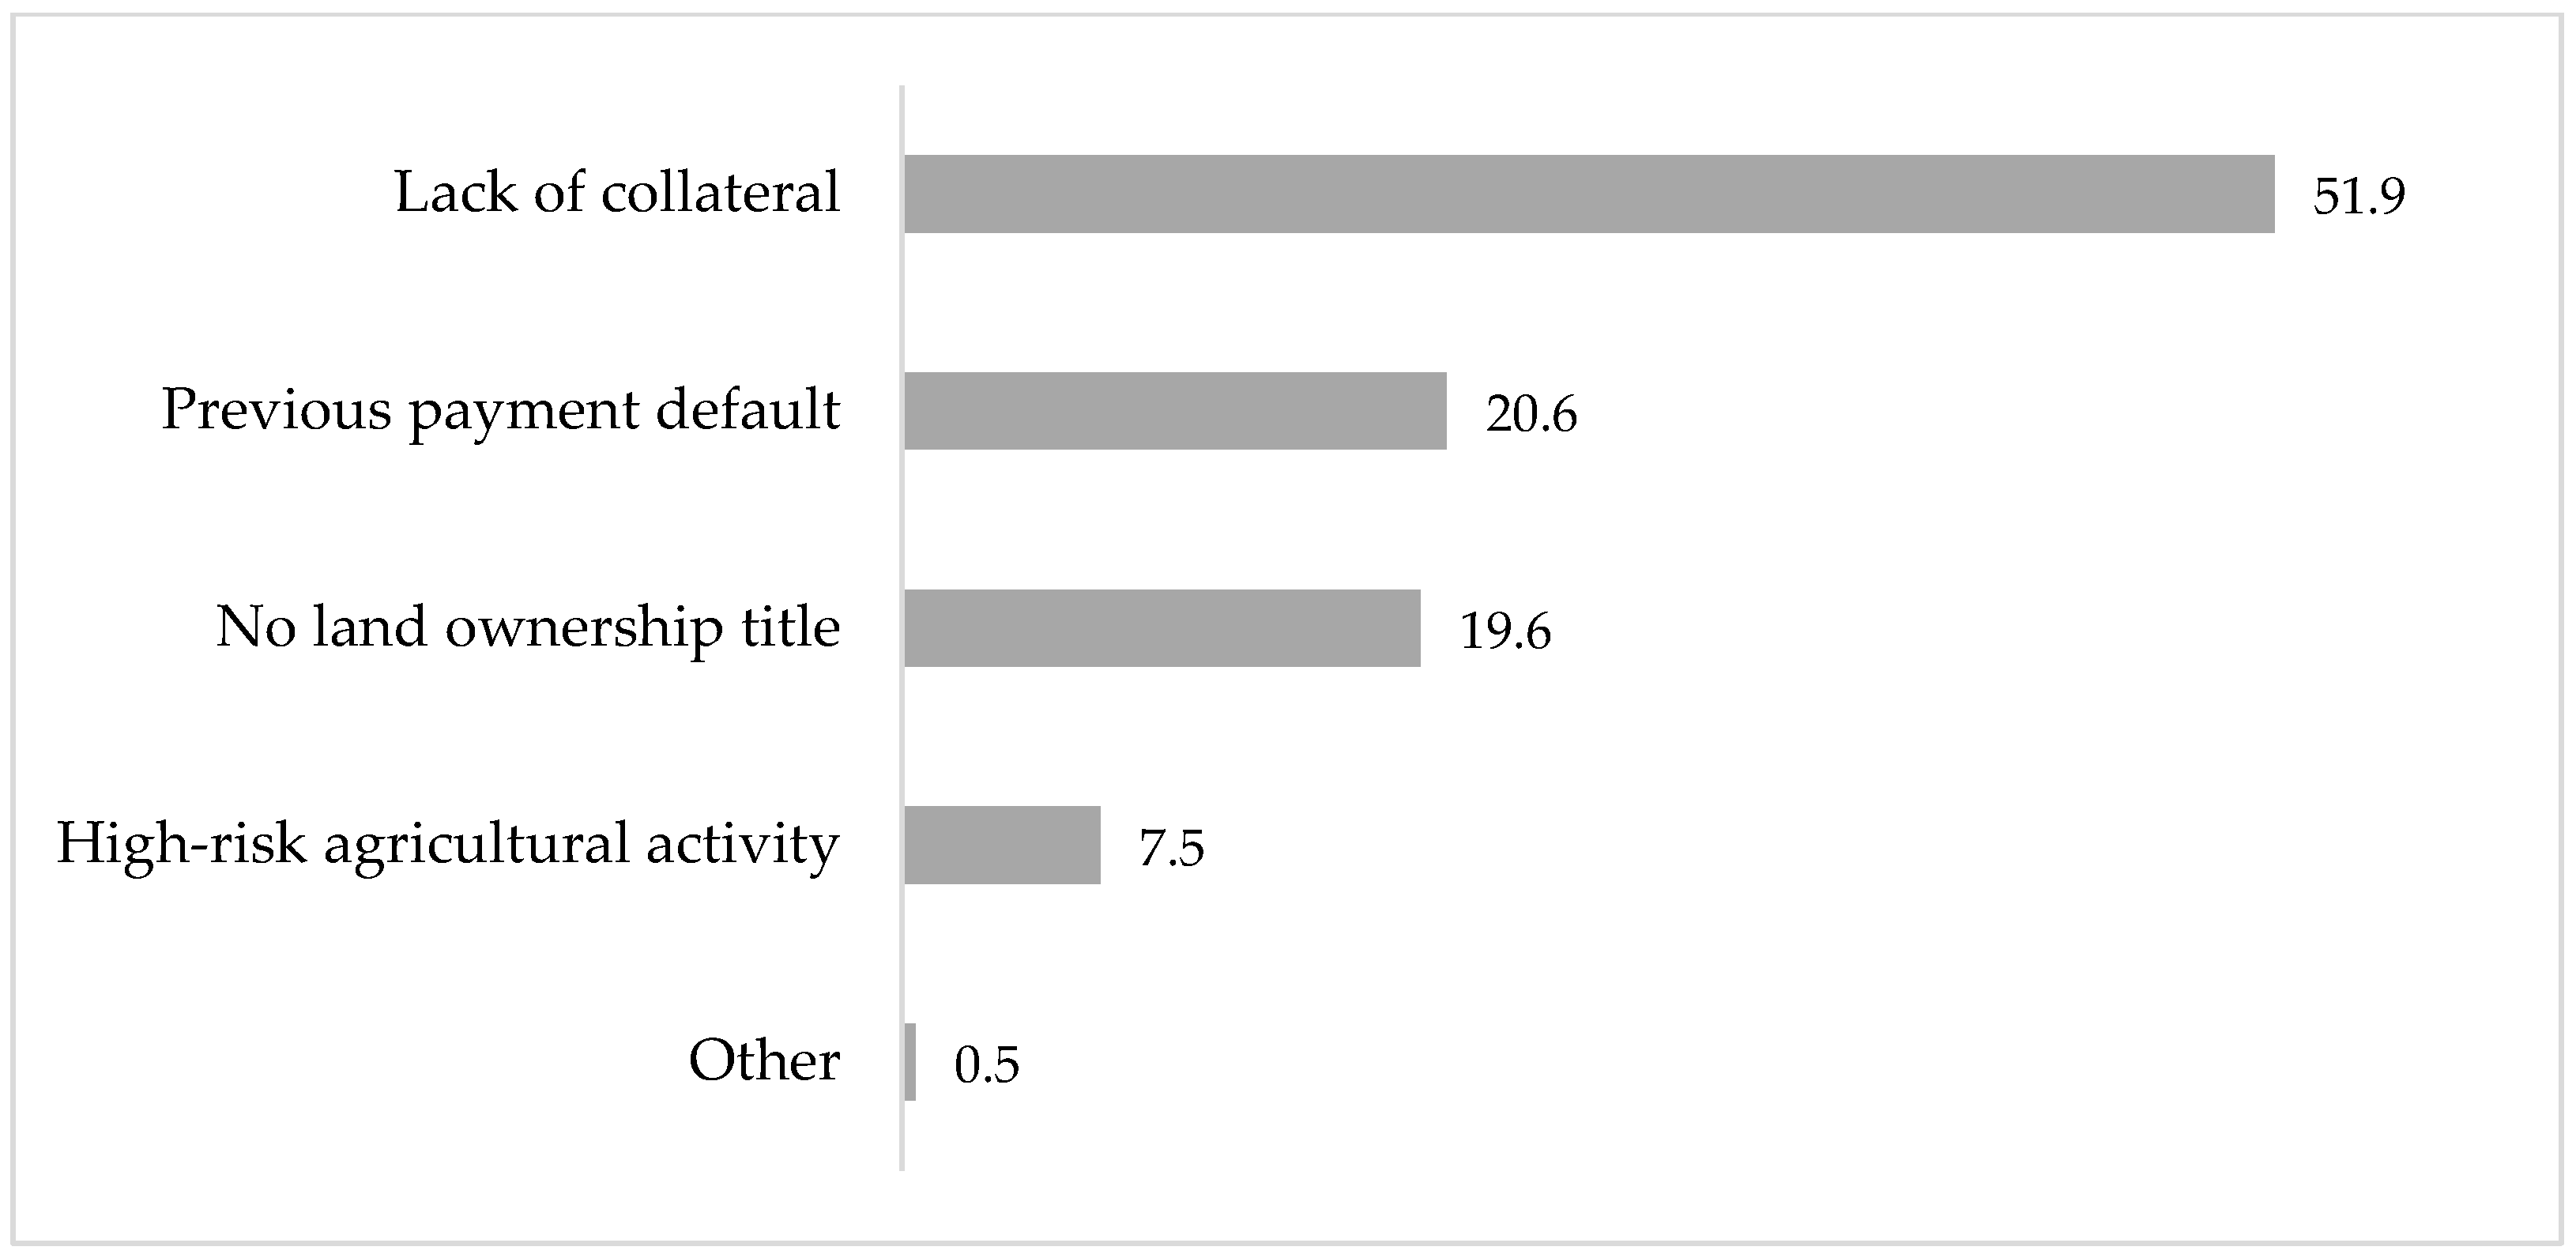
Figure 4 presents self-reported reasons for credit rejection among agricultural producers who did not receive credit. The most frequently cited constraints relate to lack of collateral, previous payment defaults, and insecure land tenure. Percentages are calculated among non-treated producers who report having applied for credit. These patterns highlight structural barriers to credit access and motivate the use of reweighting and doubly robust strategies in the impact analysis.
Figure 4.
Reasons for credit rejection among non-treated producers.
Together, Figure 2, Figure 3 and Figure 4 document key institutional features of agricultural credit markets in Peru. Credit provision is concentrated among formal financial institutions and public programs, while informal lenders remain significant. Borrowing is predominantly used for productive inputs, consistent with the hypothesized channels linking credit to agricultural performance. At the same time, credit rejection is largely driven by collateral constraints and credit history, underscoring non-random selection into treatment and motivating the reweighting and robustness strategies employed in subsequent sections.
Table 3 presents weighted descriptive statistics for agricultural producers in the pooled ENA 2022–2024 sample, reported separately for producers with and without access to agricultural credit. Continuous variables are shown as means with standard deviations, while categorical variables are reported as percentages.
Table 3.
Descriptive statistics by credit access status (ENA 2022–2024).
Producers with access to credit exhibit substantially higher levels of economic performance. Average land productivity and annual agricultural sales are significantly higher among treated producers, whereas control producers have lower income and productivity. Treated producers also cultivate fewer crops on average but operate on slightly larger cultivated areas, although the difference in land size is not statistically significant.
Clear differences also emerge in technology adoption and market orientation. Credit recipients exhibit markedly higher technology adoption index values, whereas differences in the management index are modest and not statistically significant. Treated producers are more likely to sell output in regional, national, and international markets, whereas non-treated producers rely more heavily on local markets or report uncertainty about their main sales destination.
With respect to producer characteristics, the treated and control groups differ along several observable dimensions. Credit recipients are slightly younger on average and live in larger households. Educational attainment is higher among treated producers, particularly at the secondary and tertiary levels. Land tenure arrangements also differ; treated producers are substantially more likely to rent land and less likely to operate under informal possession arrangements.
Finally, important geographic differences are observed. Conditional credit approval is more prevalent among producers in coastal regions, whereas producers in the jungle are disproportionately represented in the non-treated group. Department-level distributions further indicate pronounced spatial heterogeneity in credit access across Peru.
Taken together, these descriptive patterns underscore systematic differences between producers with and without access to credit, motivating careful adjustment for covariates before estimating causal effects.
5.2. Covariate Balance and Common Support
To support the credibility of the empirical strategy, this section assesses covariate balance between treated producers and observationally comparable controls, as well as the degree of common support in the data.
The regression estimates are based on the final complete-case sample (N = 1147), which is slightly smaller than the 1210 observations remaining after trimming and block restrictions due to missing outcome values, as discussed in Section 4.1.
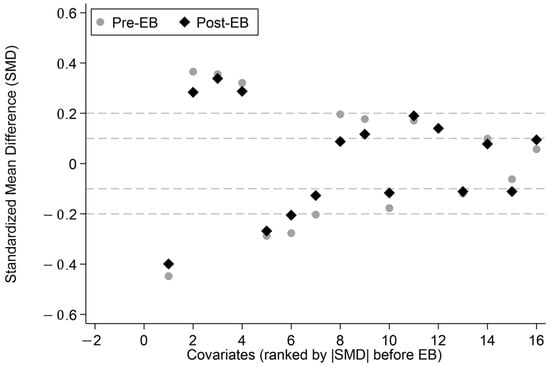
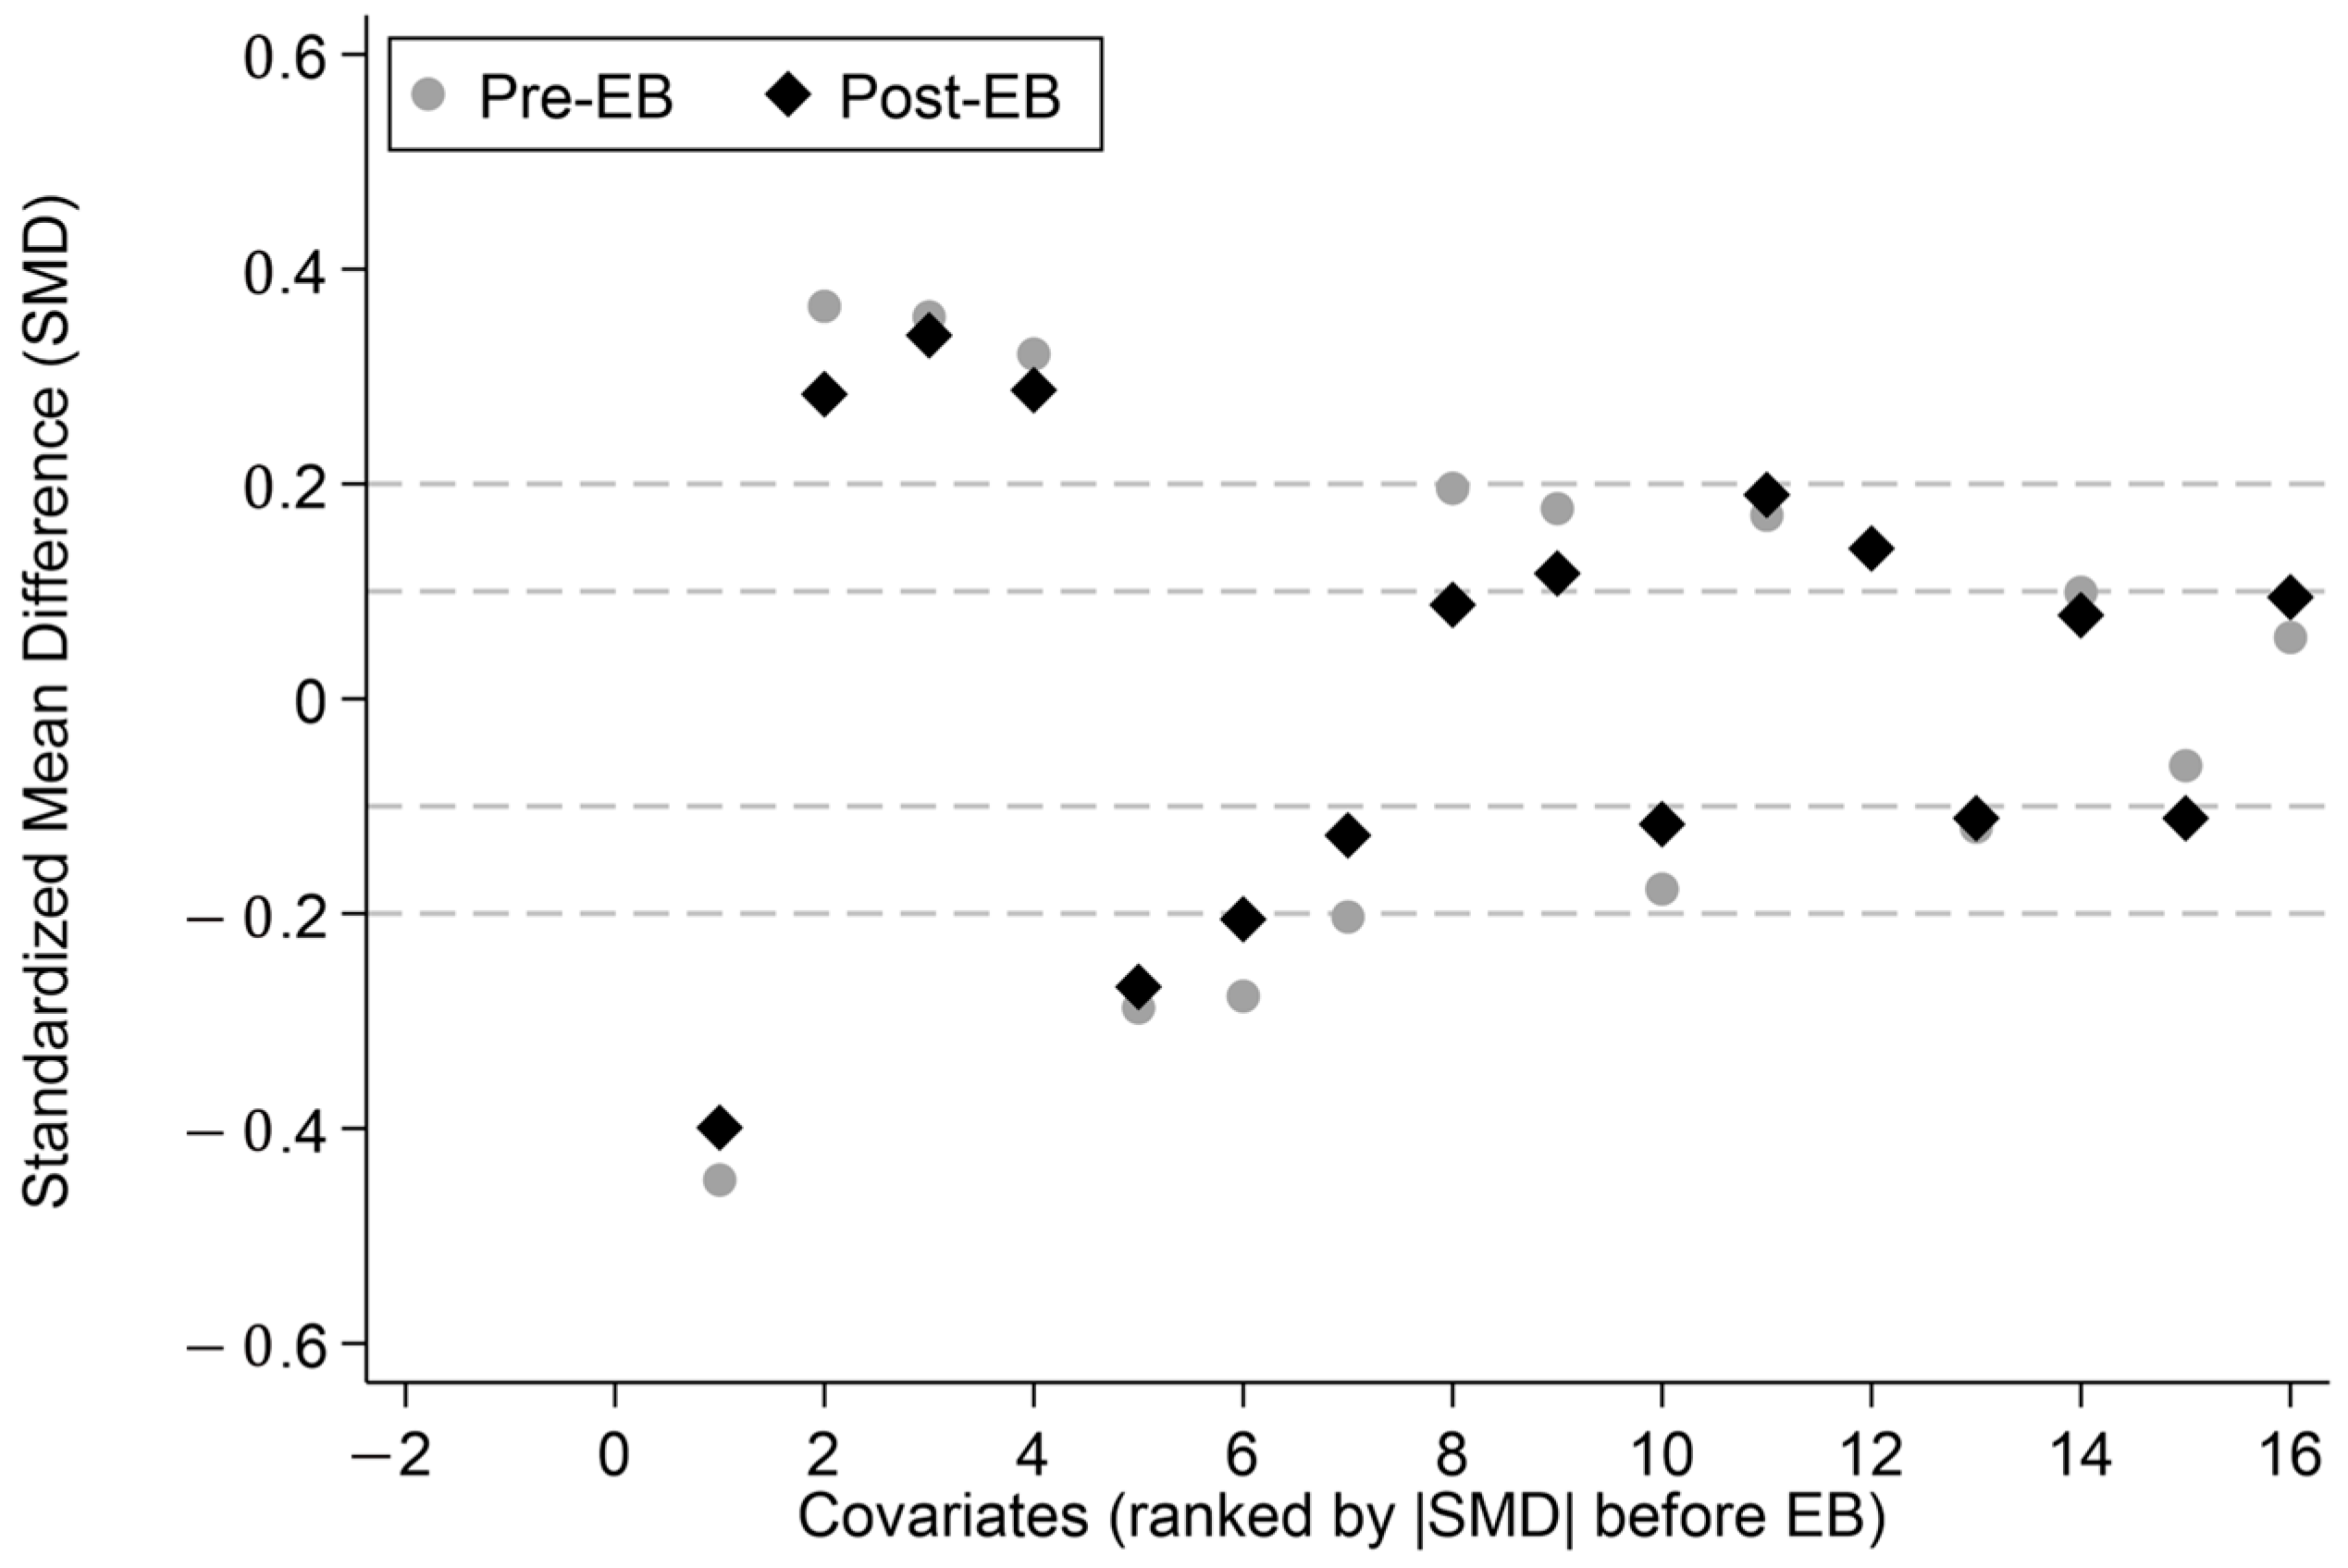
Covariate balance before and after entropy balancing is evaluated using standardized mean differences (SMDs). Table 4 reports weighted means and SMDs for the core set of pre-treatment covariates used in the reweighting procedure, while Figure 5 provides a graphical summary of balance improvements.
Table 4.
Covariate balance before and after entropy balancing.
Figure 5.
Covariate balance before and after entropy balancing.
Before reweighting, treated and control producers exhibit substantial differences across several key characteristics. Notable imbalances are observed in cultivated areas, educational attainment, land tenure status, and age, reflecting the strong selection into agricultural credit observed in the raw ENA data.
Entropy balancing improves balance across the core covariates. The mean absolute standardized mean difference decreases from 0.216 before reweighting to 0.185 after reweighting, and the maximum imbalance is reduced from 0.448 to 0.399. Although some moderate imbalance remains for a subset of covariates, this outcome reflects the intentionally parsimonious balancing strategy adopted in the main specification, combined with the limited overlap inherent in observational survey data with a highly skewed treatment share.
Figure 5 shows that post-entropy-balancing SMDs are systematically closer to zero than their pre-balancing counterparts. Although entropy balancing substantially reduces imbalance relative to the raw sample, post-weighting SMDs remain above conventional 0.10 thresholds for several covariates. This reflects structural limitations in the overlap of structures in a setting with high treatment prevalence. Accordingly, estimates should be interpreted as conditional associations within a restricted region of support rather than as approximations to experimental balance. Department fixed effects are excluded from the main balance table for brevity and are reported separately in Appendix A Table A4. In addition, the unweighted distribution of producers by department of origin between treated and control groups is reported in Appendix A Table A5.
To mitigate concerns arising from residual imbalance, all main outcome estimates are complemented with doubly robust specifications that remain consistent under partial misspecification of either the treatment or outcome model.
Although entropy balancing substantially improves covariate balance, some residual imbalance remains. This reflects the highly asymmetric treatment prevalence within the applicant-restricted sample and limited overlap in certain covariate dimensions. With a relatively small control group, imposing stricter moment conditions led to convergence difficulties and extreme weights, reducing the effective sample size. We therefore prioritize a parsimonious balancing strategy that improves mean balance while preserving estimator stability. Importantly, the similarity of results across doubly robust specifications and sensitivity analysis mitigates concerns that residual imbalance drives the main findings.
Credible estimation of treatment effects further requires sufficient overlap between treated producers and potential controls. To enforce common support, we apply a two-step restriction that combines propensity score trimming with a block-level support rule.
First, observations are trimmed outside the intersection of the treated and control propensity score distributions, defined by the 1st and 99th percentiles within each group. This step reduces sensitivity to extreme weights and limits extrapolation to regions with poor overlap.
Second, we impose a minimum control-count requirement within propensity score blocks, ensuring that each region of the treated distribution is supported by an adequate number of comparable control observations. Observations failing to meet this criterion are excluded from the final estimation sample.
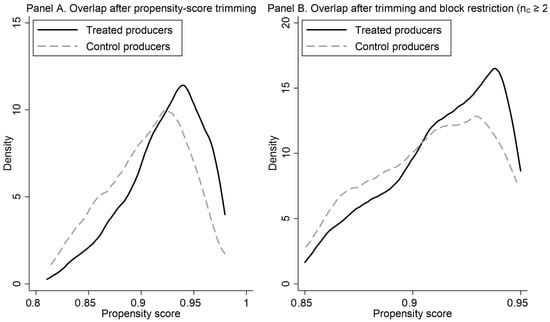
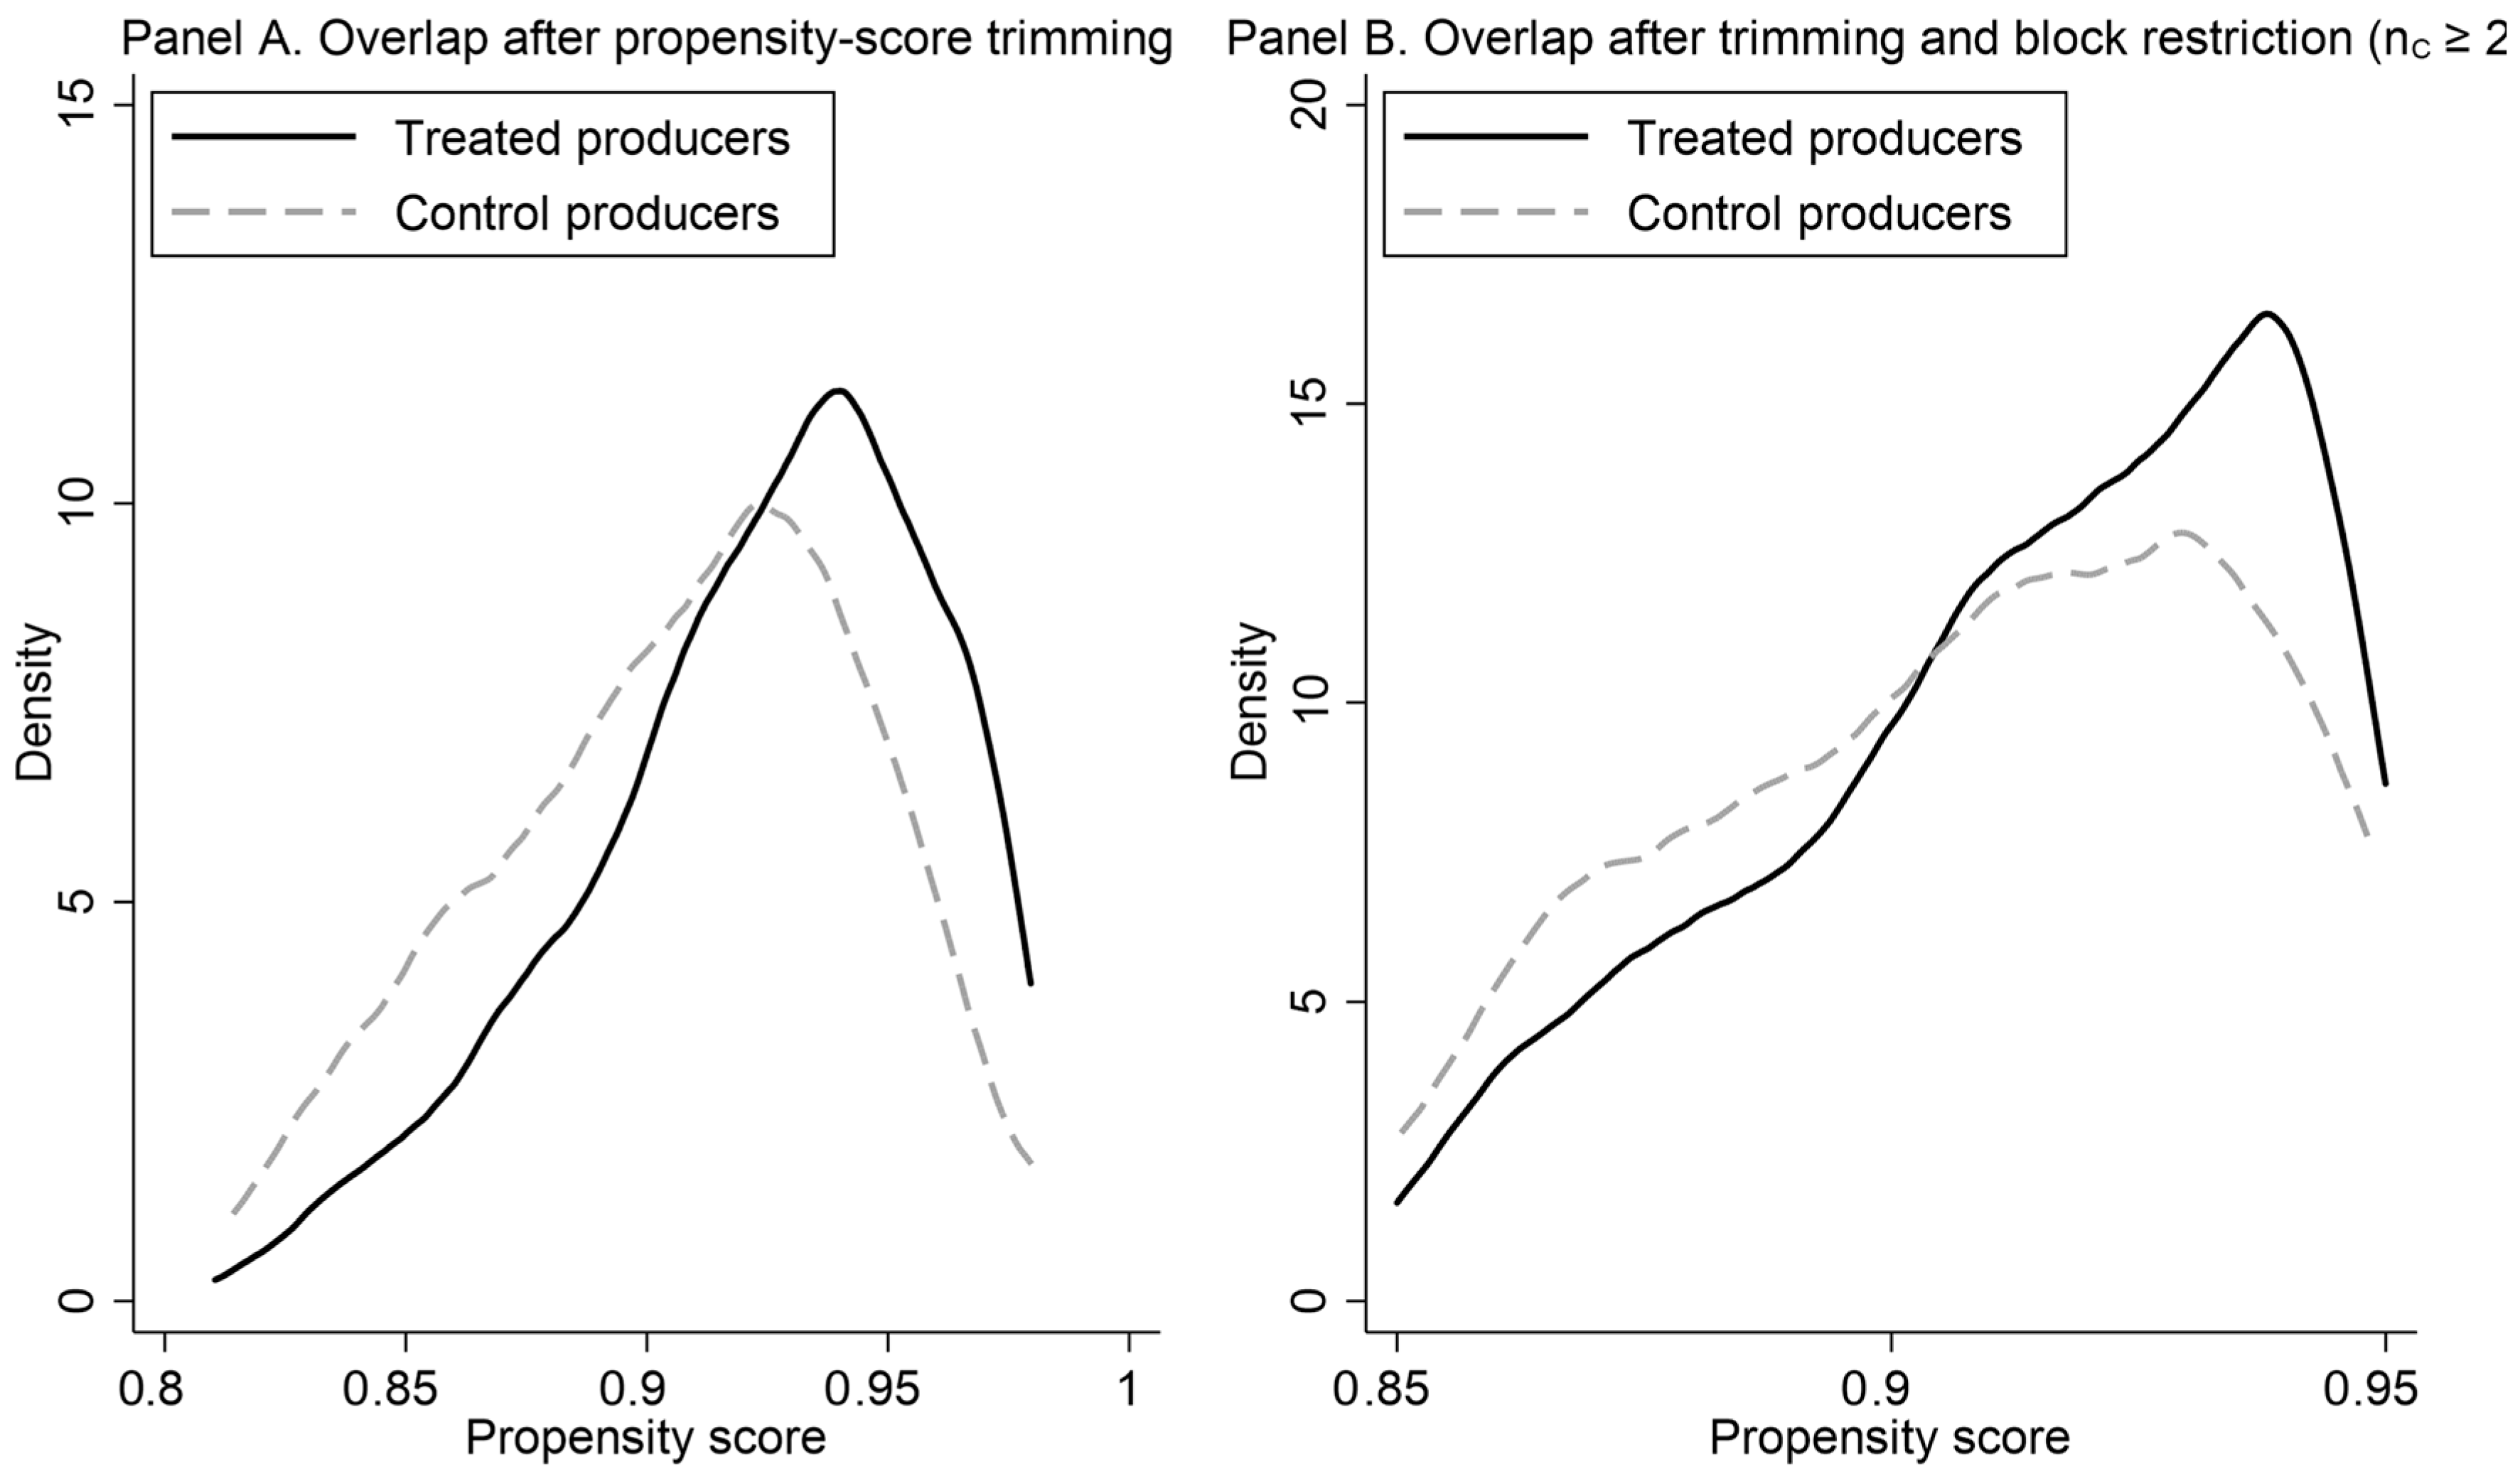
Figure 6 illustrates the propensity score distributions for treated and control producers before trimming and after imposing the common-support restriction. The figure shows that the support rule improves overlap between the two groups, particularly in the upper tail of the propensity score distribution.
Figure 6.
Common support diagnostics: propensity score overlap. Notes: Kernel density estimates of the propensity score for treated and control producers. Panel (A) shows overlap after trimming observations outside the common support. Panel (B) also imposes a minimum block-level control threshold (nC ≥ 20).
Overlap diagnostics are presented in Figure 6. After trimming and blocking restrictions, treated and control units exhibit substantial common support. The remaining sample represents applicants within the region of credible counterfactual comparison.
Table 5 documents the impact of these restrictions on the estimation sample. After propensity score trimming, the sample is reduced from 2835 to 1691 observations. The subsequent block restriction further reduces the sample to 1210 producers, comprising 1106 treated and 104 control observations. Panel B shows that all remaining treated observations fall within two propensity-score blocks that satisfy the minimum-support criterion.
Table 5.
Common support diagnostics and sample restrictions.
These restrictions define the final analysis sample used for entropy balancing and for all robustness estimators. While they reduce sample size, they substantially strengthen the credibility of the identifying comparison by ruling out regions of weak overlap and extreme extrapolation.
The final estimation sample contains 1106 treated and 104 control farmers after common-support restrictions. To assess whether the relatively small control group induces instability, we report the effective sample size (ESS) of the reweighted controls, which equals 100.19. This value is close to the nominal number of controls, indicating limited information loss due to weighting. We also examine the distribution of entropy balancing weights. The dispersion statistics (minimum, maximum, and percentile distribution) do not indicate extreme concentration in a small number of control units, suggesting that the estimates are not driven by a handful of heavily weighted observations. We additionally explored alternative trimming rules based on central propensity-score restrictions (e.g., retaining observations with estimated propensity scores between 0.2 and 0.8). However, imposing stricter trimming resulted in severe overlap violations and a drastic reduction in sample size (fewer than 20 observations satisfying the overlap condition). This suggests that the baseline common-support restriction already reflects a conservative compromise between overlap quality and sample retention.
5.3. Main Effects of Credit on Agricultural Outcomes
Table 6 reports the main estimates of the effect of credit approval, conditional on application, on agricultural income and land productivity, using entropy balancing combined with survey-weighted regressions. The analysis is restricted to producers within the common support region and accounts for ENA’s complex survey design.
Table 6.
Main effects of credit on income and land productivity.
Credit approval conditional on application is associated with a large and statistically significant increase in real agricultural income. Treated producers earn, on average, approximately 54 thousand additional soles per year (in 2024 prices) relative to observationally comparable non-treated producers. This effect is precisely estimated and economically meaningful, given the observed income distribution in the sample.
The estimated coefficient on log productivity is 0.472, which corresponds to an approximate 60.3% increase in land productivity. This semi-elasticity interpretation suggests that approved applicants exhibit substantially higher productivity relative to rejected applicants, conditional on covariates and survey design adjustments. While sizable, this estimate should be interpreted cautiously given the cross-sectional design and potential selection on unobservables. Given the cross-sectional design and the limited number of rejected applicants in the supported sample, this estimate should be interpreted cautiously and not as a population-wide productivity effect. Given the magnitude of semi-elasticity, part of the estimated association may reflect residual positive selection into credit approval among more productive applicants, even after conditioning on observables. Therefore, the productivity estimate should be interpreted as an upper-bound conditional association under the maintained identifying assumptions. Among additional controls, the managerial capacity index shows a strong, statistically significant association with both income and productivity, underscoring the importance of managerial and organizational capabilities in shaping agricultural performance. In contrast, local measures of financial access density—measured by the number of financial channels and service points—do not exhibit statistically significant associations after controlling for credit access and fixed effects.
Overall, these results provide consistent evidence that access to agricultural credit is positively associated with both income and productivity outcomes among Peruvian agricultural producers.
5.4. Robustness Checks: Doubly Robust Estimators
To assess the sensitivity of the main results to alternative identification strategies, we complement entropy balancing estimates with doubly robust estimators, namely Augmented Inverse Probability Weighting (AIPW) and Inverse Probability Weighted Regression Adjustment (IPWRA). These estimators combine treatment and outcome modeling and remain consistent if either component is correctly specified.
Table 7 reports the estimated effects of credit approval, conditional on application, on annual agricultural income and land productivity, using both approaches. For income, AIPW yields a positive but imprecisely estimated effect, whereas IPWRA indicates a positive and statistically significant effect, consistent in magnitude with the main entropy-balancing results. For land productivity, both estimators yield positive coefficients, with IPWRA producing statistically significant effects at conventional significance levels.
Table 7.
Robustness checks using doubly robust estimators.
The similarity of estimates across ATET- and ATE-based specifications suggests that results are not sensitive to the choice of estimand within the applicant sample.
Post-estimation balance diagnostics for AIPW and IPWRA are reported in Appendix A Table A6 and Table A7, respectively. These diagnostics do not necessarily show improved balance because AIPW/IPWRA do not target exact-moment balance; instead, they rely on the correct specification of either the treatment or the outcome model. Overall, these findings reinforce the robustness of the main conclusions regarding the positive association between credit access and farm performance.
The doubly robust specifications yield results that are broadly consistent with the entropy balancing estimates. The IPWRA estimates remain statistically significant for both income and productivity, while the AIPW estimates exhibit greater sensitivity across specifications. These differences likely reflect variation in finite-sample performance and weighting structure rather than fundamental changes in the underlying relationship. Accordingly, the evidence does not suggest an absence of effect but rather highlights estimator-specific variation.
Post-estimation balance diagnostics for IPWRA indicate looser covariate balance relative to entropy balancing, as expected, given that IPWRA prioritizes double robustness over exact moment balancing. Importantly, the increase in the effective number of control observations after reweighting suggests that results are not driven by a small number of extreme weights.
The substantive focus of the paper is on the effect of credit approval among applicants; thus, the ATET interpretation is primary.
5.5. Exploratory Mechanism Analysis: Technology Adoption
To explore whether access to credit is associated with higher technology adoption, we estimate a weighted linear regression of a composite technology adoption index on credit receipt. This analysis is explicitly exploratory and does not aim to establish a causal mediation pathway. The technology index is constructed using the principal components approach and normalized to the range 0–1.
Estimation follows the same empirical strategy as the main outcome models. Specifically, we restrict the sample to observations satisfying common support, apply entropy-balancing weights, and include year and department fixed effects. All models are estimated using survey-weighted regression with clustering at the primary sampling unit (PSU) level.
Results are reported in Table 8. Access to credit is positively associated with the technology adoption index, with an estimated coefficient of 0.028. The magnitude corresponds to approximately 2.8 percentage points of the index range and is statistically significant at the 10 percent level. While suggestive, this effect is modest and should be interpreted with caution.
Table 8.
Association between credit access and technology adoption.
Importantly, this exploratory association does not translate into a formal mediation claim. Given the limited statistical power and the absence of a clear causal effect on income or productivity in the doubly robust specifications, we interpret these results as indicative of a potential, albeit weak, technology channel rather than definitive evidence of mediation. Other mechanisms—such as credit use for liquidity smoothing, risk management, or non-productive expenditures—may play a more prominent role and warrant further investigation.
Because both credit approval and technological practices are measured within the same survey wave, temporal ordering cannot be established. As such, the technology index analysis should be interpreted as exploratory evidence of correlated behavioral patterns rather than a formally identified mechanism linking credit to productivity outcomes.
While IPWRA estimates remain statistically significant for income and productivity, the exploratory technology association does not exhibit consistent statistical significance across all specifications. Therefore, the interpretation of the mechanism should be treated cautiously.
5.6. Sensitivity to Unobserved Confounding
To assess the robustness of the estimates to potential unobserved confounding, we implement the Oster coefficient stability test. For productivity, the implied δ value is approximately 34, suggesting that unobserved factors would need to be substantially stronger than observables to fully attenuate the estimated effect. In contrast, for income, δ is approximately −5.25, indicating greater sensitivity to omitted variable bias. These results suggest that while the productivity association appears relatively stable, income effects should be interpreted with caution.
Given the cross-sectional design and the limited number of rejected applicants in the supported region, the findings are best interpreted as economically meaningful associations conditional on observables rather than definitive causal impacts.
6. Discussion
This paper evaluates the association between access to agricultural credit and producer outcomes in Peru using nationally representative survey data and a combination of entropy balancing and doubly robust estimators. The discussion situates empirical findings within the existing literature summarized in Table 1, highlighting areas of convergence, divergence, and novel contributions.
Income effects are sensitive to the doubly robust specification: the estimate is imprecise under AIPW but remains positive and statistically significant under IPWRA specifications. While several studies report positive income effects in selected contexts [29], others find weak, statistically insignificant, or highly context-dependent results once selection and targeting are accounted for [20,28].
The magnitude of the sensitivity parameter is consistent with recent applications of bounding approaches in development microeconometrics, where moderate to large δ values are interpreted as suggestive—though not definitive—evidence of robustness to omitted variable bias [12,13].
Our findings align more closely with the latter group. Although entropy-balanced regressions suggest a positive association between credit approval conditional on applicationand deflated annual sales income, this effect does not persist under augmented inverse probability weighting (AIPW), indicating sensitivity to identification assumptions. Similar attenuation has been documented in experimental and quasi-experimental studies where credit relaxes liquidity constraints but does not necessarily translate into higher net revenues in the short run [30,31].
Importantly, this pattern should not be interpreted as evidence that credit is irrelevant. Rather, it reinforces the view that income is an aggregate outcome shaped by multiple channels—prices, risk exposure, repayment obligations, and market access—that may dampen short-run gains even when production-related investments increase.
In contrast to income, land productivity exhibits more stable, statistically meaningful associations with credit access, particularly under entropy-balanced and IPWRA specifications. This result is consistent with studies emphasizing productivity rather than income as the primary margin of adjustment following credit expansion [32,33,34].
The magnitude of the estimated productivity effect in this study is comparable to findings from observational analyses in Latin America and South Asia that link credit access to improved input use, operational timeliness, and adoption of yield-enhancing practices [35,36]. However, as with income, productivity effects weaken under the most conservative doubly robust estimator, underscoring the importance of overlap and common support in highly unbalanced treatment settings.
This partial convergence suggests that credit may primarily operate through production efficiency rather than scale expansion, particularly among small and medium producers facing structural constraints in land markets and commercialization.
The exploratory analysis of technology adoption yields suggestive but statistically weak evidence that credit is associated with higher adoption of agricultural technologies. This finding mirrors the mixed results reported in the literature. While some studies document strong links between credit access and technology uptake [19,37], others highlight that adoption depends critically on complementary inputs such as extension services, managerial capacity, and risk-sharing mechanisms [38,39].
In this study, the technology index responds positively to credit access in survey-weighted regressions, but the effect remains marginal and does not support formal causal mediation. This suggests that credit alone may be insufficient to induce substantial technological upgrading, particularly in contexts where knowledge constraints and risk aversion remain binding. These results are consistent with recent syntheses emphasizing that financial access is a necessary but not sufficient condition for sustained productivity growth [20,40].
A novel contribution of this paper is the descriptive documentation of credit-rejection mechanisms among untreated producers. The predominance of collateral shortages, insecure land tenure, and prior repayment issues as reasons for rejection closely mirrors theoretical models of credit rationing [41] and empirical evidence from rural credit markets in developing countries [27,42].
These findings help contextualize the modest average treatment effects observed in the main analysis. Credit recipients are not drawn from a pool of observationally identical producers; rather, they are selectively screened based on institutional criteria that correlate with risk, formality, and asset ownership. As a result, expanding credit access without addressing these structural barriers may alter participation margins without necessarily generating large average income gains.
By explicitly documenting reasons for rejection using nationally representative data, this paper complements impact estimates with institutional evidence that is often absent from evaluation studies.
7. Limitations and Caveats
Despite the use of advanced reweighting and doubly robust estimators, the findings of this study should be interpreted in light of several limitations inherent to the data and identification strategy.
First, the analysis relies on observational survey data, and causal interpretation rests on the assumption of conditional confoundedness. While entropy balancing achieves substantial balance on a rich set of pre-treatment covariates—including producer characteristics, farm resources, location, and time fixed effects—it cannot account for unobserved factors such as entrepreneurial ability, risk preferences, or informal networks that may jointly influence credit approval conditional on application and outcomes. Doubly robust estimators mitigate sensitivity to model misspecification, but they do not eliminate bias arising from unobserved confounding.
Second, the treatment shared in the ENA data is highly unbalanced, with a relatively small pool of comparable control producers. Although we impose strict common-support rules—propensity-score trimming and minimum control counts within blocks—some degree of limited overlap remains. As a result, estimates should be interpreted as local average treatment effects for producers operating in regions with sufficient support, rather than as population-wide effects.
Third, outcome variables are measured at a single point in time and reflect short-run associations. Income and productivity may respond to credit with lags that are not captured in cross-sectional data, particularly for investments with longer gestation periods. In addition, income is self-reported and may be subject to recall error, while productivity proxies based on sales per hectare may not fully capture agronomic efficiency.
Fourth, the analysis of mechanisms—particularly technology adoption—is explicitly exploratory. Although we document associations consistent with hypothesised channels, the data do not support formal causal mediation analysis. Consequently, results on mechanisms should be interpreted as suggestive rather than definitive evidence on how credit affects outcomes.
Fifth, the reduction in sample size due to applicant restriction and common-support enforcement limits external validity. The estimated effects apply to credit applicants within the supported region and may not generalize to non-applicants or to producers with extreme propensity scores.
Finally, while the ENA provides nationally representative coverage of agricultural producers in Peru, institutional features of credit markets—such as collateral requirements, land tenure regimes, and the structure of financial intermediaries—vary across countries. Therefore, extrapolation of the results to other contexts should be undertaken with caution.
8. Conclusions
This study estimates the conditional effect of credit approval on agricultural income and land productivity among applicants within a selection-on-observables framework using nationally representative ENA data. After restricting the sample to producers who applied for credit and implementing entropy balancing with common-support restrictions, we find positive and statistically significant effects on annual income and productivity. While IPWRA estimates remain statistically significant, AIPW estimates are less precise and not statistically distinguishable from zero in some specifications. This suggests moderate sensitivity to modeling assumptions rather than complete robustness across all doubly robust approaches. Together, the findings indicate that credit approval within the applicant pool is associated with measurable economic gains, albeit under strong identification assumptions. The results indicate that access to credit is associated with higher farm income and modest productivity gains among producers operating in regions with sufficient common support. Results are qualitatively consistent across specifications, although statistical significance and precision vary, particularly under AIPW. The technology results should be interpreted as exploratory correlations rather than causal mediation evidence. At the same time, descriptive evidence on credit rejection highlights the central role of collateral constraints and land tenure insecurity in shaping access to formal finance.
Several policy-relevant insights emerge from these findings. First, the results suggest that expanding access to credit alone is unlikely to generate large productivity gains unless accompanied by complementary interventions that address structural constraints faced by small and medium agricultural producers. Limitations related to land titling, guarantees, and risk management appear to be critical bottlenecks that restrict both credit access and its effective use.
Second, the heterogeneity in outcomes and the documented reasons for credit rejection underscore the need to improve the targeting and design of agricultural finance instruments. Policies that reduce collateral requirements, strengthen land tenure formalization, or expand guarantee schemes may be more effective than broad credit expansion in reaching financially constrained but potentially productive producers. In this sense, public development banks and state-backed programs may play a catalytic role by crowding private lenders rather than substituting for them.
Finally, the analysis underscores the need for richer longitudinal data to better understand the dynamic effects of credit and the mechanisms through which it operates. Future research would benefit from panel data or experimental designs that allow for the explicit study of investment timing, technology adoption, and longer-term productivity trajectories.
Overall, while credit remains a central component of agricultural development strategies, this study highlights that its impacts are conditional on institutional context and complementary inputs. Carefully designed credit policies, embedded within broader rural development frameworks, are more likely to deliver sustained gains in income and productivity.
Author Contributions
Conceptualization, P.R. and J.-A.C.T.; data curation, P.R. and C.A.; formal analysis, P.R. and C.A.; funding acquisition, J.-A.C.T., J.O.-B. and M.A.T.S.; investigation, P.R., J.O.-B. and M.A.T.S.; methodology, P.R., C.A. and L.G.; project administration, P.R., J.-A.C.T. and J.O.-B.; resources, J.O.-B., M.A.T.S. and J.-A.C.T.; software, P.R. and C.A.; supervision, J.-A.C.T., J.O.-B. and M.A.T.S.; validation, P.R. and L.G.; visualization, P.R.; writing—original draft preparation, P.R.; writing—review and editing, P.R., C.A., L.G. and J.-A.C.T. All authors have read and agreed to the published version of the manuscript.
Funding
The authors gratefully acknowledge the support provided by the Programa PIADER—Unidad Ejecutora de Gestión de Proyectos Sectoriales (UEGPS) del Ministerio de Desarrollo Agrario y Riego del Perú, within the framework of “Concurso de Investigaciones sobre Resultados de la Encuesta Nacional Agropecuaria—ENA” under N° OS-2675-2025, and the APC was funded by the Vicerrectorado de Investigación of the Universidad Nacional Toribio Rodríguez de Mendoza de Amazonas.
Informed Consent Statement
Not applicable.
Data Availability Statement
Publicly available datasets were analyzed in this study. The data are available from Peru’s Encuesta Nacional Agropecuaria (ENA), 2022–2024, published by the National Institute of Statistics and Informatics (INEI). The processed analytical dataset and coding details are available from the corresponding author upon reasonable request.
Conflicts of Interest
The authors declare no conflicts of interest.
Appendix A
Table A1.
Variable definitions and construction (treatment, outcomes, covariates).
Table A2.
Comparison of Full, Applicant, and Final Estimation Samples.
Table A3.
Entropy Balancing Weight Diagnostics (Control Group).
Table A4.
Full covariate balance before and after entropy balancing.
Table A5.
Balance by department of origin.
Table A6.
Post-estimation covariate balance: AIPW.
Table A7.
Post-estimation covariate balance: IPWRA.
References
- Carter, M.R.; Barrett, C.B. The economics of poverty traps and persistent poverty: An asset-based approach. J. Dev. Stud. 2006, 42, 178–199. [Google Scholar] [CrossRef] [Scilit]
- Dercon, S. Income Risk, Coping Strategies, and Safety Nets. World Bank Res. Obs. 2002, 17, 141–166. [Google Scholar] [CrossRef] [Scilit]
- Imbens, G.W.; Wooldridge, J.M. Recent developments in the econometrics of program evaluation. J. Econ. Lit. 2009, 47, 5–86. [Google Scholar] [CrossRef] [Scilit]
- Feder, G.; Just, R.E.; Zilberman, D. Adoption of agricultural innovations in developing countries: A survey. Econ. Dev. Cult. Change 1985, 33, 255–298. [Google Scholar] [CrossRef] [Scilit]
- Hainmueller, J. Entropy Balancing for Causal Effects: A Multivariate Reweighting Method to Produce Balanced Samples in Observational Studies. Political Anal. 2012, 20, 25–46. [Google Scholar] [CrossRef] [Scilit]
- Lumley, T. Complex Surveys: A Guide to Analysis Using R; John Wiley & Sons: Hoboken, NJ, USA, 2011. [Google Scholar]
- Bang, H.; Robins, J.M. Doubly Robust Estimation in Missing Data and Causal Inference Models. Biometrics 2005, 61, 962–973. [Google Scholar] [CrossRef] [Scilit]
- Imai, K.; Keele, L.; Yamamoto, T. Identification, Inference and Sensitivity Analysis for Causal Mediation Effects. Stat. Sci. 2010, 25, 51–71. [Google Scholar] [CrossRef] [Scilit]
- Abadie, A.; Cattaneo, M.D. Econometric Methods for Program Evaluation. Annu. Rev. Econom. 2018, 10, 465–503. [Google Scholar] [CrossRef] [Scilit]
- Austin, P.C.; Stuart, E.A. Moving towards best practice when using inverse probability of treatment weighting (IPTW) using the propensity score to estimate causal treatment effects in observational studies. Stat. Med. 2015, 34, 3661–3679. [Google Scholar] [CrossRef] [Scilit]
- Funk, M.J.; Westreich, D.; Wiesen, C.; Stürmer, T.; Brookhart, M.A.; Davidian, M. Doubly Robust Estimation of Causal Effects. Am. J. Epidemiol. 2011, 173, 761–767. [Google Scholar] [CrossRef] [Scilit]
- Oster, E. Unobservable Selection and Coefficient Stability: Theory and Evidence. J. Bus. Econ. Stat. 2019, 37, 187–204. [Google Scholar] [CrossRef] [Scilit]
- Cinelli, C.; Hazlett, C. Making Sense of Sensitivity: Extending Omitted Variable Bias. J. R. Stat. Soc. Ser. B Stat. Methodol. 2020, 82, 39–67. [Google Scholar] [CrossRef] [Scilit]
- Boucher, S.R.; Guirkinger, C.; Trivelli, C. Direct Elicitation of Credit Constraints: Conceptual and Practical Issues with an Application to Peruvian Agriculture. Econ. Dev. Cult. Change 2009, 57, 609–640. [Google Scholar] [CrossRef] [Scilit]
- Diagne, A.; Zeller, M. Access to Credit and Its Impact on Welfare in Malawi [Internet]. 2001. Report. Available online: https://hdl.handle.net/10568/158034 (accessed on 2 March 2026).
- Ali, D.A.; Deininger, K.; Duponchel, M. Credit Constraints and Agricultural Productivity: Evidence from rural Rwanda. J. Dev. Stud. 2014, 50, 649–665. [Google Scholar] [CrossRef] [Scilit]
- Burgess, R.; Pande, R. Do rural banks matter? Evidence from the Indian social banking experiment. Am. Econ. Rev. 2005, 95, 780–795. [Google Scholar] [CrossRef] [Scilit]
- Kaboski, J.P.; Townsend, R.M. The Impact of Credit on Village Economies. Am. Econ. J. Appl. Econ. 2012, 4, 98–133. [Google Scholar] [CrossRef] [Scilit]
- Giné, X.; Yang, D. Insurance, credit, and technology adoption: Field experimental evidencefrom Malawi. J. Dev. Econ. 2009, 89, 1–11. [Google Scholar] [CrossRef] [Scilit]
- Banerjee, A.; Duflo, E.; Glennerster, R.; Kinnan, C. The Miracle of Microfinance? Evidence from a Randomized Evaluation. Am. Econ. J. Appl. Econ. 2015, 7, 22–53. [Google Scholar] [CrossRef] [Scilit]
- Carter, M.R.; Laajaj, R.; Yang, D. Subsidies and the Persistence of Technology Adoption: Field Experimental Evidence from Mozambique [Internet]. 2014. Report. Available online: http://faostat.fao.org/site/422/default.aspx#ancor (accessed on 15 December 2025).
- Mobarak, A.M.; Rosenzweig, M. Risk, Insurance and Wages in General Equilibrium; Report; National Bureau Of Economic Research: Cambridge, MA, USA, 2014. [Google Scholar] [CrossRef] [Scilit]
- Beaman, L.; Karlan, D.; Thuysbaert, B.; Udry, C. Selection Into Credit Markets: Evidence from Agriculture in Mali. Econometrica 2023, 91, 1595–1627. [Google Scholar] [CrossRef] [Scilit]
- Angelucci, M.; Karlan, D.; Zinman, J. Microcredit Impacts: Evidence from a Randomized Microcredit Program Placement Experiment by Compartamos Banco. Am. Econ. J. Appl. Econ. 2015, 7, 151–182. [Google Scholar] [CrossRef] [Scilit]
- Karlan, D.; Zinman, J. Expanding Credit Access: Using Randomized Supply Decisions to Estimate the Impacts. Rev. Financ. Stud. 2010, 23, 433–464. Available online: http://www.jstor.org/stable/40468313 (accessed on 15 December 2025). [CrossRef] [Scilit]
- Augsburg, B.; De Haas, R.; Harmgart, H.; Meghir, C. The Impacts of Microcredit: Evidence from Bosnia and Herzegovina. Am. Econ. J. Appl. Econ. 2015, 7, 183–203. [Google Scholar] [CrossRef] [Scilit]
- Guirkinger, C.; Boucher, S.R. Credit constraints and productivity in Peruvian agriculture. Agric. Econ. 2008, 39, 295–308. [Google Scholar] [CrossRef] [Scilit]
- Karlan, D.; Osei, R.; Osei-Akoto, I.; Udry, C. Agricultural Decisions after Relaxing Credit and Risk Constraints. Q. J. Econ. 2014, 129, 597–652. [Google Scholar] [CrossRef] [Scilit]
- Khandker, S.R.; Koolwal, G.B. How has microcredit supported agriculture? Evidence using panel data from Bangladesh. Agric. Econ. 2016, 47, 157–168. [Google Scholar] [CrossRef] [Scilit]
- Meager, R. Understanding the average impact of microcredit expansions: A Bayesian hierarchical analysis of seven randomized experiments. Am. Econ. J. Appl. Econ. 2019, 11, 57–91. [Google Scholar] [CrossRef] [Scilit]
- Crépon, B.; Devoto, F.; Duflo, E.; Parienté, W. Estimating the Impact of Microcredit on Those Who Take It Up: Evidence from a Randomized Experiment in Morocco. Am. Econ. J. Appl. Econ. 2015, 7, 123–150. [Google Scholar] [CrossRef] [Scilit]
- Eswaran, M.; Kotwal, A. Access to Capital and Agrarian Production Organisation. Econ. J. 1986, 96, 482–498. [Google Scholar] [CrossRef] [Scilit]
- Feder, G.; Lau, L.J.; Lin, J.Y.; Luo, X. The Relationship between Credit and Productivity in Chinese Agriculture: A Microeconomic Model of Disequilibrium. Am. J. Agric. Econ. 1990, 72, 1151–1157. [Google Scholar] [CrossRef] [Scilit]
- Ali, D.A.; Deininger, K.; Goldstein, M. Environmental and gender impacts of land tenure regularization in Africa: Pilot evidence from Rwanda. J. Dev. Econ. 2014, 110, 262–275. [Google Scholar] [CrossRef] [Scilit]
- de Janvry, A.; Sadoulet, E.; Suri, T. Field Experiments in Developing Country Agriculture. In Handbook of Economic Field Experiments; Chapter 5; Elsevier: Amsterdam, The Netherlands, 2017; pp. 427–466. [Google Scholar] [CrossRef] [Scilit]
- Karlan, D.; Savonitto, B.; Thuysbaert, B.; Udry, C. Impact of savings groups on the lives of the poor. Proc. Natl. Acad. Sci. USA 2017, 114, 3079–3084. [Google Scholar] [CrossRef] [Scilit]
- Binswanger, H.P.; Khandker, S.R. The impact of formal finance on the rural economy of India. J. Dev. Stud. 1995, 32, 234–262. [Google Scholar] [CrossRef] [Scilit]
- Jack, B.K. Constraints on the Adoption of Agricultural Technologies in Developing Countries; White paper; Agricultural Technology Adoption Initiative: Boston, MA, USA; Berkeley, CA, USA, 2011. [Google Scholar]
- Emerick, K.; de Janvry, A.; Sadoulet, E.; Dar, M.H. Technological Innovations, Downside Risk, and the Modernization of Agriculture. Am. Econ. Rev. 2016, 106, 1537–1561. [Google Scholar] [CrossRef] [Scilit]
- Roodman, D.; Morduch, J. The Impact of Microcredit on the Poor in Bangladesh: Revisiting the Evidence. J. Dev. Stud. 2014, 50, 583–604. [Google Scholar] [CrossRef] [Scilit]
- Stiglitz, J.E.; Weiss, A. Credit rationing in markets with imperfect information. Am. Econ. Rev. 1981, 71, 393–410. [Google Scholar]
- Boucher, S.; Carter, M.; Guirkinger, C. Risk Rationing and Wealth Effects in Credit Markets: Theory and Implications for Agricultural Development. Am. J. Agric. Econ. 2008, 90, 409–423. [Google Scholar] [CrossRef] [Scilit]

Disclaimer/Publisher’s Note: The statements, opinions and data contained in all publications are solely those of the individual author(s) and contributor(s) and not of MDPI and/or the editor(s). MDPI and/or the editor(s) disclaim responsibility for any injury to people or property resulting from any ideas, methods, instructions or products referred to in the content. |
© 2026 by the authors. Licensee MDPI, Basel, Switzerland. This article is an open access article distributed under the terms and conditions of the Creative Commons Attribution (CC BY) license.