


Abstract
Urban sprawl refers to the undesirable expansion of cities and the irrational exploitation of land resources. This study takes the Yellow River Basin as the research domain and measures the urban sprawl index of 73 prefecture-level cities in the basin from 2000 to 2020. Utilizing DMSP/OLS, NPP/VIIRS nighttime light data, and LandScan population data, the research applies the Theil index to examine urban sprawl levels and spatial heterogeneity among the upper, middle and lower reaches of the basin, as well as within individual cities. The results show that: (1) between 2000 and 2020, urban sprawl levels in the 73 prefecture-level cities within the Yellow River Basin demonstrated a consistent downward trend, with a spatial decrease observed from west to east; (2) the overall Theil index revealed regional disparities that gradually lessened over the years, with differences within the basin being significantly greater than those between its upper, middle, and lower sections; and (3) in terms of spatial heterogeneity, multiple prefecture-level cities in Qinghai Province, at the source of the basin, are primarily located in the “high high cluster” region, whereas the “low low cluster” is largely concentrated in the eastern downstream areas of the Yellow River. Sanmenxia City, located in the middle reaches, was long term the “high low cluster” zone, while the “low high cluster” zone was concentrated in Xining, Lanzhou, and Baotou cities in the upper reaches. Investigating urban sprawl in the Yellow River Basin contributes to advancing the sustainable development of the basin in a profound manner.
1. Introduction
Urban expansion constitutes an inherent trend in the progression of urbanization. China’s urbanization rate has climbed from 17.9% in 1978 to 66.2% in 2024 [1]. While rapid urbanization fosters agglomeration economies, it also gives rise to undesirable phenomena such as unregulated, low-density expansion and inefficient land utilization [2]. These issues exacerbate the strain in urban human land interactions and pose substantial hurdles to the attainment of sustainable urban development. Urban sprawl predominantly manifests in suburban areas on the urban periphery, characterized by low population density, unsustainable development models, and fragmented, single-functional land use [3]. The Yellow River Basin boasts distinctive physical and human geographical advantages, serving not only as a crucial ecological barrier in China but also as a key energy hub and a repository for essential livelihood resources. Its strategic position is pivotal within the national ecological security framework and regional sustainable development landscape. General Secretary Xi Jinping’s pivotal vision on “ecological protection and high-quality development of the Yellow River Basin” has laid out a forward-looking blueprint for the basin’s high-quality advancement [4]. Against the backdrop of rapid urbanization and the Yellow River Basin’s significant economic and ecological roles, investigating urban sprawl in this region holds profound practical significance. It contributes to enhancing regional sustainable development capacities, optimizing urban spatial layouts, delineating rational urban development boundaries, and regulating land use practices in a more scientific manner.
At the start of the 1960s, urban sprawl emerged as a topic of growing interest within academic circles. Scholars have extensively explored urban sprawl from multiple perspectives, including its conceptualization, approaches to measurement, and underlying driving forces, through both theoretical inquiry and empirical case studies. (1) Connotation Definition. Urban sprawl is defined as the rapid and random expansion of cities, resulting in the irreversible transformation of land, discontinuous land use, low population density and low land utilization efficiency [5,6,7,8,9]. (2) In the early stage, scholars mostly adopted statistical data of urban built-up areas [10] and residential areas [11] to measure the degree of urban sprawl. For instance, the urban sprawl index is constructed by the ratio of the growth rate of built-up area to the population growth rate, offering a comprehensive reflection of its complex features [12]. With the development of technology, research has shown the evolving characteristics of multi-dimensional deepening, interdisciplinary integration, and multi-regional focus. The research dimensions are constructed from multiple aspects such as urban structure, form, density and efficiency to establish an evaluation index system for urban sprawl. Moreover, by utilizing remote sensing data and employing methods such as random forest models and SHapley Additive Extension (SHAP) analysis, a more refined measurement approach has been established [13]. Embedded within the research perspective are foundational economic and management paradigms, encompassing regional synergy [14], infrastructure-induced effects [15], and green total factor productivity [16]. Concurrently, the spatial scales of investigation have evolved toward greater diversification [17], embracing multi-tiered empirical analyses that span national, economic belt, provincial jurisdictional, and representative city levels.
Although scholars both domestically and internationally have conducted in-depth discussions on the issue of urban sprawl, there are still some shortcomings. (1) The research focus is quite distinct. Studies on China mainly concentrate on geographical units defined by administrative divisions, while paying less attention to the river basin as a research scope. (2) While interdisciplinary research between economics and geography has been on the rise, the analysis of the drivers of urban sprawl from the perspectives of social sciences and environmental sciences remains relatively underdeveloped, which warrants in-depth exploration from these two disciplinary angles. In light of this, this study summarizes urban sprawl as the detrimental expansion of cities, the misallocation of resources, and the wastefulness of land resources. For this research, 73 prefecture-level cities across the Yellow River Basin are selected as the study sample, with nighttime light data and urban construction panel datasets employed to depict the spatiotemporal evolution features during 2000–2020.
This study aims to compute the urban sprawl index for 73 prefecture-level cities in the Yellow River Basin using nighttime light and population data from 2000 to 2020. It seeks to uncover the patterns of spatial temporal evolution, regional disparities, and spatial heterogeneity, thereby offering theoretical insights and supporting decision-making for the targeted implementation of ecological protection and high-quality development strategies in the region.
2. Data and Method
2.1. Study Area
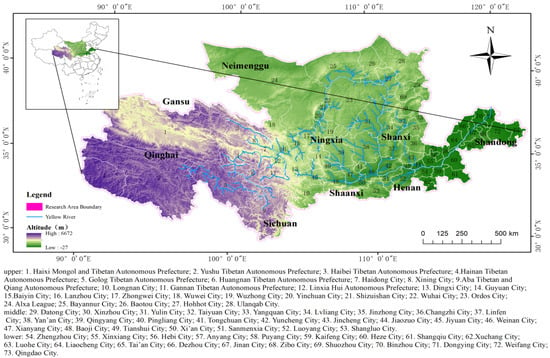
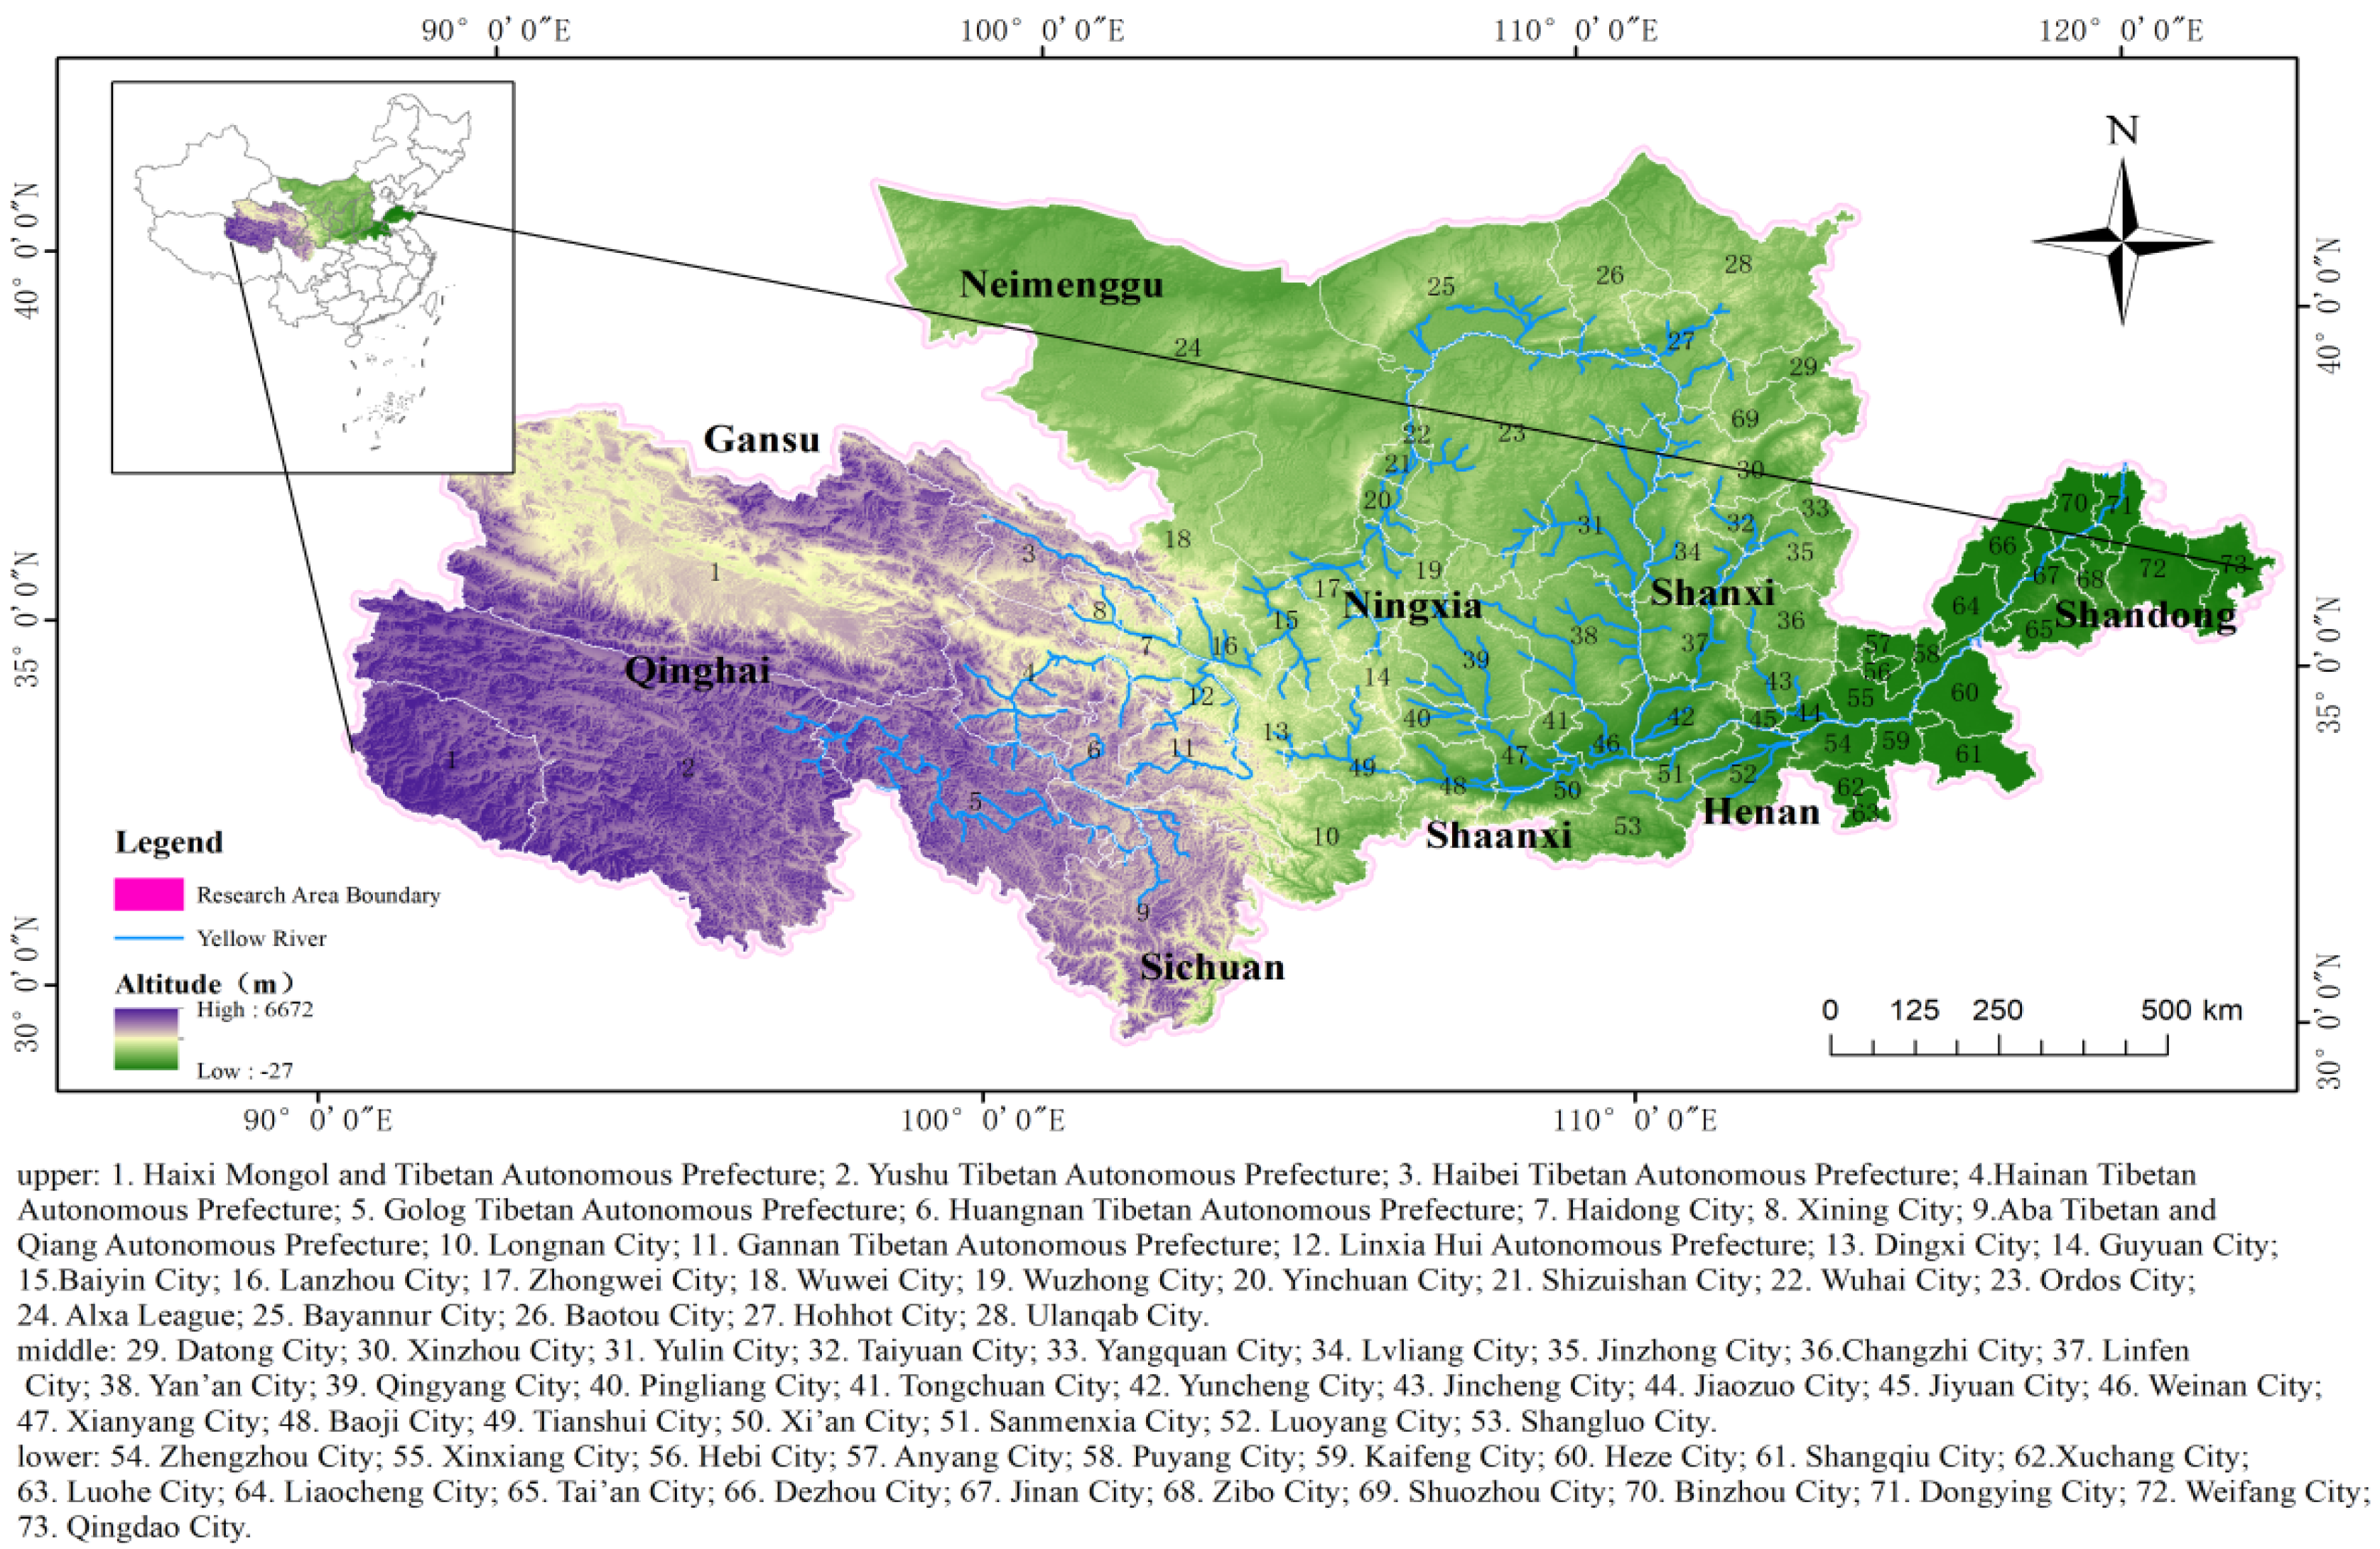
The Yellow River flows from west to east through 9 provinces and autonomous regions, including Qinghai Province, Gansu Province, Ningxia Hui Autonomous Region, Inner Mongolia Autonomous Region, Sichuan Province, Shaanxi Province, Shanxi Province, Henan Province and Shandong Province [18]; it spans four major landforms: the Qinghai-Xizang Plateau, the Loess Plateau, the Inner Mongolia Plateau and the North China Plain [19]; the basin spans 795,000 square kilometers, equivalent to 19% of the total land area of China. The Yellow River Basin is a key region of the Belt and Road Initiative. In 2023, the total GDP of the nine provinces in the basin reached 31.64 trillion yuan, accounting for about 25.1% of the national GDP; furthermore, it is also the important barrier of the national ecological system, hosting multiple national ecological functional zones, including the Sanjiangyuan Grassland Meadow Wetland Ecological Functional Zone, the Loess Plateau Hills and Gully Soil and Water Conservation Ecological Functional Zone, and the Qinba Mountains Biodiversity Ecological Functional Zone, and bears vital significance for the development of the economy and society. In recent years, ecological conservation and high-quality regional development in the Yellow River Basin have been elevated to a major national strategy, with the region’s significance becoming particularly prominent. Drawing on existing research, and grounded in the natural characteristics of the Yellow River Basin, this study delineates the research boundaries in accordance with the administrative divisions of prefecture-level cities. Specifically, 73 prefecture-level cities (municipalities, autonomous prefectures) are selected, through which the main course of the Yellow River and its secondary tributaries are used as the research area of this study, as illustrated in Figure 1. To better analyze regional disparities, the study area is categorized into the upper, middle, and lower reaches of the Yellow River.
Figure 1.
Overview of the study area.
2.2. Data Source and Processing
2.2.1. Data Source
Two types of nighttime light data, DMSP/OLS and NPP/VIIRS, are selected for the Yellow River Basin to extend the research time span, including DMSP/OLS data from 2000 to 2013 and NPP-VIIRS data from 2012 to 2020. All the light data are obtained from the National Geophysical Data Center (NGDC) (https://www.ngdc.noaa.gov/eog/download.html, accessed on 6 April 2025) of the National Oceanic and Atmospheric Administration (NOAA) [20,21,22], with a spatial resolution of 30 arc-seconds (around 1000 m). Topographic and geomorphic data, along with fluvial system data for the basin, were obtained from the Resource and Environmental Science Data Center of the Chinese Academy of Sciences (https://www.resdc.cn, accessed on 12 May 2025), with the former having a spatial resolution of 1000 m. Population data for the study region were retrieved from the LandScan Data Viewer of Oak Ridge National Laboratory in the United States (https://landscan.ornl.gov/, accessed on 4 July 2025) [23,24,25]. All remaining data were extracted from the statistical yearbooks of various prefecture-level cities issued by the National Bureau of Statistics of China.
2.2.2. Nighttime Light Data
Given the long research period spanning from 2000 to 2020, along with issues such as temporal discontinuity between the DMSP/OLS and NPP/VIIRS datasets, preprocessing was required to ensure their temporal continuity and consistency. In this study, the invariant target area method [26,27] was adopted to conduct relative correction on the DMSP/OLS nighttime light data of the Yellow River Basin for the period 2000–2013, with Guoluo Tibetan Autonomous Prefecture, a region with relatively stable development, selected as the invariant target area. Subsequently, saturation correction and continuity correction were performed by combining the radiometrically calibrated reference values, yielding a consistent DMSP/OLS nighttime light dataset for the Yellow River Basin covering 2000–2013. For the NPP/VIIRS data, noise reduction and logarithmic transformation methods [28] were applied for correction, generating a standardized NPP-VIIRS nighttime light dataset for the Yellow River Basin from 2012 to 2020. The BiDoseResp function model was further employed to implement cross-dataset consistency correction between the two datasets. In addition, the DMSP/OLS data acquired by different sensors exhibited inter-sensor inconsistency for the same year, which led to temporal discontinuity in the combined dataset. To address this issue, additional continuity correction was conducted on the integrated dataset, with the specific procedures referring to the research of Guan et al. [29].
2.2.3. Extraction of Built-Up Area
Data on built-up areas for 73 prefecture-level cities were derived from nighttime light datasets that underwent continuous processing. Li et al. [30] set distinct thresholds for each administrative unit in the study area to extract built-up area by comparing it with the reference area of built-up districts (data from statistical yearbooks). Fan et al. [31] identified a threshold of 10 for built-up area extraction in their research on urban sprawl. Liu et al. [32] adopted the threshold technique of the sudden jump method to delineate built-up areas within the study region. Considering the variations in built-up area definition standards across statistical yearbooks of different prefecture-level cities and periods, as well as for the sake of research feasibility, this study refers to the extraction method proposed by Liu L et al. and employs the widely used empirical threshold method to extract built-up areas in the Yellow River Basin. A consistent fixed threshold of 12 was determined for all prefecture-level cities across all study years: pixels with a grid value ≥ 12 were retained and classified as built-up area pixels, while those with a grid value < 12 were excluded and identified as non-built-up area pixels.
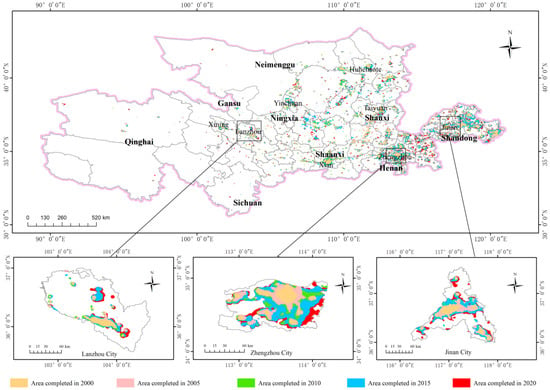
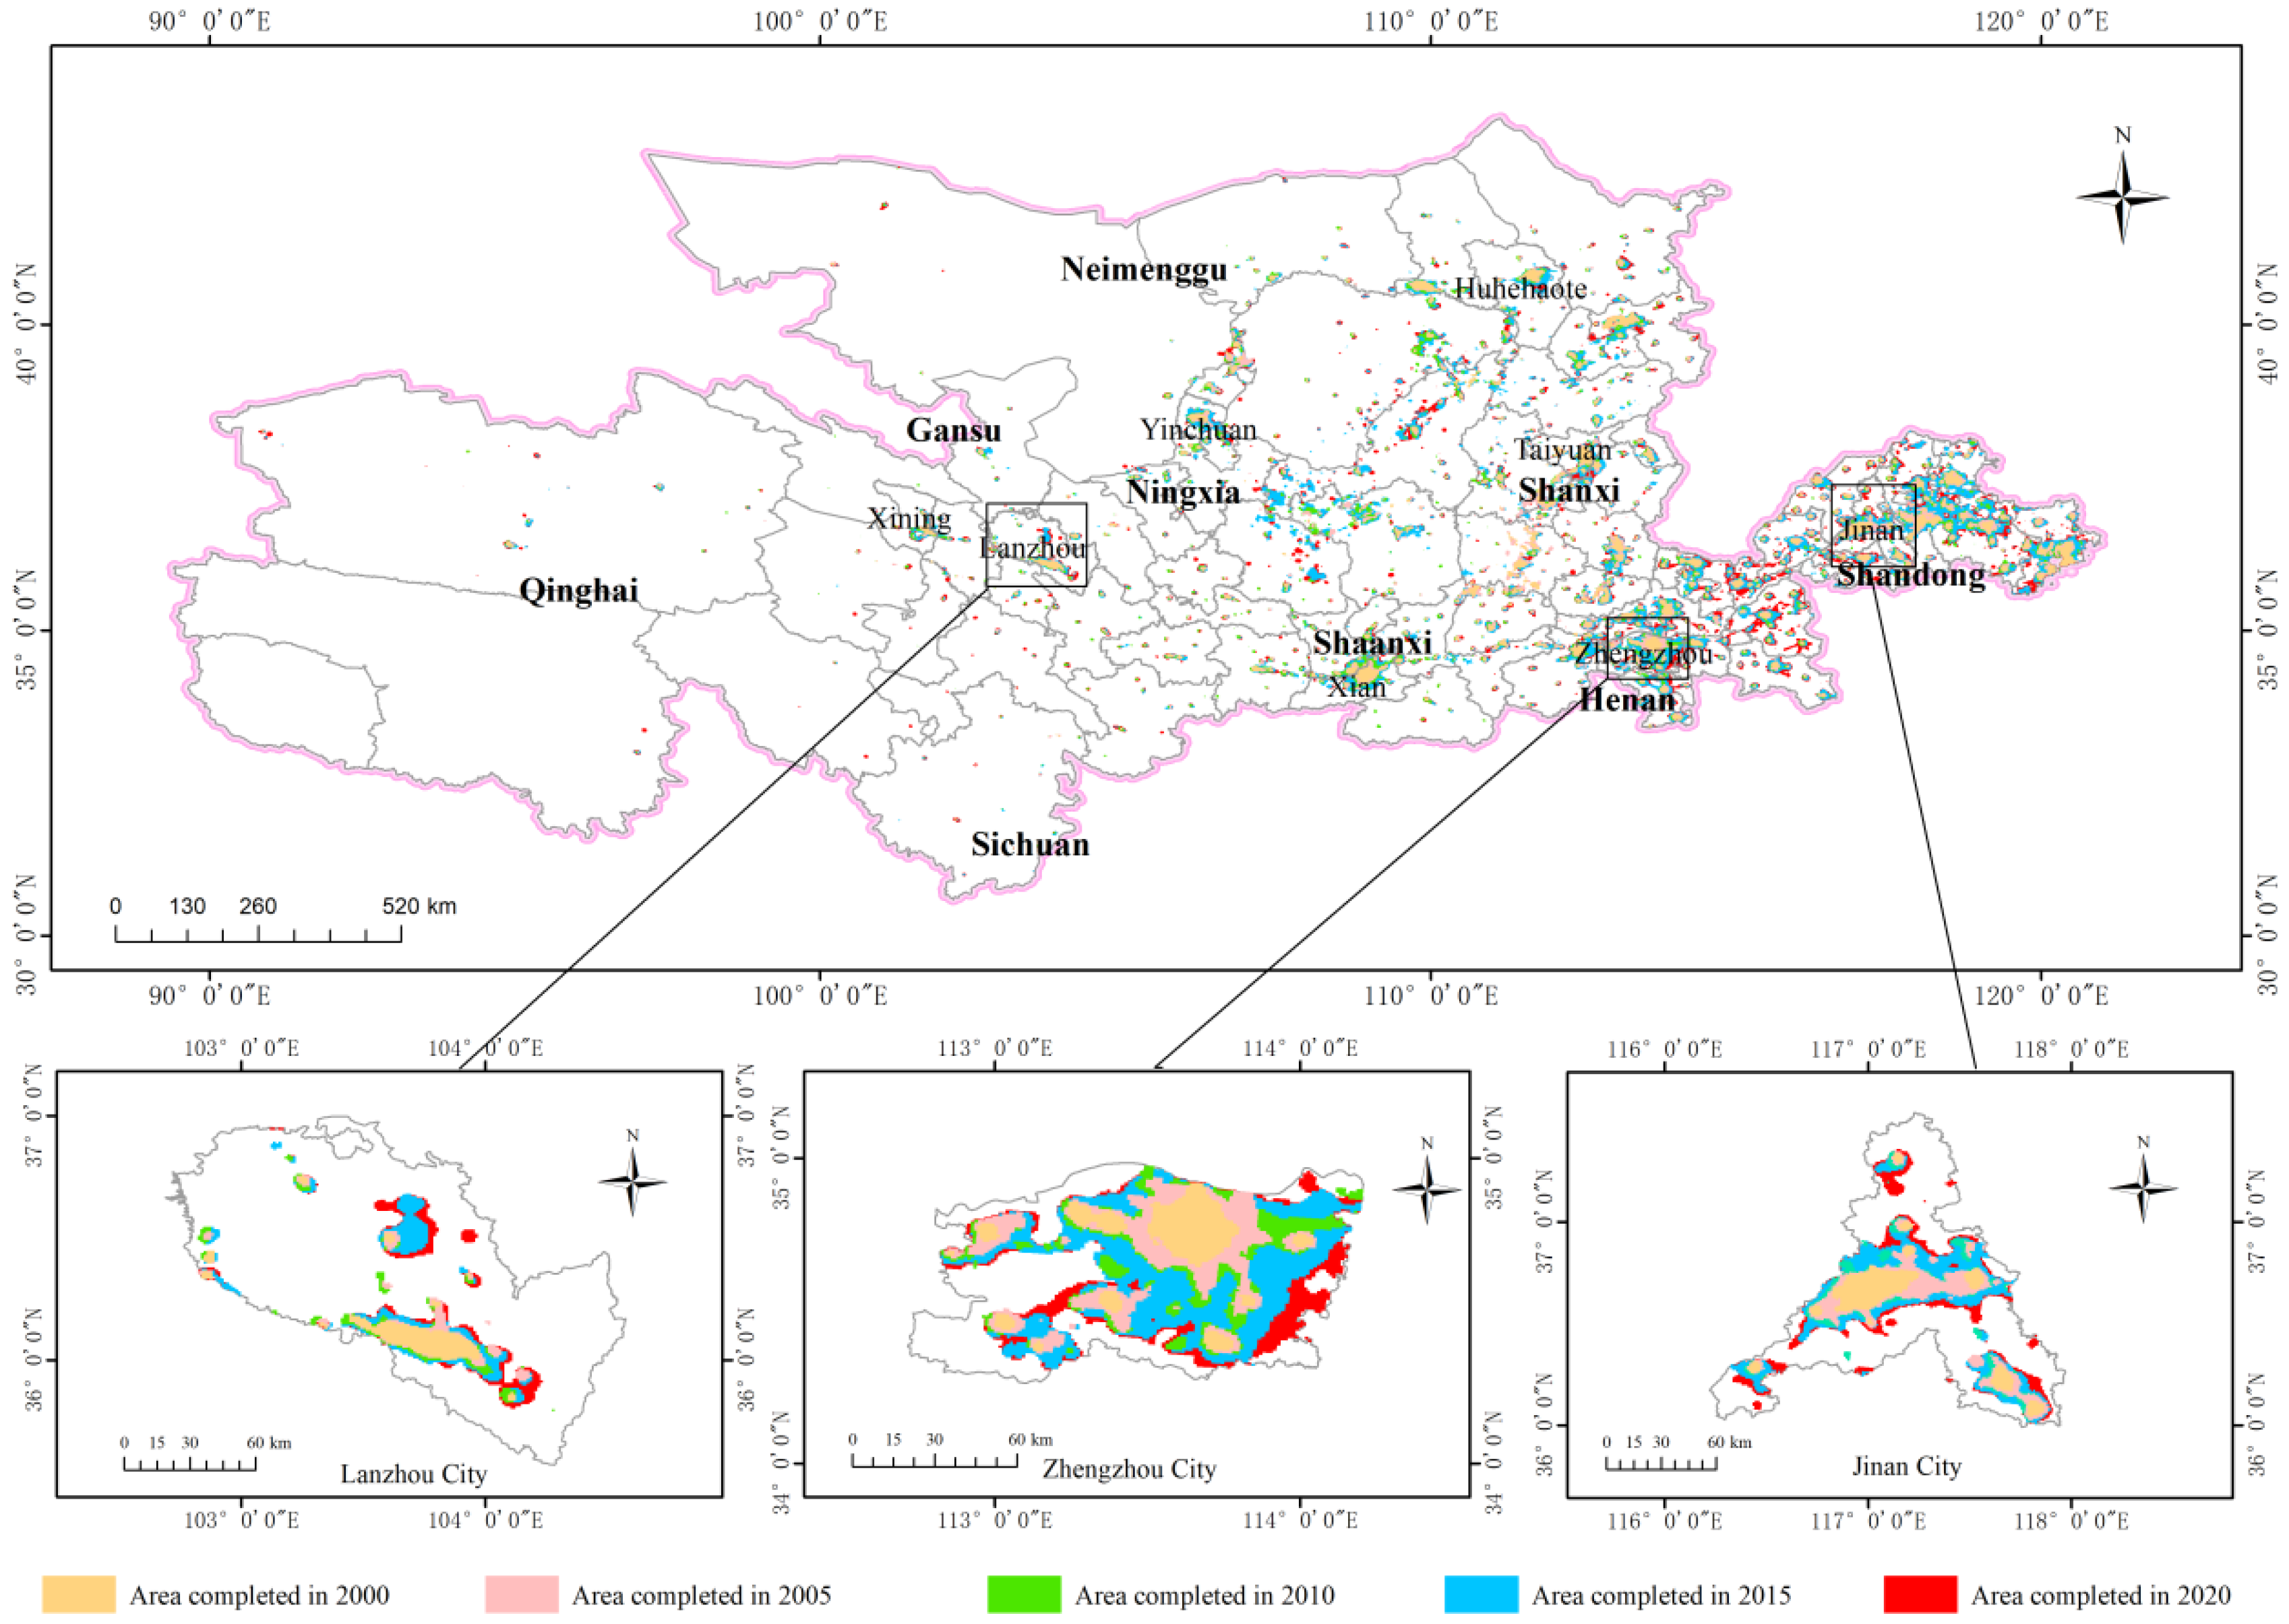
The accuracy was validated by taking the built-up area data from the China City Statistical Yearbook as reference values, with Lanzhou, Xi’an, Taiyuan, and Jinan selected as validation cities for 2015. The results indicated that the coefficient of determination R2 between the extracted built-up area data and the reference values reached 0.9901, demonstrating the excellent continuity of the calibrated data, which are thus suitable for the calculation of the urban sprawl index (see Figure 2).
Figure 2.
Schematic drawing of the built-up area of prefecture-level cities in the Yellow River Basin.
2.3. Methods
2.3.1. Sprawl Index
In the process of urban development, cities exhibit the characteristic of low-density expansion. In the absence of external interventions, urban expansion does not align proportionally with urban population growth. Generally, a steady rise in the residential population, an increase in the area of residential space, and a decrease in population density per unit area reflect the growth of urban sprawl, which is typically seen as the spread of low-density development. This study constructs the population expansion index and land expansion index based on the urban population density and built-up area. By integrating these two indicators, the urban sprawl index is derived to measure the level of urban expansion. In this study, the weights of both the land expansion index () and population expansion index () were set to 0.5. This weighting method not only references the Qiang L’s (2006) [33] mainstream assumption of equal weight of land and population dimension in urban sprawl measurement, but is also based on the core theory of “human–land coupling”—urban sprawl is the common result of land expansion and population distribution imbalance, and the two have equal importance to the contribution of sprawl index, so there is no primary or secondary; therefore, the equal weight weighting has sufficient theoretical and literature basis. The calculation formula for the urban expansion index sprawl is as follows [34,35]:
and represent the land and population sprawl indices of prefecture-level city in the Yellow River Basin. () quantifies the extent of low (high) population density areas as a proportion of the total land area in prefecture-level city within the Yellow River Basin. () represents the percentage of the population residing in low (high) density areas of city . Low population density areas are those where the population density falls below the average for the corresponding prefecture-level cities, while high population density areas are the reverse. The urban sprawl index ranges from 0 to 1, with values closer to 1 indicating a more pronounced extent of urban sprawl.
To verify the construct validity and temporal stability of the urban sprawl index, Pearson correlation analysis was conducted using two validation indicators (Table 1): the proportion of low-density area (, reflecting the characteristics of low-density and scattered land distribution) and the proportion of population in low-density area (, reflecting the characteristics of matching characteristics of human land distribution), and three key time points (2000, 2010, and 2020) were selected (Table 2). The results indicate that in 2000, the correlation coefficient between the urban sprawl index and was = 0.80 (p < 0.001), and that with was = 0.98 (p < 0.001); in 2010, the correlation coefficient between the urban sprawl index and was = 0.73 (p < 0.001), and that with was = 0.98 (p < 0.001); and in 2020, the correlation coefficient between the urban sprawl index and was = 0.80 (p < 0.001), and that with was = 0.98 (p < 0.001). The results across the three years are consistent with the theoretical expectation that “the higher the urban sprawl index, the greater the proportion of low-density area and the proportion of population in low-density area,” and all passed the significance test at the 1% level. This indicates that the index not only exhibits good construct validity but also demonstrates cross-temporal stability, enabling it to continuously capture the core attributes of urban sprawl in the Yellow River Basin.
Table 1.
Selection of construct validity validation indicators for the sprawl index.
Table 2.
Results of construct validity validation.
As shown in Table 3, during the period 2000–2020, when the weight of the land expansion index () was set to 0.4 and 0.6 respectively, the Pearson correlation coefficients between the newly calculated sprawl index and the original index (with equal weight of 0.5 for both and population expansion index ) all remained above 0.95. The average correlation coefficients reached 0.982 (for = 0.4) and 0.995 (for = 0.6), respectively. These results indicate a very high consistency between the sprawl indices under the two adjusted weight settings and the original equal weight index, confirming that the sprawl index is insensitive to weight adjustments and the equal weight assignment of 0.5 has high robustness.
Table 3.
Pearson correlation coefficients of sprawl index under different weights.
2.3.2. Theil Index
Initially developed to quantify income inequality across individuals (or regions), the Theil index also functions as a critical metric for assessing development discrepancies between regions [36]. This study applies the Theil index to analyze differences in urban sprawl in the Yellow River Basin. By implementing the Theil index and its decomposition procedure, the overall disparity, along with inter-regional and intra-regional differences, in urban sprawl levels can be accurately quantified. The overall disparity in urban sprawl across the Yellow River Basin is decomposed into disparities within the upper, middle, and lower reaches. The specific formulas are as follows [37,38]:
Intra-regional Theil index (modified weighted form): Let denote the indicator value of the i-th region, represent the mean value of the g-th group, stand for the overall mean value, and be the total number of regions.
Inter-regional Theil index:
Overall Theil index (decomposable form):
Note: The weighted Theil index decomposition was adopted, with the proportion of each region’s indicator value to the inter-regional mean value as the weight, which is consistent with the classic calculation framework proposed by Conceição & Galbraith (2000) [37] and Shorrocks & Wan (2005) [38]. The specific calculation results are shown in Table 4.
Table 4.
Overall Theil index and its decomposition of urban sprawl in the Yellow River Basin from 2000 to 2020.
To validate the statistical significance of Theil indices and decomposition results, this study employed bootstrap resampling (1000 repetitions) to test the significance of the overall Theil index (), inter-group Theil index (), intra-group Theil index (), and upstream, midstream, and downstream sub-indexes for the period 2000–2020. The results are presented in Table 5. The findings indicate that all annual index values fall within the 95% confidence interval, with p < 0.05, demonstrating that the urban sprawl regional differences calculated in this study for the Yellow River Basin exhibit strong statistical significance and reliability.
Table 5.
Theil index and its bootstrap 95% confidence interval decomposition test results.
2.3.3. Moran’s Index
To analyze the spatial correlation of urban sprawl in the Yellow River Basin, this study first employed the global Moran’s I test to examine the spatial distribution pattern of the basin-scale sprawl index from 2000 to 2020 (Table 6). The results showed that the global Moran’s I values were consistently positive with p < 0.05 for all years, indicating significant global spatial clustering characteristics in urban sprawl within the basin. This finding lays the groundwork for subsequent local Moran’s I analyses.
Table 6.
Global Moran’s I and significance test results of urban sprawl index in the Yellow River Basin from 2000 to 2020.
The local Moran’s Index is used to measure different spatial correlation forms resulting from differences in spatial location, thereby focusing on local instability within space. This study discusses the spatial layout characteristics of the urban sprawl degree of adjacent prefecture-level cities. Using ArcGIS 10.8 software, the contiguity-based spatial weight matrix was adopted and the contiguity-based spatial weight matrix, a spatial correlation analysis of the urban sprawl degree of 73 prefecture-level cities in the Yellow River Basin from 2000 to 2020 was conducted. Based on its characteristics, the LISA (Local Indicators of Spatial Association) graph was used to describe the spatial effect. The degree of sprawl in adjacent areas is classified into “high high clusters”, “high low clusters”, “low high clusters” and “low low clusters”. The “high high cluster” refers to a regional cluster formed by a certain prefecture-level city and its adjacent prefecture-level cities having a relatively high degree of urban sprawl. The “high low cluster” refers to a regional unit formed by a relatively high degree of sprawl in one city and a relatively low degree of sprawl in its surrounding cities; the “low high cluster” is a geographical unit formed by the fact that the degree of sprawl in the surrounding areas of a certain city is relatively high, while the sprawl in this city is significantly lower than that in the surrounding cities; and the “low low cluster” represents a group of several adjacent prefecture-level cities with a relatively low degree of sprawl compared to the Yellow River Basin as a whole and other cities. Regions that have not yet formed the above four types of associated relationships are all classified as “insignificant”.
3. Results
3.1. The Urban Sprawl Level in the Yellow River Basin
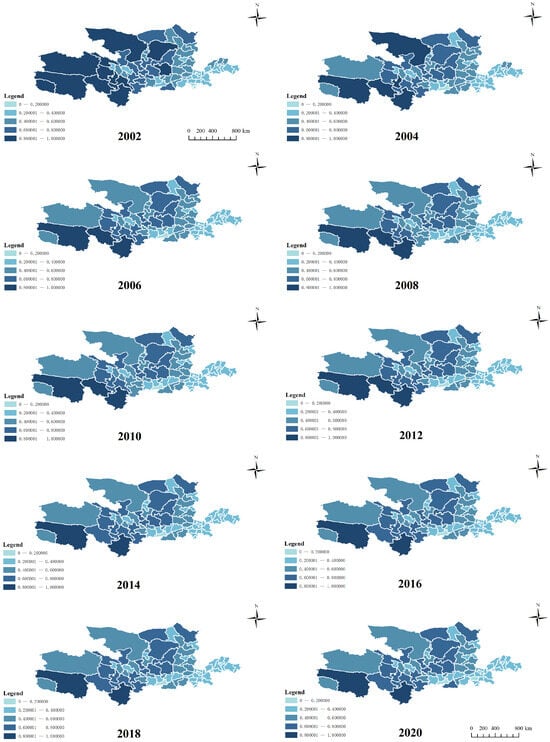
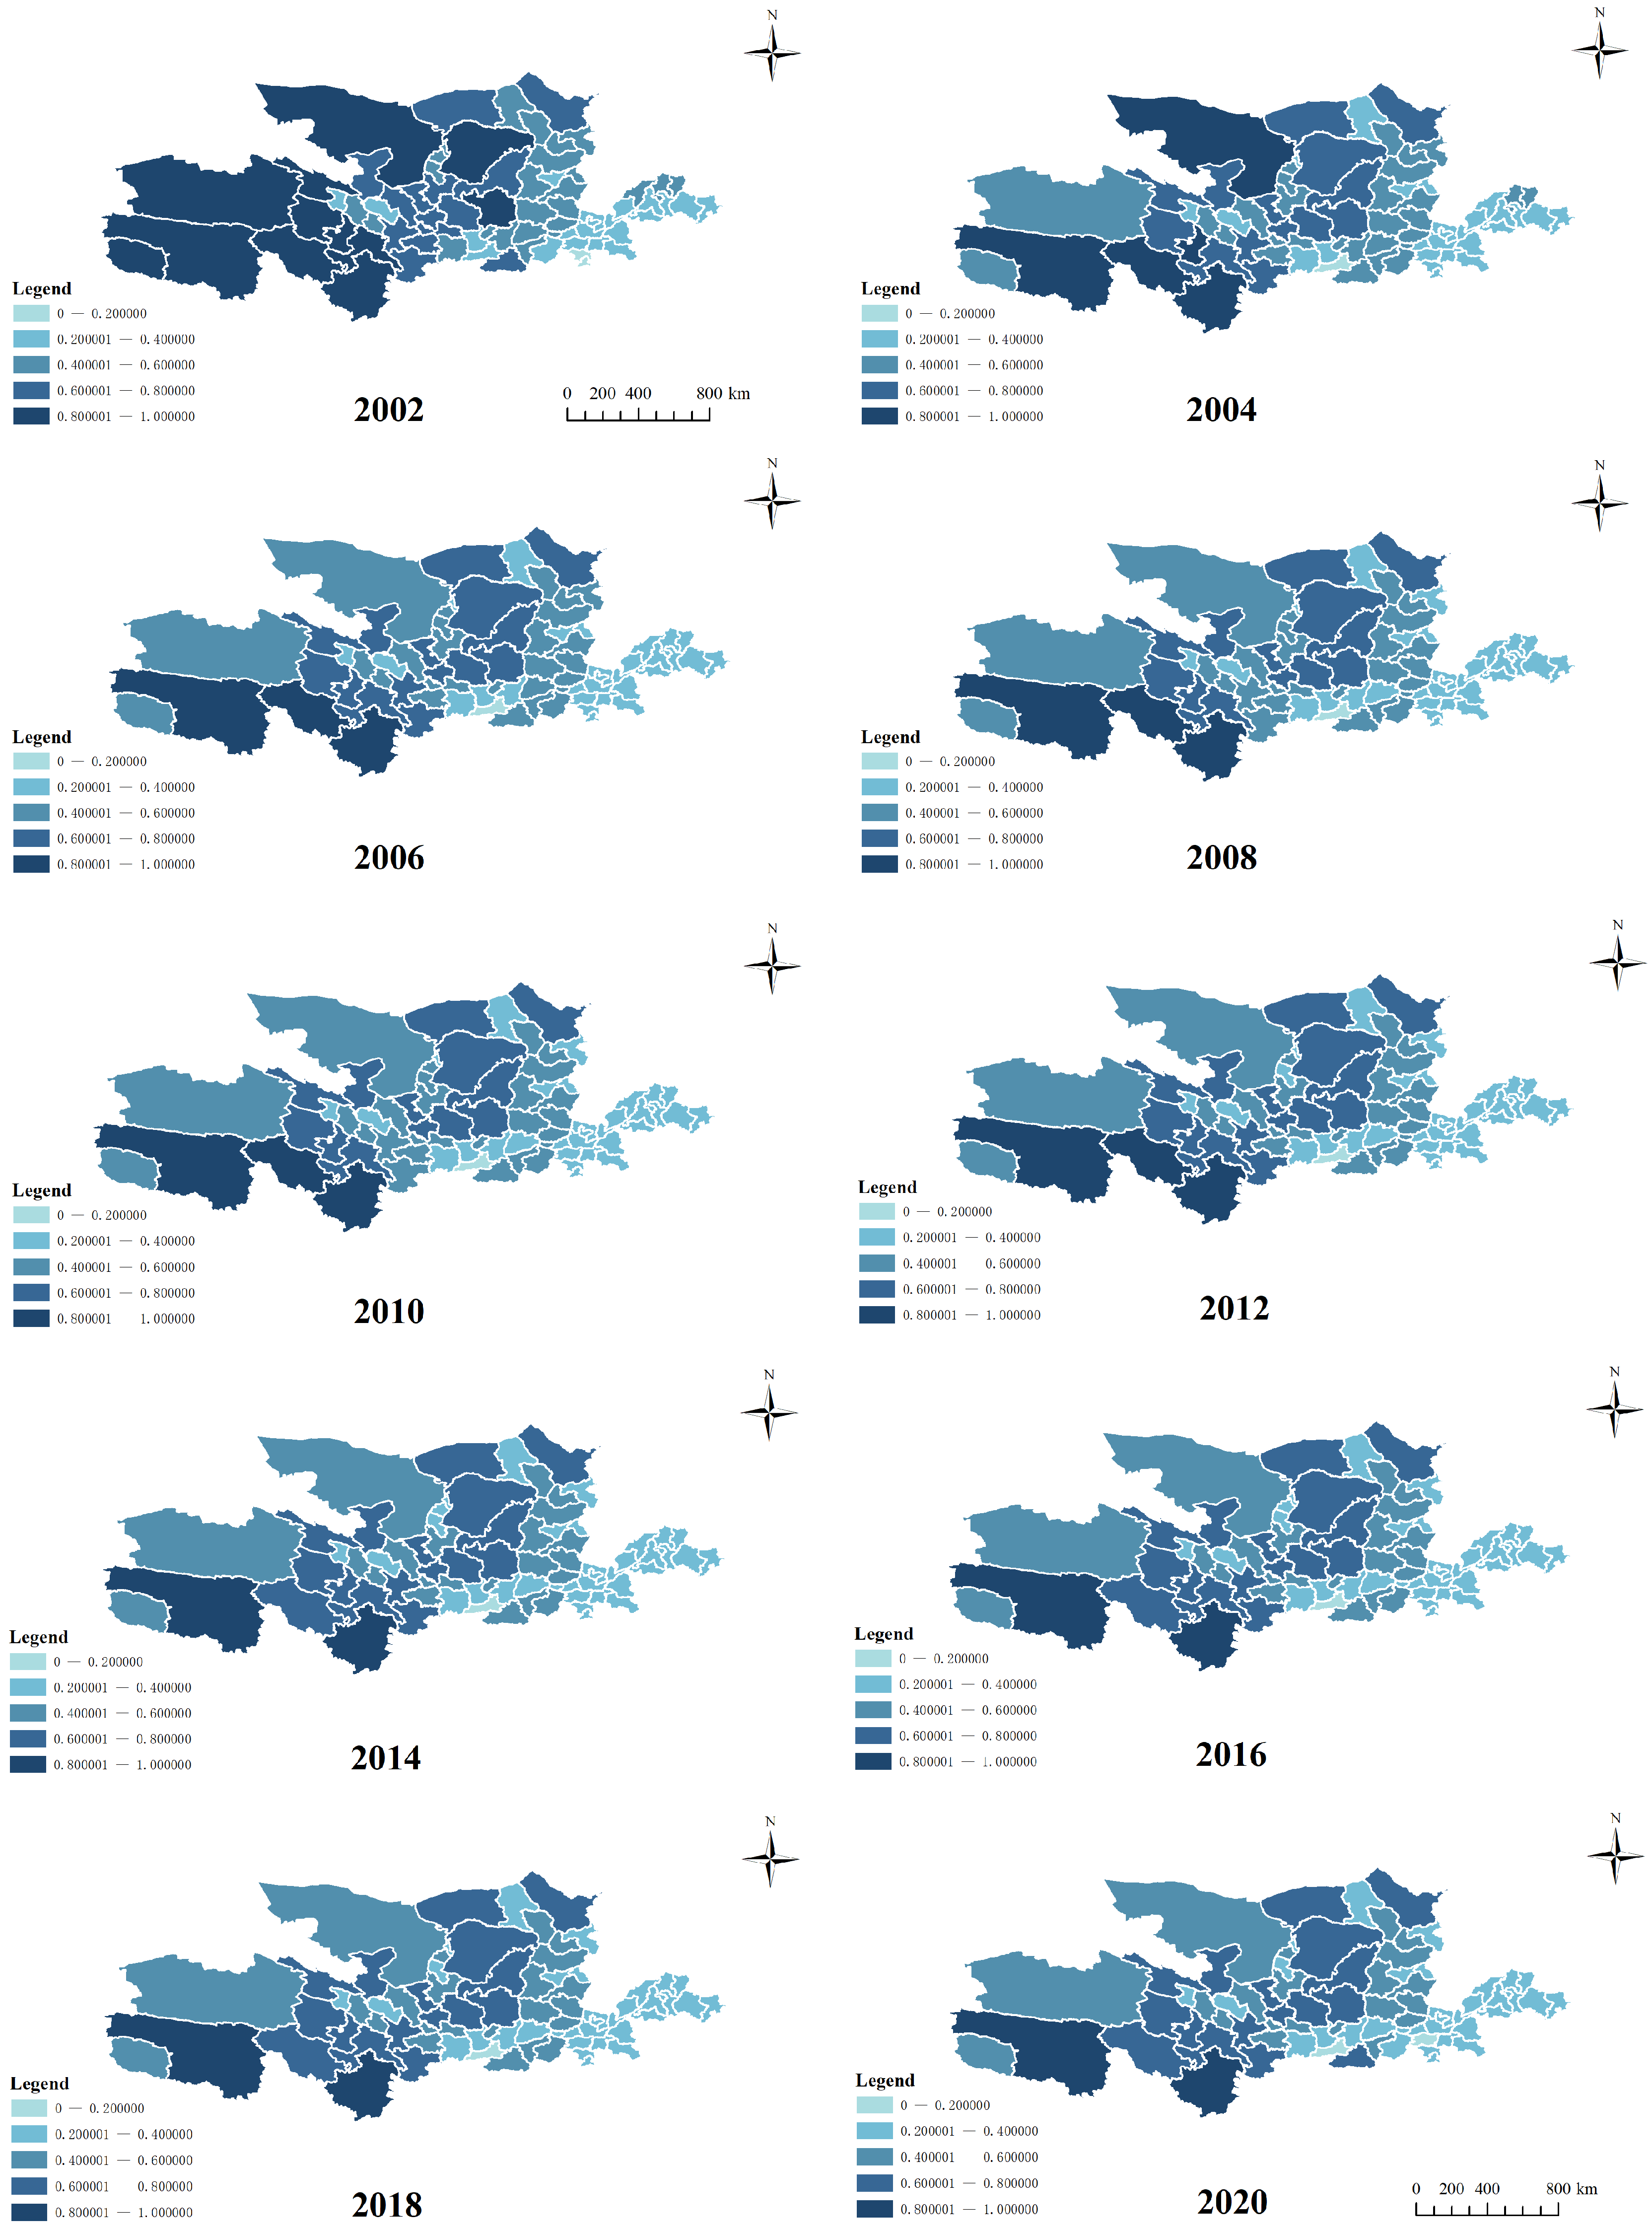
This study quantifies the extent of urban sprawl across 73 prefecture-level cities in the Yellow River Basin by computing the sprawl index, and presents the spatiotemporal dynamics of urban sprawl over the study period via visualizations created in ArcGIS 10.8 (maps are generated biennially for brevity), as shown in Figure 3. Using the natural breaks method, the prefecture-level city sprawl index is defined as low, relatively low, medium, relatively high, and high, with corresponding numerical ranges of [0–0.2], (0.2–0.4], (0.4–0.6], (0.6–0.8], and (0.8–1].
Figure 3.
Urban sprawl index in the Yellow River Basin.
Between 2000 and 2020, urban sprawl across 73 prefecture-level cities in the Yellow River Basin showed a consistent decline, with the average sprawl index decreasing from 0.538 in 2000 to 0.473 in 2020. All cities exhibited varying degrees of downward trends; Alxa League and Haixi Mongol and Tibetan Autonomous Prefecture recorded the most significant declines, with the decrease amplitude exceeding 0.3. Based on the analysis of the influencing factors of the urban sprawl index, the main reasons for the downward trend in the temporal sequence of the urban sprawl level of prefecture-level cities in the Yellow River Basin are as follows: on the one hand, from the social science perspective, that the overall population policy of “controlling the population size and improving the population quality” has led to a stable resident population in China. The net increase in population has been below 10 million since 2000, and has gradually averaged at around 7 million each year, directly affecting the level of urban sprawl. On the other hand, from the perspective of resource and environment science, the country gradually highlights the importance of the space of the national territorial spatial planning. In 2019, the Central Committee of the Communist Party of China and the State Council released the ‘Opinions on the Establishment and Oversight of the Territorial Spatial Planning System’, setting forth objectives such as the establishment of a basic territorial spatial framework by 2020. This indicates that the systematic work of territorial planning in our country is advancing steadily. Furthermore, the “General Planning Outline for the Yellow River Basin” was formulated to address the issues in the Yellow River Basin. The territorial space planning within the basin and the supervision of land resource utilization have been gradually strengthened, which is another important reason for the gradual reduction in urban sprawl levels during the research period. In conclusion, the decline in the degree of urban sprawl in the Yellow River Basin indicates that the efficiency of land resource utilization and the level of urban development in the basin have been gradually improving (Table 7).
Table 7.
Urban sprawl index of selected cities in the Yellow River Basin (2000, 2010, 2020).
The spatial distribution of urban sprawl shows an increasing tendency from west to east. The sprawl levels in Aba Tibetan and Qiang Autonomous Prefecture, Guoluo Tibetan Autonomous Prefecture, and Yushu Tibetan Autonomous Prefecture remained high, with annual sprawl indices consistently above 0.7, indicating a “moderately high to high” level. Xi’an City maintained a “low to moderately low” level throughout the study period, with annual sprawl indices below 0.3 each year. From a basin perspective, the sprawl level shows a downward trend from upstream to downstream, and the average sprawl indices are 0.600, 0.457, and 0.308 in the upper, middle, and lower basins, respectively. The underlying reasons may be as follows: First, socio-economic factors. The western upland areas mainly rely on agriculture and related industries, which lead to scattered residential patterns, which intensify urban sprawl. In the central and eastern regions, industry is the mainstay, and the development of industries drives the population to gather in urban commercial areas and industrial zones. The high population density and relatively small land area largely prevent the uncontrolled sprawl of cities. Second, natural geographical factors. Topographically, the upstream areas are more rugged and complex compared to the middle and lower reaches. The residential units are forced to be divided, resulting in a low-density and scattered distribution of the population. To a certain extent, this leads to unreasonable land use and resource waste. Regarding administrative areas, the western upper regions typically have larger administrative units compared to those in the middle and lower reaches, which naturally supports the dispersed population distribution. As a result, fewer people occupy a larger residential space.
3.2. Analysis of Regional Differences in Urban Sprawl
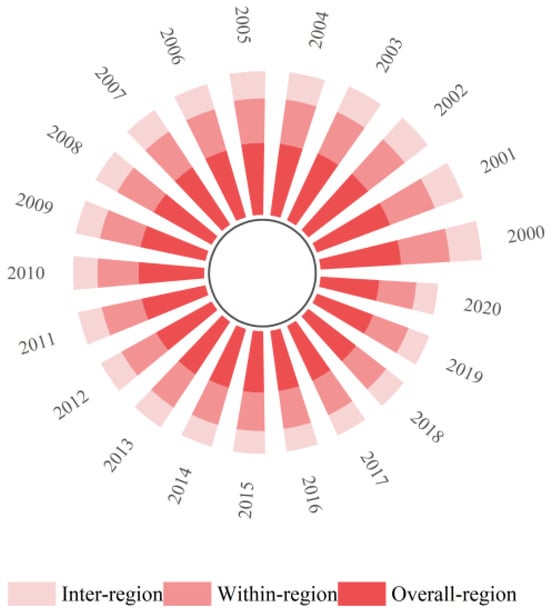
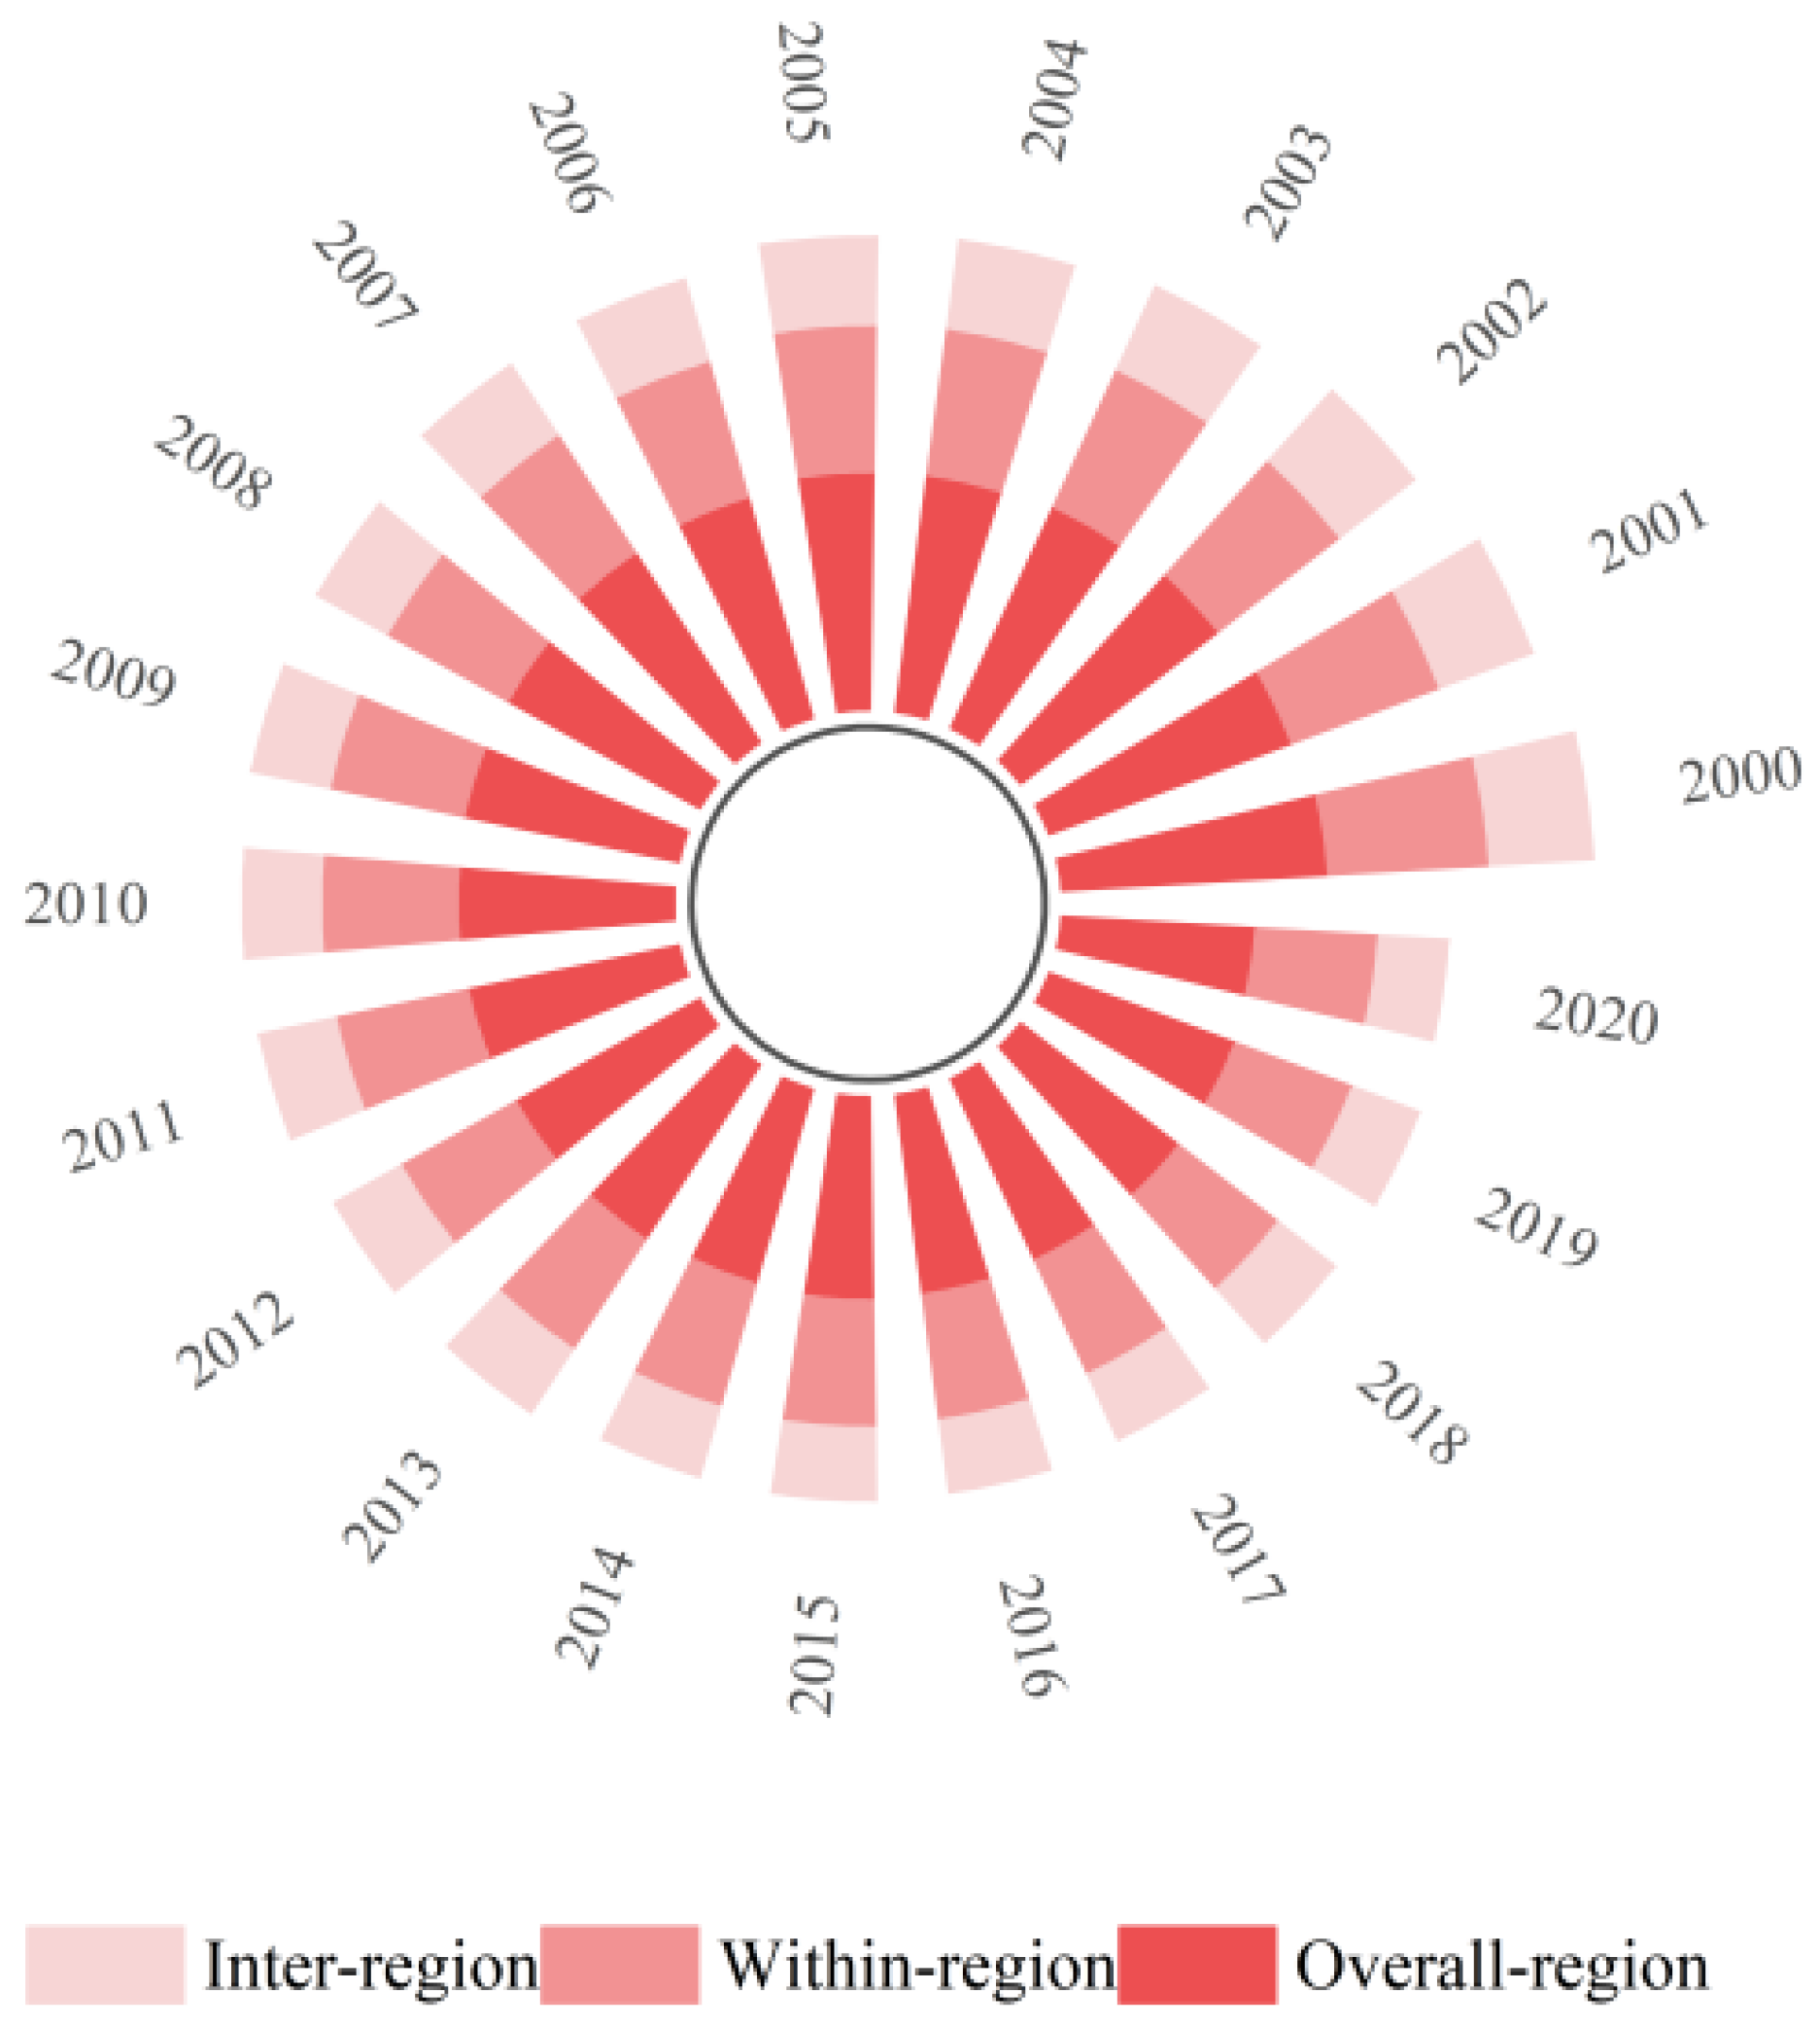
To further investigate the regional disparities in urban sprawl across prefecture-level cities in the Yellow River Basin, this study calculates the Theil index based on the sprawl indices of its upper, middle, and lower reaches (Figure 4). From the perspective of the overall Theil index, the Theil index exhibited slight fluctuations in the Yellow River Basin from 2000 to 2020. Except for two distinct periods with remarkable changes—a substantial decline during 2000–2001 and a sharp increase during 2019–2020—the annual changes trended towards stability in the remaining years. The period of 2001–2019 witnessed a steady variation, with the index level fluctuating slightly from 0.0604 in 2001 to 0.0463 in 2019 (Table 4). Despite minor oscillations, the index level maintained a relatively stable trend overall. The mean value of the overall Theil index reached 0.0644 from 2000 to 2020, indicating that significant and relatively stable disparities existed among prefecture-level cities in the basin across the study years.
Figure 4.
Overall within between-group difference index of urban sprawl in the Yellow River Basin.
The Theil index for both intra-regional and inter-regional disparities was derived by decomposing the overall Theil index. In terms of the inter-regional Theil index, it showed a similar fluctuation pattern to the overall Theil index during 2000–2020, with an average intra-regional disparity of 0.346, which was notably higher than the average inter-regional disparity of 0.298. This demonstrates that the intra-regional disparity of urban sprawl across prefecture-level cities in the Yellow River Basin was slightly larger than the inter-regional disparity, and the overall disparity was mainly driven by differences among prefecture-level cities rather than gaps between the upper, middle, and lower reaches. As for the inter-regional Theil index, it experienced considerable fluctuations and showed a downward trend from 2000 to 2019, with the most pronounced decline observed between 2000 and 2003. Following a slight increase in 2004, the index maintained a downward tendency until a significant rise in 2020, displaying an overall U-shaped trend. This reveals that disparities among the three major regions of the Yellow River Basin were unstable yet generally insignificant. Accordingly, greater emphasis should be placed on disparities among prefecture-level cities, and targeted policies should be implemented to further improve land use efficiency.
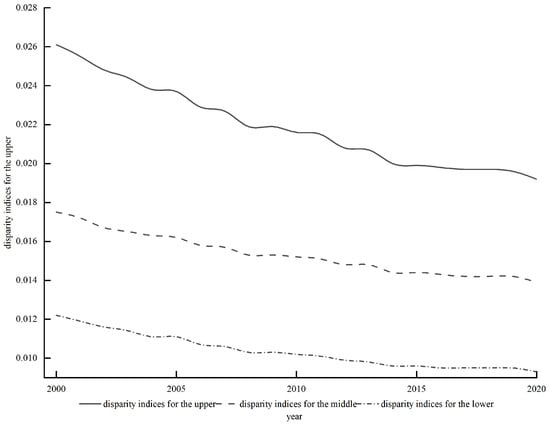
To analyze the intra-regional variations in urban sprawl levels, this study computes the disparity indices for the upper, middle, and lower reaches of the Yellow River Basin. The results show that the disparity index in the lower reaches of the Yellow River is higher than that in the other two regions only in 2000. In all other years, it is significantly lower than those in the upper and middle reaches, indicating a relatively small disparity. The possible reasons are as follows: Firstly, the lower reaches of the Yellow River are dominated by alluvial plains, with a flat terrain. There are minor differences in terrain and elevation among the prefecture-level cities and natural barriers such as mountains are not prominent. Secondly, the levels of social and economic development are similar. These areas are all densely populated regions with a consistently high population density and relatively small geographical areas, so the differences are not obvious. The difference index in the upstream and midstream areas is relatively close. In 2000, the difference index in the midstream area was slightly higher than that in the upstream area. From 2001 to 2016, the difference index in the upstream area was always greater than that in the midstream area. After 2017, the difference index in the midstream area showed an upward trend and exceeded that in the upstream area, indicating that due to various factors, there are varying degrees of differences between the prefecture-level cities in the upstream and midstream regions (see Figure 5).
Figure 5.
Urban sprawl index differences between upstream, middle and downstream reaches of the Yellow River Basin.
3.3. Analysis of Spatial Heterogeneity in Urban Sprawl
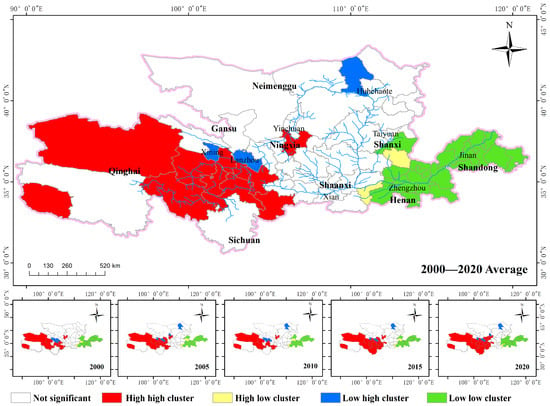
To deeply explore the local spatial heterogeneity characteristics and correlation degree of urban sprawl levels among 73 prefecture-level cities of the Yellow River Basin from 2000 to 2020, this study uses the prefecture-level urban sprawl index to measure the spatial autocorrelation characteristics. Cluster patterns are measured at five individual years (2000, 2005, 2010, 2015, 2020) as well as for the mean sprawl index over the study period to reflect local spatial autocorrelation, and LISA cluster maps are generated (Figure 6).
Figure 6.
LISA agglomeration map of urban agglomeration in the Yellow River Basin.
“High high cluster” aggregation zone. This type of aggregation was observed at the five time points measured in the study as well as in the average results, and the occurrence areas were relatively stable. Overall, several prefecture-level cities in Qinghai Province and Wuzhou City were all in the “high high cluster” aggregation at five time points and in the average calculation results. In the other years, it was an insignificant area. This is basically consistent with the calculated level of urban sprawl of prefecture-level cities in the previous text. The main reason is that these prefecture-level cities have vast areas and sparse populations, with a livestock-dominated economy, and the population is more dispersed. The sprawl level is higher than other regions, making them core areas of ecological protection and the efficient utilization of land resources.
“High low cluster” aggregation zone. This type was identified in relatively few prefecture-level cities across the five selected time points and in the mean measurement results of this study. Sanmenxia City was consistently classified into this cluster across all periods; in 2000, in addition to Sanmenxia City, Jincheng City also fell into this cluster, and Changzhi City was categorized into this cluster in all periods except 2000 and 2020. This cluster type is prominently characterized by a unique spatial pattern wherein the specific prefecture-level city exhibits a relatively high degree of urban sprawl throughout its development, while the surrounding prefecture-level cities all maintain a low level of sprawl in the meantime.
“Low high cluster” agglomeration zones. The cities where this kind of clustering occurs frequently are Xining City, Lanzhou City and Baotou City. The main reasons are as follows: First, Xining and Lanzhou are the provincial capitals of Qinghai and Gansu provinces respectively. Compared with their surrounding areas, they have a higher population density and a more concentrated population. Moreover, due to the limited administrative area of the two cities, there has been no uncontrolled sprawl. Second, the urban area of Xining City was largely constructed after 2000, and the later construction plans were more reasonable. Lanzhou City is restricted by the terrain and is distributed in a narrow river valley shape. The area expansion is restricted; the Lanzhou New Area was planned for urban planning to alleviate the pressure of urban sprawl. Ultimately, good spatial planning is an important reason why the urban expansion degree of these two cities is lower than that of the surrounding areas.
“Low low cluster” agglomeration zone. Such areas are primarily situated in the eastern section of the lower Yellow River, including six measurement nodes in the northeastern part of Henan Province and prefecture-level cities in Shandong Province. The urban sprawl in these cities is typically low and spatially concentrated, indicating that urban sprawl is not a major concern in these regions. These clustered areas have developed earlier and have a higher economic development level. They have already reached a relatively high level before the research period; meanwhile, the expansion of land area during the research period has been extremely limited. Moreover, the climate is suitable and the population density is very high. Overall, there is less occurrence of land resource waste caused by excessive sprawl.
Based on the urban sprawl indices of 73 prefecture-level cities in the Yellow River Basin from 2000 to 2020, the significance test of the Local Moran’s I was conducted with a fixed distance weight of 200 km, and the core results are presented in Table 3. Overall, the spatial heterogeneity of urban sprawl across the basin exhibits the characteristics of notable and stable agglomeration with distinct regional differentiation, which is highly consistent with the laws of regional development and effectively verifies the statistical reliability of the spatial pattern and the scientific validity of the research conclusions.
Based on the significance and spatial distribution of core clusters, the four key clusters passed the 5% statistical significance test throughout the entire period from 2000 to 2020, showing no significant fluctuations. The high high (hh) clustering zones were concentrated in Qinghai Province in the upper reaches of the Yellow River Basin; as a typical region with low urban density and scattered built-up areas within the basin, its urban sprawl characteristics exhibited a significant spatial agglomeration pattern and remained stable over the long term. The high low (hl) anomaly zones were centered on the inter-provincial junction node cities in the middle reaches, presenting a local heterogeneous structure characterized by “a high degree of urban sprawl in the central cities and a low degree of sprawl in the surrounding cities”. This feature is consistent with the reality that the node cities have experienced rapid expansion by virtue of their locational advantages, while the development of the surrounding cities has remained relatively lagging. The low high (lh) anomaly zones are concentrated in the provincial capitals (or capitals of provinces), located in the middle reaches, exhibiting a distinct spatial contrast: ‘central cities experience lower levels of urban sprawl, while surrounding cities have higher levels of sprawl’. This pattern arises because the provincial capitals have pursued compact urban development guided by urban planning, while the surrounding small and medium-sized cities have shown more pronounced sprawl due to the effects of resource exploitation and early-stage urbanization. The low low (ll) clustering zones extensively covered the prefecture-level cities in Henan and Shandong Provinces in the lower reaches; as a region with high population density and high compactness of urban built-up areas within the basin, its low-sprawl characteristics formed a significant spatial correlation and underwent no structural changes over the long term.
In terms of the temporal evolution law, the coverage and significance levels of the four clusters remained stable during 2000–2020, with no newly emerged or vanished significant regions. This highlights that the spatial variability of urban sprawl in the Yellow River Basin is not randomly distributed but is shaped into a stable pattern by long-term factors, including topography, population concentration, and stages of economic development. This result is fully consistent with the conclusions presented in Figure 6, which further verifies that the identified spatial pattern of urban sprawl in the basin has good robustness (Table 8).
Table 8.
Significance test results of spatial heterogeneity in urban sprawl of the Yellow River Basin (2000–2020).
4. Conclusions
This study investigates the spatial dynamic evolution and spatial heterogeneity of urban sprawl in the Yellow River Basin during 2000–2020. The results demonstrate that, temporally, the urban sprawl intensity of the 73 prefecture-level cities in the basin exhibited an overall steady downward trend. Spatially, sprawl levels decreased gradually from west to east, and a similar declining pattern was observed from the upper to the lower reaches across the basin divisions. Regarding regional inequality, the overall Theil index remained relatively stable with minor fluctuations, except for two noticeable periods: a sharp decline during 2000–2001 and a considerable increase during 2019–2020, while changes in other years were relatively gentle. The intra-regional Theil index showed a similar fluctuation pattern, and the intra-regional disparity was significantly higher than the inter-regional disparity, indicating that the overall regional difference was mainly driven by disparities among prefecture-level cities rather than gaps among the three major reaches. The inter-regional Theil index displayed a U-shaped evolutionary trend. The disparity index of the lower Yellow River Basin was significantly lower than those of the upper and middle reaches in most years, except for 2000 when it exceeded the other two regions. The spatial heterogeneity analysis indicates that several prefecture-level cities in Qinghai Province maintained higher sprawl levels and were stably located in the high high (hh) clustering zone. Sanmenxia City was persistently identified in the high low (hl) clustering zone. Xining, Lanzhou, and Baotou exhibited lower sprawl intensity than their neighboring cities, belonging to the low high (lh) clustering zone. The low low (ll) clustering zone was mainly distributed in the economically developed eastern lower reaches of the Yellow River Basin, characterized by relatively small administrative areas and high levels of social and economic development.
This study thoroughly examines the issue of urban sprawl in the Yellow River Basin and the findings reveal that the level of urban sprawl in the basin exhibits a temporal declining trend and a spatial pattern of gradual decrease from west to east. This result is largely consistent with the conclusions of existing research [24], which verifies the reliability of the research methods and findings adopted in this study. On this basis, the study further explores the issue of spatial heterogeneity and conducts a detailed analysis of the specific driving factors in typical regions, thus ensuring the comprehensiveness and scientific rigor of the research. The marginal contributions of study are evident in three key areas: (1) it breaks away from the traditional focus of urban sprawl research, which mainly concentrates on individual cities, urban agglomerations, or provincial regions, and instead focuses on the Yellow River Basin—an inter-regional area with both significant ecological barrier functions and economic strategic value—contributing to the promotion of sustainable development in the Yellow River Basin; (2) it constructs a long-term and large-scale analytical framework, which is more in line with the lagging characteristics of urban sprawl phenomena; and (3) it explores the differentiated driving factors of urban sprawl from the perspectives of economic geography, environmental science, and other disciplines, providing an accurate empirical basis for formulating basin-wide urban development policies.
Notwithstanding its contributions, this study still has certain data limitations: due to the halo effect, radiation saturation, and differences in sensor accuracy of NTL data, the results of urban area extraction still have some uncertainties despite the use of blooming correction and multi-temporal data consistency correction methods. Due to limitations in obtaining unified panel data at both long-term and large watershed scales, this study did not conduct rigorous driver analysis. Additionally, challenges in collecting nighttime lighting and socio-economic data for county-level units in the Yellow River Basin from 2000 to 2020 have prevented county-level analysis from being included. Future research will integrate multi-source data (e.g., high-resolution remote sensing and county statistical yearbooks) to conduct detailed studies on urban sprawl at the county level in the Yellow River Basin, thereby deepening our understanding of urban rural development disparities within the basin.
Based on the spatiotemporal pattern and agglomeration characteristics of urban sprawl, the following policy recommendations are proposed: (1) for high-density and high-spreading areas, strictly set development intensity and population density control targets, and strictly control the disorderly expansion of construction land; (2) for high-density and high-spreading areas, strictly set development intensity and population density control targets, and strictly control the disorderly expansion of construction land; and (3) differentiated management is implemented in the upper, middle and lower reaches of the Yellow River: the upper reaches focus on ecological protection and moderate development, the middle reaches emphasize intensive utilization and structural optimization, while the lower reaches strictly control sprawl and improve urban spatial quality.
Author Contributions
Research design, Q.C. and L.C.; data organization, R.F. and L.Z.; first draft preparation, Q.C.; data analysis, R.F. and L.Z.; visualization, R.F. and L.Z.; article revision, Q.C., R.F., L.Z. and L.C.; project guidance, Q.C. All authors have read and agreed to the published version of the manuscript.
Funding
This research was funded by The National Social Science Fund of China, grant number 21BJY117.
Institutional Review Board Statement
Not applicable.
Informed Consent Statement
Not applicable.
Data Availability Statement
The specific data sources have been indicated in the article. Further inquiries can be directed to the corresponding author.
Acknowledgments
The authors thank the anonymous reviewers for their valuable comments and suggestions on this article.
Conflicts of Interest
The authors declare no conflicts of interest.
References
- Wang, B.; Yan, X.L.; Bao, Z.X. Study on the impact of land use change on runoff production and confluence in urban areas. Hydro-Sci. Eng. 2025, 3, 25–36. [Google Scholar]
- Shi, S.Z.; Shi, Y.S. Multi-Dimensional Reflections of Urban Sprawl. Hum. Geogr. 2017, 32, 54–59. [Google Scholar]
- Sun, P.J.; Feng, X.P.; Sun, H. Comparative analysis of characteristics, effects and driving factors of urban sprawl in Changchun-Jilin during 2000–2009. Prog. Geogr. 2013, 32, 381–388. [Google Scholar]
- Chen, M.H.; Shi, N.; Li, Q. The Road to High-Quality Development of Major Strategic Regions in China in the New Era: Logic, Effectiveness, and Prospects. Rev. Econ. Manag. 2025, 41, 28–41. [Google Scholar]
- Zhao, Y.; Geng, Y.R.; Li, M.; Zhang, Z.F.; Zhang, P.J. Mobility constraints of residents in marginal rural areas of megacities: Evidence from Beijing, China. J. Transp. Geogr. 2025, 127, 104259. [Google Scholar] [CrossRef] [Scilit]
- Chettry, V. A critical review of urban sprawl studies. J. Geovisual. Spat. Anal. 2023, 7, 28. [Google Scholar] [CrossRef] [Scilit]
- Shi, Y.; Zhou, L.; Guo, X.; Li, J. The multidimensional measurement method of urban sprawl and its empirical analysis in the Shanghai metropolitan area. Sustainability 2023, 15, 1020. [Google Scholar] [CrossRef] [Scilit]
- Osman, T.; Arima, T.; Divigalpitiya, P. Measuring urban sprawl patterns in greater Cairo metropolitan region. J. Indian Soc. Remote Sens. 2016, 44, 287–295. [Google Scholar] [CrossRef] [Scilit]
- Mithun, S.; Sahana, M.; Chattopadhyay, S.; Johnson, B.A.; Khedher, K.M.; Avtar, R. Monitoring metropolitan growth dynamics for achieving sustainable urbanization (SDG 11.3) in Kolkata Metropolitan Area, India. Remote Sens. 2021, 13, 4423. [Google Scholar] [CrossRef] [Scilit]
- Pan, F.; Sun, Y.; Jiang, N.; Jian, Z.; Mei, Y.; Liu, Q. Analysis of the coordination of built-up area expansion and population growth in the Shandong Peninsula urban agglomeration. Sustainability 2023, 15, 7763. [Google Scholar] [CrossRef] [Scilit]
- Ungureanu, T.; Șoimoșan, T.M. An Integrated Analysis of the Urban Form of Residential Areas in Romania. Buildings 2023, 13, 2525. [Google Scholar] [CrossRef] [Scilit]
- He, R.L. Research on the Impact of Urban Form on Urban Energy Carbon Emissions Based on Nighttime Light Data. Master’s Thesis, Southwest Jiaotong University, Chengdu, China, 2023. [Google Scholar]
- An, Q.; Dong, Y.; Dong, W.; Xiao, S. Spatiotemporal dynamics and nonlinear landscape-driven mechanisms of urban heat islands in a winter city: A case study of Harbin, China. Sustain. Cities Soc. 2025, 133, 106842. [Google Scholar] [CrossRef] [Scilit]
- Genel, Ö.A.; Guan, C. Assessing urbanization dynamics in Turkey’s Marmara region using CORINE data between 2006 and 2018. Remote Sens. 2021, 13, 664. [Google Scholar] [CrossRef] [Scilit]
- Cieślak, I.; Biłozor, A.; Szuniewicz, K. The use of the CORINE land cover (CLC) database for analyzing urban sprawl. Remote Sens. 2020, 12, 282. [Google Scholar] [CrossRef] [Scilit]
- Liu, S.; Wu, P. The impact of urban sprawl on green total factor productivity: A spatial econometric analysis in China. Front. Environ. Sci. 2023, 11, 1095349. [Google Scholar] [CrossRef] [Scilit]
- Salvati, L. The ‘niche’ city: A multifactor spatial approach to identify local-scale dimensions of urban complexity. Ecol. Indic. 2018, 94, 62–73. [Google Scholar] [CrossRef] [Scilit]
- Zhao, L.; Zhou, X.Y. Spatiotemporal differentiation and influencing factors of urban economic resilience in the Yellow River Basin. J. Xi’an Univ. Financ. Econ. 2025, 38, 93–105. [Google Scholar]
- Lü, Q.; Zhang, L.Y.; Luo, Y. Spatiotemporal Pattern and Carbon Balance Zoning of County Land Use Carbon Emissions in the Yellow River Basin. Environ. Sci. 2025, 46, 6209–6220. [Google Scholar]
- Ghosh, T.; Baugh, K.E.; Elvidge, C.D.; Zhizhin, M.; Poyda, A.; Hsu, F.C. Extending the DMSP nighttime lights time series beyond 2013. Remote Sens. 2021, 13, 5004. [Google Scholar] [CrossRef] [Scilit]
- Alahmadi, M.; Mansour, S.; Martin, D.; Atkinson, P.M. An improved index for urban population distribution mapping based on nighttime lights (DMSP-OLS) data: An experiment in Riyadh Province, Saudi Arabia. Remote Sens. 2021, 13, 1171. [Google Scholar] [CrossRef] [Scilit]
- Cauwels, P.; Pestalozzi, N.; Sornette, D. Dynamics and spatial distribution of global nighttime lights. EPJ Data Sci. 2014, 3, 2. [Google Scholar] [CrossRef] [Scilit]
- Jin, Y.K.; Zhang, H.; Lu, Z.P. Spatial and temporal evolution of urban expansion in India from 2000 to 2020. World Reg. Stud. 2025, 34, 168–181. [Google Scholar]
- Liang, Y.Z.; Wei, Y.; He, J.Y. Spatiotemporal evolution and influencing factors of urban growth and shrinkage in Central and Southern Liaoning: Based on the perspective of physical urban area. Resour. Sci. 2024, 46, 1103–1118. [Google Scholar] [CrossRef] [Scilit]
- Lebakula, V.; Sims, K.; Reith, A.; Rose, A.; McKee, J.; Coleman, P.; Bright, E. LandScan Global 30 arcsecond annual global gridded population datasets from 2000 to 2022. Sci. Data 2025, 12, 495. [Google Scholar] [CrossRef] [Scilit] [PubMed]
- Pan, H.P.; Xu, Y.H.; Li, N.N. Research on the Transmission Mechanism and Impact of Innovation Infrastructure Investment on Regional Economic Development. Invest. Res. 2022, 41, 73–90. [Google Scholar]
- Guan, P. Study on the Changes of Urban Patterns in Yunnan-Burma Region Based on Night Lights. Master’s Thesis, Yunnan University, Kunming, China, 2020. [Google Scholar]
- Li, X.; Chen, Z.J.; Wu, J.X. Gridding methods of city permanent population based on night light data and spatial regression models. J. Geo-Inf. Sci. 2017, 19, 1298–1305. [Google Scholar]
- Guan, J.Y.; Li, D.; Wang, Y.F. Correction of nighttime light images of DMSP/OLS in China. Bull. Surv. Mapp. 2021, 7, 127. [Google Scholar]
- Li, M.S.; Qian, Y.G.; Guo, C.M. A new method of Urban built-up area mapping based on road network patches. Acta Ecol. Sin. 2024, 44, 10989–11003. [Google Scholar]
- Fan, J.; Zhou, L. Three-dimensional intergovernmental competition and urban sprawl: Evidence from Chinese prefectural level cities. Land Use Policy 2019, 87, 104035. [Google Scholar] [CrossRef] [Scilit]
- Liu, L.; Leung, Y. A study of urban expansion of prefectural level cities in South China using night-time light images. Int. J. Remote Sens. 2015, 36, 5557–5575. [Google Scholar] [CrossRef] [Scilit]
- Qiang, L. The Definition and the Measurement Method of Urban Sprawl in Western Countries. J. Beijing Univ. Technol. 2006, 32, 817–820. [Google Scholar]
- Chettry, V. Geospatial measurement of urban sprawl using multi-temporal datasets from 1991 to 2021: Case studies of four Indian medium-sized cities. Environ. Monit. Assess. 2022, 194, 860. [Google Scholar] [CrossRef] [Scilit]
- Chettry, V.; Surawar, M. Urban sprawl assessment in eight mid-sized Indian cities using RS and GIS. J. Indian Soc. Remote Sens. 2021, 49, 2721–2740. [Google Scholar] [CrossRef] [Scilit]
- Barabesi, L.; Crescenzi, F.; Mori, L. Theil index estimation by means of the influence function with an application to income surveys. J. R. Stat. Soc. Ser. A Stat. Soc. 2025, qnaf143. [Google Scholar] [CrossRef] [Scilit]
- Conceição, P.; Galbraith, J.K. Constructing long and dense time-series of inequality using the Theil index. East. Econ. J. 2000, 26, 61–74. [Google Scholar] [CrossRef] [Scilit]
- Shorrocks, A.; Wan, G. Spatial decomposition of inequality. J. Econ. Geogr. 2005, 5, 59–81. [Google Scholar] [CrossRef] [Scilit]

Disclaimer/Publisher’s Note: The statements, opinions and data contained in all publications are solely those of the individual author(s) and contributor(s) and not of MDPI and/or the editor(s). MDPI and/or the editor(s) disclaim responsibility for any injury to people or property resulting from any ideas, methods, instructions or products referred to in the content. |
© 2026 by the authors. Licensee MDPI, Basel, Switzerland. This article is an open access article distributed under the terms and conditions of the Creative Commons Attribution (CC BY) license.