


Abstract
As the net gain of carbon by plants after accounting for respiration, vegetation net primary productivity (NPP) plays a central role in the terrestrial carbon cycle. However, a systematic and quantitative analysis of the spatiotemporal evolution and driving mechanisms of vegetation NPP on Hainan Island, a tropical region, is still lacking. Focusing on Hainan Island, this study employs an integrated approach—including the coefficient of variation, Mann–Kendall test, Hurst exponent, geographical detector, and PLS-SEM—to investigate the spatiotemporal dynamics of vegetation NPP and its underlying drivers from 2001 to 2022. The main conclusions as follows: (1) Vegetation NPP on Hainan Island showed a fluctuating upward trend from 2001 to 2022, with a mean annual increase of 3.6 g C·m−2·yr−1, and displayed a spatial pattern of decrease from the central-southern mountainous areas toward the coastal regions. (2) NPP changes were generally stable; historically, areas showing an increasing trend exceeded those with a decreasing trend by 30.55%. In the future, the predominant projected trends are “persistent decrease” and “increase to decrease,” which together account for over 80% of the total area. (3) Topography and climate were the dominant drivers of NPP spatial heterogeneity. Elevation had the strongest explanatory power, followed by evapotranspiration and temperature. A significant, nonlinear enhancement effect was observed in the interaction between any two factors. (4) Topographic, climatic, anthropogenic, and vegetation factors all exerted direct positive effects on vegetation NPP. Anthropogenic activities also indirectly promoted NPP by influencing pathways such as vegetation growth. The conclusions of this research provide support for the implementation and evaluation of land-use planning, afforestation projects, and ecological protection and restoration measures on Hainan Island.
1. Introduction
Net primary productivity (NPP) is defined as the balance between gross primary productivity (GPP) and autotrophic respiration (RA), measuring the net production of plant biomass through photosynthesis within a given area and time period [1]. Functionally, NPP quantifies the net carbon fixed by vegetation, making it a pivotal indicator for assessing the productivity, overall quality, and carbon dynamics of terrestrial ecosystems [2,3,4]. Furthermore, NPP is impacted by a combination of various factors [5], and its driving mechanisms are complex. Therefore, exploring the evolution features of NPP and its driving mechanisms is of significant academic and practical importance for promoting the sustainable development of terrestrial ecosystems, monitoring changes in regional ecological environmental quality, and advancing ecological civilization construction.
In the early stages of research, scholars primarily conducted quantitative assessments of regional NPP by establishing ground monitoring points [6]. However, the representativeness of these assessments was largely limited to the ecosystems surrounding the monitoring stations, making it insufficient for expansive monitoring needs and challenging to accurately reflect the spatial variation characteristics of NPP [7]. In recent years, there has been a shift in research methods, with the extensive use of remote sensing data and models in NPP studies, including the Miami [8], CASA [9,10], and the BIOME-BGC model [11]. Next, NPP data products were released, such as the MODIS NPP dataset [12,13] and GLASS [14]. Among these, MODIS NPP datasets are superior and widely used in global ecological management due to larger spatial coverage. Some scholars have estimated the NPP of Anhui Province in China from 2001 to 2020 using improved models and validated the results with observed NPP data, revealing strong values, with R2 = 0.736, indicating that remote sensing models can accurately estimate the NPP values over large areas [15].
Currently, research on NPP has shifted from characterizing its temporal and spatial patterns to a deeper analysis of its driving mechanisms. Among these, topographical conditions, climatic factors, and anthropogenic activities are the primary driving forces in NPP research; however, the mechanisms through which these factors influence NPP exhibit significant spatial heterogeneity. For instance, Shi [16] deeply analyzed the relative effects of climate on NPP variations based on the MOD17A3HGF data, and it was found that precipitation as a factor can obviously impact the NPP compared to temperature. Nevertheless, the research of Yin [17] and Zhang [18] in the Yellow River region found that temperature exhibits stronger influences on NPP. Additionally, Qi et al. [19] selected the Dong-ting Lake basin as study region and found that solar radiation is the most important impacting factor for NPP. Moreover, the influence of anthropogenic activities on NPP is different in various region; in some areas, it can promote NPP growth [1], or else it may not [1,20]. Hence, it is very necessary to investigate the complex driving mechanisms of NPP, and it has become a hotspot in this field.
Hainan Island is a key part of China’s terrestrial ecosystem [21]. It has complex tropical and island features [22]. NPP is mainly used to evaluate the ecological health condition of a region [23,24]. Nevertheless, with the expansion of tourism, and rapid development of industry, its ecological environment changes seriously, and faces severe challenges [25]. For its small area [26,27,28], the island often faces climate-related threats, which are the main cause of harmful influences on its ecosystems [29,30]. Recently, a study on the spatiotemporal changes of NPP and its mechanism have attracted wide attention, and mainly focused on climate-sensitive regions like the Loess Plateau [31,32] and subtropical areas [17]. And it was reported that topographical factors and anthropogenic activities [33] are the main impacting factors for NPP, and the effect varies in different regions [21]. In tropical areas, some scholars emphasize the influence of the aforementioned factors on NPP [34], and often overlook the interaction effects of different factors on NPP variations, and lack a deep quantitative analysis [35]. Hainan Island hosts diverse vegetation that is very sensitive to climate change and anthropogenic activities. As a critical index for monitoring vegetation dynamics, net primary productivity (NPP) currently lacks sufficient quantitative research on Hainan Island, and the influence of weather and human actions on NPP and their contributing mechanisms remain unclear. Therefore, systematic monitoring of the spatiotemporal dynamics of NPP on Hainan Island holds significant scientific importance.
Based on the above, this study focuses on the NPP of Hainan Island. Utilizing remote sensing data related to climatic factors, topographical factors, and anthropogenic activities, to quantify the spatiotemporal evolution and to decipher the underlying drivers of vegetation NPP in Hainan Island (2001–2022), we combined trend analysis with a geographical detector and PLS-SEM methods. The objectives are as follows: (1) to explore the spatial-temporal evolution feature and future trends of it from 2001 to 2022 using trend analysis; (2) to clarify the main driving factors of it from the aspect of topographical factors, climatic factors, vegetation factors, and anthropogenic activities; and (3) to parse the pathways (both direct and indirect) through which diverse factors influence the spatial patterns of vegetation growth, employing the PLS-SEM model. The aim is to assess the ecological restoration effectiveness of interventions such as returning farmland to forest, returning ponds to forest (wetland), and ecological protection and restoration on Hainan. The findings will benefit future policy-making and offer ecological evidence for achieving carbon neutrality strategies.
2. Materials and Methods
2.1. Study Area
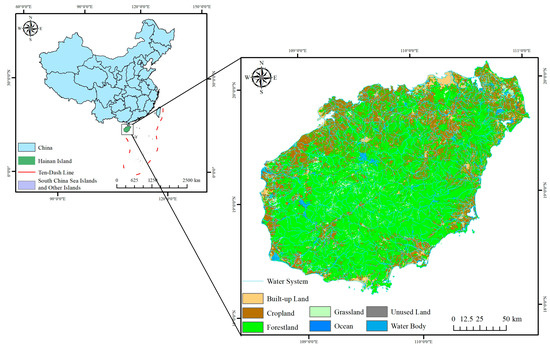
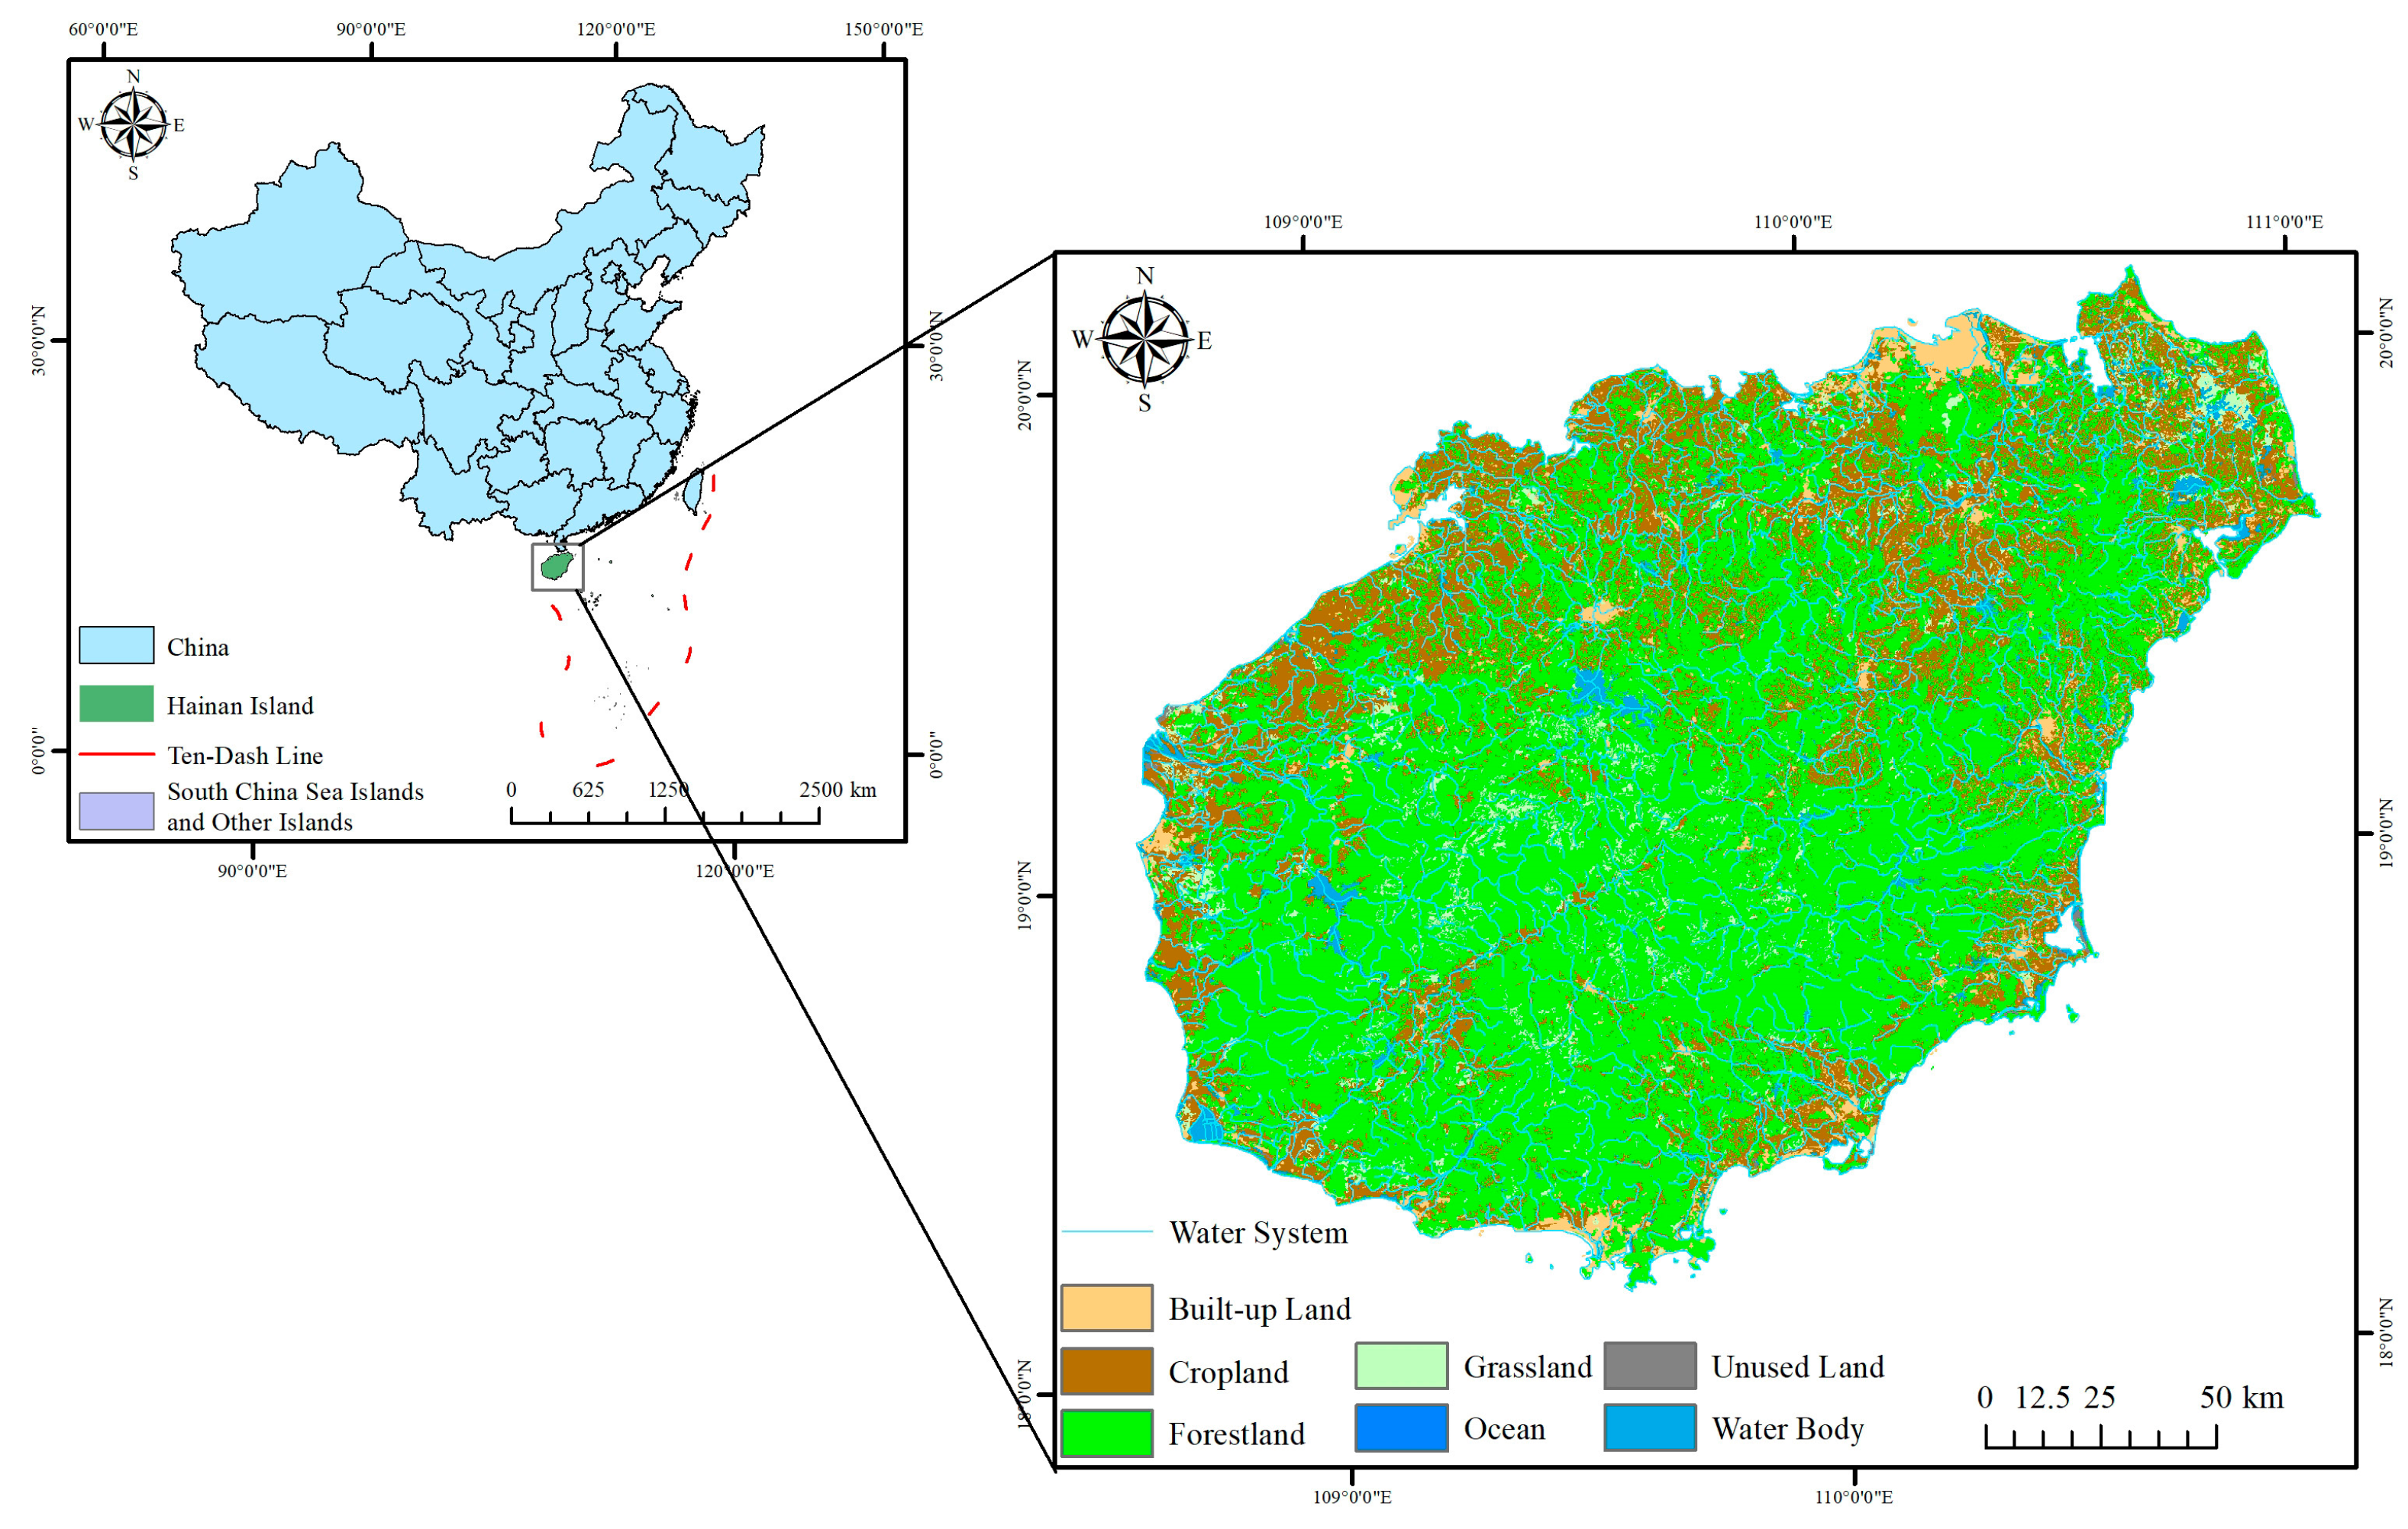
Hainan Island is located between 18°10′ N and 20°10′ N latitude, as shown in Figure 1. The geographical area of the study area is 33,900 km2. Hainan Island has distinct topographical features, with a high central region surrounded by lower areas, creating a unique landscape of mountains and hills. Approximately 38.7% of its terrain is mountainous or hilly, with plains predominantly distributed in coastal regions. The island experiences a tropical monsoon marine climate, with an average annual temperature ranging from 22.5 °C to 25.6 °C [36]. This island is a biodiverse region in China. Biologists named it a famous natural museum. Vegetation mainly includes tropical rain forests, mangrove forests, and coniferous forests.
Figure 1.
Overview of Hainan Island.
2.2. Data and Methods
2.2.1. Data Sources
In this research, annual average NPP and impacting factor data for the Hainan Island ecosystem from 2000 to 2022 were selected. The relevant data include four categories: climatic factors (rainfall, temperature), topographical factors (aspect, slope), vegetation factors (NDVI), and human activity factors (Gross Domestic Product (GDP), population, nightlights, and land use (LUCC)). The details are shown in Table 1.
Table 1.
Data sources.
The spatial resolution of all data was standardized to 1 km using ArcGIS 10.8.
2.2.2. Methods
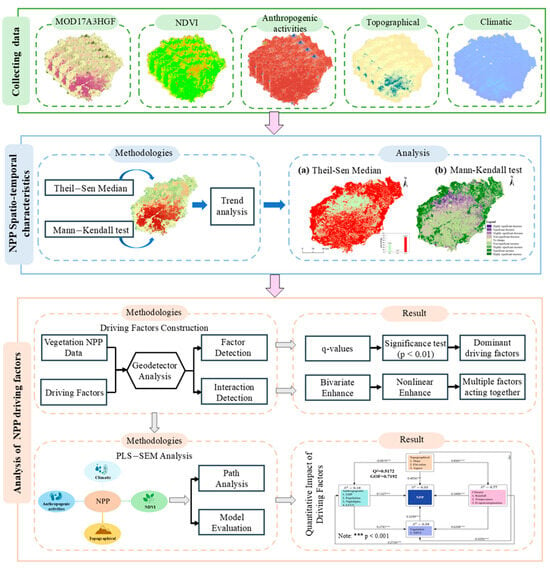
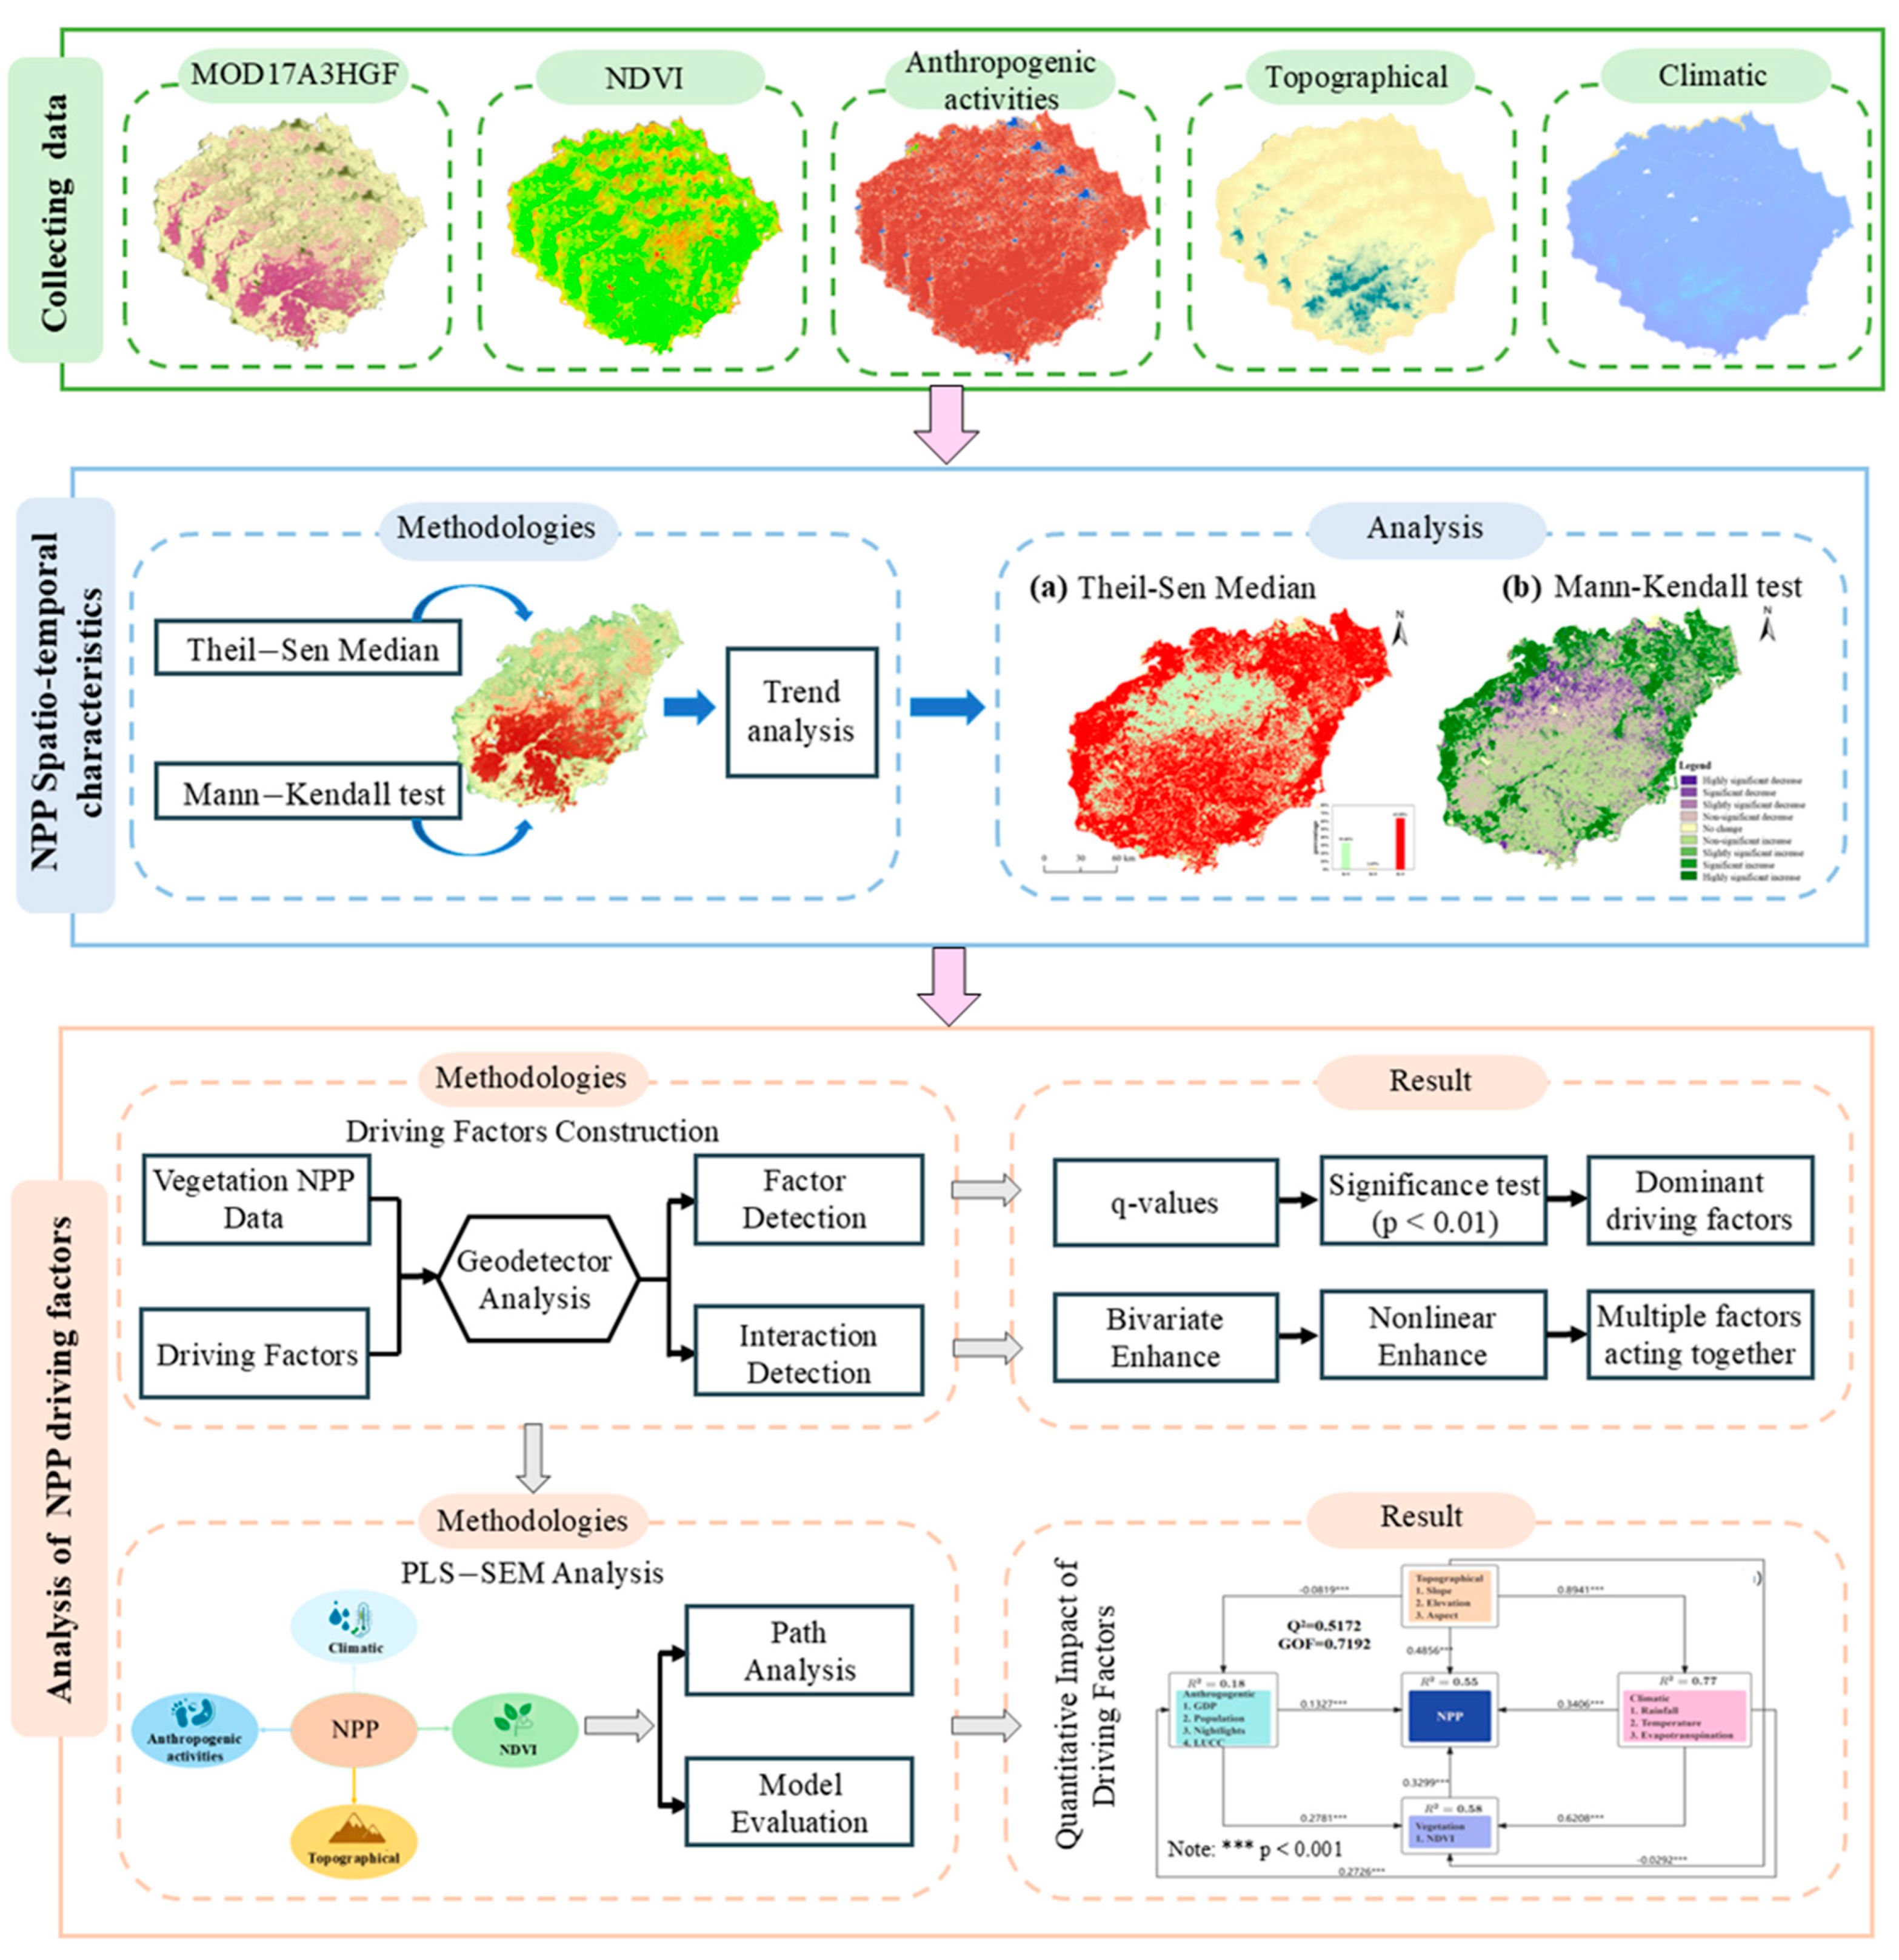
This study explores the spatiotemporal evolution features and main impacting factors of NPP in vegetation from 2001 to 2022, establishing a framework comprising “multi-source data integration—spatiotemporal evolution analysis—driving mechanism identification—quantitative image assessment.” The main workflow of this research is as follows (Figure 2): (1) Data collection, such as acquisition of MODIS NPP products (MOD17A3HGF), normalized difference vegetation index (NDVI), meteorological factors (temperature, etc.), human activity intensity data, and topographic factors (slope, etc.); (2) analysis of spatiotemporal NPP variation characteristics, combining Theil–Sen median estimation with Mann–Kendall nonparametric tests to quantitatively characterize NPP trends and their significance; (3) analysis of NPP driving factors; statistical association in NPP and main impacting factors were established using geographic detectors. Additionally, the influence pathways of the driving factors on NPP were examined using partial least squares structural equation modeling (PLS-SEM).
Figure 2.
Study framework.
Coefficient of Variation and Trend Significance
This section presents the description and quantification of the spatial temporal variations and changing trends in vegetation net primary productivity (NPP) on Hainan Island from 2001 to 2022, providing data support for subsequent spatial analyses. To evaluate the stability of NPP from 2001 to 2022, the coefficient of variation (CV) was calculated. Concurrently, the Mann–Kendall significance test was applied to detect regions with statistically significant trends.
(1) Coefficient
The CV serves as a statistical measure of the variability of observational data [37], where a higher value indicates greater variability and instability of NPP over time, while a lower value suggests relative stability [38]. The coefficient of variation (CV) is expressed as in Equation (1) [39]:
In this context, CV represents the coefficient of vegetation NPP on Hainan Island from 2001 to 2022; SDNPP means the SD of vegetation NPP (2001–2022); denotes the mean NPP (2001–2022); NPPi indicates the NPP value for year i; and n represents the time series, which is set to 22 in this study. In ArcGIS, CV is reclassified as follow [40]: very stable (CV ≦ 0.1), stable (0.1–0.2), unstable (0.2–0.3), very unstable (>0.3).
(2) Theil–Sen median slope analysis
This method was applied to analyze the trend characteristics of vegetation NPP on Hainan Island (2001–2022), and the significance was checked using the Mann–Kendall test [41]. The formula for this method is as follows in Equation (2):
In this context, K represents the Sen slope; median refers to the median function; NPPj − NPPi is the difference of the NPP value at time-points j and i. K > 0 corresponds to upward trend in NPP, while K < 0 means a contrary trend in NPP within the time series.
(3) Mann–Kendall tests
This test was used for the significance testing of the results obtained from the Sen trend analysis. It does not need the measurements to follow a normal distribution. To ensure the statistical reliability of the analysis results of NPP, this study employed the Mann–Kendall test to assess the significance of the temporal variation in NPP on Hainan Island. This method serves to clarify the pattern of change in NPP and to validate the results of such analysis. The formula is detailed in Equation (3):
In this context, n means the data series length, and is a sign function. The calculation formula is as follows (4):
The trend test is conducted via the test statistic Z, and can be calculated by Equation (5):
The Var formula is Equation (6):
in which n is the number of data, m means the knots number, and ti represents the width of the knot. A two-sided trend test was employed in this study; see the references for details [42].
Analysis of Future Trend Persistence (Hurst Index)
To assess whether the observed historical trends in NPP have a high possibility to continue in future, we employed the Hurst exponent (H) analysis. The H is a statistical measure derived from the R/S (rescaled range) analysis, originally applied in hydrology [43] and later adopted in fields like finance and ecology [44,45,46]. It quantifies the long-term memory or persistence of a time series. The value of H ranges between 0 and 1. An H value between 0 and 0.5 indicates that the future trend is likely to be opposite to the past (anti-persistence), H = 0.5 means a random (non-persistent) series, and H between 0.5 and 1 signifies that the future trend will likely follow the past trend (positive persistence), with values near 1 indicating stronger persistence [38].
In the whole research process, this step is a foundational temporal analysis. It identifies regions of NPP that vary with persistent trends, the spatial type of these trends, and guides for finding the potential drivers used for the following explicit methods. The Hurst exponent for the NPP time was calculated based on the following formulas [19]:
in which represents the long time series NPP, is the range, is the SD, and H means the Hurst index, in the range of 0–1.
Geodetector Analysis for Driver Identification and Interaction
According to the regions with obvious NPP trends, this research used the Geodetector model to determine the explanatory level of every driving factor and their interactions’ effects. This method uses GIS models to analyze the causal relationships according to the value of spatial distribution consistency [47,48]. First, four categories of driving factors were treated to obtain unified temporal and spatial resolutions. Subsequently, the data were reclassified using the Natural Breaks method. The Geodetector toolkit for ArcGIS Pro was downloaded from the official website to complete the analysis. This research mainly used factor and interaction detection, and the corresponding calculation methods are as follows:
(1) Factor detection
It quantifies the explanatory power of each driving factor for the spatial heterogeneity of NPP through the q-value, with a larger q-value indicating stronger explanatory strength [49]. The calculation is based on comparing the within-stratum variance (SSW) to the total variance (SST). Its value can be determined by Equations (12)–(14):
in which h is the stratification of Y or X; N is the number of cells; is the variance of y-value; is the variance of h-values; and SST is the total variance in the whole region.
(2) Interaction detection
This evaluates whether two driving factors (X1 and X2) interact to enhance or decrease their influence on NPP. Based on comparing q(X1), q(X2), and q(X1∩X2), we can determine if the combined effect is nonlinear-enhancing, bi-enhancing, independent, or weakening (Table 2).
Table 2.
Categories of the interaction effect between X1 and X2 on Y.
Partial Least Squares SEM (PLS-SEM)
To synthesize the research findings and examine the complex, hierarchical relationships among driving factors suggested by the Geodetector results, we employed Partial Least Squares Structural Equation Modeling (PLS-SEM). PLS-SEM is a variance-based multivariate technique suitable for complex models, non-normal data, and relatively small sample sizes [50]. We employed a grid-based sampling method, selecting a total of 39,535 sample points for this study. This method was used to calculate the contributions of climatic factors, topographical factors, vegetation factors, and anthropogenic activities to variation of NPP, and to quantify their effects. The analysis was performed on piecewiseSEM in R [51].
The linear equations related to latent variables are as follows in Equation (15) [52]:
where means the endogenous latent variables; represents the exogenous latent variables; denotes the path coefficients; and means the random error term of model.
The linear equations representing the relation in latent and observed variables in the model can be determined as follows in Equation (16):
where represents the observed variables; denotes the latent variables; means the factor loadings of the j-th observed variable corresponding to the k-th principal component; and is an error term.
To evaluate the reliability of the above models, the index of (R2), (Q2), and goodness-of-fit (GOF) were employed as model fit criteria [53]. The explanatory ability of the structural model was interpreted by established R2 thresholds; values above 0.67, 0.33, and 0.19 mean substantial, moderate, and weak explanatory power, respectively. Predictive relevance is confirmed when Q2 > 0, with higher values representing greater predictive accuracy of the model. Following conventional criteria, a global GOF value of 0.1 was considered weak, 0.25 medium, and 0.36 strong.
3. Results
3.1. Spatial-Temporal Evolution Features of Vegetation NPP
3.1.1. Temporal Variation Features
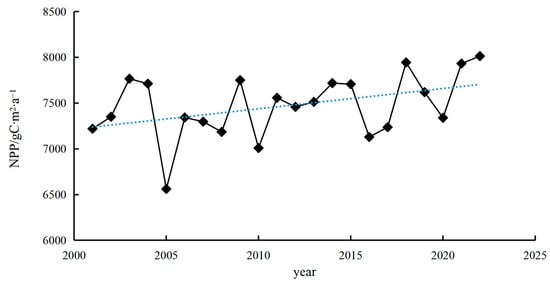
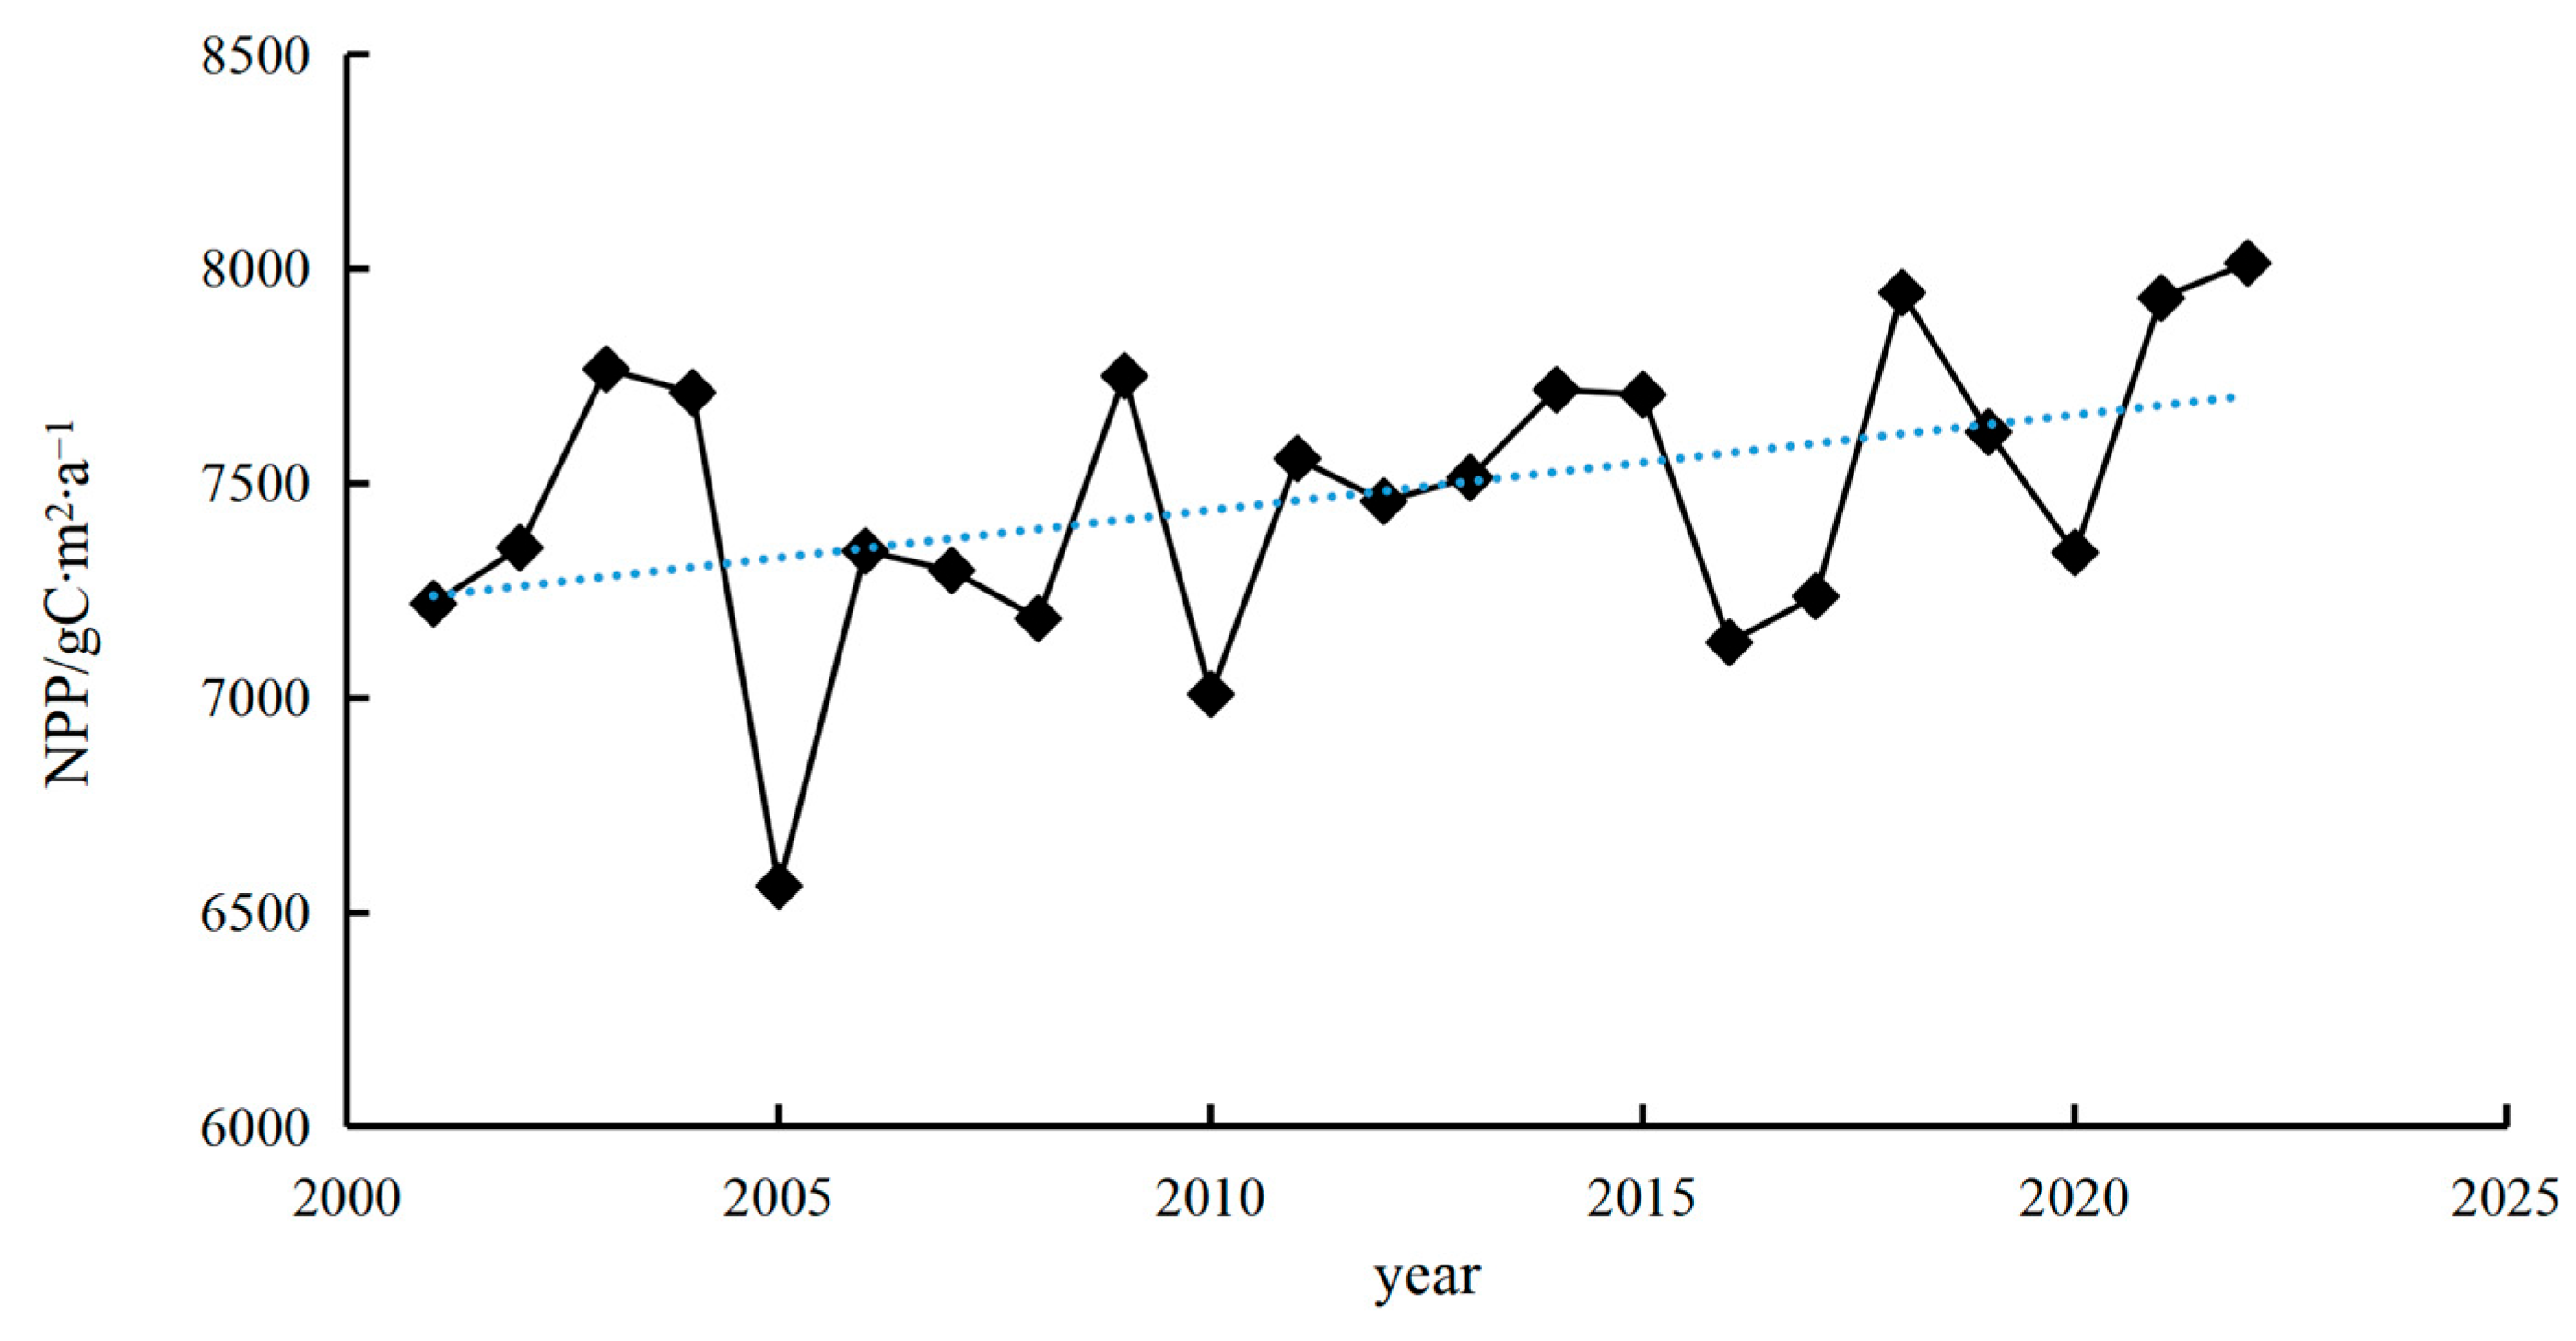
The trend of vegetation NPP on Hainan Island (2001–202) shows an increasing trend, as indicated by the blue standard regression line in Figure 3, which shows an upward trend with a mean annual increase of 0.036 kg C·m2·a−1. The mean range of NPP variation is between 6.56 and 8.01 kg C·m2·a−1, with a mean annual value of 7.47 kg C·m2·a−1, where the lowest and largest values occur in 2005 and 2022, respectively. Additionally, Figure S1 presents the annual average NPP for different land use types on Hainan Island from 2001 to 2022. The results indicate that forestland type has the highest annual average NPP at 9.95 kg C·m2·a−1. The dynamic process of NPP values across various land use types shows a high consistency with the overall changes in vegetation NPP, all exhibiting an increasing trend. However, the trends differ, with arable land showing the greatest interannual variation in NPP, while the change in NPP for forestland is the slowest among all land use types.
Figure 3.
Characteristics of vegetation NPP changes on Hainan Island from 2001 to 2022 (Dash line: Trend line).
3.1.2. Spatial Variation Features
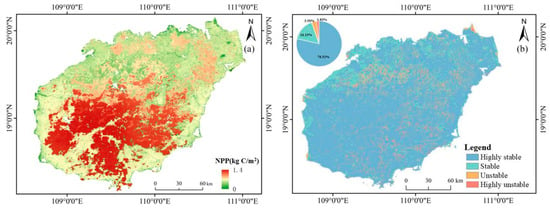
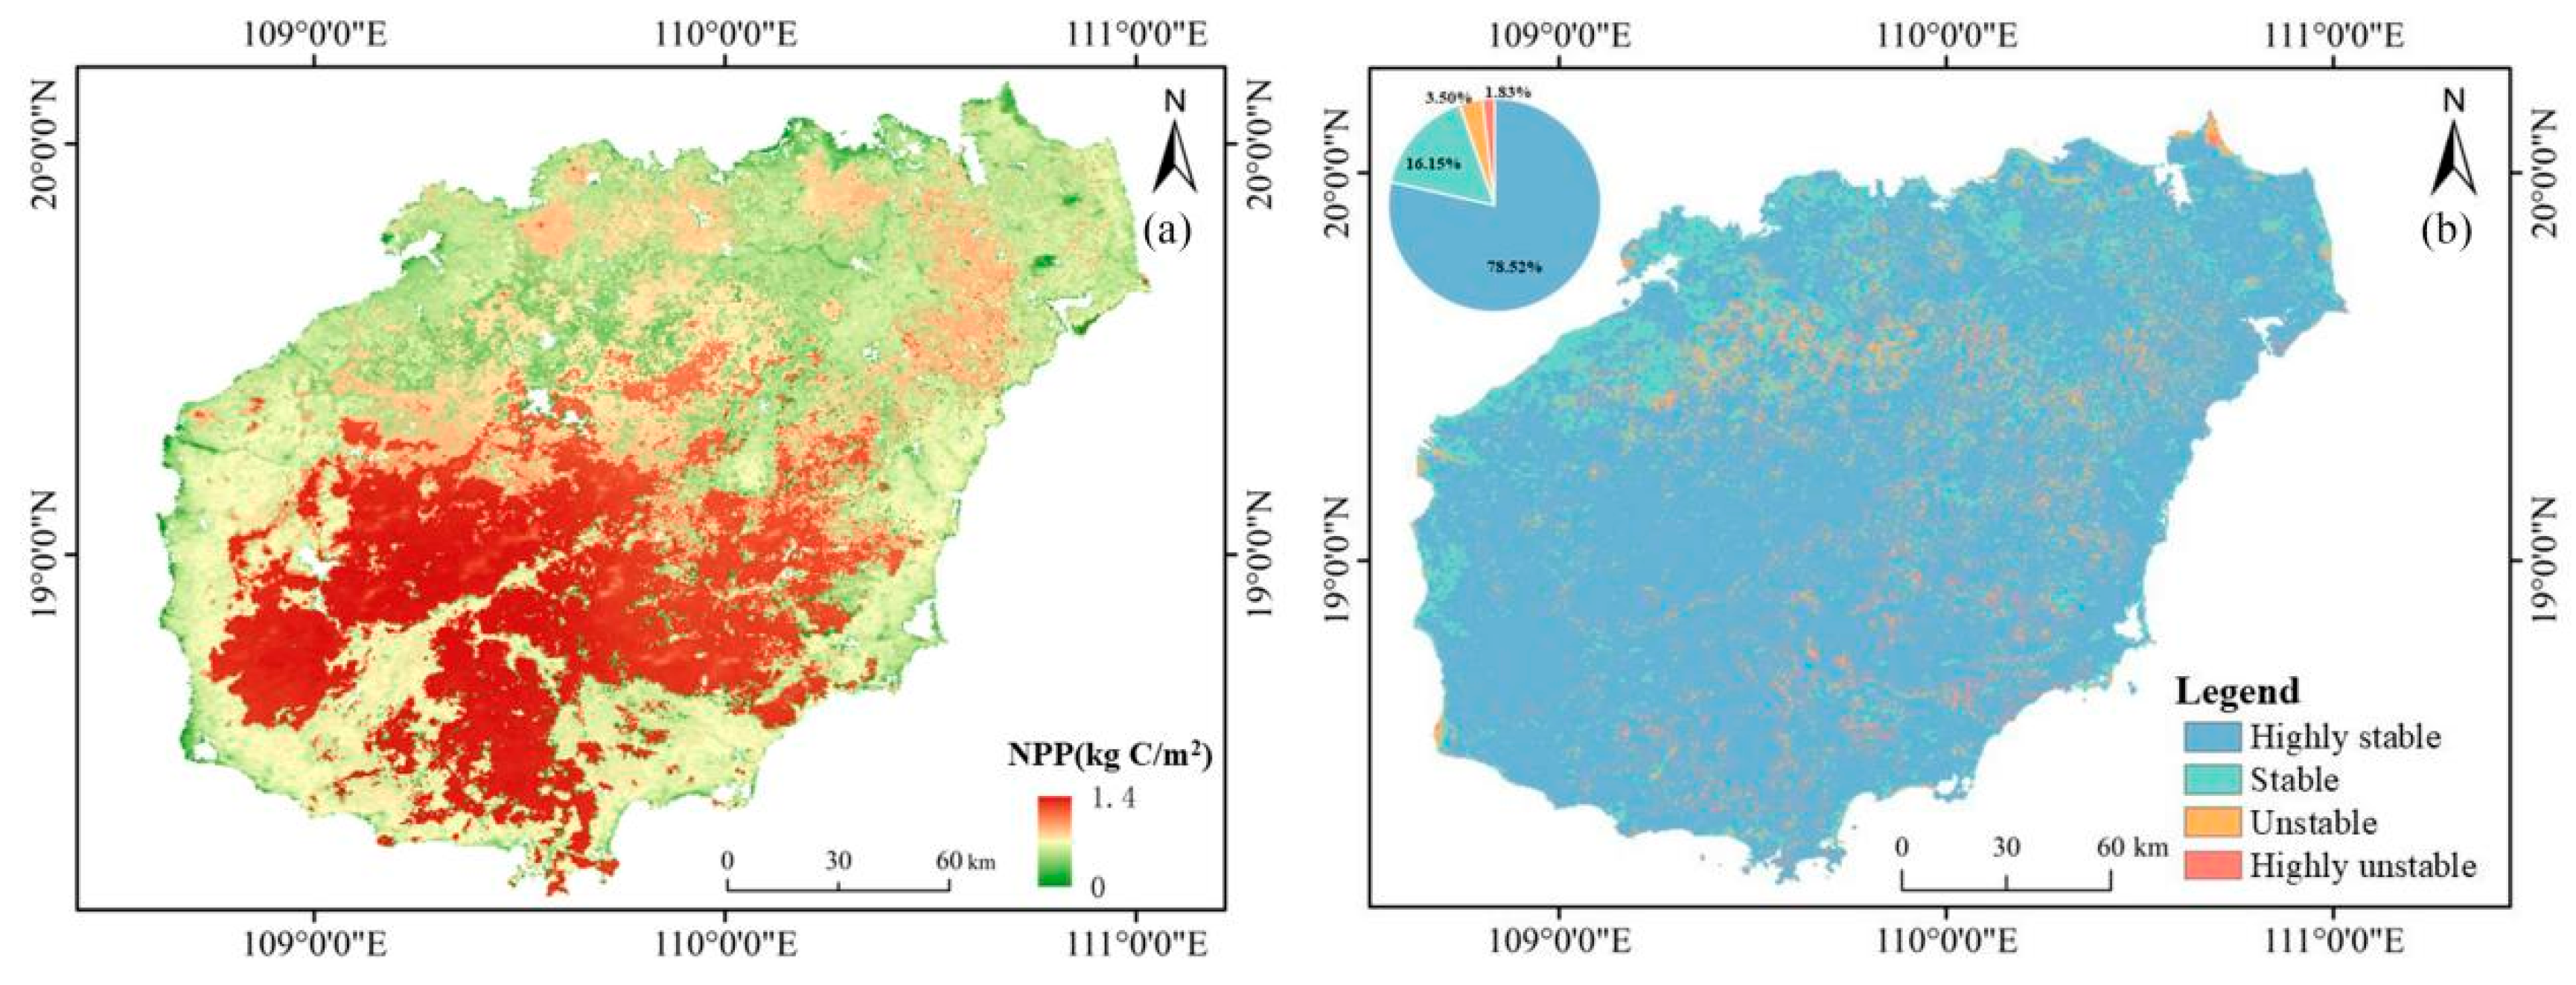
The spatial variation characteristics of vegetation NPP on Hainan Island are illustrated in Figure 4. Specifically, Figure 4a presents the spatial distribution of it from 2001 to 2022. The results indicate that vegetation NPP on Hainan Island exhibits significant non-uniformity, with a variation range from 0 kg C·m2·a−1 to 1.4 kg C·m2·a−1. The areas with the highest NPP are predominantly found in the southern mountainous part of the central region, i.e., within the Hainan Tropical Rainforest National Park—an area renowned for its dense forest cover, high biodiversity, and rich floristic composition. Furthermore, as a protected area, the national park effectively limits over-exploitation and the disturbances from anthropogenic activities, thus enhancing the photosynthetic efficiency of the vegetation. In contrast, the northeastern region shows relatively lower NPP values, significantly influenced by anthropogenic activities. Frequent land use changes, like city and agricultural development, have caused a reduction in natural vegetation and a decline in soil quality, thereby significantly reducing the NPP in this area.
Figure 4.
Spatial characteristics of vegetation NPP in Hainan Island, 2001–2022. (a) Mean Annual NPP; (b) coefficient of variation (CV) of NPP.
Based on the CV, Figure 4b illustrates the spatial distribution of the CV values of vegetation NPP in the study period. The results reveal significant regional differences. The fluctuations in NPP are tending to stabilize, predominantly characterized by areas of high stability and stability, which cover 94.67% of Hainan Island. In contrast, the areas classified as unstable and highly unstable account for only 5.33%, scattered in regions affected by coastal town expansion, rapid land use transformation, and areas significantly impacted by extreme weather events such as typhoons and heavy rainfall. Overall, vegetation NPP on Hainan Island exhibits a relatively stable trend, indicating a low level of external disturbance and a strong self-repair capability, along with a generally favorable ecological environment on the island.
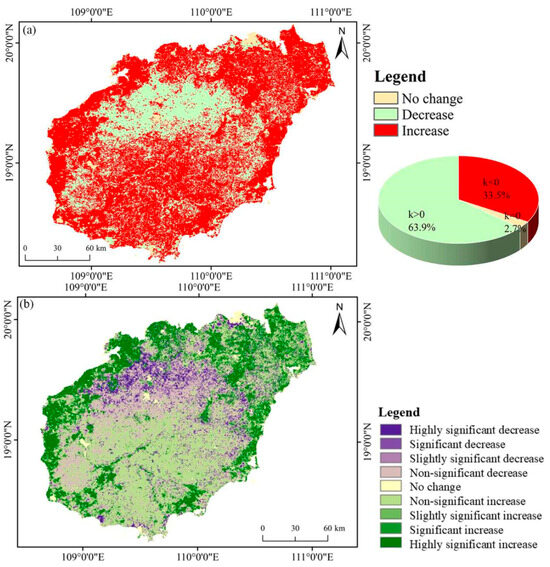
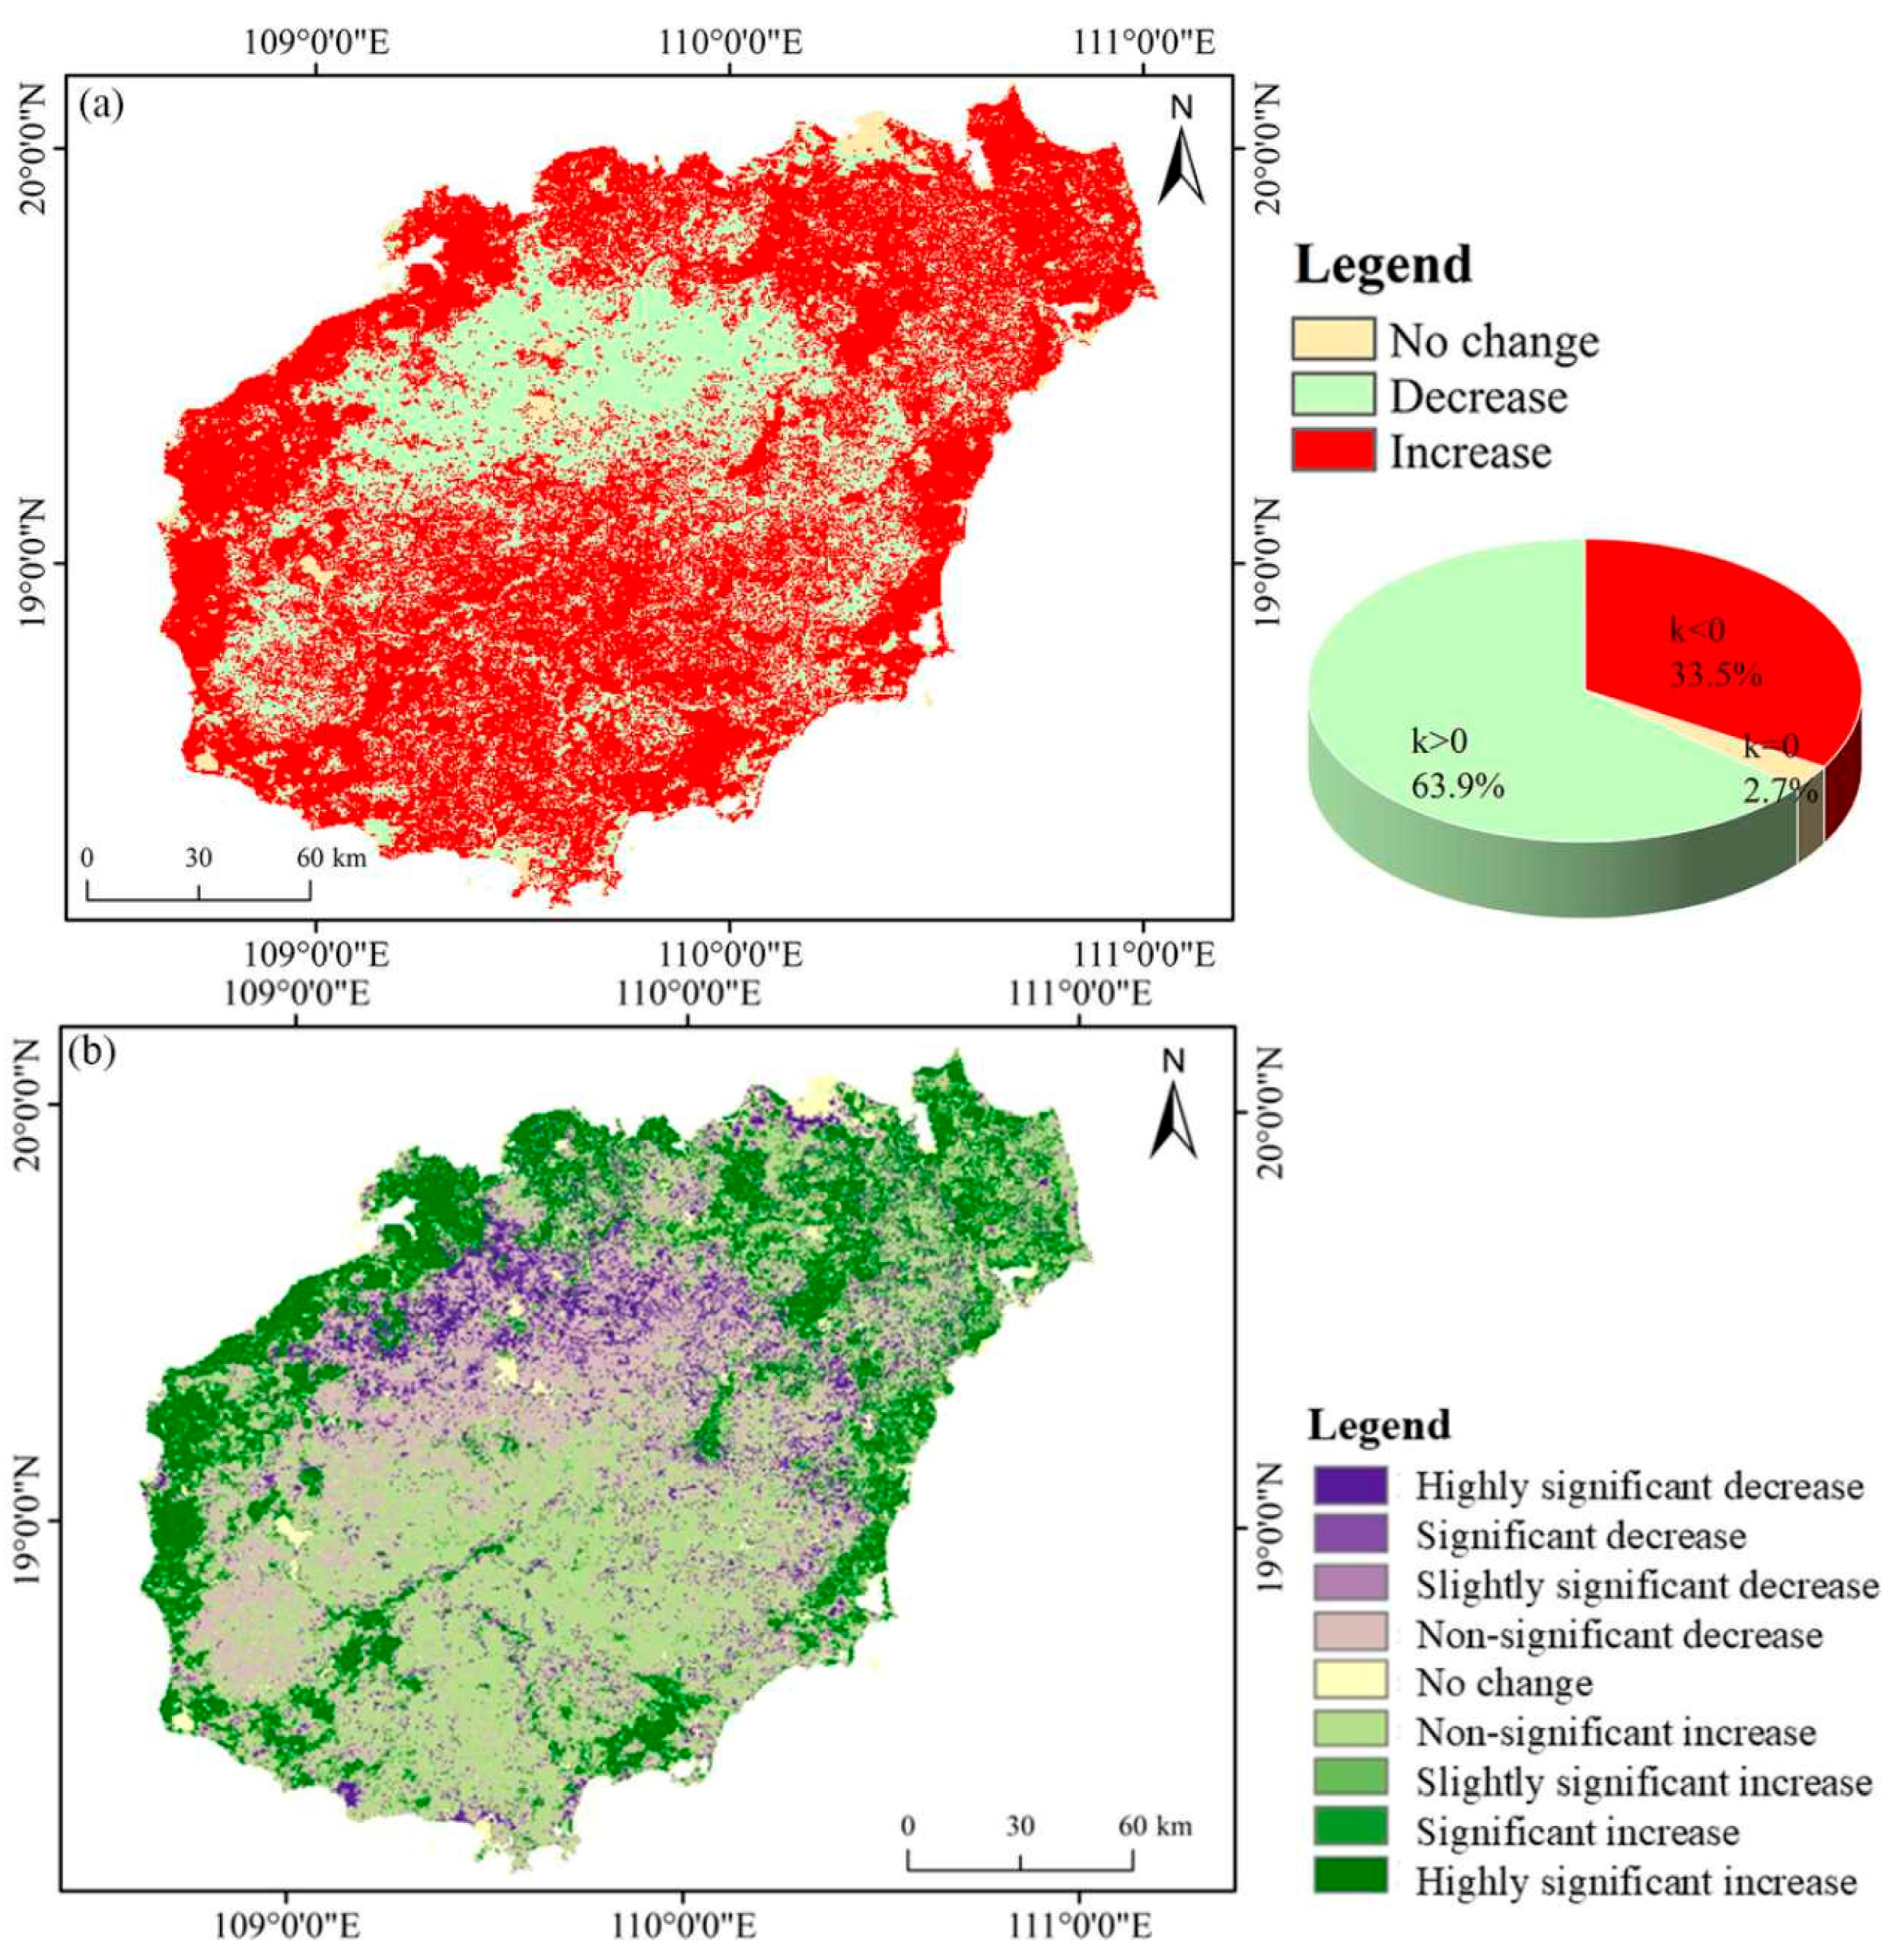
Figure 5 shows the results of the spatial trend analysis on Hainan Island from 2001 to 2022. The results based on the Sen trend analysis (Figure 5a) indicate that the overall pattern of vegetation NPP during the study period is primarily increasing, with areas of NPP increase accounting for 63.88%, while areas of decrease cover 33.46%, and areas of no statistically significant trend are only 2.65%. This overall reflects a positive development in the productivity of the island’s ecosystem vegetation. Furthermore, combining the Mann–Kendall trend test effectively characterizes the historical variation of it. The historical trend of vegetation NPP on Hainan Island shows an overall upward trend (Figure 5b). Regions showing increases of varying significance levels (slight, significant, and highly significant) collectively constitute 28.75% of the area and are predominantly clustered in the northeastern and northwestern parts of the island. These areas have relatively favorable climate conditions that are proper for vegetation growth, and the significant improvements in the ecological environment can be largely credited to agricultural development, the conversion of farmland back to forest, and the restoration of wetland ecosystems. The proportion of regions with no obvious increase is 35.13%, mainly located in the southern area, which is designated as a tropical rainforest national park with minimal human activity interference and no significant changes in the ecological environment. Regions showing a significant decreasing trend account for 11.1%, concentrated in the northwestern area of the central region. This area is predominantly influenced by frequent anthropogenic activities, such as urban expansion and agricultural development, as well as drought conditions limited by the leeward slopes of the monsoon, collectively leading to a reduction in natural vegetation and a decline in soil quality, thus significantly reducing the NPP in this region.
Figure 5.
Spatiotemporal trends of vegetation NPP on Hainan Island (2001–2022). (a) Spatial pattern of the Theil–Sen median trend; (b) statistical significance of trends (Mann–Kendall Test).
3.2. Analysis of Driving Factors of Vegetation NPP
3.2.1. Factor Detection
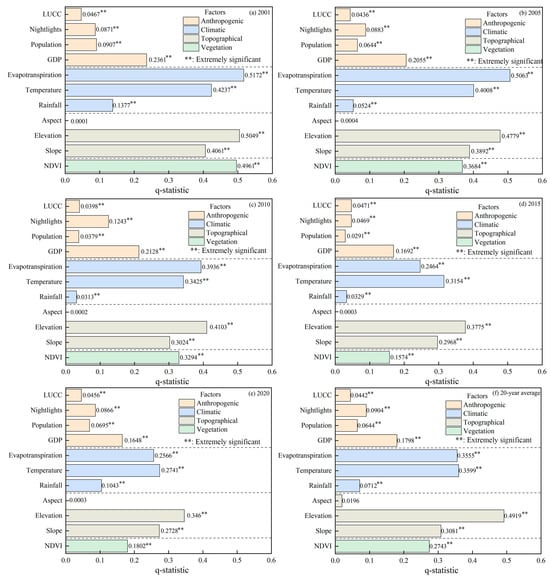
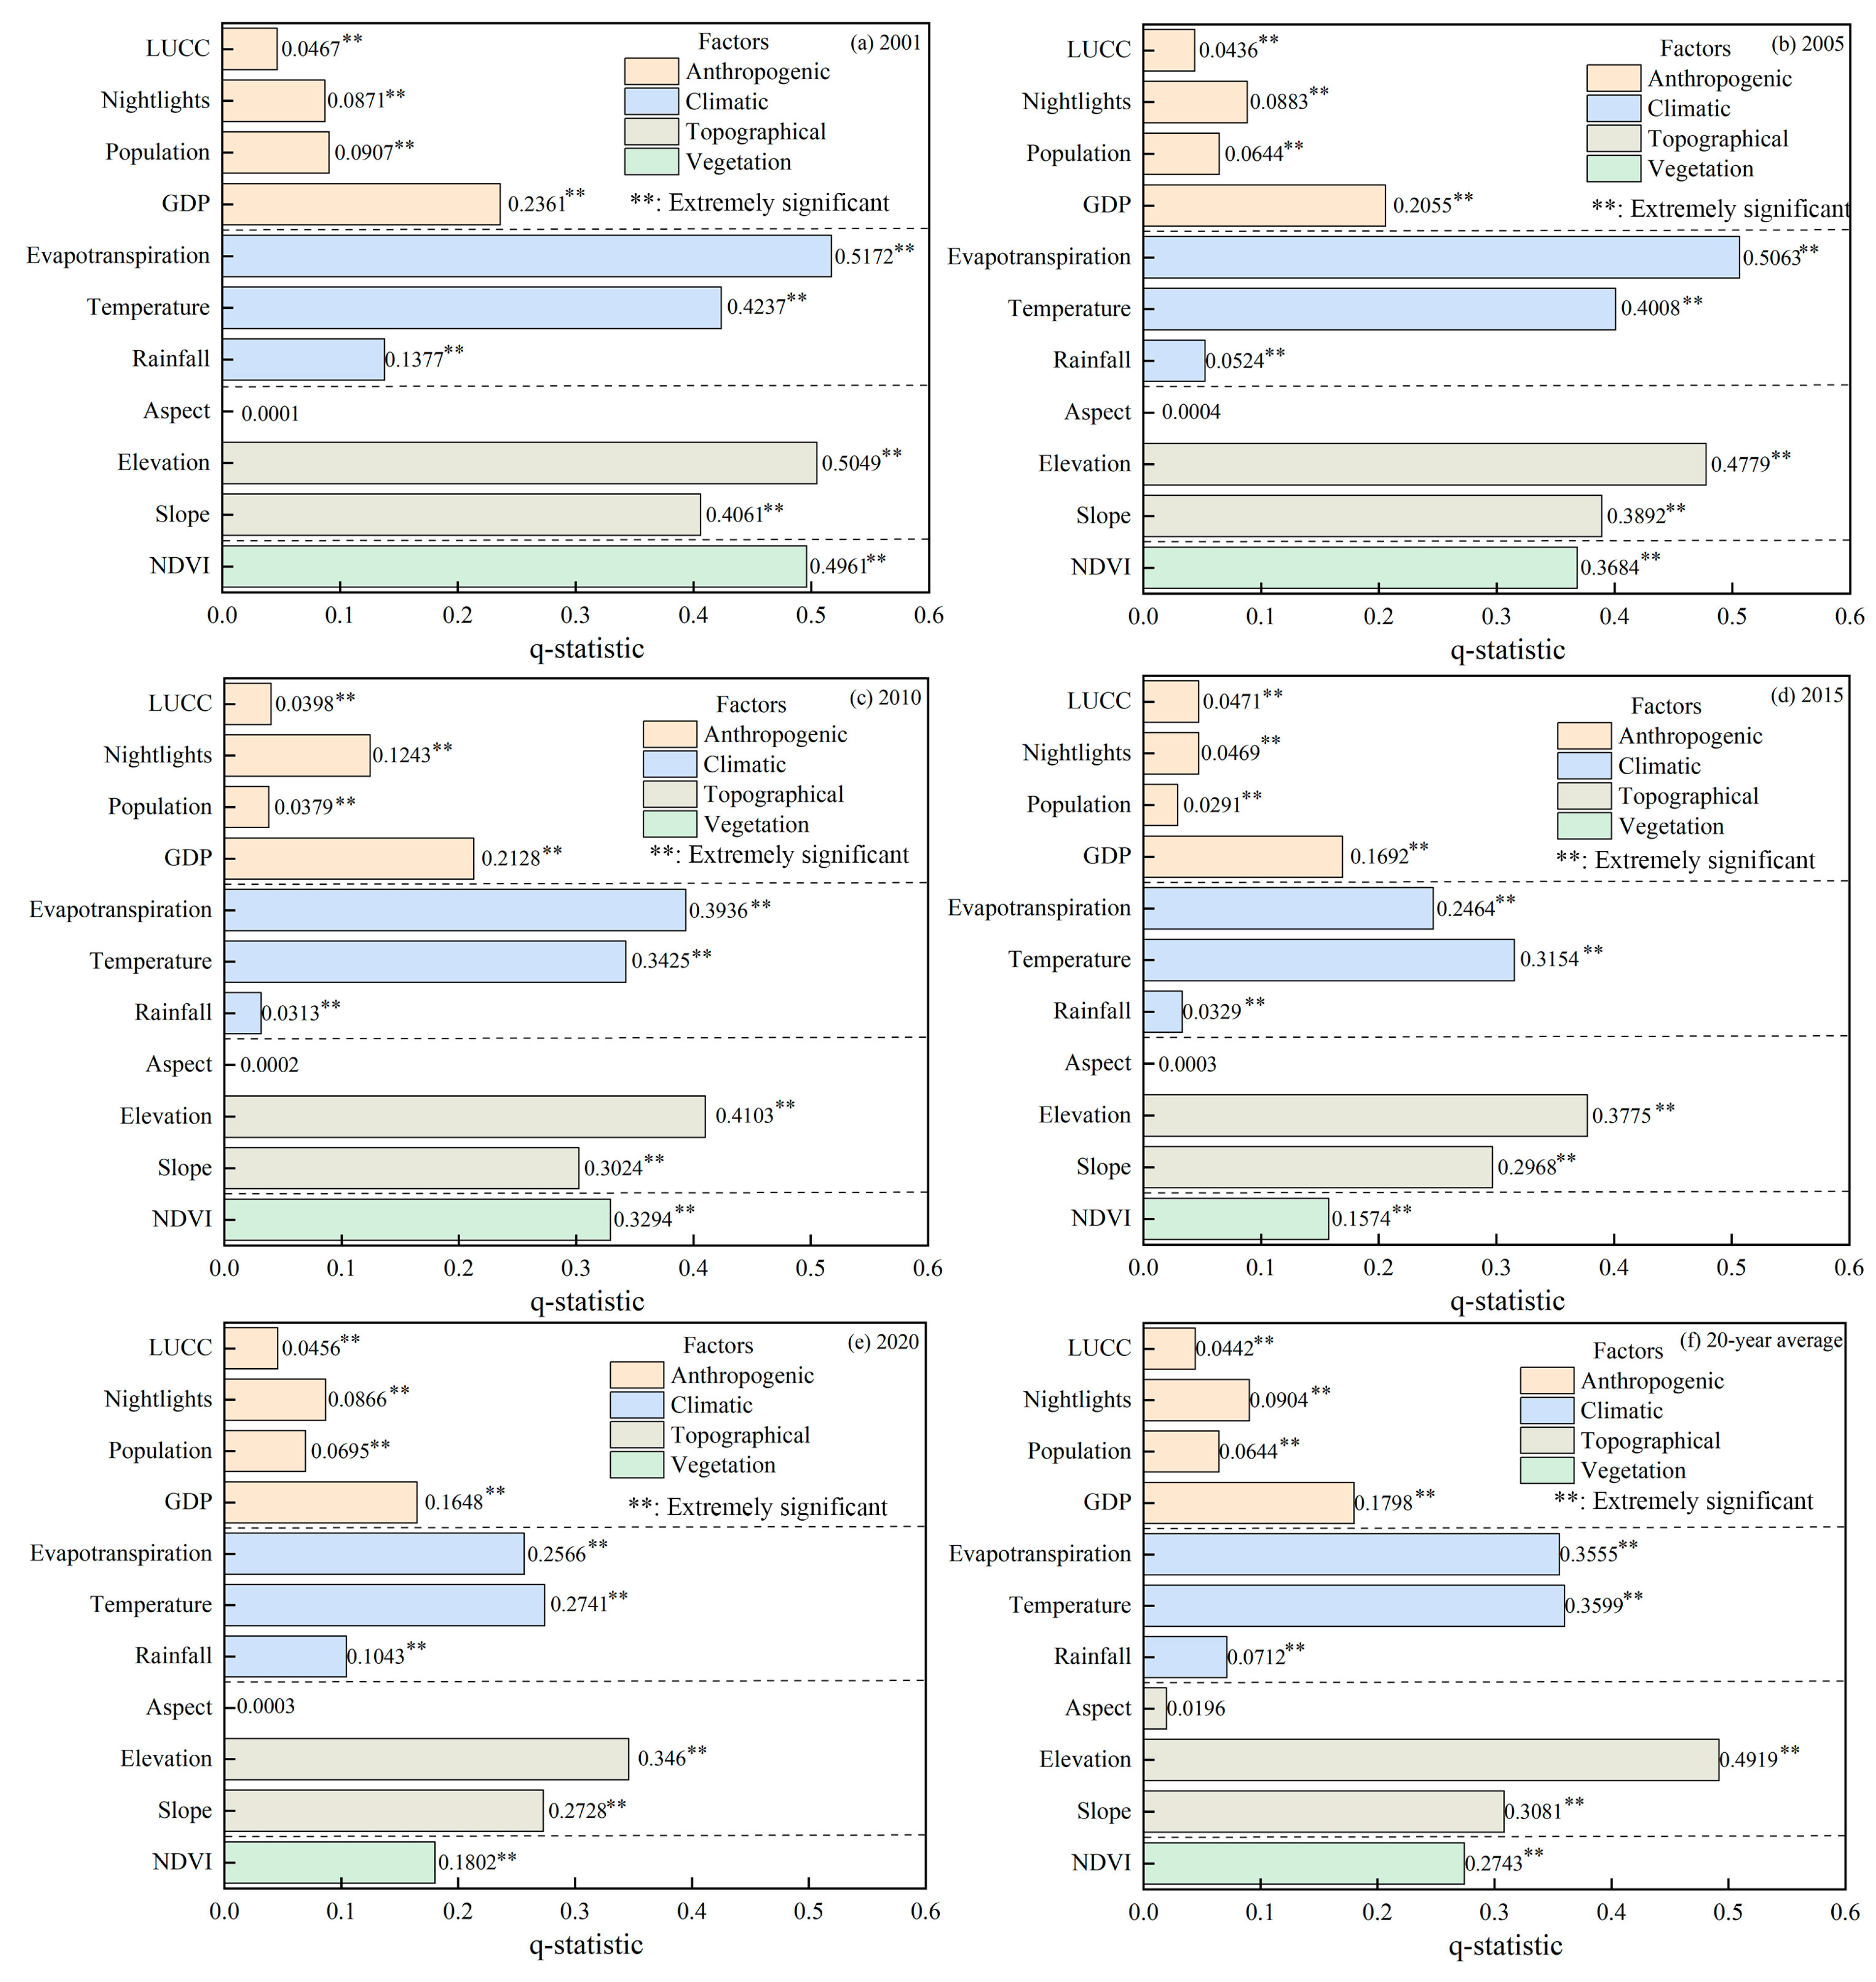
To determine the driving factors behind the spatial distribution pattern of vegetation NPP on Hainan Island, this research selected 11 indicators as explanatory variables, including topographic factors (slope, elevation, aspect), climatic factors (rainfall, temperature, evapotranspiration), vegetation factors (NDVI), and human activity factors (GDP, population, nighttime lights, LUCC). Factor detection results showed that, with the exception of aspect, the influence of all other driving factors passed the significance test (p < 0.01). As shown in Figure 6, in 2001, evapotranspiration had the strongest impact on NPP (q = 0.5172), followed by elevation (q = 0.5049). The influence of temperature, NDVI, and slope was comparable, with q-values ranging between 0.4061 and 0.4961. The explanatory power pattern of each factor in 2005 was generally consistent with that in 2001. From 2010 to 2020, all the q-values dropped below 0.4, which may be related to the interference of extreme climate events such as typhoons and droughts that Hainan Province experienced in 2005 and 2014. Based on the twenty-year average, elevation, evapotranspiration, temperature, slope, and NDVI were the key factors inpacting the spatiotemporal pattern of NPP on Hainan Island, while GDP, rainfall, population, nighttime lights, and LUCC had relatively weaker effects. Aspect exhibited the lowest explanatory power (p < 0.01).
Figure 6.
The factor detection results for annual NPP on Hainan Island for the years 2001, 2005, 2010, 2015, 2020, and the 20-year average are presented in panels (a–f), respectively.
3.2.2. Interaction Detection
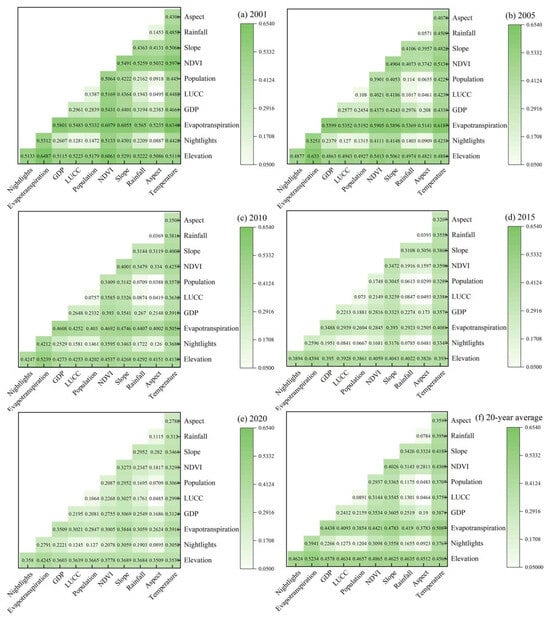
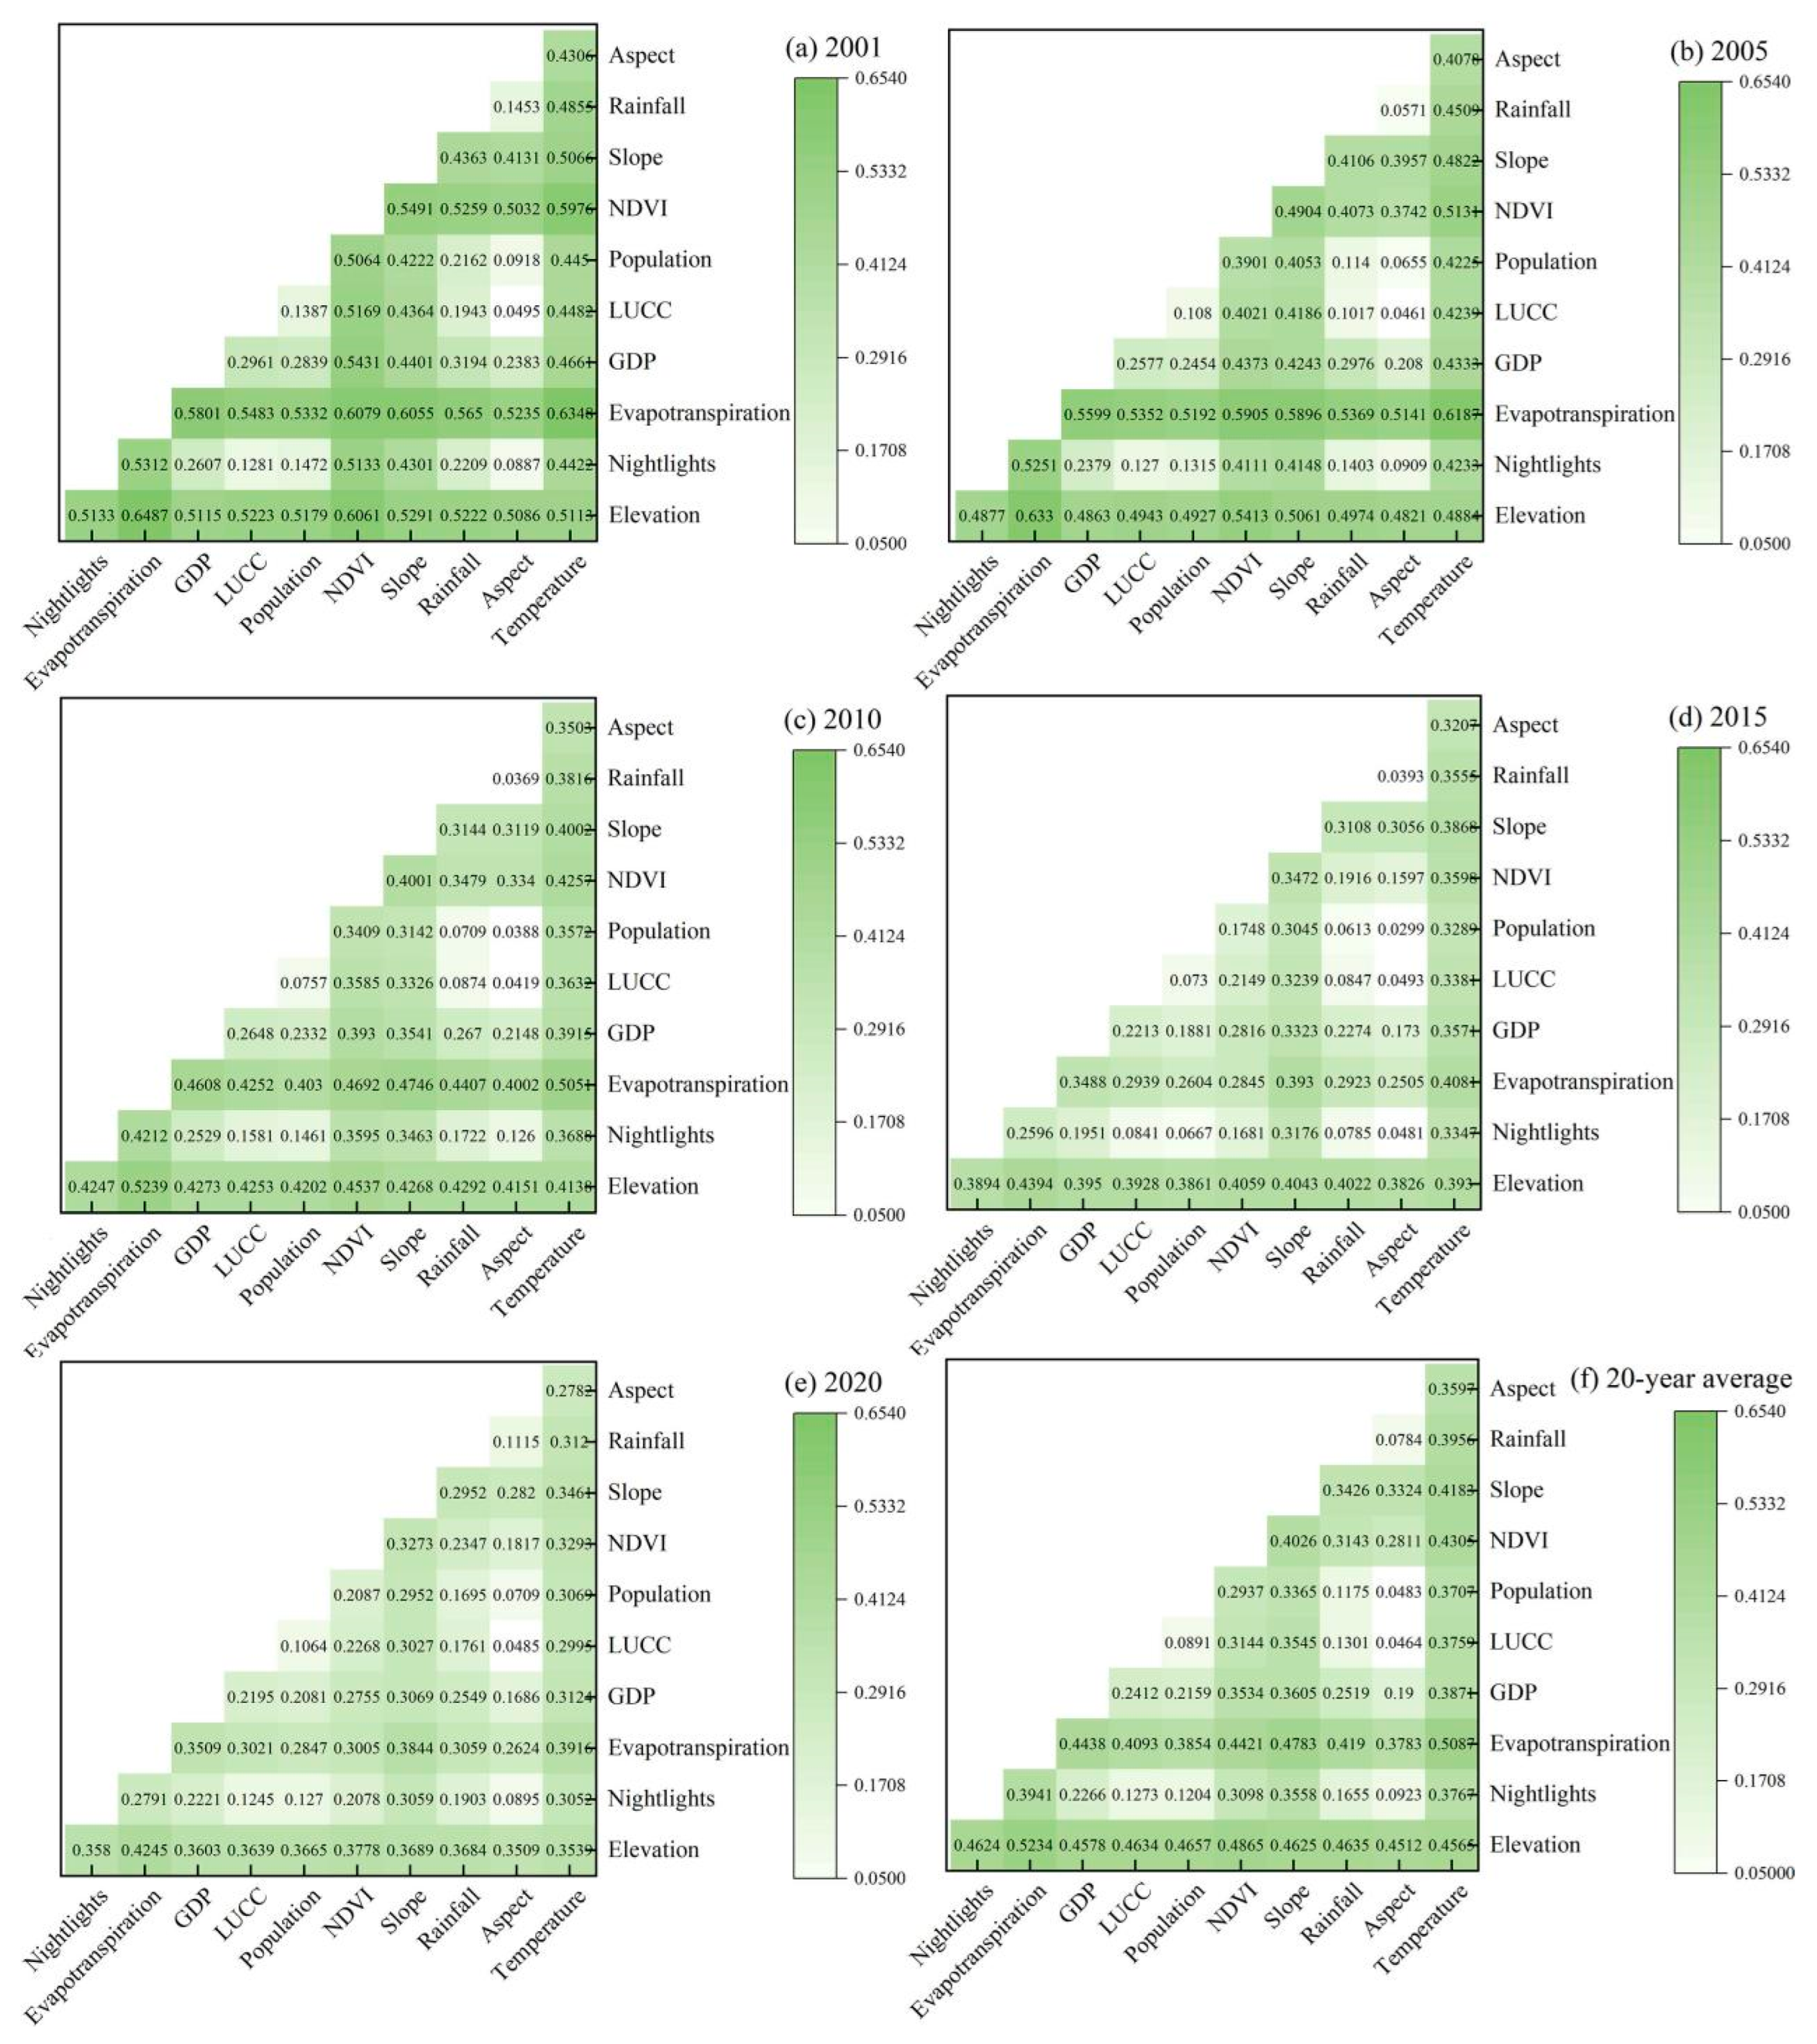
The Geodetector analysis results indicate that the interactions among influencing factors of vegetation NPP on Hainan Island are primarily characterized by bi-variable enhancement and nonlinear enhancement effects. As shown in Figure 7, the explanatory ability of different driving factors varies within the same time period, and the interactive effects of the same factor on NPP also exhibit dynamic variation across different years. The five interactive factor pairs with the highest explanatory power for vegetation NPP on Hainan Island are: elevation and evapotranspiration, evapotranspiration and temperature, evapotranspiration and slope, elevation and NDVI, and evapotranspiration and GDP. It is noteworthy that although factors such as precipitation, LUCC, population density, nighttime light, and aspect have relatively low independent explanatory power, their explanatory capacity increases significantly when interacting with other factors.
Figure 7.
Panels (a–f) display the interaction detection results for annual NPP on Hainan Island for the years 2001, 2005, 2010, 2015, 2020, and the 20-year average, respectively.
3.3. Impact of Latent Variables on the Spatial Patterns
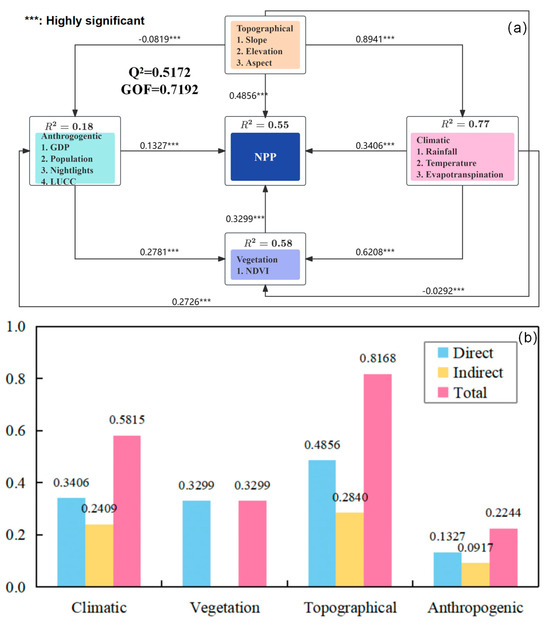
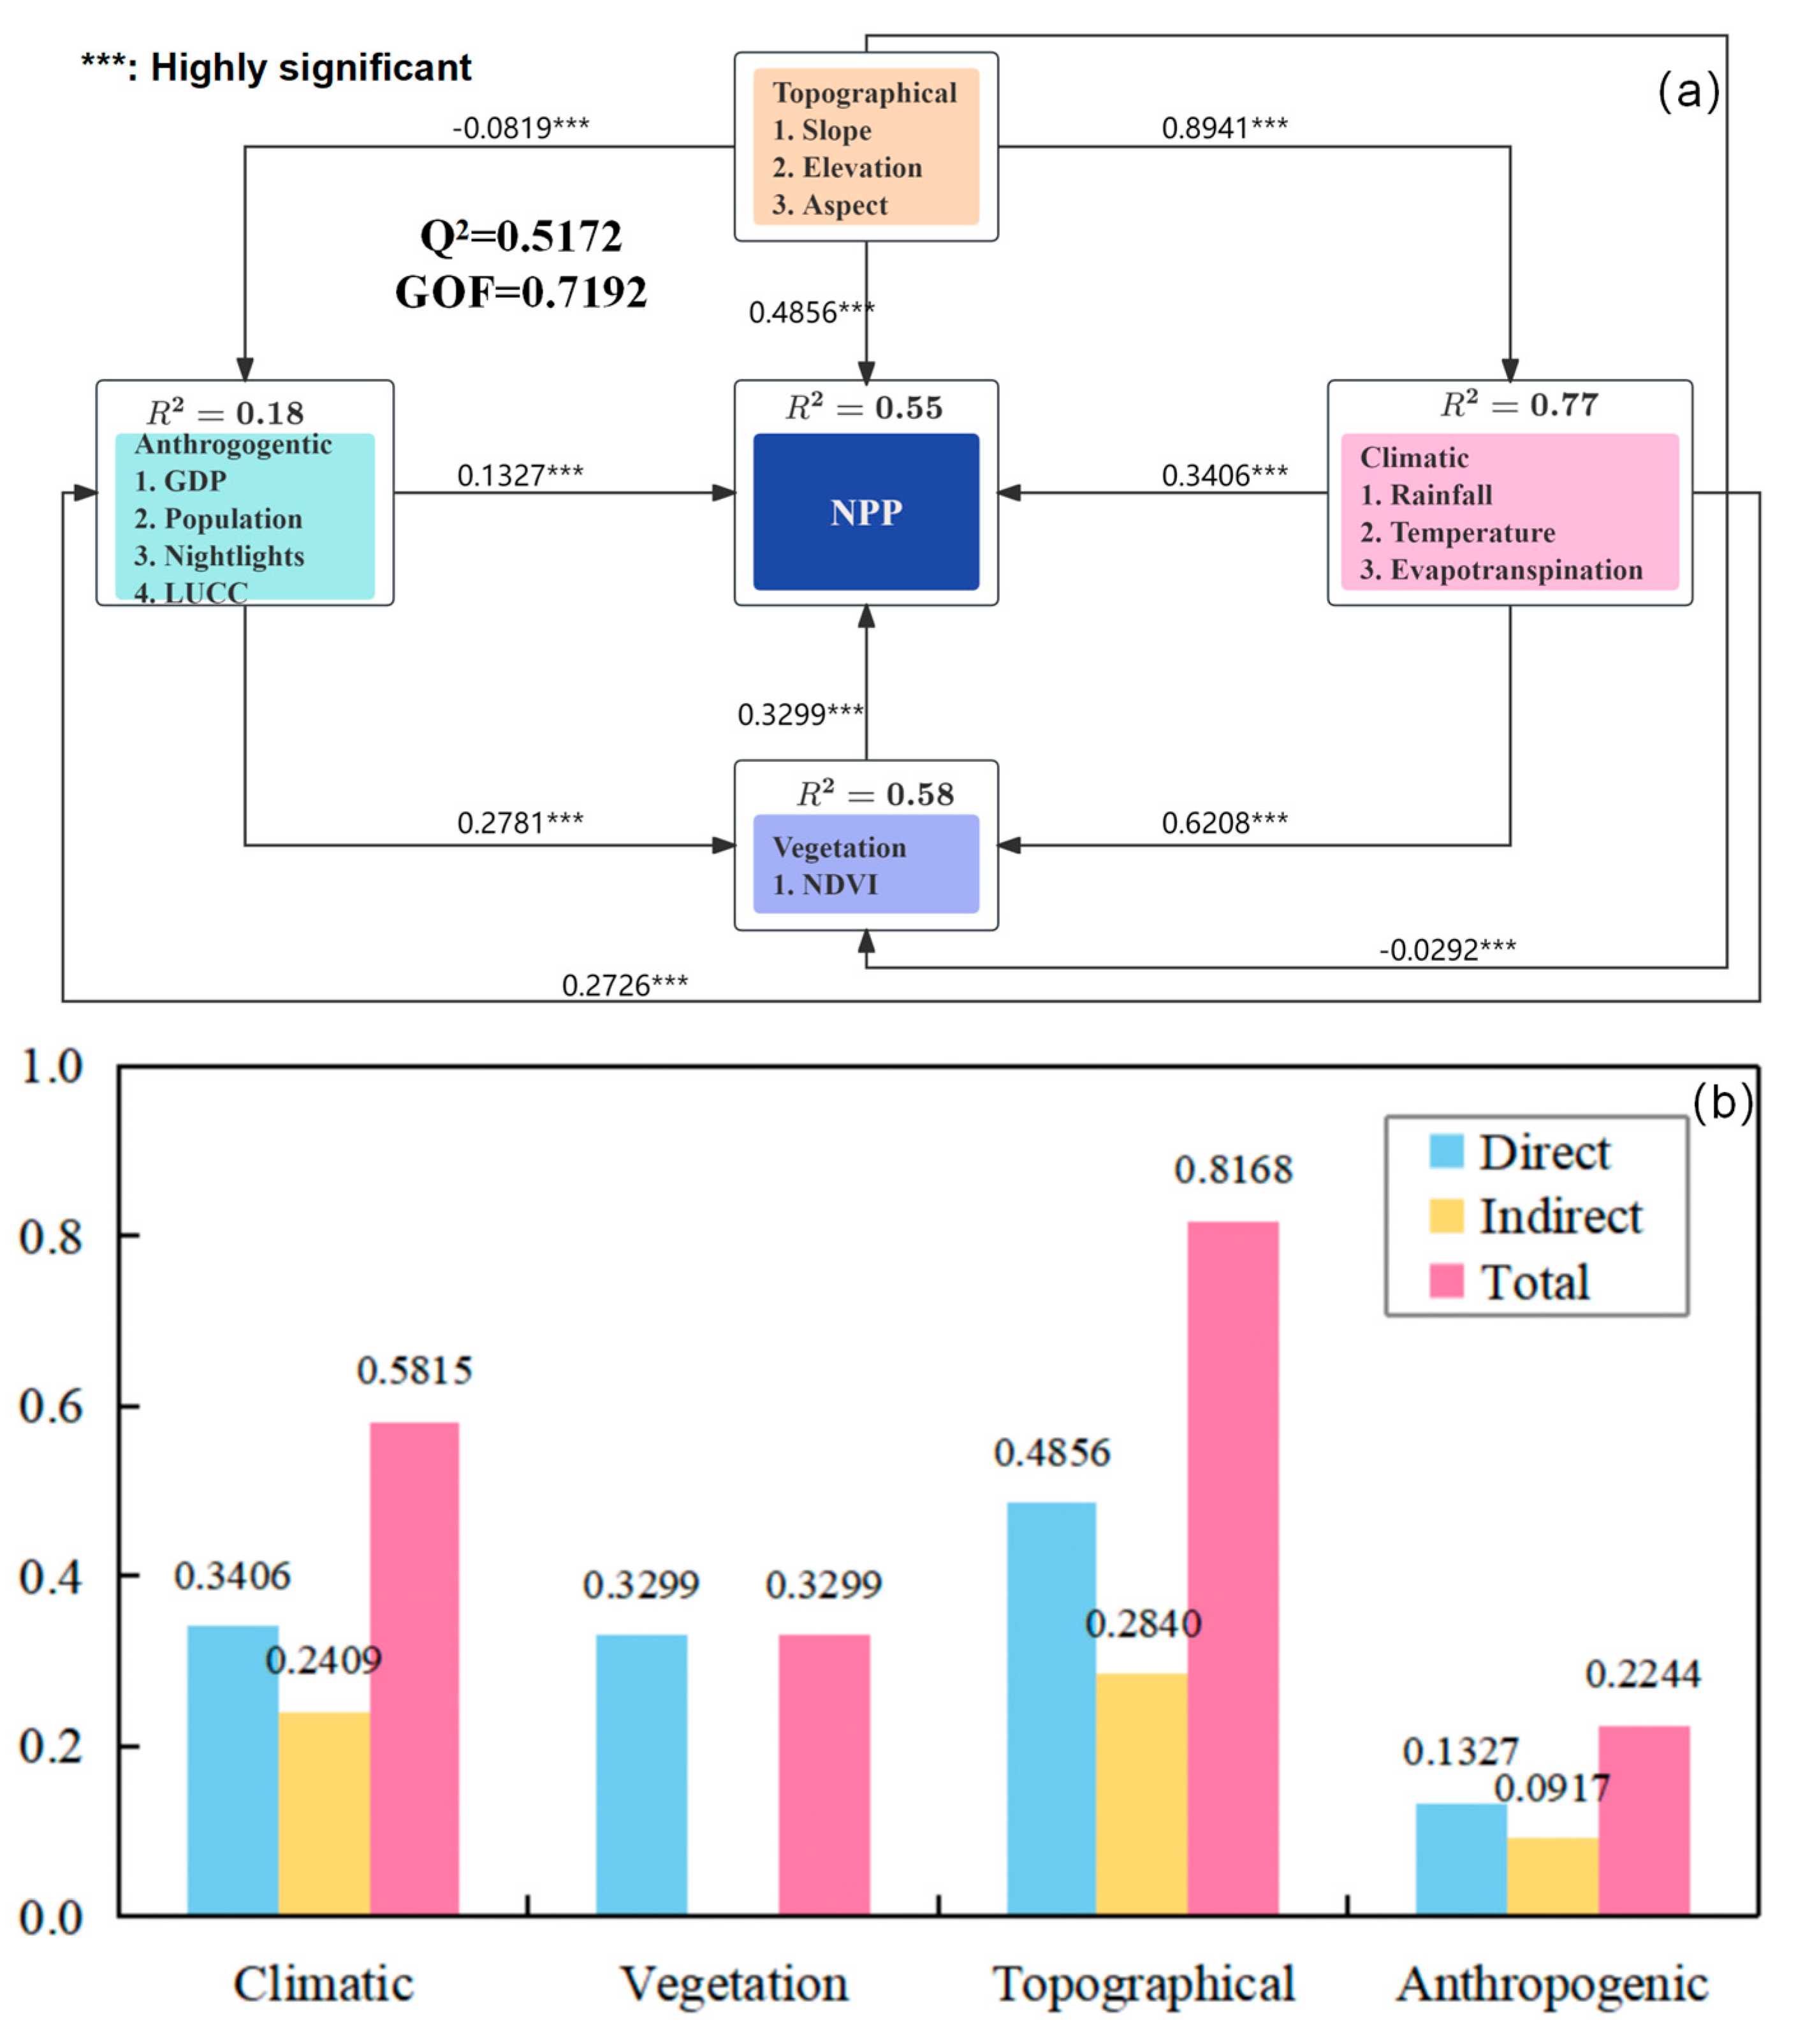
The Geodetector analysis identified the primary drivers governing the spatial heterogeneity of vegetation NPP; to this end, the PLS-SEM method was utilized to clarify the direct and indirect influencing pathways of climate, topography, NDVI, and anthropogenic activities on NPP. As shown in Figure 8, topography, climate, anthropogenic activities, and vegetation factors all have direct positive effects on vegetation NPP according to the PLS-SEM model (2001–2022), with path coefficients of 0.4856, 0.3406, 0.1327, and 0.3299, respectively. The Q2 value of 0.5172, above zero, suggests that the model has relatively high predictive relevance. Furthermore, the GOF value of 0.7192 means that the overall model fit approaches a strong level (GOF > 0.36).
Figure 8.
Causal relationships between latent variables and multi-year average vegetation NPP (2001−2022). (a): path diagram; (b): overall effect.
The results of the PLS-SEM model indicate that topographic, climatic, human activity, and vegetation factors all have significant direct and indirect effects on vegetation NPP (p < 0.001). As shown in Figure 8a, the direct effect of topographic factors is the largest, with a coefficient of 0.4856. The indirect effect on vegetation NPP is primarily mediated through the facilitation of climate change, which has a direct impact coefficient of 0.8841, resulting in a positive indirect effect of 0.3045. The indirect impact of climate is weaker than its direct effect, generating positive indirect effects of 0.2408 and 0.0612 through the facilitation of vegetation growth (direct effect coefficient of 0.6208) and anthropogenic activities (direct effect coefficient of 0.2726), respectively. Anthropogenic activities exert a positive indirect effect of 0.0917 on vegetation NPP mainly by promoting vegetation growth (direct effect coefficient of 0.2781).
The overall effects of the latent variables on NPP spatial differentiation are shown in Figure 8b, with topographic, climatic, anthropogenic, and NDVI factors all contributing positively, having coefficients of 0.7696, 0.5816, 0.2244, and 0.3299, respectively.
4. Discussion
Aiming to understand the long-term dynamics of vegetation productivity, this study estimated the NPP for Hainan Island (2001–2022) using remote sensing data to analyze its spatiotemporal patterns and project future trends. Additionally, it quantitatively compared the influences of climatic, topographic, vegetation, and anthropogenic factors on the spatial variation of NPP.
4.1. Analysis of the Spatiotemporal Variation Trends of NPP
Over the study period (2001–2022), the vegetation NPP on Hainan Island showed a net increase from 7.22 to 8.01 kg C·m2·a−1, exhibiting a slow upward trend amidst fluctuations. This trend is consistent with the NPP trajectory of green vegetation in China [54], indicating that over the past two decades in Hainan, although some farmland and forestland have been repurposed for development, implemented measures such as the conversion of cropland to forest, the “Green Island” initiative, and ecological restoration have increased forest area [55,56], improving the quality of natural vegetation and soil [57]. This has caused balance and growth in Hainan’s vegetation NPP. In terms of various land use types, the NPP growth trend is most pronounced in cropland, while the increase in forestland is relatively small. This phenomenon is closely associated with the rapid progression of agriculture in Hainan in recent years, advanced irrigation technologies, superior genetic resources, and more rational fertilizer application [58].
Notably, the significant low value of net primary productivity (NPP) observed on Hainan Island in 2005 is likely associated with the occurrence of Typhoon Damrey, a severe tropical cyclone event that affected the region that same year. Extreme typhoon events directly inflict mechanical damage and physiological stress on vegetation, leading to the destruction of canopy structures and extensive defoliation. This, in turn, impairs photosynthetic activity and results in a marked short-term decline in NPP within the affected areas. While the annual-scale data employed in this study integrate the immediate effects of such extreme events, the temporal resolution limits the ability to investigate potential ecological lag effects following the typhoon. Future research integrating higher temporal resolution remote sensing data with ecological models to systematically analyze the dynamic response of NPP before and after typhoon passage would provide clearer insights into the disturbance mechanisms, recovery processes, and ecosystem resilience associated with extreme climate events.
For spatial distribution, the spatial differences in the vegetation NPP on Hainan Island are very obvious, which are basically in line with the zonal differentiation [59]. In total, NPP decreases from the central-southern region towards the surrounding coastal areas. The central-southern region has fewer anthropogenic activities and high forest coverage [60]. This is the main reason for its higher NPP values. Nevertheless, the northern and coastal area is more accessible, with higher human activity levels, which lead to lower natural vegetation, thereby obviously decreasing NPP. It should be pointed out that the vegetation ecosystems in the northern and coastal regions are relatively simple and are very weak from facing severe climate events, which cause lower NPP values and ecosystem stability. In total, the stark contrast between the natural conservation in different regions reflects the meaning of ecological protection and enhancing vegetation NPP.
According to the results of the trend analysis, there exist obvious regional differences in the NPP variation trends in the study region. Influenced by the tropical monsoon climate and abundant annual precipitation, coupled with the promoting effects of global warming on vegetation growth, 63.88% of the area on Hainan Island shows an increasing trend in NPP. The implementation of urban greening and wetland protection initiatives may explain the concentration of areas with significant growth in the northeastern and coastal regions [61], which have significantly increased vegetation coverage in these areas. Conversely, 11.1% of the area shows an obvious decrease in NPP, predominantly in the central-northern part, which is primarily impacted by frequent anthropogenic activities such as urban expansion and agricultural development, compounded by arid conditions on the leeward slope of the monsoon. These factors together have led to a reduction in natural vegetation and a decline in soil quality, significantly lowering the NPP in this region. Overall, the area with increasing NPP exceeds that with decreasing NPP, indicating that the vegetation productivity on Hainan Island is developing positively.
4.2. Analysis of the Sustainability Characteristics of NPP
This research also explores the future trends of vegetation NPP on Hainan Island based on the Hurst exponent method, with results shown in Figure S2 and Table S1. Although the overall trend of vegetation NPP from 2001 to 2022 indicates an increase, the future change trends suggest that Hainan Island’s vegetation NPP still faces certain ecological risks. Notably, with 56.30% of the area seeing a transition from “increase to decrease,” it can be inferred that the present urbanization and the abnormal application of cropland are harmful for the carbon sink ability of the region. Moreover, future interannual precipitation variability and typhoons may cause lower ecosystem resilience, which may prevent the continuous growth of NPP. In addition, it was found that 25.56% of the area will face declining vegetation NPP, especially for urban expansion areas of the northwest, which suffer strong anthropogenic activities like agricultural expansion, thereby obviously worsening the ecological condition.
To solve the above risk problems, it is necessary to develop various ecological governance systems according to ecological risk in different areas. For areas facing a transition from increase to decrease, particularly urban and surrounding regions subject to strong human disturbance, it is necessary to implement arable land protection measures, enhance vegetation greening, and optimize vegetation types, while also conducting scientific urban landscape planning to improve ecological conditions. For areas experiencing continued decreases, a comprehensive development strategy that combines artificial and ecological restoration is recommended, especially in regions where vegetation NPP is continuously declining; greater emphasis should be placed on optimizing vegetation types and layouts to promote an ecological civilization. For areas where vegetation NPP is continuously increasing or transitioning from decrease to increase, efforts should continue to promote the implementation of policies for returning farmland to forest, wetland ecological restoration, coastal shelterbelt construction, and ecological protection and restoration measures.
4.3. Analysis of the Driving Mechanisms of NPP Changes
4.3.1. Spatial Heterogeneity
As described in Section 3.2, this study systematically evaluated the effects of climate, topography, vegetation, and anthropogenic activities on vegetation NPP. The results found that, concerning the temporal heterogeneity of vegetation NPP in Hainan Island over the recent two decades, no single category of factors plays an absolutely dominant role. This situation can be attributed to differences in the q-values of influencing factors between adjacent years. The driving factors have evolved significantly over the past two decades. In particular, extreme climate events have caused notable fluctuations in NDVI, evapotranspiration, and temperature, along with the continuous intensification of agricultural expansion and urbanization processes, leading to changes in GDP, nightlights, and population. The combined effects of these factors can also result in variations in the q-values of topographic factors between adjacent years.
To more intuitively dissect the drivers of NPP heterogeneity, geographic detector analysis was applied to the 20-year average annual NPP. The results (Figure S3) identify elevation, evapotranspiration, temperature, slope, and NDVI as the dominant factors shaping its spatial distribution, whereas LUCC, GDP, and nightlights are secondary contributors. The influences of rainfall, population, and aspect are comparatively weak. Overall, it is believed that anthropogenic activities obviously influence vegetation NPP on Hainan Island. This is due to the accelerated urban infrastructure development on Hainan Island and the use of roads to promote urban expansion, which has a substantial influence on vegetation NPP.
Moreover, the coupled effects among elevation, evapotranspiration, temperature, NDVI, and slope have obvious influence on vegetation NPP. The predominant control over NPP dynamics stems from the synergistic interactions among aspect, elevation, and evapotranspiration, despite aspect’s minimal standalone effect. This is intrinsically linked to the distinctive geomorphological and climatic context of Hainan Island. The unique topography and climatic conditions of Hainan Island result in significant effects of moisture evapotranspiration from different aspects on vegetation growth. In general, south-facing slopes typically receive more light and heat, which can promote plant growth, whereas north-facing slopes limit plant growth due to adverse environmental conditions.
Hence, the geographical features of Hainan Island significantly influence plant transpiration, resulting in notable variations in net primary production (NPP) across different regions. Chen et al. [57] collected extensive measurement data, revealing that the relationship between NPP and temperature/precipitation on Hainan Island is influenced by regional factors, with the southern and northern areas showing particularly pronounced effects. Yang et al. [56] demonstrated that NPP on the western side of Hainan Island is primarily determined by light conditions, while the central and northern regions are affected by both temperature and light. These findings highlight the significant spatial heterogeneity of climatic variables in the ecosystem, which are key determinants of NPP. Comparative analysis indicates that coastal urban expansion zones and areas highly susceptible to extreme weather events exhibit notably lower NPP values. These areas have higher GDP and nightlight levels, and anthropogenic activities like land development and urban expansion have affected the stability and resilience of the ecosystem, constraining vegetation growth. Nevertheless, the central-southern regions, with less human intervention, keep good ecological condition and higher biodiversity, thereby exhibiting higher vegetation NPP levels. The above result indicates that natural driving factors are fully expressed in these regions, and cause higher vegetation NPP.
It should be noted that the climate factors (like rainfall, temperature) used in the present research are mainly on the basis of annual mean data, and their resolution may be insufficient in calculating the NPP for short time intervals, especially in capturing recovery dynamics. Additionally, the application of Geodetector in this study is subject to certain limitations due to the human activity indicators adopted. Indicators such as nighttime light and population density cannot fully represent the complexity and fine-scale variations of anthropogenic influences within Hainan Island, potentially leading to an underestimation of the impact of localized anthropogenic activities. In future studies, it will be necessary to incorporate extreme climate indicators and human activity data related to land greening and ecological restoration, thereby enabling a more comprehensive assessment of the effects of climate variability and anthropogenic factors on the spatial heterogeneity of NPP.
4.3.2. The Impacting Effects of Driving Factors on NPP Changes
There exists a complex causal relationship among climate, topography, NDVI, and anthropogenic activities, all of which have a direct positive effect on vegetation NPP. Topography emerges as the dominant direct driver of vegetation NPP, with its influence being more pronounced than that of other variables. This is especially evident in high-altitude, steep-slope mountainous terrain, where topographic constraints limit anthropogenic disturbance and create favorable conditions for NPP accumulation. Furthermore, climate exerts a positive effect on vegetation NPP by facilitating plant growth, which may correlate with Hainan Island’s natural advantages, such as ample rainfall and sunlight, that are conducive to vegetation growth. Contrary to many research conclusions [62], anthropogenic activities have a direct promoting effect on vegetation NPP, which may be related to ongoing human measures, such as afforestation, protection of significant ecological function areas, and ecological conservation projects that promote vegetation recovery and growth in the study area. These also represent the primary research directions in this field, requiring in-depth exploration.
4.4. Limitations and Future Work
The data collected in this study were primarily sourced from the GEE platform. Using these datasets and relevant models, we analyzed the key factors influencing vegetation NPP variations in Hainan Province and their underlying mechanisms. We further examined the spatiotemporal patterns of these changes to identify correlations between NPP and major influencing factors. The PLS-SEM model was employed to quantify the impact levels of different factors. The findings provide valuable insights for ecological management and land use policy formulation in the study area, while also offering references for similar research. However, several limitations remain. Firstly, the applicability of the MOD17A3HGF NPP product to humid subtropical regions remains unclear, and the interannual variation results of calculated NPP exhibit relatively low accuracy [63,64]. When applied to calculate net primary production (NPP) under tropical climate conditions in Hainan, the model’s results may deviate from actual conditions, compromising the reliability of conclusions. To effectively address this issue, it is essential to collect more field measurements and regional calibration data across different areas, thereby establishing a tailored CASA model that better meets local NPP analysis requirements. Secondly, while this study employs high-temporal-resolution remote sensing data for model analysis, other datasets still lack sufficient resolution, limiting the model’s ability to analyze small-scale NPP variations. Furthermore, the results fail to account for factors such as small-scale land use changes and short-term extreme weather events. Therefore, comprehensive analysis incorporating additional resource survey data is crucial to obtain more reliable outcomes. The model’s interactions among multiple variables remain underexplored. For complex tropical forest ecosystems, these factors exhibit intricate synergistic effects and sometimes undergo dramatic nonlinear changes, necessitating future research to analyze these dynamics [65]. Furthermore, socio-economic drivers significantly regulate NPP patterns. Moving forward, a critical research priority lies in decoupling their direct and indirect effects on ecosystem productivity to quantify the specific contribution of each key driver, thereby enhancing the robustness of findings.
5. Conclusions
NPP, a direct measure of an ecosystem’s net carbon uptake, is a fundamental variable in both carbon cycle research and the widely adopted frameworks for ecosystem health assessment. It enables accurate analysis of how vegetation growth offsets anthropogenic carbon emissions. This study investigates the characteristics and influencing factors of NPP in the Hainan region. By integrating multi-source remote sensing datasets, we applied trend analysis and geographical detector methods to characterize the spatiotemporal dynamics of local vegetation NPP and elucidate its primary driving factors. The main conclusions are as follows:
(1) From 2001 to 2022, the vegetation NPP in the study area showed an obvious fluctuating upward trend, with a mean annual increase of 0.036 kg C·m−2·a−1. Spatially, this index in the central and southern mountainous areas varies obviously compared to nearby coastal regions. About 63.88% of the island’s area has an obvious growth trend in NPP, while others show a declining trend. Moreover, about 94.67% of the area maintained stable NPP changes, with low external disturbances. Future policy needs to focus on long-term monitoring.
(2) Driver analysis revealed that topography and climate are the key drivers of spatial heterogeneity in vegetation NPP on Hainan Island. Among the variables, elevation, evapotranspiration, temperature, NDVI, and slope had the most significant impacts, while rainfall, population density, nighttime light, and LUCC showed relatively weaker explanatory power (average q < 0.10). Interaction analysis demonstrated that the combined effect of any two factors was stronger than their individual effects, with the interactions of elevation and evapotranspiration, evapotranspiration and temperature, and evapotranspiration and slope being the most significant. These results confirm that the spatial distribution features of NPP are shaped by the synergistic effects of multiple natural drivers.
(3) PLS-SEM path analysis quantified the interrelationships among latent variables. Topography exerted the largest direct positive effect on NPP. Climate factors showed significant direct effects and even stronger total effects through indirect pathways. Anthropogenic activities had a moderate direct positive impact. NDVI exhibits direct positive effects. It showed strong explanatory power and goodness-of-fit (GOF = 0.719), which proves the robustness of the model.
This study investigates the regulatory mechanisms underlying vegetation productivity, with findings that provide valuable insights into the spatiotemporal dynamics of local net NPP. Furthermore, the results demonstrate significant reference value for ecological restoration and green environmental protection projects, as well as ecological development initiatives. And the study provides an in-depth analysis of the mechanisms and key influencing factors behind the variation in vegetation NPP across different regions of Hainan Island. It offers valuable insights for assessing the dynamics of local ecosystem productivity and holds practical significance for ecological restoration efforts. Furthermore, the methodological framework established in this research can be applied to studies in other similar regions.
Supplementary Materials
The following supporting information can be downloaded at https://www.mdpi.com/article/10.3390/su18062701/s1, Figure S1: Interannual variations of vegetation NPP in different land use types; Figure S2: Hurst index and future variation trends of vegetation NPP on Hainan Island; Figure S3: The average of q-value for different influencing factors; Table S1: Statistics of future variation trends of vegetation NPP on Hainan Island.
Author Contributions
X.C.: Conceptualization, Methodology, Data curation, Formal analysis, Writing—original draft. Z.C. (Zongzhu Chen): Writing—review and editing. Y.C.: Resources, Supervision. Y.A.: Data curation, Visualization, Formal analysis. Z.C. (Zhaojun Chen): Data curation, Visualization. Y.L.: Funding acquisition, Formal analysis. T.W.: Formal analysis. X.P.: Formal analysis. G.L.: Formal analysis. All authors have read and agreed to the published version of the manuscript.
Funding
This work was funded by the Hainan Province Scientific Research Institute Technology Innovation Project (Grant No. KYYSLK2023-016) and Hainan Provincial Technical Innovation Program for Provincial Research Institutes (No. KYYSLK2024-001).
Data Availability Statement
The data presented in this study are derived from publicly available resources. The website addresses (URLs) for these resources are provided in full in Table 1.
Conflicts of Interest
The authors declare that they have no known competing financial interests or personal relationships that could have appeared to influence the work reported in this paper.
References
- Long, B.; Zeng, C.; Zhou, T.; Yang, Z.; Rao, F.; Li, J.; Chen, G.; Tang, X. Quantifying the relative importance of influencing factors on NPP in Hengduan Mountains of the Tibetan Plateau from 2002 to 2021: A Dominance Analysis. Ecol. Inform. 2024, 81, 102636. [Google Scholar] [CrossRef] [Scilit]
- Bai, X.; Zhang, S.; Li, C.; Xiong, L.; Song, F.; Du, C.; Li, M.; Luo, Q.; Xue, Y.; Wang, S. A carbon-neutrality-capacity index for evaluating carbon sink contributions. Environ. Sci. Ecotechnol. 2023, 15, 100237. [Google Scholar] [CrossRef] [Scilit]
- Wu, Y.; Yang, J.; Li, S.; Yu, H.; Luo, G.; Yang, X.; Yue, F.; Guo, C.; Zhang, Y.; Gu, L. The impact of climate change and human activities on the Spatial and Temporal variations of vegetation NPP in the Hilly-Plain region of Shandong Province, China. Forests 2024, 15, 898. [Google Scholar] [CrossRef] [Scilit]
- Song, Y.; Gao, M.-X.; Wang, Z.-R.; Wang, J.-F.; Xu, Z.-X. Spatiotemporal variation characteristics and driving factors of cultivated land NPP in the shandong area around the Bohai sea. Huan Jing Ke Xue Huanjing Kexue 2024, 45, 4733–4743. [Google Scholar] [CrossRef] [Scilit]
- Fang, H.; Fan, G.F.; Wang, K.; He, Y.; Shi, S.H.; Li, Z.Q. Spatiotemporal variation characteristics and driving factors of vegetation NPP in the Yangtze River Delta from 2000 to 2022. Huanjing Kexue (Environ. Sci.) 2025, 46, 5788–5799. [Google Scholar] [CrossRef] [Scilit]
- Xiao, J.; Rao, L.Y. Spatiotemporal variation characteristics and driving factors of vegetation NPP in the Wuliangsu Lake Basin from 2001 to 2020. Environ. Sci. 2024, 45, 4744–4755. [Google Scholar] [CrossRef] [Scilit]
- Wang, Q.; Zeng, J.; Leng, S.; Fan, B.; Tang, J.; Jiang, C.; Huang, Y.; Zhang, Q.; Qu, Y.; Wang, W. The effects of air temperature and precipitation on the net primary productivity in China during the early 21st century. Front. Earth Sci. 2018, 12, 818–833. [Google Scholar] [CrossRef] [Scilit]
- Tian, K.; Liu, X.; Zhang, B.; Wang, Z.; Xu, G.; Chang, K.; Xu, P.; Han, B. Analysis of spatiotemporal evolution and influencing factors of vegetation net primary productivity in the yellow river basin from 2000 to 2022. Sustainability 2024, 16, 381. [Google Scholar] [CrossRef] [Scilit]
- Field, C.B.; Randerson, J.T.; Malmström, C.M. Global net primary production: Combining ecology and remote sensing. Remote Sens. Environ. 1995, 51, 74–88. [Google Scholar] [CrossRef] [Scilit]
- Afzali, A.; Hadian, F.; Sabri, S.; Yaghmaei, L. Investigating net primary production in climate regions of Khuzestan Province, Iran using CASA model. Int. J. Biometeorol. 2024, 68, 1357–1370. [Google Scholar] [CrossRef] [Scilit]
- Running, S.W.; Hunt, E.R. 8-Generalization of a forest ecosystem process model for other biomes, BIOME-BGC, and an application for global-scale models. Scaling Physiol. Process. Leaf Globe 1993, 141, 158. [Google Scholar] [CrossRef] [Scilit]
- Running, S.W.; Nemani, R.R.; Heinsch, F.A.; Zhao, M.; Reeves, M.; Hashimoto, H. A continuous satellite-derived measure of global terrestrial primary production. Bioscience 2004, 54, 547–560. [Google Scholar] [CrossRef] [Scilit]
- Turner, D.P.; Ritts, W.D.; Cohen, W.B.; Gower, S.T.; Running, S.W.; Zhao, M.; Costa, M.H.; Kirschbaum, A.A.; Ham, J.M.; Saleska, S.R. Evaluation of MODIS NPP and GPP products across multiple biomes. Remote Sens. Environ. 2006, 102, 282–292. [Google Scholar] [CrossRef] [Scilit]
- Li, W.; Zhou, J.; Xu, Z.; Liang, Y.; Shi, J.; Zhao, X. Climate impact greater on vegetation NPP but human enhance benefits after the Grain for Green Program in Loess Plateau. Ecol. Indic. 2023, 157, 111201. [Google Scholar] [CrossRef] [Scilit]
- Tang, H.; Fang, J.; Yuan, J. Climate change and Land Use/Land Cover Change (LUCC) leading to spatial shifts in net primary productivity in Anhui Province, China. PLoS ONE 2024, 19, e0307516. [Google Scholar] [CrossRef] [Scilit]
- Shi, Z.Y.; Wang, Y.T.; Zhao, Q.; Zhang, L.F.; Zhu, C.M. The spatiotemporal changes of NPP and its driving mechanisms in China from 2001 to 2020. Ecol. Environ. Sci. 2022, 31, 2111–2123. [Google Scholar] [CrossRef]
- Yin, X.Y.; Cao, D. Spatiotemporal Variation and Driving Mechanisms of Vegetation Net Primary Productivity in Hunan Province from 2001 to 2023. Sci. Remote Sens. 2025, 12, 100269. [Google Scholar] [CrossRef] [Scilit]
- Zhang, Y.Z.; Gong, J.; Yang, J.X.; Peng, J. Evaluation of Future Trends Based on the Characteristics of Net Primary Production (NPP) Changes over 21 Years in the Yangtze River Basin in China. Sustainability 2023, 15, 10606. [Google Scholar] [CrossRef] [Scilit]
- Qi, S.; Chen, S.; Long, X.; An, X.; Zhang, M. Quantitative contribution of climate change and anthropological activities to vegetation carbon storage in the Dongting Lake basin in the last two decades. Adv. Space Res. 2023, 71, 845–868. [Google Scholar] [CrossRef] [Scilit]
- Ma, B.; Jing, J.; Liu, B.; Wang, Y.; He, H. Assessing the contribution of human activities and climate change to the dynamics of NPP in ecologically fragile regions. Glob. Ecol. Conserv. 2023, 42, e02393. [Google Scholar] [CrossRef] [Scilit]
- Guo, B.; Zang, W.Q.; Yang, F.; Han, B.M.; Chen, S.T.; Liu, Y.; Yang, X.; He, T.L.; Chen, X.; Liu, C.T.; et al. Spatial and temporal change patterns of net primary productivity and its response to climate change in the Qinghai-Tibet Plateau of China from 2000 to 2015. J. Arid Land 2020, 12, 1–17. [Google Scholar] [CrossRef] [Scilit]
- Luo, H.X.; Dai, S.P.; Hu, Y.Y.; Zheng, Q.; Yu, X.; Chen, B.Q.; Li, Y.P.; Wang, C.X.; Li, H.L. Integrating Knowledge-Based and Machine Learning for Betel Palm Mapping on Hainan Island Using Sentinel-1/2 and Google Earth Engine. Plants 2025, 14, 2696. [Google Scholar] [CrossRef] [Scilit]
- Guan, M.; Xiong, C. The Net Spatio-Temporal Impact of the International Tourism Is-Land Strategy on the Ecosystem Service Value of Hainan Island: A Counterfactual Analysis. Land 2022, 11, 1694. [Google Scholar] [CrossRef] [Scilit]
- Li, L.; Tang, H.; Lei, J.; Song, X. Spatial autocorrelation in land use type and ecosystem service value in Hainan Tropical Rain Forest National Park. Ecol. Indic. 2022, 137, 108727. [Google Scholar] [CrossRef] [Scilit]
- Liu, P.; Wen, T.; Han, R.; Zhang, L.; Liu, Y. Remote Sensing-Based LULP Change and Its Effect on Ecological Quality in the Context of the Hainan Free Trade Port Plan. Sustainability 2024, 16, 5311. [Google Scholar] [CrossRef] [Scilit]
- Weigelt, P.; Jetz, W.; Kreft, H. Bioclimatic and physical characterization of the world’s islands. Proc. Natl. Acad. Sci. USA 2013, 110, 15307–15312. [Google Scholar] [CrossRef] [Scilit]
- Courchamp, F.; Hoffmann, B.D.; Russell, J.C.; Leclerc, C.; Bellard, C. Climate change, sea-level rise, and conservation: Keeping island biodiversity afloat. Trends Ecol. Evol. 2014, 29, 127–130. [Google Scholar] [CrossRef] [Scilit] [PubMed]
- Harter, D.E.; Irl, S.D.; Seo, B.; Steinbauer, M.J.; Gillespie, R.; Triantis, K.A.; Fernández-Palacios, J.-M.; Beierkuhnlein, C. Impacts of global climate change on the floras of oceanic islands–Projections, implications and current knowledge. Perspect. Plant Ecol. Evol. Syst. 2015, 17, 160–183. [Google Scholar] [CrossRef] [Scilit]
- Veron, S.; Mouchet, M.; Govaerts, R.; Haevermans, T.; Pellens, R. Vulnerability to climate change of islands worldwide and its impact on the tree of life. Sci. Rep. 2019, 9, 14471. [Google Scholar] [CrossRef] [Scilit] [PubMed]
- Leclerc, C.; Courchamp, F.; Bellard, C. Future climate change vulnerability of endemic island mammals. Nat. Commun. 2020, 11, 4943. [Google Scholar] [CrossRef] [Scilit]
- Zheng, H.J.; Yang, X.F.; Song, C.Q.; Zhang, W.; Sun, W.J.; Wang, G.C. Distinct environmental controls on above- and below-ground net primary productivity in Northern China’s grasslands. Ecol. Indic. 2024, 167, 112717. [Google Scholar] [CrossRef] [Scilit]
- Xiong, Q.; Xiao, Y.; Liang, P.; Li, L.; Zhang, L.; Li, T.; Pan, K.; Liu, C. Trends in climate change and human interventions indicate grassland productivity on the Qinghai–Tibetan Plateau from 1980 to 2015. Ecol. Indic. 2021, 129, 108010. [Google Scholar] [CrossRef] [Scilit]
- Wang, Y.T.; Tong, X.J.; Li, J.; Yang, M.X.; Wang, Y. Impacts of Climate Change and Human Activities on Vegetation Productivity in China. Remote Sens. 2025, 17, 1724. [Google Scholar] [CrossRef] [Scilit]
- Nemani, R.R.; Keeling, C.D.; Hashimoto, H.; Jolly, W.M.; Piper, S.C.; Tucker, C.J.; Myneni, R.B.; Running, S.W. Climate-driven increases in global terrestrial net primary production from 1982 to 1999. Science 2003, 300, 1560–1563. [Google Scholar] [CrossRef] [Scilit]
- Ji, J.-X.; Tong, X.; Duan, L.-M.; Liu, X.-Y.; Gong, Y.; Liu, T.-X. Spatio-temporal Dynamic Characteristics and Driving Factors of Vegetation NPP in Hetao Irrigation District of Inner Mongolia. Huan Jing Ke Xue Huanjing Kexue 2025, 46, 4392–4402. [Google Scholar] [CrossRef] [Scilit]
- Liu, H.D.; Liu, H.; Chen, Y.F.; Xu, Z.Y.; Dai, Y.C.; Chen, Q.; Ma, Y.K. Identifying the patterns of changes in α- and β-diversity across Dacrydium pectinatum communities in Hainan Island, China. Ecol. Evol. 2021, 11, 4616–4630. [Google Scholar] [CrossRef] [Scilit]
- Zhang, Y.; Hu, Q.; Zou, F. Spatio-temporal changes of vegetation net primary productivity and its driving factors on the Qinghai-Tibetan Plateau from 2001 to 2017. Remote Sens. 2021, 13, 1566. [Google Scholar] [CrossRef] [Scilit]
- Lu, Z.; Chen, P.; Yang, Y.; Zhang, S.; Zhang, C.; Zhu, H. Exploring quantification and analyzing driving force for spatial and temporal differentiation characteristics of vegetation net primary productivity in Shandong Province, China. Ecol. Indic. 2023, 153, 110471. [Google Scholar] [CrossRef] [Scilit]
- Dong, S.; Du, S.; Wang, X.-C.; Dong, X. Terrestrial vegetation carbon sink analysis and driving mechanism identification in the Qinghai-Tibet Plateau. J. Environ. Manag. 2024, 360, 121158. [Google Scholar] [CrossRef] [Scilit]
- Wang, F.; Wang, Z.; Zhang, Y. Spatio-temporal variations in vegetation net primary productivity and their driving factors in Anhui Province from 2000 to 2015. Acta Ecol. Sin. 2018, 38, 2754–2767. [Google Scholar] [CrossRef] [Scilit]
- Xu, Y.; Huang, H.-Y.; Dai, Q.-Y.; Guo, Z.-D.; Zheng, Z.-W.; Pan, Y.-C. Spatial-temporal Variation in Net Primary Productivity in terrestrial vegetation ecosystems and its driving forces in Southwest China. Huan Jing Ke Xue Huanjing Kexue 2023, 44, 2704–2714. [Google Scholar] [CrossRef] [Scilit]
- Yang, H.F.; Hu, D.D.; Xu, H.; Zhong, X.N. Assessing the spatiotemporal variation of NPP and its response to driving factors in Anhui province, China. Environ. Sci. Pollut. Res. 2020, 27, 14915–14932. [Google Scholar] [CrossRef] [Scilit]
- Hurst, H.E. Long-term storage capacity of reservoirs. Trans. Am. Soc. Civ. Eng. 1951, 116, 770–799. [Google Scholar] [CrossRef] [Scilit]
- Bui, Q.; Ślepaczuk, R. Applying Hurst Exponent in pair trading strategies on Nasdaq 100 index. Phys. A Stat. Mech. Its Appl. 2022, 592, 126784. [Google Scholar] [CrossRef] [Scilit]
- Cho, P.; Lee, M. Forecasting the volatility of the stock index with deep learning using asymmetric Hurst exponents. Fractal Fract. 2022, 6, 394. [Google Scholar] [CrossRef] [Scilit]
- Zagretdinov, A.; Ziganshin, S.; Vankov, Y.; Izmailova, E.; Kondratiev, A. Determination of pipeline leaks based on the analysis the hurst exponent of acoustic signals. Water 2022, 14, 3190. [Google Scholar] [CrossRef] [Scilit]
- Long, X.; Lin, H.; An, X.; Chen, S.; Qi, S.; Zhang, M. Evaluation and analysis of ecosystem service value based on land use/cover change in Dongting Lake wetland. Ecol. Indic. 2022, 136, 108619. [Google Scholar] [CrossRef] [Scilit]
- Qiao, Y.; Wang, X.; Han, Z.; Tian, M.; Wang, Q.; Wu, H.; Liu, F. Geodetector based identification of influencing factors on spatial distribution patterns of heavy metals in soil: A case in the upper reaches of the Yangtze River, China. Appl. Geochem. 2022, 146, 105459. [Google Scholar] [CrossRef] [Scilit]
- Wang, J.F.; Li, X.H.; Christakos, G.; Liao, Y.L.; Zhang, T.; Gu, X.; Zheng, X.Y. Geographical Detectors-Based Health Risk Assessment and its Application in the Neural Tube Defects Study of the Heshun Region, China. Int. J. Geogr. Inf. Sci. 2010, 24, 107–127. [Google Scholar] [CrossRef] [Scilit]
- Gao, F.; Xiang, Y.; Wang, S.; Zhao, L.; Hou, M.; Bian, S.; Luo, X. Analysis of vegetation change and driving factors in southeastern Tibet based on geographical detector and PLS-SEM. Environ. Sci. Technol 2024, 47, 225–236. [Google Scholar] [CrossRef]
- Lefcheck, J. piecewiseSEM: Piecewise structural equation modelling in r for ecology, evolution, and systematics. Methods Ecol. Evol. 2016, 7, 573–579. [Google Scholar] [CrossRef] [Scilit]
- Vinzi, V.E.; Trinchera, L.; Amato, S. PLS path modeling: From foundations to recent developments and open issues for model assessment and improvement. In Handbook of Partial Least Squares: Concepts, Methods and Applications; Springer: Berlin/Heidelberg, Germany, 2009; pp. 47–82. [Google Scholar] [CrossRef] [Scilit]
- Xu, B.N.; Li, J.J.; Liu, Y.G.; Zhang, T.B.; Luo, Z.Y.; Pei, X.J. Disentangling the response of vegetation dynamics to natural and anthropogenic drivers over the Qinghai-Tibet Plateau using dimensionality reduction and structural equation model. For. Ecol. Manag. 2024, 554, 121677. [Google Scholar] [CrossRef] [Scilit]
- Luo, H.X.; Dai, S.P.; Li, M.F.; Liu, E.P.; Li, Y.P.; Xie, Z.H. NDVI-Based Analysis of the Influence of Climate Changes and Human Activities on Vegetation Variation on Hainan Island. J. Indian Soc. Remote Sens. 2021, 49, 1755–1767. [Google Scholar] [CrossRef] [Scilit]
- Zhong, J.H.; Cui, L.L.; Deng, Z.Y.; Zhang, Y.; Lin, J.; Guo, G.; Zhang, X. Long-Term Effects of Ecological Restoration Projects on Ecosystem Services and Their Spatial Interactions: A Case Study of Hainan Tropical Forest Park in China. Environ. Manag. 2024, 73, 493–508. [Google Scholar] [CrossRef] [Scilit]
- Yang, H.; Wu, K.; Chen, J.H.; Zhong, C.H.; Hu, Z.M. Spatiotemporal Variability and Climatic Drivers of Net Primary Productivity on Hainan Island during 2000-2018. Remote Sens. Inf. 2024, 39, 164–172. [Google Scholar] [CrossRef]
- Chen, B.Q.; Xiao, X.M.; Ye, H.C.; Ma, J.; Doughty, R.; Li, X.P.; Zhao, B.; Wu, Z.X.; Sun, R.; Dong, J.W.; et al. Mapping Forest and Their Spatial-Temporal Changes From 2007 to 2015 in Tropical Hainan Island by Integrating ALOS/ALOS-2 L-Band SAR and Landsat Optical Images. IEEE J. Sel. Top. Appl. Earth Obs. Remote Sens. 2018, 11, 852–867. [Google Scholar] [CrossRef]
- Wang, S.G.; Zhou, S.D. The dynamic relation between fertilization, precipitation and the diffusion of agricultural non-point pollution in Hainan Island. Front. Environ. Sci. 2024, 12, 1419912. [Google Scholar] [CrossRef] [Scilit]
- Yang, Q.; Bader, M.Y.; Feng, G.; Li, J.L.; Zhang, D.X.; Long, W.X. Mapping species assemblages of tropical forests at different hierarchical levels based on multivariate regression trees. For. Ecosyst. 2023, 10, 100120. [Google Scholar] [CrossRef] [Scilit]
- Zhai, J.; Hou, P.; Cao, W.; Yang, M.; Cai, M.Y.; Li, J. Ecosystem assessment and protection effectiveness of a tropical rainforest region in Hainan Island, China. J. Geogr. Sci. 2018, 28, 415–428. [Google Scholar] [CrossRef] [Scilit]
- Shen, W.J.; Liu, Q.; Ji, M.; He, J.Y.; He, T.; Huang, C.Q. Impacts of urban forests and landscape characteristics on land surface temperature in two urban agglomeration areas of China. Sustain. Cities Soc. 2023, 99, 104909. [Google Scholar] [CrossRef] [Scilit]
- Xi, Z.; Chen, G.; Xing, Y.; Xu, H.; Tian, Z.; Ma, Y.; Cui, J.; Li, D. Spatial and temporal variation of vegetation NPP and analysis of influencing factors in Heilongjiang Province, China. Ecol. Indic. 2023, 154, 110798. [Google Scholar] [CrossRef] [Scilit]
- Zhang, L.; Ren, X.L.; Wang, J.B.; He, H.L.; Wang, S.Q.; Wang, M.M.; Piao, S.L.; Yan, H.; Ju, W.M.; Gu, F.X.; et al. Interannual variability of terrestrial net ecosystem productivity over China: Regional contributions and climate attribution. Environ. Res. Lett. 2019, 14, 014003. [Google Scholar] [CrossRef] [Scilit]
- Chen, A.; Zhong, X.Z.; Wang, J.L.; Li, J. Spatiotemporal patterns and driving forces of net primary productivity in South and Southeast Asia based on Google Earth Engine and MODIS data. Catena 2025, 249, 108689. [Google Scholar] [CrossRef] [Scilit]
- Sun, L.; Li, H.; Wang, J.; Chen, Y.H.; Xiong, N.A.; Wang, Z.; Wang, J.; Xu, J.Q. Impacts of Climate Change and Human Activities on NDVI in the Qinghai-Tibet Plateau. Remote Sens. 2023, 15, 587. [Google Scholar] [CrossRef] [Scilit]

Disclaimer/Publisher’s Note: The statements, opinions and data contained in all publications are solely those of the individual author(s) and contributor(s) and not of MDPI and/or the editor(s). MDPI and/or the editor(s) disclaim responsibility for any injury to people or property resulting from any ideas, methods, instructions or products referred to in the content. |
© 2026 by the authors. Licensee MDPI, Basel, Switzerland. This article is an open access article distributed under the terms and conditions of the Creative Commons Attribution (CC BY) license.