


Abstract
With the acceleration of global urbanization, water resources, as a core element supporting the economic and social development of cities, have seen their green configuration efficiency become a significant bottleneck restricting the sustainable development of cities. In order to alleviate the contradiction between water resources supply and demand, and to optimize the water supply issue brought about by rapid urbanization, based on the DEA–Malmquist index method, this study systematically measured the dynamic evolution characteristics of the green configuration efficiency of water resources in the Yellow River areas of Gansu Province, China from 2012 to 2022, and analyzed the key factors affecting these efficiencies. The research findings show that from 2012 to 2022, the Yellow River areas in Gansu Province demonstrated DEA effectiveness, while the majority of the remaining areas experienced varying degrees of fluctuation and increase in the efficiency of green water resource allocation, with an overall average increase rate of 4.28%. By decomposition of the Malmquist green configuration efficiency index, it was found that from 2012 to 2022, the green configuration efficiency of water resources in the Yellow River areas of Gansu Province showed an overall trend of fluctuating upward first and then decreasing. The Yellow River areas of Gansu Province all showed technological progress to varying degrees, but due to the limitation of the decline in the technical efficiency index, some areas failed to achieve the efficient utilization of green allocation of water resources. Based on the research conclusions, countermeasures and suggestions for improving the efficiency of green water resource allocation in various regions of Gansu Province are put forward.
1. Introduction
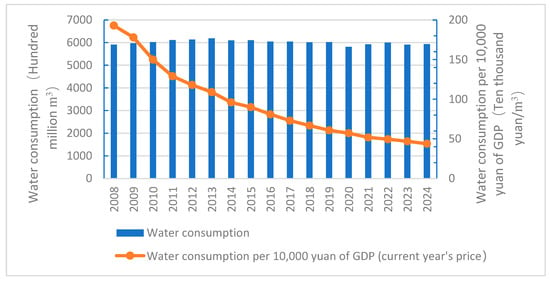
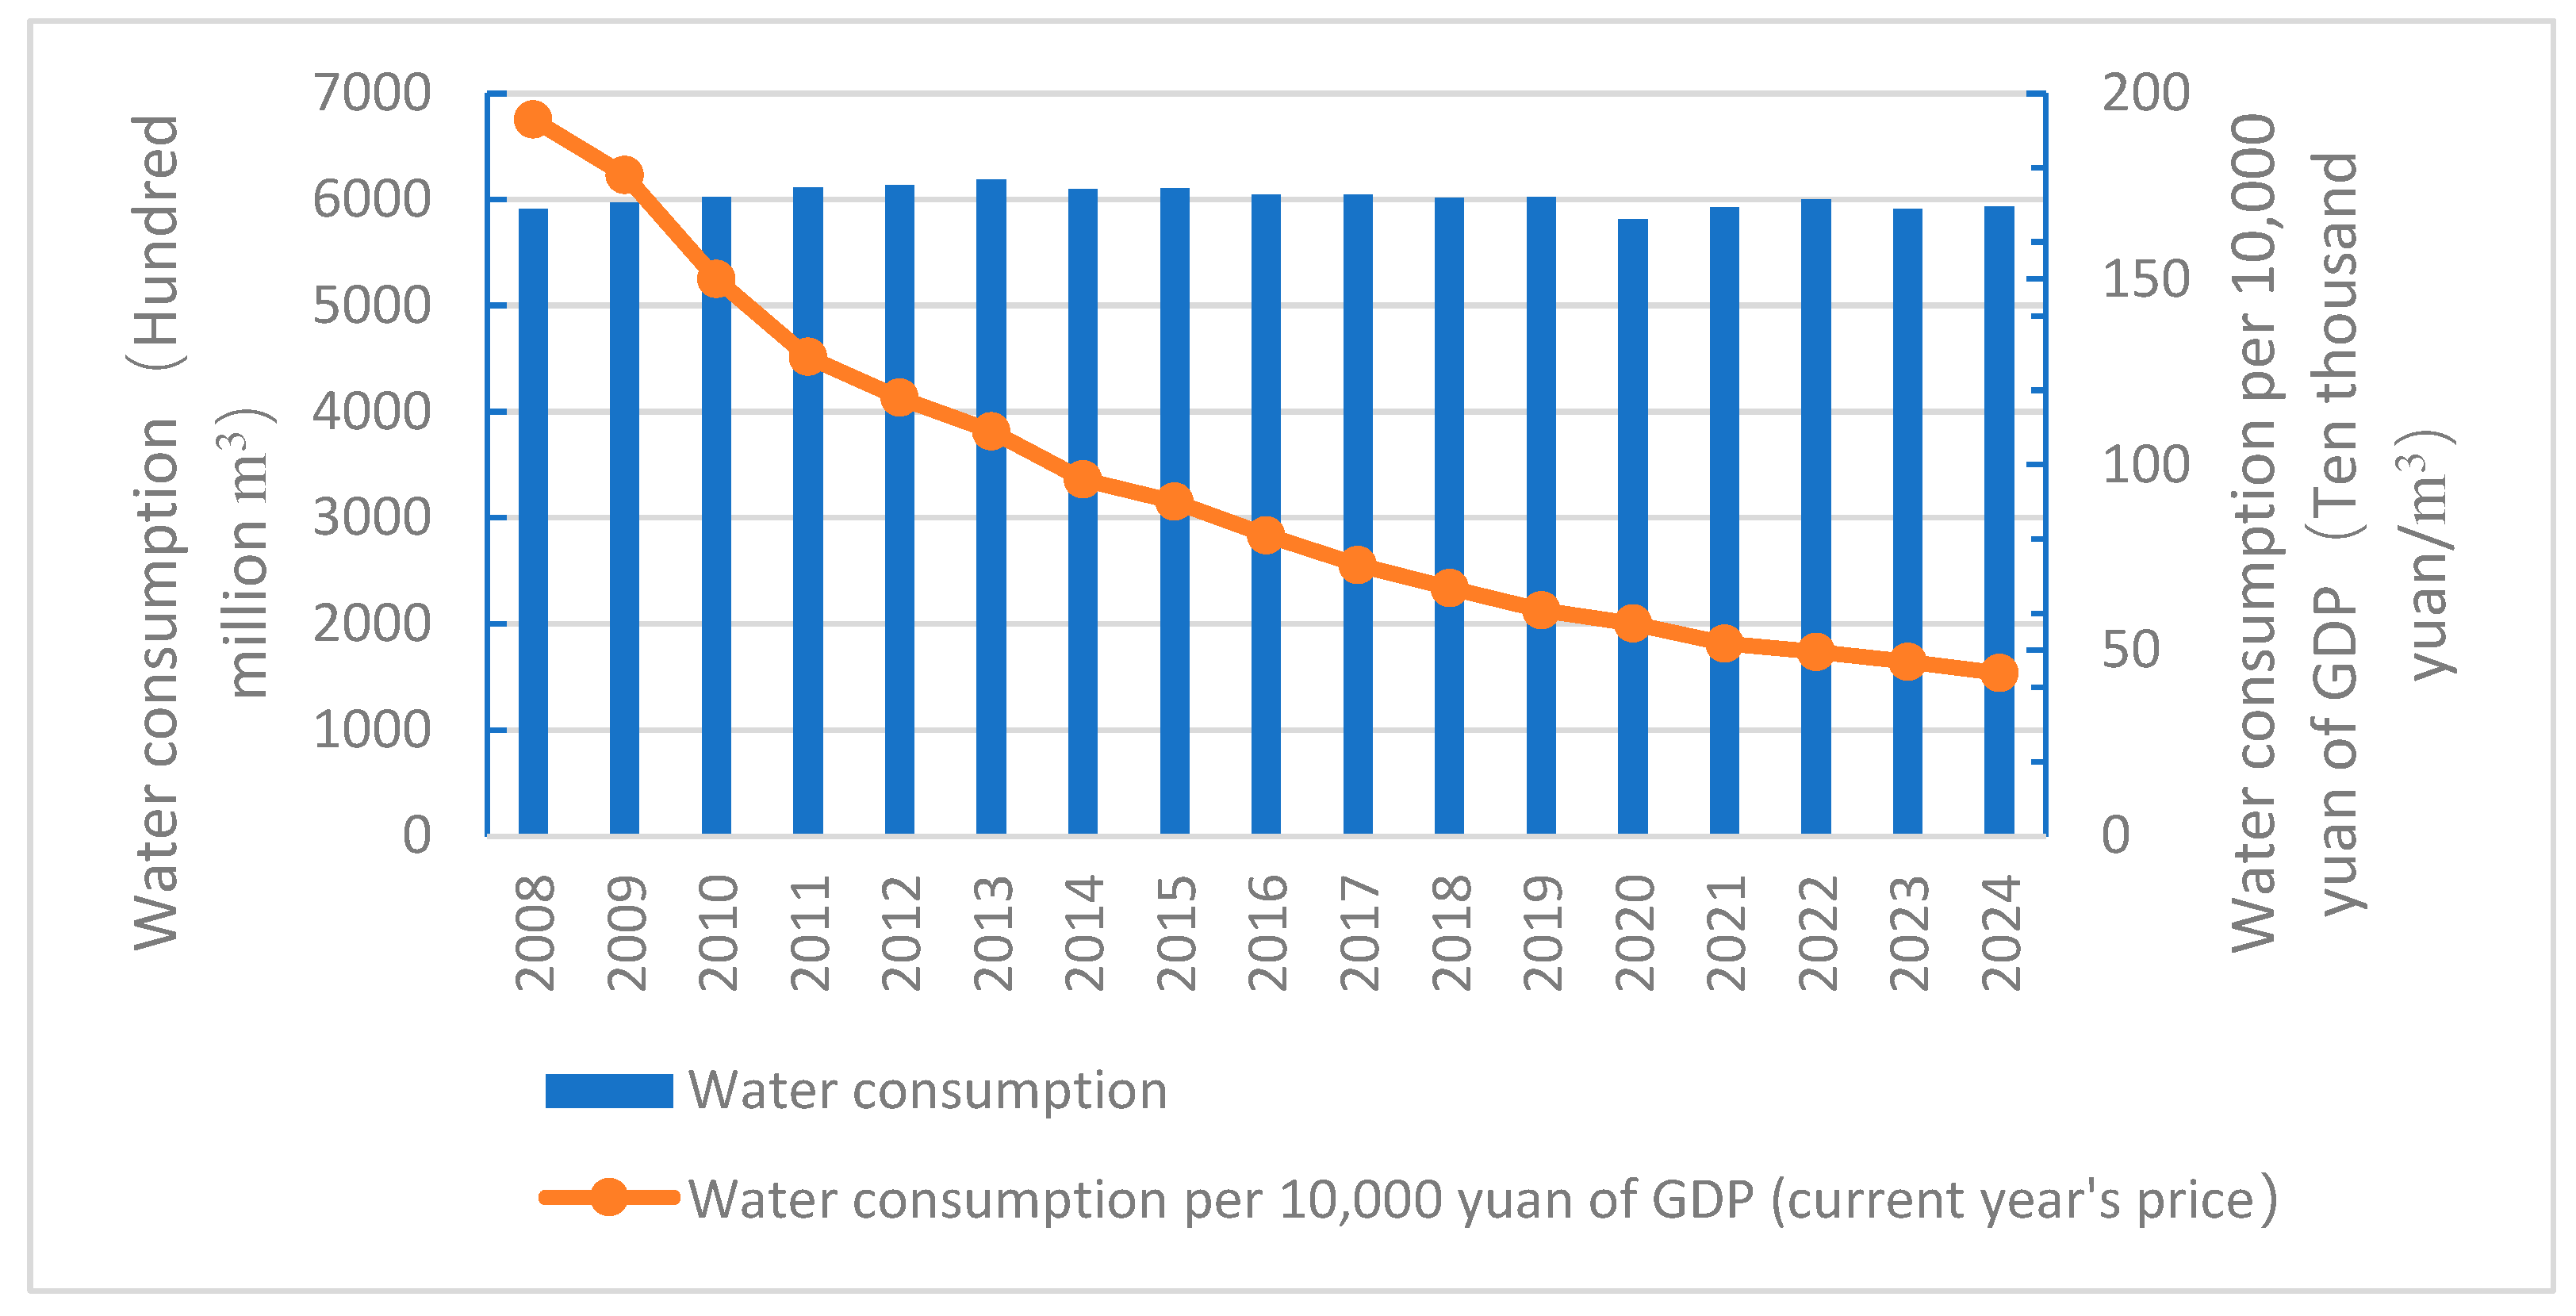
As an indispensable element of production and life, with the improvement of China’s economic development level and residents’ living standards, the demand for water resources has been increasing year by year [1]. From 2000 to 2016, China’s total water consumption increased from 549.8 billion cubic meters to 604 billion cubic meters. Although the implementation of water-saving society construction projects has to some extent curbed the excessive growth of total water demand, the average annual water shortage still stands at around 50 billion cubic meters. The long-term extensive economic growth model that emphasizes growth over efficiency has led to a huge waste of water resources. Calculated at current prices, China’s water consumption per 10,000 yuan of GDP (Gross Domestic Product) dropped from 548.26 cubic meters in 2000 to 81.17 cubic meters in 2016. In contrast, the water consumption per 10,000 yuan of GDP in Japan and the United States was only 24.02 cubic meters and 36.48 cubic meters in 2009 and 2015 respectively [2,3,4]. The efficiency of water resource utilization in China needs to be further improved (Figure 1). Meanwhile, the future situation of water supply and demand in China is also very severe, and water shortage has become a bottleneck problem affecting the stable development of the social economy in the future. Based on the experience of industrialization and urbanization in developed countries, China’s total water demand will reach 720 billion cubic meters by 2030. Compared with the control target of 700 billion cubic meters set in the National Water Resources Comprehensive Plan (2010–2030), there is still a gap of 20 billion cubic meters. Based on the standard that China’s per capita GDP reaches the level of moderately developed countries in the middle of the 21st century, the total water consumption will approach 2550 billion cubic meters by 2050. At that time, China can only achieve a balance between supply and demand by exhausting all renewable water resources.
Figure 1.
Water usage in China from 2008 to 2024 [5].
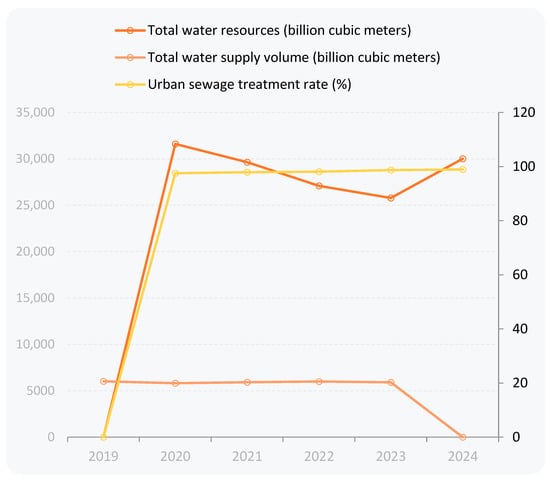
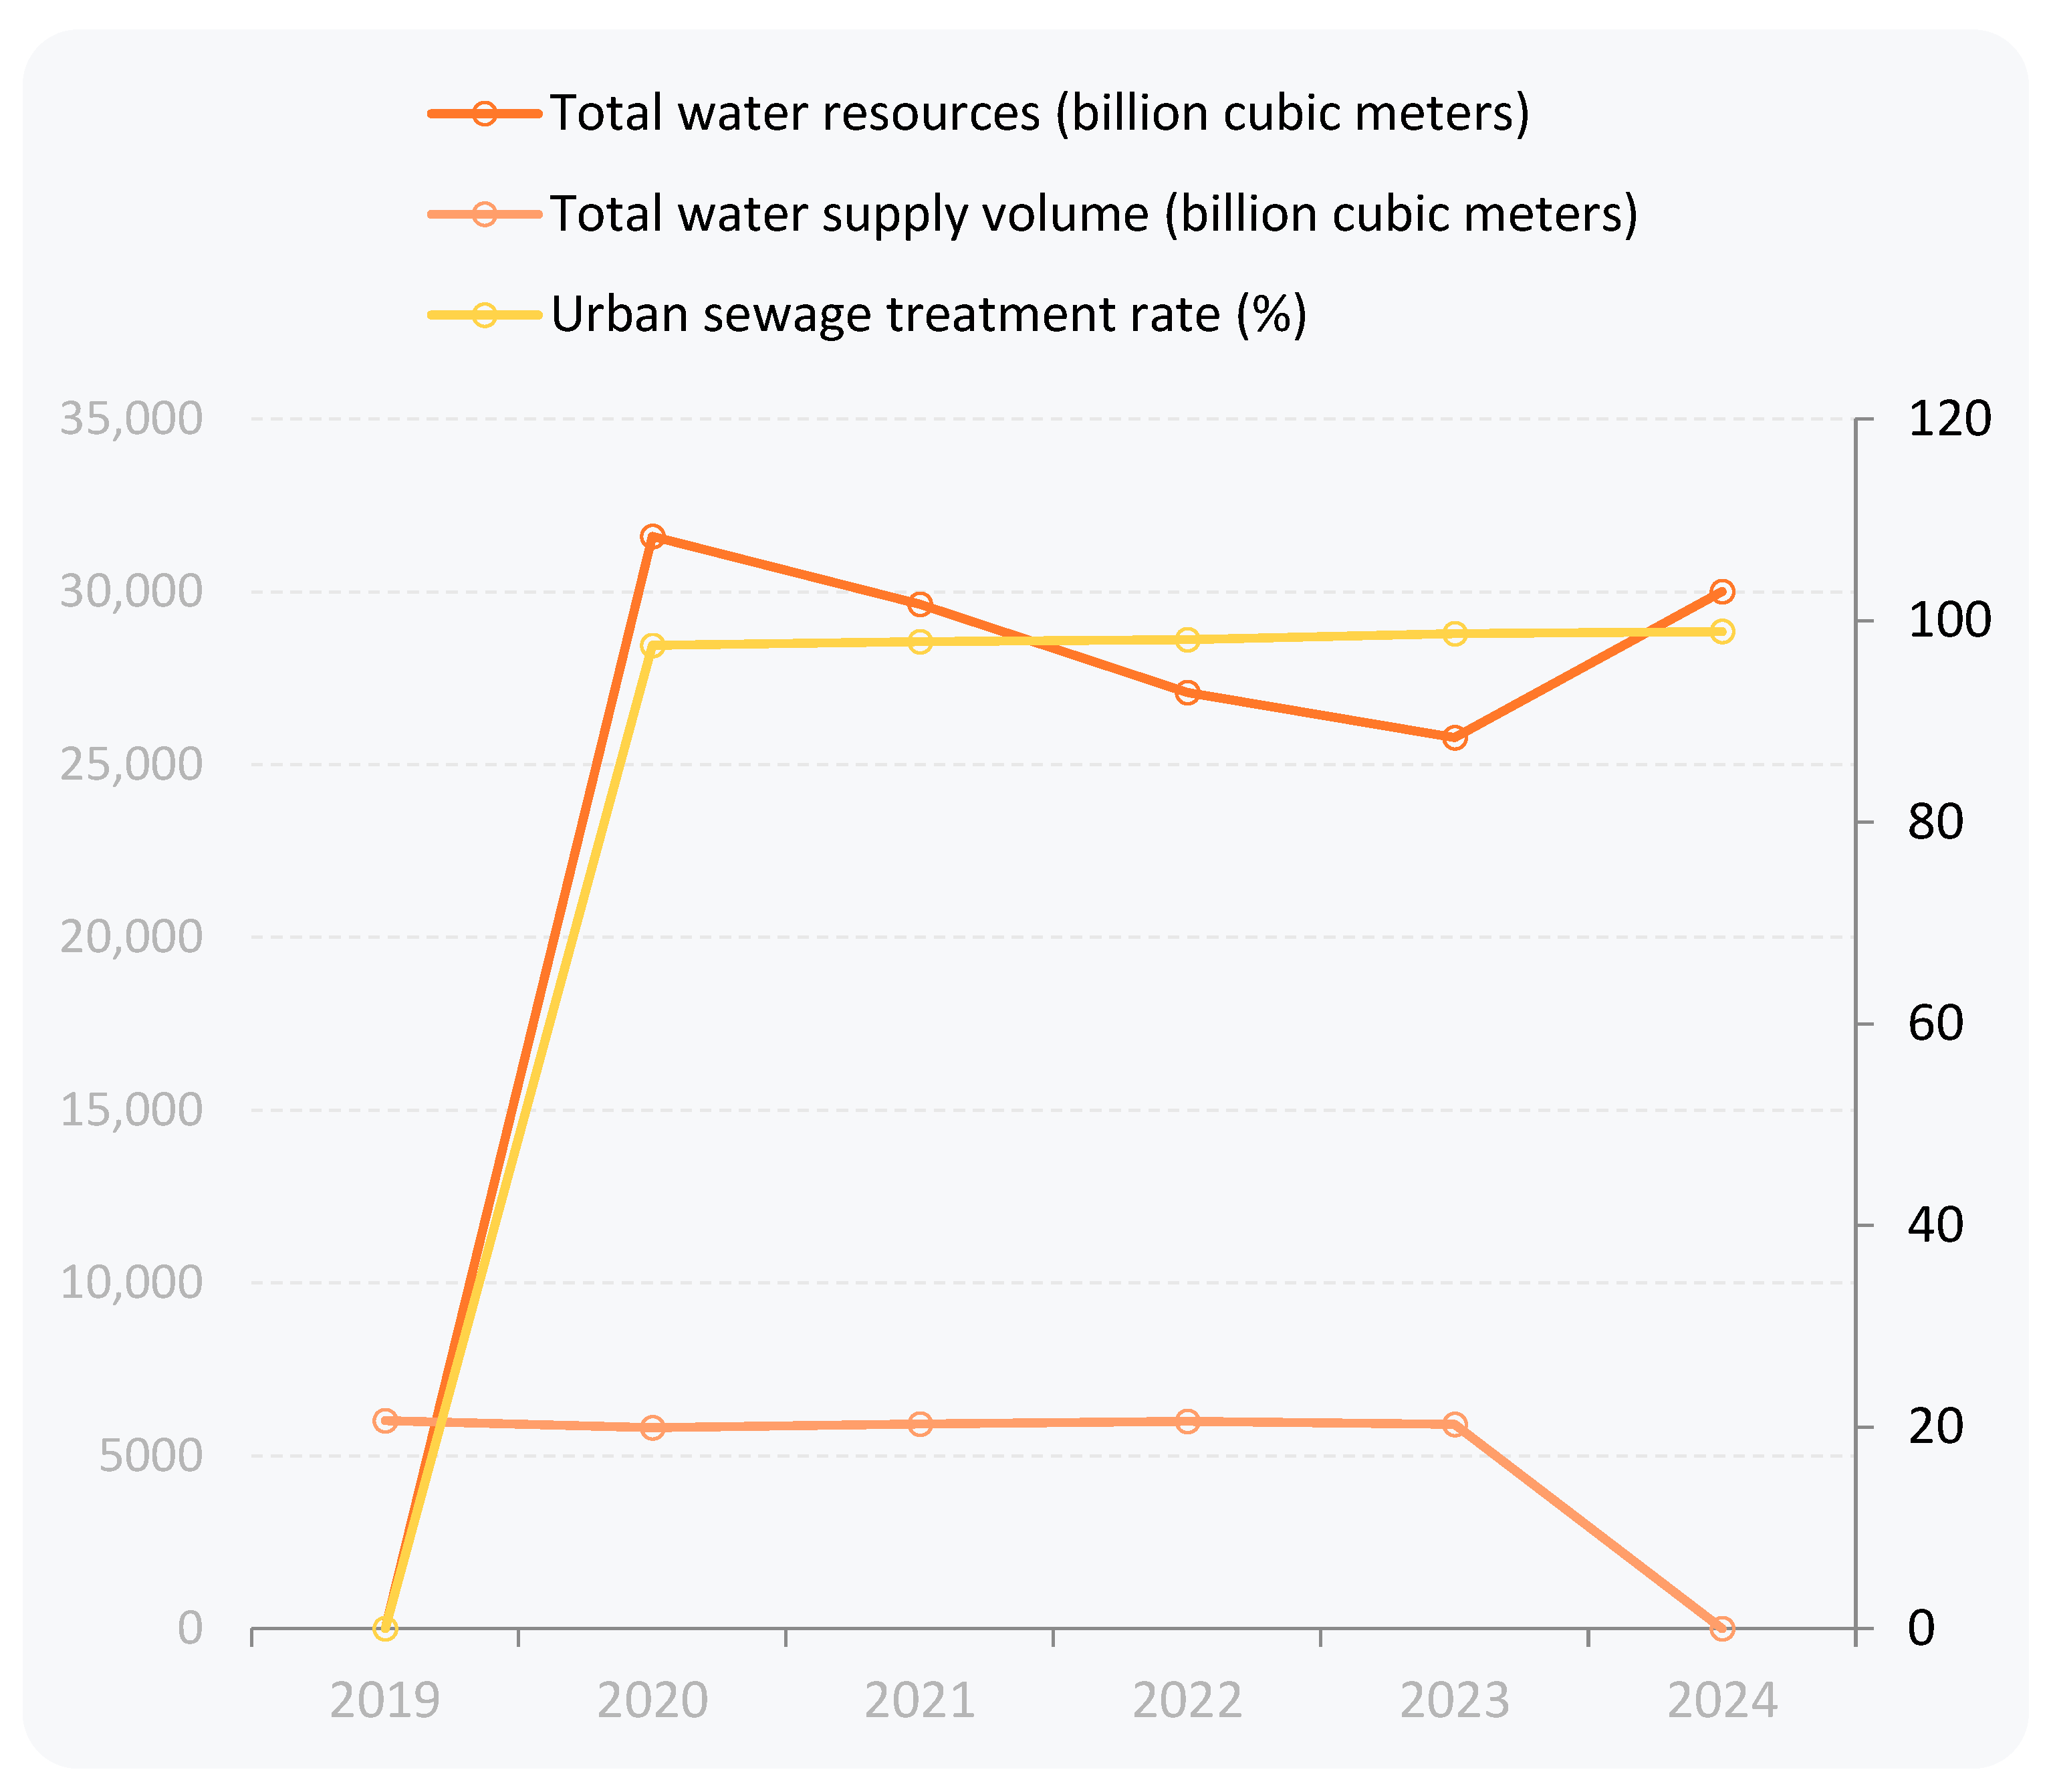
In addition to the tight supply and demand of water, the water environment situation in China is also not optimistic. Although the urban sewage treatment rate has reached over 90%, the rural sewage treatment rate is only 22% [6]. A large amount of domestic sewage is directly discharged into the environment without treatment, becoming the main source of sewage. The base of industrial wastewater discharge is large, and the composition of pollutants is complex. However, the rate of meeting discharge standards is low, which can easily cause soil pollution, groundwater pollution, and pose a great threat to human health. On the other hand, the backward standards of sewage treatment technology, the aging and insufficient coverage of sewage pipe networks, and the lack of supervision have further exacerbated water pollution. National water resources and sewage treatment data show that from 2020 to 2024, the total water resources in China have shown a fluctuating downward trend, dropping from 3160.52 billion cubic meters to 2578.25 billion cubic meters [7]. During the same period, the total water supply has fluctuated narrowly between 581.29 billion and 599.82 billion cubic meters. Meanwhile, the urban sewage treatment rate has continued to rise, steadily increasing from 97.53% in 2020 to 98.93% in 2024, demonstrating an enhanced capacity for water pollution control. The contradiction between water supply and demand remains severe [8]. As shown in Figure 2, compared with 2020, the total water resources decreased by 20% in 2023. However, the total water supply only decreased by 1.76%. This highlights the reality that there is limited room for improvement in terms of green allocation efficiency. The dual pressures of supply–demand imbalance and efficiency lag directly reflect the deep-seated problems existing in the water resource allocation system during the rapid urbanization process.
Figure 2.
Water pollution status in China from 2019 to 2024 [9].
With the continuous deepening of research on water resources issues, the scope of water resource allocation research has expanded from the early allocation of single reservoirs or irrigation districts to water resource allocation in river basins and across river basins, as well as urban water resource allocation [10]. Vedula and Mujumdar (1992) constructed an optimal scheduling model for reservoirs in irrigation districts by using the stochastic dynamic programming method to study the problem of water resource allocation under the seasonal differences in water demand of different crops in irrigation districts [11]. Kucukmehmetoglu et al. (2010) took the political participation willingness of the countries in the Rates and Tigris River basins as the fuzzy variable of the game, calculated the intensity of the political participation willingness by using the fuzzy reasoning method, and studied the optimal allocation scheme of water resources across river basins [12]. Müller et al. (2017) combined the two-dimensional groundwater distribution and allocation model with game theory to study the governance organization effectiveness of groundwater resource allocation in the critical area between Jordan and Saudi Arabia, as well as the impact of unilateral resolutions on the exploitation of shared groundwater on the exploitation costs of both sides and the economic benefits of agricultural planting areas [13]. Cities are important spatial carriers for human beings to gather and survive, and water resources are one of the key factors related to the future development scale and direction of cities [13]. Xiang (2019) believes that in addition to traditional water sources such as surface water, groundwater and transferred water, reclaimed water, due to its environmental friendliness and recyclability, has become an important source of urban landscape ecological water, industrial water and domestic water for flushing toilets [14]. The issue of reclaimed water utilization has also received extensive attention in the research of urban water resource allocation [14].
The theory of green allocation of water resources aims to optimize the utilization structure of water resources, enhance utilization efficiency, and ensure an ecological environment. Its core objective is to achieve a dynamic balance between resource allocation and social economic development through scientific management methods. The essence of this theory encompasses three principles: fairness in resource allocation, sustainability in utilization, and efficiency in benefits. The goal is to address the constraints of water resource supply and demand on economic development through multi-dimensional allocation strategies. The research results of the above-mentioned scholars provide theoretical references for this paper. However, in terms of research areas, there is still a lack of discussion on the western regions, especially the Yellow River areas along Gansu Province. Given the important position of the Yellow River areas along Gansu Province in the Yellow River Basin, its economic development is closely related to water resources. Moreover, Gansu Province has a poor endowment of water resources, a low per capita water resource possession, and a prominent problem of water shortage. In addition, Gansu is located in an arid and semi-arid area, and the efficiency of water resource utilization is relatively low. Based on the above analysis, this paper measures the green configuration efficiency of water resources in Gansu Province based on the DEA–Malmquist index model. This paper aims to break through the static limitations of traditional efficiency evaluation and construct a dynamic measurement framework covering technological progress, scale efficiency and total factor productivity. By integrating time series data such as the total national water resources and sewage treatment rates, the spatio-temporal evolution laws of water resource green configuration efficiency at different stages of urbanization are revealed. The research not only focuses on the path of efficiency improvement, but also emphasizes the coordinated realization of fairness and sustainability, providing theoretical tools and practical solutions for solving the problems of resource-constrained urban development. This paper, based on the dynamic analysis of the DEA–Malmquist index, reveals the deep mechanism of regional differences. This fluctuating change reflects the unbalanced development of resource allocation capabilities among regions, providing dynamic evidence for identifying the bottlenecks of efficiency improvement.
By measuring the efficiency of green allocation of water resources, this study reveals the potential problems in water resource utilization during the current urbanization process, such as uneven allocation and severe waste. Using the DEA–Malmquist index model, we can quantify the efficiency of water resource allocation in different cities and regions, and analyze their changing trends. This quantitative analysis helps decision-makers intuitively understand the current situation of water resource allocation and provide scientific basis for subsequent policy formulation. At the same time, clearly distinguishing between efficiency assessment and policy effectiveness or management quality is a major feature of this research. In terms of efficiency assessment, we focus on the input–output ratio of green allocation of water resources, that is, by optimizing resource allocation, we aim to achieve sustainable utilization of water resources. Meanwhile, in terms of policy effectiveness and management quality, we mainly analyze the specific measures implemented during the policy process and their impact on the efficiency of resource allocation.
2. Materials and Methods
2.1. DEA Model
Gansu Province is located in the northwest of China and is a typical dryland farming area. In total, 70% of the cultivated land in the province is dry land. The agricultural ecological environment is fragile and drought disasters occur frequently. As a core flax-growing area in China, Gansu Province boasts a complex and diverse terrain, including mountains, plateaus, plains, river valleys and deserts, with the terrain sloping from southwest to northeast. Influenced by the terrain, the climate types in Gansu Province, from north to south, are plateau climate, arid climate, semi-arid climate, semi-humid climate and humid climate in sequence.
This study employs Data Envelopment Analysis (DEA) technology in combination with the Malmquist index method to evaluate the efficiency of green water resource allocation [15]. The core of the DEA framework lies in integrating the input–output information of each decision-making entity, calculating the relative efficiency values of each entity, and then ranking and comparing them based on these values to ultimately identify the decision-making entity with relatively optimal efficiency. The DEA model does not require the specific functional relationship between input and output indicators to be determined in advance, nor does it need to preset weights. Therefore, it avoids the influence of subjective factors and has strong objectivity. The traditional CCR and BCC models are adopted to measure the comprehensive efficiency, pure technical efficiency and scale efficiency of each decision-making unit. Total factor productivity (TFP) can be decomposed into the technology progress index (TECHCH) and the technology efficiency change index (EFFCH). When scale efficiency is variable, the technology efficiency change index can be further divided into the pure technology efficiency index (PECH) and the scale efficiency index (SECH). The formula is as follows:
Specifically, X represents the set of input parameters, Y corresponds to the set of output parameters, characterizes the degree of waste of input resources, reflects the situation of insufficient output, ε exists as a non-standard infinitesimal, and λi represents the weight distribution coefficient. The θ indicator is used to measure the overall technical efficiency level of the decision-making unit. The numerical range of θ is limited to between 0 and 1. When θ takes the value of 1 and simultaneously meets the conditions of = 0 and = 0, it indicates that the decision-making unit is in a DEA-efficient state, and at this time, the input–output ratio achieves a Pareto optimal configuration.
2.2. Construction of Malmquist Exponential Model
In 1994, Fare integrated the Malmquist index with the DEA method to examine the evolution of total factor productivity in two adjacent periods (t period to t + 1 period) [15]. The original design intention of this model framework is to reveal the dynamic evolution law of the green configuration efficiency of water resources in the Gansu region. Its core decomposition formula can be expressed as
In the formula:
TFPCH—Productivity Change Index
EFFCH—Index of Change in Technical efficiency
TECHCH—When the TECHCH value exceeds 1, it indicates that the production efficiency is on the rise. The EFFCH indicator in this calculation formula can be further subdivided into two dimensions: changes in pure technical efficiency and changes in scale benefits.
2.3. Construction of DEA–Malmquist Exponential Model
In 1994, the renowned operations researcher Rolf Fare successfully integrated this index with the data envelopment analysis technique. This indicator, by calculating the ratio relationship between actual output and input factors, has significant application value in the fields of regional economic development and production efficiency assessment [15]. This study innovatively integrates the DEA method and the Malmquist index analysis framework to establish a dynamic efficiency measurement system, which is specifically designed to assess the performance level and dynamic evolution law of green water resource allocation in the rapid urbanization process. This model is theoretically supported by the multi-objective dynamic characteristics of the water resource allocation system and systematically integrates multi-dimensional constraints such as economic benefits, social benefits, and ecological sustainability.
2.4. Variable Selection and Data Sources
In terms of the construction of the indicator system, through literature analysis and expert consultation, four indicators, namely the optimal water consumption, water redundancy, insufficient agricultural water output, and water conservation rate, were selected as input variables (i.e., representing inputs X1 to X4 in sequence), and at the same time, the total urban output value was chosen to represent the water output situation (i.e., output Y), forming a measurement framework containing five core indicators. These indicators not only reflect the physical utilization status of water resources, but also cover multi-dimensional goals such as ecological protection and economic and social benefits, and can comprehensively reflect the comprehensive efficiency of green water resource allocation. Descriptive statistics of the indicators are detailed in Table 1.
Table 1.
Descriptive statistical table of input-output efficiency of green allocation of water resources in the Yellow River areas of Gansu Province.
In terms of data processing, the study adopted the panel data of Gansu Province from 2012 to 2022. The data were sourced from the “China Water Resources Bulletin”, the “China Environmental Statistical Yearbook” and the Gansu Province Statistical Yearbook. To eliminate dimensional differences, all indicators were standardized and the homogeneity of the data distribution was verified by the Kruskal–Wallis test. The model calculation was implemented with the aid of DEAP 2.1 and Stata 16.0 software.
In addition, to ensure the co-directionality of input and output data, SPSS24.0 software was used to conduct correlation tests on the two sets of data. The results are shown in Table 2. It can be observed that the correlation coefficients between the output variable and the input variables are all positive numbers, and they have passed the significance test at the p < 0.01 level, that is, all indicators conform to the principle of co-directionality, allowing for further research.
Table 2.
Correlation test of input indicators and output indicators in the Yellow River areas of Gansu Province.
3. Results
3.1. Analysis of the Green Configuration Efficiency of Water Resources in the Yellow River Areas of Gansu Province
This paper incorporates the panel data at the municipal and prefectural levels of the Yellow River region in Gansu Province from 2012 to 2022 into Equations (1) and (2) of the BCC model. With the help of DEAP2.1 software, DEA static efficiency analysis is conducted in an input-oriented manner. The obtained results are shown in Table 3.
Table 3.
Agricultural water green configuration efficiency of each city and prefecture along the Yellow River in Gansu Province.
As can be seen from Table 2, during the statistical period, the average water consumption quota and efficiency of the 9 cities in the Yellow River Basin of Gansu Province showed a trend of first fluctuating upward, then decreasing, and finally slightly recovering. Since 2012, it has risen from 0.923 to 0.941 in 2015, then decreased year by year to the lowest value of 0.782 in 2021, then rebounding to 0.822 in 2022. Overall, it has decreased by approximately 12.70%. It can be seen that the range of farmland water use efficiency in various cities and regions along the Yellow River in Gansu Province from the DEA effective state is still quite large, and there is still a significant decline in benefits. In conclusion, only Wuwei, Gannan and Pingliang have been able to correctly adopt green water resource management measures. Among the other six places, except for Baiyin, whose water resource utilization rate has always been low, Lanzhou, Tianshui, Qingyang, Dingxi and Linxia have also witnessed a significant decline in water use efficiency. The final recovery is merely a compensation. The reduction in the relative effect is still relatively small.
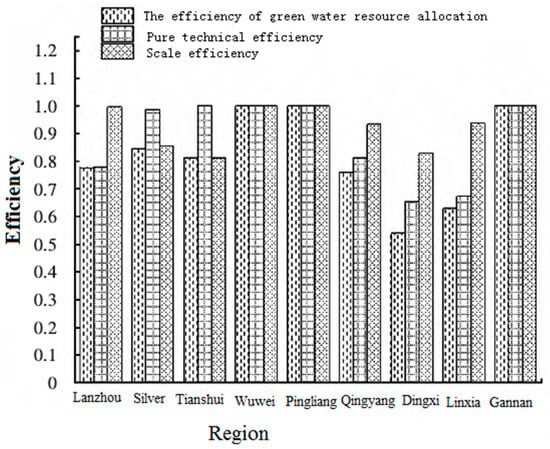
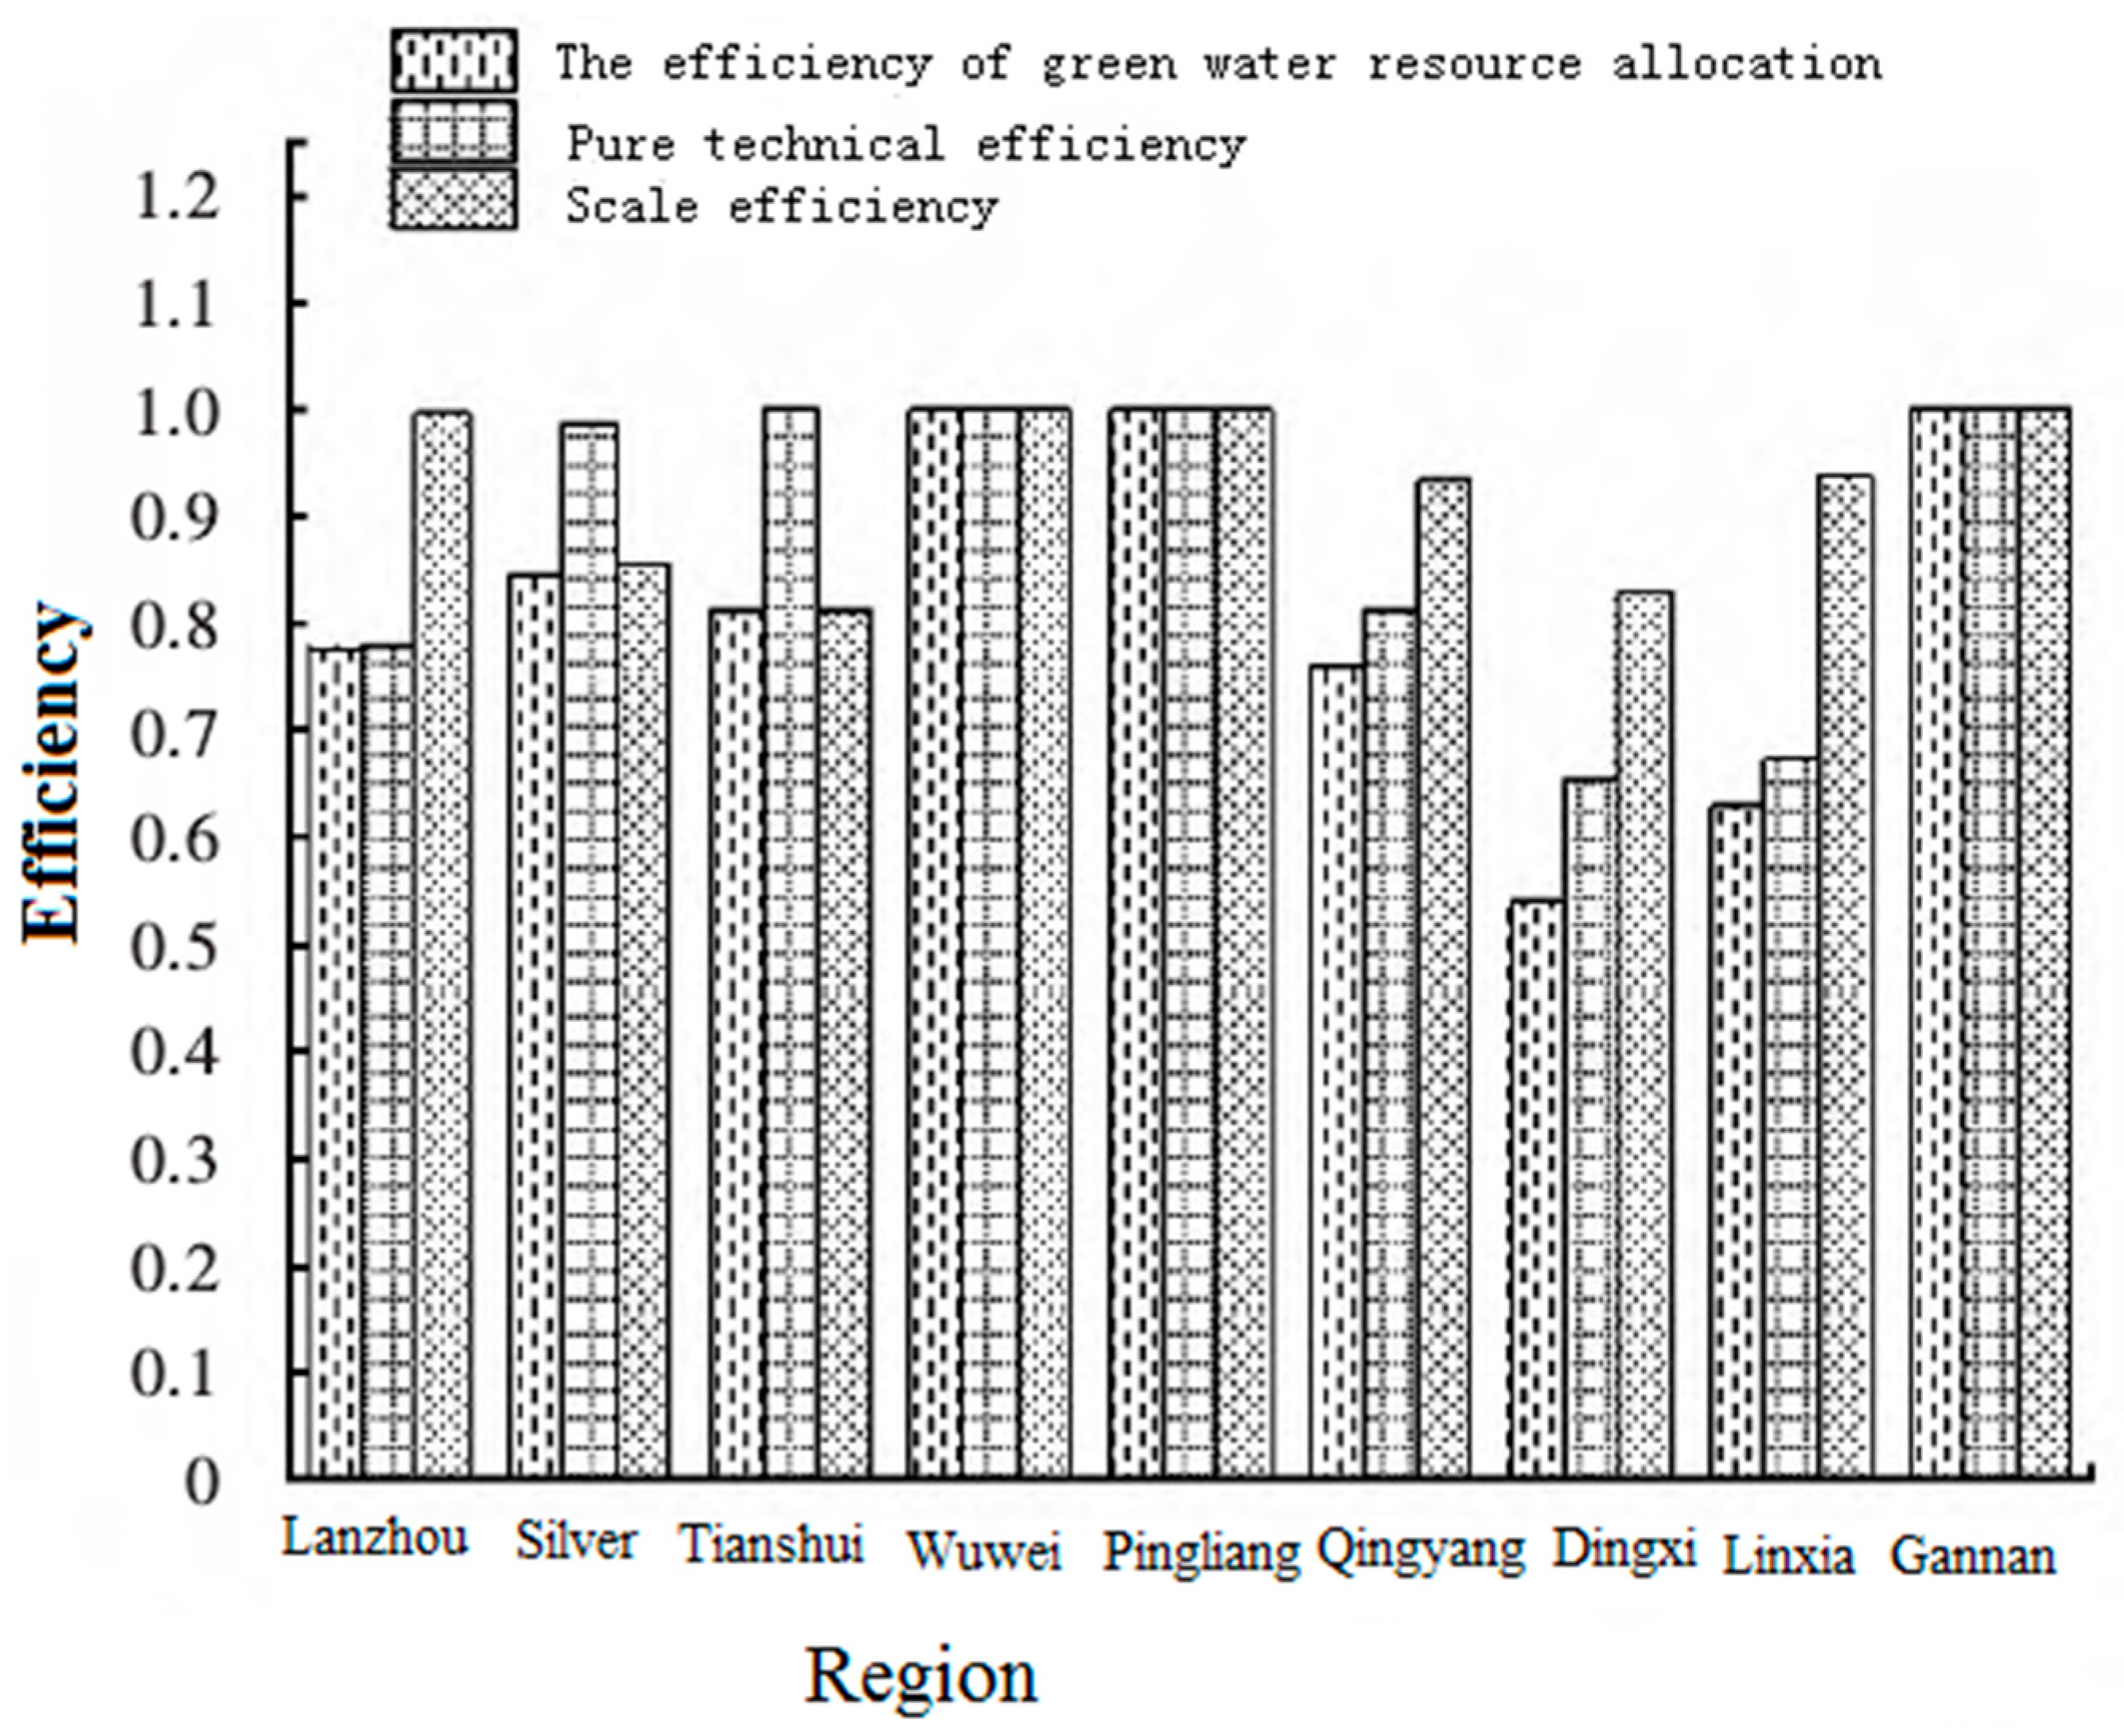
Taking 2022 as the research benchmark and applying the principles of the BCC model, the differences in the spatial green configuration efficiency of agricultural water resources were classified. Figure 3 shows the classification results of the pure technical efficiency and scale efficiency of the green configuration efficiency of agricultural water resources.
Figure 3.
The green configuration efficiency of water resources and its decomposition in each city and prefecture along the Yellow River in Gansu Province in 2022.
As can be seen from Figure 3, by 2022, Wuwei, Pingliang and Gannan all had a pure technical efficiency of 1 and a scale efficiency of 1, indicating that there were no benefit issues among the three places. Meanwhile, the pure technical efficiency of Tianshui is also equal to 1, indicating that the allocation of farmland irrigation water resources in this area reached the optimal level during this period. However, the scale efficiency is only 0.814 and shows a downward trend. From this, it can be seen that in order for DEA to achieve effective output, we must reduce our output scale. In addition, the pure technical efficiency in the silver region reached 0.987, which was higher than its scale efficiency of 0.857, and showed a downward trend. Thus, it can be observed that silver not only has problems in terms of water resources, but also should make better use of various production factors. In the other areas, the pure technicalefficiency was significantly higher than the scale efficiency. For instance, Lanzhou was the only place where the scale benefits increased. This shows that increasing the production scale can greatly improve the efficiency of farmland water use.
3.2. Dynamic Analysis of Green Configuration Efficiency of Water Resources in Gansu Province
To present the efficiency trends and driving mechanisms of green water resource allocation in the Yellow River areas of Gansu Province in each year, the Malmquist productivity index model was selected to measure the green water resource green configuration efficiency (LP), its decomposition and growth rate. The results are shown in Table 4.
Table 4.
Green configuration efficiency index and decomposition of water resources in the Yellow River areas of Gansu Province from 2012 to 2022.
From the perspective of the technology efficiency change index (EFFCH), the data for 2012–2013, 2016–2017, and 2022 showed a positive growth trend, while the remaining years showed negative growth. The EFFCH is further decomposed into PECH and SECH. The two generally show a “W” shape change. The average values of PECH and SECH from 2012 to 2022 were both 0.999, indicating that the pure technical efficiency and scale efficiency slightly declined over the time period. This has become the main factor hindering the further improvement of the green configuration efficiency of water resources in Gansu Province. It indicates that there are deficiencies in the management of water resources throughout the province in terms of scale constraints and policy formulation and implementation. Efforts should be made to accelerate the optimization and adjustment of the industrial structure, strengthen the effective management of water resources, and promote the continuous improvement of related technical levels.
From the perspective of the technological progress change index (TECHCH), technological change showed an upward trend in all years except 2015 and 2017, which was basically the same as the trend of the total factor productivity index. The average value over the 11 years was 1.043, with an increase of 4.3%, slightly higher than the total factor productivity index, proving that during the study period, the technological level of Gansu Province was continuously improving. The advancement of water-saving technologies has led to a constant increase in the efficiency of green water resource allocation in Gansu Province. This means that in the process of water resource production and utilization, more attention should be paid to the improvement of technical efficiency. Increasing investment in advanced technologies is an effective way to enhance the efficiency of green water resource allocation.
3.3. Analysis of Water-Saving Potential in the Yellow River Areas of Gansu Province
An analysis of input redundancy and output insufficiency was conducted on agricultural water use in 9 cities and prefectures along the Yellow River in Gansu Province in 2020, and their water-saving potential was calculated. The specific calculation results are shown in Table 5.
Table 5.
Assessment of water-saving potential of cities and prefectures along the Yellow River in Gansu Province in 2020.
As can be seen from Table 5, although no overproduction in the cities along the Yellow River in Gansu Province was detected, the remaining production capacity of most DEA-effective cities in 2019 has reached a certain level. For instance, the water consumption in Tianshui, Wuwei, Pingliang and Gannan has been fully utilized, so it is impossible to achieve more effective water conservation. If water consumption is to be further reduced, only the proportion of water resources and other inputs can be redistributed. Meanwhile, the water usage rates of agricultural land in Lanzhou, Baiyin, Qingyang, Dingxi and Linxia were 30.02%, 14.70%, 18.55%, 34.65% and 48.26% respectively, with Baiyin having the lowest water usage rate. Linxia has the highest amount of water surplus and the largest ratio of water that can be saved. This means that Linxia has the greatest potential to save water when it needs it the most. Meanwhile, the water usage rates in Lanzhou and Dingxi exceed 30%, which indicates that these two regions have the strongest water-saving capabilities.
4. Discussion
4.1. Conclusions and Policy Implications
This study adopted the BCC model in combination with the Malmquist productivity index to construct a measurement framework for the efficiency of green water resource allocation and total factor output. A systematic calculation and comparative analysis were conducted on the green configuration efficiency of water resources and the total factor output of agricultural water use in the Gansu section of the Yellow River Basin and its internal cities from 2012 to 2022, and the following important findings were obtained:
(1) The measurement results of water use efficiency in the Yellow River Basin of Gansu Province through the BCC model show an increasing state of upward–downward–upward–upward–downward, which then gradually stabilizes and repeats to a certain level. In 2022, the average agricultural water green configuration efficiency decreased by 10.9% compared with that in 2012. Among the 9 cities, only three cities have been in a long-term DEA effective state (Wuwei, Pingliang and Gannan), while other regions have shown varying degrees of efficiency decline during this stage. From the perspective of agricultural water utilization efficiency in various regions, except for Tianshui, all are affected to varying degrees by the scale effect, and none have reached the frontier efficiency line. In terms of the overall water consumption of these 9 cities in 2022, we also made judgments on effective investment and ineffective investment. We found that although there was no obvious phenomenon of ineffective investment, it was relatively common in the cities that failed to achieve DEA efficiency. Moreover, in Linxia, the proportion of ineffective investment in water resource utilization was as high as 48.26%. From this, it can be seen that the decline in efficiency also implies huge potential for savings.
As for other cities like Linxia, their pure technical efficiency is only 0.620, and they are facing a downward trend in scale benefits. However, in addition to reducing our water resource consumption, we should also increase readjustments within production factors to optimize our industrial structure. Finally, the problems in Qingyang City and Dingxi City are similar to those in Linxia City, but their current efficiency situation is not as serious as that in Linxia City.
(2) According to the calculation results of the Malmquist index, the green configuration efficiency of water resources in the Yellow River Basin of Gansu Province shows a fluctuating characteristic. Data shows that except for the two special periods of 2016–2017 and 2019–2020, the total factor productivity of water resource allocation in this region has maintained a positive growth trend. From the perspective of specific constituent elements, technical efficiency has shown an average annual negative growth of 1.4%, while technological progress has maintained a significant increase of 9.9%. It is worth noting that both the pure technical efficiency and scale efficiency indicators have continued to decline, with annual drops reaching 1.1% and 0.3% respectively. These data reflect that the improvement of total factor productivity mainly stems from the driving force of technological innovation, but the continuous decline in technological efficiency has restricted the overall efficiency. Although the water green configuration efficiency of various cities generally improved during the research period, there were still obvious deficiencies in the application of water-saving technologies in some areas. In response to this situation, it is urgently necessary to focus on strengthening the improvement of technical efficiency.
(3) In this study, the DEA–Malmquist index model was employed to measure the green allocation efficiency of water resources. In previous studies, some scholars used the traditional DEA model, while others adopted other efficiency evaluation methods such as the Efficiency Prioritization Model (E-P), the Fairness Prioritization Model (F-P), and the Stratified Water Supply Model (SWS) [16]. Through the comparison of these methods, we found that the DEA–Malmquist index model has significant advantages in considering changes in technical efficiency and technological progress.
Although during the rapid urbanization process, our country has continuously introduced and promoted new technologies for water resource management, such as intelligent monitoring systems, water-saving irrigation technologies, and rainwater collection and utilization systems, in an attempt to improve the efficiency of water resource utilization, the actual results have not been as expected. Firstly, in practical operations, due to the lack of coordination among various departments and links, there can be difficulties in technology integration and insufficient innovation motivation. In addition, the R&D investment in water resource management in our country is relatively low, and the conversion rate of innovation achievements is not high, making it difficult for new technologies to be effectively promoted and applied. Secondly, the water resource management system is not sound. Currently, there are problems such as multi-head management and unclear rights and responsibilities in our country’s water resource management system, resulting in a lack of unified planning and coordination in water resource allocation. In the context of rapid urbanization, the contradiction between urban expansion and water shortage has become increasingly prominent, but the existing management system is unable to adapt to this change, leading to low efficiency in water resource allocation.
4.2. Paths to Enhance the Efficiency of Green Allocation of Water Resources
4.2.1. Systematically Optimize Policies Related to Water Resources
In the rapid process of urbanization, the improvement of the efficiency of green water resource allocation requires strong policy and institutional support. From the perspective of policy and institutional framework, by systematically optimizing the water resources management framework, price regulation mechanism and legal guarantee system, it is possible to effectively solve problems such as fragmented resource allocation, inefficient utilization and weak protection. At present, building a scientific and reasonable water resources management policy system is the core task of institutional optimization. It is necessary to establish a unified water resources management institution at the national level that transcends regions and departments, break down the barriers of administrative divisions, and achieve the overall planning and dynamic allocation of water resources in river basins. On this basis, differentiated and quantifiable water resource allocation standards should be formulated. In combination with regional water demand and ecological carrying capacity, a dynamic allocation mechanism based on efficiency priority should be established. By introducing intelligent monitoring and real-time feedback systems, policy implementation can achieve a transformation from extensive control to precise regulation, ensuring that limited water resources are inclined towards high-efficiency and low-energy consumption areas.
4.2.2. Strengthen Water Resources Management and Promote Sustainable and Circular Utilization of Water Resources
First, we should strengthen the resolution of water pollution issues, adopt policy measures to restrict the discharge of industrial wastewater, utilize purification technologies to reduce the degree of water pollution, and implement a responsibility system to promote the development of local water pollution prevention and control work, so as to avoid water resource consumption and waste caused by water pollution and improve the utilization rate of water resources. Second, we should further improve the management of water resources and form a cross-regional and cross-border integration system. To uniformly allocate water resources, it is necessary to change the situation of each system working independently. We should manage and utilize water resources at the national level, prevent water competition incidents among different river systems and regions, and severely crack down on illegal discharge of sewage across regions. We should establish a national-level water resources management mechanism under the central government’s supervision and coordinated management by multiple departments, thereby achieving all-round and full-scale water resources improvement and management. Third, we should clarify the responsibility for water resources management and use the responsibility system to avoid the occurrence of departmental irresponsibility. If the rights and responsibilities are not clear, it is easy to cause chaos in water resource management, leading to mutual shirking of responsibility. Therefore, it is necessary to determine the responsibilities that each unit should bear in the process of water resource management and control, and implement them accordingly. Once any problems arise, they should be assigned to the units and individuals to ensure that the responsibilities for water resource management and control are effectively implemented. Supervision should be used to promote the optimal allocation of water resources, thereby building a sustainable water cycle model for water resource recycling and utilization.
4.2.3. Promote Technological Innovation in the Green Allocation of Water Resources
Technological innovation is the core driving force for enhancing the efficiency of green water resource allocation. Through the dual paths of optimizing the resource allocation mechanism and reducing environmental load, it provides key technological support for sustainable development. The breakthrough progress of new water treatment technologies such as membrane separation technology and the ozone oxidation treatment process has effectively increased the reuse rate of industrial wastewater and the quality standards of reclaimed water, laying a technical foundation for the construction of regional water circulation systems. These technological breakthroughs not only enhance the efficiency of water resource utilization but also directly alleviate the pressure on the water environment by reducing pollutant emissions, embodying the core essence of green allocation.
In terms of recycling technology, it is particularly important to build a full-chain technical system of “source reduction–process control–end reuse”. Through the integration of technologies such as closed-loop industrial cooling water circulation systems and building reclaimed water reuse devices, the resource utilization rate of wastewater can reach over 60%. Especially at the level of industrial parks, establishing centralized water treatment centers and a shared pipeline network system can break through the treatment capacity limitations of a single enterprise, form a regional water resource cascade utilization network, and significantly improve the overall green configuration efficiency. The application of such technologies not only reduces the intensity of fresh water consumption but also optimizes the ecological carrying capacity through the coordinated governance of pollutants, demonstrating the coordinated development of technological innovation and environmental protection.
4.2.4. Popularize Water-Saving Technologies and Enhance the Efficiency of Water Resource Utilization
Water-saving technology, as a key factor influencing water resource allocation and green development, can largely reduce the amount of water needed for people’s lives and industrial production, thereby easing the tension between supply and demand. Therefore, we need to vigorously promote water-saving technologies to replace traditional production techniques and increase water utilization efficiency, so as to solve the problems caused by uneven water resource allocation. First of all, we are vigorously promoting and applying water-saving technologies, conserving water in large-scale industrial applications, transforming high-energy-consuming production processes into energy-saving ones, and replacing high-energy-consuming machinery and equipment. This can effectively reduce the demand for water resources in industrial production and thereby alleviate the pressure on water supply. Secondly, we need to accelerate the improvement of water conservation regulations and promote the wide application and technological improvement of water conservation technologies. China can promote the popularization of water conservation laws across the country through measures such as tax labeling management of products, restricting the manufacture or sale of products that do not meet the legal water conservation standards, enhancing the supply capacity of water-saving services, and establishing water-saving model projects. This will lead to the improvement of water-saving technologies nationwide and the effective utilization of water resources.
4.2.5. Strengthen Supervision and Management to Ensure the Effective Implementation of Water Resources Management
First, formulate local water resources management plans to enable the general public to promptly understand the policies, guidelines and specific plans of the government and the state regarding water resources management, strive for the cooperation and supervision of the whole society, and ensure the effective implementation of water resources management. Second, extensive basic water situation surveys should be carried out, and a continuous and dynamic monitoring mechanism for water resource supply and consumption should be established to promptly identify and resolve water resource utilization issues, eliminate unreasonable water resource allocation problems in their infancy, and ensure the rationality and effectiveness of optimal water resource allocation. Thirdly, carry out universal publicity and education work, establish a comprehensive awareness of water conservation, set up a social public opinion supervision and management mechanism, and mobilize the strength of the whole society to jointly commit to the establishment of a sustainable development and recycling model of water resources. The improvement of the public participation mechanism is an important path to achieving the democratization of resource allocation. The government should establish diversified participation platforms, such as developing digital systems for water resource management, enabling the public to query regional water usage data in real time, vote on water-saving plans or submit optimization suggestions. At the community level, a collaborative group composed of resident representatives, environmental protection organizations and water affairs experts should be formed to jointly formulate water-saving targets and supervision rules. This participation model not only enhances the public’s recognition of resource allocation policies, but also forces the government and enterprises to improve management transparency through group supervision. It is worth noting that the design of the public supervision mechanism needs to take into account both scientificity and operability.
Author Contributions
Conceptualization, G.T. and T.Y.; methodology, T.Y.; software, T.Y.; validation, T.Y. and G.T.; formal analysis, T.Y.; investigation, T.Y.; resources, T.Y.; data curation, T.Y.; writing—original draft preparation, T.Y.; writing—review and editing, G.T. and T.Y.; visualization, T.Y.; supervision, T.Y.; project administration, G.T. and T.Y.; funding acquisition, G.T. All authors have read and agreed to the published version of the manuscript.
Funding
This research received no external funding.
Institutional Review Board Statement
Not applicable.
Informed Consent Statement
Not applicable.
Data Availability Statement
Data are contained within the article. The data presented in this study can be requested from the authors.
Conflicts of Interest
The authors declare no conflicts of interest.
References
- He, N.; Ding, R. A dual-method approach integrating dynamic QCA and LightGBM-SHAP algorithms to uncover the configuration paths and key drivers of water resource green efficiency in China. Ecol. Indic. 2025, 175, 113540. [Google Scholar] [CrossRef] [Scilit]
- Mohammed, M.; Birhanu, B.; Abegaz, F. Multi-objective optimization of water resources allocation in rift valley lakes basin (Ethiopia): Tradeoffs between efficiency and equity. Discov. Water 2025, 5, 8. [Google Scholar] [CrossRef] [Scilit]
- Ji, Y.; Zuo, Q.; Zhao, C.; Zhang, Z.; Wu, Q. Measurement and decomposition of green water resource utilization efficiency across multiple water use sectors in China: A perspective on water-saving potential. Environ. Impact Assess. Rev. 2025, 112, 107806. [Google Scholar] [CrossRef] [Scilit]
- Ortuzar, I.; Serrano, A.; Xabadia, A.; Brouwer, R. Balancing Efficiency and Inequality in a Non-Linear Multi-Regional Water Allocation Optimization Model. Environ. Resour. Econ. 2025, 88, 761–794. [Google Scholar] [CrossRef] [Scilit]
- Pal, R.; Pati, D.R.; Shrivastav, S. Corruption versus efficiency in water allocation under uncertainty: Is there a trade-off? Reg. Stud. 2024, 58, 105–119. [Google Scholar] [CrossRef] [Scilit]
- Human, M.; Chen, L.; Yuan, J. Green Water Resource Utilization Efficiency in Urban Agglomerations: Measurement, Spatiotemporal Variations and Influencing Factors. J. Resour. Ecol. 2023, 14, 1176–1191. [Google Scholar] [CrossRef] [Scilit]
- Han, Z.; Jiao, R.; Zhang, Y.; Feng, Y. Optimal Water Resource Allocation Under Policy-Driven Rigid Constraints: A Case Study of the Yellow River Great Bend. Land 2026, 15, 318. [Google Scholar] [CrossRef] [Scilit]
- Zhao, C.; Zuo, Q.; Ma, J.; Zang, C.; Wu, Q. Measurement of Green Water Resource Utilization Efficiency for Carbon Neutrality: A Multiple Water Use Sectoral Perspective Considering Carbon Emission. Water 2023, 15, 3312. [Google Scholar] [CrossRef] [Scilit]
- Gong, Z.; He, Y.; Chen, X. Evaluation of Regional Water Use Efficiency under Green and Sustainable Development Using an Improved Super Slack-Based Measure Model. Sustainability 2022, 14, 7149. [Google Scholar] [CrossRef] [Scilit]
- Heng, X. Measurement and analysis of green water resources efficiency in Jing-Jin-Ji. E3S Web Conf. 2021, 248, 02003. [Google Scholar] [CrossRef] [Scilit]
- Vedula, S.; Mujumdar, P.P. Optimal reservoir operation for irrigation of multiple crops. Water Resour. Res. 1992, 28, 1–9. [Google Scholar] [CrossRef] [Scilit]
- Kucukmehmetoglu, M.; Sen, Z.; Özger, M. Coalition possibility of riparian countries via game theory and fuzzy logic models. Water Resour. Res. 2010, 46, 65–74. [Google Scholar] [CrossRef] [Scilit]
- Müller, M.F.; Müller-ltten, M.C.; Gorelick, S.M. How Jordan and Saudi Arabia are avoiding a tragedy of the commons over shared groundwater. Water Resour. Res. 2017, 53, 5451–5468. [Google Scholar] [CrossRef] [Scilit]
- Xiang, N.; Sha, J.H.; Yan, J.J.; Xu, F. Dynamic modeling and simulation of water environment management with a focus on water recycling. Water 2019, 6, 17–31. [Google Scholar] [CrossRef] [Scilit]
- Tian, P.; Chen, S.; Yu, Y.; Wu, Y.; Wang, W. Spatiotemporal Dynamics and Attribution Analysis of Blue and Green Water Resources During 1980–2019 in the Hanjiang River Basin, China. Water 2025, 17, 1008. [Google Scholar] [CrossRef] [Scilit]
- Niu, C.; Wang, X.; Chang, J.; Wang, Y.; Guo, A.; Ye, X.; Wang, Q.; Li, Z. Integrated model for optimal scheduling and allocation of water resources considering fairness and efficiency: A case study of the Yellow River Basin. J. Hydrol. 2023, 626, 130236. [Google Scholar] [CrossRef] [Scilit]

Disclaimer/Publisher’s Note: The statements, opinions and data contained in all publications are solely those of the individual author(s) and contributor(s) and not of MDPI and/or the editor(s). MDPI and/or the editor(s) disclaim responsibility for any injury to people or property resulting from any ideas, methods, instructions or products referred to in the content. |
© 2026 by the authors. Licensee MDPI, Basel, Switzerland. This article is an open access article distributed under the terms and conditions of the Creative Commons Attribution (CC BY) license.