


Abstract
With the escalating demand for forest-derived ecological products, quantifying forest ecological product production capacity (EPC) has become essential for precise ecological governance. Addressing the methodological gaps and complexity in current assessments, this study develops a transferable Forest EPC theoretical framework integrated across four dimensions: environmental background, vegetation status, human pressure, and human investment. Using Henan Province as a case study, we established a multi-criteria evaluation model to characterize the spatial drivers and supply potential of Forest EPC. Our findings reveal that the provincial forest EPC stands at a moderate level (0.341). The spatial distribution is highly heterogeneous: the “medium” EPC grade dominates the landscape (36.69%), whereas “high-level” areas are critically scarce (3.76%). Notably, forest EPC exhibits a strong spatial gradient, with high-performance clusters in the southern and western highlands contrasting with lower values in the northern plains. The identification of significant spatial autocorrelation (Global Moran’s I = 0.71) highlights the necessity of regional collaborative management. This study provides a methodological reference that is adaptable to diverse regional contexts through the recalibration of local indicators and weights, offering a scientific benchmark for optimizing the spatial layout of ecological product supply.
1. Introduction
Ecosystems provide human society with a variety of products and services, ranging from food, timber, and fresh water to regulating services including air purification, temperature regulation, and carbon sequestration. These ecosystem products undoubtedly form the link between humans and nature and are essential to human survival and development [1]. However, the accelerating pace of global urbanization has triggered an unprecedented expansion of human settlements, particularly in China [2,3], leading to the overexploitation of natural resources and significant habitat fragmentation [4,5]. This intensive urban expansion not only exacerbates environmental degradation but also severely compromises the intrinsic supply capacity of ecosystems products. Consequently, enhancing ecosystem product production capacity (EPC) has emerged as a critical global imperative, particularly in countries with prominent forestry sectors such as China, Finland, and Canada. In these regions, the transition from traditional timber-oriented management to multifunctional forestry has necessitated comprehensive frameworks to evaluate the long-term productive capacity of forest landscapes beyond mere material yield.
The concept of ecosystem products originated in China, developing from the internationally proposed concept of ecosystem services [6]. The term first appeared in a 2010 planning document entitled National Main Functional Zone Division [7]. Ecosystem products are defined as the collective final services and material products supplied to humans through the combined actions of natural ecosystem biological production and human socio-economic activities [1,6]. Since 2012, China has vigorously promoted the construction of an ecological civilization, with the importance of EPC increasingly recognized by decision-makers and the public. In 2021, the Chinese government issued the ‘Opinions on Establishing and Improving the Mechanism for Realising the Value of Ecosystem Products’, emphasizing the need to encourage all regions to enhance their capacity for supplying ecosystem products. By focusing on the integrated output of natural and human systems, the Chinese concept of EPC provides a localized yet globally relevant perspective on the stock-flow relationship within social–ecological systems.
The scientific community has conducted extensive research on ecosystem products, predominantly focusing on their conceptual connotation [8,9], suitability for development [10], value accounting methods [11,12], and value realization models [13]. Recent assessments have increasingly focused on multi-dimensional indicator systems, integrating ecosystem services with land-use constraints to identify regional development priorities [10]. However, progress in EPC research has been slow due to the lack of consensus on the definition and classification of ecosystem products in existing research [1]. Currently, the most widely used methods of EPC assessment can be divided into two categories: physical quantity assessment methods and value quantity assessment methods. Physical quantity assessment, which measures the actual quantity of ecosystem products, (e.g., food production, water conservation and tourist numbers), have evolved from simple empirical calculations to process-based simulations. In soil and water conservation research, for instance, the integration of the Revised Universal Soil Loss Equation (RUSLE) has enabled large-scale estimation of soil retention products [14]. Similarly, hydrological assessments in water-limited Mediterranean regions have transitioned toward soil moisture balance models to accurately reflect freshwater supply capacity [15]. In the context of timber-rich temperate and boreal forests, the methodology often involves using forest inventory data and empirical models to determine the potential supply of ecosystem products [16]. More recently, the application of process-based forest models (e.g., the 4C model) has facilitated the evaluation of supply capacity under complex, distinct management modes [17]. These diverse methodological trajectories highlight that EPC is a function of regional environmental constraints and human intervention. Nevertheless, a significant limitation of physical quantity assessment involves its focus on isolated product categories, which may fail to represent aggregate capacity. Some scholars have therefore normalized the physical quantities of multiple ecosystem products and constructed a comprehensive ecosystem service index to reflect the EPC of a region [18]. The value assessment method monetarily values ecosystem products by combining a pricing method with physical quantities to determine their monetary value. Specifically, this includes the equivalent factor method [19] and the market value method [20]. In fact, both physical and value quantity assessment methods measure ecosystem products as flows of ecosystem services.
Despite these advancements, several critical gaps remain in the current theoretical framework of forest EPC. Existing assessments frequently conflate ecosystem service “flows” with “capacity”, failing to distinguish between transient supply and long-term ecological stability. Conversely, the role of human–nature interactions is often oversimplified. In addition, the assessment process relies heavily on complex, specialized process models, limiting the widespread use of such methods in grassroots management practices [21]. Natural ecosystems are the main carriers of ecosystem products and are also an important factor in the formation of these products [1]. To address this, our research conceptualizes EPC as a structural attribute of Social-Ecological Systems (SES). By shifting from ‘flow-based’ metrics to a ‘capacity’ perspective, we prioritize ‘slow variables’, such as forest age, soil organic carbon and aboveground biomass, that characterize long-term ecological stability. This ensures that the evaluated capacity represents a resilient supply potential, rather than a temporary output influenced by short-term climatic. Therefore, establishing an assessment index system based on the capacity characteristics of natural ecosystems to quantify EPC is a new and feasible approach [22]. Nevertheless, research in this area is currently limited.
As a critical region of the middle and lower reaches of the Yellow River basin, Henan Province faces intensifying ecological pressures driven by rapid urbanization and high population density. Its forest ecosystems are indispensable for maintaining soil stability and water regulation [13,14,15]; however, the supply of these essential services currently fails to meet the escalating demands of both urban and rural communities [23]. Therefore, understanding the spatial distribution patterns of forest EPC in Henan is vital for regional sustainable development. Existing forest EPC research has primarily focused on single climatic zones—such as subtropical forests [1] or temperate forests [24]. However, studies on forest EPC in transitional zones between temperate and subtropical regions, like Henan, remain insufficient. To address this gap, this study utilizes Henan Province as a representative study area to systematically evaluate forest EPC. The study has three key objectives: (1) To define the concept of EPC and establish a general theoretical framework for EPC assessment; (2) to establish an evaluation index system and measurement model for forest EPC; (3) to reveal the spatial distribution characteristics of forest EPC and verify the robustness of the results. The study aims to propose a new approach to EPC assessment that can inform subsequent ecological protection planning and the realization of ecosystem product value in other ecosystems.
2. Conceptual Framework for Ecological Product Production Capacity
2.1. Conception of EPC
This study is aligned with the concept of ecosystem final services from the United Nations System of Environmental–Economic Accounting (SEEA EA) ecosystem accounting framework [25]. In the context of international research, the provision capacity of ecosystem services corresponds closely to the EPC construct [26]. Within the SEEA EA framework, ecosystem service provision capacity is defined as the ability of ecosystems to produce ecosystem services under current ecological conditions, management, and utilization [27]. The present study is founded upon extant research and defines EPC as the comprehensive capacity of natural ecosystems and human socio-economic systems to sustainably generate ecological products within a specific timeframe and spatial scope. The objective of this analysis is to underscore the state characteristics of the production entity (natural ecosystems) within the context of production activities [28]. Unlike realized ecosystem service flows, EPC emphasizes potentiality, representing the stable reserve and functional stock of services maintained under current ecological baselines and management regimes.
2.2. Assessment Framework
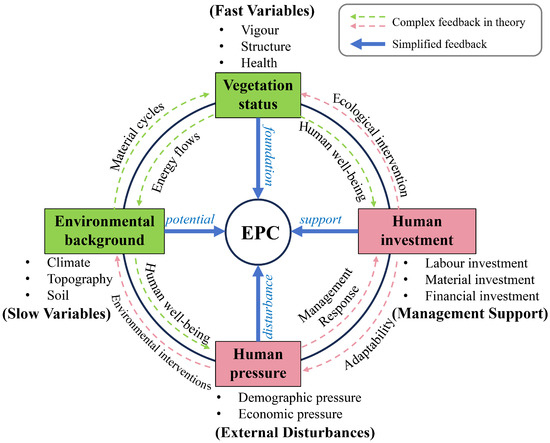
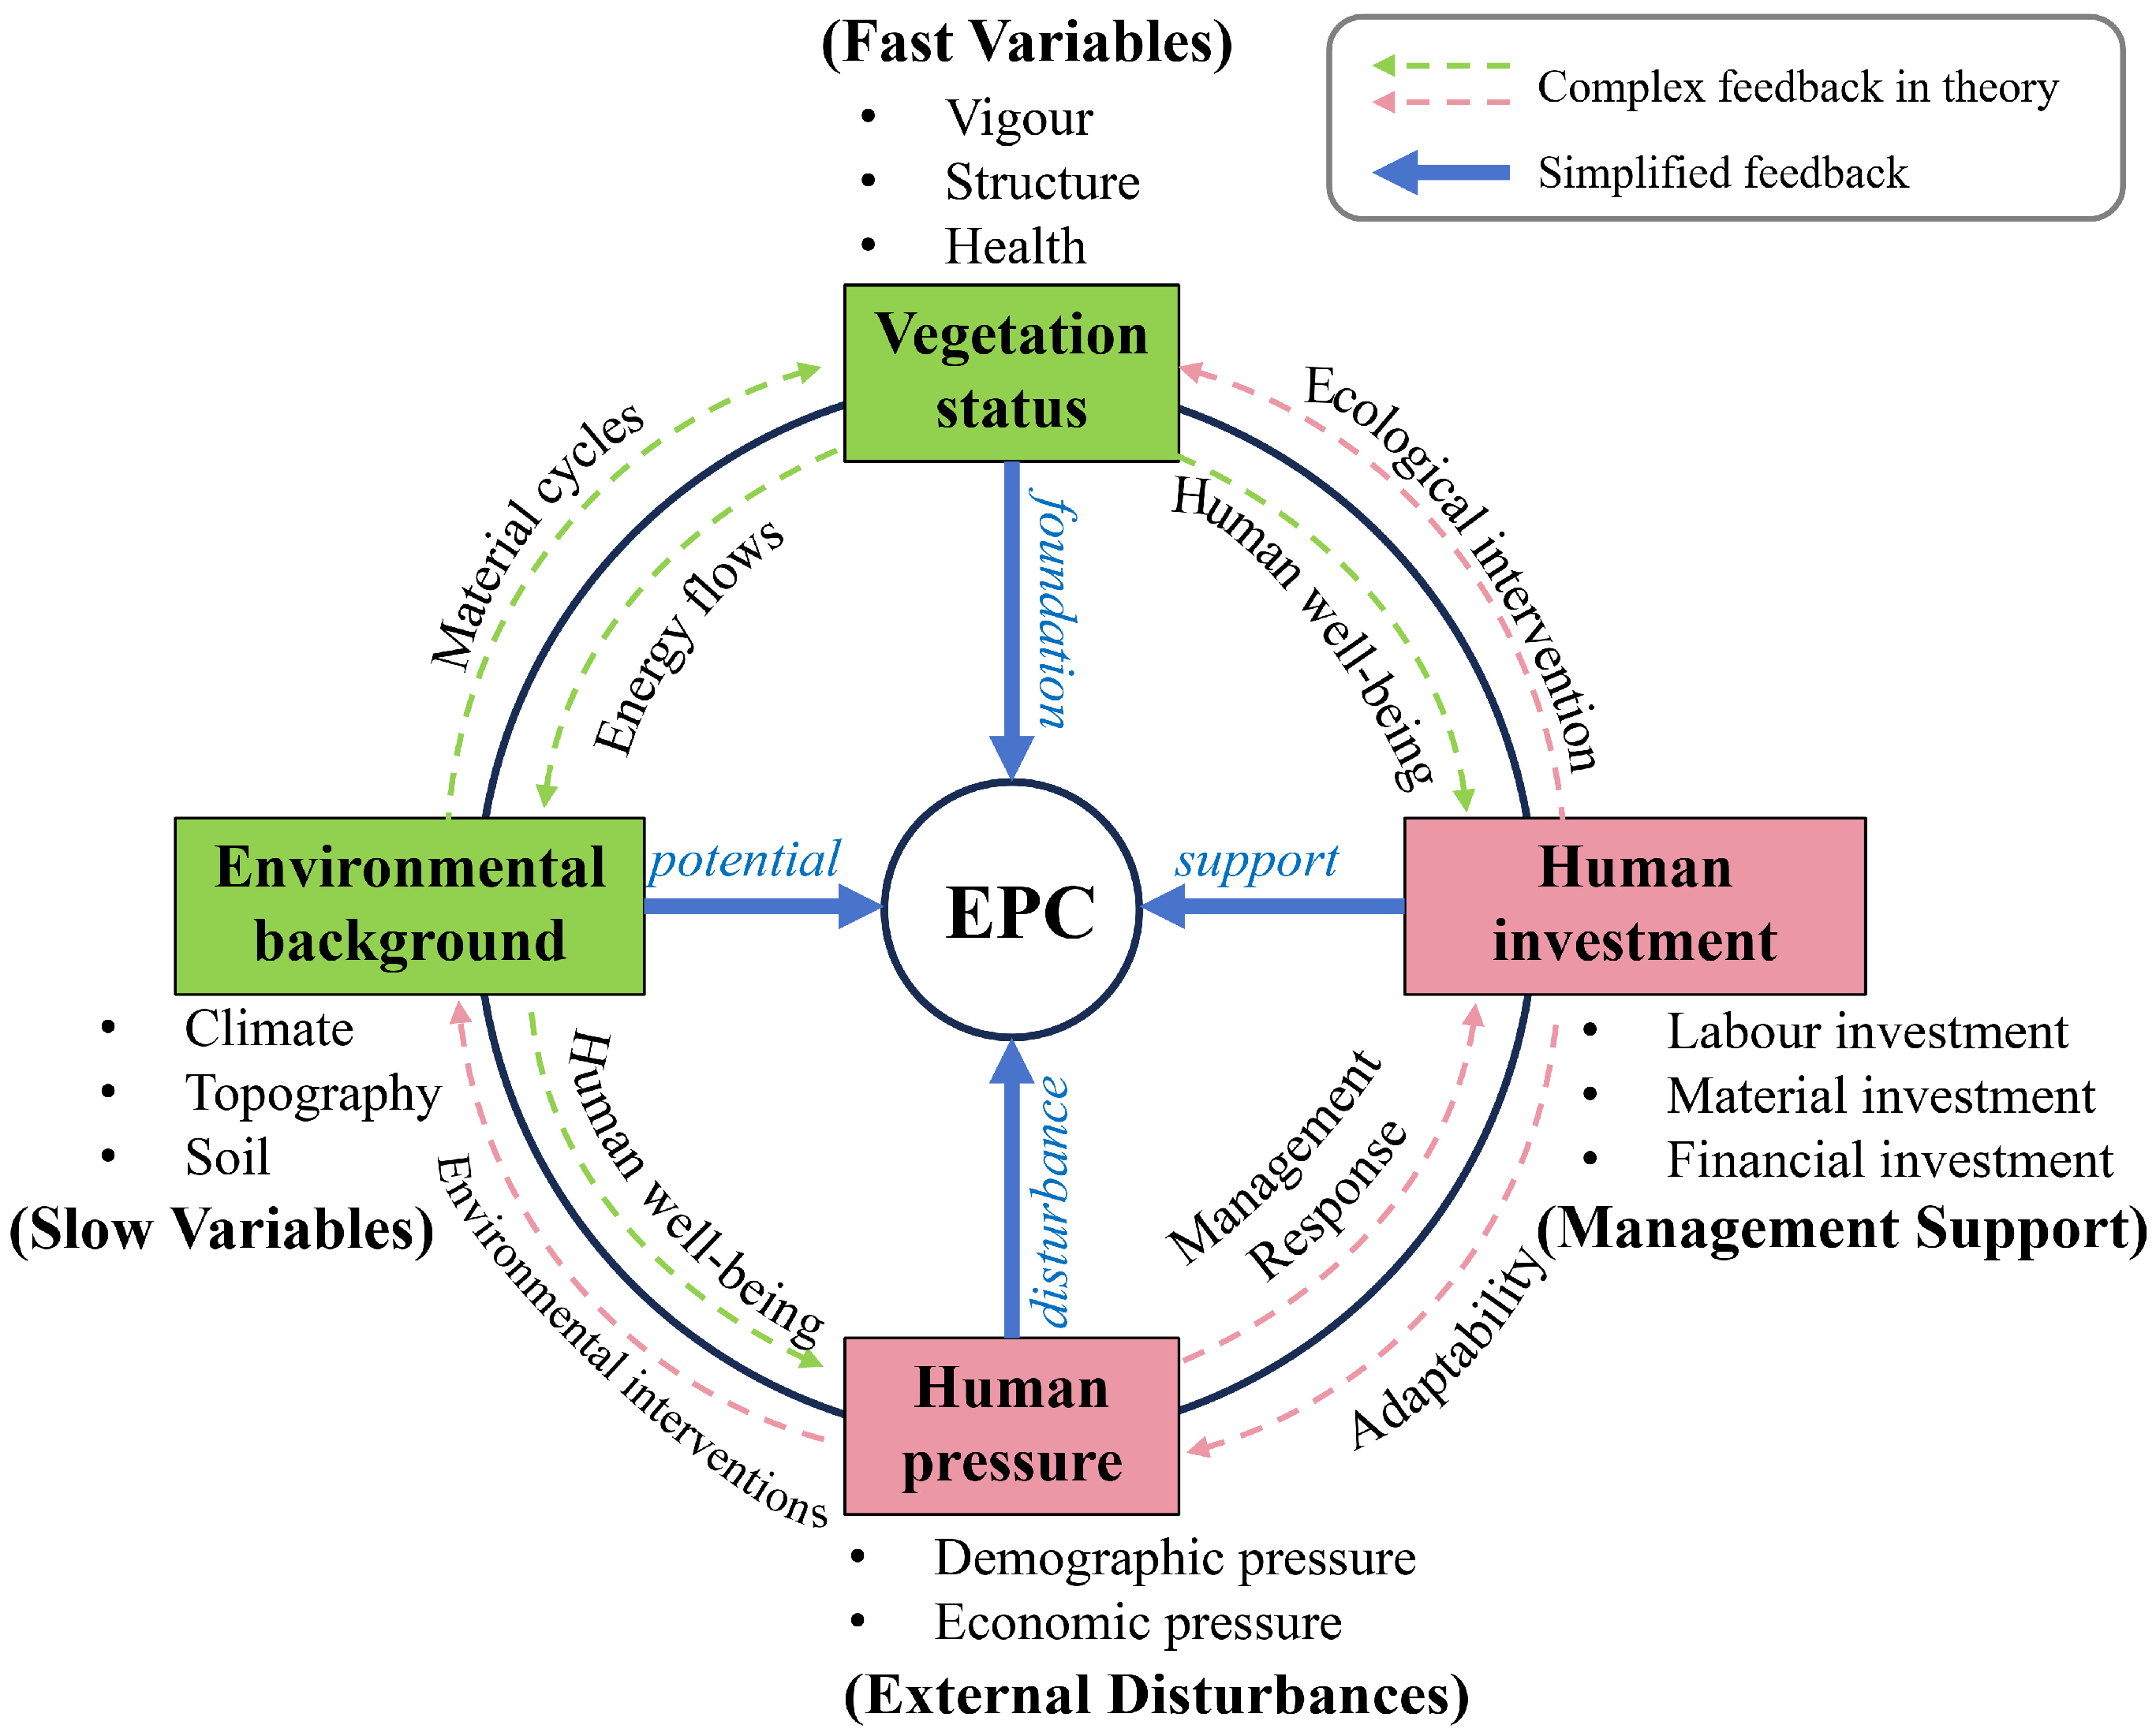
The formation of EPC is fundamentally a process of a Social–Ecological System (SES), the central premise of which is that human and natural systems are intrinsically coupled through complex feedback loops and reciprocal interactions [29]. Consequently, EPC can be evaluated from two perspectives: natural production capacity and human intervention capacity. To operationalize this evaluation, this study constructs a four-dimensional framework comprising environmental background, vegetation status, human pressure, and human investment (Figure 1).
Figure 1.
Conceptual framework of the EPC.
Natural production capacity forms the biophysical foundation for the formation of EPC. Specifically, ecosystems with particular components and structures form ecological processes such as energy flow, material cycling, and information transmission through physical, chemical, and biological interactions. The primary and secondary production resulting from these processes constitute the physiological foundation for supplying various ecological products [9]. It is widely accepted that natural productive capacity is contingent on environmental background characteristics and vegetation status [30]. It is evident that environmental background characteristics, including temperature, precipitation, and slope, exert a direct influence on biological growth and development processes. These represent long-term ‘slow variables’ that dictate the composition, distribution, and productivity of ecosystems [31]. Distinct environmental conditions give rise to discrete ecosystems, and to a certain extent, environmental background characteristics determine the upper limit of natural productivity. Vegetation status is widely regarded as a comprehensive indicator of ecological shifts, offering an effective reflection of ecosystem changes. Vegetation composition, structure, and health status are typically used to characterize vegetation status [32]. Generally, under comparable environmental background, the superiority of vegetation status is directly correlated with the capacity to sustainably provide ecosystem products to humans.
In the Anthropocene era, human society and the natural ecosystem are interdependent, mutually influential, and interact with each other [33]. In essence, the natural ecosystem has become a natural–human complex [34], thereby forming the human intervention capacity of EPC. Human intervention exerts a profound influence on the formation of EPC by modifying one or more ecological processes, thereby functioning as an indirect driving factor. Specifically, human intervention capacity can be subdivided into human pressure and human investment. The concept of human pressure is defined by socio-economic activities and human behavior that result in adverse environmental impacts. For instance, the exhaustion of natural resources and the uncontrolled discharge of waste into the natural environment. Pressure indicators can effectively determine the causal relationship between a natural ecosystem being in a poor state and serve as an important supplementary indicator for evaluating EPC [35,36]. Moreover, guided by demand, humans also purposefully and consciously implement measures to protect and restore the ecological environment and natural resources through investments in capital, human resources, facilities, policies, and other areas [37]. They systematically manage and intervene in processes such as land cover change and biogeochemical cycles to improve the quantity and quality of natural resources, thereby forming positive interventions with beneficial effects.
While the conceptual framework (Figure 1) illustrates the dynamic feedbacks and ecological interventions inherent in an SES, this study adopts a weighted linear aggregation model for mathematical assessment. This simplified approach ensures model parsimony and management interpretability, treating each dimension as a component essential for characterizing the overall EPC at a regional scale.
3. Materials and Methods
3.1. Study Area
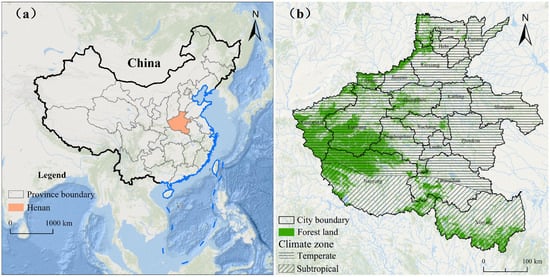
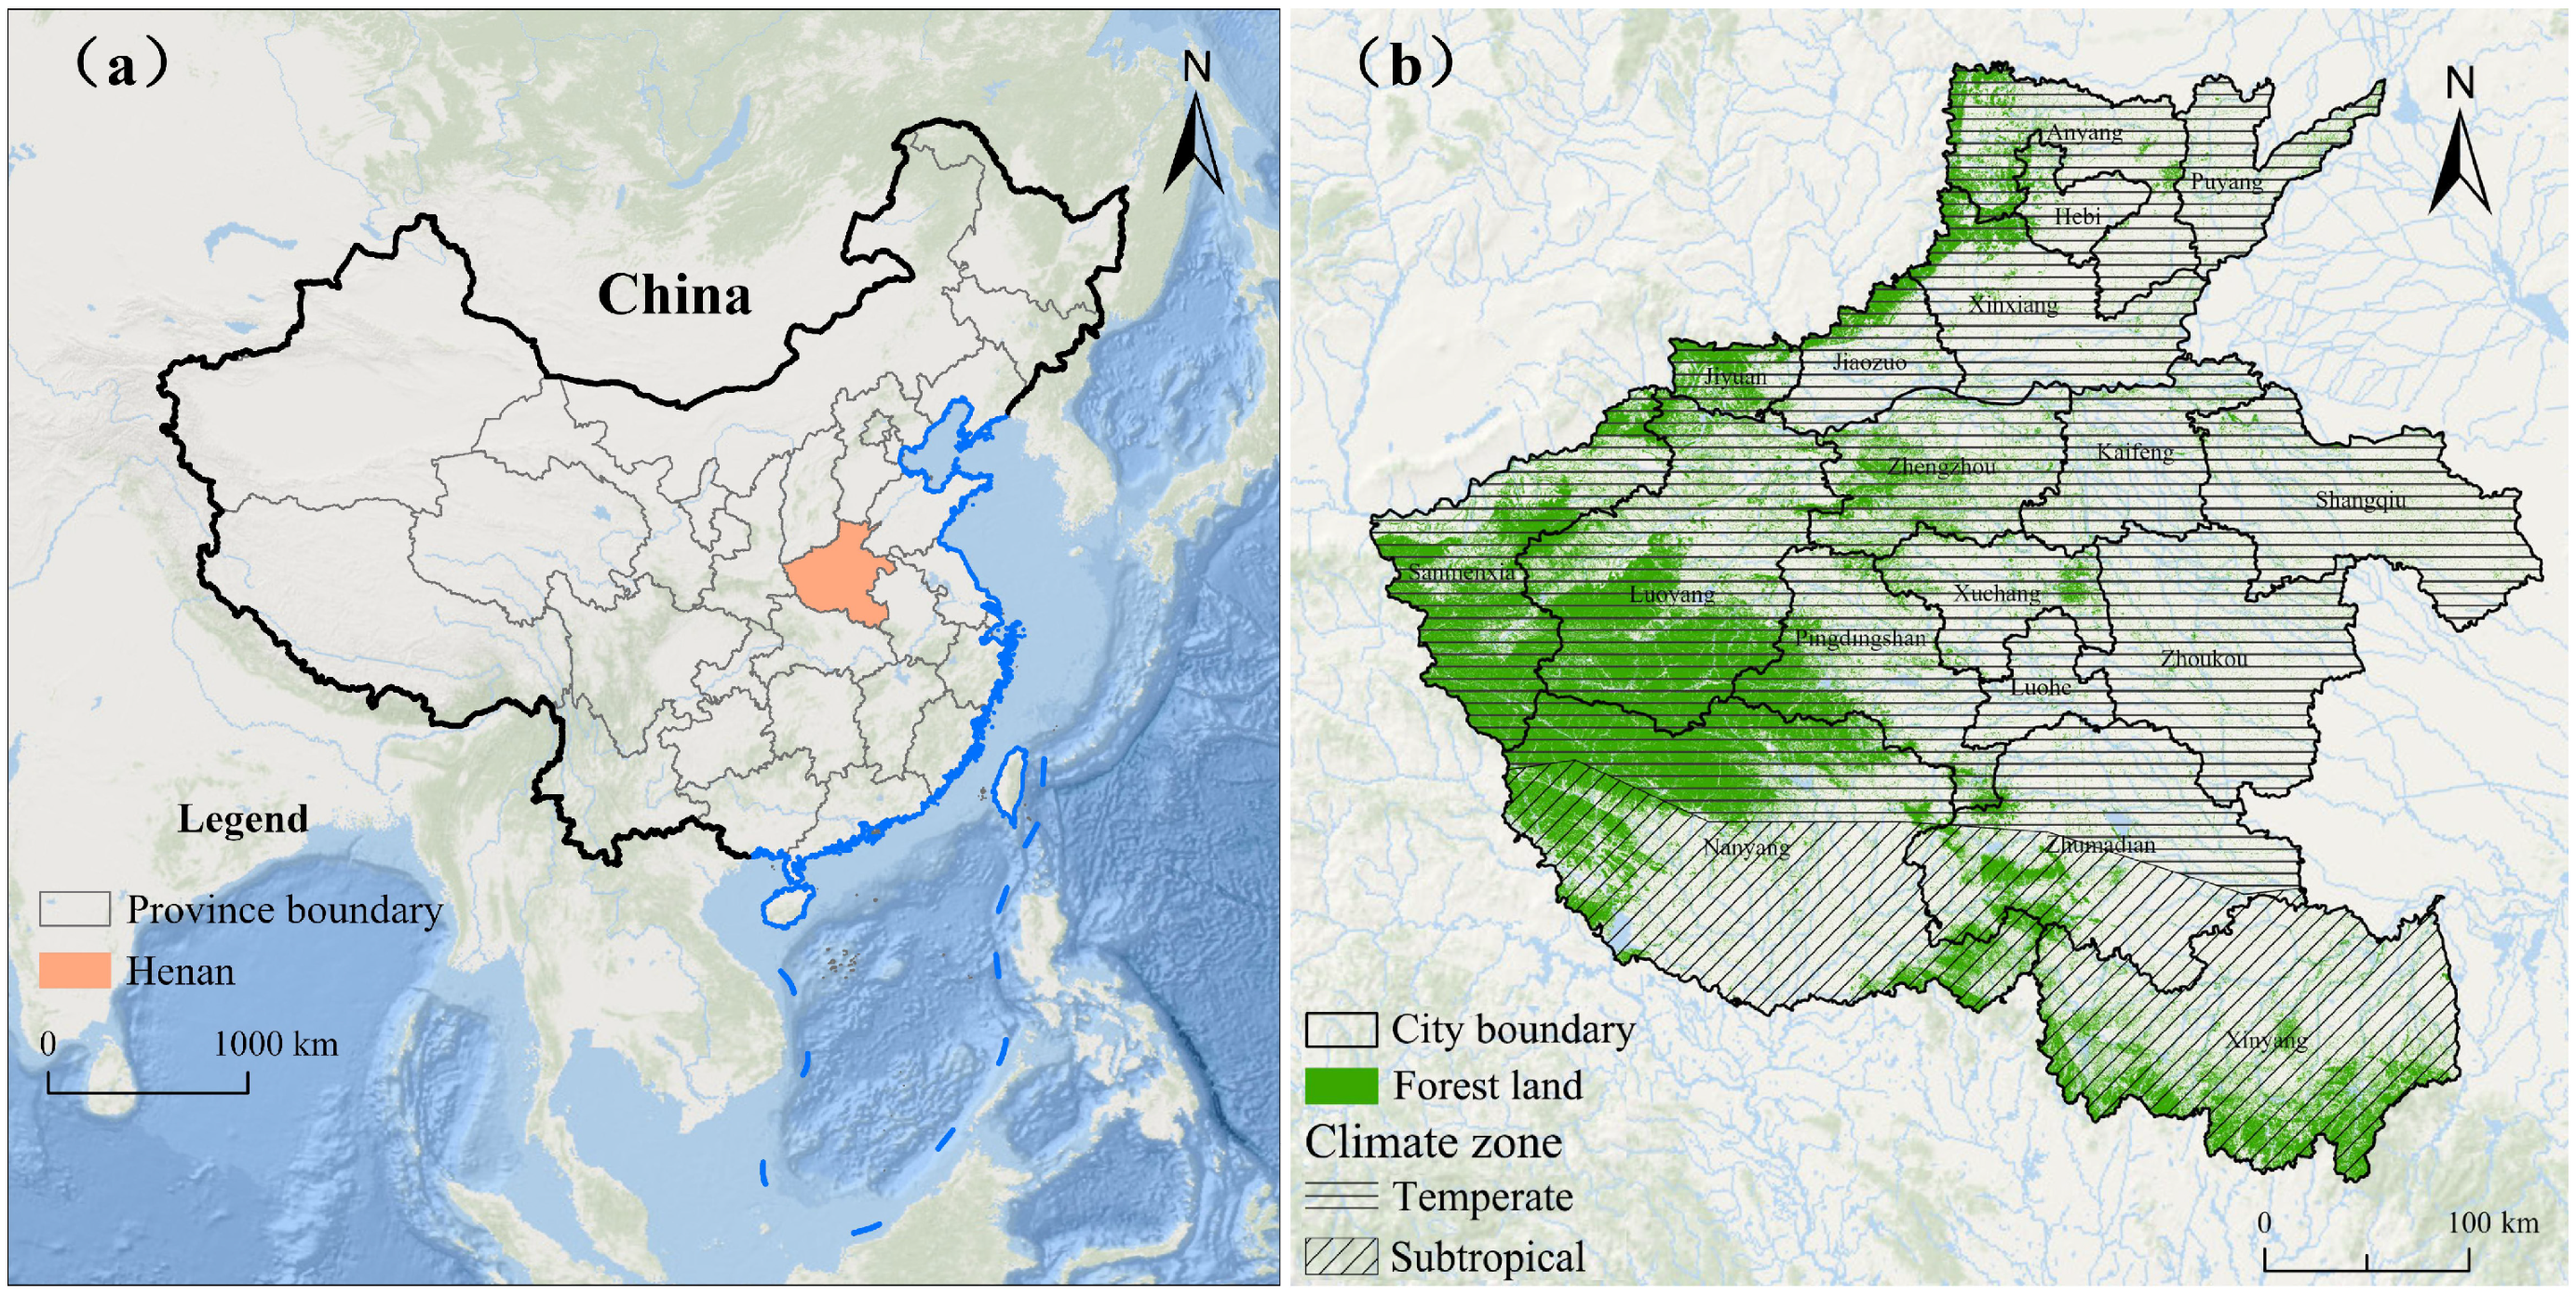
Henan Province (110°21′ to 116°39′ E, 31°23′ to 36°22′ N) is located in the central part of China’s North China Plain (Figure 2), with a total land area of approximately 167,000 km2. The average annual temperature is between 12 °C and 16 °C, and the annual precipitation is between 500 mm and 900 mm. In 2023, Henan Province’s forest area reached 42,999 km2, with a forest coverage rate of 25.53% and a timber stock volume of 215 million cubic meters. Forests are primarily distributed across the Taihang Mountains, Funiu Mountains, Tongbai Mountains, and Dabie Mountains. These regions provide ecological services such as water conservation, carbon sequestration, and soil and water conservation [38]. The central and eastern regions are characterized by alluvial plains, which are considered to be the primary grain production areas in China. Henan was selected as a representative study area for three critical reasons. First, it is a bioclimatic transition zone between the warm temperate and subtropical regions; while previous studies often focus on single-climate zones [39], research at the provincial scale in this transition belt remains a significant gap. Second, as a core region in the middle and lower reaches of the Yellow River, Henan forest serves as a vital ecological barrier for soil and water conservation [40], playing a crucial role in mitigating erosion from the Loess Plateau. Third, the region experiences intense anthropogenic pressure due to its dense population and agricultural history [41]. From 2000 to 2025, extensive afforestation and restoration projects have been implemented here [42], making it an ideal natural laboratory to explore the interplay between human activities and forest EPC.
Figure 2.
Location of the study area. (a) The location of Henan Province. (b) Distribution of forests in Henan Province.
3.2. Data Sources and Processing
The forest data (30 m), population data (1 km) and terrestrial ecosystem service value (1 km) in China utilized in this study were obtained from the Chinese Academy of Sciences Resource and Environmental Science Data Center (https://www.resdc.cn/Default.aspx, accessed on 3 October 2024). The 1 km climate, 90 m digital elevation model (DEM) data, and 250 m vegetation cover were sourced from the National Tibetan Plateau Data Center (https://data.tpdc.ac.cn/, accessed on 6 October 2024). The 1 km soil data were derived from the China High Resolution National Soil Information Grid Basic Attribute Dataset (https://soil.geodata.cn/ztsj.html, accessed on 6 October 2024). The 500 m of NPP and mixed forest distribution data were acquired from the USGS MOD173AH and MCD12Q1. Natural forest distribution maps were obtained from the National Platform for Intelligent Management of Forest and Grassland Resources (http://szlc.stgz.org.cn/lczyt/gjlczyt_mh/, accessed on 6 October 2024); forest stock was replaced by 100 m aboveground biomass of forests, which was obtained from the ESA Biomass Climate Change Initiative (https://climate.esa.int/en/projects/biomass/, accessed on 6 October 2024); forest age (30m) was obtained from previous research [43]; and the degree of pest and disease was replaced by the 4 km vegetation health index, which was downloaded from the NOAA Center for Satellite Applications and Research (https://www.star.nesdis.noaa.gov/star/index.php, accessed on 6 October 2024). Previous studies have shown that remote sensing can monitor pest and disease losses at the regional scale [44]. Forest fire point data were obtained from the Fire Information for Resource Management system (FIRMS) database (https://firms.modaps.eosdis.nasa.gov/map/, accessed on 6 October 2024). Fire points within the area of interest from 2000 to 2020 were extracted and analyzed by point kernel density to generate kernel density values as forest fire disturbance intensity. Protected area extent data were obtained from the China Nature Reserve Specimen Resource Sharing Platform (https://www.nsii.org.cn/2017/, accessed on 6 October 2024). Deforestation data were obtained from previous research [45]. The researchers used provincial timber harvesting statistics, tree cover loss (TCL) data sets, and satellite vegetation indices. Based on the detection of changes in multi-temporal vegetation indices, they provided 30 m spatial information on deforestation.
The analysis was facilitated through the uniform resampling of data of differing spatial resolutions to a resolution of 30 m. The raster data of the forest were converted into a vector format and then fused using ArcGIS 10.8, which was used as the basic evaluation unit of the EPC. This process resulted in the generation of a total of 1,766,391 map patches. The Mean Aggregation method was applied via the Zonal Statistics tool to extract the attribute values for each patch.
3.3. Research Method
3.3.1. EPC Assessment Process
Construction of the Indicator System
Research evidence has demonstrated the multifunctional nature of a healthy, complete and stable forest ecosystem [46], thereby underlining its ability to ensure the long-term capacity of the forest to provide a diverse array of ecological products [47]. Consequently, drawing upon the theoretical framework delineated in the preceding section and guided by extant literature, this study principally identifies relevant indicators that influence the health, integrity and stability of forest ecosystems. Concurrently, certain indicators were excluded on the basis of a comprehensive consideration of the principles of management needs, representativeness of indicators, operability and data accessibility, and the evaluation indicator system was systematically established (Table 1).
Table 1.
Indicator system for evaluating forest EPC.
As demonstrated in Table 1, the environmental background elements are primarily reflected in three aspects: climatic factors, topography and soil [48]. Climatic factors, specifically temperature and precipitation, fundamentally govern forest growth processes and energy conversion [49]. Topographical conditions modulate vegetation development by mediating solar radiation, temperature, and moisture distribution patterns. Soil provides the necessary support for the successful establishment of plants and is the primary factor in maintaining soil fertility, carbon sequestration, and the formation of other ecosystem products. Consequently, soil layer thickness and organic carbon content were incorporated as key indicators of edaphic quality [50]. Consequently, soil layer thickness and organic carbon content were incorporated as key indicators of edaphic quality [51]. Vigor reflects the metabolic capacity of the forest ecosystem; thus, forest stock volume and net primary productivity (NPP) were utilized as proxies for this functional vitality. Structural integrity, which ensures system stability and sustainability, is operationalized through metrics including canopy cover, community composition, forest origin, age, and tree species structure [51]. Furthermore, the ‘health’ dimension quantifies the degree to which anthropogenic or natural disturbances, such as fire, pests and diseases, may cause functional degradation [52]. Accordingly, the intensity of forest fires and the prevalence of pests and diseases were selected to encapsulate these disturbance dynamics [53].
Population and economic pressures are established metrics for quantifying anthropogenic influence on ecosystems. As a previous study [54] had observed, an increase in demand for forest resources is to be expected as a result of population and economic development, given certain total forest resources. These effects on forest ecosystems are complex, wide-ranging and multi-dimensional in nature and negative. In alignment with previous scholarship [55], population density and forest harvesting intensity were selected to serve as proxies. Regarding human investment, while inputs are traditionally categorized into labor, material, financial, and technical domains, the strategic shift in China’s forestry policy toward ‘ecological civilization’ has prioritized systemic conservation efforts. Consequently, the degree of forest protection, as reflected in the intensity of management and restoration policies, was incorporated as a primary indicator [56]. Here, higher values denote greater institutional support for forest functions.
Indicator Selection and Normalization
Potential information redundancy and interconnections among the selected indicators may compromise the reliability of the evaluation results. Pearson’s correlation coefficient was utilized to analyze the covariance between the 16 potential indicators, with a correlation coefficient |R| > 0.7 (p < 0.05) serving as the criterion for excluding highly linearly correlated indicators [57]. To ensure comparability and enhance result robustness, all indicator data were normalized prior to the evaluation process.
For positive indicators, normalization is performed as follows:
For negative indicators, normalization is performed as follows:
where and are the values of the indicator before and after normalization, respectively; and are the minimum and maximum values of , respectively.
Calculation of Combined Weights
Recognizing the potential for human subjectivity or the inherent characteristics of the data to influence the calculation of weights through a singular method, this study proposes an integration of subjective and objective approaches for the calculation of weights [58]. The subjective weights were calculated using the hierarchical analysis method (AHP) [59], and six scholars or technical officials from frontline ecology, forestry, and management fields were invited to score the weights. These experts provided pairwise comparison scores based on their extensive field experience and deep understanding of Henan’s forest conditions. The arithmetic mean of the expert judgment matrices was utilized to construct the final comparison matrix. To ensure the logical rigor of the subjective assessment, a consistency analysis was performed on both individual and aggregated judgment matrices. The Consistency Ratio (CR) for all matrices was verified to be less than 0.1.
The objective weight calculation method employs the Entropy weight method (Entropy) [60], which is predicated on the principle of information entropy. This method calculates the entropy value of each index as the weight. The combined weight is the average of the weights of the two methods, which effectively balances the decision-makers’ expertise with the intrinsic information density of the data [61]. The calculation expression is as follows:
where is the combined weight of indicator i, is the weight calculated by hierarchical analysis method, and is the weight calculated by entropy weight method.
Multi-Criteria Assessment to Calculate EPC
The score of EPC on each forest evaluation unit is calculated by comprehensive weighted summation with the following expression:
where is the ecological capacity of forest in unit ; is the value of indicator in unit ; is the weight of indicator ; is the number of indicators, which is 12 here.
3.3.2. Spatial Autocorrelation Analysis
Global and local spatial autocorrelation analyses were introduced to explore the spatial dependence between the of forest EPC patches and the surrounding forest.
- (1)
- Global Moran’s I
Global spatial autocorrelation can be considered as an indicator of the strength of spatial correlation of the region as a whole. The most commonly employed index is Global Moran’s I [62], which takes a value between −1 and 1; with larger absolute values representing stronger correlation. Negative values are indicative of negative correlation, signifying a pattern of spatial dispersion; positive values denote positive correlation and spatial agglomeration; and 0 represents a random spatial distribution. The expression is as follows [63]:
where is the number of forest patches, and are the EPC values of neighboring patches and , and is the average value of the forest EPC; is the value of spatial weight matrix, with = 1 if patches and are neighbouring, and 0 otherwise; and is the sum of all the elements of the spatial weight matrix.
- (2)
- Local Moran’s I
Local spatial autocorrelation analysis reveals spatial differences in correlations from a local perspective based on a global analysis, usually using the LISA statistic [64]. The expression is as follows [65]:
where, based on the LISA statistic, the spatial characteristics can be classified into four types: high–high clustering (H-H), low–low clustering (L-L), high–low clustering (H-L) and low–high clustering (L-H).
3.3.3. Validation Analysis
Validating forest EPC is inherently complex as it represents the potential capacity of an ecosystem, whereas empirical records typically measure actual service flows. Ideally, this index would be verified against long-term, plot-based forest inventory data. However, the extreme logistical costs and labor intensity required for standardized primary observations across the entire province render such in situ validation currently unfeasible. As a pragmatic alternative, drawing on the work of Fang et al. [66], we utilized the 2020 Chinese Terrestrial Ecosystem Service Value dataset for spatial correlation analysis. This approach is predicated on the logic that high forest EPC is the fundamental structural precursor to high ecosystem service output (flow) [16]. By randomly generating sample points to extract both EPC and ESV values, we calculated the Pearson correlation coefficient to evaluate the spatial consistency between the model’s predicted potential and the realized service values.
The existing literature has indicated that model-based approaches, despite their cumbersome procedures, have the ability to calculate ecological product supply capacity with a higher degree of accuracy [20,67,68]. In order to verify the accuracy of the assessment results in this study, we chose to use the dataset of the value of terrestrial ecosystem services in China in 2020 as a reference, inspired by Fang et al.’s study [66]. The dataset was utilized to calculate the total value of four major categories of ecosystem services, including provisioning services, regulating services, supporting services and cultural services [69]. Specifically, we randomly generate several sample points, extract the corresponding EPC and total ecosystem service value, and calculate the Pearson correlation coefficient.
4. Results and Analysis
4.1. Indicator Weights
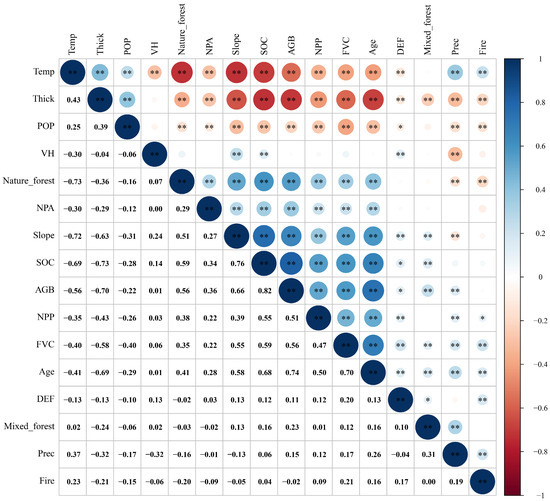
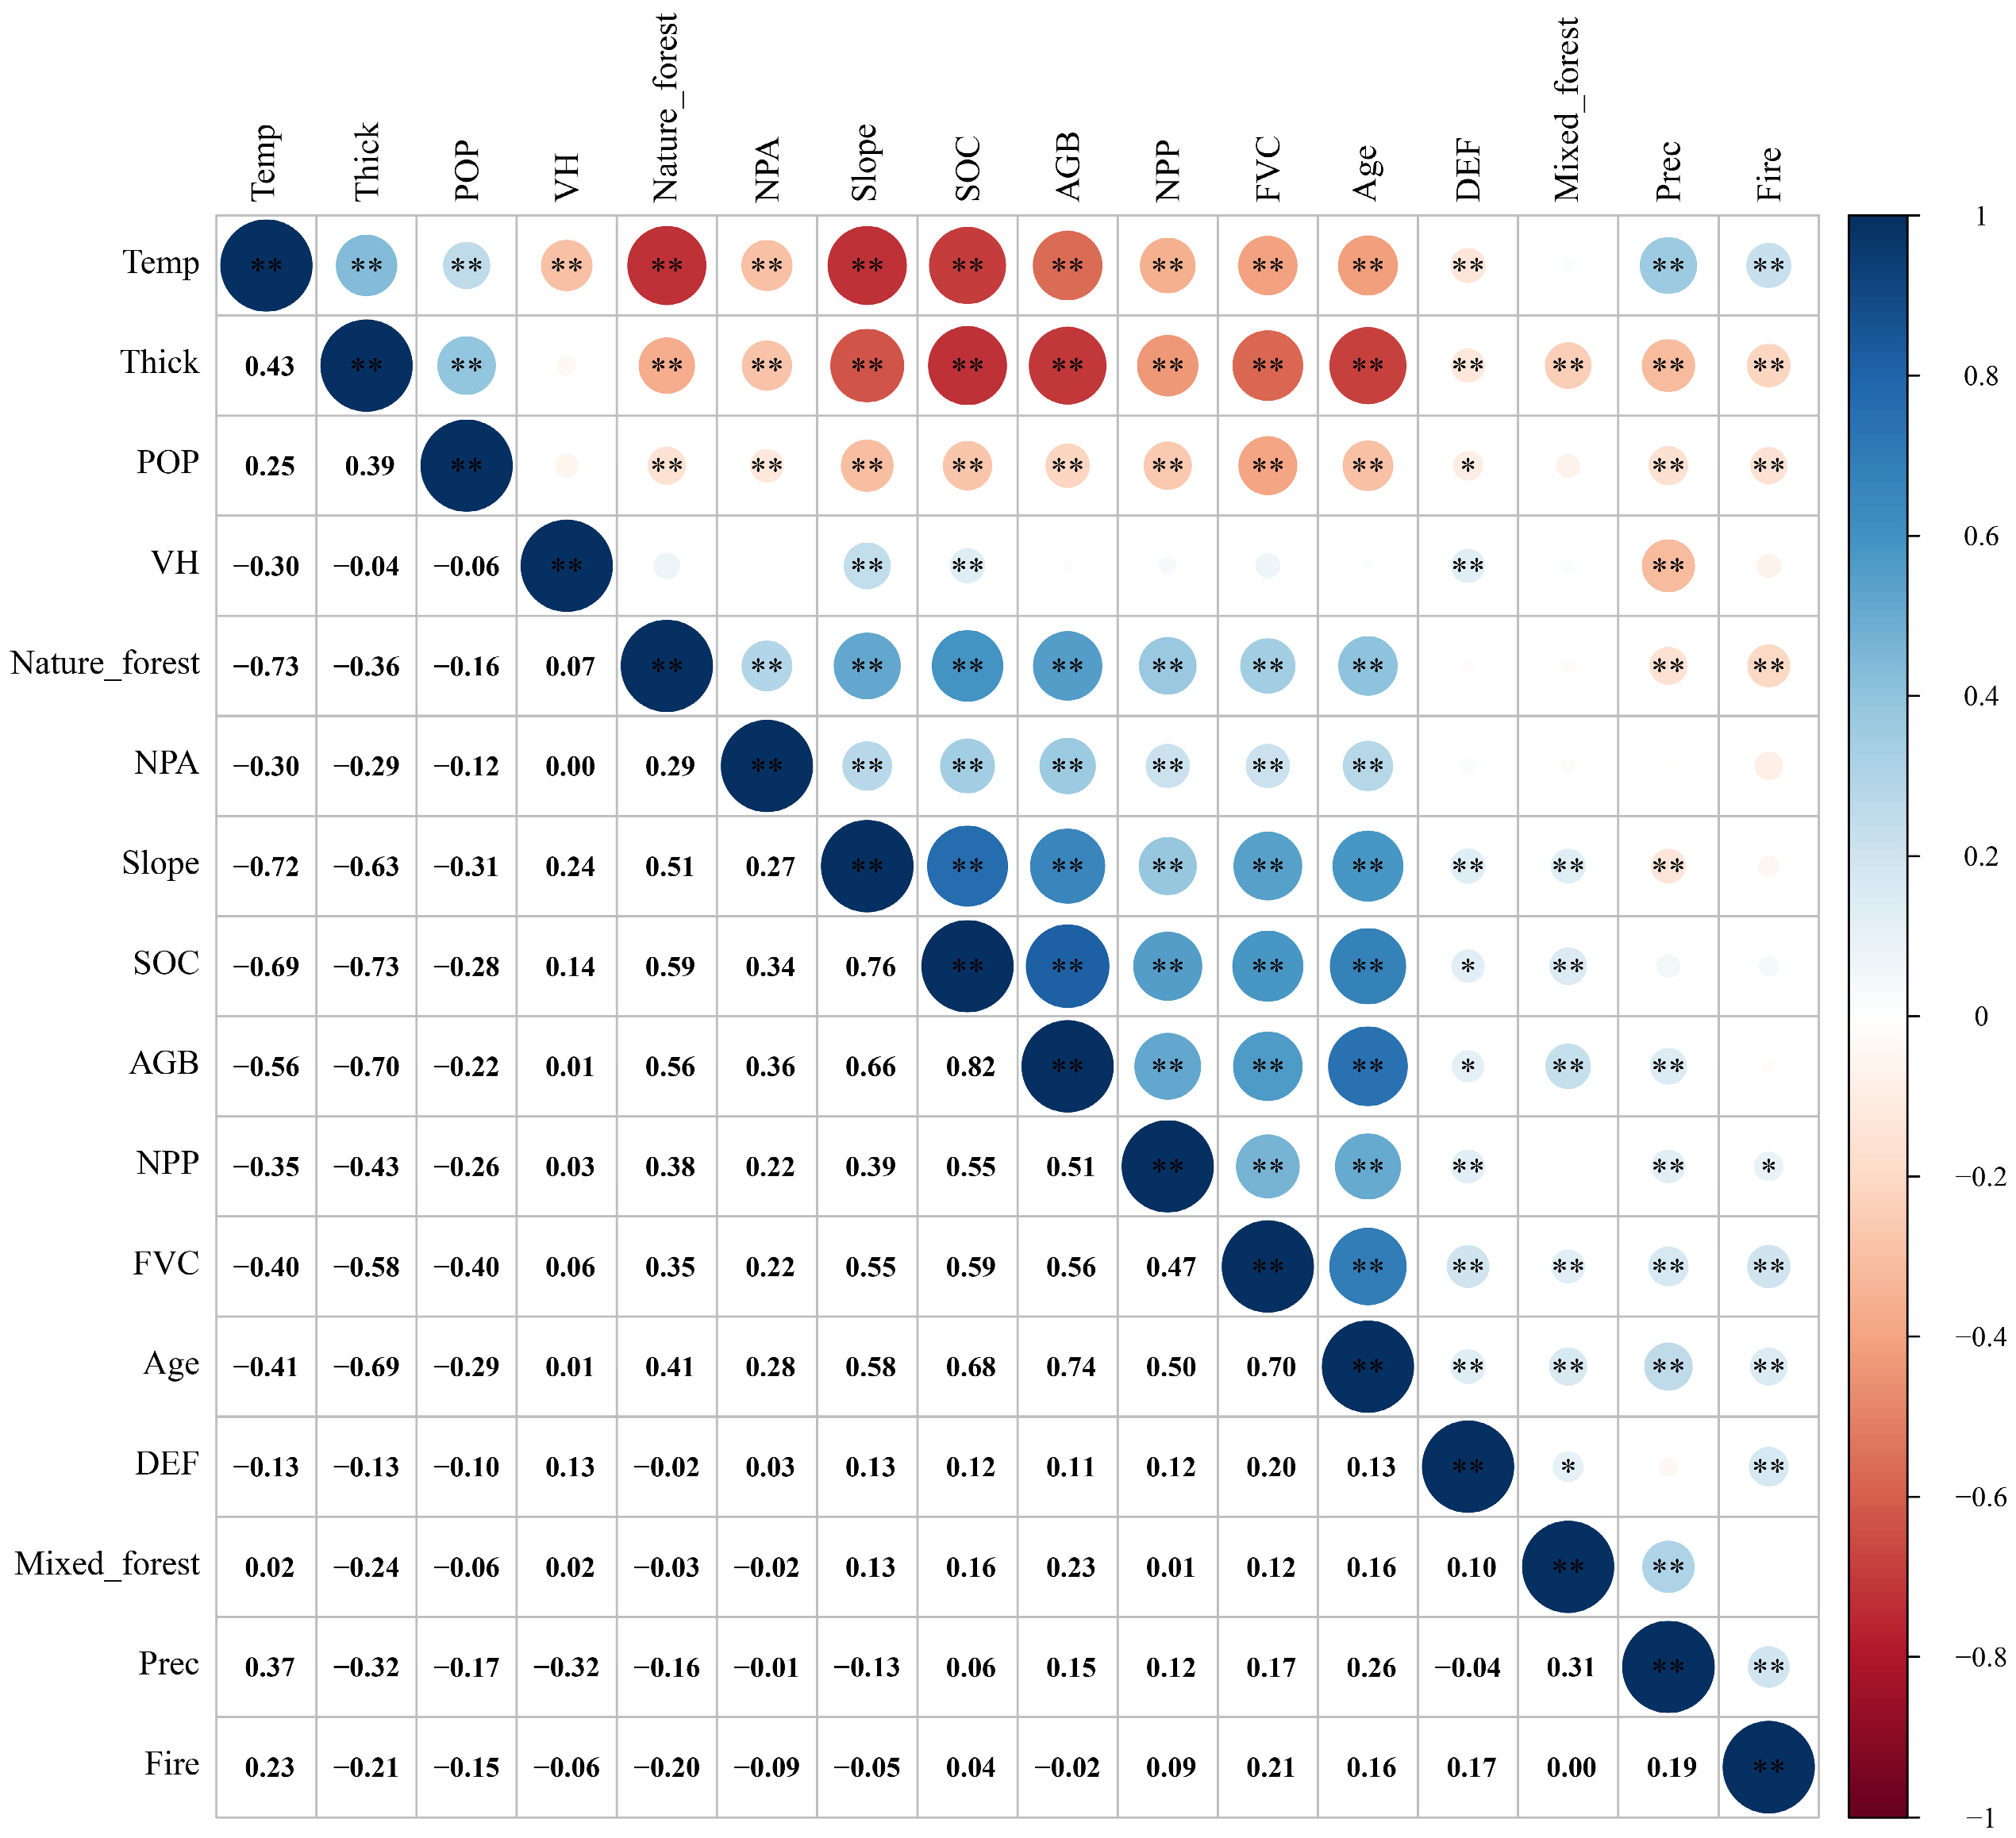
The results of the Pearson correlation analysis (Figure 3) demonstrated that five pairs of variables exhibited absolute values of correlation coefficients greater than 0.7. These pairs comprised Nature_forest-Temp (−0.73), Slope-Temp (−0.72), Slope-SOC (0.76), Age-AGB (0.82), and Thick-SOC (−0.73). In order to eliminate multicollinearity in the evaluation index system, priority is given to the indexes with high measurement accuracy and high correlation with forest ecology as evidenced by extant literature [29]. Consequently, four redundant variables (i.e., Thick, Slope, AGB and Temp) are eliminated. While temperature is recognized as the fundamental driving force of forest productivity, the temperature index in this study is derived via site interpolation, resulting in a low resolution. Furthermore, the spatial variation in temperature in Henan Province is closely related to terrain gradient (slope) and soil properties (SOC). The retention of SOC and Nature_forest is pivotal, given their integration of climatic history and site quality. Finally, the entropy weight method and AHP method were integrated to calculate the combined weights of the final 12 indicators (Table 2). The top four highest combined weights of Age, FVC, SOC and VH reflect the fact that the vegetation condition of forest is crucial for maintaining the forest EPC.
Figure 3.
Correlation analysis of potential indicators. Note: * and ** indicate significant differences at the 0.05 and 0.01 levels, respectively.
Table 2.
Factor weights calculated by different methods.
4.2. Spatial Distribution of Ecological Product Production Capacity of Forest
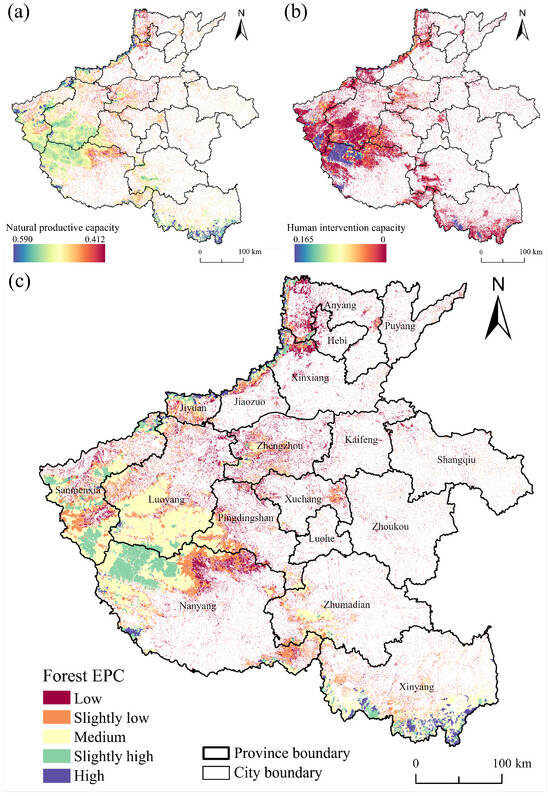
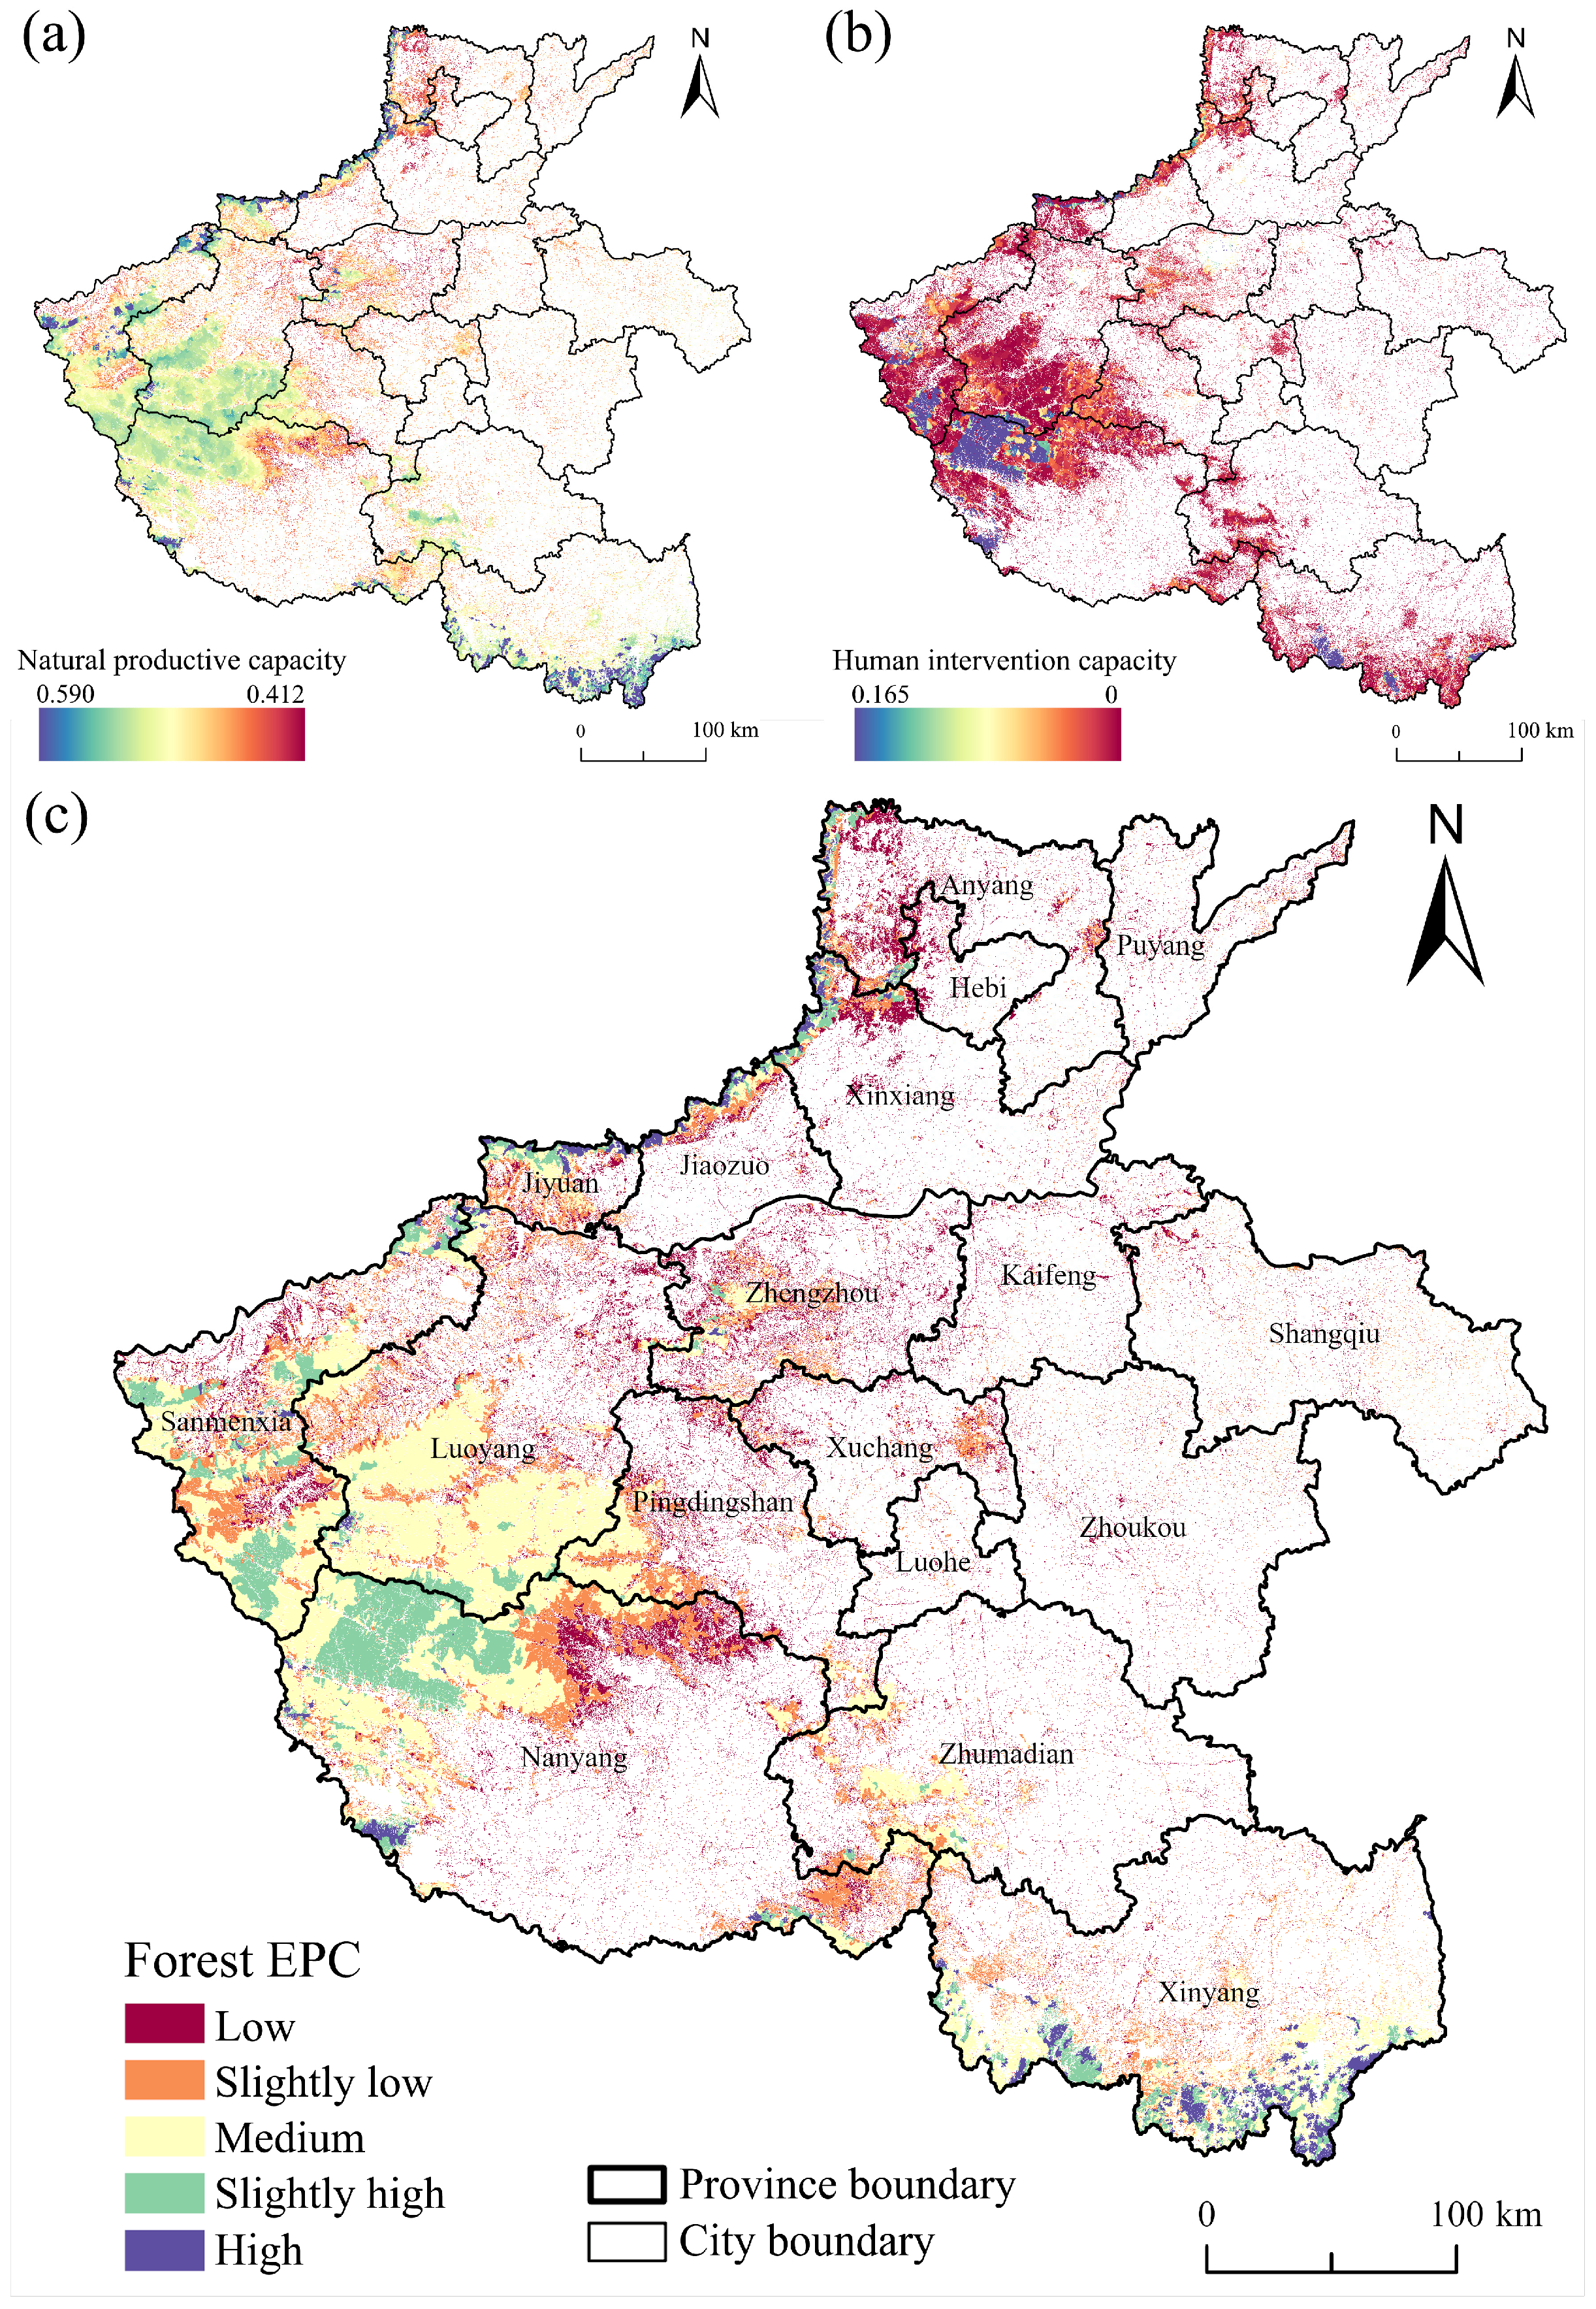
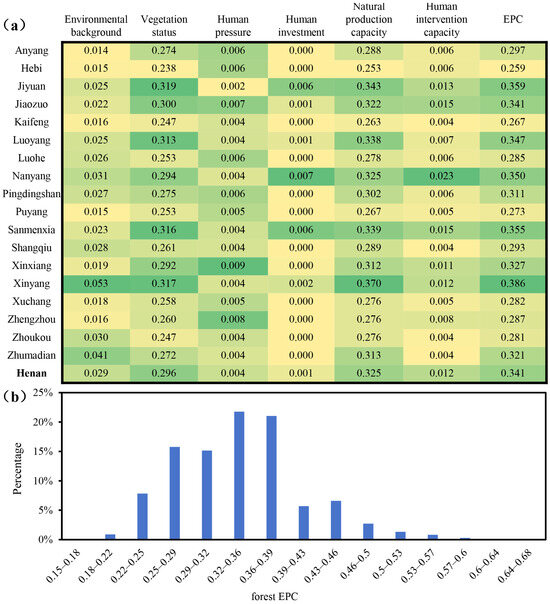
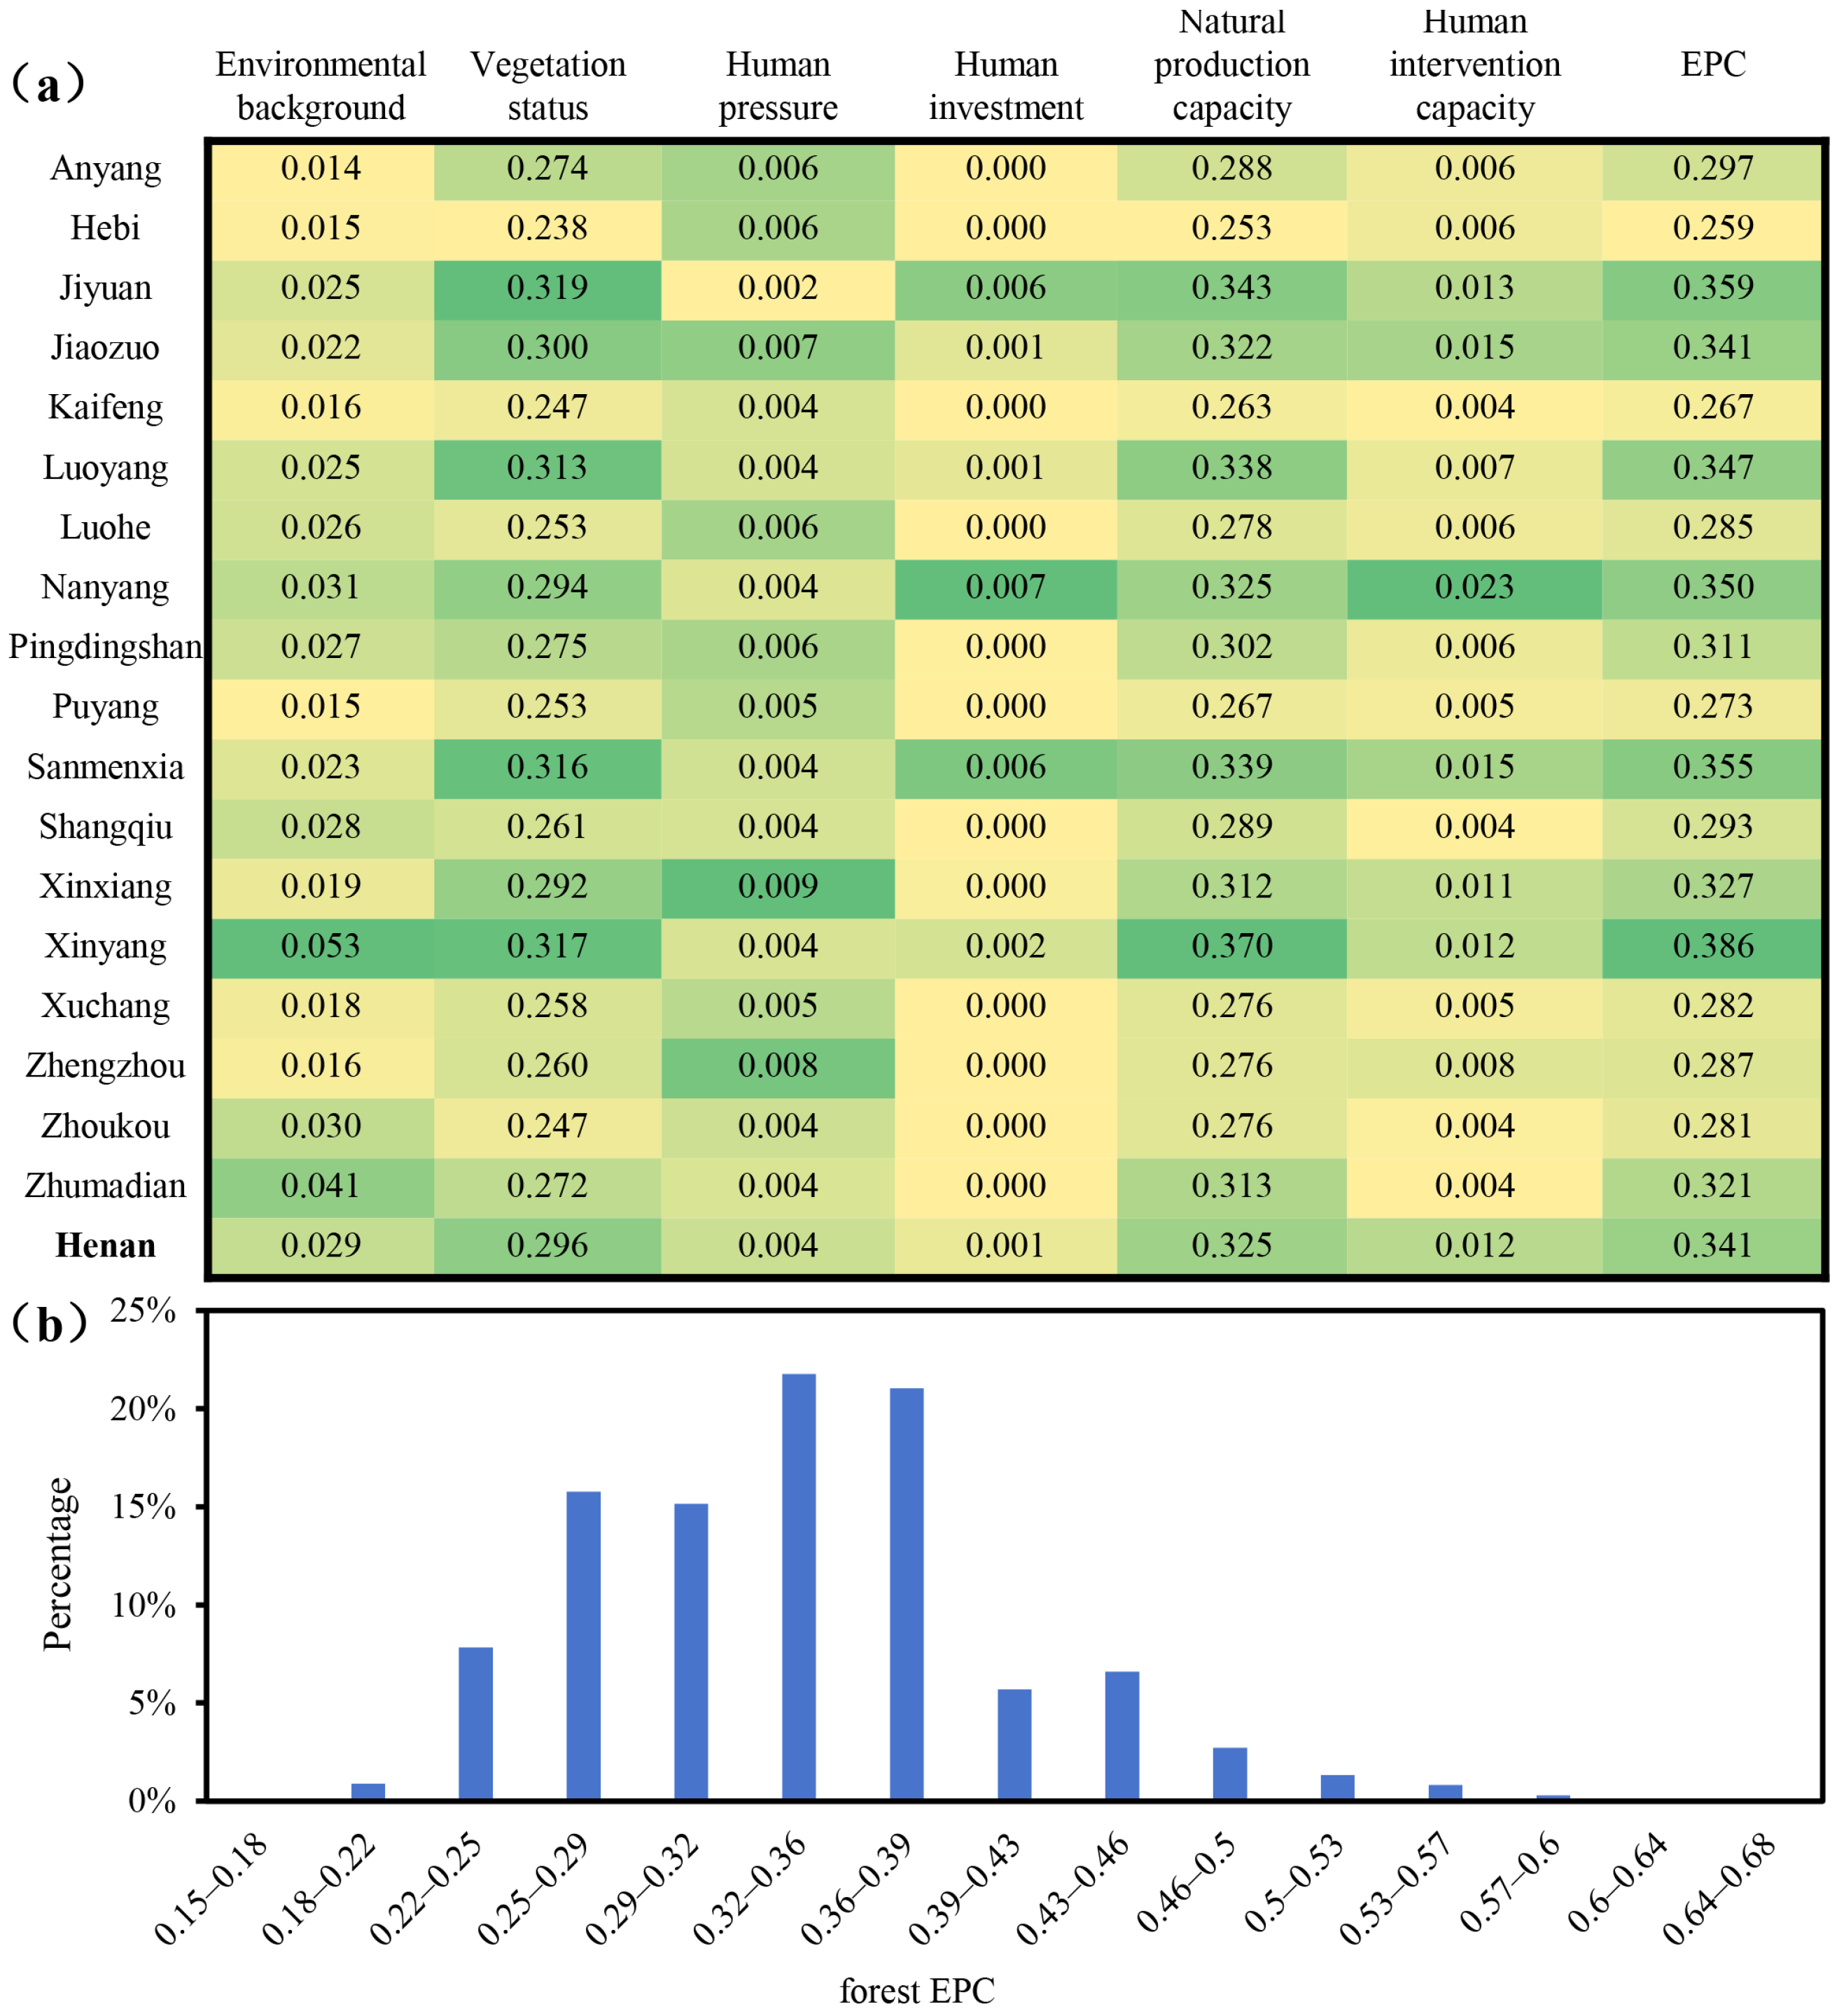
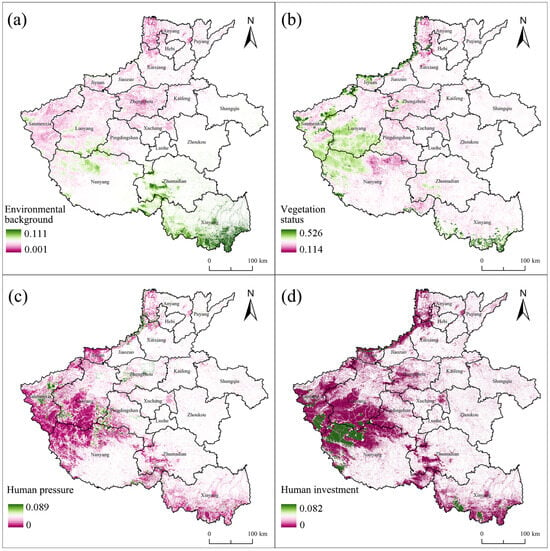
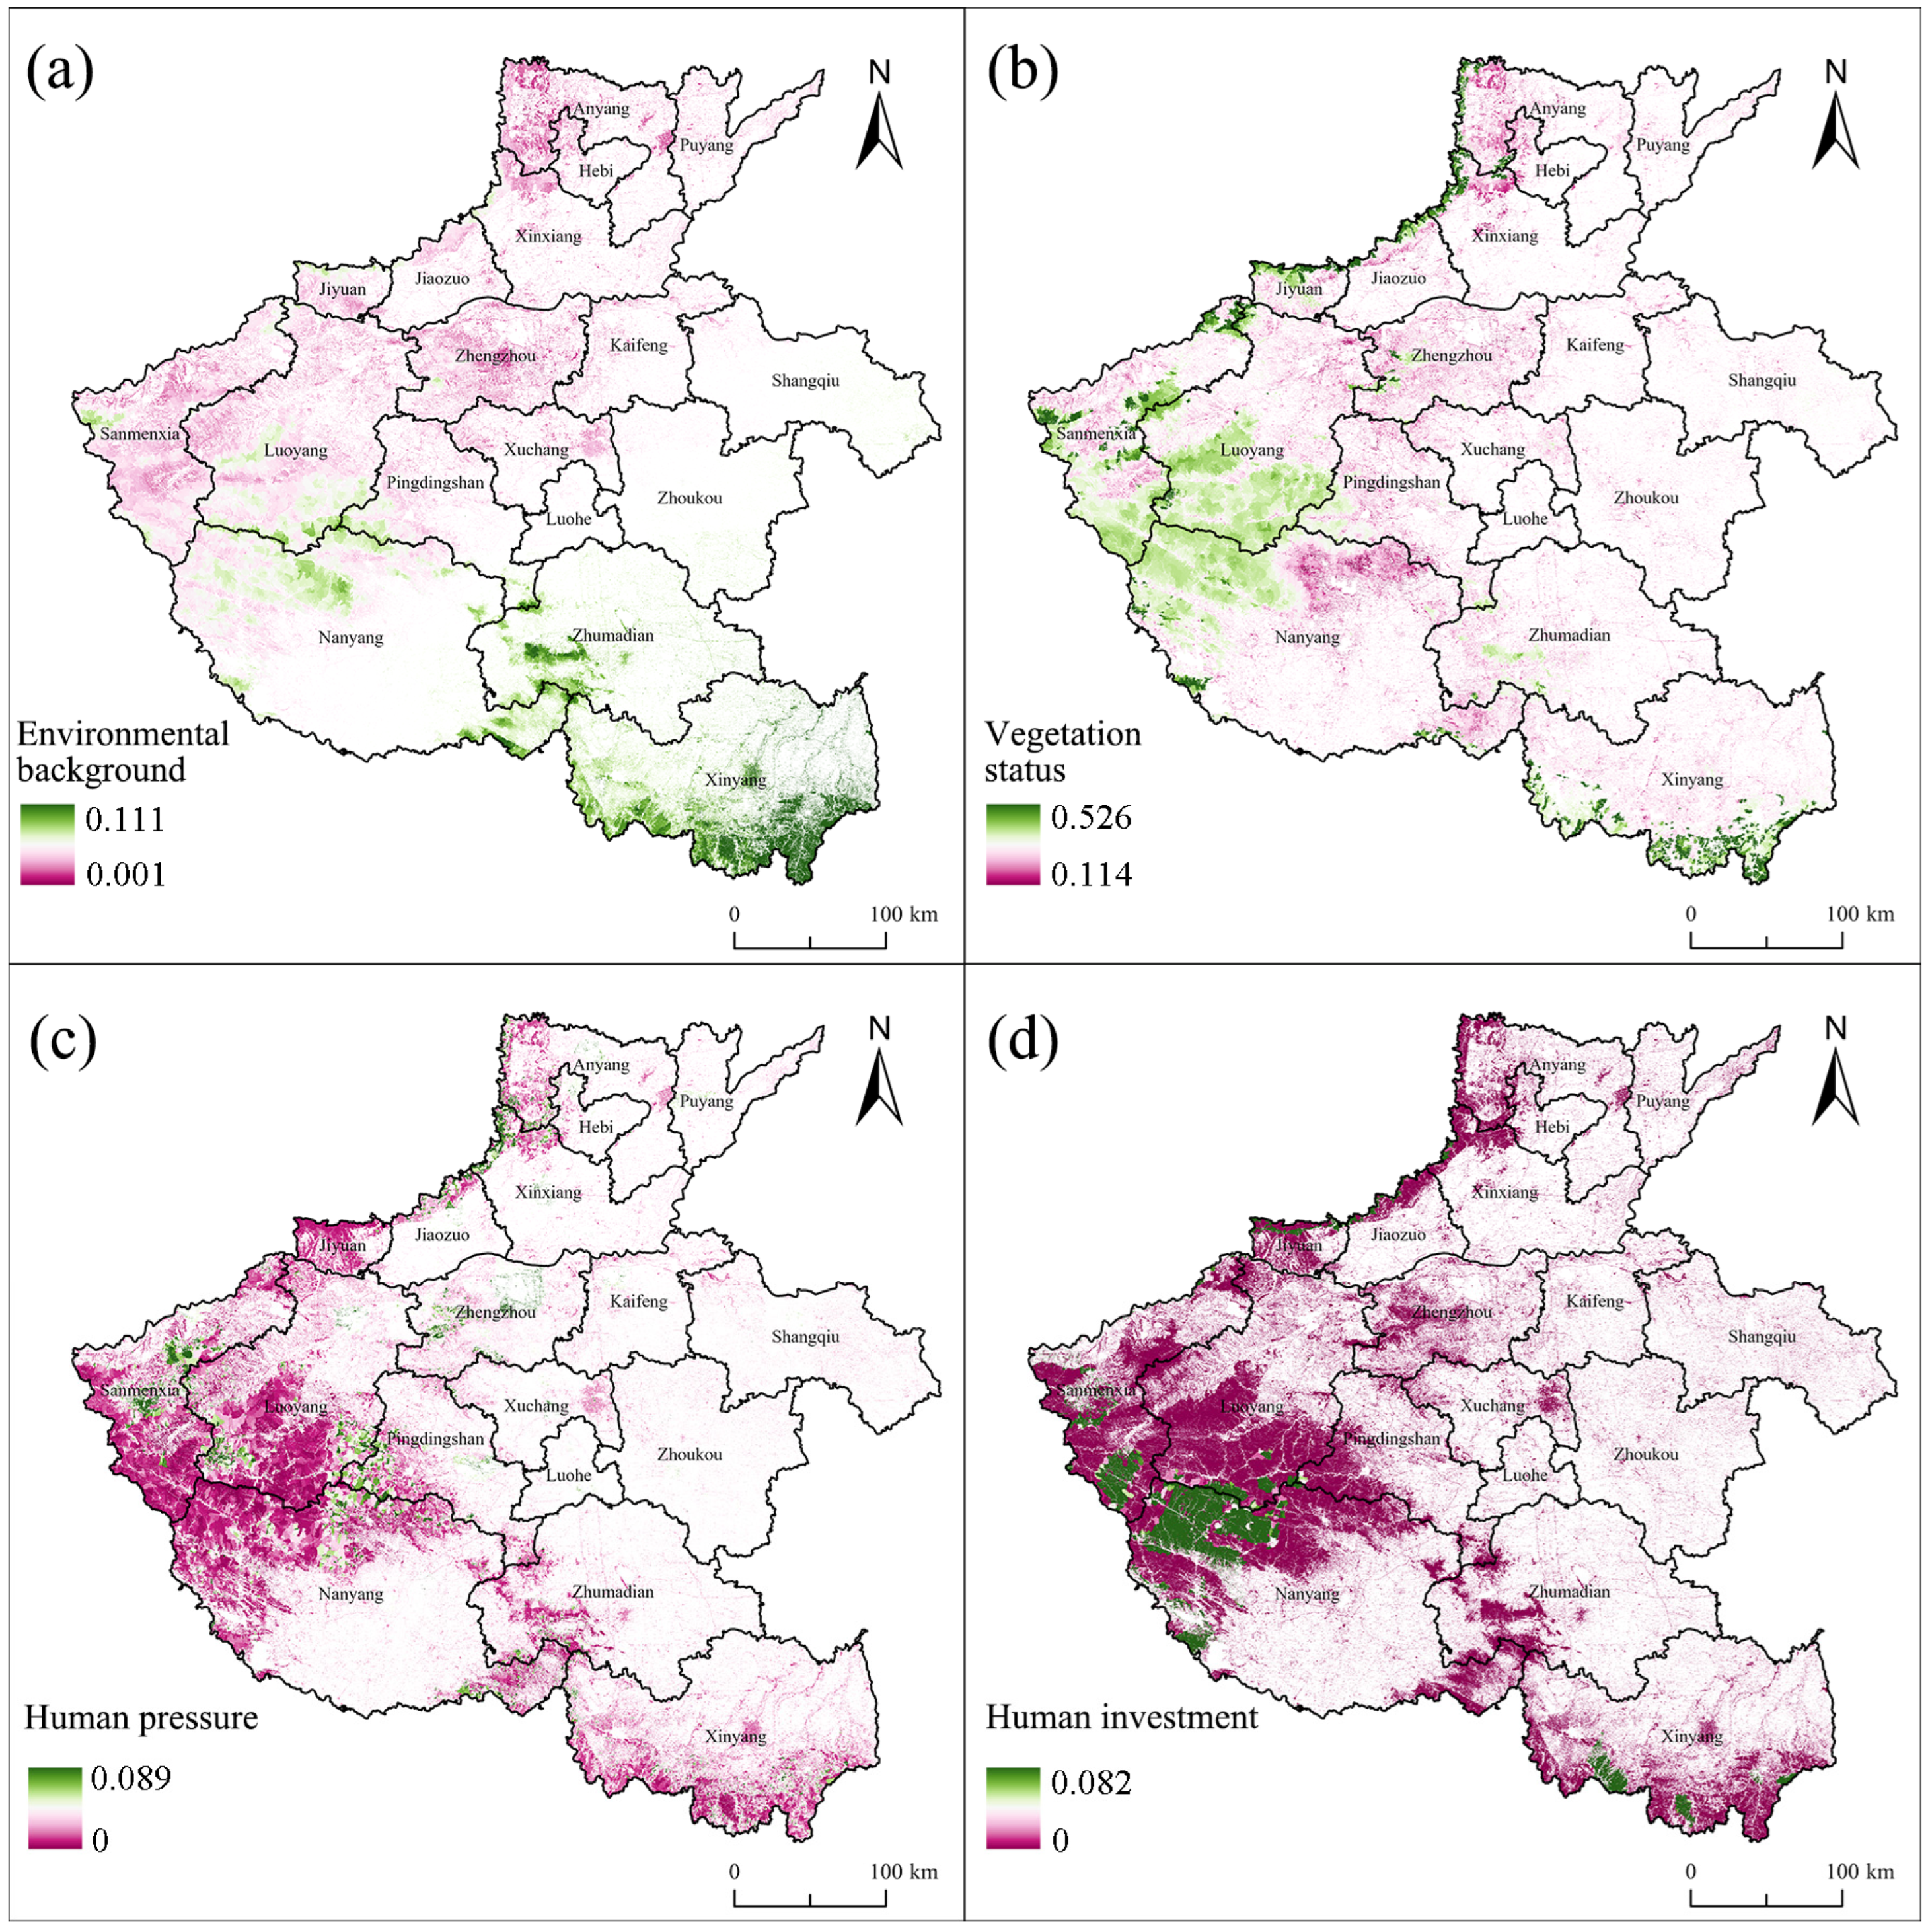
Overall, the forest EPC across Henan Province exhibits a distribution pattern characterized by “Southern Dominance and Mountainous Clustering”, with the majority of values concentrated in the 0.32–0.39 range (Figure 4 and Figure 5). The forest EPC evaluation indicators exhibit a pronounced asymmetrical spatial distribution (Figure 6), where the natural dimensions of environmental background and vegetation status demonstrate intense heterogeneity compared to the relatively uniform human pressure and investment dimensions. The natural productive dimensions (environmental background and vegetation status) demonstrate a broad-scale “latitudinal gradient”, where southern regions like Xinyang and Nanyang significantly outperform the north due to superior hydrothermal conditions. These natural advantages are further anchored by topographic barriers, with high-value clusters in vegetation status (0.114–0.526) concentrated along the Funiu, Dabie, and Taihang mountain ranges. In contrast, the human intervention dimensions exhibit a more fragmented and localized pattern. While human pressure (0–0.089) reflects a dual-core expansion driven by both western forest resource exploitation and eastern urbanization, human investment (0–0.082) remains strictly resource-dependent and confined to traditional ecological strongholds (Figure 6). At the city scale, this results in a notable divergence: Xinyang leads in natural endowment, whereas Nanyang exhibits the highest levels of active human intervention (Figure 5).
Figure 4.
Spatial distribution pattern of forest EPC evaluation results in Henan. (a) Evaluation results of the natural production capacity dimension. (b) Evaluation results of the human intervention capacity dimension. (c) Forest EPC Grading Results.
Figure 5.
Evaluation results of forest EPC: (a) the evaluation results for each dimension within each region; (b) the area proportion of the forest EPC for each interval.
Figure 6.
Spatial distribution of evaluation results of elements dimension of the forest EPC. (a) Environmental background dimension assessment result. (b) Vegetation condition dimension assessment result, human pressure dimension assessment result. (c) Human pressure dimension assessment result. (d) Human investment dimension assessment result.
In the absence of an established classification standard for EPC, we applied the natural breaks classification method, a technique widely adopted in mainstream research [70], to stratify forest EPC in the study area into five distinct grades (Table 3). We identified that medium-grade forests dominate the landscape, covering 36.69% (14,655.07 km2) of the total area. Comparing across dimensions, the scarcity of high-EPC areas (only 3.76% of the total extent) indicates that high-tier production capacity is achieved only where superior natural endowment synergizes with intensive management. The predominance of medium and low grades (collectively over 80%) suggests that in many regions, human investment has not yet effectively compensated for natural environmental constraints. This spatial configuration underscores a critical gap between the current ecosystem structure and the increasing demand for diversified ecosystem products across Henan Province.
Table 3.
Area composition of EPC grades of forest in Henan.
4.3. Spatial Clustering of Ecological Product Production Capacity of Forest
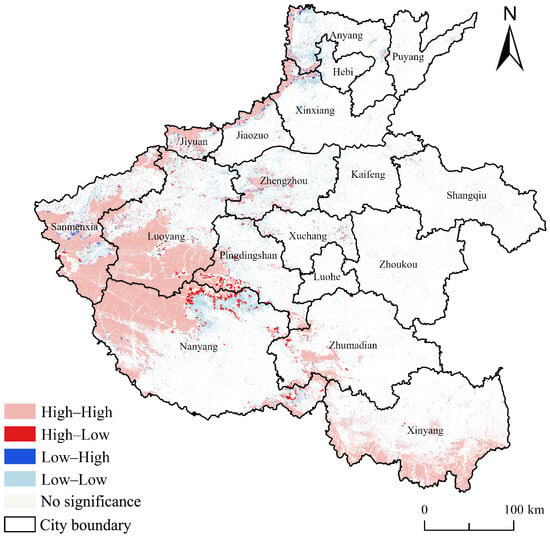
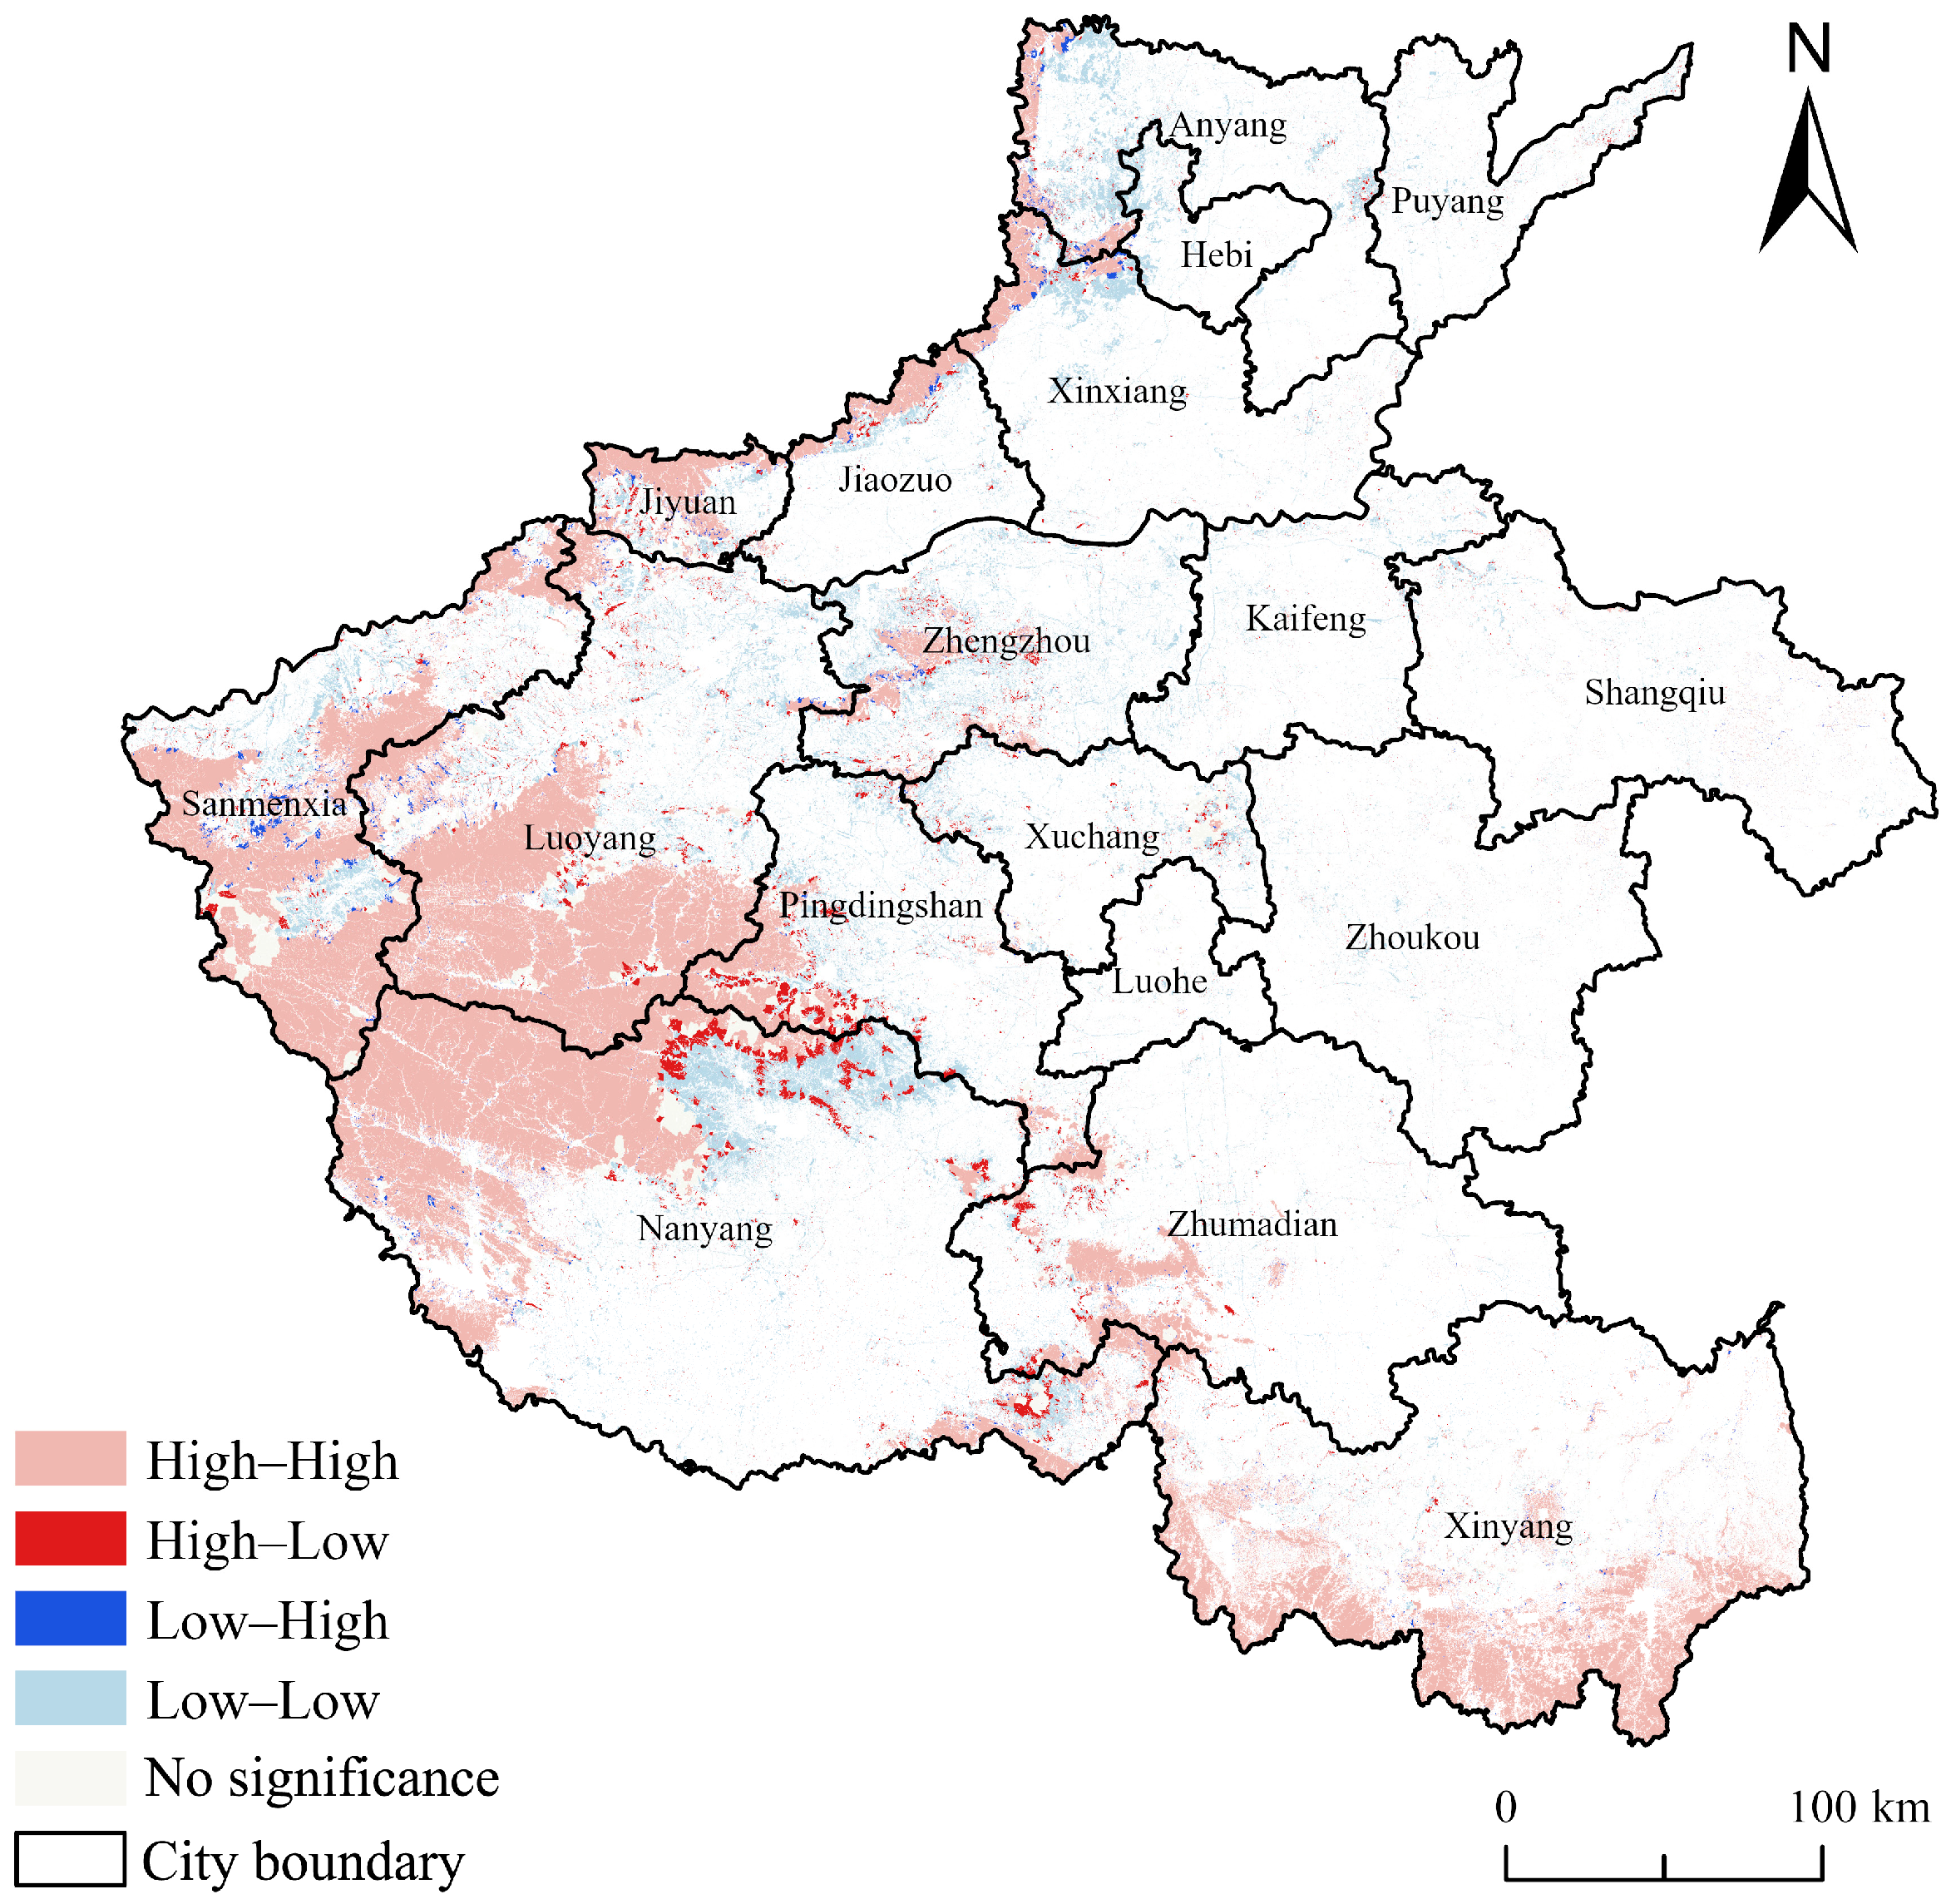
Global spatial autocorrelation analysis reveals a significant positive spatial correlation for forest EPC in Henan, with a Moran’s I of 0.7126 (Table 4), indicating strong spatial clustering. The LISA map (Figure 7) further identifies distinct spatial patterns, where the High–High (H-H) cluster emerges as the dominant spatial structure, forming the “core” of forest EPC.
Table 4.
Global Moran’s I for the forest EPC in Henan.
Figure 7.
Local spatial autocorrelation analysis of forest EPC.
The H-H clusters are primarily concentrated in the mountainous regions of western, southern, and northern Henan. These areas can be categorized into primary core regions (e.g., the Funiu and Dabie Mountains) and sub-core regions (e.g., the Taihang Mountains). The primary cores are driven by a synergistic “natural–human” coupling mechanism, where high topographic protection and favorable hydrothermal conditions are augmented by intensive ecological management and investment. In contrast, the sub-core regions in the north, while exhibiting clustering, show slightly lower EPC intensity due to more constrained climatic variables.
The Low–Low (L-L) clusters are predominantly distributed across the expansive plains and the southeastern periphery of the western mountains. This clustering is explained by the “urban–agricultural squeeze” effect, where rapid urbanization and intensive farming fragment forest patches, leading to a localized decline in ecological stability. Furthermore, the High–Low (H-L) and Low–High (L-H) clusters, which are distributed linearly along the eastern edge of the western mountains and scattered across the north, represent spatial transition zones. These transition zones highlight the “edge effect” where high-capacity mountain forests meet low-capacity urban-agricultural plains, creating a sharp gradient in production potential.
4.4. Validation of Assessment Results
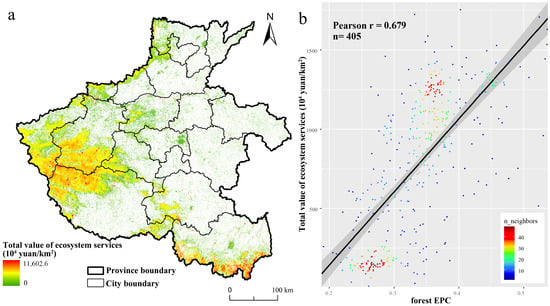
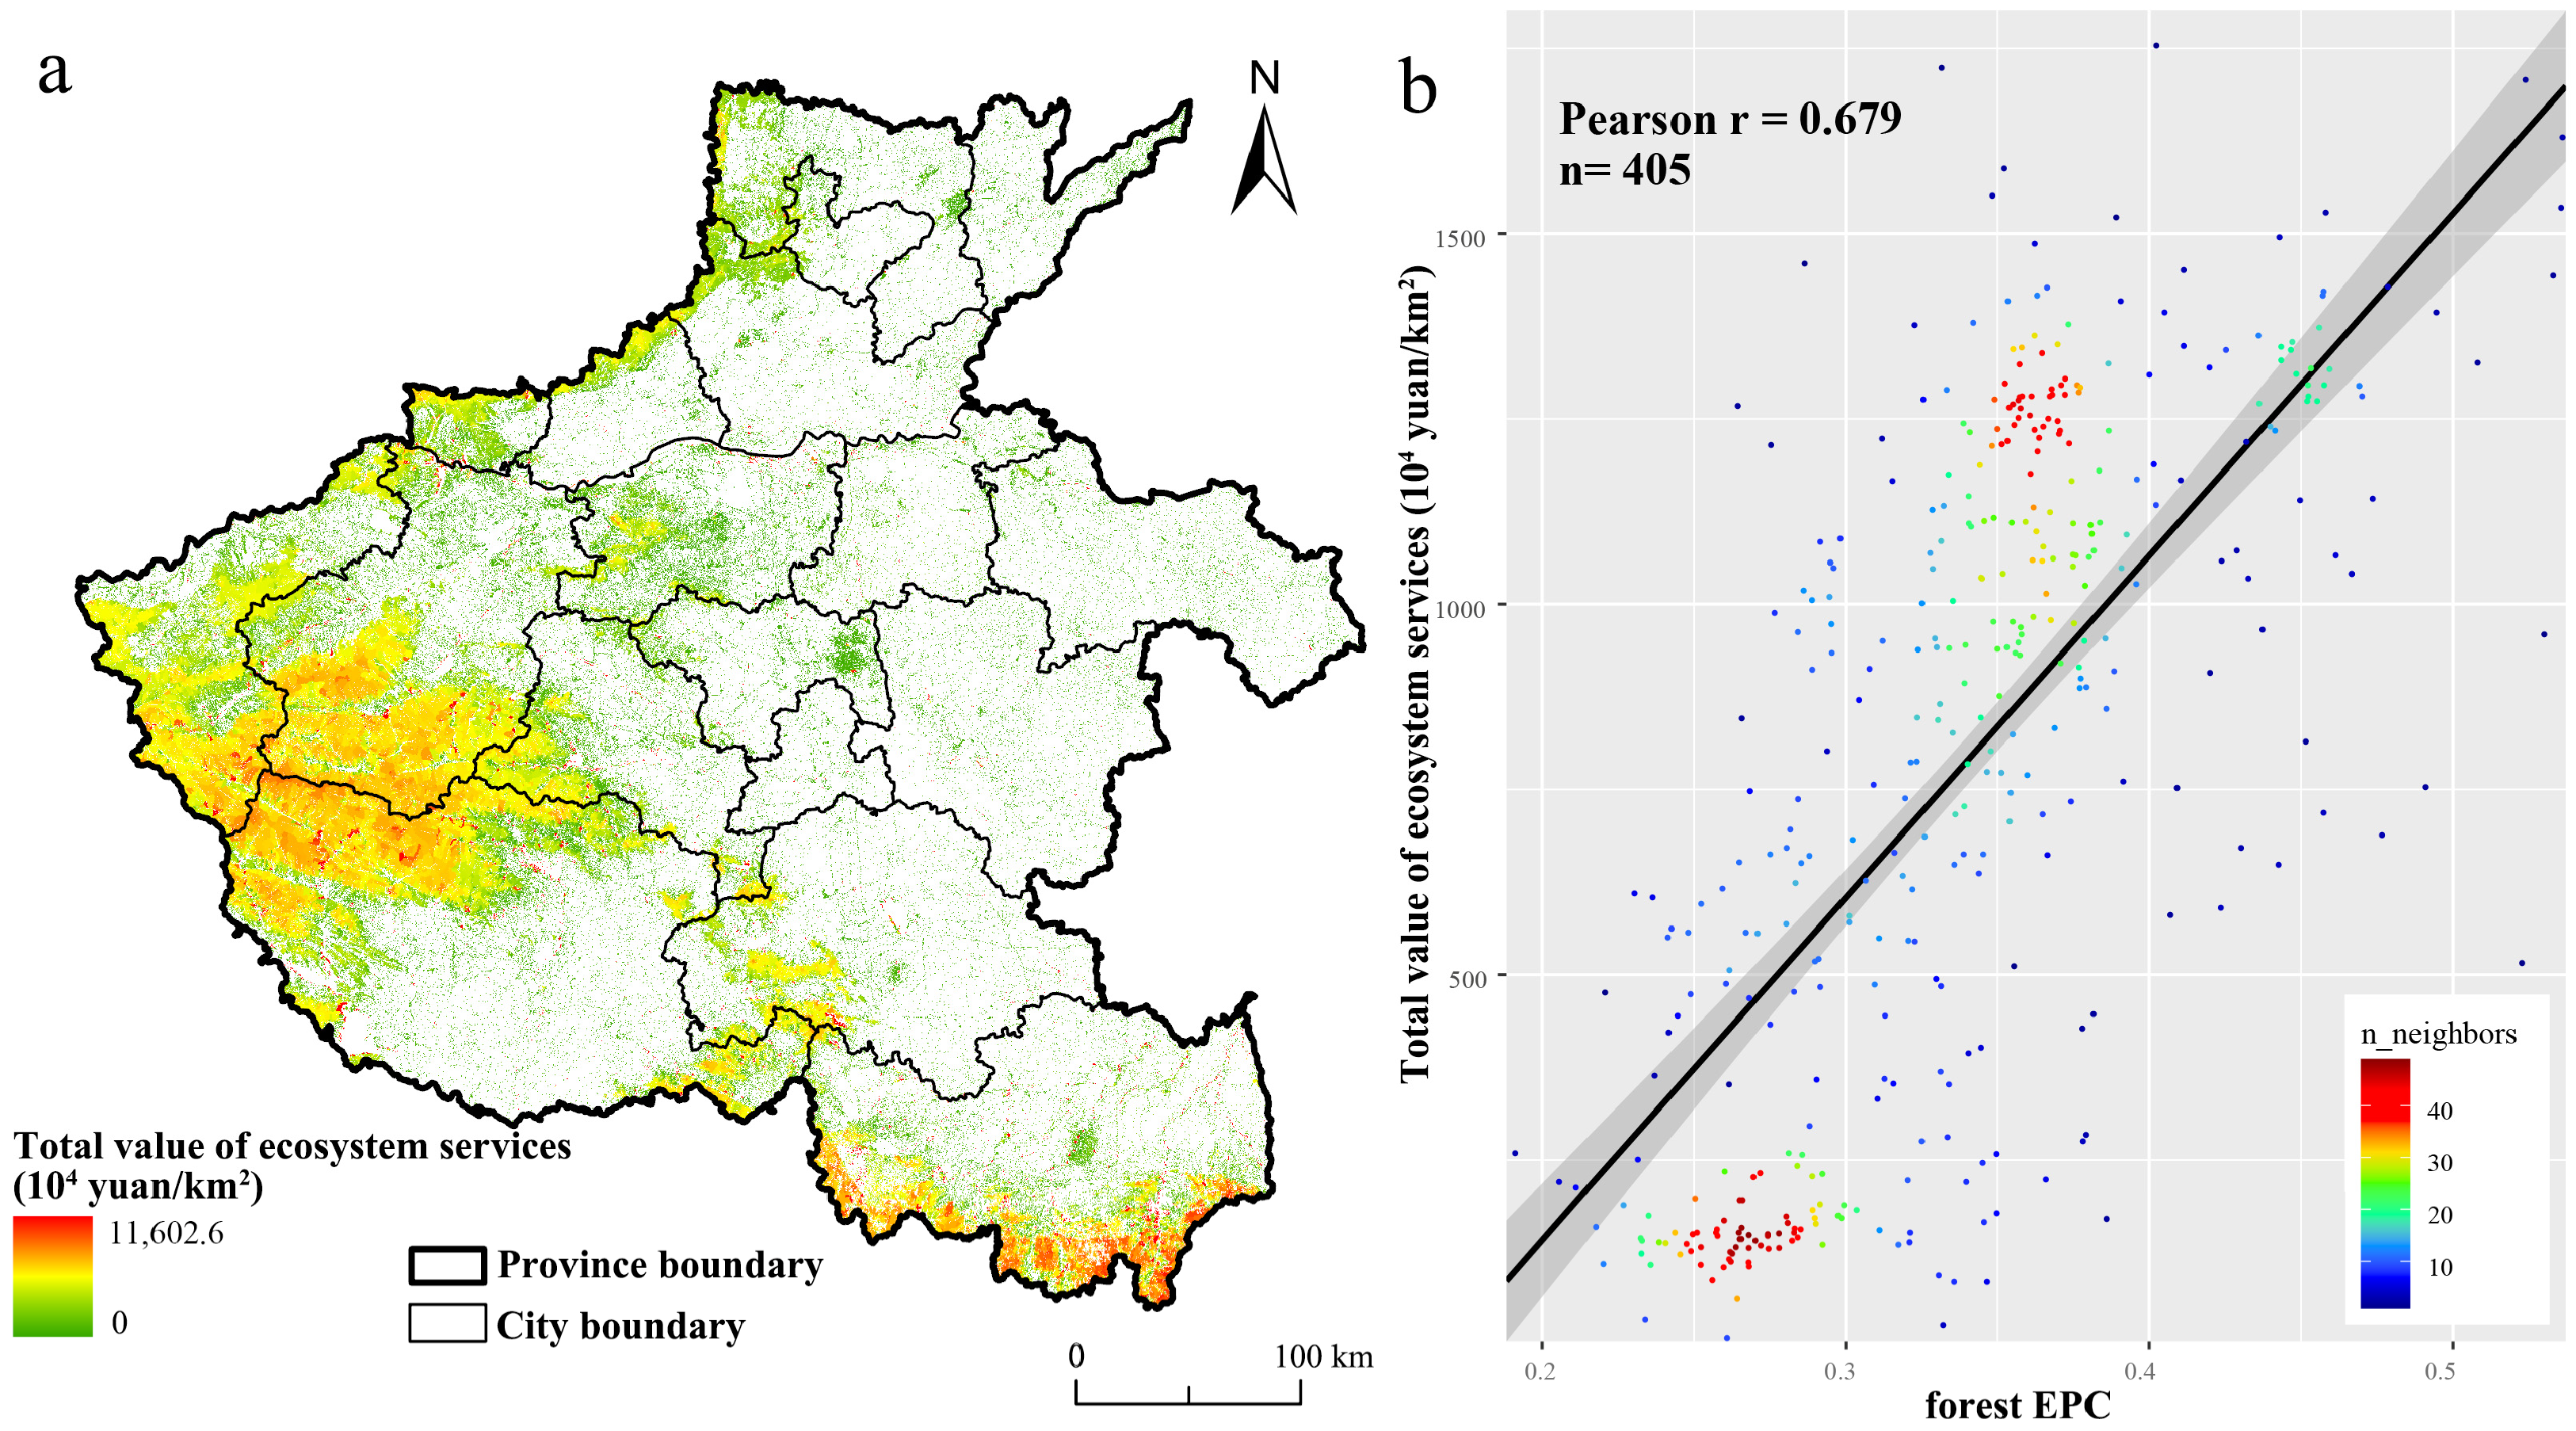
As displayed in Figure 8a, the total value of forest ecosystem services in Henan was higher in the Dabie Mountain and the Funiu Mountain and lower in the plains. This spatial distribution pattern was found to be highly congruent with the results of our study (Figure 4). High EPC constitutes the material foundation for providing ecosystem services [22]. The results of the correlation analysis (Figure 8a) showed that the correlation coefficients of the two variables reached a strong correlation (0.679). Despite the disparity in units of measurement between the dataset and our results, both reflect the relative high and low levels of EPC, thereby ensuring the reliability of the findings [66]. The empirical results in Henan illustrated the validity of the EPC assessment framework proposed in this study.
Figure 8.
Validation of forest EPC. (a) Spatial distribution of the total value of ecosystem services. (b) Correlation verification.
5. Discussion
5.1. Explanation of Spatial Heterogeneity
In this study, we found that forest EPC exhibited significant effects of both latitude and topography. The forest EPC in the southern part of Henan Province was significantly higher than in the north, as was that in the mountains compared to the plains (Figure 7). These results are consistent with those of Roces-Díaz et al. (2018) [15] and Mengjuan et al. (2025) [71], who attributed this to the complex interaction between precipitation patterns and human activities. Specifically, rainfall is usually positively correlated with the supply of main ecosystem products [15]. As latitude increases, the availability of water resources becomes a key factor in limiting the supply of ecosystem services. The forests in the southern mountainous area benefit from the transitional climate. There are abundant precipitation and suitable temperatures here, which are conducive to the formation of a complex, multi-layered forest structure. From an ecological perspective, these diversified communities possess higher functional redundancy and energy conversion efficiency, enabling a more stable and continuous supply of ecosystem products compared to the simpler ecosystems in the north.
Between 2000 and 2020, Henan Province experienced rapid urbanization, with the percentage of the population living in cities rising from 23.17% to 55.43% [71]. This led to the fragmentation of natural habitats, especially grasslands and forests in the plains. Although certain ecological restoration measures have recently been implemented, most of these forests are young, single-species plantations and the ecosystem products they provide are limited [72]. In contrast, mountainous forests, often shielded by protected area status, have maintained their community integrity. These interior forest habitats are less susceptible to the edge effects of infrastructure and mining, allowing for more robust nutrient cycling and soil stabilization.
5.2. Comparison with Existing Studies
The forest EPC framework developed in this study offers distinct theoretical and practical advantages over traditional ecosystem accounting methodologies. A substantial body of previous research has quantified ecological outputs primarily from a “flow” perspective, utilizing normalized composite indices [18] or monetary valuations [20]. However, flow-based metrics often reflect the actual use of ecosystem products by humans rather than the sustainable capacity of the ecosystem to provide them [73,74]. By shifting the focus to a “capacity” perspective, our framework emphasizes the long-term potential of the natural-human complex to generate products under stable ecological and management regimes. This transition from “flow” to “capacity” effectively mitigates the persistent risk of double-counting between intermediate and final services—a long-standing challenge in ecosystem accounting [75]. Meanwhile, we have observed that there is a strong spatial autocorrelation in the forest EPC. This finding is similar to those reported in some previous studies [76,77]. The EPC in the Poyang Lake Basin has a positive spatial spillover effect, with the global Morans index being above 0.6 [76].
The generalizability of this multidimensional framework across China’s diverse forest ecosystems constitutes a core strength of the proposed approach. While existing Chinese forest research has largely concentrated on national ecological hotspots in subtropical or boreal zones [78,79], our study provides a methodological template for transitional forest zones that can be systematically extended to other regions. The framework’s flexibility allows for the recalibration of dimensions based on specific regional drivers: for subtropical forests in southern China, the framework can prioritize human investment [80] (e.g., plantation programs) as the dominant modifier of forest EPC; conversely, for boreal forests in the Northeast, the assessment can emphasize environmental background [81] (e.g., temperature, precipitation). This transferability ensures that the assessment framework remains effective in different climatic and socio-economic contexts. Furthermore, our research results confirm that the natural production capacity remains the fundamental driving factor for the ecosystem products of forests, which is similar to the findings of previous studies [16]. However, the contribution of human intervention capabilities should also be acknowledged. In other words, targeted ecological investments and proactive management interventions can accelerate the restoration of EPC in regions with a relatively weak natural foundation [82]. Compared to complex process-based models such as InVEST or the 4C model, which often necessitate high-resolution parameters and specialized computational expertise [17], the simplicity and transparency of our indicator-based approach facilitate rapid policy response and grassroots management.
5.3. Implications for Forest Management in Henan
Rising incomes, urbanization, and agricultural expansion have intensified forest scarcity while escalating public demand for ecological products. However, a significant imbalance exists in the alignment of supply and demand, particularly in the plains [83]. Analyzing forest EPC is therefore essential to identify supply shortfalls, mitigate resource risks, and provide a scientific basis for ecological accounting and cross-regional compensation [10,83]. Our findings reveal that forest EPC in Henan is significantly higher in the western and southern mountains than in the plains, though high-value areas remain limited. Notably, the Global Moran’s I of 0.71 indicates a powerful spatial agglomeration effect, where high-EPC and low-EPC areas form distinct clusters. To ensure a sustainable supply of ecological products, a spatially coordinated management strategy is required:
First, implement integrated protection for High–High EPC clusters. As the western and southern mountains form a contiguous high-value belt, management should transcend administrative boundaries to establish a collaborative ecological corridor. These regions, serving as the primary ecological shield for the Yellow River basin, must be strictly managed under a unified “ecological protection red line” to mitigate habitat fragmentation caused by human disturbances. Expanding nature reserves in the southern mountains is particularly vital to preserving the continuity of these high-capacity clusters. This is with a view to mitigating disturbances caused by human activities, including commercial logging and the utilization of fuel wood in rural areas.
Second, leverage regional synergy to enhance forest resilience. In transitional areas such as northern Nanyang and western Zhumadian, where spatial dependence is high, forest health initiatives should be synchronized across administrative boundaries. Rather than isolated firefighting or pest control, a regional monitoring and early warning network should be established to protect these critical EPC zones [84]. Furthermore, afforestation initiatives should prioritize diverse tree species [82] to enhance the collective resistance of the forest belt against large-scale environmental risks.
Third, foster multi-city synergistic afforestation in Low-Low clusters. Given the persistent low-EPC clustering in the central and eastern plains, policy should focus on improving the spatial equity of ecological product access. A recent body of research has revealed that urban forests, despite undergoing fragmentation, continue to offer ecological benefits including temperature regulation, reduction in air pollution, and the provision of recreational areas [85,86]. By integrating urban forests into the spatial planning of the Zhengzhou metropolitan area, these regions can better fulfill the escalating environmental health demands of densely populated urban areas.
5.4. Limitation and Future Work
Despite the insights provided by the EPC framework, this study has two primary limitations that warrant further exploration. First, the current evaluation relies on a static spatial snapshot and indirect remote sensing proxies. While this provides a baseline for spatial management, it does not fully account for the intertemporal sustainability or degradation trends of ecological supply. Incorporating temporal dynamics would allow for a distinction between “stable supply zones” and “transitional risk zones”. While the vegetation health index is an effective proxy for canopy stress, it is inherently sensitive to moisture availability. In the context of Henan’s seasonal climate, the interpretation of vegetation health index may be biased during periods of severe meteorological drought, where moisture-induced browning could be misidentified as biotic disturbance. This is in addition to the impacts of pests and diseases on vegetation [87]. Future research should incorporate intertemporal dynamics and in situ forest inventories to distinguish between stable supply zones and transitional risk areas.
Second, while our hybrid weighting method identifies the relative importance of EPC drivers, it does not fully decouple the complex, non-linear interactions between natural and anthropogenic factors. The absence of a systematic sensitivity analysis remains a limitation when evaluating the robustness of forest EPC against variations in parameters. The weight analysis of this study indicates that natural endowments such as forest age, forest coverage, and soil organic carbon content are the primary driving factors. To move beyond indicator weighting toward a substantive understanding of spatial heterogeneity, future endeavors should utilize Geodetector or Geographically Weighted Regression (GWR). These tools will be essential for quantifying the threshold effects of human investment and its capacity to compensate for natural environmental constraints across different geographical gradients. In addition, The determination of weights was based on a group of six experts, and this sample size is relatively small.
6. Conclusions
This study proposes a comprehensive EPC assessment framework for natural ecosystems based on environmental background, vegetation status, human pressure, and human investment. This framework was subsequently applied to forest ecosystems to establish a robust assessment system for forest EPC. Utilizing a multi-criteria evaluation method that combines the AHP with the entropy weight method, the study empirically analyzed the spatial distribution of forest EPC in Henan Province. The primary conclusions are summarized as follows:
- (1)
- The spatial differentiation of forest EPC in Henan is primarily driven by a hierarchical synergy of natural and anthropogenic factors, with natural endowment acting as the foundational determinant.
- (2)
- Henan exhibits significant spatial heterogeneity in forest EPC. The Dabie Mountains in the south and the Funiu Mountains in the west exhibit significantly higher levels of EPC in comparison to the northern mountainous areas and eastern plains. The average forest EPC in Henan is 0.341, which is at an medium level, with only 16.52% of forest area classified as having EPC at the ‘slightly high’ or ‘high’ levels. The distribution of forest EPC in Henan exhibits strong spatial dependency.
- (3)
- The EPC assessment framework established in this study proved to be reliable. In comparison with conventional model-based methodologies, it reduces the application threshold while maintaining high accuracy, thus providing novel methodological concepts for analogous studies in other regions.
Author Contributions
B.L.: Conceptualization, methodology, investigation, writing—original draft preparation. K.W.: Conceptualization, supervision. Z.F.: validation, writing—review and editing. J.Q.: Methodology, supervision. All authors have read and agreed to the published version of the manuscript.
Funding
This work was supported by National Natural Science Foundation of China (Grant No. 42171261).
Institutional Review Board Statement
Not applicable.
Informed Consent Statement
Not applicable.
Data Availability Statement
The datasets used in the current study available from the corresponding author on reasonable request.
Conflicts of Interest
The authors declare no competing interests.
References
- Zhou, J.; Xiong, K.; Wang, Q.; Tang, J.; Lin, L. A Review of Ecological Assets and Ecological Products Supply: Implications for the Karst Rocky Desertification Control. Int. J. Environ. Res. Public Health 2022, 19, 10168. [Google Scholar] [CrossRef] [Scilit]
- Zhang, D.; Peng, J.; Yang, Z. Identifying Urban Agglomeration’s Range: Integrating Clustering and Accessibility Analysis. Cities 2026, 171, 106708. [Google Scholar] [CrossRef] [Scilit]
- Gu, C.; Hu, L.; Ian, G.C. China’s Urbanization in 1949–2015: Processes and Driving Forces. Chin. Geogr. Sci. 2017, 27, 847–859. [Google Scholar] [CrossRef] [Scilit]
- Lawrence, D.; Vandecar, K. Effects of tropical deforestation on climate and agriculture. Nat. Clim. Change 2015, 5, 27–36. [Google Scholar] [CrossRef] [Scilit]
- de Graaf, I.E.M.; Gleeson, T.; van Beek, L.P.H.; Sutanudjaja, E.H.; Bierkens, M.F.P. Environmental flow limits to global groundwater pumping. Nature 2019, 574, 90–94. [Google Scholar] [CrossRef] [Scilit]
- Notice of the State Council on Issuing the National Main Functional Zone Planning. 2010. Available online: https://www.gov.cn/zwgk/2011-06/08/content_1879180.htm (accessed on 12 October 2024).
- Chen, Q.; Li, Z.; Xie, H.; Wu, M.; Pan, Y.; Luo, S. How can ecological product value realization contribute to landscape sustainability? Landsc. Ecol. 2024, 39, 15. [Google Scholar] [CrossRef] [Scilit]
- Zhu, C.; Li, N.; Wang, H.; Guo, B.; Cao, J. The conceptual connotation evolution and key points of value realization in forest ecological products. Chin. J. Eco-Agric. 2025, 33, 1024–1032. [Google Scholar]
- Zhang, L.; Yu, H.; Li, D.; Jia, Z.; Wu, F.; Liu, X. Connotation and Value Implementation Mechanism of Ecological Products. Trans. Chin. Soc. Agric. Mach. 2019, 50, 173–183. [Google Scholar]
- Zhang, E.; Gao, X.; Lei, S.; Qiao, Q.; Zheng, Y.; Liu, L.; Han, Y. Evaluation Methods and Application of Adaptability of Ecological Product Development and Utilization—Taking Jizhou District, Tianjin City, as an Example. Sustainability 2024, 16, 3438. [Google Scholar] [CrossRef] [Scilit]
- Gao, M.-N.; Hu, Y.-X.; Shang, G.-F.; Li, W. Research on the impact of spatial and temporal changes in ecological product value in Hebei Province based on land use changes. Sci. Rep. 2025, 15, 9571. [Google Scholar] [CrossRef] [Scilit]
- Ben, F.; Li, Z.; Sun, J.; Wang, H.; Zhao, X. Ecological product value accounting and analyst behavior. Int. Rev. Financ. Anal. 2024, 94, 103273. [Google Scholar] [CrossRef] [Scilit]
- Wang, N.; Xu, C.; Kong, F. Value Realization and Optimization Path of Forest Ecological Products—Case Study from Zhejiang Province, China. Int. J. Environ. Res. Public Health 2022, 19, 7538. [Google Scholar] [CrossRef] [Scilit] [PubMed]
- Pandey, R.; Mehta, D.; Kumar, V.; Pradhan, R.P. Quantifying soil erosion and soil organic carbon conservation services in Indian forests: A RUSLE-SDR and GIS-based assessment. Ecol. Indic. 2024, 163, 112086. [Google Scholar] [CrossRef] [Scilit]
- Roces-Díaz, J.V.; Vayreda, J.; Banqué-Casanovas, M.; Cusó, M.; Anton, M.; Bonet, J.A.; Brotons, L.; De Cáceres, M.; Herrando, S.; de Aragón, J.M.; et al. Assessing the distribution of forest ecosystem services in a highly populated Mediterranean region. Ecol. Indic. 2018, 93, 986–997. [Google Scholar] [CrossRef] [Scilit]
- Vauhkonen, J.; Ruotsalainen, R. Assessing the Provisioning Potential of Ecosystem Services in a Scandinavian Boreal Forest: Suitability and Tradeoff Analyses on Grid-Based Wall-to-Wall Forest Inventory Data. For. Ecol. Manag. 2017, 389, 272–284. [Google Scholar] [CrossRef] [Scilit]
- Gutsch, M.; Lasch-Born, P.; Kollas, C.; Suckow, F.; Reyer, C.P.O. Balancing Trade-Offs Between Ecosystem Services in Germany’s Forests Under Climate Change. Environ. Res. Lett. 2018, 13, 045012. [Google Scholar] [CrossRef] [Scilit]
- Wu, L.; Fan, F. Assessment of ecosystem services in new perspective: A comprehensive ecosystem service index (CESI) as a proxy to integrate multiple ecosystem services. Ecol. Indic. 2022, 138, 108800. [Google Scholar] [CrossRef] [Scilit]
- Xie, G.; Zhang, C.; Zhen, L.; Zhang, L. Dynamic changes in the value of China’s ecosystem services. Ecosyst. Serv. 2017, 26, 146–154. [Google Scholar] [CrossRef] [Scilit]
- Zhu, J.; Liu, C.; Ke, X.; Huang, L.; Jiao, W. Analysis on the change characteristics of ecological product production capacity in urbanization process: A case study of Hubei Yangtze River economic zone. Ecol. Environ. Sci. 2024, 33, 469–477. [Google Scholar]
- De La Cruz, P.M.C. The Knowledge Status of Coastal and Marine Ecosystem Services—Challenges, Limitations and Lessons Learned from the Application of the Ecosystem Services Approach in Management. Front. Mar. Sci. 2021, 8, 684770. [Google Scholar] [CrossRef] [Scilit]
- Hein, L.; Bagstad, K.; Edens, B.; Obst, C.; De Jong, R.; Lesschen, J.P. Defining Ecosystem Assets for Natural Capital Accounting. PLoS ONE 2016, 11, e0164460. [Google Scholar] [CrossRef] [Scilit]
- Wang, C.; Chang, Y.; Guo, B.; Liu, P. Forecasting and Evaluation of Ecosystem Services Supply-Demand Under SSP-RCP Scenarios in the Henan Segment of the Yellow River Basin, China. Remote Sens. 2025, 17, 1067. [Google Scholar] [CrossRef] [Scilit]
- Yang, Y.; Ma, J.; Liu, H.; Song, L.; Cao, W.; Ren, Y. Spatial Heterogeneity analysis of urban forest ecosystem services in Zhengzhou City. PLoS ONE 2023, 18, e0286800. [Google Scholar] [CrossRef] [Scilit] [PubMed]
- Edens, B.; Maes, J.; Hein, L.; Obst, C.; Siikamaki, J.; Schenau, S.; Javorsek, M.; Chow, J.; Chan, J.Y.; Steurer, A.; et al. Establishing the SEEA Ecosystem Accounting as a global standard. Ecosyst. Serv. 2022, 54, 101413. [Google Scholar] [CrossRef] [Scilit]
- La Notte, A.; Vallecillo, S.; Maes, J. Capacity as “virtual stock” in ecosystem services accounting. Ecol. Indic. 2019, 98, 158–163. [Google Scholar] [CrossRef] [Scilit] [PubMed]
- United Nations. System of Environmental-Economic Accounting—Ecosystem Accounting (SEEA EA). 2021. Available online: https://seea.un.org/ecosystem-accounting (accessed on 12 October 2024).
- Liu, B.; Wu, K.; Feng, Z. An Exploration of the Meaning and Evaluation of Ecosystem Product Production Capacity. China Land 2023, 7, 25–27. [Google Scholar] [CrossRef]
- Ostrom, E. A General Framework for Analyzing Sustainability of Social-Ecological Systems. Science 2009, 325, 419–422. [Google Scholar] [CrossRef] [Scilit]
- Jonsson, M.; Bengtsson, J.; Gamfeldt, L.; Moen, J.; Snäll, T. Levels of forest ecosystem services depend on specific mixtures of commercial tree species. Nat. Plants 2019, 5, 141–147. [Google Scholar] [CrossRef] [Scilit]
- Runting, R.K.; Bryan, B.A.; Dee, L.E.; Maseyk, F.J.F.; Mandle, L.; Hamel, P.; Wilson, K.A.; Yetka, K.; Possingham, H.P.; Rhodes, J.R. Incorporating climate change into ecosystem service assessments and decisions: A review. Glob. Change Biol. 2017, 23, 28–41. [Google Scholar] [CrossRef] [Scilit]
- Felipe-Lucia, M.R.; Soliveres, S.; Penone, C.; Manning, P.; van der Plas, F.; Boch, S.; Prati, D.; Ammer, C.; Schall, P.; Gossner, M.M.; et al. Multiple forest attributes underpin the supply of multiple ecosystem services. Nat. Commun. 2018, 9, 4839. [Google Scholar] [CrossRef] [Scilit]
- Folke, C.; Polasky, S.; Rockström, J.; Galaz, V.; Westley, F.; Lamont, M.; Scheffer, M.; Österblom, H.; Carpenter, S.R.; Chapin, F.S.; et al. Our future in the Anthropocene biosphere. Ambio 2021, 50, 834–869. [Google Scholar] [CrossRef] [Scilit] [PubMed]
- Morse, N.B.; Pellissier, P.A.; Cianciola, E.N.; Brereton, R.L.; Sullivan, M.M.; Shonka, N.K.; Wheeler, T.B.; McDowell, W.H. Novel ecosystems in the Anthropocene: A revision of the novel ecosystem concept for pragmatic applications. Ecol. Soc. 2014, 19, 12. [Google Scholar] [CrossRef] [Scilit]
- Dietz, T. Drivers of Human Stress on the Environment in the Twenty-First Century. Annu. Rev. Environ. Resour. 2017, 42, 189–213. [Google Scholar] [CrossRef] [Scilit]
- Rendon, P.; Erhard, M.; Maes, J.; Burkhard, B. Analysis of trends in mapping and assessment of ecosystem condition in Europe. Ecosyst. People 2019, 15, 156–172. [Google Scholar] [CrossRef] [Scilit]
- Ouyang, Z.; Zheng, H.; Xiao, Y.; Polasky, S.; Liu, J.; Xu, W.; Wang, Q.; Zhang, L.; Xiao, Y.; Rao, E.; et al. Improvements in ecosystem services from investments in natural capital. Science 2016, 352, 1455–1459. [Google Scholar] [CrossRef] [Scilit]
- Zhao, Y.; Zhang, X.; Wu, Q.; Huang, J.; Ling, F.; Wang, L. Characteristics of Spatial and Temporal Changes in Ecosystem Service Value and Threshold Effect in Henan Along the Yellow River, China. Ecol. Indic. 2024, 166, 112531. [Google Scholar] [CrossRef] [Scilit]
- Anaya-Romero, M.; Muñoz-Rojas, M.; Ibáñez, B.; Marañón, T. Evaluation of Forest Ecosystem Services in Mediterranean Areas. A Regional Case Study in South Spain. Ecosyst. Serv. 2016, 20, 82–90. [Google Scholar] [CrossRef] [Scilit]
- Gu, Z.; Ji, K.; Li, Z.; Xu, G.; Li, A.; Shen, Y.; Yao, C.; Yang, B. Spatiotemporal Variations of Vegetation and Its Response to Climate Change and Human Activities in Loess Hilly Area of Western Henan Province, China. Front. Ecol. Evol. 2025, 13, 1597342. [Google Scholar] [CrossRef] [Scilit]
- Ji, X.; Sun, Y.; Guo, W.; Zhao, C.; Li, K. Land Use and Habitat Quality Change in the Yellow River Basin: A Perspective with Different CMIP6-Based Scenarios and Multiple Scales. J. Environ. Manag. 2023, 345, 118729. [Google Scholar] [CrossRef] [Scilit]
- Li, M.; Zhang, J.; Gao, H.; Ji, G.; Li, G.; Li, L.; Li, Q. Spatiotemporal Variation Characteristics of Ecosystem Carbon Storage in Henan Province and Future Multi-Scenario Simulation Prediction. Land 2024, 13, 185. [Google Scholar] [CrossRef] [Scilit]
- Xiao, Y.; Wang, Q.; Tong, X.; Atkinson, P.M. Thirty-meter map of young forest age in China. Earth Syst. Sci. Data 2023, 15, 3365–3386. [Google Scholar] [CrossRef] [Scilit]
- Hall, R.J.; Castilla, G.; White, J.C.; Cooke, B.J.; Skakun, R.S. Remote sensing of forest pest damage: A review and lessons learned from a Canadian perspective. Can. Entomol. 2016, 148, S296–S356. [Google Scholar] [CrossRef] [Scilit]
- Wang, D.; Ren, P.; Xia, X.; Fan, L.; Qin, Z.; Chen, X.; Yuan, W. National forest carbon harvesting and allocation dataset for the period 2003 to 2018. Earth Syst. Sci. Data 2024, 16, 2465–2481. [Google Scholar] [CrossRef] [Scilit]
- Zhang, H.; Lei, X.; Zhang, C.; Zhao, X.; Hu, X. Research on theory and technology of forest quality evaluation and precision improvement. J. Beijing For. Univ. 2019, 41, 1–18. [Google Scholar]
- Hasani, M.; Pielesiak, I.; Mahiny, A.S.; Mikaeili, A. Regional ecosystem health assessment based on landscape patterns and ecosystem services approach. Acta Ecol. Sin. 2023, 43, 333–342. [Google Scholar] [CrossRef] [Scilit]
- Chen, S.; Liu, X.; Yang, L.; Zhu, Z. Variations in Ecosystem Service Value and Its Driving Factors in the Nanjing Metropolitan Area of China. Forests 2023, 14, 113. [Google Scholar] [CrossRef] [Scilit]
- Xu, T.; Niu, X.; Wang, B. Spatial patterns of forest ecosystem services in Liaoning province. Sci. Soil Water Conserv. 2021, 19, 100–107. [Google Scholar]
- Milne, E.; Banwart, S.A.; Noellemeyer, E.; Abson, D.J.; Ballabio, C.; Bampa, F.; Bationo, A.; Batjes, N.H.; Bernoux, M.; Bhattacharyya, T.; et al. Soil carbon, multiple benefits. Environ. Dev. 2015, 13, 33–38. [Google Scholar] [CrossRef] [Scilit]
- Hao, T.; Wng, B.; Niu, X.; Liu, S.; Yu, G. Practice and Thinking of Comprehensively Improving the Quality and Stability of Forest Ecosystem in China. Terr. Ecosyst. Conserv. 2022, 2, 13–31. [Google Scholar]
- Gao, J.; Cai, M.Y.; Zhang, X.S.; Shen, W.M.; Shi, X.W.; Xiao, R.L. Research on the method and application of large-scale ecological disturbance risk assessment. China Environ. Sci. 2021, 41, 5274–5281. [Google Scholar]
- Li, Y.; Wang, K.; Liu, W.; Wang, S.; Zhang, D. County forest ecological security evaluation and spatial econometric analysis in Jiangsu Province. Acta Ecol. Sin. 2019, 39, 202–215. [Google Scholar] [CrossRef] [Scilit]
- Linares, J.C.; Carreira, J.A.; Ochoa, V. Human impacts drive forest structure and diversity. Insights from Mediterranean mountain forest dominated by Abies pinsapo (Boiss.). Eur. J. For. Res. 2011, 130, 533–542. [Google Scholar] [CrossRef] [Scilit]
- Tang, X.; Song, X.; Zeng, Y.; Zhang, D. Evaluation and spatio-temporal evolution of forest ecological security in the Yangtze River Economic Belt. Acta Ecol. Sin. 2021, 41, 1693–1704. [Google Scholar] [CrossRef] [Scilit]
- Liu, Z.; Wu, Z.; Ma, L. Spatial-temporal characteristics and causes of forest ecological safety in Fujian Province. Fujian Trib. 2022, 39, 97–107. [Google Scholar]
- Majeed, I.; Das, B.S. Large-Scale Mapping of Soil Quality Index in Different Land Uses Using Airborne Hyperspectral Data. IEEE Trans. Geosci. Remote Sens. 2024, 62, 5514211. [Google Scholar] [CrossRef] [Scilit]
- Tang, X.; Liu, F.; Hu, X.; Feng, J. Assessment of Ecological Carrying Capacity and Spatiotemporal Evolution Analysis for Arid Areas Based on the AHP-EW Model: A Case Study of Urumqi, China. Land 2025, 14, 1143. [Google Scholar] [CrossRef] [Scilit]
- Feng, J.; Wang, J.; Yao, S.; Ding, L. Dynamic assessment of forest resources quality at the provincial level using AHP and cluster analysis. Comput. Electron. Agric. 2016, 124, 184–193. [Google Scholar] [CrossRef] [Scilit]
- Yi, Z.; Cao, X.; Qin, L. Evaluation of Socially and Culturally Coordinated Development in Cities of Yangtze River Economic Belt and Its Spatial Correlation. Land 2025, 14, 1226. [Google Scholar] [CrossRef] [Scilit]
- Zhang, B.; Li, J.; Tian, W.; Chen, H.; Kong, X.; Chen, W.; Zhao, M.; Xia, X. Spatio-Temporal Variances and Risk Evaluation of Land Finance in China at the Provincial Level from 1998 to 2017. Land Use Policy 2020, 99, 104804. [Google Scholar] [CrossRef] [Scilit]
- Chen, Y. An Analytical Process of Spatial Autocorrelation Functions Based on Moran’s Index. PLoS ONE 2021, 16, e0249589. [Google Scholar] [CrossRef] [Scilit]
- Bivand, R.S.; Wong, D.W.S. Comparing implementations of global and local indicators of spatial association. TEST 2018, 27, 716–748. [Google Scholar] [CrossRef] [Scilit]
- Wolf, L.J. Confounded Local Inference: Extending Local Moran Statistics to Handle Confounding. Ann. Am. Assoc. Geogr. 2024, 114, 1216–1231. [Google Scholar] [CrossRef] [Scilit]
- Anselin, L. Local Indicators of Spatial Association—LISA. Geogr. Anal. 1995, 27, 93–115. [Google Scholar] [CrossRef] [Scilit]
- Fang, Z.; Ding, T.; Chen, J.; Xue, S.; Zhou, Q.; Wang, Y.; Wang, Y.; Huang, Z.; Yang, S. Impacts of land use/land cover changes on ecosystem services in ecologically fragile regions. Sci. Total Environ. 2022, 831, 154967. [Google Scholar] [CrossRef] [Scilit] [PubMed]
- Bagstad, K.J.; Johnson, G.W.; Voigt, B.; Villa, F. Spatial dynamics of ecosystem service flows: A comprehensive approach to quantifying actual services. Ecosyst. Serv. 2013, 4, 117–125. [Google Scholar] [CrossRef] [Scilit]
- Logsdon, R.A.; Chaubey, I. A quantitative approach to evaluating ecosystem services. Ecol. Model. 2013, 257, 57–65. [Google Scholar] [CrossRef] [Scilit]
- Ding, T.; Fang, L.; Chen, J.; Ji, J.; Fang, Z. Exploring the relationship between water-energy-food nexus sustainability and multiple ecosystem services at the urban agglomeration scale. Sustain. Prod. Consum. 2023, 35, 184–200. [Google Scholar] [CrossRef] [Scilit]
- Amirruddin, A.D.; Muharam, F.M.; Ismail, M.H.; Ismail, M.F.; Tan, N.P.; Karam, D.S. Hyperspectral Remote Sensing for Assessment of Chlorophyll Sufficiency Levels in Mature Oil Palm (Elaeis Guineensis) Based on Frond Numbers: Analysis of Decision Tree and Random Forest. Comput. Electron. Agric. 2020, 169, 105221. [Google Scholar] [CrossRef] [Scilit]
- Mengjuan, Q.; Luo, G.; Wenshu, L.; Weiyin, W.; Chunqian, J.; Yanfeng, B. Climate Drivers of Forest Ecosystem Services Supply in the Hilly Mountainus Regions of Southern China Based on SHAP-Enhanced Machine Learning. Ecol. Indic. 2025, 178, 114085. [Google Scholar] [CrossRef] [Scilit]
- Messier, C.; Bauhus, J.; Sousa-Silva, R.; Auge, H.; Baeten, L.; Barsoum, N.; Bruelheide, H.; Caldwell, B.; Cavender-Bares, J.; Dhiedt, E.; et al. For the Sake of Resilience and Multifunctionality, Let’s Diversify Planted Forests! Conserv. Lett. 2022, 15, e12829. [Google Scholar] [CrossRef] [Scilit]
- Schröter, M.; Barton, D.N.; Remme, R.P.; Hein, L. Accounting for capacity and flow of ecosystem services: A conceptual model and a case study for Telemark, Norway. Ecol. Indic. 2014, 36, 539–551. [Google Scholar] [CrossRef] [Scilit]
- Schröter, M.; Remme, R.P.; Hein, L. How and where to map supply and demand of ecosystem services for policy-relevant outcomes? Ecol. Indic. 2012, 23, 220–221. [Google Scholar] [CrossRef] [Scilit]
- Fisher, B.; Kerry Turner, R. Ecosystem Services: Classification for Valuation. Biol. Conserv. 2008, 141, 1167–1169. [Google Scholar] [CrossRef] [Scilit]
- Zou, Z.; Luo, S.; Duan, P. Dynamic Assessment and Zoning Strategies for Ecosystem Health in Poyang Lake Urban Agglomeration. Sci. Rep. 2025, 15, 21956. [Google Scholar] [CrossRef] [Scilit]
- Gu, L.; Gong, Z.; Bu, Y. Forest Quality Dynamic Change and Its Driving Factors Accompanied by Forest Transition in China. Forests 2021, 12, 733. [Google Scholar] [CrossRef] [Scilit]
- Lan, J.; Lei, X.; He, X.; Gao, W.; Guo, H. Stand Density, Climate and Biodiversity Jointly Regulate the Multifunctionality of Natural Forest Ecosystems in Northeast China. Eur. J. For. Res. 2023, 142, 493–507. [Google Scholar] [CrossRef] [Scilit]
- Liu, L.; Wang, J.; Li, J.; He, S.; Lan, Y.; Liu, F. Evaluation of Ecosystem Service Capacity Using the Integrated Ecosystem Services Index at Optimal Scale in Central Yunnan, China. Ecol. Evol. 2025, 15, e71222. [Google Scholar] [CrossRef] [Scilit]
- Tong, X.; Brandt, M.; Yue, Y.; Zhang, X.; Fensholt, R.; Ciais, P.; Wang, K.; Liu, S.; Zhang, W.; Mao, C.; et al. Reforestation Policies Around 2000 in Southern China Led to Forest Densification and Expansion in the 2010s. Commun. Earth Environ. 2023, 4, 260. [Google Scholar] [CrossRef] [Scilit]
- Wang, X.-Y.; Zhao, C.-Y.; Jia, Q.-Y. Impacts of Climate Change on Forest Ecosystems in Northeast China. Adv. Clim. Change Res. 2013, 4, 230–241. [Google Scholar] [CrossRef] [Scilit]
- Hua, F.; Bruijnzeel, L.A.; Meli, P.; Martin, P.A.; Zhang, J.; Nakagawa, S.; Miao, X.; Wang, W.; McEvoy, C.; Peña-Arancibia, J.L.; et al. The Biodiversity and Ecosystem Service Contributions and Trade-Offs of Forest Restoration Approaches. Science 2022, 376, 839–844. [Google Scholar] [CrossRef] [Scilit]
- Cheng, K.; Wu, J.; Ma, X.; Wu, L. Simulation of Carbon Sink of Arbor Forest Vegetation in Henan Province of China Based on CO2FIX Model. Land 2023, 12, 246. [Google Scholar] [CrossRef] [Scilit]
- Winkel, G.; Lovrić, M.; Muys, B.; Katila, P.; Lundhede, T.; Pecurul, M.; Pettenella, D.; Pipart, N.; Plieninger, T.; Prokofieva, I.; et al. Governing Europe’s Forests for Multiple Ecosystem Services: Opportunities, Challenges, and Policy Options. For. Policy Econ. 2022, 145, 102849. [Google Scholar] [CrossRef] [Scilit]
- Zhang, Y.; Su, T.; Ma, Y.; Wang, Y.; Wang, W.; Zha, N.; Shao, M. Forest ecosystem service functions and their associations with landscape patterns in Renqiu City. PLoS ONE 2022, 17, e0265015. [Google Scholar] [CrossRef] [Scilit]
- Führer, E. Forest functions, ecosystem stability and management. For. Ecol. Manag. 2000, 132, 29–38. [Google Scholar] [CrossRef] [Scilit]
- Serban, C.; Maftei, C. Remote Sensing Evaluation of Drought Effects on Crop Yields Across Dobrogea, Romania, Using Vegetation Health Index (VHI). Agriculture 2025, 15, 668. [Google Scholar] [CrossRef] [Scilit]

Disclaimer/Publisher’s Note: The statements, opinions and data contained in all publications are solely those of the individual author(s) and contributor(s) and not of MDPI and/or the editor(s). MDPI and/or the editor(s) disclaim responsibility for any injury to people or property resulting from any ideas, methods, instructions or products referred to in the content. |
© 2026 by the authors. Licensee MDPI, Basel, Switzerland. This article is an open access article distributed under the terms and conditions of the Creative Commons Attribution (CC BY) license.