


Abstract
Soil health and agricultural sustainability are primarily threatened by organic matter depletion and a decline in biodiversity. To mitigate these processes, managing set-aside systems remains a simple practice to preserve biodiversity and functions essential to soil fertility. The objective of this study was to evaluate the effectiveness of medium-term set-aside management in preventing soil degradation using changes in microbial and microarthropod communities, both of which are involved in organic matter degradation. Three different set-aside managements, with mowing (May or July) and without mowing, were compared to conventional rotation in three sites located in North, Central, and South Italy. The microbial community was analyzed through both biochemical methods, such as the assessment of soil respiration and microbial biomass, and molecular techniques, such as Denaturing Gradient Gel Electrophoresis. Soil fertility was assessed by the Biological Fertility Index, while soil biodiversity was assessed with microbial and microarthropod indicators. All set-aside management showed a statistically significant separation from conventional crop rotation for both microbial and microarthropod communities. Indicators highlighted a lower efficiency of set-aside management in organic matter use compared to conventional crop rotation, while microbial and microarthropod biodiversity increased in all set-aside managements. The QBS-ar index showed good soil quality standards in each set-aside management, benefiting the euedaphic microarthropods, whereas soil microbial respiration highlighted a higher microbial activity in the same experimental context.
1. Introduction
In recent decades, the expansion of intensive agriculture has exerted increasing pressure on soil ecosystems, altering belowground biological communities [1,2]. The intensive use of mineral fertilizers and pesticides, deep mechanical tillage, and simplified crop rotations have been associated with either a reduction in the diversity and abundance of soil microarthropods or with effects on the structure as well as functional capacity of microbial communities [3,4]. Soil biodiversity represents one of the fundamental pillars of agroecosystem functioning and biological soil fertility, including a wide range of organisms ranging from microorganisms to soil-dwelling invertebrates. Soil microbial biodiversity plays a key role in biogeochemical cycles, soil fertility, and the sustainability of agricultural production [5,6]. Microbial communities regulate essential processes such as organic matter decomposition, nutrient mineralization, nitrogen fixation, and soil structure formation [7,8]. However, these processes do not occur in isolation but are closely interconnected with the activity of soil fauna. Soil microarthropods represent a fundamental component of the belowground biodiversity and play a key role in controlling microbial communities and regulating ecosystem processes [9,10]. Through litter fragmentation, soil mixing, and selective predation on bacteria and fungi, microarthropods influence nutrient availability and organic matter dynamics, thereby enhancing microbial activity and promoting the stabilization of soil aggregates [11,12]. The loss of soil biodiversity, encompassing both microorganisms and arthropods, can compromise agroecosystem resilience, reducing soil ability to provide essential ecosystem services and increasing reliance on external inputs to sustain agricultural productivity [13,14]. In this context, agricultural policies play a critical role in shaping land management practices and their impacts on soil biodiversity. The Common Agricultural Policy (CAP) 2023–2027 of the European Union represents a key framework aimed at promoting sustainable agriculture, explicitly recognizing soil protection and biodiversity conservation as strategic objectives. Nine Good Agricultural and Environmental Condition (GAEC) standards have been defined within the CAP. Specifically, GAEC Standard 8 is designed to protect soil biological communities and enhance biodiversity through the maintenance, at farm level, of a proportion of arable land to non-productive areas and features. There are several agronomic techniques suitable to comply with this standard, including ecological set-aside, crop rotations, pastures or cover cropping. The set-aside has been widely applied in Europe from 1988 to 2008, but its actual effectiveness in maintaining or enhancing soil biodiversity is still a matter of controversy. Recent studies highlight how set-aside practices may contribute to mitigate the simplification of soil food webs induced by intensive farming, thus enhancing resistance to environmental stressors such as climate change, soil degradation, and long-term fertility decline [15,16]. Several authors studied the effect of set-aside on the soil microarthropod community, which evidenced an increase in terms of abundance and diversity of the populations and a better soil biological quality [17,18,19]. In a Mediterranean agroecosystem, set-aside practices have been shown to affect microbial communities and modify the composition of microarthropod community, highlighting the importance of land-use and disturbance regimes in shaping soil microbial and microarthropod populations [20]. Mocali et al. [21] investigated the effects of set-aside management on soil microbial communities and ground-dwelling arthropods: results indicated an increase in the abundance and diversity of microarthropod populations, whereas no significant differences in microbial biodiversity were highlighted between set-aside and conventional land.
The aim of this work was to evaluate the potential effectiveness of different medium-term set-aside management systems on the biological fertility of soil across different geographical areas of Italy. The experimental sites were located in North, Central and South Italy with different soils and climate conditions. Three set-aside management systems, with mowing in May or July and without mowing, were compared to conventional rotation. The effect of the set-aside management was evaluated by (i) the soil microbial activity and biodiversity indicators, (ii) the soil microarthropod structure and biodiversity indicators, and (iii) the relationship between environmental variables and biological indicators. The hypothesis of this study was that set-aside management may improve the soil biological fertility as well as bacterial and microarthropods biodiversity.
2. Materials and Methods
2.1. Site and Treatment Description
The selected experimental fields used in this study were located in Caorle (Veneto, North Italy), Fagna (Tuscany, Central Italy), and Metaponto (Basilicata, South Italy). They had been managed as set-aside since 2008, after being previously used for cereal crops with various conventional rotations. Specifically, the Caorle experimental site was selected in the farm “Valle Vecchia” of Veneto Agricoltura (45°37′51.21″ N–12°58′10.29″ E) on a lagoon plain at 1 m a.s.l. According to the Köpper climate types, this area was classified as Cfb (temperate oceanic climate), and the characteristic crop rotation was maize/sorghum (Table S1) [22]. The Fagna experimental site was located in the “Centro Sperimentale di Fagna” farm of CREA in Scarperia, Florence (43°58′53.28″ N–11°21′01.15″ E), on a hill at 253 m a.s.l. The climate was classified as Cfa (Humid Subtropical Climate), and the wheat or barley (1 year)/alfalfa (4 years) rotation was applied. The Metaponto experimental site was located in the farm “Pantanello” of CREA in Metaponto, Matera (40°23′12.13″ N–16°47′40.08″ E), on a plain at 4 m a.s.l. The climate is classified as Csa (Hot-Summer Mediterranean Climate), and the durum wheat (3 years)/fallow (1 year) rotation was applied. Soil chemical properties for each site were reported in Table 1.
Table 1.
Soil chemical properties of the topsoil (0–20 cm) in Caorle, Fagna, and Metaponto sites after five years of set-aside application. CR, crop rotation; MJ, set-aside with mowing in July; MM, set-aside with mowing in May; NM, set-aside without mowing.
The same experimental design was applied in each site to compare three different set-aside management systems with the conventional crop rotation: (i) set-aside with mowing in May (MM) without removing the vegetation cover (agronomically more suitable period, but not allowed by the Directive 147/2009 CE to encourage bird breeding); (ii) set-aside with mowing in July (MJ), avoiding the removal of the vegetation cover (an agronomically less suitable period, but permitted by the Directive 147/2009 CE to encourage bird breeding); (iii) set-aside without mowing (NM), with “wild” plots (without mowing) and thus similar to the abandonment; (iv) conventional crop rotation (CR), specific to each site and characterized by different degrees of soil disturbance (as reported above). The total experimental area in each site was 2 ha (corresponding to 0.5 ha per treatment) with an ecotonal belt on at least one side.
2.2. Soil Sampling Design
In each study area, in 2012 and 2013, corresponding to the final years of the experiment (years 4 and 5), soil samples were collected in spring (before mowing) and autumn (after mowing) at three different points in each plot, spaced at approximately 20 m, 40 m, and 60 m from the ecotonal belt. For each examined parameter, three samples were collected for every four treatments and four times, corresponding to a total of 48 samples.
To characterize microbial biomass, respiration, and eubacterial biodiversity, soil samples were taken at 0–20 cm depth. To characterize the soil microarthropod structure, an additional set of soil samples was collected close to the previous ones. The sampling was performed using a special 10 cm3 corer for mesofauna sampling, as reported by Parisi et al. [23]. Soil samples were placed in a plastic bag and stored at 4 °C for microbial samples and at room temperature for microarthropod samples. A sub-sample of about 50 g was prepared from each soil sample and stored at −20 °C for the molecular analysis.
2.3. Soil Microbial Community Analysis
The direct extraction of DNA from the soil was carried out using the FastDNA® SPIN Kit for Soil (MP Biomedicals, Irvine, CA, USA) following the manufacturer’s instructions. The extracted DNA was amplified using bacterial 16S rDNA (GC986f–UNI1401r) [24]-specific primers. Amplification reactions were performed according to Baiano et al. [25]. DGGE analysis was performed with the INGENYphorU-2 System (Ingeny International BV, Goes, The Netherlands) loading 500 ng of amplified DNA on a 6% polyacrylamide gel (acrylamide/bis ratio 37.5:1) under denaturation conditions (urea, 7 mol L−1; 40% formamide with a denaturing gradient ranging from 42 to 58%). The gels were run in 1× TAE buffer at 80 V for 17 h at a temperature of 60 °C and stained with SYBR® Green (Molecular Probes®, Eugene, OR, USA; dilution 1:10.000 in 1× Tris-acetate-EDTA—TAE—buffer) for 30 min in the dark. Digital pictures were performed using a ChemiDoc™ Imaging System (BioRad, Hercules, CA, USA). The richness of the obtained bacterial DGGE bands (S_bact), together with biodiversity indices (Shannon diversity, H_bact; evenness, J_bact; Simpson dominance, D_bact), were calculated.
Regarding microbial activity indices, microbial respiration was assessed according to Isermeyer [26]; soil respiration was expressed as mg C-CO2 kg−1 soil d−1 and measured in a closed environment after 1, 3, 7, 10, 15, 21, and 28 days for each soil using DL50-Rondolino titrator (Mettler Toledo, Columbus, OH, USA). Cumulative respiration (CumR) represents the amount of total C-CO2 production after 28 days of incubation. Basal respiration (BasR) represents the value of mineralized C in a definite period when a steady-state condition has been reached (this condition is established when the CO2 production rate does not change over time, under constant conditions, generally after 28 days). Microbial biomass carbon MBC (mg C kg−1 soil) was measured by the fumigation extraction method on air-dried soils which were conditioned at −33 kPa water tension and preincubated for 10 days in open glass jars at 30 °C. The extraction solution was K2SO4 0.5 M, and the calculation formula was MBC (g C/g soil) = EC × 2.64, where EC is the difference between the amount of C of fumigated and non-fumigated soils [27]. Several derived parameters were then calculated in accordance with Mocali et al. [28]: (i) qCO2 (metabolic quotient), calculated by the ratio BasR/MBC [(mg C-CO2 basal mg MBC−1) h−1]; (ii) qM (mineralization quotient), expressed as mg C-CO2 kg−1 soil h−1 and calculated from cumulative respiration after 28 days by the relationship: CumR/TOC; (iii) the Biological Fertility Index (BFI) was calculated as proposed by Renzi et al. [29], and here briefly reported: BFI = BasR + CumR + MBC + SOM + qCO2 + qM, where SOM (%) is soil organic matter, obtained from TOC multiplied by a conversion factor of 1.724. The biological fertility index is scored in increasing classes of soil fertility. Class I, BFI < 9, is stressed soils with very low fertility; class II, 9 < BFI < 12, is pre-stressed soils; class III, 13 < BFI < 18, is intermediate fertility soils; class IV, 19 < BFI < 24, is good fertility soils; and class V, BFI > 24, is very high fertility soils.
2.4. Soil Microarthropod Community Analysis
Microarthropods were extracted using modified Berlese–Tullgren funnels following the standard methodology [23], observed at the stereomicroscope, and identified at the order level. The edaphic microarthropod communities were characterized using the (i) individual abundance (I_meso), (ii) richness (S_meso) determined by counting the number of taxa, (iii) biodiversity indices (Shannon diversity, H_meso; evenness, J_meso; Simpson dominance, D_meso), and (iv) soil biological quality (QBS-ar index) according to Parisi et al. [23] in order to evaluate the soil biological quality by arthropod adaptation to the edaphic habitat.
2.5. Multi-Level Biotic Response Statistical Analysis
For each site, the overall effect of treatment on the microbial and microarthropod community and activity indices were tested using the Kruskal–Wallis test. For statistically significant results (p-value < 0.05), pairwise differences between treatments were tested using Dunn’s post hoc test with Benjamini–Hochberg (BH) multiple comparison correction.
Multivariate methods were performed to assess variation in soil biota indices (i.e., microbial activity, bacterial and microarthropods diversity) and soil physicochemical properties in different experimental contexts with different set-aside managements. Non-metric multidimensional scaling ordinations (NMDS) on the Euclidean distance matrix on the obtained indices and soil properties were performed using the vegan (version 2.6-6.1) [30] R package [31]; to remove scale effect between different indices, each value was divided by the maximum value of that variable, using decostand() command in the vegan package (method = max; margin = 2). The effect of different experimental factors on the multivariate set of indices was tested using PERMANOVA with 999 permutations. The overall analysis, integrating soil biota indices, environmental parameters (soil physicochemical properties) and experimental factors (year, season, management, site), was obtained using Multi Factor Analysis (MFA) obtained with the FactoMineR package (version 2.11) [32]. In addition, within sites, Canonical Correspondence Analysis (CCA) was performed using all soil biota indices with respect to experimental/environmental constraints (sand, clay, EC, pH, TOC, Olsen P, and management) using the vegan R package. Management was converted to 4 numerical pseudo-variables for the analysis. The model and terms significance was assessed using ANOVA, while the contribution of constrains to the canonical axes was assessed using canonical regression coefficients obtained with the scores() function in vegan. During model fitting, one of the constrains (NM management) was automatically excluded by the cca() function because it was aliased with the constrains of other management practices due to high collinearity.
3. Results
3.1. Bacterial Community and Microbial Activity Indices
The results of bacterial diversity and microbial activity are reported in Table 2. Overall, samples from the Caorle, Fagna, and Metaponto sites showed a high degree of similarity in terms of bacterial diversity. All biodiversity indices (S_bact, J_bact, H_bact, and D_bact) displayed very similar values across all management practices and sites.
Table 2.
Bacterial community and microbial activity indices in soils managed with different practices (CR, crop rotation; MJ, mowing in July; MM, mowing in May, NM, no mowing) in the three sites. Table reports mean (and standard error in brackets) of each variable–management combination in the three different sites. The effect of the different management practices on the indices was assessed using the Kruskal–Wallis test and p-values were reported in table (column KW p-value). For significant results (evidenced in bold) a post hoc comparison between different management practices was performed using the Dunn test with Benjamini–Hochberg correction for multiple testing. Results of the Dunn test are reported as letter notations.
At the Caorle site, no significant differences were detected among treatments for microbial biomass carbon (MBC), basal respiration (BasR), cumulative respiration (CumR), qCO2, or the biological fertility index (BFI). In contrast, qM values were significantly higher in MJ and NM soils than in CR and MM soils (Table 1; p < 0.05). Specifically, MJ and NM soils showed qM values ranging from 4.405 to 4.823, with no significant difference between them, whereas lower and comparable values were observed in CR (2.892) and MM (2.924).
In Fagna, microbial respiration parameters varied among management systems. Soils under conventional crop rotation (CR) exhibited the lowest CumR value (311.009 mg C–CO2 mg−1 soil), which was significantly lower than those observed in the other treatments (Table 1; p < 0.001). In contrast, MJ, MM, and NM soils showed higher CcumR values than CR soils (+42.7%, +62.5%, and +50.3%, respectively), and BFI followed a similar pattern. No significant differences were observed in basal respiration across treatments. The lowest qM value was recorded in CR soils (3.343), although it did not differ significantly from MJ (3.914) and NM (4.163). Notably, qM values in NM soils were comparable to the highest values observed under MM management (4.702). Consistently, BFI reached its highest value under MM management (+17.5% compared to CR), while MJ and NM soils also showed higher BFI values (+14.0% and +14.6%, respectively).
At the Metaponto site (Table 2), microbial respiration differed significantly among management systems for both basal (p < 0.05) and cumulative respiration (p < 0.01). BasR ranged from a minimum of 6.953 mg C–CO2 mg−1 soil in CR soils to a maximum of 11.313 mg C–CO2 mg−1 soil under MJ management (+62.7% compared to CR). Similarly, MM and NM soils exhibited significantly higher BasR values than CR soils (+58.7% and +49.8%, respectively). The lowest CumR value was again observed in CR soils, whereas significantly higher values were recorded under MJ (+69.1%), MM (+94.4%), and NM (+67.4%) management. Accordingly, the lowest BFI value was found in CR soils (14.833), while it increased significantly under MJ (+23.6%), MM (+25.8%), and NM (+23.0%) management (p < 0.01).
3.2. Microarthropod Structure Community and Biodiversity Indices
Twenty-one different microarthropod taxa were identified in soil samples collected in the three sites. MDS analysis of microarthropod abundance showed a spatial separation between set-aside management systems (MM, MJ, and NM) and traditional crop rotation in all sites (Figure S1). One-way ANOSIM analysis of microarthropod abundance confirmed these results (Table S2). Specifically, R values were highest in Caorle, ranging from 0.43 (p < 0.0012) in the MJ-CR pairwise comparison to 0.63 in the MM-CR (p < 0.0006) one. In the Fagna site, they ranged from 0.27 (p < 0.0012) for the pairwise comparison of MM-CR and NM-CR to 0.48 (p < 0.0006) for the MJ-CR one. Finally, R values were lowest in the Metaponto site, ranging from 0.32 (p < 0.0048) in the MJ-CR pairwise comparison to 0.35 (p < 0.0012) in the NM-CR one. Total microarthropod abundance was higher in all set-aside management systems than in conventional crop rotation in all sites, although only the Caorle and Fagna sites showed statistically significant differences. Furthermore, the highest abundances were found in the Caorle and Fagna sites, while the lowest abundances were reported in the Metaponto site.
Analysis of taxa abundance relative to the mean Bray–Curtis dissimilarity among these managements using SIMPER showed the highest overall dissimilarity values in the Caorle and Metaponto sites, with 48.26% and 46.25%, respectively (Tables S3–S5). The lowest total dissimilarity value was found in the Fagna site, corresponding to 36.05%. Although the taxa-wise breakdown of similarity showed that a similar number of taxa accounted for 95% of this similarity in each site (Caorle, 12 taxa; Fagna, 14 taxa; Metaponto, 14 taxa), a marked dominance of a few taxa was evident in the Caorle and Metaponto sites. Specifically, Collembola and Hymenoptera were prominent, representing over 60% of the cumulative contribution in the Caorle site, while, in the Metaponto site, Acarina and Collembola, accounted for almost 70% of the entire cumulative contribution. In contrast, in the Fagna site, Acarina and Collembola taxa represented only 45% of the entire cumulative contribution.
The abundance of microarthropod taxa showed some significant differences between the different management systems. In the Caorle site, the abundance of Collembola was higher in MM and NM than in CR; the individuals of Acarina, Isopoda, and Araneae were greater in MM than in the other management systems; the abundance of Diplura and Coleoptera was greater in MJ than in the other management systems. Furthermore, a high number of ants belonging to the species Solenopsis fugax Latreille (Hymenoptera: Formicidae) were found in all set-aside management systems even though they were non-significantly different compared to the CR. Some samples were discarded due to the presence of ant nests. At the Fagna site, the abundance of Acarina was higher in MJ than in CR, while the individuals of Collembola were greater in MM than in CR. Furthermore, the abundance of Isopoda was higher in MM and MJ than in the other management systems. In the Metaponto site, the abundance of Acarina was higher in MM than in CR.
The mean values of the richness (S_meso), Evenness (J_meso), Shannon diversity (H_meso), evenness (J), Simpson Dominance (D_meso), and QBS-ar (Soil Biological Quality—arthropods) indices for each management and related statistical analyses are reported in Table 3. Overall, indices showed similar results across the three sites. S_meso was significantly higher in MM and MJ compared to CR in the Caorle site and also for NM in the other two sites. J_meso was significantly higher in CR and MJ compared to MM and NM in the Caorle site, while it was only significantly higher in CR in the Metaponto site. No significant differences were found in the Fagna site for J_meso. D_meso evidenced significantly higher values in CR than in the other managements and in the Caorle and Metaponto sites; no significant differences were found in the Fagna site for it. On the contrary, H_meso showed contrasting evidence. In fact, in the Caorle and Metaponto sites, their highest values were recorded in CR. In contrast, while in the Fagna site, the highest values were reported in MM and MJ. QBS-ar was always significantly lower in CR than in all the set-aside management systems. Moreover, these values never reached 100, which is the generally accepted value, considered the numeric threshold indicating healthy soil in terms of biodiversity. On the other hand, QBS-ar indicated good soil quality in the other managements, especially in the mowing management systems (MM and MJ).
Table 3.
Microarthropod community indices in soils managed with different practices (CR, crop rotation; MJ, mowing July; MM, mowing May; NM, no mowing) in the three sites. Table reports mean (and standard error in brackets) of each variable–management combination in the three different sites. The effect of the different management practices on the indices was assessed using the Kruskal–Wallis test and p-values were reported in table (column KW p-value). For significant results (evidenced in bold), a post hoc comparison between different management practices was performed using the Dunn test with the Benjamini–Hochberg correction for multiple testing. Results of the Dunn test are reported as letter notations.
3.3. Relationship Between Environmental Variables and Biological Indicators
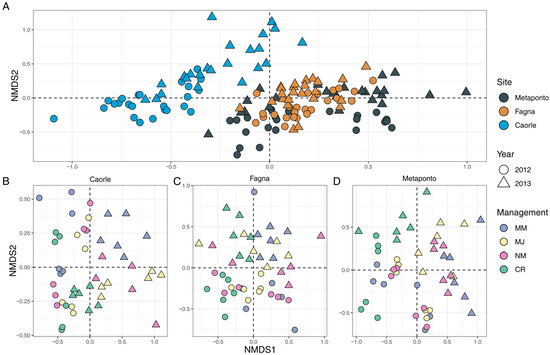
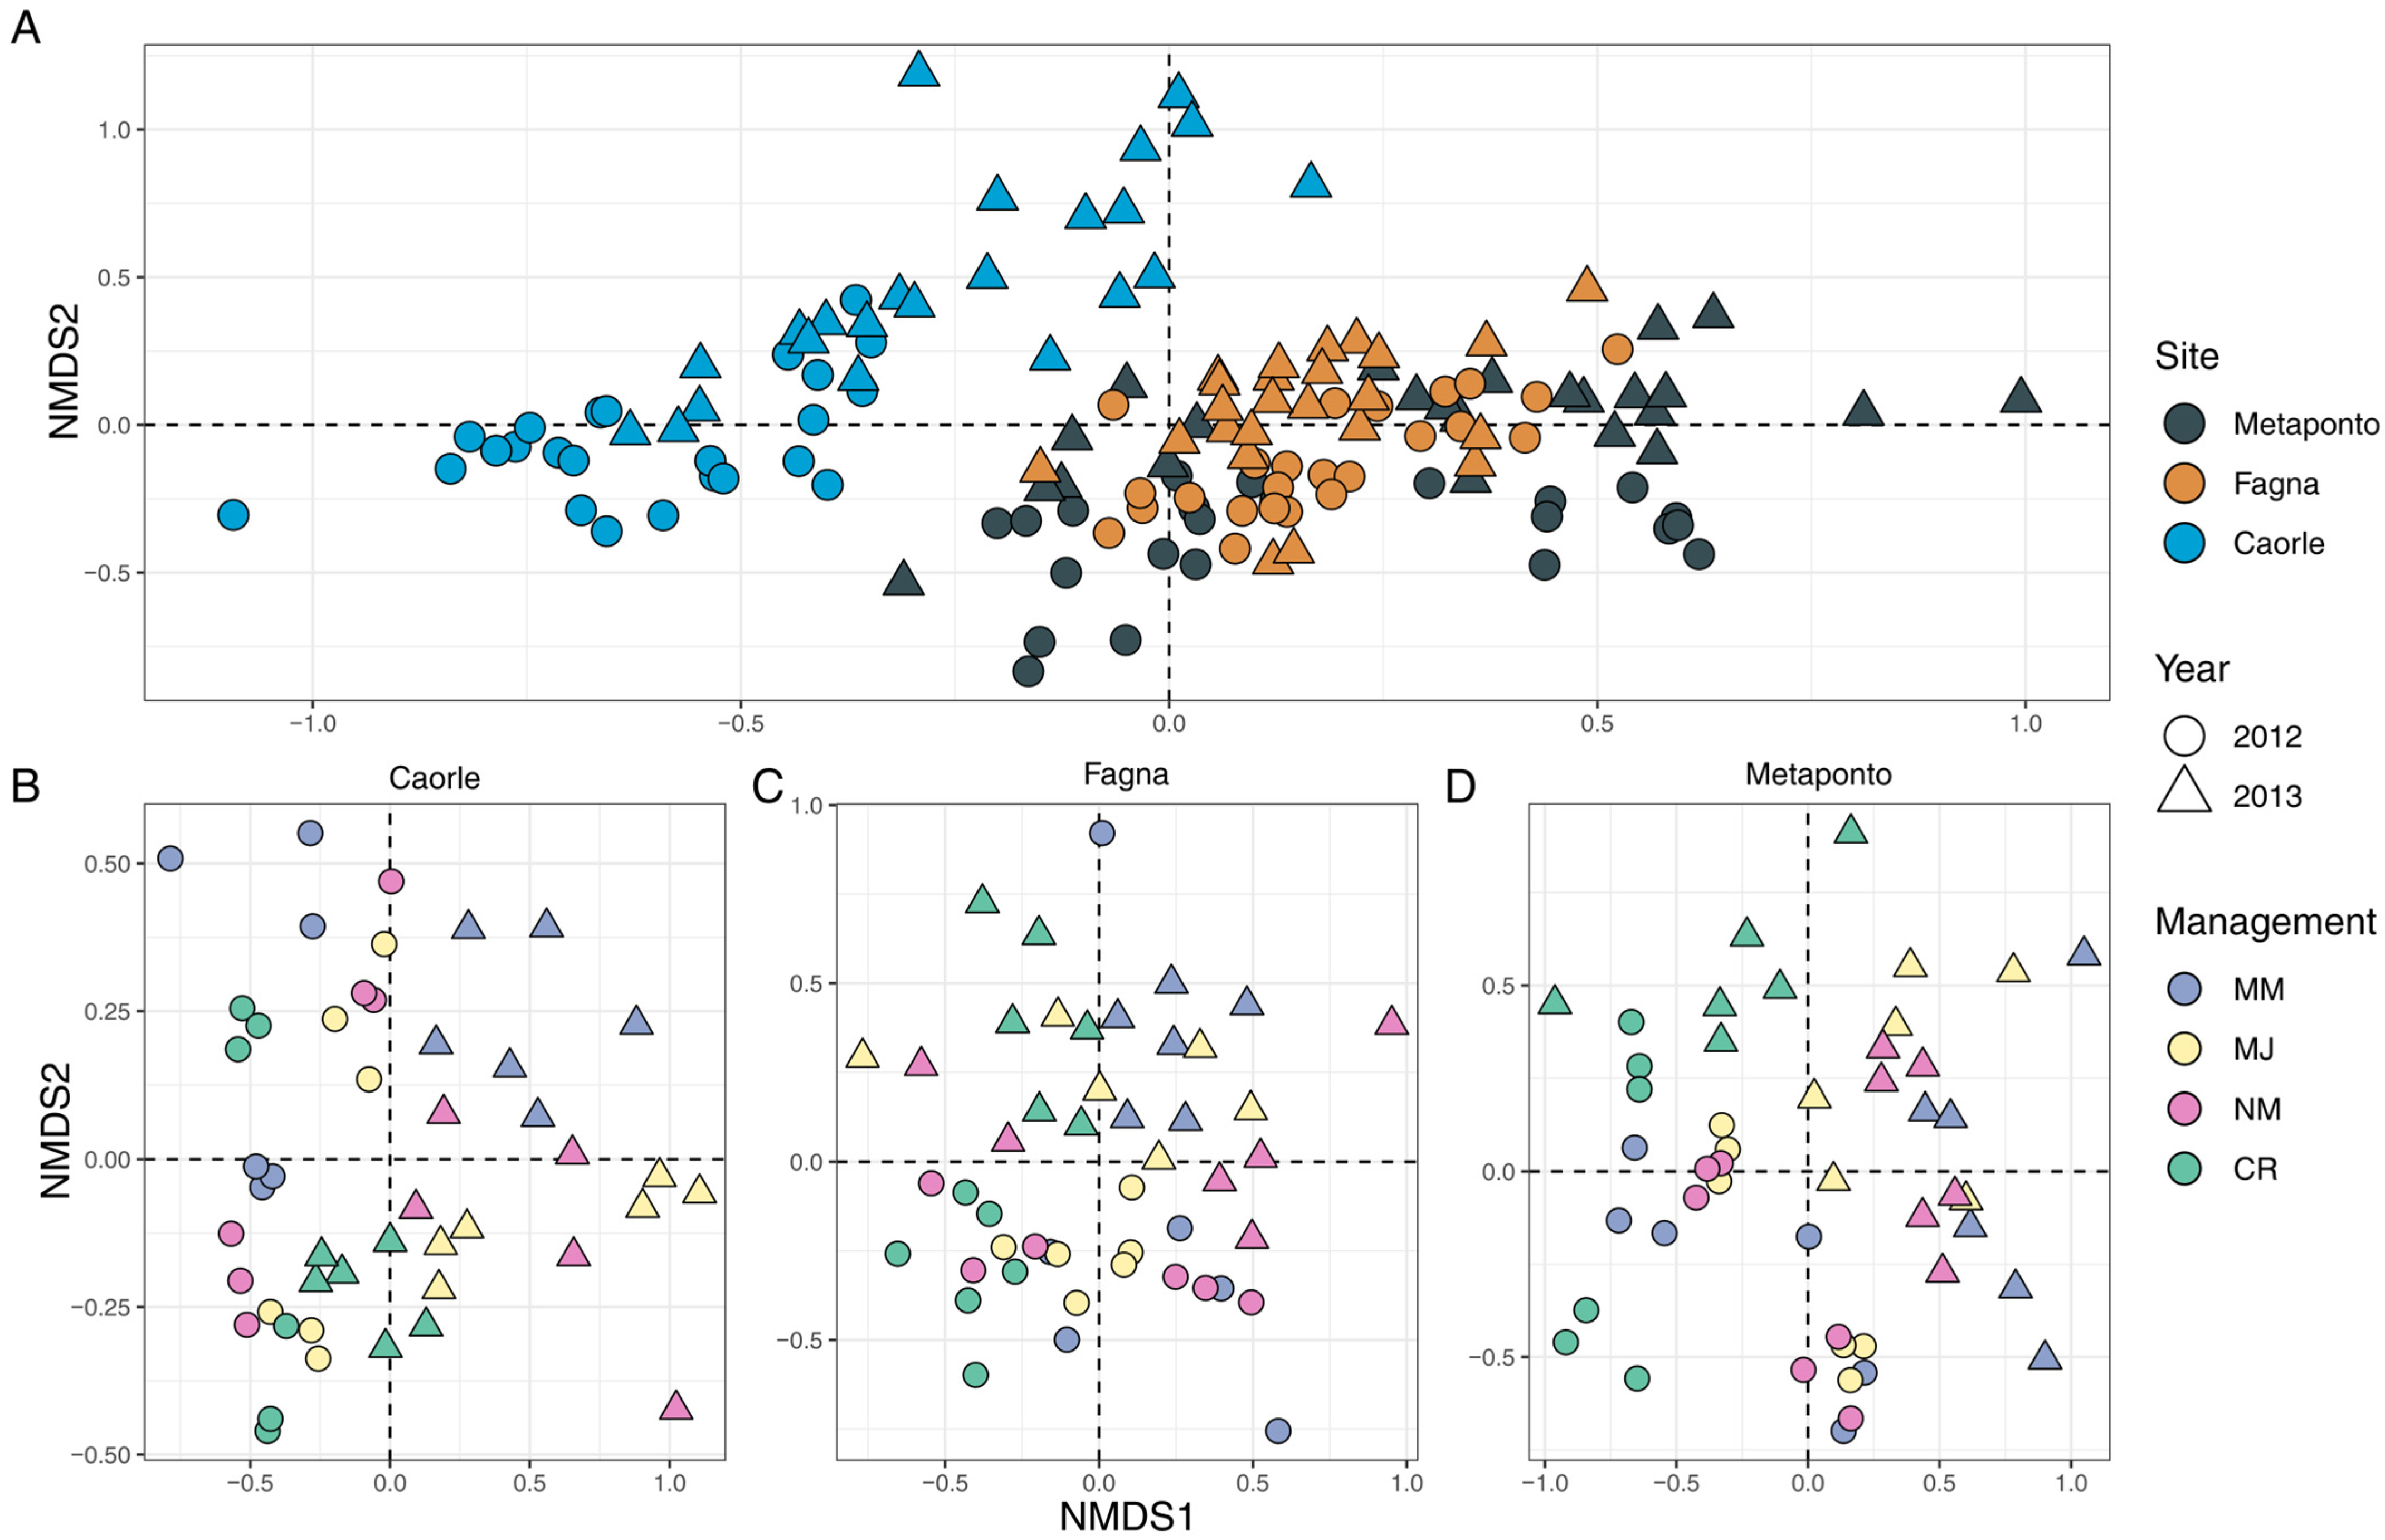
A non-metric multidimensional scaling (NMDS) ordination analysis was performed on all the obtained indices (microbial activity, bacterial and microarthropods diversity) and soil physicochemical properties to obtain a general overview of multivariate relationships between different samples (Figure 1). The sampling site strongly influenced the ordination. Caorle samples were positioned on the negative side of the first ordination axis, whereas samples from Metaponto and Fagna clustered on the positive side (Figure 1A). In addition, a difference was also observed based on the different sampling year. The year effect on the indices results were even more evident in panels B–D of Figure 1, reporting the ordination on the subsets of samples from Caorle, Fagna, and Metaponto, respectively. Samples were always clearly clustered according to the year (shape of point) but also based on management, particularly regarding conventional crop rotation (CR) which appeared separated in respect to the different set-aside management systems (MM, MJ, NM), especially for the Metaponto samples (Figure 1D).
Figure 1.
Non-metric multidimensional scaling ordination (NMDS) of all considered biodiversity indices and soil physicochemical properties. Shape of the points represents sampling year, while color of the points represents the sampling site in panel (A), or the management in the site-specific ordinations in panel (B) (Caorle), (C) (Fagna), and (D) (Metaponto).
The PERMANOVA analysis (Table 4) confirmed these observations. All the tested experimental factors (sampling site, season, year, management) were highly significant on the whole samples group (p-value < 0.001). The sampling site was the most determining factor (R2 = 0.331) while sampling season the least (R2 = 0.038). Also in this case, analysis was additionally performed on the subsets of samples from Caorle, Fagna, and Metaponto. All tested factors were highly significant in Caorle and Metaponto, while the sampling season was not significant in Fagna. Interestingly, the importance of management and year factors results were similar within the different sampling sites (R2 approximately 0.25, 0.16, 0.24 for Caorle, Fagna, and Metaponto, respectively).
Table 4.
Results of permutational multivariate ANOVA (PERMANOVA) analysis for testing the effect of different experimental factors (site, management, season and year) on all considered indices (using the Euclidean distance matrix). Both overall and within-site testing are reported. Reported numbers are R2. For the p-value, the following notation applies: n.s. = p-value > 0.05, *** = p-value < 0.001).
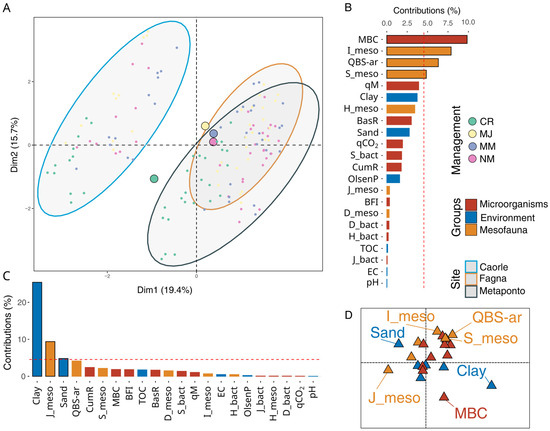
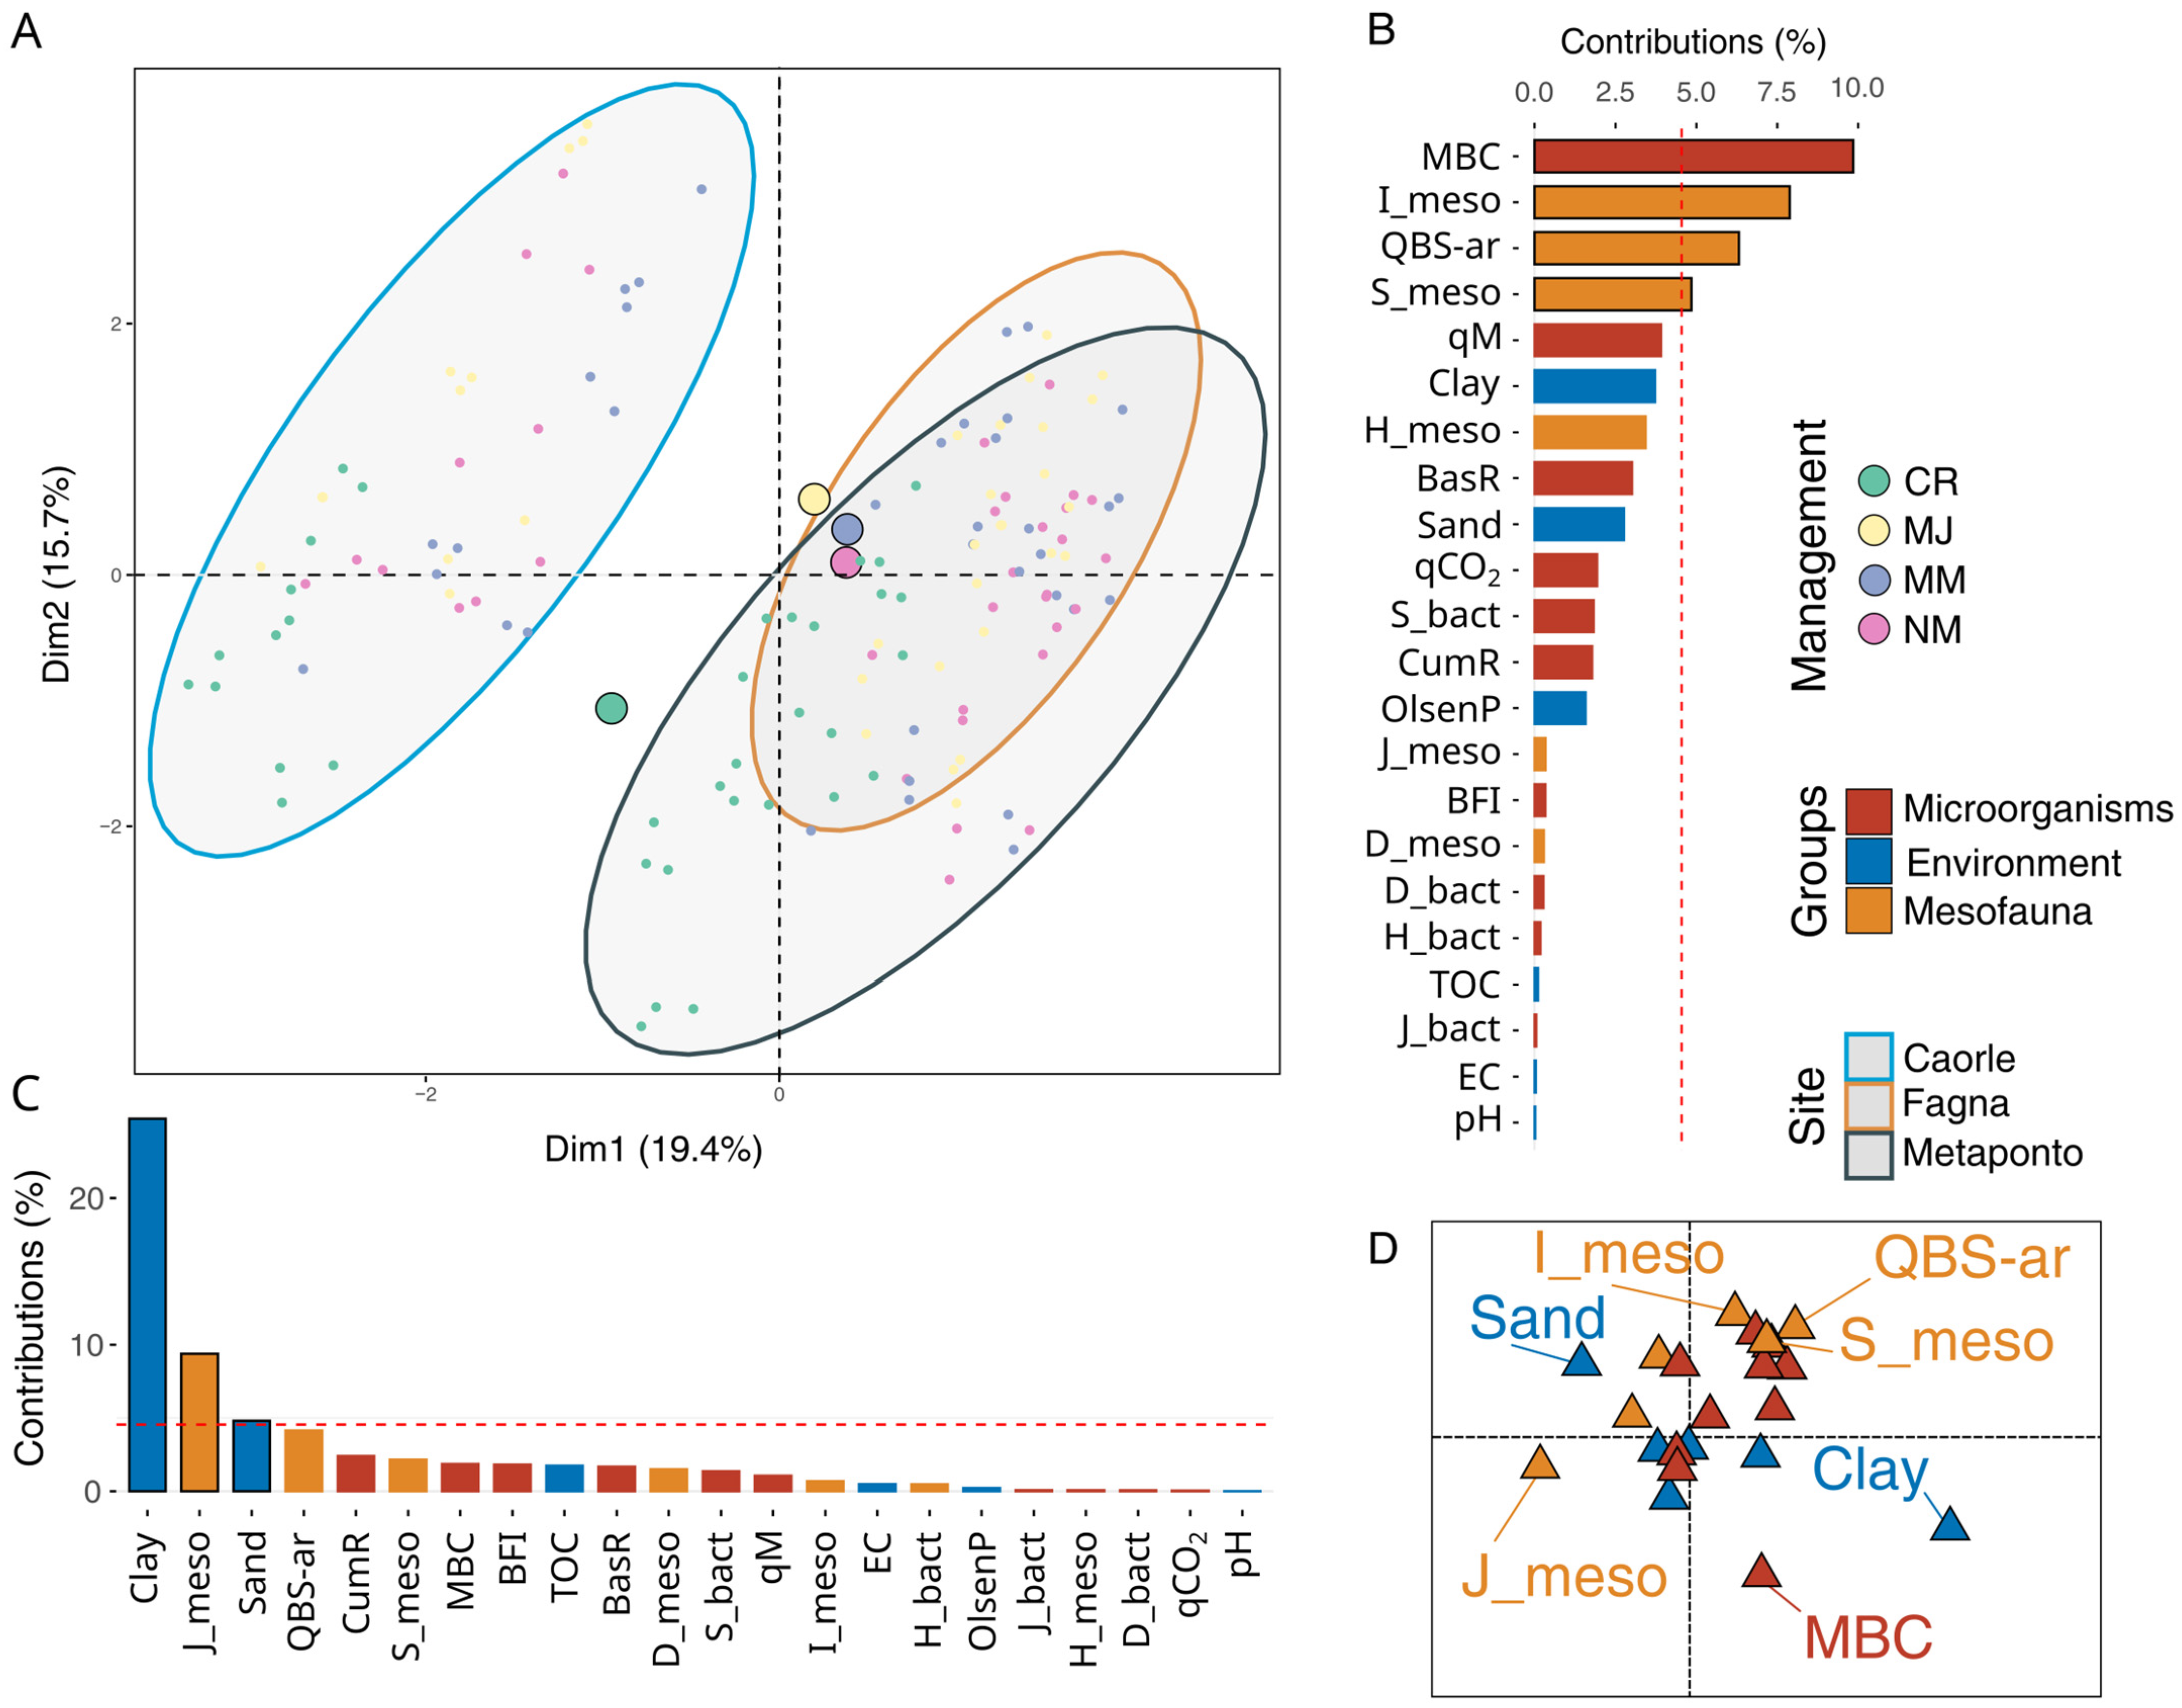
The multiple factor analysis (MFA) confirmed the separation of samples on the first ordination axis based on the different sampling sites (Figure 2A), distinguishing Caorle samples from the others (Figure S2) in accordance with the NMDS results. This separation was mostly driven by soil texture (clay and sand content), together with microarthropod community evenness determined by the strong increment of Acarina, Collembola, and Hymenoptera taxa, especially in the Metaponto site (Figure 2C). Specifically, Caorle samples results are characterized by higher values of sand and microarthropods evenness, while Fagna and Metaponto have more clay soils, as evidenced by the plotting of the variables on the ordination plot (Figure 2D).
Figure 2.
Multiple factor analysis (MFA) of all considered indices. (A) Ordination of the samples, where each point represents a sample, colored based on the management. The large dots with a black border represent the centroid of the management group. Finally, a gray ellipse is shown, representing site groups (the color of the ellipse border maps to site). (B,C) Bar plots reporting the contribution of each numerical variable on the first (C) and second (B) ordination axis. During MFA, each numerical variable was assigned to a variable group (i.e., bacteria, mesofauna and environment variables set), each represented with a different color. (A) Red dotted line is reported to represent the contribution threshold for identifying the most important variables (variables with contribution above this threshold were highlighted with a black outline for the bar plot). (D) Positioning of each variable (i.e., end of the vector) in the ordination plane. Only the most influencing variables (i.e., variables with contribution above the red dotted line in panels (B,C)) were labeled.
The MFA also highlighted a clear separation of the samples subjected to the different soil managements, as highlighted by the group centroids position (Figure 2A). Specifically, set-aside managements (MM, MJ, and NM) centroids clustered together, separated from the conventional crop rotation (CR) one. This separation was evident on both the ordination axes, with results mostly guided by both soil texture on the first axis (Figure 2C), soil community indices such as microarthropods evenness on the first axis (Figure 2C) and MBC and microarthropods indicators (number of individuals, richness and QBS-ar index) on the second axis (Figure 2B). The plotting of the variables on the ordination plot evidenced that the set-aside samples are those characterized by higher values of microarthropods indicators, compared to CR samples (Figure 2D).
Canonical Correspondence Analysis (CCA) was performed within each site (Supplementary Table S6, Figure S3), to evaluate the site-specific association of biological indicators and experimental/environmental parameters. Results were largely in accordance with the evaluation given by MFA. Interestingly, the CR management showed the highest canonical regression coefficient (to either CCA1 or CCA2) in respect to the other managements for all sites, differentiating them from the set-aside managements. Indeed, in both Caorle and Fagna sites, most of the community diversity indices, especially the mesofauna number of individuals, richness and QBS-ar index, tended to map in the quadrant diametrically opposite to CR, in accordance with MFA. In Fagna and Metaponto, Olsen P and TOC showed vectors pointing to the same direction and associated with set-aside management (MJ and MM); in Caorle, on the contrary, Olsen P and TOC vectors pointed in the opposite direction, with TOC associated with set-aside management (primarily MM) and Olsen P associated with conventional crop rotation (CR). In Metaponto CCA, the distribution of the indices’ variables was less grouped at the origin of the axes, with a more homogeneous distribution within the plot.
4. Discussion
The selected sites, representing different Italian latitudes, allowed a broad evaluation of the efficacy of the set-aside management system on a national scale. These sites were, in fact, characterized by different climatic conditions, soil properties, and, consequently, by different crop rotation systems. As already reported by Landi et al. [22], after five years of application, the set-aside management strategies improved soil fertility in these sites, particularly after intensive crop rotations. However, even though the organic carbon content increased, the humification remained low. The best advisable set-aside practice involved mowing in May, which produced the highest organic matter increments. After a thorough investigation of the set-aside impact on the soil nematode community [22], in this work, microbial activity, microarthropod community structure, and their biodiversity indicators were assessed in the same sites.
4.1. Effects of Set-Aside on Soil Microbial Community Structure and Activity
The results of bacterial diversity of the three sites showed that no differences were observed within each of the sites under different managements. In fact, although the Shannon index (S_bact) showed increasing values across the three sites, ranging from an average of 18.253 in Caorle to 20.562 in Fagna, and to 22.437 in Metaponto, such differences did not cause the results to be significant. Similar variations were observed with J_bact, H_bact and D_bact indices. Overall, such a lack of difference in terms of the bacterial diversity within each site may likely be due to the low resolution of the DGGE technique as compared to the DNA metabarcoding combined with high-throughput sequencing approach, detecting only microorganisms present in high concentrations which may cause an underestimation of rare species [33,34]. Nevertheless, DGGE is yet a molecular technique successfully used for microbial community profiling and is still recognized as a powerful and cost-effective approach to address soil microbial diversity shifts [35,36,37]. In this context, we used this technique as a comparative analysis aiming at evaluating potential major changes in the dominant bacterial taxa. Thus, we rather suppose that such a lack of bacterial diversity indices under different management across the three sites may be likely related to the poor effects of soil management on the bacterial diversity of these soils, as reported in other works [38,39,40]. On the other hand, in this study, MBC showed just minor and not significant variation under different management, thus suggesting that local nutrient levels, total organic carbon and other chemical–physical soil properties were quite stable within each site. Nevertheless, in some occasions, this indicator was shown to have poor sensitivity to differences in soil management, as previously reported by Dos Santos et al. [41]. However, to some extent, what could explain this result is that the microbial biomass has stabilized in the soil. And if the soil is under stable conditions for a long period, the microbial biomass can also achieve a stable equilibrium with the soil substrate, mainly related to the organic carbon supply [42]. Moreover, considering the poor seasonal changes in organic carbon availability of these soils, which was shown in a previous work [22], some of the microorganisms in these soils would probably be in a latent state [43]. However, MBC is not an estimate of microbial activity, it only reflects the total living mass of microorganisms, whether in the latent state or not [27], and it is significantly correlated to climatic variables [35,44]. Thus, it is not surprising that MBC values may differ across the three sites but not within each of them. In this context, microbial respiration might play a more sensitive role to differentiating the management systems. For example, in the Fagna site the CumR values in CR indicated a lower microbial activity under conventional crop rotation, whereas BasR did not significantly change across the different managements, suggesting that the composition of the available organic matter was similar in all the samples. Nevertheless, the highest microbial respiration values have been measured in MM soils, where the label fraction of the organic residues after mowing in May was likely better mineralized under the favorable climatic conditions of the spring season. On the other hand, the lower CumR values of CR soils may reflect the lower organic carbon content due to the conventional agricultural intensity, as previously reported for these sites [22]. Consequently, it may explain the low qM values in CR soils as compared to the other managements, which were influenced by the higher proportion of organic material. In fact, qM values have been shown to significantly vary with soil fertilization [28,45]. Consistently, the BFI values in CR soils are classified as soils with “intermediate fertility”. It is in line with previous validation of BFI which showed its reliability as an indicator to discriminate the soil biological fertility under different fertilization treatments [46,47]. Although MJ, MM and NM soils were also assigned to the same “intermediate fertility” class, they showed higher BFI scores (>16) than CR, displaying a similar trend as what was observed in the Metaponto site, thus confirming that the higher content of organic carbon played a key role. Moreover, the high content of organic carbon of MM soils observed across the three sites is reflected in the high value of microbial activity of MJ, MM, and NM soils expressed as soil respiration.
4.2. Effects of Set-Aside on Soil Microarthropod Community Structure
On the whole, a high variability in the soil microarthropod community structure was found across the three sites, which were characterized by different climatic zones, soil properties, and cropping histories. However, in all cases, the MDS analysis showed a separation between set-aside and crop-rotation management systems, demonstrating that this practice altered the soil microarthropod community. It is known that the composition and diversity of soil microarthropod communities depend more on their use than on geographic, climatic, and site-specific soil conditions [20]. In particular, deep soil tillage, along with soil moisture and compaction, represents the most important conditions influencing soil life [48]. Furthermore, SIMPER analysis demonstrated that set-aside management systems modified the composition of the microarthropod community primarily when the fields had been previously managed with an intensive crop rotation, such as in the Caorle and Metaponto sites. The overall mean dissimilarity was indeed not significantly affected by the conversion from conventional to set-aside management in Fagna, a site managed with a conservative rotation. This result is consistent with what was previously reported by Landi et al. [22] for the soil nematode community in the same trial. In line with what already reported by several authors, mites and springtails, the numerically dominant taxa, increased their abundance in all sites in the set-aside management systems when compared to the conventional crop rotation [20,21,49]. Specifically, mites were represented mainly by Oribatids, which strongly increased in all set-aside managements as already reported by Dubie et al. [50]. The feeding habits were favored by either the organic matter increase or the absence of tillage [51] leading to the return of grass biomass to the soil. The springtail community, characterized mainly by Entomobryomorpha and Poduromorpha forms, maintained all the ecological functions and increased in abundance in all set-aside managements [21]. In addition, in accordance with Landi et al. [20], the populations of the euedaphic group, mainly Diplura, and the hemi-edaphic group, primarily Coleoptera, Isopoda, Aranea, and Hymenoptera, also increased, especially in the mowing set-aside (MM and MJ). In particular, the beetle community, characterized mainly by predators belonging to Carabids, and to a lesser extent Staphylinids, increased in all set-aside managements due to the augmented food availability represented by micro- and mesofauna [22]. It is worth noting that the most relevant increments were reported in sites located in North and Central Italy, primarily because of the more suitable environmental conditions. On the contrary, phytophagous beetles, mainly represented by the Elateridae family in Fagna and Curculionidae in Metaponto, were not particularly abundant, being less than 20% of the entire Coleoptera community. Moreover, the NM highlighted the dominance of several groups, particularly the Formicidae in the Caorle site.
Among the indicators selected for this study, biodiversity indices appear to have limited potential as a metric for the evaluation of healthy/unhealthy systems, as microarthropods were only identified at high taxonomic ranks and results of this trial were not always consistent. However, some general considerations can be highlighted. The increase in richness in all sites managed with the set-aside practice, compared to the CR, indicated the improvement in biodiversity resulting from more natural, no-till management systems. Only in the Caorle set-aside system without mowing, the richness remained similar to crop rotation due to the dominance of certain taxa. The J index showed the highest CR values in all sites, indicating a high level of uniformity in the distribution of community individuals among the different species in a management system applied for many years. This observation highlighted how the application of set-aside represented a medium-term disturbance factor. The D index showed a reduction in dominance in all set-aside management systems compared to conventional management systems; however, the differences were negligible, except for the Metaponto site. The extremely warm climatic conditions recorded in the Metaponto site likely emphasized in this area the positive impact of set-aside in limiting the dominance of a few taxa. The H index showed very inconsistent results. On the contrary, the QBS-ar performed very well as an ecological indicator. In this trial, in accordance with what was previously reported for natural areas and set-aside land use, the measured threshold ranged approximately from 90 to 100 EMI (ecomorphological index); such an interval is generally accepted as an adequate soil quality standard [18,19,23,46,52,53]. Moreover, the intensive cereal-based crop rotation applied in the Caorle and Metaponto sites produced QBS-ar lower than 90 EMI, showing a disturbance in the soil microarthropod community. On the other hand, the more sustainable crop rotation based on cereal and alfalfa applied in the Fagna site achieved good soil quality.
4.3. Holistic/Combined Effects of Set-Aside Management
This study was designed to evaluate the effect of medium-term set-aside management in different climatic and pedological settings. Indeed, results confirmed that the three selected sampling sites were significantly different for several aspects of the microbial and microarthropod communities, as well as in respect to soil physicochemical properties. More specifically, Caorle clearly differentiated from the other two sampling sites. This separation was driven, among the considered variables, by soil texture, with Caorle samplings characterized by sandy soils. These experimental settings, statistically supported by the above-mentioned results, allow the following considerations on the effects of set-aside management to be generalizable to different pedoclimatic contexts. Samples subjected to conventional crop rotation were distinguished from set-aside managed ones. As already observed by Landi et al. [20], this separation result was guided by both soil physicochemical properties (specifically, soil texture) and soil biota indices, mainly microarthropod indicators. Set-aside managements were, in fact, characterized by higher numbers of microarthropod individuals, richness, and QBS-ar index. Their highest values in set-aside managed soils confirmed a general improvement in microarthropod biodiversity resulting from more natural management systems, as previously discussed [20,54]. Conversely, microbial biomass carbon (MBC) was related to CR, demonstrating a higher potential activity in conventional management.
In addition, the effect of the different management systems on soil biological and physicochemical indicators results were more evident when the three different sampling sites were separately considered. In the CCA, CR vectors were always very long and pointed in the opposite direction in respect to those from set-aside managements. This suggested that CR management differed most in terms of the observed biodiversity variables, compared to the others. Furthermore, CR vectors consistently showed a negative correlation with TOC and a positive correlation with all set-aside practices across all sites. This suggests that increasing the organic carbon content was the primary driver for improving both microbial parameters and microarthropod indicators. However, the response differed between the two, with microarthropods showing a rapid and strong reaction compared to a weaker response from the microbial community. This is well-evidenced by the greater distance from the origin of microarthropod individuals. Therefore, set-aside practices mainly positively influenced this indicator, demonstrating that certain taxa found optimal conditions for growth, with Acarina and Collembola being primarily responsible for this trend. On the other hand, although microbial parameters were positively affected by TOC, they were located near the origin, indicating the low impact of organic matter increment for the microbial community. Microbial community diversity was never among the contributing variables in the system under consideration, whereas the indices of microbial activity, particularly microbial biomass carbon (MBC), played a more relevant role [20]. As already observed by Hamer et al. [55], this may indicate that set-aside managements did not induce shifts in the composition of microbial communities compared with the conventional rotation, but rather modified the activity of the community, leading mainly to a greater microbial population growth.
Comparing the different managements, in the CCA, the vector of MM management is longer respect to that of MJ management, suggesting that MM differentiate more to CR, in respect to MJ, especially in Caorle. Similarly to what has already been reported by Landi et al. [22] on the soil nematode community in the same experimental sites, CCA in Fagna highlighted a wider distribution of indices’ variables around the origin of the axes. This suggested that Fagna had a higher intra-site variability in respect to the other sites due to its previously discussed, more conservative management strategy prior to the set-aside application. Conversely, Caorle and Metaponto highlighted a stronger positive correlation between soil microarthropod abundance and TOC than Fagna, demonstrating the positive impact of set-aside management after more intensive rotations, as was already reported for the soil nematode community.
In general, as is widely reported in the literature, microarthropod indicators and their abundance are also influenced by microbial activity [54]. However, the low activity of the microbial community reported in this context probably did not allow us to highlight a strong relation. Indeed, as reported by Landi et al. [20], in a long-term condition this relation was more evident.
5. Conclusions
The national scale evaluation of three different set-aside managements compared to conventional crop rotation allowed the assessment of their effects on soil biological fertility and the diversity of the soil microbial and microarthropod communities. The set-aside practice improved soil biological fertility and microarthropod diversity. Nonetheless, the set-aside efficacy depended on the previously applied crop rotation, with major advantages particularly evident after intensive agricultural managements. Moreover, this study carried out on soil biota at a multitrophic level highlighted a network complexity strongly related to soil management. Among the indices selected for this work, microbial respiration and QBS-ar appeared to have the greatest potential as quality indicators of the management systems. The QBS-ar index indicated the achievement of an adequate soil quality standard in each set-aside management favoring the euedaphic microarthropods, while soil microbial respiration underlined a higher microbial activity in the same experimental conditions.
Our results suggest that the set-aside management is a medium-term beneficial practice for improving soil biodiversity and biological fertility.
Supplementary Materials
The following supporting information can be downloaded at: https://www.mdpi.com/article/10.3390/su18052575/s1, Figure S1: MDS analysis based on Bray–Curtis index of microarthropod community abundance from soil samples in Caorle, Fagna, and Metaponto sites; Figure S2: Multiple factor analysis (MFA) of all considered indices; Figure S3: Results of CCA; Table S1: Geographic parameters, climate, soil type, and management in the three selected sites; Table S2: One-way ANOSIM analysis based on Bray–Curtis index of microarthropod community abundance from soil samples; Table S3: Percentage contribution to the Bray–Curtis dissimilarity in soil microarthropod abundance (SIMPER analysis) in Caorle; Table S4: Percentage contribution to the Bray–Curtis dissimilarity in soil microarthropod abundance (SIMPER analysis) in Fagna; Table S5: Percentage contribution to the Bray–Curtis dissimilarity in soil microarthropod abundance (SIMPER analysis) in Metaponto; Table S6: Result of analysis of variance (ANOVA) on the terms of CCA model in different sites.
Author Contributions
Conceptualization, S.M. and S.L.; methodology, S.M. and S.L.; formal analysis, F.V. and S.D.D.; investigation, A.F., F.B., F.V. and S.D.D.; data curation, S.L. and S.M.; writing—original draft preparation, A.F.; writing—review and editing, A.F., F.V., S.D.D. and S.L.; supervision, S.M.; funding acquisition, S.M. All authors have read and agreed to the published version of the manuscript.
Funding
This research was conducted as part of the MO.NA.CO project (National Network for monitoring the Environmental Effectiveness of Cross Compliance and the Competitiveness Differential Affecting Agricultural Enterprises), funded on 18 February 2011 by the Italian Ministry of Agriculture, Food Sovereignty, and Forests (MASAF), under grant number ‘COSVIR II Prot.0004010’, within Action 1.2.2, ‘Interregional Workshops for Development’, of the ‘Operational Programme National Rural Network 2007–2013’.
Institutional Review Board Statement
Not applicable.
Informed Consent Statement
Not applicable.
Data Availability Statement
The data presented in this study are available upon request from the corresponding author.
Acknowledgments
We wish to thank Giorgio Moretti, Lorenzo Furlan, Francesco Fracasso, Francesco Fagotto, Francesco Montemurro, Stefano Fiore and their co-workers for the setup and the management of the monitoring fields, making this work possible.
Conflicts of Interest
The authors declare no conflicts of interest.
References
- Matson, P.A.; Parton, W.J.; Power, A.G.; Swift, M.J. Agricultural intensification and ecosystem properties. Science 1997, 277, 504–509. [Google Scholar] [CrossRef] [Scilit] [PubMed]
- Tsiafouli, M.A.; Thébault, E.; Sgardelis, S.P.; de Ruiter, P.C.; van der Putten, W.H.; Birkhofer, K.; Hemerik, L.; De Vries, F.T.; Bardgett, R.D.; Brady, M.V.; et al. Intensive agriculture reduces soil biodiversity across Europe. Glob. Change Biol. 2015, 21, 973–985. [Google Scholar] [CrossRef] [Scilit] [PubMed]
- Geisseler, D.; Scow, K.M. Long-term effects of mineral fertilizers on soil microorganisms—A review. Soil Biol. Biochem. 2014, 75, 54–63. [Google Scholar] [CrossRef] [Scilit]
- Sánchez-Bayo, F.; Wyckhuys, K.A.G. Worldwide decline of the entomofauna: A review of its drivers. Biol. Conserv. 2019, 232, 8–27. [Google Scholar] [CrossRef] [Scilit]
- Torsvik, V.; Øvreås, L. Microbial diversity and function in soil: From genes to ecosystems. Curr. Opin. Microbiol. 2002, 5, 240–245. [Google Scholar] [CrossRef] [Scilit]
- van der Heijden, M.G.A.; Bardgett, R.D.; van Straalen, N.M. The unseen majority: Soil microbes as drivers of plant diversity and productivity in terrestrial ecosystems. Ecol. Lett. 2008, 11, 296–310. [Google Scholar] [CrossRef] [Scilit]
- Philippot, L.; Chenu, C.; Kappler, A.; Rillig, M.C.; Fierer, N. The interplay between microbial communities and soil properties. Nat. Rev. Microbiol. 2024, 22, 226–239. [Google Scholar] [CrossRef] [Scilit]
- Falkowski, P.G.; Fenchel, T.; Delong, E.F. The microbial engines that drive Earth’s biogeochemical cycles. Science 2008, 320, 1034–1039. [Google Scholar] [CrossRef] [Scilit]
- Lavelle, P.; Decaëns, T.; Aubert, M.; Barot, S.; Blouin, M.; Bureau, F.; Margerie, P.; Mora, P.; Rossi, J.P. Soil invertebrates and ecosystem services. Eur. J. Soil Biol. 2006, 42, S3–S15. [Google Scholar] [CrossRef] [Scilit]
- Bardgett, R.D.; van der Putten, W.H. Belowground biodiversity and ecosystem functioning. Nature 2014, 515, 505–511. [Google Scholar] [CrossRef] [Scilit]
- Moore, J.C.; McCann, K.; de Ruiter, P.C. Modeling trophic pathways, nutrient cycling, and dynamic stability in soils. Pedobiologia 2004, 47, 507–519. [Google Scholar] [CrossRef] [Scilit]
- Maaß, S.; Caruso, T.; Rillig, M.C. Functional role of microarthropods in soil aggregation. Pedobiologia 2015, 58, 59–63. [Google Scholar] [CrossRef] [Scilit]
- Tilman, D.; Cassman, K.G.; Matson, P.A.; Naylor, R.; Polasky, S. Agricultural sustainability and intensive production practices. Nature 2002, 418, 671–677. [Google Scholar] [CrossRef] [Scilit] [PubMed]
- Lal, R. Restoring soil quality to mitigate soil degradation. Sustainability 2015, 7, 5875–5895. [Google Scholar] [CrossRef] [Scilit]
- Delgado-Baquerizo, M.; Maestre, F.T.; Reich, P.B.; Jeffries, T.C.; Gaitan, J.J.; Encinar, D.; Berdugo, M.; Campbell, C.D.; Singh, B.K. Microbial diversity drives multifunctionality in terrestrial ecosystems. Nat. Commun. 2016, 7, 10541. [Google Scholar] [CrossRef] [Scilit]
- Bardgett, R.D.; Bullock, J.M.; Lavorel, S.; Manning, P.; Schaffner, U.; Ostle, N.; Chomel, M.; Durigan, G.; Fry, E.L.; Johnson, D.; et al. Combatting global grassland degradation. Nat. Rev. Earth Environ. 2021, 2, 720–735. [Google Scholar] [CrossRef] [Scilit]
- Tóth, Z.; Hornung, E.; Báldi, A. Effects of set-aside management on certain elements of soil biota and early stage organic matter decomposition in a high nature value area, Hungary. Nat. Conserv. 2018, 29, 1–26. [Google Scholar] [CrossRef] [Scilit]
- Biaggini, M.; Bazzoffi, P.; Gentile, R.; Corti, C. Effectiveness of the GAEC cross compliance standards rational management of set aside, grass strips to control soil erosion and vegetation buffers along watercourses on surface animal diversity and biological quality of soil. Ital. J. Agron. 2011, 6, 100–106. [Google Scholar] [CrossRef] [Scilit]
- Raglione, M.; Lorenzoni, P.; Bonifazi, A.; Nannelli, R.; Gagnarli, E.; Bazzoffi, P.; Gentile, R. Effectiveness of the GAEC cross compliance standard rational management of set aside (weed control through mowing) in assuring a minimum level of habitats maintenance. Ital. J. Agron. 2011, 6, 92–99. [Google Scholar] [CrossRef] [Scilit]
- Landi, S.; Binazzi, F.; Papini, R.; d’Errico, G.; Del Duca, S.; Fabiani, A.; Mocali, S. Effect of long-term set-aside management system on soil health by evaluation of biodiversity indicators. Diversity 2025, 17, 240. [Google Scholar] [CrossRef] [Scilit]
- Mocali, S.; Landi, S.; Fabiani, A.; Piccolo, R.; Agnelli, A.; d’Errico, G.; Mazza, G.; Fedrizzi, M.; Sperandio, G.; Guerrieri, M.; et al. Environmental effectiveness of GAEC cross-compliance Standard 4.2 on biodiversity in set-aside management and economic evaluation of the competitiveness gap for farmers, part I. Ital. J. Agron. 2015, 10, 711. [Google Scholar] [CrossRef] [Scilit]
- Landi, S.; Papini, R.; d’Errico, G.; Brandi, G.; Rocchini, A.; Roversi, P.F.; Bazzoffi, P.; Mocali, M. Effect of different set-aside management systems on soil nematode community and soil fertility in North, Central and South Italy. Agric. Ecosyst. Environ. 2018, 261, 251–260. [Google Scholar] [CrossRef] [Scilit]
- Parisi, V.; Menta, C.; Gardi, C.; Jacomini, C.; Mozzanica, E. Microarthropod communities as a tool to assess soil quality and biodiversity: A new approach in Italy. Agric. Ecosyst. Environ. 2005, 105, 323–333. [Google Scholar] [CrossRef] [Scilit]
- Felske, A.; Wolterink, A.; Van Lis, R.; Akkermans, A.D.L. Phylogeny of the main bacterial 16S rDNA sequences in Drentse A grassland soils (The Netherlands). Appl. Environ. Microbiol. 1998, 64, 871–879. [Google Scholar] [CrossRef] [Scilit] [PubMed]
- Baiano, S.; Fabiani, A.; Fornasier, F.; Ferrarini, A.; Innangi, M.; Mocali, S.; Morra, L. Biowaste compost amendment modifies soil biogeochemical cycles and microbial community according to aggregate classes. Appl. Soil Ecol. 2021, 168, 104132. [Google Scholar] [CrossRef] [Scilit]
- Isermeyer, H. Eine einfache Methode zur Bestimmung der Bodenatmung und der Karbonate im Boden. Z. Pflanzenernähr. Bodenkd. 1952, 56, 26–38. [Google Scholar] [CrossRef] [Scilit]
- Vance, E.D.; Brookes, P.C.; Jenkinson, D.S. An extraction method for measuring microbial biomass carbon. Soil Biol. Biochem. 1987, 19, 703–707. [Google Scholar] [CrossRef] [Scilit]
- Mocali, S.; Paffetti, D.; Emiliani, G.; Benedetti, A.; Fani, R. Diversity of heterotrophic aerobic cultivable microbial communities of soils treated with fumigants and dynamics of metabolic, microbial, and mineralization quotients. Biol. Fertil. Soils 2008, 44, 557–569. [Google Scholar] [CrossRef] [Scilit]
- Renzi, G.; Canfora, L.; Salvati, L.; Benedetti, A. Validation of the soil biological fertility index (BFI) using a multidimensional statistical approach: A country-scale exercise. Catena 2017, 149, 294–299. [Google Scholar] [CrossRef] [Scilit]
- Oksanen, J.; Simpson, G.; Blanchet, F.; Kindt, R.; Legendre, P.; Minchin, P.; O’Hara, R.; Solymos, P.; Stevens, M.; Szoecs, E.; et al. Vegan: Community Ecology Package. R Package Version 2.6-10, 2025. Available online: https://CRAN.R-project.org/package=vegan (accessed on 5 February 2026).
- R Core Team. R: A Language and Environment for Statistical Computing; R Foundation for Statistical Computing: Vienna, Austria, 2024; Available online: https://www.R-project.org/ (accessed on 5 February 2026).
- Le, S.; Josse, J.; Husson, F. FactoMineR: An R package for multivariate analysis. J. Stat. Softw. 2008, 25, 1–18. [Google Scholar] [CrossRef] [Scilit]
- Vasselon, V.; Domaizon, I.; Rimet, F.; Kahlert, M.; Bouchez, A. Application of high-throughput sequencing metabarcoding to diatom biomonitoring: Do DNA extraction methods matter? Freshw. Sci. 2017, 36, 162–177. [Google Scholar] [CrossRef] [Scilit]
- Al-Mailem, D.M.; Kansour, M.K.; Radwan, S.S. Capabilities and limitations of DGGE for the analysis of hydrocarbonoclastic prokaryotic communities directly in environmental samples. MicrobiologyOpen 2017, 6, e00495. [Google Scholar] [CrossRef] [Scilit] [PubMed]
- Mocali, S.; Gelsomino, A.; Nannipieri, P.; Pastorelli, R.; Giagnoni, L.; Petrovicova, B.; Renella, G. Short-term resilience of soil microbial communities and functions following severe environmental changes. Agriculture 2022, 12, 268. [Google Scholar] [CrossRef] [Scilit]
- Wu, T.; Sabula, M.; Milner, H.; Strickland, G.; Liu, G. Agricultural practice negatively affects soil bacterial diversity and nitrogen functional genes compared to adjacent native forest soils. Appl. Soil Ecol. 2023, 186, 104856. [Google Scholar] [CrossRef] [Scilit]
- Karna, R.R.; Kumara, S.T.; McCracken, V.J.; Fowler, T.J.; Lin, Z.Q. Enhancement of selenium volatilization for phytoremediation: Role of plant and soil microbe interaction. Front. Plant Sci. 2024, 15, 1504528. [Google Scholar] [CrossRef] [Scilit]
- Rachwał, K.; Gustaw, K.; Kazimierczak, W.; Waśko, A. Is soil management system really important? Comparison of microbial community diversity and structure in soils managed under organic and conventional regimes with some view on soil properties. PLoS ONE 2021, 16, e0256969. [Google Scholar] [CrossRef] [Scilit]
- Lupatini, M.; Suleiman, A.K.A.; Jacques, R.J.S.; Antoniolli, Z.I.; Kuramae, E.E.; Roesch, L.F.W. Soil-borne bacterial structure and diversity does not reflect community activity in Pampa biome. PLoS ONE 2013, 8, e76465. [Google Scholar] [CrossRef] [Scilit]
- Wu, T.; Chellemi, D.O.; Graham, J.H.; Martin, K.J.; Rosskopf, E.N. Comparison of soil bacterial communities under diverse agricultural land management and crop production practices. Microb. Ecol. 2008, 55, 293–310. [Google Scholar] [CrossRef] [Scilit]
- dos Santos, J.V.; Bento, L.R.; Bresolin, J.D.; Mitsuyuki, M.C.; Oliveira, P.P.A.; Pezzopane, J.R.M.; Martin-Neto, L. Long-term effects of intensive grazing and silvopastoral systems on soil physicochemical properties, enzymatic activity, and microbial biomass. Catena 2022, 219, 106619. [Google Scholar] [CrossRef] [Scilit]
- Wang, W.J.; Dalal, R.C.; Moody, P.W.; Smith, C.J. Relationships of soil respiration to microbial biomass, substrate availability and clay content. Soil Biol. Biochem. 2003, 35, 273–284. [Google Scholar] [CrossRef] [Scilit]
- Blagodatskaya, E.; Kuzyakov, Y. Active microorganisms in soil: Critical review of estimation criteria and approaches. Soil Biol. Biochem. 2013, 67, 192–211. [Google Scholar] [CrossRef] [Scilit]
- Insam, H. Are the soil microbial biomass and basal respiration governed by the climatic regime? Soil Biol. Biochem. 1990, 22, 525–532. [Google Scholar] [CrossRef] [Scilit]
- Kaur, S.; Dheri, G.S.; Benbi, D.K. Effect of long-term fertilization in maize–wheat cropping system on carbon mineralization in soil. Carbon Manag. 2019, 10, 523–532. [Google Scholar] [CrossRef] [Scilit]
- Vittori Antisari, L.; Ferronato, C.; De Feudis, M.; Natali, C.; Bianchini, G.; Falsone, G. Soil biochemical indicators and biological fertility in agricultural soils: A case study from northern Italy. Minerals 2021, 11, 219. [Google Scholar] [CrossRef] [Scilit]
- Francaviglia, R.; Renzi, G.; Ledda, L.; Benedetti, A. Organic carbon pools and soil biological fertility are affected by land use intensity in Mediterranean ecosystems of Sardinia, Italy. Sci. Total Environ. 2017, 599, 789–796. [Google Scholar] [CrossRef] [Scilit] [PubMed]
- Jacomini, C.; Nappi, P.; Sbrilli, G.; Mancini, L. Indicatori Ed Indici Eco Tossicologici E Biologici Applicati Al Suolo: Stato Dell’Arte; Agenzia Nazionale per la Protezione dell’Ambiente (ANPA): Rome, Italy, 2000. [Google Scholar]
- Menta, C.; Conti, F.D.; Pinto, S.P.; Bodini, A. Soil Biological Quality index (QBS-ar): 15 years of application at global scale. Ecol. Indic. 2018, 85, 773–780. [Google Scholar] [CrossRef] [Scilit]
- Dubie, T.R.; Greenwood, C.M.; Godsey, C.; Payton, M.E. Effects of Tillage on Soil Microarthropods in Winter Wheat. Southwest. Entomol. 2011, 36, 11–20. [Google Scholar] [CrossRef] [Scilit]
- Betancur-Corredor, B.; Lang, B.; Russell, D.J. Reducing tillage benefits the soil micro- and mesofauna in a global meta-analysis. Eur. J. Soil Sci. 2022, 73, e13321. [Google Scholar] [CrossRef] [Scilit]
- Menta, C.; Leoni, A.; Bardini, M.; Gardi, C.; Gatti, F. Nematode and microarthropod communities: Comparative use of soil quality bioindicators in covered dump and natural soils. Environ. Bioind. 2008, 3, 35–46. [Google Scholar] [CrossRef] [Scilit]
- Ferrazzi, P.; Berger, F.; Verti, F. Biomonitoraggio della Qualità dei Suoli nei Comuni di Agenda 21 Laghi. In Proceedings of the 4th Forum di Agenda 21 Laghi, Torino, Italy, 16 June 2007. [Google Scholar]
- Del Duca, S.; Mocali, S.; Vitali, F.; Fabiani, A.; Cucu, M.A.; Valboa, G.; d’Errico, G.; Binazzi, F.; Storchi, P.; Perria, R.; et al. Impacts of soil management and sustainable plant protection strategies on soil biodiversity in a Sangiovese vineyard. Land 2024, 13, 599. [Google Scholar] [CrossRef] [Scilit]
- Hamer, U.; Makeschin, F.; Stadler, J.; Klotz, S. Soil organic matter and microbial community structure in set-aside and intensively managed arable soils in NE-Saxony, Germany. Appl. Soil Ecol. 2008, 40, 465–475. [Google Scholar] [CrossRef] [Scilit]

Disclaimer/Publisher’s Note: The statements, opinions and data contained in all publications are solely those of the individual author(s) and contributor(s) and not of MDPI and/or the editor(s). MDPI and/or the editor(s) disclaim responsibility for any injury to people or property resulting from any ideas, methods, instructions or products referred to in the content. |
© 2026 by the authors. Licensee MDPI, Basel, Switzerland. This article is an open access article distributed under the terms and conditions of the Creative Commons Attribution (CC BY) license.