


Abstract
Allometric equations are essential tools for estimating sustainable biomass and carbon dynamics in riparian tree species. This study derived and validated log–log transformation regression equations that relate diameter at breast height (DBH) to the dry weight, stem volume, and total biomass of Salix chaenomeloides Kimura across five river systems in Korea (Byeongcheon, Andong, Boseong, Topyeong, and Yeongdong). DBH was significantly correlated with biomass components and whole-tree biomass, with explanatory power ranging from 0.47 (Byeongcheon-root) to 0.99 (Topyeong-stem) (R2). Model evaluation metrics (RMSE, MAE, MPE) indicated high predictive accuracy across sites. Using the derived allometric equations, net primary productivity (NPP) of individual was 9.40 kg·tree−1·yr−1 and 2.45 ton C·ha−1·yr−1 at the stand level, with site-specific variability reflecting environmental differences. Biomass conversion coefficients, expansion factors, and root-to-aboveground biomass ratios were also obtained, with mean values of 0.29 (branches/stem), 0.10 (leaves/stem), and 0.25 (roots/AGB), a wood density of 0.63 g·cm−3, and a biomass expansion factor of 1.37. Independently derived NPP estimates based on stem analysis were comparable (9.02 kg tree−1 yr−1 and 2.43 t C ha−1 yr−1 at individual and stand levels, respectively), supporting the robustness of the approach. These findings provide robust, site-calibrated allometric models for S. chaenomeloides, supporting accurate biomass estimation, carbon accounting, and the evaluation of riparian ecosystems in climate change mitigation and restoration contexts. From a sustainability perspective, these results highlight the development of tools for evaluating the carbon budget of riparian vegetation, which are not yet incorporated into the Korean national IPCC report. They also demonstrate progress in carbon budget assessment by integrating both allometry and stem analysis.
1. Introduction
The accelerating impacts of climate change have intensified the need for effective carbon mitigation strategies. Natural ecosystems play a critical role in sustaining the sustainability of the planet by functioning as carbon sinks that capture and store atmospheric CO2. Forests, wetlands, and oceans have been extensively studied and integrated into global carbon accounting frameworks. However, riparian zones—linear transition areas between terrestrial and aquatic ecosystems—remain underrepresented in both scientific research and policy applications [1,2,3].
Riparian ecosystems possess ecological characteristics that distinguish them from other terrestrial systems and make them uniquely relevant for sustainability-oriented climate solutions. Constant hydrological connectivity provides high water and nutrient availability, supporting some of the most productive plant communities across diverse landscape types. Their structural complexity, ranging from herbaceous plants to trees, creates multilayered biomass pools with substantial potential for carbon storage. Hydrological processes such as sediment deposition, organic matter burial, and waterlogging further enhance soil carbon retention, often producing conditions more favorable for long-term sequestration than upland systems [4,5,6].
Carbon is sequestered in riparian vegetation through both aboveground biomass (leaves, stems, and branches) and belowground root systems. In forested riparian corridors, aboveground biomass can rival that of upland forests. Rich alluvial soils with high organic content further support carbon accumulation, as root inputs contribute to stable soil carbon pools, particularly under anaerobic conditions that slow decomposition. Frequent inputs of litter and woody debris, coupled with sediment deposition during floods, enhance the persistence of organic matter. In flood-prone riparian zones, repeated burial of organic-rich sediments further strengthens long-term sequestration potential [7,8,9,10].
The carbon storage capacity of riparian vegetation is shaped by both environmental and anthropogenic factors. Seasonal flooding promotes carbon burial, though extreme floods may release stored carbon [11,12,13]. Woody vegetation generally has greater sequestration potential than herbaceous species, while older, undisturbed riparian forests store larger cumulative stocks [8,14,15]. Conversely, urbanization, agriculture, and channelization reduce riparian width and connectivity, undermining their carbon sink capacity [5,16,17]; however, restoration efforts can rapidly reinstate carbon sequestration functions [18,19,20]. Climate change introduces additional complexity: warmer temperatures may accelerate decomposition, but waterlogged conditions can inhibit microbial activity, preserving soil carbon [21,22,23].
Despite their ecological importance, riparian zones are rarely included in carbon offset schemes or national greenhouse gas inventories, largely because their dynamic nature and variable carbon cycling complicate standardized measurement [5,9,24]. This omission weakens comprehensive carbon budgeting and limits the integration of riparian systems into sustainability strategies. Riparian vegetation, therefore, represents a valuable yet underutilized component of the terrestrial carbon sink network [25,26,27]. However, considering that carbon absorption is significantly insufficient compared to carbon emissions [28], and that Salix spp., which represent riparian vegetation, exhibit a high carbon absorption capacity [29,30], it is inevitably necessary to calculate the carbon absorption capacity of riparian vegetation.
Compared to many upland forest systems, riparian vegetation often benefits from more favorable growth conditions, particularly higher soil moisture, which can accelerate carbon accumulation [11,29,31,32]. Yet, carbon accounting has historically not distinguished between forest vegetation and riparian vegetation [33]. Recognizing riparian systems as distinct is critical, as their ecological settings allow them to accumulate carbon at potentially faster rates than many upland forests. Moreover, riparian ecosystems provide multiple ecosystem services—including water quality improvement, habitat provision, and climate regulation—further strengthening their importance for integrated environmental management [8].
Given their multifunctional roles in ecosystem regulation, riparian zones warrant greater attention in climate change mitigation discourse, sustainability policy, and nature-based solution strategies [4,34]. This study quantifies the carbon sequestration potential of representative riparian vegetation to assess its role as a potential carbon sink. Specifically, we focused on the willow (Salix chaenomeloides Kimura) community, which represents typical riparian vegetation in Korea. In this study, we hypothesized that DBH can accurately predict biomass and carbon stock of S. chaenomeloides across diverse hydrological settings. To test this, we developed an allometric equation and obtained biomass expansion coefficients through stem analysis as the primary tools to estimate net primary production (NPP). We then statistically validated these tools applying R2, RMSE, MAE, and MPE values. Finally, we calculated NPP using the derived allometric equation in combination with biomass expansion coefficients, providing a quantitative basis for incorporating riparian vegetation into sustainable carbon accounting.
2. Materials and Methods
2.1. Study Site
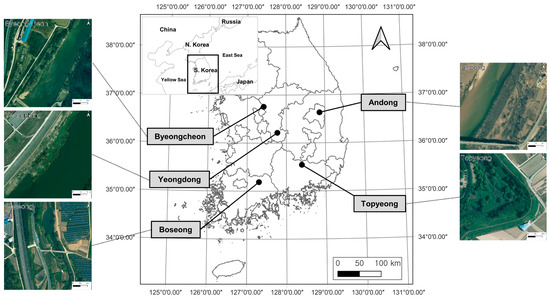
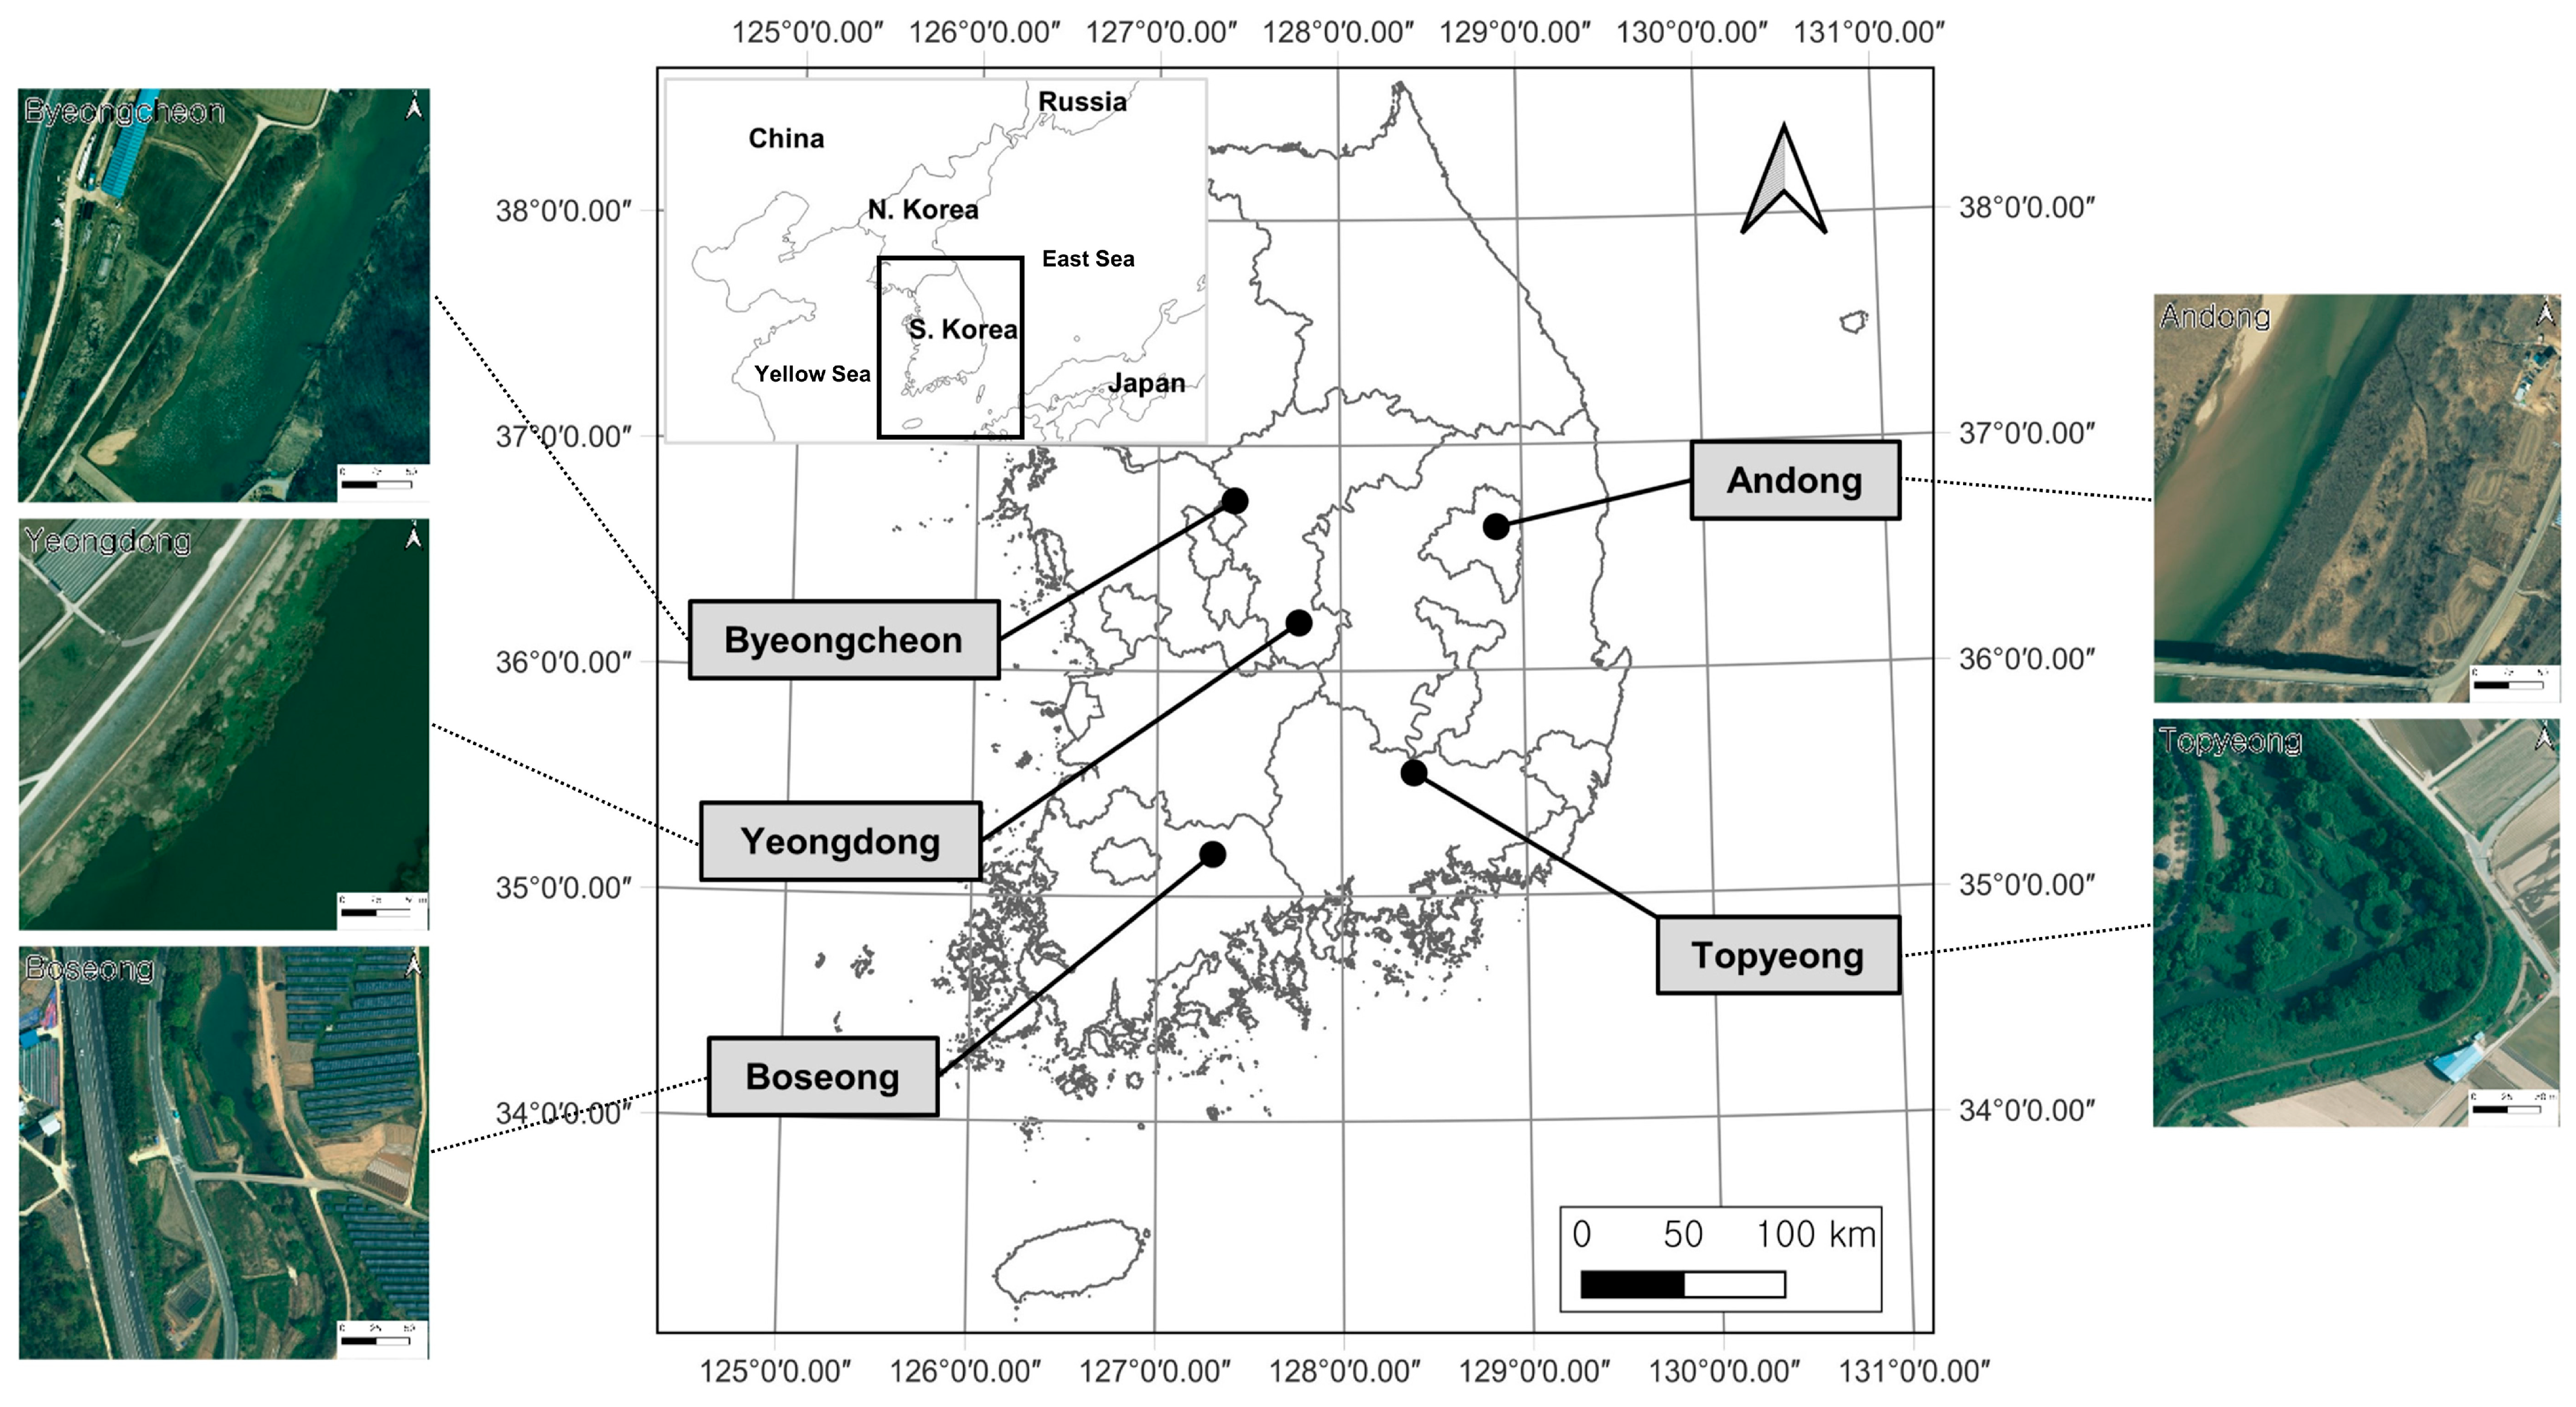
To reflect climate characteristics, the choice of survey site required consideration of the geographical location. Sites also considered the spatial distribution range of S. chaenomeloides, which is restricted to the central to southern regions, and accessibility. Byeongcheon Stream in Cheongju, Chungcheongbuk-do, Nakdonggang River in Andong, Gyeongsangbuk-do, Boseong River in Suncheon, Jeollanam-do, and Topyeong Stream in Changnyeong-gun, Gyeongsangnam-do, and Geum River in Yeongdong-gun, Chungcheongbuk-do, were chosen as the study sites for the derivation of the allometric equation of S. chaenomeloides (Figure 1).
Figure 1.
Map showing the locations of study sites in South Korea. The geographical coordinate of each site was indicated in Table 1. The aerial photos show the study sites.
The study sites were dominated by S. pierotii; S. chaenomeloides was a subdominant species (Table 1). In regions where rice is the staple food, most riparian areas, including floodplains, have been converted into rice paddies for the cultivation of the aquatic plant Oryza sativa. As a result, the extent of riparian vegetation has been greatly reduced. Typically, riparian vegetation is distributed in a zonal pattern: herbaceous plant-dominated zones occur closest to the waterway, followed by shrub-dominated zones, and then tree-dominated zones at greater distances. Willow species are the dominant components of the shrub- and tree-dominated zones. Within these areas, Salix pierotii tends to occur in sites relatively close to the waterway, whereas S. chaenomeloides is distributed in areas farther away. Consequently, the habitat of S. chaenomeloides has been particularly reduced. Nevertheless, S. chaenomeloides constitutes the second-largest component of riparian vegetation, following S. pierotii. At each study site, S. chaenomeloides recorded II to III, while S. pierotii recorded III to IV based on Braun–Blanquet [35] cover degree.
Table 1.
Vegetation status and geographical coordinates of the study sites.
2.2. Field Sampling and Measurements
We determined the sample size to be more than 30 individuals to obtain robust and reliable equation [36]. Thirty-three S. chaenomeloides trees of varying sizes were excavated from riparian sites (Table 2). DBH was measured at 1.3 m height, and harvested trees were separated into stems, branches, leaves, and roots. Fresh weights were recorded in the field, and subsamples were oven-dried at 80 °C until a constant weight with no change to determine moisture content and dry biomass. Subsamples were taken from each organ of all sample trees by three.
Table 2.
DBH configurations of S. chaenomeloides sampled at each study site.
2.3. Estimation of Biomass and Carbon Stock
Biomass was quantified using two complementary approaches: (i) species-specific allometric models and (ii) stem analysis. Organ-level dry biomass obtained from destructively sampled trees was regressed against DBH to develop allometric equations. The general form of the fitted equation was:
where Y is the dry biomass (kg), X is DBH (cm), a is the intercept, and b is the scaling exponent.
log Y = log a + b log X
Stand-level biomass (ton·ha−1) was estimated by multiplying the mean individual tree biomass (the arithmetic mean of all sampled tree biomass values) by the average stand density (individuals per ha). Tree density was calculated based on the number of S. chaenomeloides individuals per hectare, excluding other willow species. Carbon stock was calculated by applying the IPCC (2006) default carbon fraction (0.47 of dry biomass), and corresponding CO2 sequestration was obtained by multiplying carbon stock by the conversion factor (44/12) [32].
2.4. Measurement of Net Primary Productivity (NPP)
Two permanent plots of 100 m2 (10 m × 10 m) were installed at each study site, and the density of S. chaenomeloides within the plots was examined. Outside the permanent plots, 33 additional trees were excavated from riparian sites for destructive sampling.: seven from Byeongcheon Stream, six from the Andong reach of Nakdong River, six from Boseong River, seven from Topyeong Stream, and seven from the Youngdong reach of Geum River. These sampling individuals were used for annual ring analysis. Annual DBH increments were determined through annual ring analysis of disc samples collected to measure diameter growth. Diameter growth was measured in mm units using a vernier caliper (Mitutoyo, Tokyo, Japan). The diameter growth for all annual rings was taken as the mean of the two measurements after measuring the long and short diameters except that of the current year. NPP was calculated as the mean annual change in biomass after obtaining the annual biomass by substituting the diameter measured by year into the allometric equation derived. The NPP of stand level was obtained by multiplying the stand density with the average individual NPP [29].
On the other hand, the stem analysis was used to calculate the annual increment of stem volume, simultaneously, which were quantified to the annual biomass by multiplying the wood density (g cm−3) and biomass expansion factor (BEF). The wood density of S. chaenomeloides trees at each study site was calculated by dividing the stem oven-dry weight (biomass) of the sampled trees by the stem volume. The BEF was calculated by dividing the oven-dry weight of each organ part of the sampled trees by the stem oven-dry weight. The NPP was expressed as the mean annual change in biomass. The NPP was expressed as the mean annual change in biomass obtained through the stem analysis method. The NPP of stand level was estimated by multiplying the average stand density of riparian sites [30].
To compare the potential annual carbon sequestration and storage of S. chaenomeloides stands following the application of the two methods (allometric vs. stem analysis methods) at the riparian sites, the total annual amount of carbon for the stand level NPP (ton C ha−1 yr−1) was also obtained by applying the default carbon fraction (0.47 of dry biomass) in IPCC (2006).
2.5. Statistical Test of Allometric Equation
Biomass and diameter at breast height (DBH) data were log-transformed prior to regression analysis to meet the assumptions of linearity and homoscedasticity. Model performance was evaluated using the coefficient of determination (R2), root mean squared error (RMSE; Equation (2)), mean absolute error (MAE; Equation (3)), and mean percentage error (MPE; Equation (4)). The normality of model residuals was assessed using the Shapiro–Wilk test, and diagnostic evaluations were conducted through quantile–quantile (Q–Q) plots and residuals versus fitted value plots to verify model assumptions.
To further assess the predictive robustness, leave-one-out cross-validation (LOOCV) was applied, and the model’s generalization performance was evaluated by synthesizing prediction errors across iterations. For model comparison and auxiliary analyses, the Akaike information criterion (AIC) and Bayesian information criterion (BIC) were calculated. The statistical significance of regression coefficients was assessed using standard errors (SEs), t-statistics, and associated p-values.
Differences in allometric relationships among organs and sampling regions were examined using analysis of covariance (ANCOVA). Estimation uncertainty was quantified using 95% confidence intervals, and uncertainty propagation was evaluated following standard error propagation principles. Additional statistical analyses and detailed results are provided in the Supplementary Materials. All analyses were conducted in R software (version 4.5.1; R Core Team, Vienna, Austria) and used packages including “ggplot2”, “dplyr”, “tidyverse”.
n: number of sample trees;
y: measured biomass of sample trees;
ŷ: biomass of sample trees estimated by allometric equation
3. Results
3.1. Derivation of the Allometric Equation of S. chaenomeloides
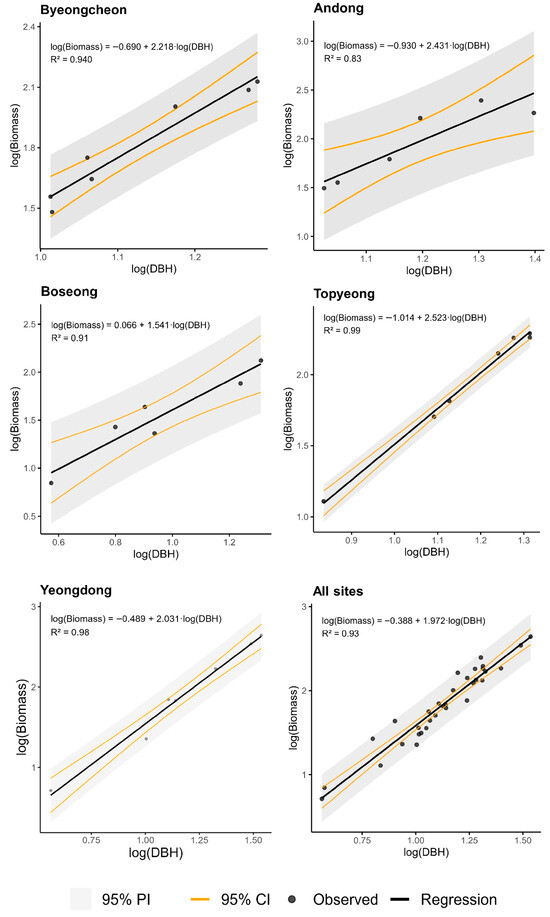
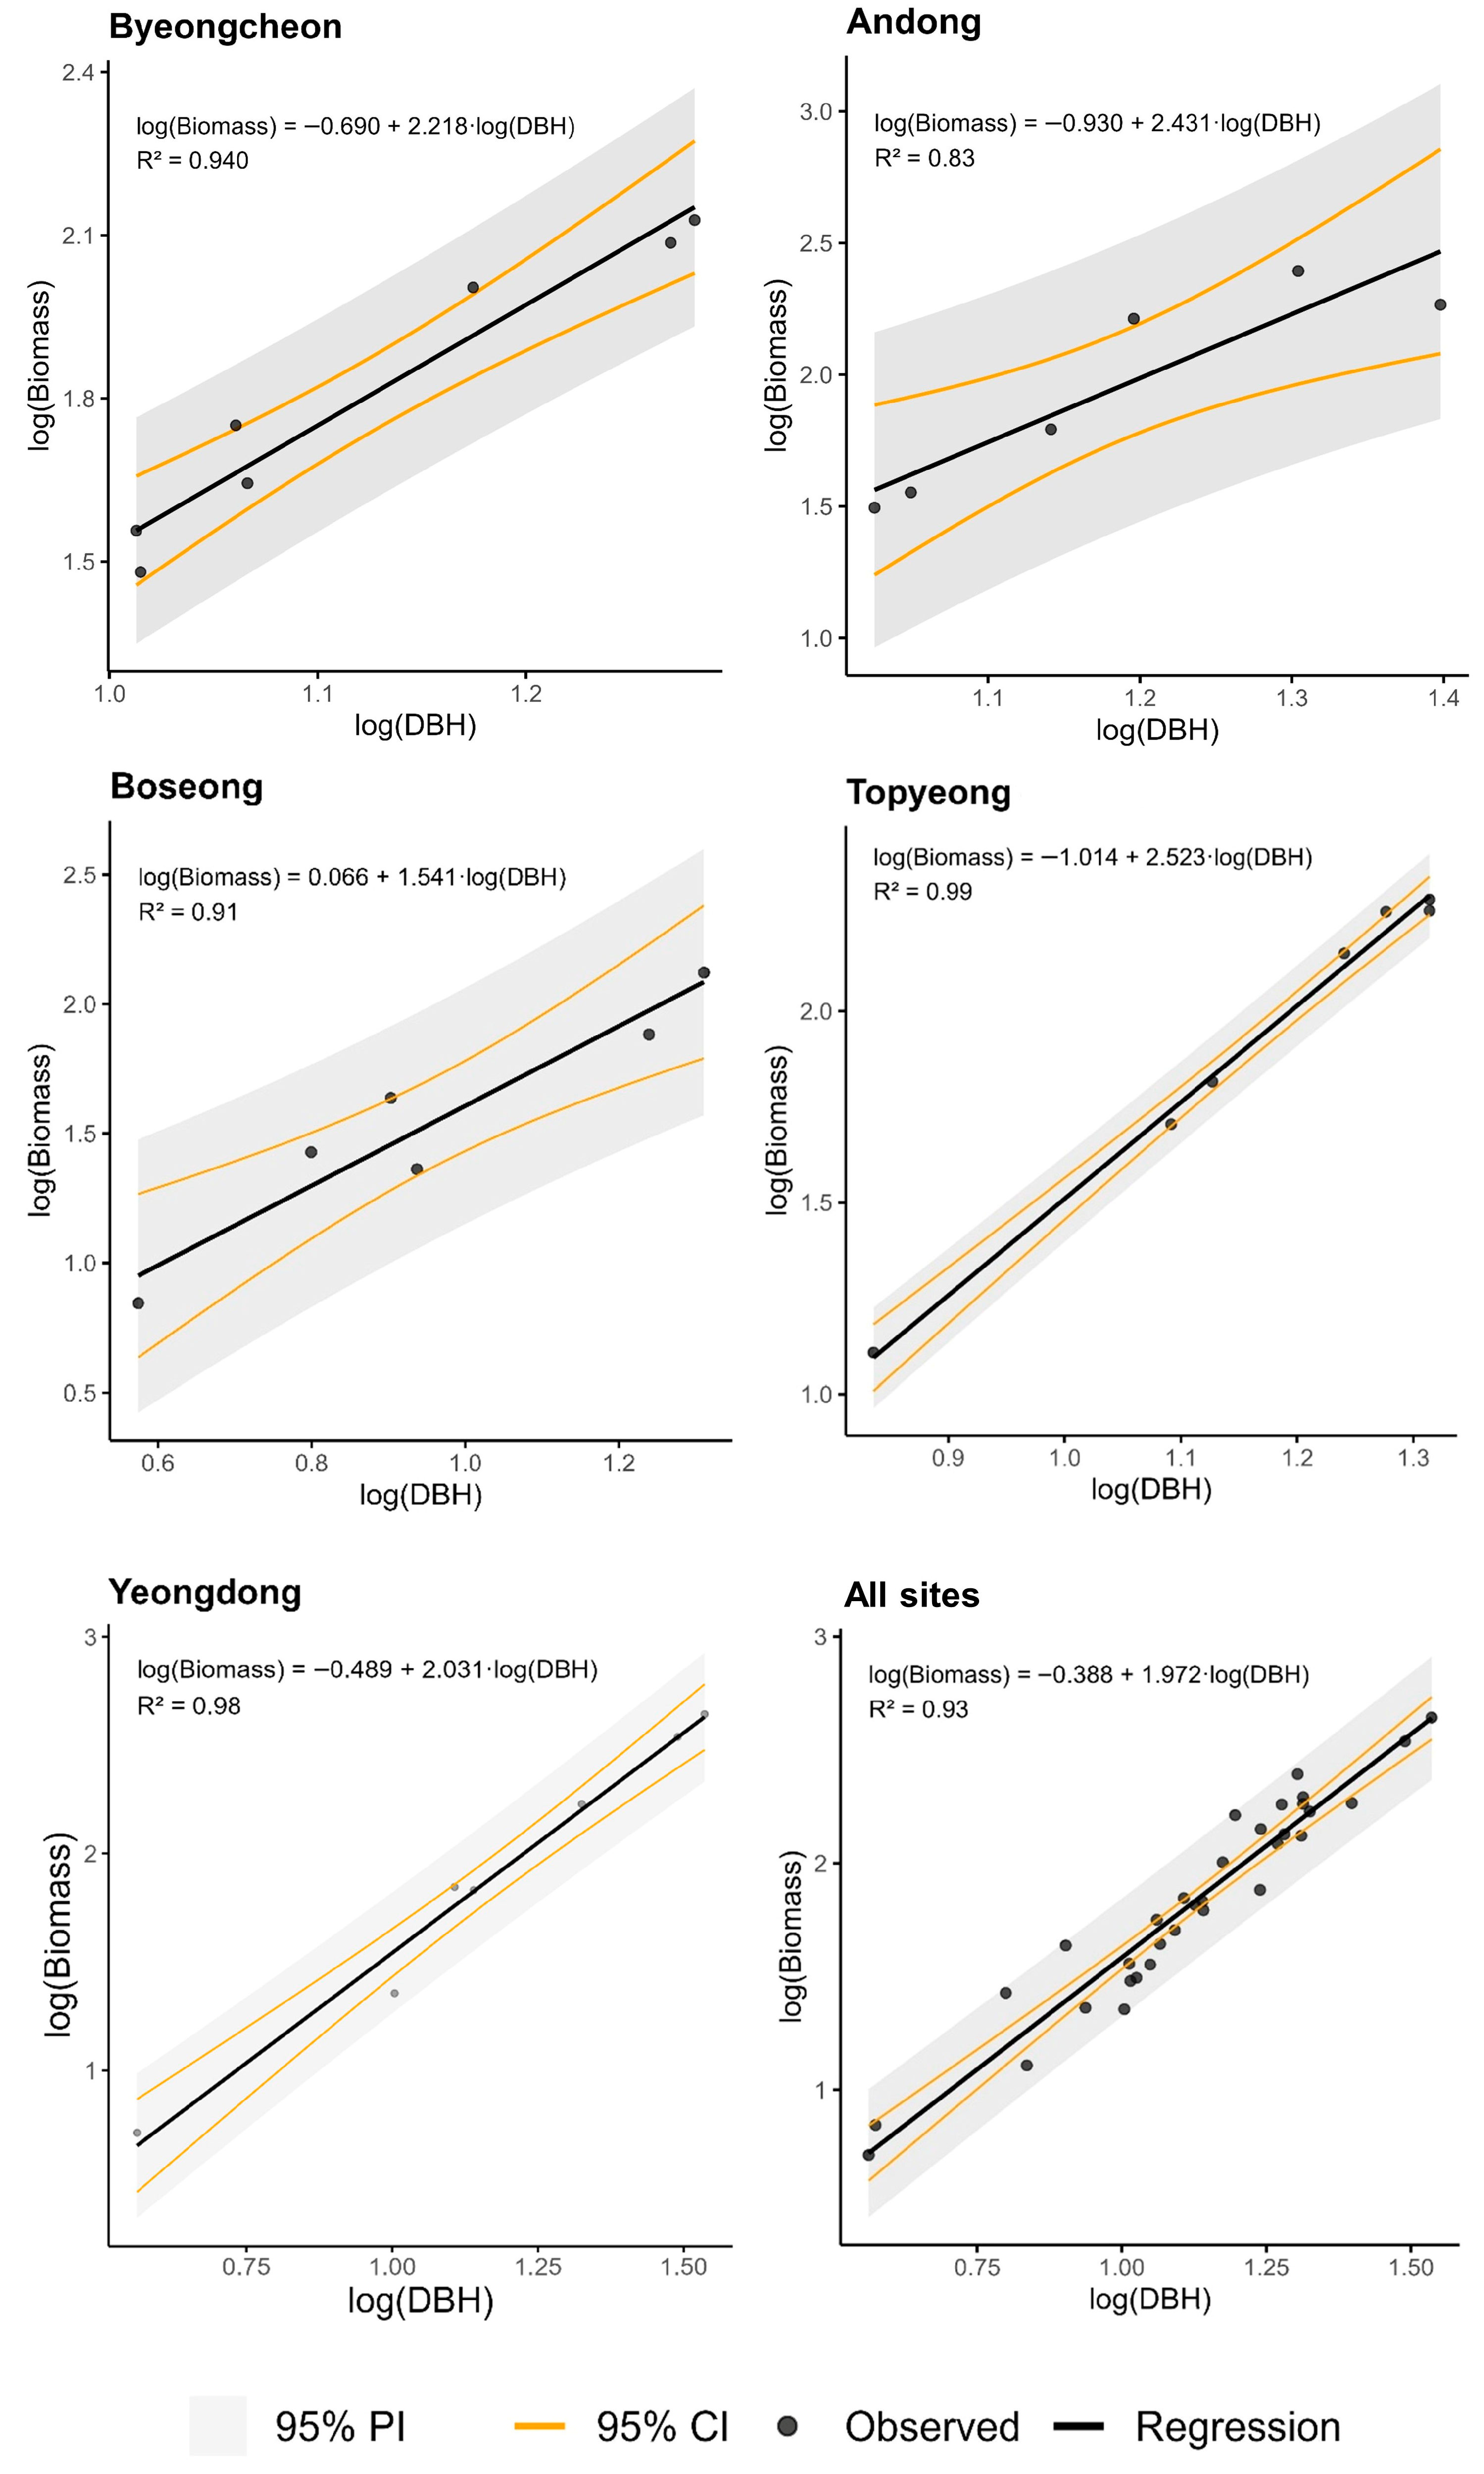
Across all sites, log-transformed DBH strongly predicted log-transformed biomass (R2 = 0.83–0.99; Figure 2), confirming robust DBH-based allometric relationships. Topyeong and Yeongdong showed near-perfect fits (R2 ≥ 0.98), indicating highly uniform stand structure, while Byeongcheon and Boseong also exhibited strong relationships (R2 = 0.91–0.94). Andong showed the weakest fit (R2 = 0.83), reflecting greater biomass variability for a given DBH. Site-specific slopes (1.54–2.52) varied, indicating differences in biomass accumulation relative to diameter growth, with steeper slopes at Topyeong and Andong and shallower scaling at Boseong.
Figure 2.
Allometric relationships between diameter at breast height (DBH) and dry biomass of S. chaenomeloides obtained from five riparian zones. Each regression equation was obtained from 33 samples obtained from each organ and from the whole tree. Allometric relationships between diameter at breast height (DBH) and dry biomass of each organ were shown in Supplementary Figure S1.
Regression confidence intervals were generally narrow, particularly at Topyeong and Yeongdong, whereas wider prediction intervals captured individual-level variability and expanded at DBH extremes due to limited sample sizes. The pooled model retained high explanatory power (R2 = 0.93) but showed increased scatter and wider prediction intervals, indicating that site-level heterogeneity is partially obscured. Overall, site-specific equations provide the most precise biomass estimates, while the pooled model is appropriate for regional-scale applications with increased uncertainty at individual sites.
3.2. Assessment of the Derived Allometric Equation
Table 3 indicates that the log-transformed DBH-based allometric equations provided generally strong biomass predictions across sites, with clear differences among organs. Stem and whole-tree biomass showed consistently high model performance (R2 > 0.90 across most sites), particularly at Topyeong and Yeongdong (R2 = 0.97–0.99), accompanied by low RMSE and MAE values, demonstrating high predictive precision. In contrast, branch, leaf, and root biomass exhibited greater variability in model fit, with moderate explanatory power for branches (R2 = 0.57–0.93) and leaves (R2 = 0.66–0.96), and the weakest and most variable performance for roots, especially at Byungcheon (R2 = 0.47).
Table 3.
Verification of fitness for the allometric regression equations. Each value was calculated based on log-transformed values.
Mean percentage error (MPE) was generally close to zero, particularly for stem and whole-tree biomass, indicating minimal systematic bias, whereas larger absolute MPE values for branches, leaves, and roots reflected higher uncertainty in smaller and more variable biomass fractions. When pooled across all sites (n = 33), model performance remained strong for stem and whole-tree biomass (R2 = 0.94 and 0.93), but declined for organ-level components (R2 = 0.71–0.81), highlighting the robustness of DBH-based models for total biomass estimation and the importance of site- or organ-specific calibration for finer biomass partitioning.
3.3. Verification of Normality and Homogeneity
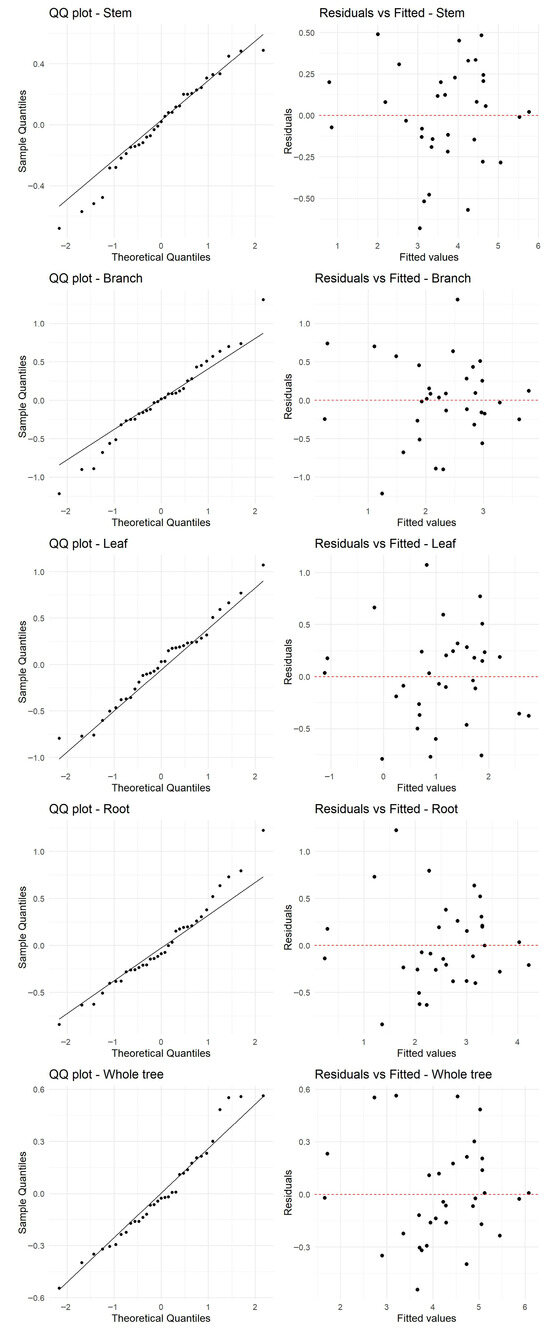
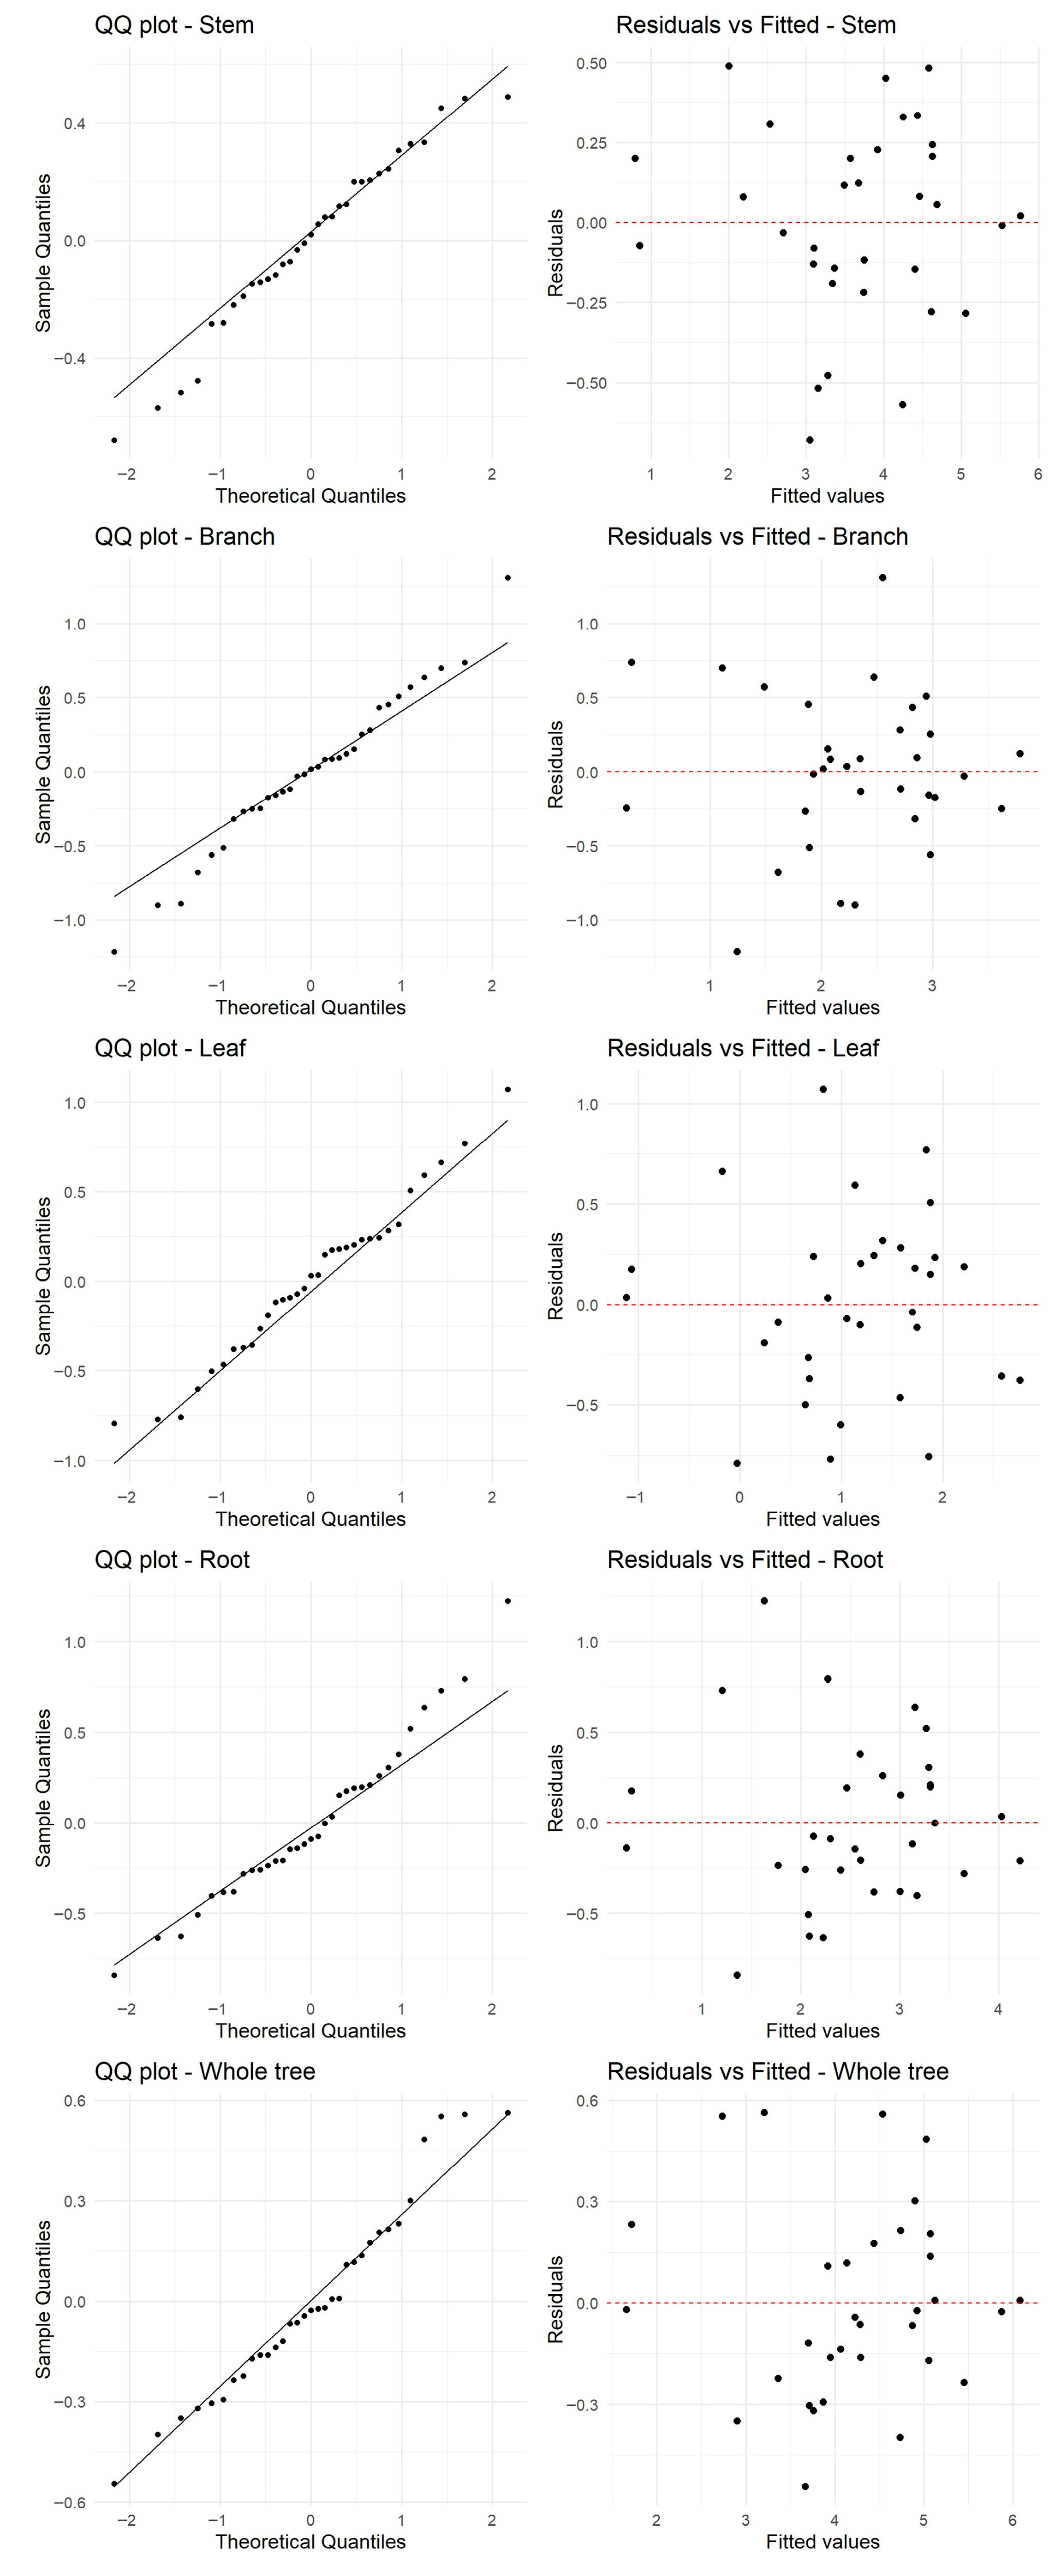
As a result of residual analysis, the residual in the QQ plot was close to the straight line to satisfy the normality, and the Residuals vs. Fitted plot did not show a clear pattern or increase in variance, confirming equal variance (Figure 3). The Shapiro–Wilk normality test results are presented in Supplementary Table S1. In the Yeongdong area, DBH was distributed to 3.65–34.35 cm and biomass of individual tree to 5.15–439.89 kg, indicating significantly different growth stages within the same area. Due to this distribution characteristic, the residuals of the log–log allometric equation rejected normality (p = 0.0196), but the result of the Residual vs. Fitted plot (QQ plot) did not identify any serious violations, and considering the log-normal biomass distribution characteristics, this model is considered sufficiently suitable for biomass estimation.
Figure 3.
Results of QQ plot and RVF.
3.4. NPPs of Individuals and Stands of S. chaenomeloides Based on the Allometric Method
The stand density and net primary productivity (NPP) of S. chaenomeloides are summarized in Table 4. NPP, estimated using the allometric approach, varied considerably among sites. The NPP of individual trees, calculated using the allometric method, was 8.48 (kg·tree−1·yr−1), 12.53 (kg·tree−1·yr−1), 4.27 (kg·tree−1·yr−1), 14.68 (kg·tree−1·yr−1), and 7.02 (kg·tree−1·yr−1) in Byeongcheon, Andong, Boseong, Topyeong, and Yeongdong, respectively; overall, the mean individual NPP was 9.40 (kg·tree−1·yr−1).
Table 4.
Stand density and net primary productivity (NPP) of individual trees and stands in Salix chaenomeloides communities established along five rivers in South Korea (unit: ton·C·ha−1·yr−1). NPP was obtained using the allometric method.
Stand-level NPP, estimated using the allometric approach, showed clear variation among sites (Table 4). Annual NPP was 6.36 ton ha−1 yr−1 at Byeongcheon, 8.77 ton ha−1 yr−1 at Andong, 1.07 ton ha−1 yr−1 at Boseong, 8.07 ton ha−1 yr−1 at Topyeong, and 1.76 ton ha−1 yr−1 at Yeongdong. Across all study areas, the mean NPP was 4.70 ton ha−1 yr−1.
3.5. Conversion Coefficients by Component Derived to Estimate Biomass in Stem Analysis
Biomass allocation patterns and conversion coefficients are presented in Table 5. Ratios of branch, leaf, and root biomass to stem biomass varied among sites, ranging from 0.12 to 0.37, 0.07 to 0.16, and 0.21 to 0.37, respectively. The average of these ratios across all rivers was 0.29 for branches, 0.10 for leaves, and 0.25 for roots. The proportion of root biomass relative to aboveground biomass (AGB) also showed site-specific differences, with values from 0.41 to 0.82 and a mean of 0.64.
Table 5.
Biomass conversion coefficients of branches, leaves, and roots relative to stem biomass. Each value was based on the oven-dry weight.
Wood density values (Table 6) ranged from 0.54 to 0.82 g·cm−3, with a mean of 0.63 g·cm−3. Corresponding biomass expansion factors (BEFs) varied between 1.19 and 1.52, averaging 1.37 across all sites. The root-to-AGB ratio ranged from 0.21 to 0.37, with a mean of 0.25. These coefficients provide the basis for scaling organ-level biomass to whole-tree and stand-level estimates.
Table 6.
Biomass expansion factors derived from the studied river sites. Wood density was obtained based on the oven-dry weight to the fresh volume and biomass expansion factor and root ratios were obtained based on the oven-dry weight.
3.6. Derivation of the Allometric Equations of S. chaenomeloides Based on Stem Analysis
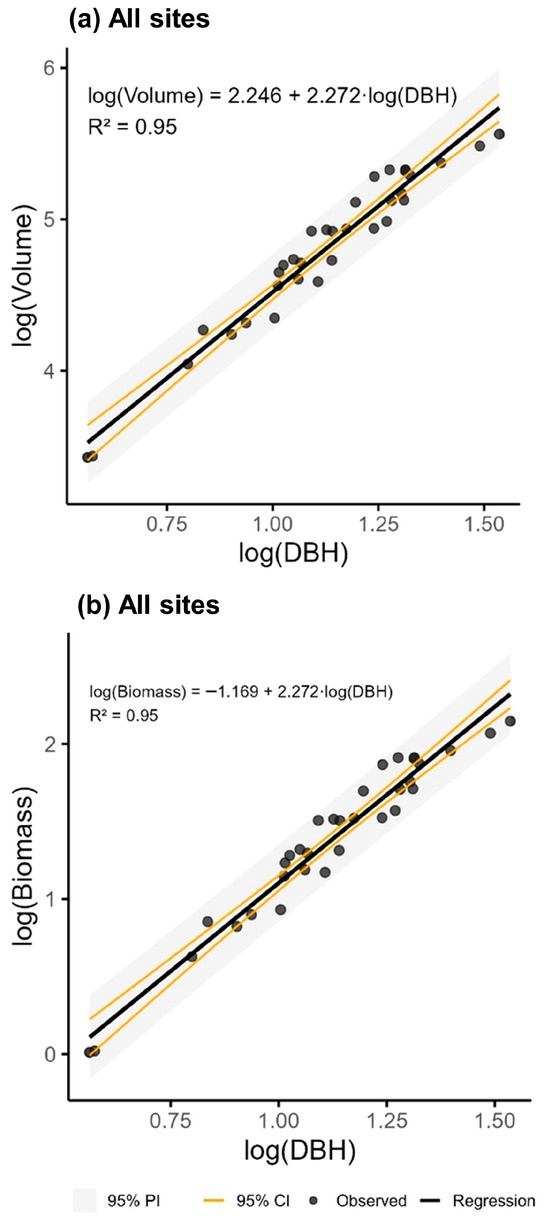
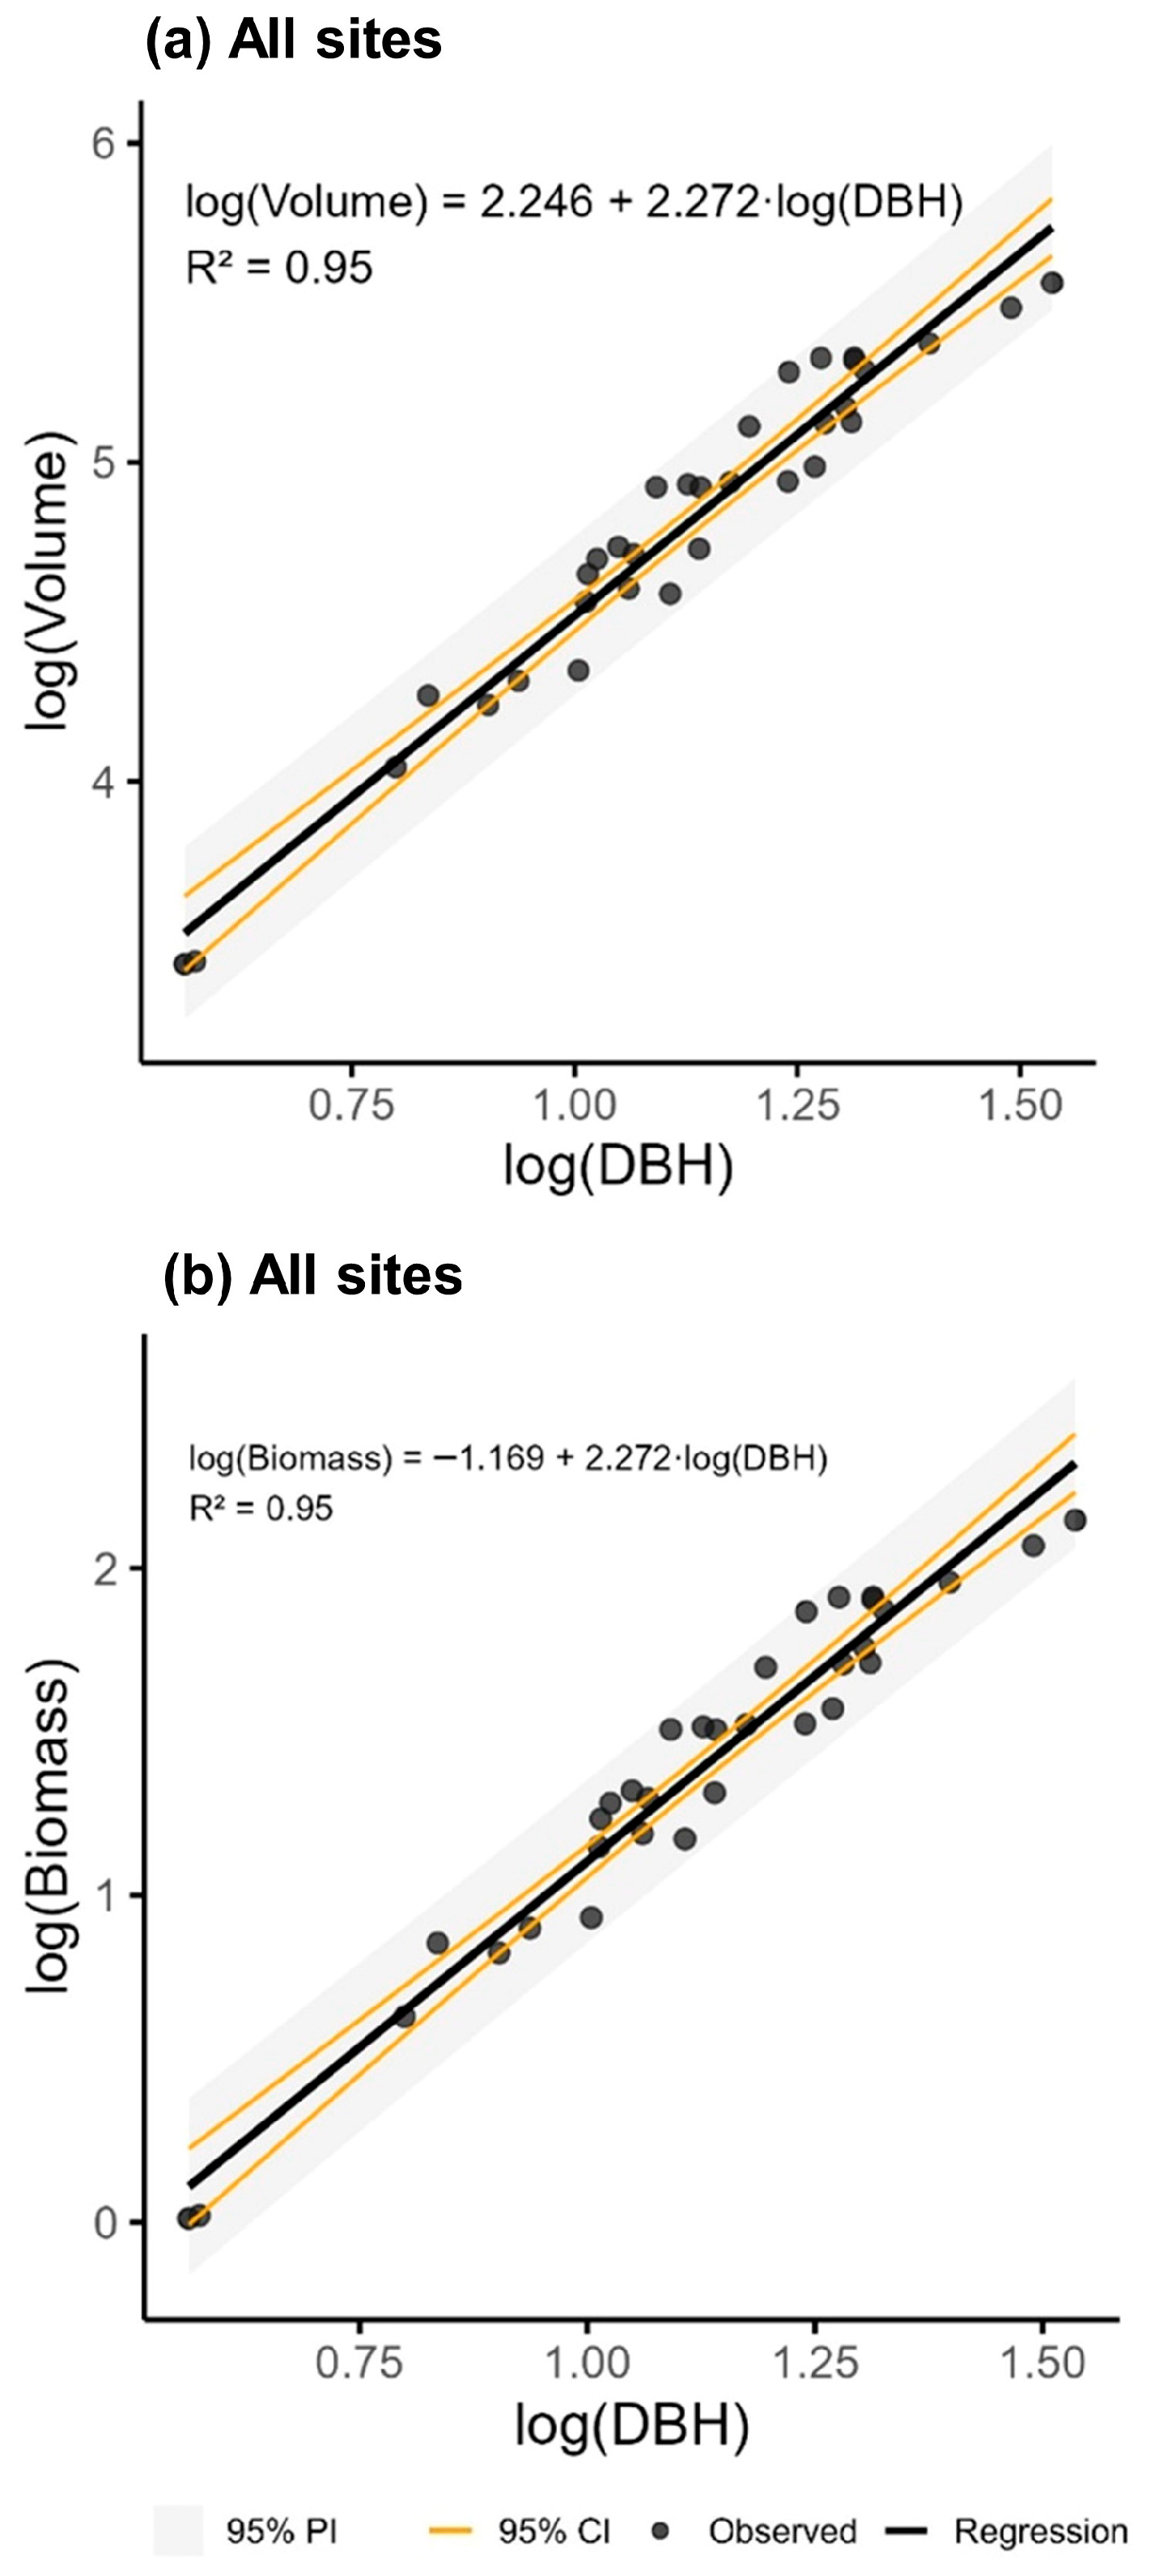
Both DBH–volume and DBH–biomass allometric models exhibited very strong linear relationships with identical explanatory power (R2 = 0.95; Figure 4a,b), indicating that DBH explains 95% of the variation in both variables across sites. The two models shared an identical scaling exponent (slope = 2.272), demonstrating proportional increases in volume and biomass with DBH and a stable biomass–volume relationship at the regional scale. Differences in intercepts reflected expected unit and magnitude differences between geometric volume and density-integrated biomass, rather than reduced model performance.
Figure 4.
Allometric relationships between DBH and stem volume (a) and biomass (b) of S. chaenomeloides obtained by combining data from Byeongcheon, Andong, Boseong, Topyeong, and Yeongdong River. Allometric relationships between DBH, and stem volume and biomass of S. chaenomeloides based on the data obtained from each river were shown in Supplementary Figures S2 and S3.
Regression parameters were precisely estimated, as indicated by narrow 95% confidence intervals, while wider but still constrained prediction intervals captured individual-tree variability, with slight widening at DBH extremes due to limited observations. The near-identical performance of the two models indicates that either volume- or biomass-based equations can be reliably applied for regional biomass estimation from DBH, supporting their transferability across sites while acknowledging the potential value of site-specific calibration where local conditions differ.
3.7. Assessment of the Allometric Equation Derived from Stem Analysis
Model evaluation metrics for the stem-analysis-based allometric equations are presented in Table 7. Whole-tree equations showed high explanatory power across all sites, with coefficients of determination exceeding 93%. Specifically, the explanatory rates were 93.1% at Byeongcheon, 96.8% at Andong, 99.6% at Boseong, 98.3% at Topyeong, and 99.0% at Yeongdong.
Table 7.
Statistical verification results for the allometric equations derived from stem analysis.
Generally, error statistics indicated strong model performance. RMSE and MAE values were low, ranging from 0.03 to 0.48 from RMSE and 0.03 to 0.10 from MAE, while MPE values were small but varied across sites (−0.11 to −1.66). The pooled dataset pertaining to all five sites yielded an explanatory rate of 95%, with very similar RMSE and MAE values of 0.12 and 0.10, respectively, and an MPE of 0.12, suggesting that combined-site models had slightly reduced accuracy compared to site-specific models.
3.8. Validation and Comparison of Model
Leave-one-out cross-validation (LOOCV) indicated high predictive accuracy across sites, with overall RMSE and MAE values of 0.30 and 0.24, respectively, and a mean absolute percentage error (MAPE) of 6.24%. Prediction errors were lowest at Topyeong and Byeongcheon (RMSE = 0.11–0.18; MAPE = 2.38–3.84%) and slightly higher at Andong and Boseong (RMSE = 0.41–0.60; MAPE = 10.30–13.00%). Mean percentage error (MPE) values were close to zero across sites (−3.47 to 2.58%), indicating minimal systematic bias and strong model generalizability (Supplementary Table S2).
Model comparison using AIC and BIC showed that power–log regression consistently outperformed polynomial regression across all tree organs. The advantage was most pronounced for stem and whole-tree biomass, while branches, leaves, and roots also showed lower AIC and BIC values under the power–log model. These results support the power–log formulation as the most parsimonious and robust framework for describing organ-level biomass allocation, consistent with theoretical expectations of allometric scaling (Supplementary Table S3).
3.9. NPPs of Individuals and Stands of S. chaenomeloides Based on Stem Analysis
The stand density and net primary productivity (NPP) of S. chaenomeloides are summarized in Table 8. Stand density ranged from 250 to 750 (individuals∙ha−1). At the individual level, mean annual NPP ranged from 4.13 kg·tree−1·yr−1 at Boseong to 13.96 kg·tree−1·yr−1 at Andong, with an overall average of 9.02 kg tree−1 yr−1 across all sites.
Table 8.
Density and NPP of S. chaenomeloides at the individual and stand levels in the riparian zones of five South Korean rivers (unit: ton·ha−1·yr−1).
When scaled to the stand level, NPP varied between 1.03 ton ha−1 yr−1 (Boseong) and 9.77 ton ha−1 yr−1 (Andong). The mean stand-level NPP across all rivers was 4.51 ton ha−1 yr−1. These results highlight substantial site-to-site differences in productivity, with Andong and Topyeong exhibiting the highest values and Boseong and Yeongdong the lowest.
4. Discussion
4.1. Allometric Equation and Carbon Coefficient Derived for the Calculation of the Biomass of S. chaenomeloides
The allometric equation y = 1.972X − 0.388 (R2 = 0.93) showed a strong relationship between DBH and biomass of S. chaenomeloides. Based on this model, the estimated single-tree biomass and NPP were 72.72 kg and 9.40 kg yr−1, respectively, while the stand-level biomass and NPP were 38.83 ton ha−1 and 4.70 ton C ha−1 yr−1 (Table 4). On the other hand, when evaluating the biomass and NPP of a single tree and a stand of S. chaenomeloides based on the allometric equation derived from stem analysis, the single -tree biomass was found to be 87.42 kg, the single-tree NPP was 9.02 kg yr−1, the mean stand biomass was 48.75 ton ha−1, and the stand NPP was 4.51 ton ha−1 yr−1 (Table 8).
The site-specific allometric equations revealed significant variation in biomass–diameter relationships among the study locations. Slope parameters were statistically significant across all sites (p < 0.01), confirming stem diameter as a strong predictor of biomass accumulation. However, the magnitude and uncertainty of parameter estimates differed substantially. Topyeong exhibited the steepest slope (2.52) with the smallest standard error (SE = 0.09), indicating rapid biomass increases with diameter and a highly robust model fit. Andong also showed a relatively steep slope (2.43) but with larger associated uncertainty (SE = 0.56), reflecting greater variability in tree form or growth conditions. Byeongcheon and Yeongdong had moderate slopes (2.22 and 2.03, respectively), with significant slope estimates but weaker intercept significance in Byeongcheon (p = 0.06), suggesting structural heterogeneity within the stand. In contrast, Boseong showed the lowest slope (1.54) and a non-significant intercept (p = 0.80), implying reduced biomass responsiveness to diameter growth and potentially reflecting poorer site quality or suppressed growth. Collectively, these results emphasize the importance of using localized allometric relationships when estimating biomass or carbon stocks, particularly in ecologically variable landscapes (Supplementary Table S4).
4.2. Verification of Derived Model
The DBH-based allometric equations showed high explanatory power across organs and sites, with R2 values ranging from 0.47 to 0.99 for individual organs (Table 3) and from 0.83 to 0.99 across sites (Figure 2). Allometric equations derived from stem analysis further confirmed strong predictive performance, with R2 values of 0.93–1.00, low RMSE and MAE, and mean percentage errors close to zero (−1.66 to −0.11%), indicating negligible systematic bias (Table 7). Although RMSE was slightly higher at Topyeong, overall prediction accuracy remained high. When pooled across sites, the model retained strong explanatory power (R2 = 0.95), with modestly increased error due to inter-site variability and minimal bias (MPE = 0.12%) (Table 7).
The models were reliable within the observed DBH range (3.65–34.35 cm), which reflects typical size distributions of mature S. chaenomeloides stands in Korea, supporting their practical applicability. ANCOVA results showed a highly significant effect of log(DBH) on biomass (F = 471.51, p < 0.001), whereas site effects were not significant (F = 0.47, p = 0.75), indicating similar mean biomass at a given DBH across sites. The marginally significant DBH × site interaction (F = 2.87, p = 0.05) suggests weak but detectable site-specific variation in scaling slopes, implying that site-level calibration may slightly improve accuracy (Supplementary Table S5).
Standard errors of parameter estimates were generally low (0.03–0.42 across sites), and correction factors were close to 1.0, indicating stable model fitting. The pooled model exhibited higher uncertainty (SE = 1.11; CF = 1.85) due to combined site heterogeneity but remained valid for regional-scale applications (Supplementary Table S6).
Uncertainties in wood density, biomass expansion factor, and root ratio varied among sites, with higher variability at Andong and Boseong and lower uncertainty at Topyeong and Byeongcheon; integrated uncertainties remained acceptable (12.51% for WD, 17.87% for BEF, and 4.95% for root ratio) (Supplementary Table S7).
Leave-one-out cross-validation (LOOCV) further confirmed stable predictive performance and model robustness (Supplementary Table S2). Overall, these results demonstrate consistent allometric scaling of biomass with stem diameter across riparian environments, indicating that S. chaenomeloides forms structurally coherent riparian forests with predictable biomass accumulation and reliable carbon sequestration potential despite local environmental variability.
4.3. Characteristics, Limitations, and Utilization of Allometric and Stem Analysis Methods
The allometric method is based on predictable scaling relationships between easily measured plant dimensions (e.g., diameter, height, crown size) and biomass. It assumes that plant form follows regular biological growth laws, meaning that biomass can be statistically inferred from external structural traits [37,38]. The allometric method is a widely used, non-destructive, and cost-effective approach for estimating forest carbon sequestration by relating tree measurements to biomass through species- or region-specific equations [39,40,41]. Its scalability—from small plots to broader landscapes—makes it highly practical, although accuracy depends on using appropriate equations and overcoming field measurement challenges. Assumptions about belowground biomass or carbon content can also introduce uncertainty, yet the method remains fundamental for assessing forest carbon dynamics and informing climate mitigation strategies [42,43,44,45,46,47].
Stem analysis offers a complementary approach by reconstructing tree growth and biomass accumulation through cross-sectional examination of annual rings. It is grounded in dendrochronology and growth reconstruction theory. This provides detailed, year-specific carbon sequestration estimates that can be scaled to stands using tree density and further expanded through modeling tools [48,49,50,51]. Although labor-intensive and limited in sample size, it enables broader carbon assessments when integrated with remote sensing and forest inventory data [52,53,54].
Both methods were developed for vegetation established in forests, which is a relatively stable environment compared to riparian zones. Therefore, careful attention should be paid to field surveys and laboratory analysis to apply these methods to riparian vegetation with severe deformation of each organ, including the stem, due to frequent disturbances.
4.4. NPP of the S. chaenomeloides Stand
Using the allomatic equation derived in the study, the NPP of a single tree was estimated to 4.27 to 14.68 kg yr−1, while the NPP of a S. chaenomeloide stand was 0.5 to 4.38 ton C ha−1∙yr−1. Applying the carbon coefficient, the NPP of a single S. chaenomeloides tree was estimated to be 4.13 to 13.96 kg yr−1, while the NPP of an S. chaenomeloides stand was estimated to be 0.52 to 4.89 kg yr−1. The NPP of a single S. pierotii was 1.8 to 8.17 kg yr−1, and indicating wide variation [34]. The NPP of an S. pierotii stand ranged between 5.35 and 20.52 ton C ha−1∙yr−1 [34]. Meanwhile, the NPPs of Salix spp. calculated in various parts of the world ranged from 4.5 ton C ha−1∙yr−1 to 8.2 ton C ha−1∙yr−1 (Supplementary Table S8) [41,42,43,44]. These results suggest that the NPP of S. chaenomeloides at both the single tree and stand levels is similar to other willow species.
In a previous study aiming to derive the allometric equations for S. pierotii [34], the density of the community was high (an average of 2700 individuals per ha). However, the S. chaenomeloides density in this study was 500 individuals per ha, significantly lower than that of the S. pierotii community. This difference is believed to be due to the difference in the spatial niches of S. chaenomeloides and S. pierotii. In other words, compared to S. pierotii, the habitat of S. chaenomeloides stands is located farther from the waterway. In this regard, the low density of S. chaenomeloides stands can be attributed to the transformation of their main habitat to other land types, as occurs frequently in Korea, as land-use intensity is high in riparian areas. Therefore, we speculate that the low NPP of S. chaenomeloides stands is due to this density difference, rather than the NPP of a single tree.
Among sites, NPP was higher at Andong and Topyeong and lower at Boseong and Yeongdong, corresponding to differences in conservation status and anthropogenic disturbance rather than intrinsic site conditions.
Uncertainty-propagated NPP estimates revealed substantial spatial variability, with mean values ranging from 0.91 to 5.66 ton ha−1 yr−1. Andong showed the highest productivity but greatest uncertainty, whereas Byeongcheon exhibited high NPP with the lowest relative uncertainty, indicating more stable stand structure. Overlapping uncertainty intervals among sites highlight the need to account for uncertainty when comparing productivity and assessing riparian carbon dynamics (Supplementary Table S9).
4.5. Comparison of Growth Strategies and Carbon Absorption Capacities by Species Through Allometric Equation Coefficient
In the allometric equation, the slope coefficient b is more than just a regression coefficient; it is a key indicator of the growth strategy and speed of several species. When log Y = b log X + log a is converted into an exponential function, it appears as a power function of Y = aXb. At this time, b acts as an exponential term that determines the rate of increase in the dependent variable (biomass) according to the increase in the independent variable (diameter at breast height, height, etc.). Therefore, for the same diameter or height increase, the larger the species b value, the faster the accumulation of biomass. In other words, the coefficient b is an index that mathematically expresses the relative growth rate of a population beyond a simple statistical fit, and has an important meaning in quantitatively interpreting the difference in physiological growth strategies among species.
In general, b values are larger in fast-growing early successional species and smaller in stable late successional species [35,36]. The allometric equation of Quercus mongolica, a representative late successional species, is Y = 0.595D1.766, i.e., b = 1.766. Meanwhile, the allometric equation of a representative early successional species, Pinus dentiflora, is Y = 0.235D2.071, indicating, i.e., b = 2.071 [47]. In this context, the allometric equation of S. chaenomeloides is Y = 0.1257 D2.2158, i.e., b = 2.2158, and the allometric equation of Salix pierotii is Y = 0.0521 D2.4476, i.e., b = 2.4476. The b values for these species, from highest to lowest, are in the order S. pierotii, S. chaenomeloides, P. densiflora, and Q. mongolica. These results confirmed that the growth of riparian plants is faster than that of upland forest plants, and that the growth also differed according to the successional stage. The results also suggest that riparian vegetation, especially willow communities, can function as carbon sinks, with high productivity and carbon accumulation potential beyond simple river buffering functions. This provides the basis for considering riparian vegetation as independent and effective carbon sinks in the existing forest-centered carbon sink management system.
4.6. Importance of Riparian Vegetation as a Carbon Sink and the Need for River Restoration
In many rice-dependent countries, riparian zones and floodplains have historically been converted into paddy fields to ensure food security. While this transformation has contributed to agricultural productivity, it has simultaneously reduced the ecological width of rivers, degraded habitats, and heightened the vulnerability of freshwater systems to climate change. Narrow and channelized rivers are less resilient to hydrological variability, extreme weather events, and biodiversity loss. Against this backdrop, the restoration of riparian zones has emerged as a critical strategy, not only for ecological conservation but also for sustainability-oriented climate change mitigation [48,49,50,51].
Riparian ecosystems are characterized by fertile soils, high moisture availability, and dynamic nutrient cycles. These conditions allow riparian vegetation to exhibit relatively high productivity compared to adjacent terrestrial ecosystems. As a result, restored riparian areas have the potential to function as highly effective carbon sinks, storing atmospheric CO2 in both biomass and soils. This capacity is particularly significant in the current era, where achieving carbon neutrality as a strategy to secure global sustainability is central to addressing the accelerating climate crisis. By enhancing aboveground biomass accumulation and promoting soil carbon sequestration, riparian vegetation can contribute meaningfully to national and global carbon budgets [30,51,52,53]. From a sustainability perspective, this dual function positions riparian systems as strategic components of nature-based climate solutions rather than peripheral landscape elements.
Moreover, the multifunctionality of riparian restoration extends beyond carbon absorption. Restored riparian zones improve water quality through nutrient retention, buffer the impacts of floods and droughts, and provide habitat corridors that support biodiversity. These ecosystem services create a synergistic link between climate mitigation and adaptation, reinforcing the role of riparian systems in integrated sustainability governance. From an academic standpoint, integrating riparian carbon sequestration into broader ecological and carbon accounting frameworks addresses a critical research gap: while forests, wetlands, and oceans have long been recognized in global climate strategies, riparian systems remain underestimated [34,54,55].
Therefore, restoring rivers and their riparian zones is not merely an ecological imperative but also a climate policy priority. Securing riparian carbon sinks can serve dual purposes—enhancing landscape resilience against climate extremes while contributing to the carbon neutrality goals demanded by international agreements such as the Paris Accord. Future research should quantify the spatial and temporal dynamics of carbon storage in riparian ecosystems, assess trade-offs with agricultural land use, and explore governance models that balance food security with ecosystem restoration [8,34,56].
In conclusion, river and riparian restoration provides a unique opportunity to align ecological health, human well-being, and climate change mitigation within a unified sustainability framework. Recognizing riparian vegetation as a significant and underutilized carbon sink is an essential step toward developing integrated strategies that reconcile agricultural demands with the urgent need to achieve carbon neutrality and long-term sustainability [5,57,58,59].
Riparian ecosystems’ high capacity to store above- and belowground carbon indicates the need to formally integrate them into national greenhouse gas (GHG) inventory frameworks, which currently emphasize forests, wetlands, and agricultural lands while overlooking riparian zones despite their productivity and multifunctional roles. For countries like Korea, incorporating riparian carbon pools into the LULUCF sector would improve carbon budget accuracy, support Paris Agreement requirements for transparent inventories, and justify expanded investment in river restoration as a Nature-based Solution. Because riparian restoration simultaneously enhances flood buffering capacity, water quality regulation, biodiversity conservation, and climate resilience, it can advance both mitigation and adaptation objectives within national climate strategies and sustainability policies. Embedding riparian carbon sequestration into national reporting systems would allow nations to fully recognize these underutilized natural carbon sinks and strengthen policy support for restoring resilient, climate-beneficial riparian landscapes.
5. Conclusions
This study developed and validated allometric equations for estimating the biomass and NPP of S. chaenomeloides across five riparian sites, showing strong DBH-based correlations (R2 > 0.70) and reliable model performance supported by validation metrics (RMSE, MAE, MPE). The results revealed significant site-specific variation in NPP, ranging from 0.50 to 4.12 ton C·ha−1·yr−1 at the stand level, with a mean of approximately 2.45 ton C·ha−1·yr−1 across all sites. These values underscore the potential role of S. chaenomeloides in carbon sequestration within riparian landscapes, where biomass accumulation is influenced by local hydrological and edaphic conditions. The derived biomass conversion coefficients and expansion factors provide practical tools for scaling individual tree measurements to stand-level carbon assessments, enabling more accurate integration of willow communities into regional carbon accounting frameworks. In particular, this study developed a basic tool for calculating NPP by applying both the allometric method and the stem analysis method. Furthermore, this study calculated the NPP at both the individual and stand levels, and thus, expanded the utilization of the results.
Overall, this study demonstrates that S. chaenomeloides stands contribute meaningfully to carbon absorption and storage in riparian ecosystems. The allometric models developed here enable precise biomass and carbon flux estimation and offer a foundation for assessing restoration outcomes and riparian climate mitigation potential, while future work should incorporate temporal change, species differences, and broader environmental gradients to further improve carbon accounting.
Looking ahead, the validated allometric models and NPP estimates developed for S. chaenomeloides will provide a foundational framework that can be systematically integrated into national carbon datasets and future updates of land-sector reporting.
Supplementary Materials
The following supporting information can be downloaded at: https://www.mdpi.com/article/10.3390/su18052496/s1, Figure S1: Allometric relationships between diameter at breast height (DBH) and dry biomass of stems, branches, leaves, roots, and whole trees of S. chaenomeloides from each site; Figure S2: Allometric relationships between DBH and stem volume of S. chaenomeloides from each site; Figure S3: Allometric relationships between diameter at breast height (DBH) and biomass estimated from stem analysis of Salix chaenomeloides excavated each site; Table S1: Shapiro–Wilk normality test results for model residuals by site; Table S2: Result of leave-one-out cross-validation; Table S3: Result of AIC/BIC between Power-log regression and Polynomial regression; Table S4: Parameter estimates and standard errors (SE) of the site-specific allometric equations; Table S5: ANCOVA results evaluating slope differences (log(DBH) × Site) among sampling sites; Table S6: Standard errors (SE) of parameter estimate and correction factors (CF) for the log-transformed allometric models; Table S7: Uncertainty of wood density, biomass expansion factor, and root ratio by site; Table S8: Comparison of net primary productivity (NPP) of willow species (Salix spp.) measured in various countries; Table S9: Uncertainty-propagated Net Primary Productivity (NPP) by site.
Author Contributions
Conceptualization, C.S.L.; methodology, B.S.L., J.S., S.J.J. and C.S.L.; software, B.S.L., J.S., G.T.K. and C.S.L.; validation, S.J.J. and C.S.L.; formal analysis, J.S., G.T.K. and C.S.L.; investigation, B.S.L., J.S., S.J.J. and C.S.L.; resources, C.S.L.; data curation, C.S.L.; writing—original draft preparation, C.S.L.; writing—review and editing, S.J.J. and C.S.L.; visualization, S.J.J. and C.S.L.; supervision, C.S.L.; project administration, C.S.L.; funding acquisition, C.S.L. All authors have read and agreed to the published version of the manuscript.
Funding
This work was supported by the Korea Environment Industry & Technology Institute (KEITI) through the Wetland Ecosystem Value Evaluation and Carbon Absorption Value Promotion Technology Development Project, funded by the Korea Ministry of Environment (2022003630002).
Institutional Review Board Statement
Not applicable.
Informed Consent Statement
Not applicable.
Data Availability Statement
The data are included in the manuscript.
Conflicts of Interest
The authors declare no conflicts of interest.
Abbreviations
The following abbreviations are used in this manuscript:
| AGB | Above-ground Biomass |
| BEF | Biomass Expansion Factor |
| DBH | Diameter of Breast Height |
| MAE | Mean Absolute Error |
| MPE | Mean Percentage Error |
| NPP | Net Primary Productivity |
| R | Root Ratio |
| RMSE | Root Mean Squared Error |
| WD | Wood Density |
References
- Evro, S.; Oni, B.A.; Tomomewo, O.S. Global Strategies for a Low-Carbon Future: Lessons from the US, China, and EU’s Pursuit of Carbon Neutrality. J. Clean. Prod. 2024, 461, 142635. [Google Scholar] [CrossRef] [Scilit]
- Peng, J.; Xu, D.; Xu, Z.; Tang, H.; Jiang, H.; Dong, J.; Liu, Y. Ten Key Issues for Ecological Restoration of Territorial Space. Natl. Sci. Rev. 2024, 11, nwae176. [Google Scholar] [CrossRef] [Scilit]
- Jain, H. Synergizing Carbon Reduction Technologies and Nature-Based Solutions for a Climate-Neutral Future. Mitig. Adapt. Strateg. Glob. Change 2025, 30, 42. [Google Scholar] [CrossRef] [Scilit]
- Nóbrega, R.L.B.; Ziembowicz, T.; Torres, G.N.; Guzha, A.C.; Amorim, R.S.S.; Cardoso, D.; Johnson, M.S.; Santos, T.G.; Couto, E.; Gerold, G. Ecosystem Services of a Functionally Diverse Riparian Zone in the Amazon–Cerrado Agricultural Frontier. Glob. Ecol. Conserv. 2020, 21, e00819. [Google Scholar] [CrossRef] [Scilit]
- Dinca, L.; Murariu, G.; Lupoae, M. Understanding the Ecosystem Services of Riparian Forests: Patterns, Gaps, and Global Trends. Forests 2025, 16, 947. [Google Scholar] [CrossRef] [Scilit]
- de Simone, L.; Fanfarillo, E.; Fiaschi, T.; Maccherini, S.; Bonari, G.; Angiolini, C. Riparian Structural Vegetation Types Exhibit Differential Responses to Local Community Drivers. Hydrobiologia 2025, 852, 2971–2991. [Google Scholar] [CrossRef] [Scilit]
- Aishan, T.; Betz, F.; Halik, Ü.; Cyffka, B.; Rouzi, A. Biomass Carbon Sequestration Potential by Riparian Forest in the Tarim River Watershed, Northwest China: Implication for the Mitigation of Climate Change Impact. Forests 2018, 9, 196. [Google Scholar] [CrossRef] [Scilit]
- Dybala, K.E.; Matzek, V.; Gardali, T.; Seavy, N.E. Carbon Sequestration in Riparian Forests: A Global Synthesis and Meta-Analysis. Glob. Change Biol. 2019, 25, 57–67. [Google Scholar] [CrossRef] [Scilit]
- Baggaley, N.; Britton, A.; Sandison, F.; Lilly, A.; Stutter, M.; Rees, R.; Reed, M.; Buckingham, S. Understanding Carbon Sequestration from Nature-Based Solutions; The James Hutton Institute: Scotland, UK, 2022. [Google Scholar] [CrossRef]
- Joshi, K.; Rana, D.; Ram, J. Tree Biomass and Carbon Stock Variations between Riparian and Terrestrial Forests in Central Himalaya. Curr. World Environ. 2025, 20, 850. [Google Scholar] [CrossRef] [Scilit]
- Sutfin, N.A.; Wohl, E.E.; Dwire, K.A. Banking Carbon: A Review of Organic Carbon Storage and Physical Factors Influencing Retention in Floodplains and Riparian Ecosystems. Earth Surf. Process. Landf. 2016, 41, 38–60. [Google Scholar] [CrossRef] [Scilit]
- Salerno, L.; Vezza, P.; Perona, P.; Camporeale, C. Eco-Morphodynamic Carbon Pumping by the Largest Rivers in the Neotropics. Sci. Rep. 2023, 13, 5591. [Google Scholar] [CrossRef] [Scilit]
- Yun, S.-L.; McCloskey, T.A.; Cohen, M.C.; Liu, K.; Shin, H.-S.; Ryu, J. Natural and Anthropogenic Factors Controlling Organic Carbon Storage in Riverine Wetlands along South Korea’s Four Rivers. Sci. Rep. 2025, 15, 539. [Google Scholar] [CrossRef] [Scilit] [PubMed]
- Matzek, V.; Lewis, D.; O’Geen, A.; Lennox, M.; Hogan, S.D.; Feirer, S.T.; Eviner, V.; Tate, K.W. Increases in Soil and Woody Biomass Carbon Stocks as a Result of Rangeland Riparian Restoration. Carbon Balance Manag. 2020, 15, 16. [Google Scholar] [CrossRef] [Scilit] [PubMed]
- Calderón-Balcázar, A.; Cárdenas, C.D.; Díaz-Vasco, O.; Fandiño, E.; Márquez, T.; Pizano, C. Biomass and Carbon Stocks of Four Vegetation Types in the Llanos Orientales of Colombia (Mapiripán, Meta). Trees For. People 2023, 12, 100380. [Google Scholar] [CrossRef] [Scilit]
- Garrastazú, M.C.; Mendonça, S.D.; Horokoski, T.T.; Cardoso, D.J.; Rosot, M.A.; Nimmo, E.R.; Lacerda, A.E. Carbon Sequestration and Riparian Zones: Assessing the Impacts of Changing Regulatory Practices in Southern Brazil. Land Use Policy 2015, 42, 329–339. [Google Scholar] [CrossRef] [Scilit]
- Gumiero, B.; Veronesi, L.; Galgani, L.; Di Grazia, F.; Corsi, A.; Cirrone, R.G.; Loiselle, S.A. Seeing Is Believing: How Citizen Science Challenges Riparian Misconceptions. Open Res. Eur. 2025, 5, 89. [Google Scholar] [CrossRef] [Scilit]
- Valach, A.C.; Kasak, K.; Hemes, K.S.; Anthony, T.L.; Dronova, I.; Taddeo, S.; Silver, W.L.; Szutu, D.; Verfaillie, J.; Baldocchi, D.D. Productive Wetlands Restored for Carbon Sequestration Quickly Become Net CO2 Sinks with Site-Level Factors Driving Uptake Variability. PLoS ONE 2021, 16, e0248398. [Google Scholar] [CrossRef] [Scilit]
- Chen, H.; Wei, Y.; Huang, J.J. Urbanization Diminishes Net Ecosystem Productivity by Changing the Landscape Pattern. Agric. For. Meteorol. 2025, 362, 110369. [Google Scholar] [CrossRef] [Scilit]
- Wu, Y.; Zhang, R.; MacDougall, A.S.; Tian, D.; Wang, J.; Niu, S. Wetland Restoration Is Effective but Insufficient to Compensate for Soil Organic Carbon Losses from Degradation. Glob. Ecol. Biogeogr. 2025, 34, e70063. [Google Scholar] [CrossRef] [Scilit]
- Nyberg, M.; Hovenden, M.J. Warming Increases Soil Respiration in a Carbon-Rich Soil without Changing Microbial Respiratory Potential. Biogeosciences 2020, 17, 4405–4420. [Google Scholar] [CrossRef] [Scilit]
- Bright, K.; Dienes, B.; Keiluweit, M.; Rixen, C.; Aeppli, M. Climate Change Impacts on Organic Carbon Cycling in European Alpine Soils. Soil Biol. Biochem. 2025, 210, 109891. [Google Scholar] [CrossRef] [Scilit]
- Oishy, M.N.; Shemonty, N.A.; Fatema, S.I.; Mahbub, S.; Mim, E.L.; Raisa, M.B.H.; Anik, A.H. Unravelling the Effects of Climate Change on the Soil-Plant-Atmosphere Interactions: A Critical Review. Soil Environ. Health 2025, 3, 100130. [Google Scholar] [CrossRef] [Scilit]
- Maraseni, T.; Mitchell, C. An Assessment of Carbon Sequestration Potential of Riparian Zone of Condamine Catchment, Queensland, Australia. Land Use Policy 2016, 54, 139–146. [Google Scholar] [CrossRef] [Scilit]
- Rheinhardt, R.D.; Brinson, M.M.; Meyer, G.F.; Miller, K.H. Carbon Storage of Headwater Riparian Zones in an Agricultural Landscape. Carbon Balance Manag. 2012, 7, 4. [Google Scholar] [CrossRef] [Scilit] [PubMed]
- Chang, L.; Ju, T.; Liu, H.; Li, Y. The Contribution of Saline-Alkali Land to the Terrestrial Carbon Stock Balance: The Case of an Important Agriculture and Ecological Region in Northeast China. Land 2024, 13, 900. [Google Scholar] [CrossRef] [Scilit]
- Naiman, R.J.; Decamps, H.; McClain, M.E. Riparia: Ecology, Conservation, and Management of Streamside Communities; Elsevier: Amsterdam, The Netherlands, 2010; ISBN 978-0-08-047068-9. [Google Scholar]
- Lee, C.S. ESG Management Should Consider Environmental Sustainability. J. Wetl. Res. 2023, 25, 248–256. [Google Scholar]
- Lim, B.-S.; Joo, S.-J.; Seok, J.-E.; Lee, C.-S. An Assessment of the Carbon Budget of the Passively Restored Willow Forests Along the Miho River, Central South Korea. Climate 2024, 12, 182. [Google Scholar] [CrossRef] [Scilit]
- Lim, B.S.; Seok, J.; Joo, S.J.; Lim, J.C.; Lee, C.S. Derivation and Application of Allometric Equations to Quantify the Net Primary Productivity (NPP) of the Salix pierotii Miq. Community as a Representative Riparian Vegetation Type. Forests 2025, 16, 1225. [Google Scholar] [CrossRef] [Scilit]
- Abdul Malak, D.; Marín, A.; Trombetti, M.; Sonsoles, S. Carbon Pools and Sequestration Potential of Wetlands in the European Union; European Topic Centre on Urban, Land and Soil Systems: Vienna, Austria; Malaga, Spain, 2021; ISBN 978-3-200-07433-0. [Google Scholar]
- Intergovernmental Panel on Climate Change (IPCC). 2006 IPCC Guidelines for National Greenhouse Gas Inventories; IUCN: Gland, Switzerland, 2006. [Google Scholar]
- Capon, S.J.; Chambers, L.E.; Mac Nally, R.; Naiman, R.J.; Davies, P.; Marshall, N.; Pittock, J.; Reid, M.; Capon, T.; Douglas, M.; et al. Riparian Ecosystems in the 21st Century: Hotspots for Climate Change Adaptation? Ecosystems 2013, 16, 359–381. [Google Scholar] [CrossRef] [Scilit]
- Paarlberg, A.; Sena, G.; Loc, H.H.; Schultner, J. Understanding Stakeholder Perspectives on the Implementation and Management of Riparian Buffer Zones in the Santa Lucia River Basin, Uruguay. Environ. Manag. 2025, 75, 2596–2613. [Google Scholar] [CrossRef] [Scilit]
- Braun-Blanquet, J. Pflanzensoziologie: Grundzüge Der Vegetationskunde; Springer: Berlin/Heidelberg, Germany, 2013; ISBN 3-7091-4078-1. [Google Scholar]
- Wolf, E.J.; Harrington, K.M.; Clark, S.L.; Miller, M.W. Sample Size Requirements for Structural Equation Models: An Evaluation of Power, Bias, and Solution Propriety. Educ. Psychol. Meas. 2013, 73, 913–934. [Google Scholar] [CrossRef] [Scilit]
- Parresol, B.R. Assessing Tree and Stand Biomass: A Review with Examples and Critical Comparisons. For. Sci. 1999, 45, 573–593. [Google Scholar] [CrossRef] [Scilit]
- Chave, J.; Andalo, C.; Brown, S.; Cairns, M.A.; Chambers, J.Q.; Eamus, D.; Fölster, H.; Fromard, F.; Higuchi, N.; Kira, T. Tree Allometry and Improved Estimation of Carbon Stocks and Balance in Tropical Forests. Oecologia 2005, 145, 87–99. [Google Scholar] [CrossRef] [Scilit]
- Sileshi, G.W. A Critical Review of Forest Biomass Estimation Models, Common Mistakes and Corrective Measures. For. Ecol. Manag. 2014, 329, 237–254. [Google Scholar] [CrossRef] [Scilit]
- Henry, M.; Picard, N.; Trotta, C.; Manlay, R.; Valentini, R.; Bernoux, M.; Saint André, L. Estimating Tree Biomass of Sub-Saharan African Forests: A Review of Available Allometric Equations. Silva Fenn. 2011, 45, 38. [Google Scholar] [CrossRef] [Scilit]
- Verlinden, M.S.; Broeckx, L.S.; Wei, H.; Ceulemans, R. Soil CO2 Efflux in a Bioenergy Plantation with Fast-Growing Populus Trees—Influence of Former Land Use, Inter-Row Spacing and Genotype. Plant Soil 2013, 369, 631–644. [Google Scholar] [CrossRef] [Scilit] [PubMed]
- Nakatsubo, T.; Hirota, M.; Kishimoto-Mo, A.W.; Oura, N.; Uchida, M. Carbon Exchange and Primary Production in a High-Arctic Peatland in Svalbard. Polar Res. 2023, 42, 8541. [Google Scholar] [CrossRef] [Scilit]
- Arevalo, C.B.; Bhatti, J.S.; Chang, S.X.; Sidders, D. Land Use Change Effects on Ecosystem Carbon Balance: From Agricultural to Hybrid Poplar Plantation. Agric. Ecosyst. Environ. 2011, 141, 342–349. [Google Scholar] [CrossRef] [Scilit]
- Fischer, M.; Fichot, R.; Albaugh, J.M.; Ceulemans, R.; Domec, J.C.; Trnka, M.; King, J.S. Populus and Salix Grown in a Short-Rotation Coppice for Bioenergy: Ecophysiology, Aboveground Productivity, and Stand-Level Water Use Efficiency. Risk 2015, 9, 13–14. [Google Scholar] [CrossRef] [Scilit]
- Zhao, M.; Tian, S.; Zhu, Y.; Li, Z.; Zeng, S.; Liu, S. Allometric Relationships, Functional Differentiations, and Scaling of Growth Rates across 151 Tree Species in China. Ecosphere 2021, 12, e03522. [Google Scholar] [CrossRef] [Scilit]
- Schwarzmann, J.; Waller, D.M. Allometric Equations Quantify Accelerated Growth and Carbon Fixation in Trees of Northeastern North America. For. Ecosyst. 2025, 14, 100347. [Google Scholar] [CrossRef] [Scilit]
- Son, Y.; Kim, R.; Lee, K.; Pyo, J.; Kim, S.; Hwang, J.; Lee, S.; Park, H. Carbon Emission Factors and Biomass Allometric Equations by Species in Korea. In Korea Forest Research Institute Report; Korea Forest Research Institute: Seoul, Republic of Korea, 2014; pp. 14–18. [Google Scholar]
- Lim, C.H.; Pi, J.H.; Kim, A.R.; Cho, H.J.; Lee, K.S.; You, Y.H.; Lee, K.H.; Kim, K.D.; Moon, J.S.; Lee, C.S. Diagnostic Evaluation and Preparation of the Reference Information for River Restoration in South Korea. Int. J. Environ. Res. Public Health 2021, 18, 1724. [Google Scholar] [CrossRef] [Scilit]
- Lim, B.S.; Seol, J.; Kim, A.R.; An, J.H.; Lim, C.H.; Lee, C.S. Succession of the Abandoned Rice Fields Restores the Riparian Forest. Int. J. Environ. Res. Public Health 2022, 19, 10416. [Google Scholar] [CrossRef] [Scilit]
- Wu, S.; Bashir, M.A.; Raza, Q.-U.-A.; Rehim, A.; Geng, Y.; Cao, L. Application of Riparian Buffer Zone in Agricultural Non-Point Source Pollution Control—A Review. Front. Sustain. Food Syst. 2023, 7, 985870. [Google Scholar] [CrossRef] [Scilit]
- Lee, C.-S.; Lim, B.-S.; Seok, J.-E. Carbon Absorption Potential of Abandoned Rice Paddy Fields in Korea. Sustainability 2025, 17, 2054. [Google Scholar] [CrossRef] [Scilit]
- Richardson, D.M.; Holmes, P.M.; Esler, K.J.; Galatowitsch, S.M.; Stromberg, J.C.; Kirkman, S.P.; Pyšek, P.; Hobbs, R.J. Riparian Vegetation: Degradation, Alien Plant Invasions, and Restoration Prospects. Divers. Distrib. 2007, 13, 126–139. [Google Scholar] [CrossRef] [Scilit]
- Prado, R.B.; Damasceno, G.M.S.; Aquino, F.D.G. Overview of Studies on Ecosystem Services in Riparian Zones: A Systematic Review. Acta Limnol. Bras. 2022, 34, e19. [Google Scholar] [CrossRef] [Scilit]
- Castellano, C.; Bruno, D.; Comín, F.A.; Rey Benayas, J.M.; Masip, A.; Jiménez, J.J. Environmental Drivers for Riparian Restoration Success and Ecosystem Services Supply in Mediterranean Agricultural Landscapes. Agric. Ecosyst. Environ. 2022, 337, 108048. [Google Scholar] [CrossRef] [Scilit]
- Graziano, M.P.; Deguire, A.K.; Surasinghe, T.D. Riparian Buffers as a Critical Landscape Feature: Insights for Riverscape Conservation and Policy Renovations. Diversity 2022, 14, 172. [Google Scholar] [CrossRef] [Scilit]
- Peroni, F.; Codato, D.; Buscemi, L.; Cibrario, M.; Pappalardo, S.E.; De Marchi, M. Rethinking Urban Riparian Ecosystems as a Frontline Strategy to Counter Climate Change: Mapping 60 Years of Carbon Sequestration Evolution in Padua, Italy. Front. Clim. 2023, 5, 1235886. [Google Scholar] [CrossRef] [Scilit]
- Seavy, N.E.; Gardali, T.; Golet, G.H.; Griggs, F.T.; Howell, C.A.; Kelsey, R.; Small, S.L.; Viers, J.H.; Weigand, J.F. Why Climate Change Makes Riparian Restoration More Important than Ever: Recommendations for Practice and Research. Ecol. Restor. 2009, 27, 330–338. [Google Scholar] [CrossRef] [Scilit]
- Singh, R.; Tiwari, A.; Singh, G. Managing Riparian Zones for River Health Improvement: An Integrated Approach. Landsc. Ecol. Eng. 2021, 17, 195–223. [Google Scholar] [CrossRef] [Scilit]
- Davis, S.; Grainger, M.; Pfeifer, M.; Pattison, Z.; Stephens, P.; Sanderson, R. Restoring Riparian Habitats for Benefits to Biodiversity and Human Livelihoods: A Systematic Map Protocol for Riparian Restoration Approaches in the Tropics. Environ. Evid. 2025, 14, 2. [Google Scholar] [CrossRef] [Scilit] [PubMed]

Disclaimer/Publisher’s Note: The statements, opinions and data contained in all publications are solely those of the individual author(s) and contributor(s) and not of MDPI and/or the editor(s). MDPI and/or the editor(s) disclaim responsibility for any injury to people or property resulting from any ideas, methods, instructions or products referred to in the content. |
© 2026 by the authors. Licensee MDPI, Basel, Switzerland. This article is an open access article distributed under the terms and conditions of the Creative Commons Attribution (CC BY) license.