


Abstract
As China’s Sponge City Program (SCP) shifts towards retrofitting old communities, enhancing flood resilience is critical for sustainable urban renewal. However, engineering practice often encounters a performance inversion—characterized by high design evaluation scores but low operational efficiency. This issue largely stems from relying on the static importance of indicators while neglecting dynamic driving forces within the socio-technical system. To address this, this study aims to construct a Robust Causal Diagnostic Framework integrating Improved AHP, DEMATEL, and K-means clustering. Through a quadrant positioning and cluster locking mechanism, it identifies Hidden Leverage Factors (HLFs)—critical indicators typically assigned low weights but exerting strong driving forces. To demonstrate the practical application of this framework, an empirical analysis of H City’s DG Community was conducted, identifying residents’ willingness and design pertinence as the project’s HLFs. Optimization strategies based on this diagnosis were simulated using SWMM. Results show that the Annual Runoff Volume Capture Ratio increased by 44.45%, with significant improvements in peak flow reduction and water purification. This study facilitates a shift from empirical evaluation to precision diagnosis, offering a quantitative reference for enhancing urban flood resilience under complex social constraints.
1. Introduction
As China’s Sponge City Program (SCP) pivots from the incremental development of new districts to the stock renewal of existing old communities, enhancing flood resilience within limited spaces and under complex social constraints has emerged as a critical challenge for urban regeneration [1,2]. According to national guidelines, urban renewal is categorized into three tiers: basic, improvement, and elevation. Among these, upgrading drainage networks and implementing sponge retrofits are strictly classified as basic-tier renovations, emphasizing their fundamental role in ensuring residents’ safety [3]. This policy of prioritization is crucial; compared to sporadic natural hazards like earthquakes or fires, urban pluvial flooding represents the most frequent and disruptive threat to daily socio-economic activities in these aging areas. Addressing this specific threat in existing neighborhoods is highly challenging. Unlike new construction projects with flexible planning, retrofitting old communities presents typical problems: rigid spatial boundaries, the severe deterioration of existing pipeline networks [4,5,6], and highly heterogeneous resident demands [7,8] tightly intertwine to constitute a complex socio-technical system [9,10]. Although the engineering sector has invested heavily in optimizing technical solutions, the contradiction of performance inversion—characterized by high design evaluation scores but low actual operational efficiency—remains prevalent in practice [11,12]. Many retrofit projects eventually fall into a dilemma of facility abandonment or functional degradation due to a lack of endogenous motivation [13,14,15].
Existing research has addressed these challenges from multiple perspectives, broadly along two primary pathways. The first focuses on improving hydrological performance through simulation-based optimization. Studies employing the Storm Water Management Model (SWMM), often combined with multi-objective algorithms such as NSGA-II [16,17,18], enable quantitative evaluation of Low-Impact Development (LID) configurations and support trade-offs between runoff control and construction costs. Spatial layout optimization further refines the placement and scale of green infrastructure [19,20]. However, these approaches are typically developed under simplified operational assumptions, where social dynamics—such as residents’ behavior, maintenance participation, and spatial conflicts—are treated as fixed boundary conditions, limiting their applicability in old community retrofits where socio-technical interactions influence long-term performance [21]. The second pathway applies Multi-Criteria Decision-Making (MCDM) methods, including AHP, entropy weighting, and TOPSIS, to evaluate retrofit schemes across technical, environmental, and socio-economic dimensions [22,23,24,25,26,27]. While these methods improve decision transparency and enable systematic comparison of alternatives, most rely on linear weighting structures that assume indicator independence [28,29], which may not adequately represent interdependencies and feedback in complex socio-technical systems [30,31]. As a result, socially driven factors—such as resident participation and community governance—are often underrepresented despite their importance for long-term operation and maintenance [10,32,33].
Therefore, overcoming the limitations of traditional static evaluation and linear decision-making frameworks to systematically identify factors—specifically those easily underestimated in the early decision-making stage but critical to long-term operational performance—has become a core research question for enhancing flood resilience in old communities.
2. Methodology
2.1. Construction of the Robust Causal Diagnostic Framework
Drawing on Donella Meadows’ classic theory of Leverage Points—where small interventions at key nodes in a system trigger significant overall structural changes [34]—this study constructs a Robust Causal Diagnostic Framework. Adopting a systemic perspective, this framework aims to identify Hidden Leverage Factors (HLFs): critical factors that are often masked by static weights but exert a decisive influence on project success.
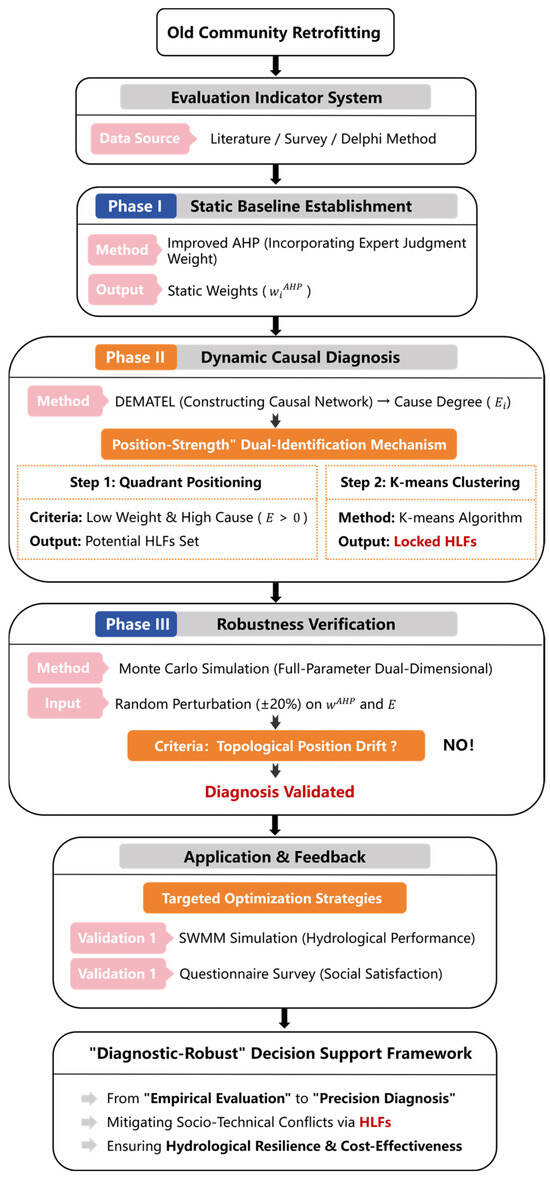
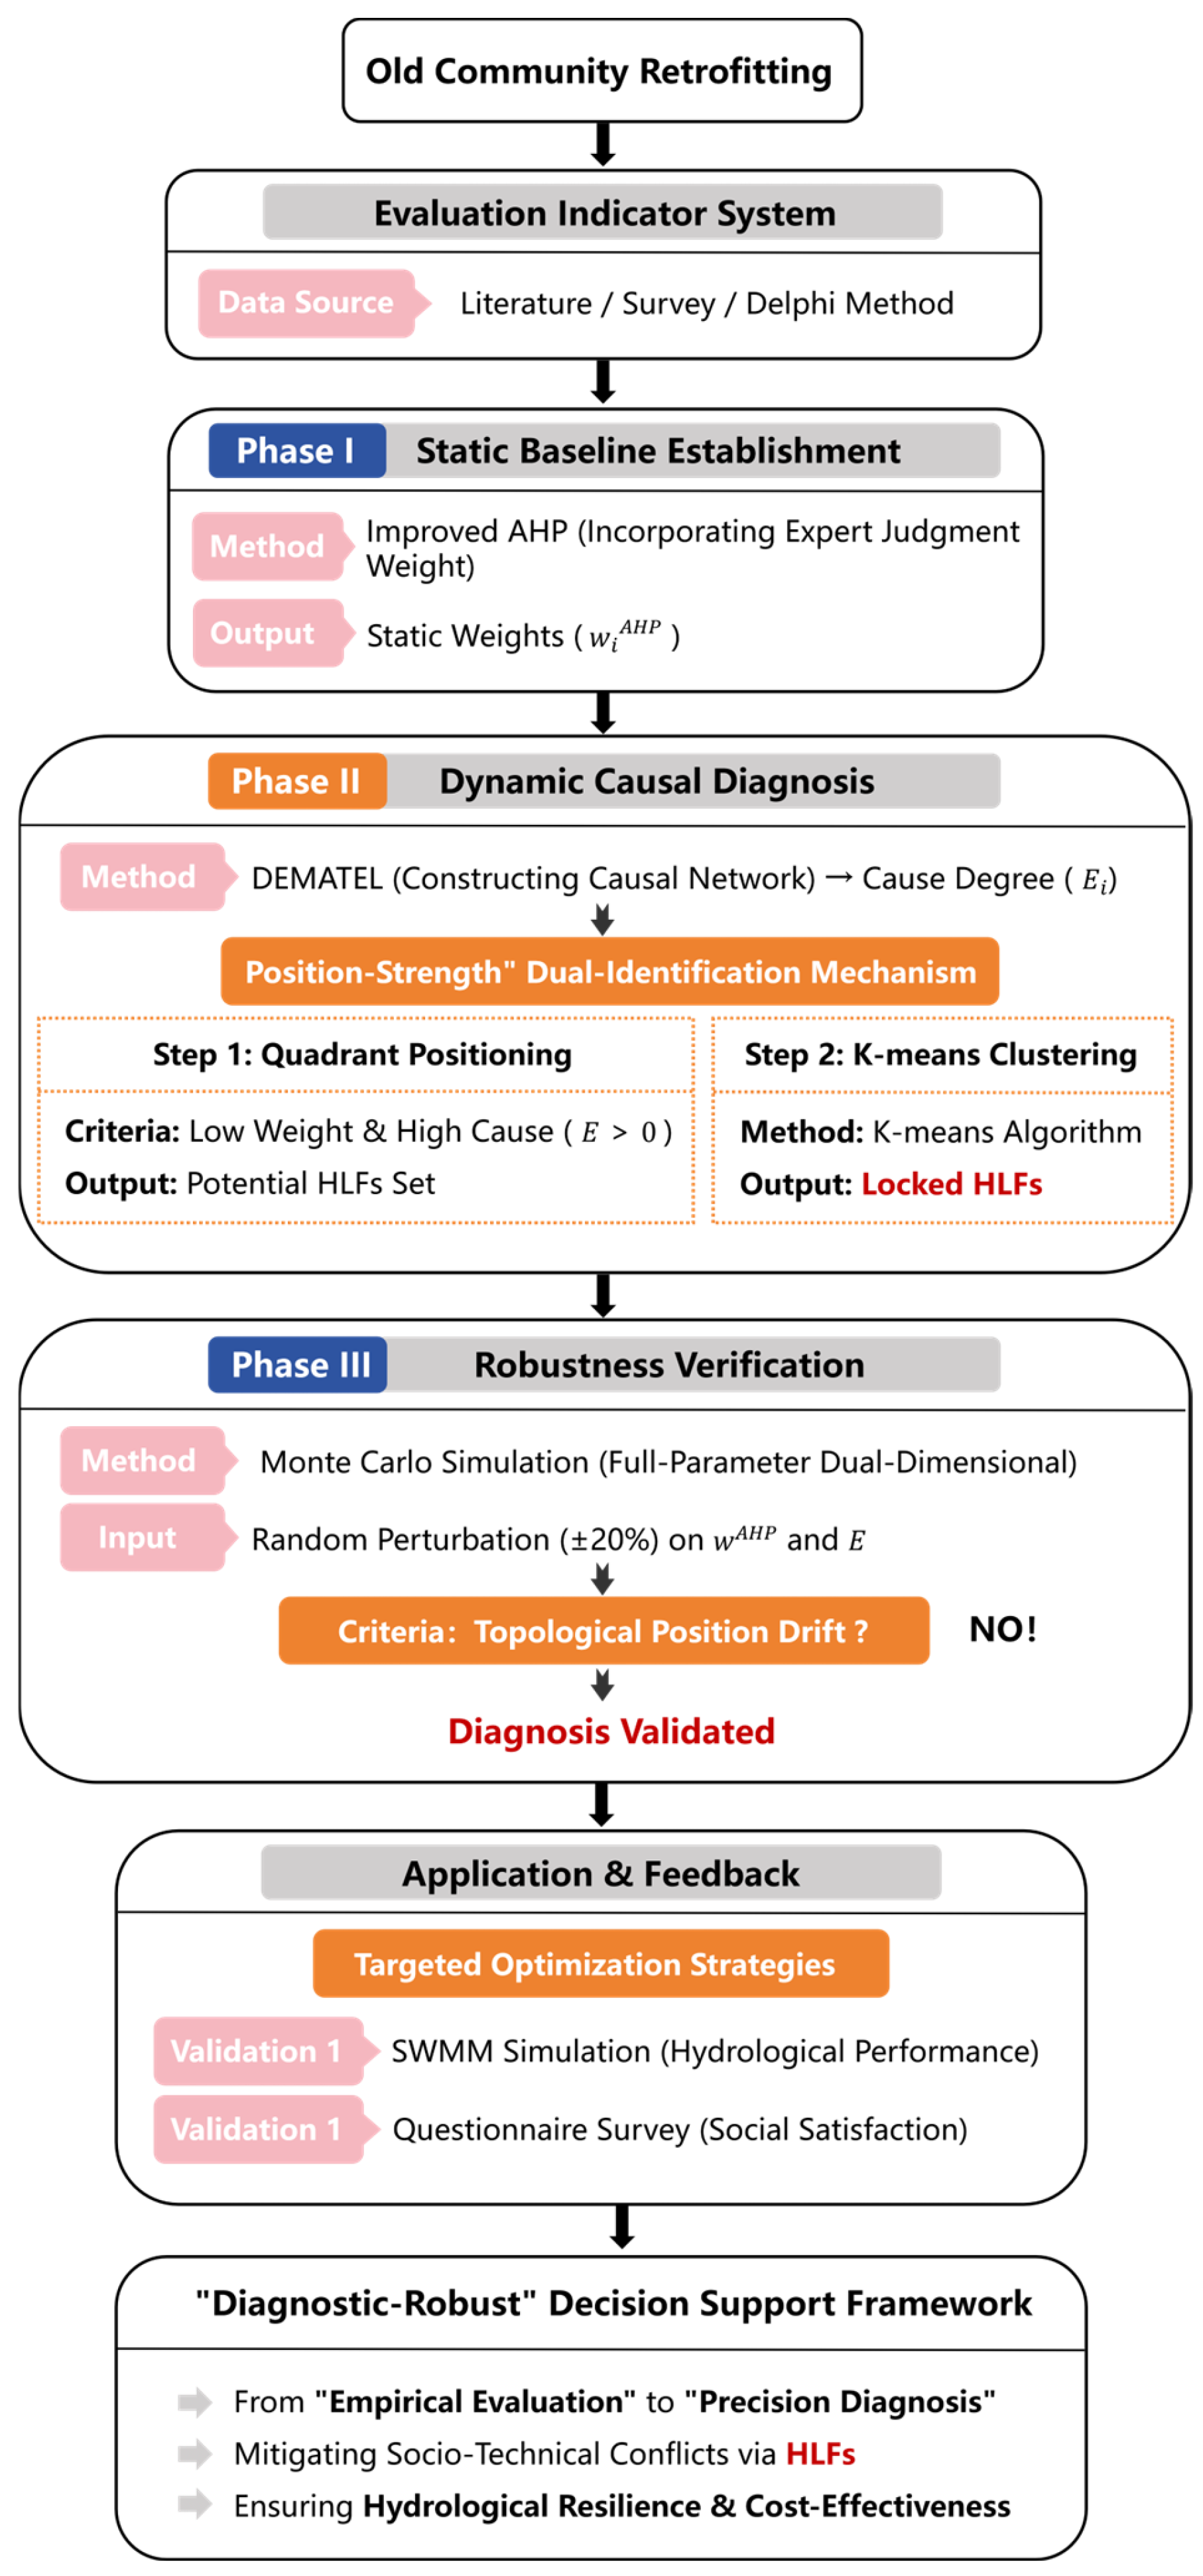
The rationale for constructing this hybrid framework lies in the necessity to decouple the complex socio-technical constraints of old community retrofitting. Traditional linear assessments focus on static importance but fail to capture the dynamic driving forces (e.g., social resistance) that cause Performance Inversion. To bridge this gap, this study integrates Improved AHP to establish the engineering static baseline, DEMATEL to map the dynamic causal network of social interactions, and K-means to objectively lock the Hidden Leverage Factors (HLFs) without human bias. This combination forms a closed-loop diagnosis from Static Weighting to Dynamic Diagnosis to Objective Locking (Figure 1).
Figure 1.
Technical roadmap.
The framework consists of three logically progressive phases. The first is the “Static Baseline Establishment Phase,” which acquires the static baseline weights of indicators using an Improved AHP method incorporating expert judgment weights, thereby reflecting explicit priorities under engineering technical standards [35]. The second is the “Dynamic Causal Diagnosis Phase,” which utilizes the DEMATEL method to construct a causal network of indicators. Through a dual mechanism of “Quadrant Positioning–K-means Cluster Locking,” this phase reveals deep driving logic from the dimensions of system topological structure and data distribution characteristics, locking in the HLFs. Finally, the “Robustness Verification Phase” introduces random perturbations via Monte Carlo simulation to quantify the impact of uncertainty in expert subjective judgment on diagnostic results, verifying the reliability of decision-making conclusions.
2.2. Phase I: Static Baseline Establishment
Before executing the quantitative calculation, it is necessary to define the dimensionality of the target evaluation system. This study constructs a socio-technical evaluation framework comprising 23 specific indicators across three dimensions (detailed in Section 3. The expert scoring and subsequent judgment matrices described in this section are structurally scaled to these 23 target indicators.
Given the paucity of long-term historical monitoring data for old community retrofitting, which renders purely data-driven models inapplicable, this study adopts a knowledge-driven approach. To characterize experts’ static cognition of the relative importance of evaluation indicators, this paper uses the Improved Analytic Hierarchy Process (IAHP) to determine the basic weights () [31]. Considering differences in expert backgrounds and consistency of judgment, the equal-weight aggregation assumption of traditional AHP may amplify individual subjective biases. Therefore, this paper introduces expert judgment weights within the group decision-making framework to comprehensively integrate expert opinions [36,37].
To ensure a multi-dimensional perspective of decision-making, we invited a panel of 7 experts based on a Socio-Technical selection criterion. The panel comprises 4 technical experts from design institutes and research agencies (focusing on engineering design and feasibility) and 3 administrative officials from government departments (focusing on policy implementation and community coordination). All seven experts hold senior professional titles and possess extensive practical experience in compiling technical codes and standards for sponge city construction or comprehensive old community retrofitting. The detailed profiles are presented in Table 1.
Table 1.
Profiles of the Expert Panel.
Regarding the panel size, the selection of 7 experts aligns with Saaty’s “magic number seven plus or minus two” principle [38] to optimally ensure logical consistency without inducing group polarization. Data collection was conducted via email using the Saaty 1–9 scale. These experts constructed the initial judgment matrices (), and the Consistency Index () of each matrix was calculated.
To attribute greater influence to experts with higher logical consistency and mitigate subjective bias in group decision-making [39], the expert judgment weight () is constructed using a specific exponential function adopted from established Group AHP methodologies [40], calculated as follows:
where is the total number of participating experts. A smaller value indicates tighter judgment logic and more reliable opinions from the -th expert, resulting in a larger decision weight .
Subsequently, utilizing these weights, the elements of the 7 experts’ judgment matrices were aggregated to obtain the comprehensive judgment matrix , with elements calculated as follows:
Finally, the eigenvector method was applied to the comprehensive judgment matrix to calculate the final static weight vector , followed by a consistency check (requiring .1). Within the Robust Causal Diagnostic Framework, this weight characterizes the “Static Importance” of the indicator and serves as the basic input for subsequent dynamic diagnosis.
2.3. Phase II: Dynamic Causal Diagnosis and Identification of Hidden Leverage Factors
This phase identifies HLFs from the socio-technical network through causal parameter calculation and a dual locking mechanism.
- (1)
- Calculation of Causal Parameters
This study uses DEMATEL to analyze the causal mechanisms between indicators [41]. Based on the scoring of the 7 core experts, a Direct Influence Matrix was constructed and normalized to obtain the Comprehensive Influence Matrix :
Then, the row sum (, representing the comprehensive influencing value) and column sum (, representing the influenced value) of Matrix were calculated to compute the Centrality () and Relation Degree () of each indicator [42]:
where reflects the overall importance of the indicator in the system; is used to determine the attribute of the indicator: if > 0, the indicator is a Causal Factor, exerting a net driving force on the system; if < 0, it is a Result Factor [43].
- (2)
- Dual Locking Mechanism for HLFs
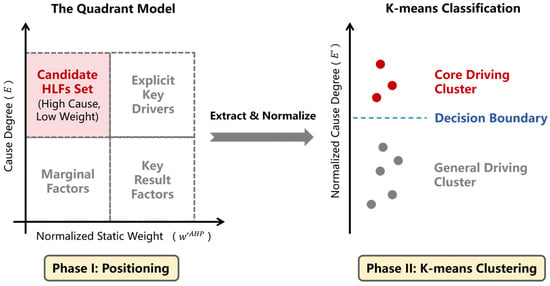
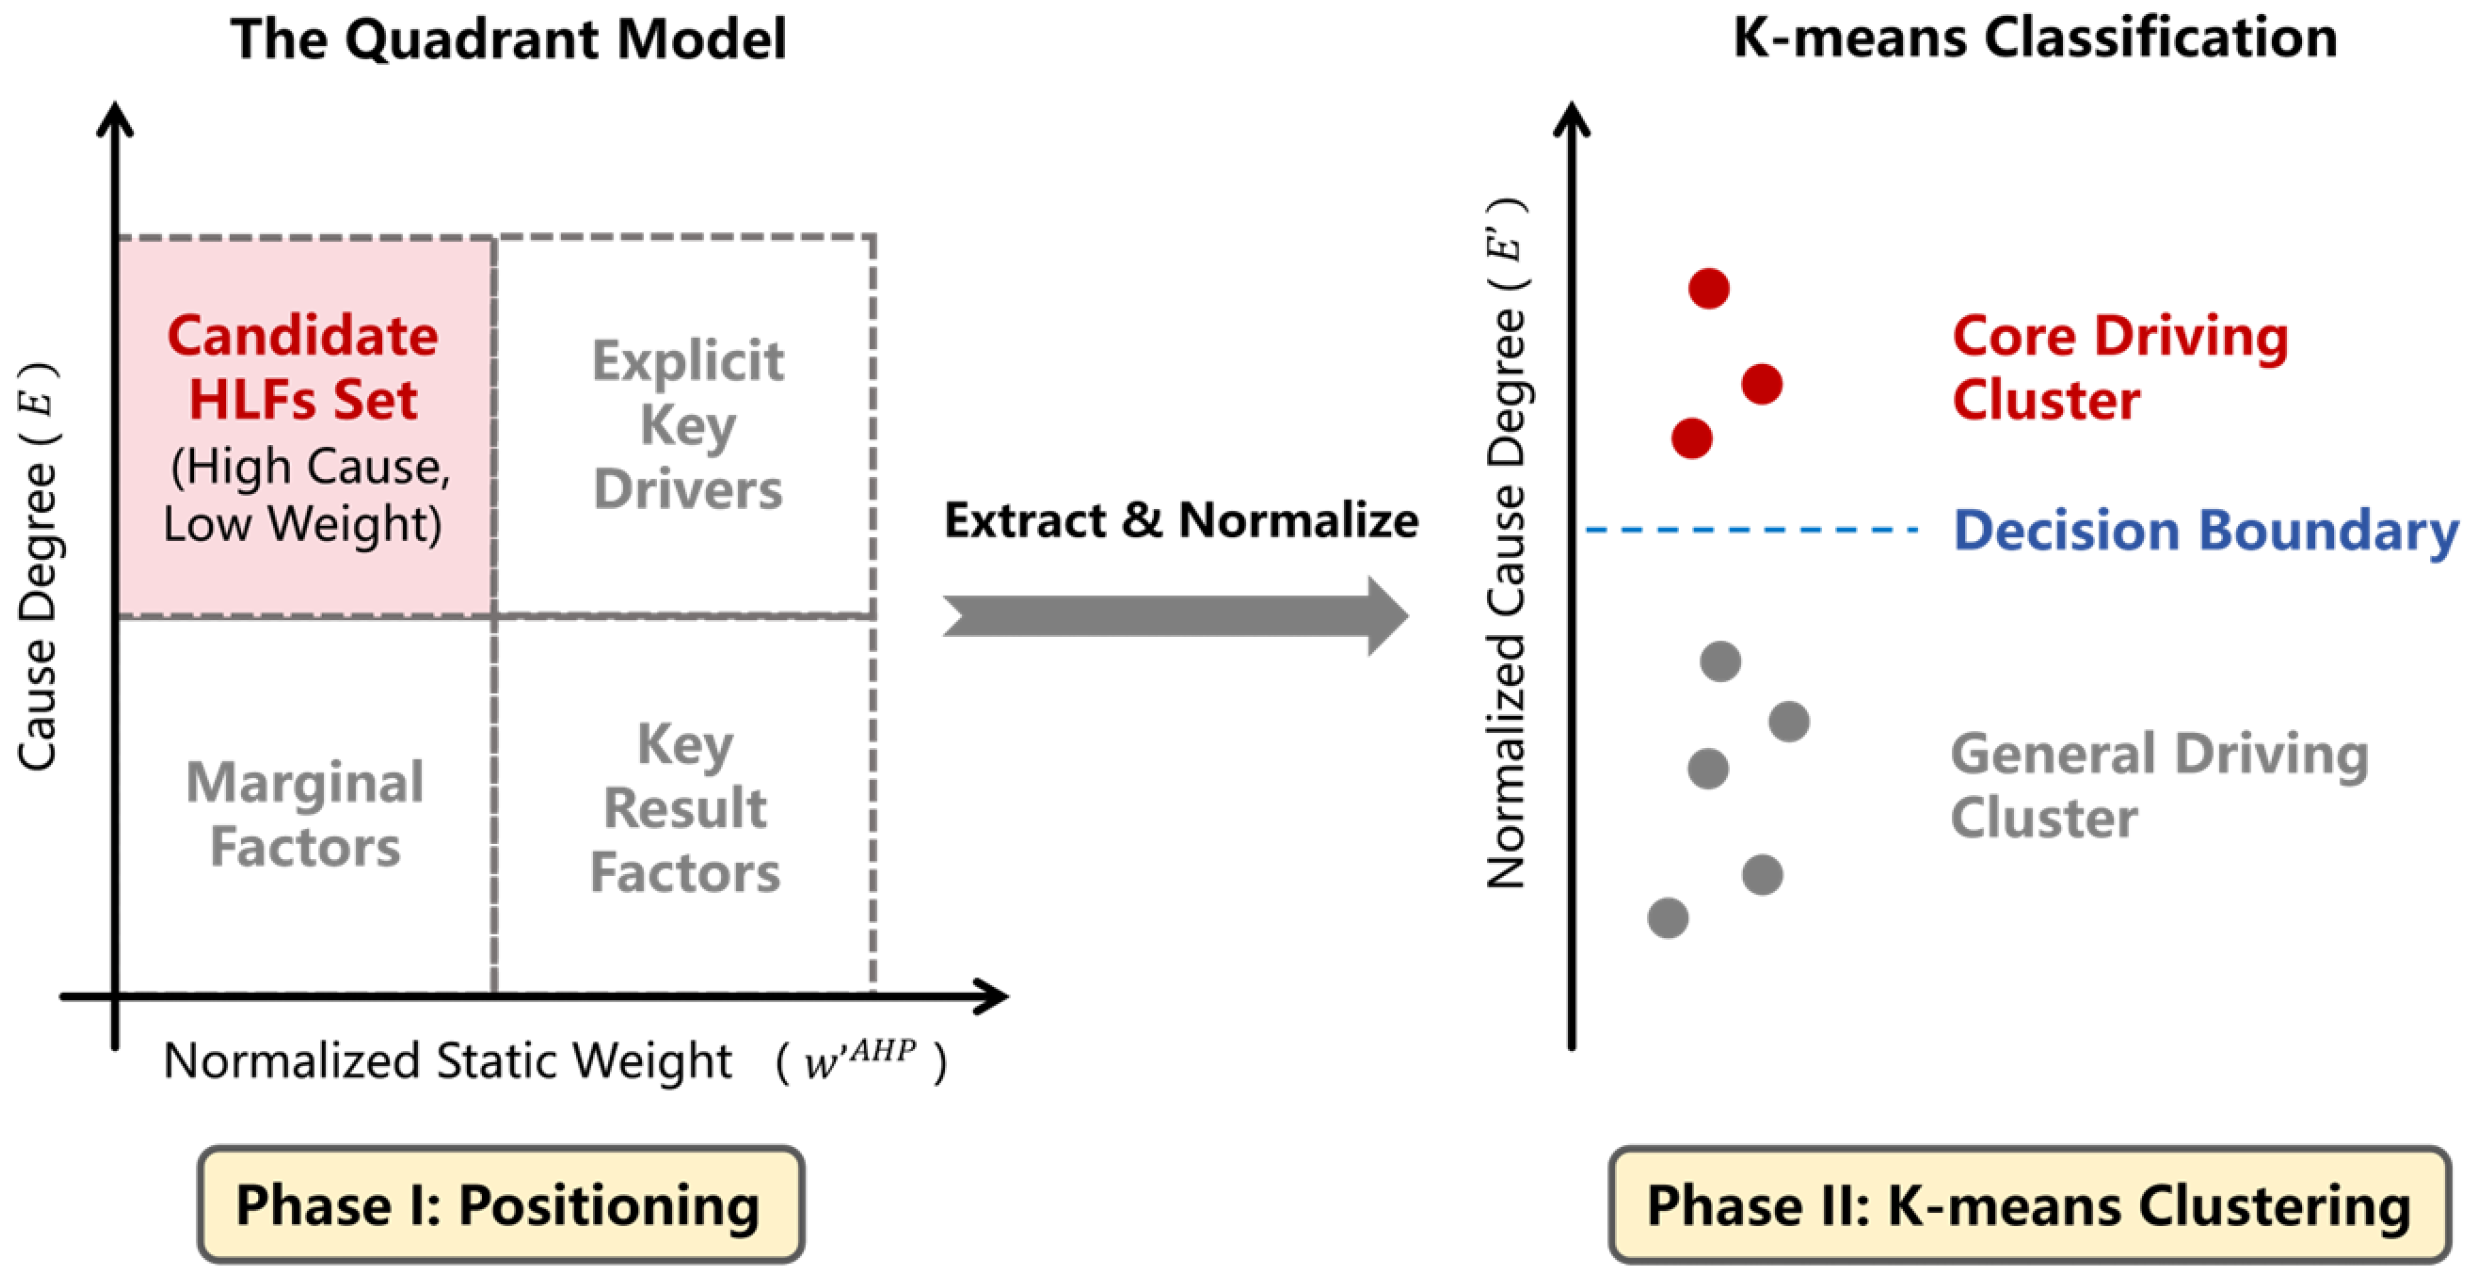
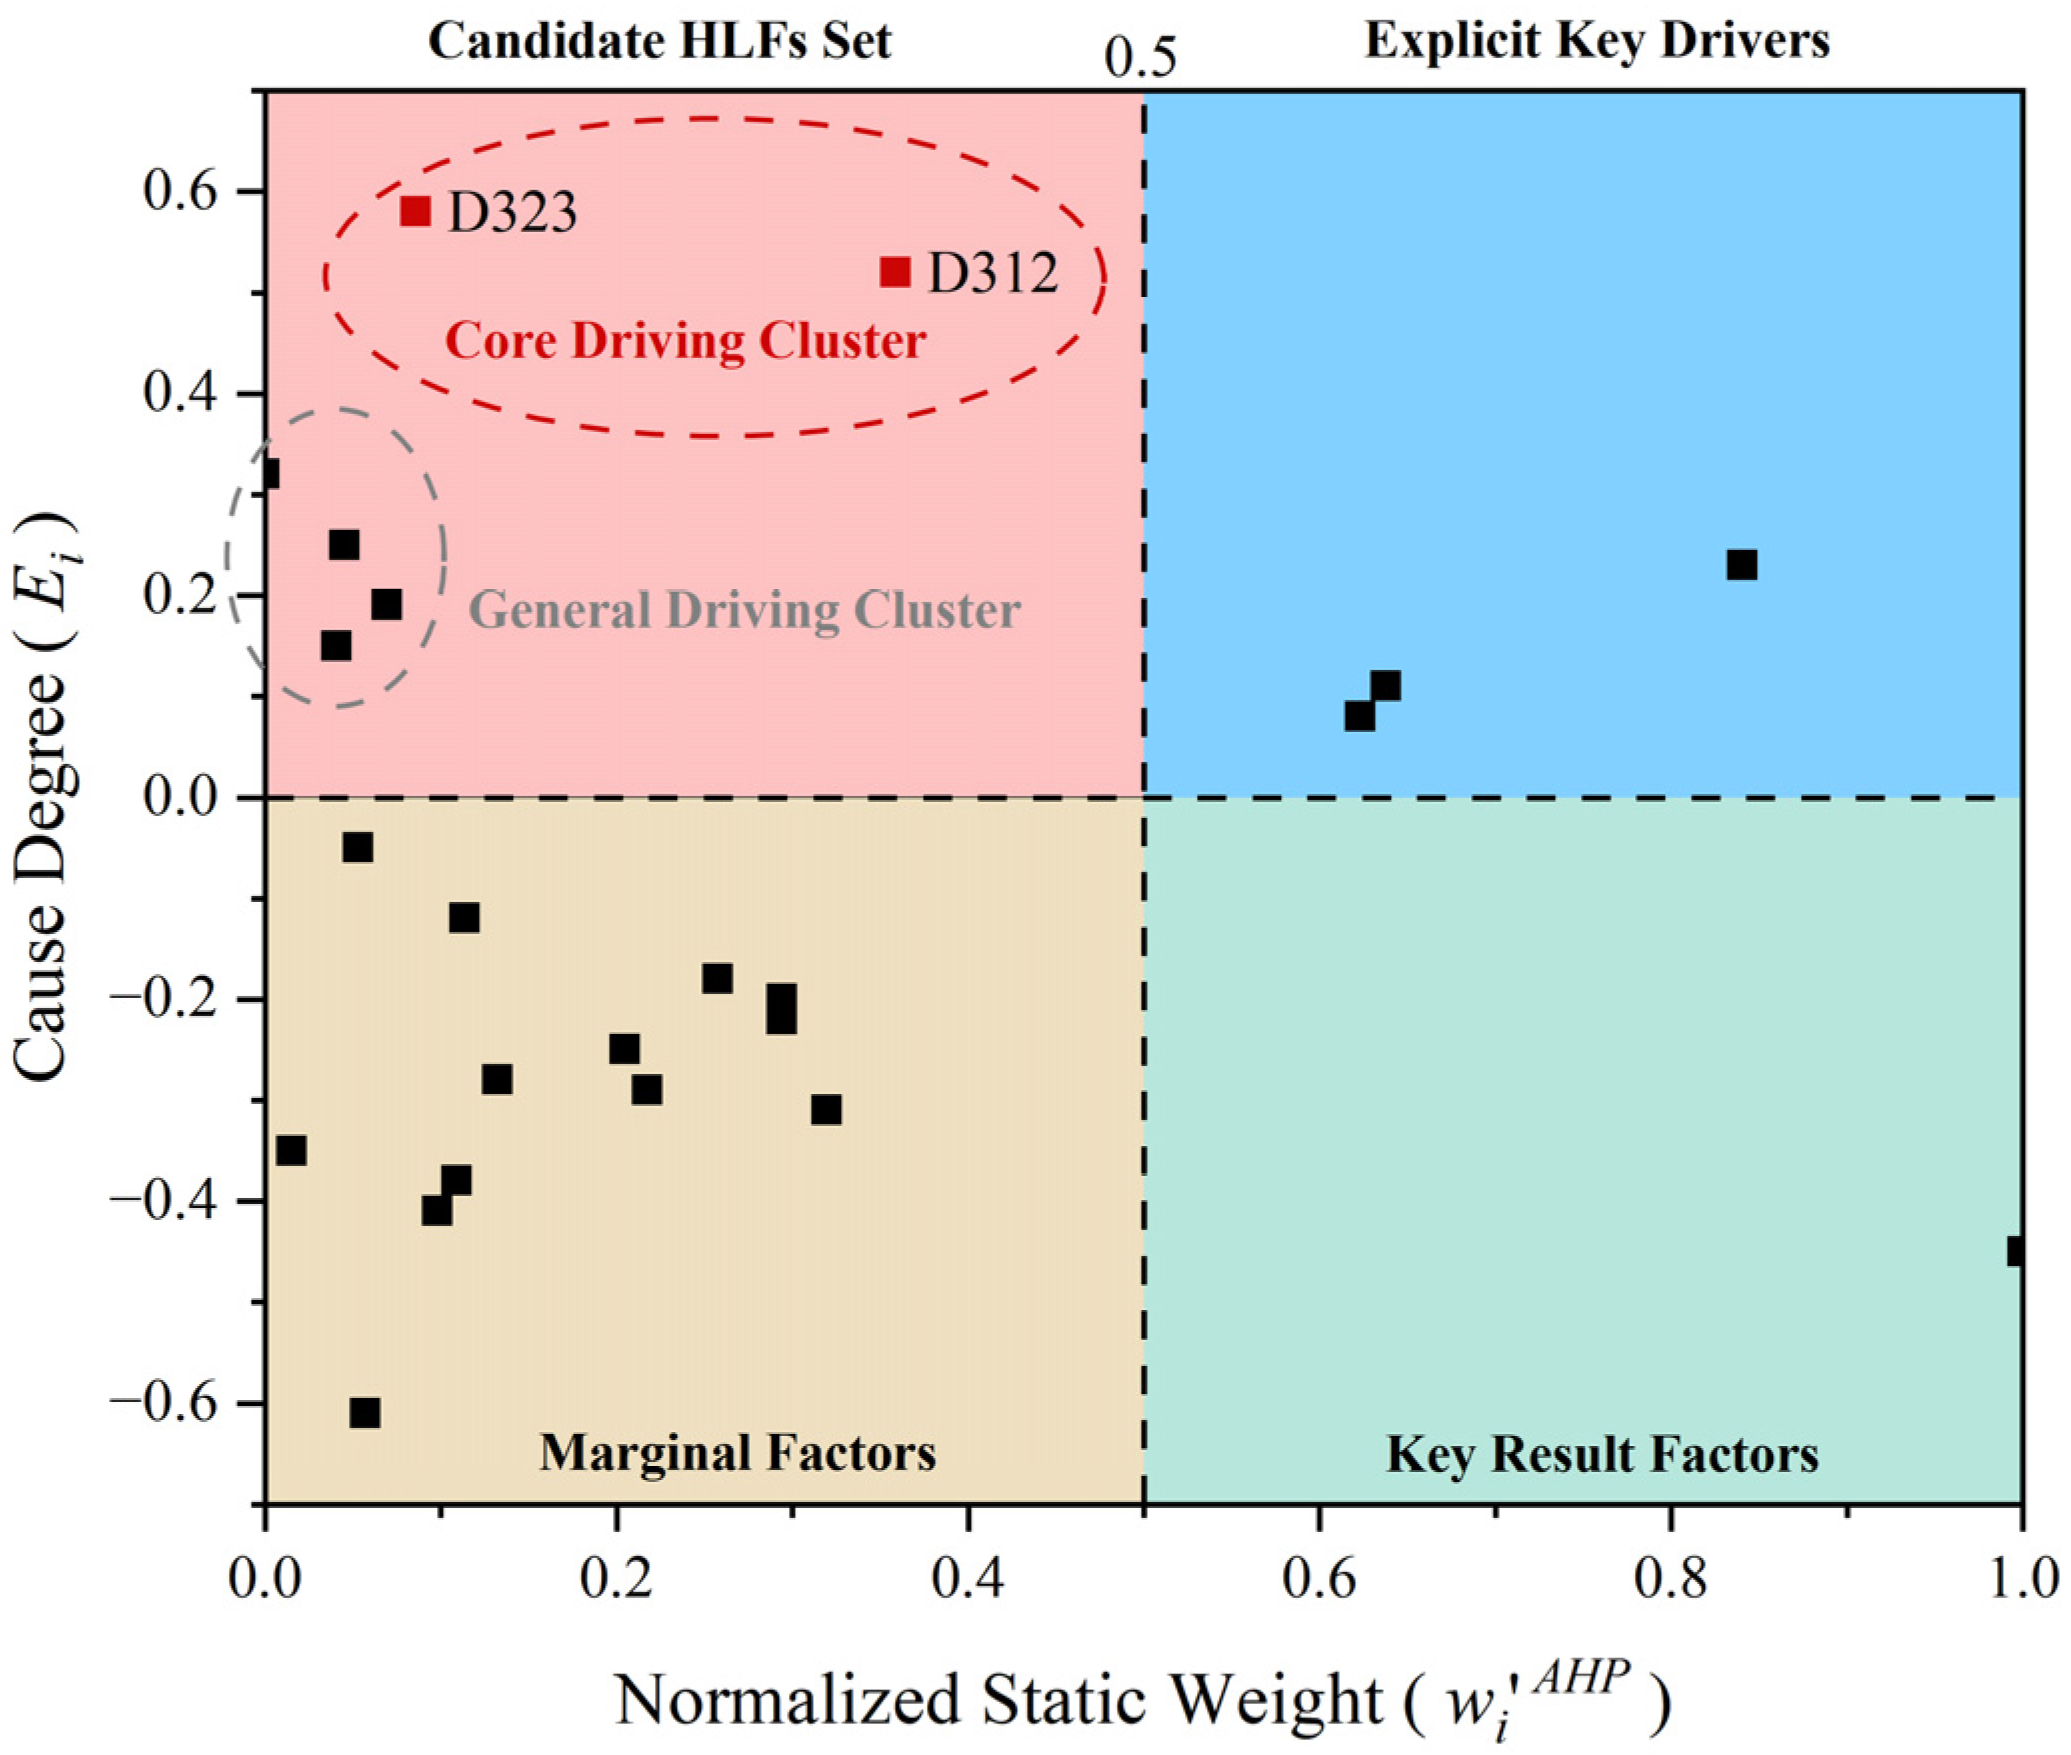
This study defines HLFs as key indicators that are undervalued within the static weighting system but possess high driving power over other indicators within the system’s causal network. To precisely identify such indicators, a two-step locking mechanism based on “Position–Strength” was constructed (see Figure 2).
Figure 2.
The dual locking mechanism for identifying HLFs.
Step 1: Quadrant Positioning based on a 2D Model. A “Normalized Static Weight–Relation Degree” 2D diagnostic model was built, with the normalized Improved AHP weight () as the x-axis and the DEMATEL Relation Degree () as the y-axis. Indicators falling into the Second Quadrant (the “Low Weight–High Cause Zone”) possess structural characteristics of “low resource allocation priority but high causal drive,” thus constituting the “Candidate HLFs Set.”
Step 2: Strength Locking based on K-means Clustering. To overcome the artificial ambiguity of quadrant boundaries, the K-means clustering algorithm was used to quantitatively stratify the candidate set. Taking the normalized relation degree () of the indicators as the input feature and setting the cluster number , the algorithm aims to objectify the visual fault lines observed in the data, automatically dividing the candidate set into a “Core Driving Cluster” and a “General Driving Cluster.” Only indicators classified into the “Core Driving Cluster” are finally locked as the core HLFs. This mechanism ensures that the identification results are determined by the internal data structure of the system rather than relying on the researcher’s subjective experience.
2.4. Phase III: Robustness Verification
Given the inherent subjectivity and ambiguity of expert scoring methods, relying on a single static diagnostic result may introduce bias. To verify the credibility of the identified HLFs against subjective biases, Phase III of the overall Robust Causal Diagnostic Framework employs a full-parameter dual-dimensional Monte Carlo simulation model for global robustness analysis [44,45].
This mechanism simultaneously introduces stochastic perturbations into all evaluation indicators (“full parameter”) across two core parameters: the weight and the normalized relation degree (“dual dimensional”). The model assumes that these original parameters are not deterministic constants but random variables following a triangular distribution with a ±20% fluctuation range, a standard threshold set to simulate significant expert cognitive uncertainty [46]. Through 10,000 random sampling simulations, the study tracks whether the topological positions of key indicators in the 2D diagnostic model drift.
The judgment criterion is set as follows: If a target indicator can remain in the “Low Weight–High Cause” Hidden Leverage Zone (Second Quadrant) with a high probability (e.g., >90%) within a wide range of random fluctuations, and does not jump to the “High Weight Zone” (First/Fourth Quadrants) or “Non-Driving Zone” (Third Quadrant), it proves that the diagnostic result is determined by the inherent structural characteristics of the socio-technical system and possesses high robustness.
3. Empirical Diagnosis and Identification of Hidden Leverage Factors
The DG Community in H City (built in the late 1990s), selected to demonstrate the framework’s application in diagnosing retrofit barriers under complex socio-technical constraints, faces severe dual constraints posed by hydro-geological conditions and spatial resources. On the one hand, the groundwater level is extremely shallow (0.2–0.8 m), and the soil is dominated by clay with weak permeability, rendering conventional infiltration facilities unsuitable. On the other hand, a severe shortage of parking spaces leads to long-term encroachment on public spaces, triggering fierce spatial competition between sponge facility construction and residents’ parking needs. To accurately diagnose these constraints, we constructed a comprehensive evaluation system where the selection of the 23 indicator names followed a rigorous Standard–Literature–Field triangulation protocol. To ensure mandatory compliance, ecological indicators (D111–D124) were strictly inherited from GB/T 51345-2018 [35], while socio-economic indicators (e.g., D323) were synthesized from high-impact urban renewal literature (e.g., [4,7]). Furthermore, addressing specific pain points in the DG Community (e.g., facility abandonment), operational indicators like Management Maintainability (D231) were derived from on-site interviews. Finally, to ensure scientific rigor, the initial candidate set underwent a two-round Delphi screening by the expert panel, where indicators with high divergence (i.e., high coefficient of variation) were excluded, finalizing the evaluation system (Table 2). On this basis, causal diagnosis was carried out utilizing judgment data from 7 project experts (Cronbach’s α > 0.8) [47].
Table 2.
Summary of weights and causal parameters for the sponge city retrofitting evaluation indicators of the DG Community in H City.
3.1. Diagnostic Results: Misalignment Between Static Importance and Causal Driving Force
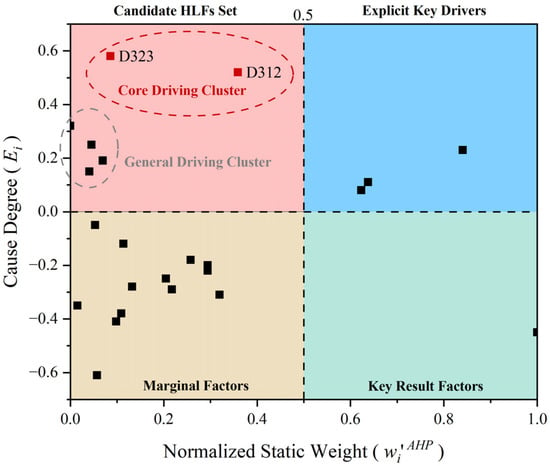
The calculation results of Improved AHP and DEMATEL (Table 2) show a structural misalignment between the “Static Importance” and “Dynamic Causal Driving Force” of the indicator system. To visualize this cognitive conflict, this study established a 2D diagnostic coordinate system with normalized static weight as the x-axis and relation degree as the y-axis, mapping all indicators onto it (Figure 3).
Figure 3.
The 2D diagnostic chart of normalized static weight vs. relation degree.
Observation of the scatter distribution reveals a significantly unbalanced structure among system indicators. The Explicit Key Driving Zone (First Quadrant) contains very few indicators, including only a few technical indicators like Sponge Facility Selection (D331), which occupy a high share of weights, reflecting the explicit emphasis on engineering technical parameters in traditional decision-making. Conversely, most indicators are densely distributed in the Marginal Factor Zone (Third Quadrant), indicating their secondary status in the current evaluation system and weak causal driving force on the system. Notably, in the Candidate Hidden Leverage Zone (Second Quadrant), “Residents’ Willingness to Renovate (D323)” and “Design Pertinence (D312)” exhibit significant outlier characteristics. This visual fault line suggests that although their static weights are underestimated, they may harbor substantial positive driving effects in the system’s causal network [8,48].
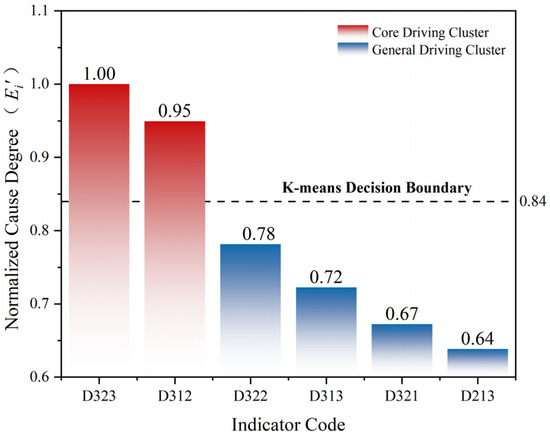
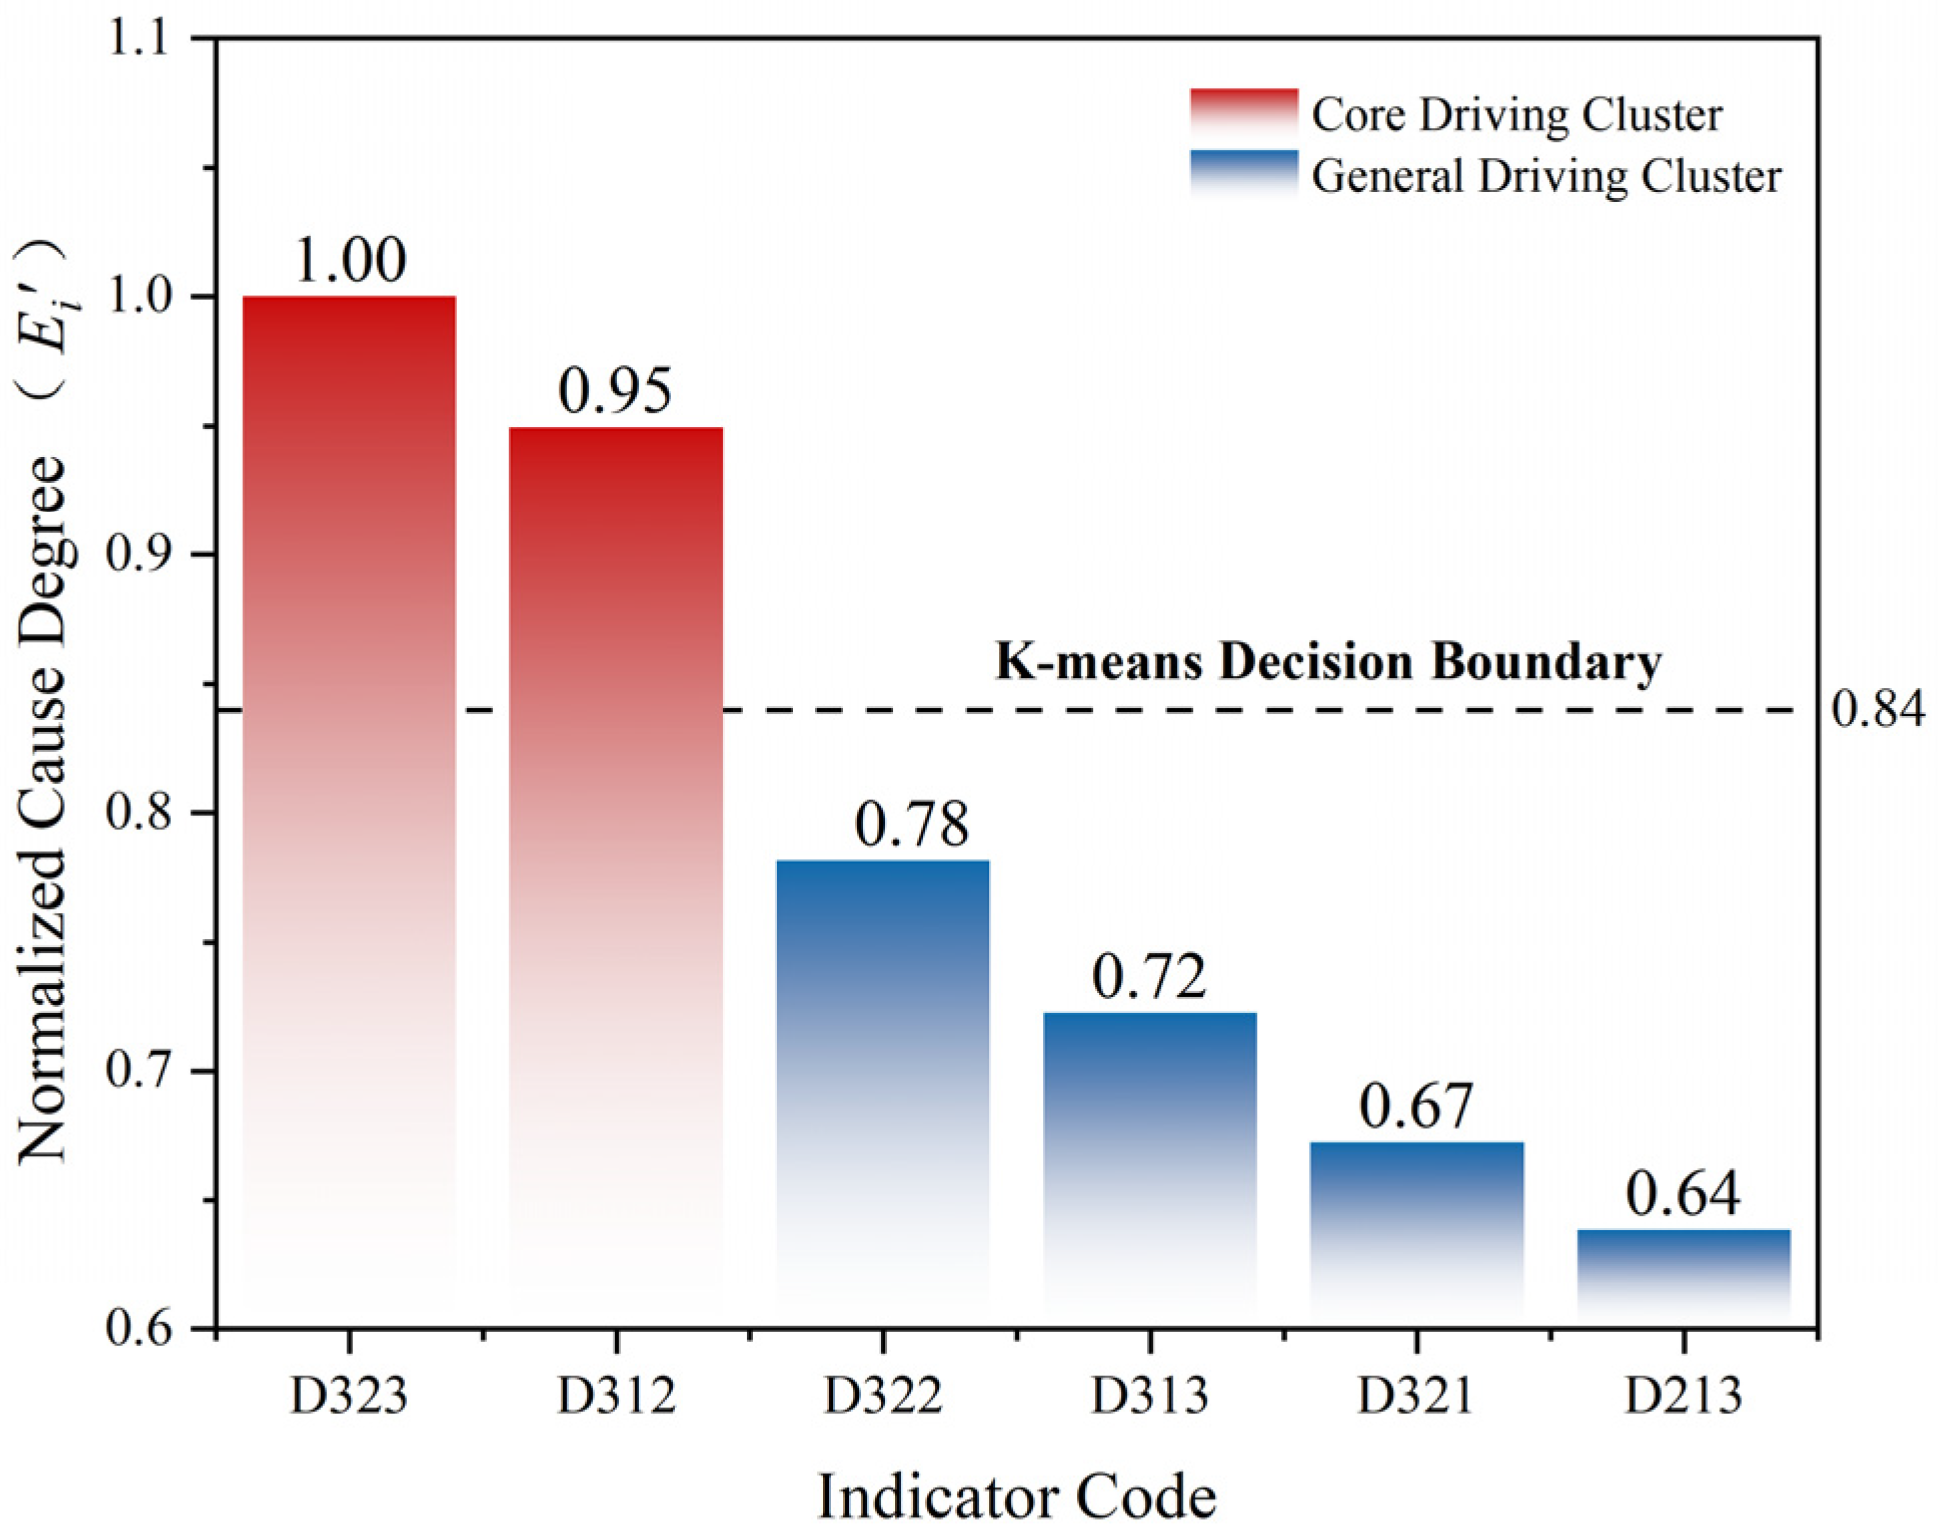
To eliminate the subjectivity of visual judgment, the study further used the K-means clustering algorithm to perform statistical stratification verification on the normalized relation degrees () of indicators in the Hidden Leverage Zone (Second Quadrant). The K-means clustering results (Figure 4) confirmed the existence of the visual fault line:
Figure 4.
K-means clustering results and driving force stratification of indicators in the Hidden Leverage Zone.
The first tier is the “Core Driving Cluster,” containing only D323 and D312. The normalized relation degrees of these two indicators are as high as 1.00 and 0.95, respectively, both located above the classification boundary determined by the algorithm (Boundary ≈ 0.84). In contrast, the value of the top indicator in the second tier, “General Driving Cluster,” D322 (Availability of Construction Materials), drops to 0.78. The K-means algorithm confirms that the 0.17 numerical gap between D312 and D322 is not a random fluctuation of data but an objective boundary of the internal driving structure of the system. Based on this, D323 and D312 are locked as the Core HLFs for the DG Community retrofit project.
3.2. Robustness Verification of Diagnostic Results
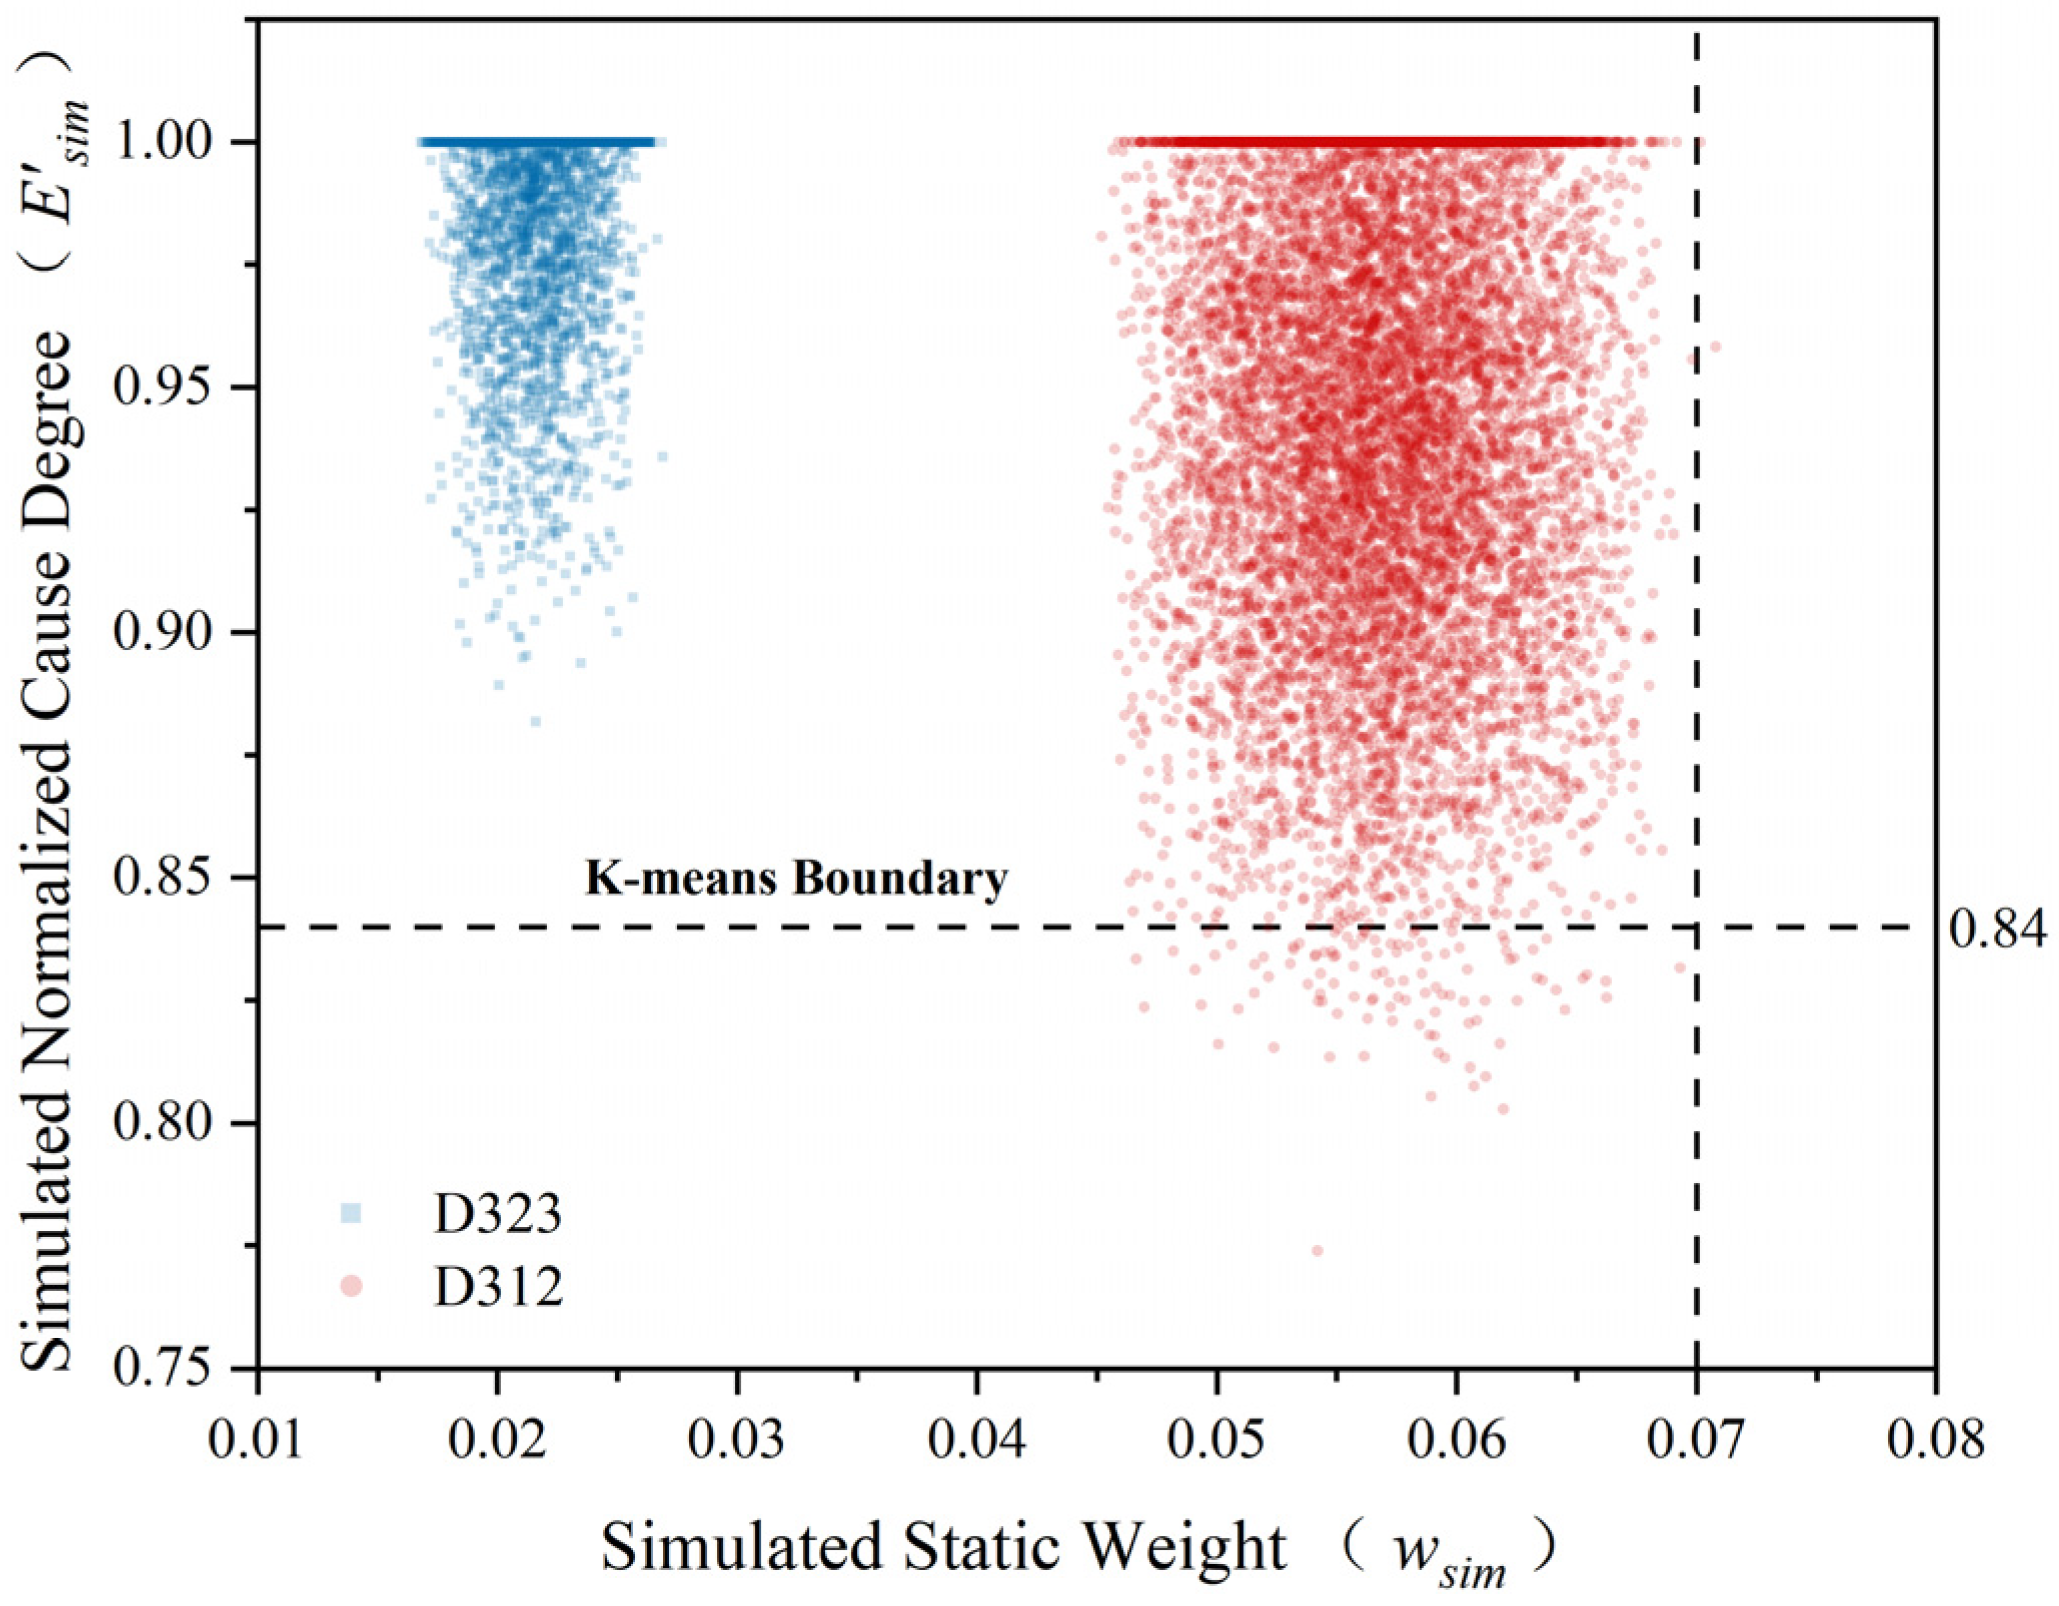
Given the subjective ambiguity of expert scoring, to verify the reliability of the HLF identification results, a full-parameter dual-dimensional Monte Carlo simulation model was established. Assuming the original weights and relation degrees of all 23 indicators follow a triangular distribution with random perturbations of ±20% [49,50]. Through 10,000 random iterations, the model reconstructed the entire system boundary in real-time and recalculated the simulated normalized relation degree (). To determine whether key indicators experienced “Topological Drift,” a dual robustness judgment threshold was set: the indicator must simultaneously satisfy “Simulated Weight < 0.065″ (empirical upper limit of the low-weight zone) and “Simulated Normalized Relation Degree > 0.84″ (lower limit of the Core Driving Cluster determined by K-means in Section 3.1).
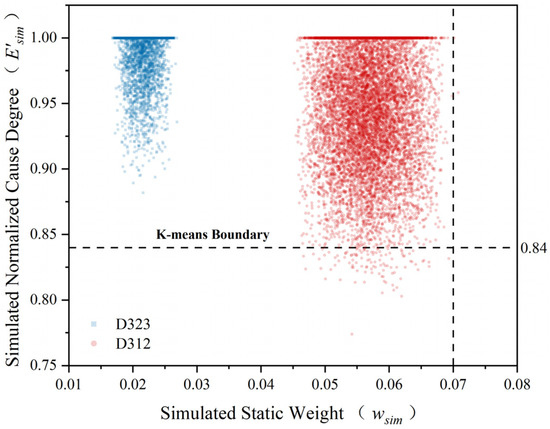
The statistical analysis and visualization results are shown in Figure 5.
Figure 5.
Global robustness verification results for key Hidden Leverage Factors (HLFs) considering dual uncertainty.
Simulation results show that D323 (Residents’ Willingness to Renovate) demonstrated absolute robustness (Probability 100%), with its scatter cloud highly converged deep within the “Effective Identification Zone,” showing no spillover towards the high-weight zone or low-driving zone. D312 (Design Pertinence) also maintained extremely high structural stability (Probability 96.22%). Although minor random perturbations caused a slight diffusion of scatter points, the vast majority of sample points remained tightly clustered within the threshold boundary. This confirms that locking D323 and D312 as Core HLFs is not due to accidental data errors but is a stable characteristic determined by the inherent causal topological structure of the socio-technical system.
4. Optimization Strategies and Performance Verification
4.1. Socio-Technical Feedback Mechanism of Traditional Retrofit Failure
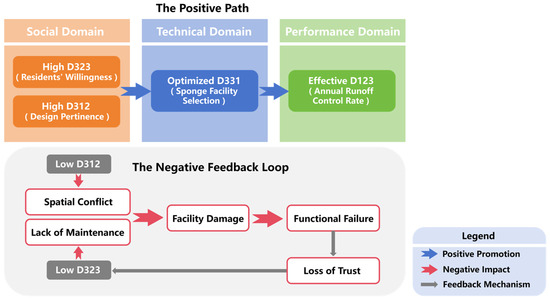
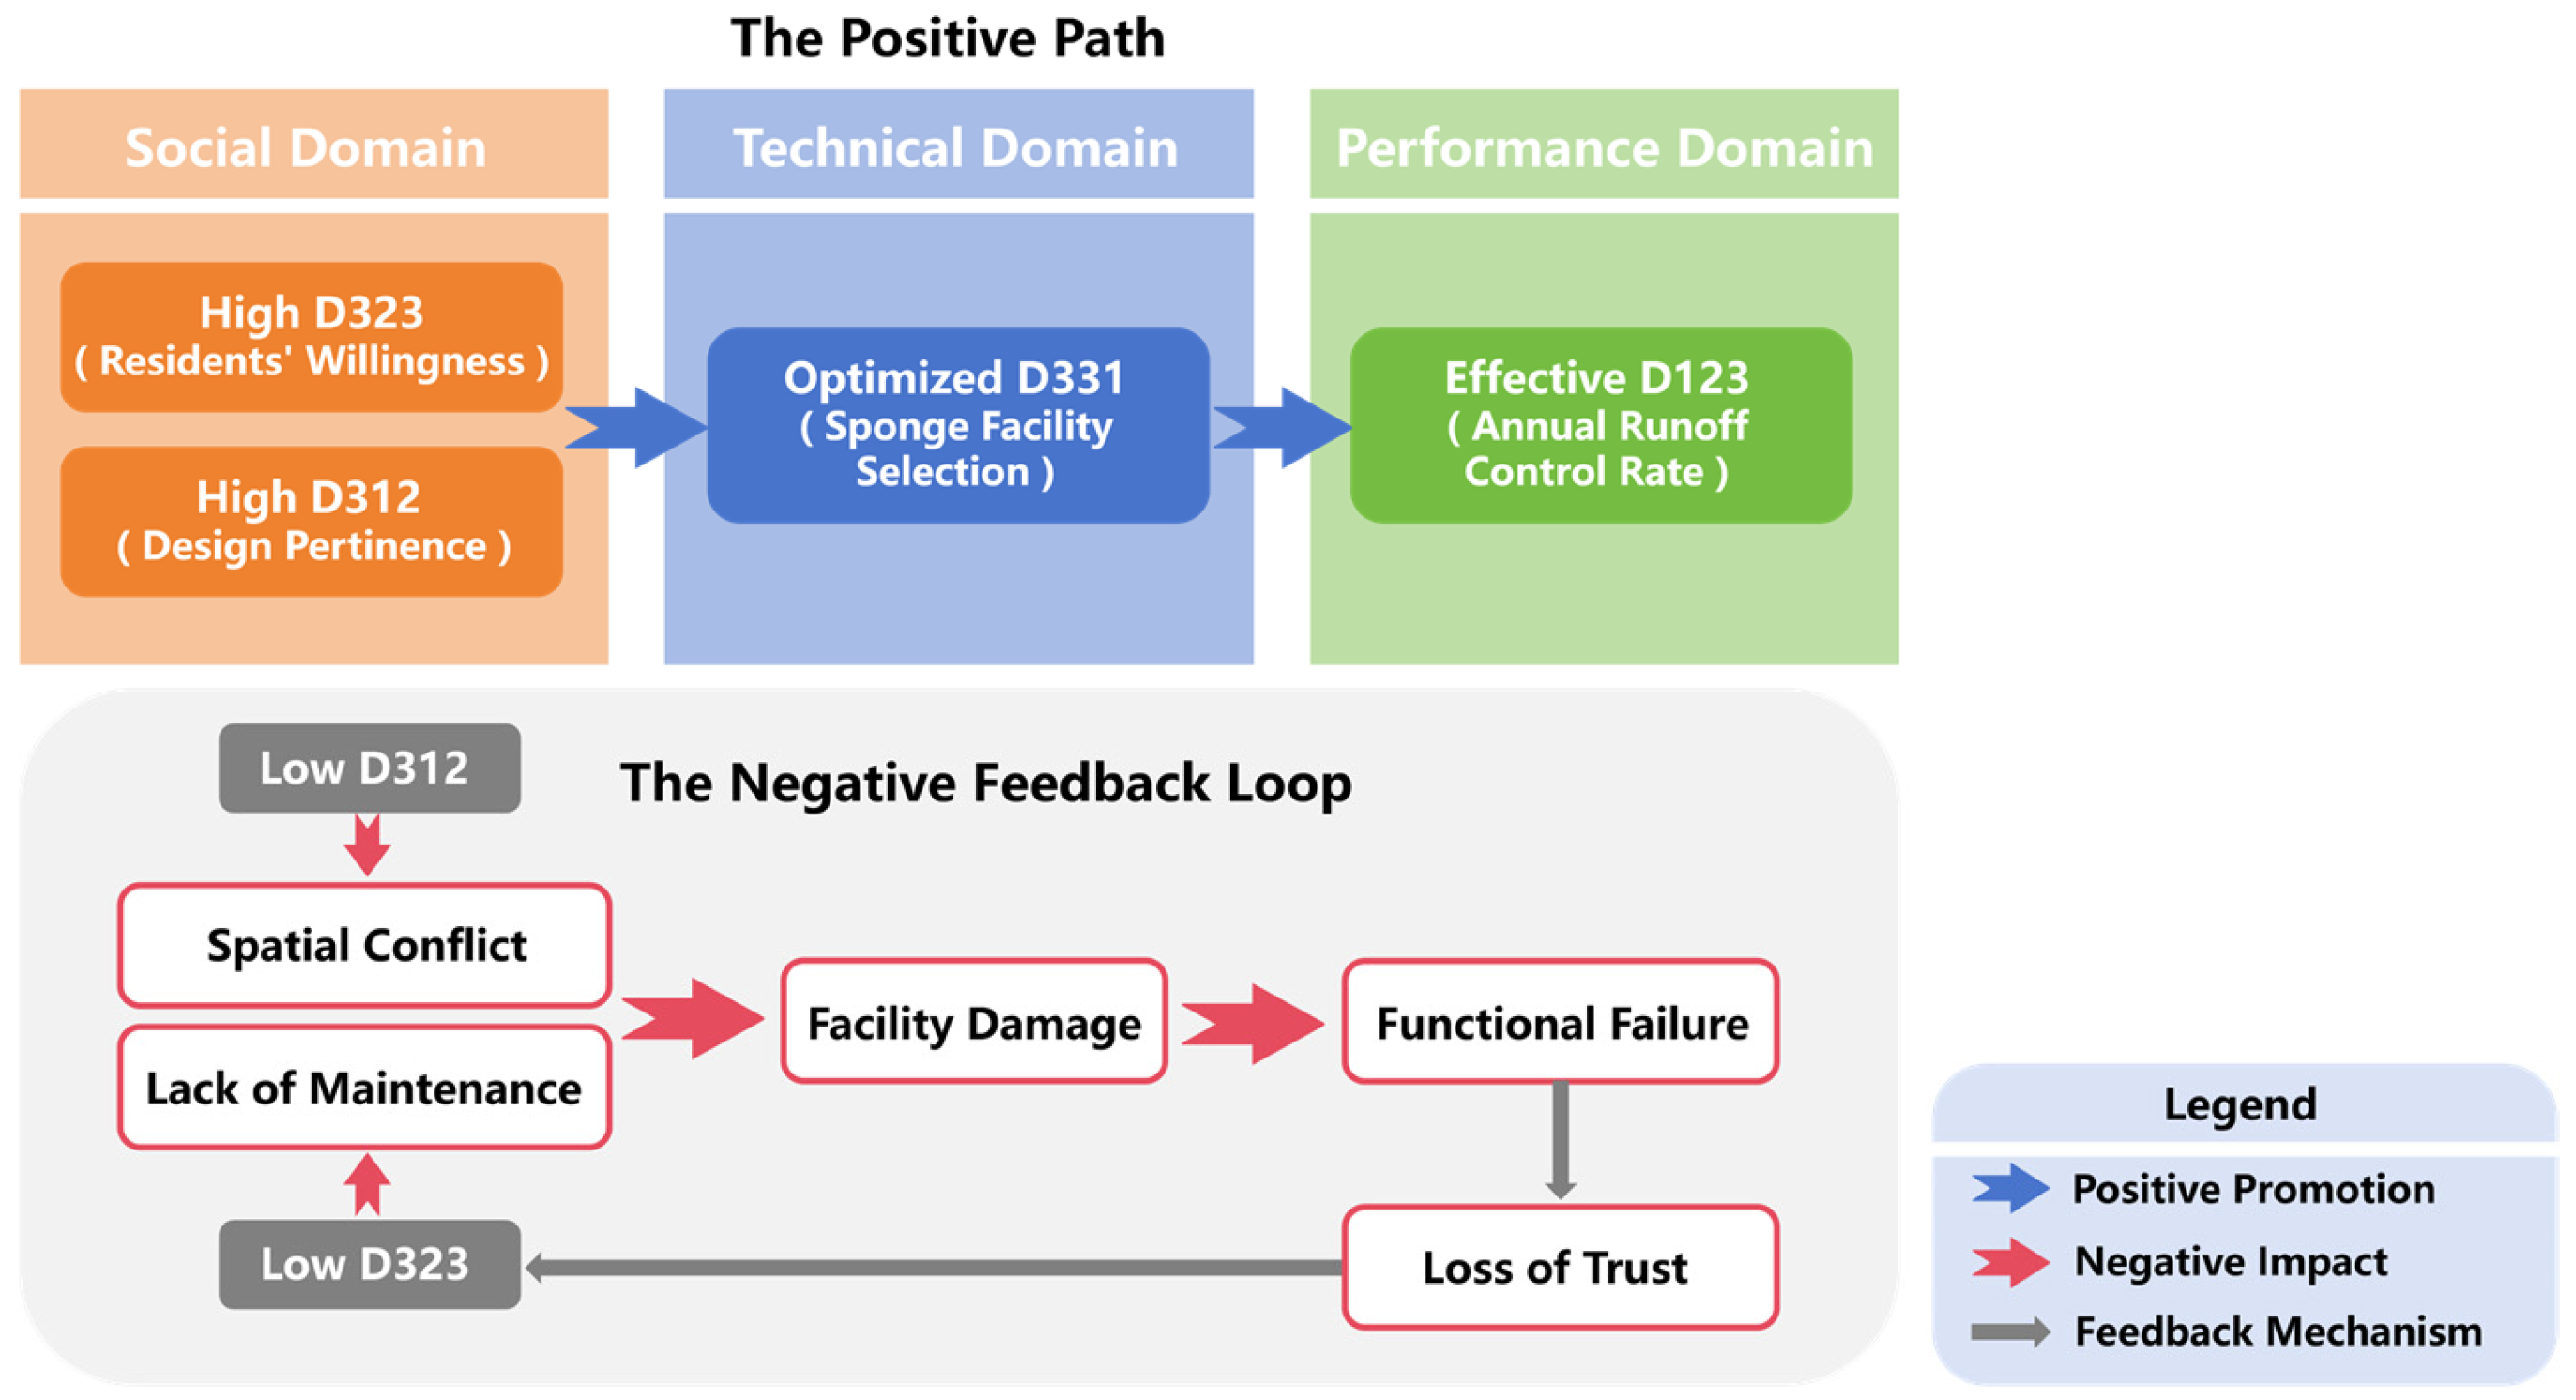
Based on the Core Hidden Leverage Factors (HLFs) locked in Chapter 3, this study reveals the deep causal feedback paths underlying the sponge retrofitting of the DG Community (Figure 6). As shown in Figure 6, the systemic neglect of D312 (Design Pertinence) and D323 (Residents’ Willingness) in the traditional decision-making mode triggers dual negative feedback loops:
Figure 6.
Key causal feedback paths and failure mechanism model based on HLFs.
First is the Conflict Loop in the Spatial Dimension: The lack of “Design Pertinence” as a source constraint leads to the mechanical replication of Low Impact Development (LID) facility layouts, which aggressively encroach on scarce parking and public spaces. This triggers a spatial game of “Construction vs. Livelihood” [51,52], leading to obstruction of construction or forced simplification of schemes.
Second is the Broken Loop in the O&M Dimension: If “Residents’ Willingness” fails to be transformed into effective social capital, the facilities will face a severe “Community O&M Vacuum” after handover [13,53,54], leading to facility occupation or functional degradation.
This causal topology reveals that the root of the failure of the traditional “Technology-Oriented” mode lies in the structural decoupling of the social system and the technical system. Therefore, disrupting the aforementioned negative feedback is the prerequisite for achieving hydrological performance.
4.2. Optimization Strategies and Quantitative Mapping of Physical Parameters
To block the above failure loops, this study integrates Participatory Governance Theory [55] with localized design concepts [56], proposing two intervention paths: micro-renewal design and functional composite, and establishes the correspondence between socio-technical intervention strategies and SWMM physical parameters (Table 3).
Table 3.
Optimization strategies driven by HLFs and the mapping mechanism for SWMM physical parameters.
For D312 (Design Pertinence), the strategy adopts micro-renewal tactics of storage instead of discharge and soil replacement for infiltration to address site constraints caused by high groundwater levels and weak permeable soil. Through this strategy, the physical environment is transformed (e.g., clay replacement), which directly drives the parameter adjustments in the model based on objective data. Spatially, the input areas for facilities like sunken green spaces are exact measurements derived from the facility scale statistics of the community’s architectural design plan. Hydrologically, the physical parameters (such as corrected soil saturated hydraulic conductivity) are set according to the site’s geotechnical survey data and the standard recommended values in the official US EPA SWMM User’s Manual [57]. The specific quantitative mapping values are detailed in Table 3.
For D323 (Residents’ Willingness to Renovate), the study employs the functional composite intervention path. Through whole-process participatory workshops [58,59], residents formed a consensus on the renovation of public spaces, allowing hard-paved spaces originally dominated by parking functions to be physically transformed into carriers for permeable paving and sponge facilities. In the model, this spatial conversion translates directly into measurable engineering data. The comprehensive impervious rate of the sub-catchment area is objectively reduced based on the actual transformed areas of permeable parking and roads. Concurrently, following the same guidelines [57], Manning’s N coefficient for the paved areas is correspondingly adjusted to accurately simulate the increased surface flow resistance provided by the permeable media. All detailed parameter adjustments are summarized in Table 3.
4.3. Quantitative Verification of Hydrological and Environmental Performance
To quantitatively verify the optimization effect, a SWMM conceptual model of the DG Community was constructed. The simulation used the Chicago Design Rainstorm type with a 2-year return period and a duration of 4 h (total rainfall 66.32 mm) for H City, and performed continuous calculation based on the Green-Ampt infiltration model. Table 4 summarizes the comparison results between the status quo baseline and the optimized scheme in three dimensions: water volume, peak value, and water quality.
Table 4.
Comparison of hydrological and environmental performance between the status quo baseline and the optimization scheme.
Simulation data indicates that the optimization scheme significantly repaired the hydrological cycle function of the system. Regarding total volume control, benefiting from the efficient synergy between the vertical storage space provided by sunken green spaces and the large-area infiltration interface released by permeable paving, the Annual Runoff Volume Capture Ratio jumped from 25.95% (Status Quo) to 70.40% (Optimized), achieving a qualitative leap. Regarding flood safety, the peak flow was reduced by 30.85%, indicating that LID facilities exerted significant peak-shaving functions at the moment of peak heavy rainfall. Regarding environmental benefits, the SS pollutant removal rate increased to 53.10%, proving the effectiveness of source interception. The above physical simulation data confirms that by breaking through the rigid spatial and technical constraints of the old community, the scheme successfully achieved the transformation from “Theoretical Indicator Optimization” to “Actual Operational Optimization”.
5. Discussion and Conclusions
Addressing the widespread “Performance Inversion” challenge in the sponge city retrofitting of old communities in China, this study proposed a Robust Causal Diagnostic Framework and conducted an in-depth empirical diagnosis and strategic verification on the DG Community in H City. By integrating the empirical results with the theoretical context, the following key insights and conclusions are drawn:
- (1)
- Validation of the objective existence and critical attributes of HLFs.
Our study confirms that in complex socio-technical systems, there objectively exists a class of “Hidden Leverage Factors (HLFs).” These indicators, such as “Residents’ Willingness to Renovate” and “Design Pertinence,” are typically undervalued in traditional static evaluation systems (low weights) but exert a significant dominating role (strong driving force) in the actual causal network. This finding provides a theoretical explanation for the “Performance Inversion” phenomenon: it reveals that decision-makers often rely excessively on static priorities based on expert experience, failing to identify those core indicators that possess high net driving forces and significantly influence other evaluation outcomes. The driving role of similar indicators in sponge retrofitting projects across other Chinese cities (e.g., [4,7]) further confirms the cross-regional validity of these Hidden Leverage Factors (HLFs) beyond H City.
- (2)
- Effectiveness of the “Static Baseline–Dynamic Causality–Robust Verification” diagnostic path.
The Robust Causal Diagnostic Framework constructed in this study successfully achieved a paradigm shift from “Empirical Evaluation” to “Targeted Diagnosis.” In the empirical analysis of the DG Community, the framework effectively excluded interference items and precisely locked the core pathology. Unlike traditional linear decision-making models, this framework reveals that the fundamental constraint on flood resilience in old communities is not merely a shortage of technical facilities, but the structural misalignment between physical space and social needs (as illustrated by the feedback mechanisms in Section 4).
- (3)
- Efficacy of targeted optimization strategies based on HLFs.
Targeting the diagnosed HLFs, this study formulated intervention strategies of “Micro-Renewal Design” and “Functional Composite,” establishing a quantitative link to the SWMM. Simulation results demonstrated that after adopting these measures, the Annual Runoff Volume Capture Ratio jumped from 25.95% to 70.40% (+44.45%), with significant improvements in peak reduction and water quality. These results quantitatively verify the validity of the proposed framework: by precisely identifying and intervening in the key leverage points within the system, substantial improvements in hydrological performance can be achieved even under rigid spatial and technical constraints.
Limitations:
First, this study relied on the judgments of a 7-member panel composed of technical experts and administrative officials. While this configuration ensures professional alignment with the socio-technical complexity of old community retrofitting and satisfies the consistency requirements of IAHP (CR < 0.1), it represents an expert-driven perspective. Compared to large-scale public surveys, this small sample size may limit the granularity of capturing diverse resident needs, potentially overlooking specific localized social preferences within the community.
Future Directions:
Although this study successfully realized precise diagnosis and performance enhancement for the DG Community, the empirical results from a single case may be limited in generalizability. Future work aims to apply this framework across multiple cities to further examine its applicability under diverse socio-technical conditions. Additionally, we plan to introduce carbon emission indicators and Digital Twin technology to achieve full-process management and continuous improvement of urban flood resilience.
Author Contributions
Conceptualization, H.Y. and Y.S.; methodology, H.Y. and Y.Z. (Yumo Zhu); software, H.Y.; validation, H.Y., Y.Z. (Ying Zhang) and Y.S.; formal analysis, H.Y.; investigation, H.Y. and Y.Z. (Yumo Zhu); resources, Y.Z. (Ying Zhang) and Y.S.; data curation, H.Y.; writing—original draft preparation, H.Y.; writing—review and editing, Y.Z. (Ying Zhang) and Y.Z. (Yumo Zhu); visualization, H.Y.; supervision, Y.Z. (Ying Zhang) and Y.S. All authors have read and agreed to the published version of the manuscript.
Funding
This research received no external funding.
Institutional Review Board Statement
Ethical review and approval were waived for this study due to its non-interventional nature. The study involved professional expert consultation regarding engineering indicators and did not involve surveys of the general public or patients.
Informed Consent Statement
Informed consent was obtained from all subjects involved in the study. All participants were fully informed that their professional assessments would be used for academic research and publication.
Data Availability Statement
The data presented in this study are available on request from the corresponding author. The raw data (expert scoring matrices) are not publicly available due to privacy restrictions regarding the individual expert participants.
Acknowledgments
During the preparation of this manuscript, the author(s) used ChatGPT/GPT for text polishing. The authors have thoroughly reviewed and edited the polished content and take full responsibility for the entirety of this publication.
Conflicts of Interest
The authors declare no conflicts of interest.
References
- Luo, P.; Zheng, Y.; Wang, Y.; Zhang, S.; Yu, W.; Zhu, X.; Huo, A.; Wang, Z.; He, B.; Nover, D. Comparative Assessment of Sponge City Constructing in Public Awareness, Xi’an, China. Sustainability 2022, 14, 11653. [Google Scholar] [CrossRef] [Scilit]
- Yin, D.; Xu, C.; Jia, H.; Yang, Y.; Sun, C.; Wang, Q.; Liu, S. Sponge City Practices in China: From Pilot Exploration to Systemic Demonstration. Water 2022, 14, 1531. [Google Scholar] [CrossRef] [Scilit]
- General Office of the State Council. Guiding Opinions on Comprehensively Promoting the Renovation of Old Urban Residential Communities (Guo Ban Fa [2020] No. 23); China Architecture & Building Press: Beijing, China, 2020. (In Chinese) [Google Scholar]
- Zhang, S.; Liu, L.; Fang, X.; Chen, G.; Ma, S. Barriers to the Renewal of Old Residential Communities in High-Density Urban Areas: Evidence from China. Sustainability 2025, 17, 10745. [Google Scholar] [CrossRef] [Scilit]
- Liang, Y.; Qian, Q.K.; Li, B.; An, Y.; Shi, L. A critical assessment on China’s old neighborhood renovation: Barriers analysis, solutions and future research prospects. Energy Build. 2025, 332, 115407. [Google Scholar] [CrossRef] [Scilit]
- Liu, W.; Kang, Z.; Cai, D.; Han, Y.; Li, X. Renovation Methods for Old Residential Districts in Northern China under the Sponge City Concept. Constr. Sci. Technol. (China) 2019, 7, 10–14. (In Chinese) [Google Scholar]
- Wang, Y.; Cai, J.; Zuo, J.; Bartsch, K.; Huang, M. Conflict or consensus? Stakeholders’ willingness to participate in China’s Sponge City program. Sci. Total Environ. 2021, 769, 145250. [Google Scholar] [CrossRef] [Scilit]
- Wu, J.; Li, W.; Xu, W.; Yuan, L. Measuring Resident Participation in the Renewal of Older Residential Communities in China under Policy Change. Sustainability 2023, 15, 2751. [Google Scholar] [CrossRef] [Scilit]
- Li, W.; Li, Q.; Liu, Y.; Wang, S.; Jia, L. Decision-making factors for renovation of old residential areas in Chinese cities under the concept of sustainable development. Environ. Sci. Pollut. Res. 2023, 30, 39695–39707. [Google Scholar] [CrossRef] [Scilit]
- Zhu, S.; Li, D.; Jiang, Y. The impacts of relationships between critical barriers on sustainable old residential neighborhood renewal in China. Habitat Int. 2020, 103, 102232. [Google Scholar] [CrossRef] [Scilit]
- Chikhi, F.; Li, C.; Ji, Q.; Zhou, X. Review of Sponge City implementation in China: Performance and policy. Water Sci. Technol. 2023, 88, 2499–2520. [Google Scholar] [CrossRef] [Scilit]
- Xu, H.; Randall, M.; Liu, Y.; Xu, M.; Fryd, O. Beyond hydrologic benefits: Post-occupancy evaluation of the Sponge City Construction in China, a case study of the Quyuan Park, Changde. Blue-Green Syst. 2025, 7, 63–78. [Google Scholar] [CrossRef] [Scilit]
- Knapik, E.; Brandimarte, L.; Usher, M. Maintenance in sustainable stormwater management: Issues, barriers and challenges. J. Environ. Plan. Manag. 2025, 68, 2769–2795. [Google Scholar] [CrossRef] [Scilit]
- Chen, Y.; Zhu, D.; Zhou, L. A game theory analysis of promoting the spongy city construction at the building and community scale. Habitat Int. 2019, 86, 91–100. [Google Scholar] [CrossRef] [Scilit]
- Barclay, N.; Klotz, L. Role of Community Participation for Green Stormwater Infrastructure Development. J. Environ. Manag. 2019, 251, 109620. [Google Scholar] [CrossRef] [Scilit]
- Wang, B.; Gong, Y.; Li, X.; Zhang, Y.; Li, Z. Multi-Objective Optimization of Urban Stormwater Systems. J. Environ. Manag. 2025, 386, 125671. [Google Scholar] [CrossRef] [Scilit]
- Azari, B.; Tabesh, M. Urban Storm Water Drainage System Optimization Using a Sustainability Index and LID/BMPs. Sustain. Cities Soc. 2022, 76, 103500. [Google Scholar] [CrossRef] [Scilit]
- Saadatpour, M.; Delkhosh, F.; Afshar, A.; Sandoval Solis, S. Developing a simulation-optimization approach to allocate low impact development practices for managing hydrological alterations in urban watershed. Sustain. Cities Soc. 2020, 61, 102334. [Google Scholar] [CrossRef] [Scilit]
- Cui, T.; Gao, Q.; Long, Y. Multi-Objective Optimal Planning and Deciding of Low Impact Development for an Intending Urban Area. Water 2025, 17, 154. [Google Scholar] [CrossRef] [Scilit]
- Zhu, Y.; Xu, C.; Liu, Z.; Yin, D.; Jia, H.; Guan, Y. Spatial Layout Optimization of Green Infrastructure Based on Life-Cycle Multi-Objective Optimization Algorithm and SWMM Model. Resour. Conserv. Recycl. 2023, 191, 106906. [Google Scholar] [CrossRef] [Scilit]
- Wang, Y.; Huang, X. Socio-hydrology: Conceptual framework, research progress, and future perspectives. Hydrol. Sci. J. 2025, 70, 2729–2733. [Google Scholar] [CrossRef] [Scilit]
- Luo, L.; Yang, L.; Jiang, W. A Novel Performance Evaluation Framework for Sponge City Construction. Buildings 2025, 15, 1814. [Google Scholar] [CrossRef] [Scilit]
- Liu, X.; Chen, Y.; Zhang, H.; Chang, J. An Evaluation of Sponge City Construction and a Zoning Construction Strategy from the Perspective of New Quality Productive Forces: A Case Study of Suzhou, China. Land 2025, 14, 836. [Google Scholar] [CrossRef] [Scilit]
- Ding, K.; Zhang, Y. Practical Research on the Application of Sponge City Reconstruction in Pocket Parks Based on the Analytic Hierarchy Process. Adv. Civ. Eng. 2021, 2021, 5531935. [Google Scholar] [CrossRef] [Scilit]
- Zhao, Z.; Chen, J.; Han, S.; Ding, L.; Zhao, X.; Liu, X.; Deng, H. A Study on Plant Selection for Low-Carbon Rain Gardens Based on an AHP-TOPSIS Model. Sustainability 2024, 16, 2097. [Google Scholar] [CrossRef] [Scilit]
- Leng, L.; Mao, X.; Jia, H.; Xu, T.; Chen, A.S.; Yin, D.; Fu, G. Performance assessment of coupled green-grey-blue systems for Sponge City construction. Sci. Total Environ. 2020, 728, 138608. [Google Scholar] [CrossRef] [Scilit]
- Huang, Z.; Feng, C. Comprehensive Evaluation of Urban Storm Flooding Resilience by Integrating AHP–Entropy Weight Method and Cloud Model. Water 2025, 17, 2576. [Google Scholar] [CrossRef] [Scilit]
- de Brito, M.M.; Evers, M. Multi-criteria decision-making for flood risk management: A survey of the current state of the art. Nat. Hazards Earth Syst. Sci. 2016, 16, 1019–1033. [Google Scholar] [CrossRef] [Scilit]
- Boix Cots, D.; Pardo-Bosch, F.; Pujadas, P. A systematic review on multi-criteria group decision-making methods based on weights: Analysis and classification scheme. Inf. Fusion 2023, 96, 102–126. [Google Scholar] [CrossRef] [Scilit]
- Huang, J.-J.; Chen, C.-Y. Using Markov Random Field and Analytic Hierarchy Process to Account for Interdependent Criteria. Algorithms 2024, 17, 1. [Google Scholar] [CrossRef] [Scilit]
- Saaty, T.L. Decision Making with Dependence and Feedback: The Analytic Network Process; RWS Publications: Pittsburgh, PA, USA, 1996. [Google Scholar]
- Zhang, J.; Han, Y.; Qiao, X.-J.; Randrup, T.B. Citizen Willingness to Pay for the Implementation of Urban Green Infrastructure in the Pilot Sponge Cities in China. Forests 2023, 14, 474. [Google Scholar] [CrossRef] [Scilit]
- Shi, C.; Xia, Y.; Qiu, H.; Wang, X.; Zhou, Y.; Li, Y.; Liu, G.; Li, S.; Gao, W.; Xu, T.; et al. Exploring public attitudes toward implementing green infrastructure for sponge city stormwater management. Sci. Rep. 2024, 14, 24252. [Google Scholar] [CrossRef] [Scilit] [PubMed]
- Meadows, D.H. Leverage Points: Places to Intervene in a System; The Sustainability Institute: Hartland, VT, USA, 1999; Available online: https://www.donellameadows.org/wp-content/userfiles/Leverage_Points.pdf (accessed on 23 January 2026).
- GB/T 51345-2018; Standard for Assessment of Sponge City Construction. China Architecture & Building Press: Beijing, China, 2018.
- Chen, Z.; Zhong, P.; Liu, M.; Ma, Q.; Si, G. An integrated expert weight determination method for design concept evaluation. Sci. Rep. 2022, 12, 6358. [Google Scholar] [CrossRef] [Scilit] [PubMed]
- Ramanathan, R.; Ganesh, L.S. Group preference aggregation methods employed in AHP: An evaluation and an intrinsic process for deriving members’ weightages. Eur. J. Oper. Res. 1994, 79, 249–265. [Google Scholar] [CrossRef] [Scilit]
- Saaty, T.L.; Ozdemir, M.S. Why the magic number seven plus or minus two. Math. Comput. Model. 2003, 38, 233–244. [Google Scholar] [CrossRef] [Scilit]
- Dong, Y.; Zhang, G.; Hong, W.-C.; Xu, Y. Consensus models for AHP group decision making under row geometric mean prioritization method. Decis. Support Syst. 2010, 49, 281–289. [Google Scholar] [CrossRef] [Scilit]
- Li, Y.; Tao, Z. Structure method for judging matrix of group in the AHP. J. Shenyang Norm. Univ. (Nat. Sci. Ed.) 2002, 20, 86–90. (In Chinese) [Google Scholar]
- Gabus, A.; Fontela, E. World Problems, an Invitation to Further Thought Within the Framework of DEMATEL; Battelle Geneva Research Centre: Geneva, Switzerland, 1972. [Google Scholar]
- Si, S.-L.; You, X.-Y.; Liu, H.-C.; Zhang, P. DEMATEL Technique: A Systematic Review of the State-of-the-Art Literature on Methodologies and Applications. Math. Probl. Eng. 2018, 2018, 3696457. [Google Scholar] [CrossRef] [Scilit]
- Huang, J.; Li, L.; Jiang, P.; Zhang, S. DEMATEL-Based ANP Model for Identifying Critical Indicators in Sustainable Emergency Material Reserve Systems. Sustainability 2024, 16, 5263. [Google Scholar] [CrossRef] [Scilit]
- Cui, H.; Dong, S.; Hu, J.; Chen, M.; Hou, B.; Zhang, J.; Zhang, B.; Xian, J.; Chen, F. A hybrid MCDM model with Monte Carlo simulation to improve decision-making stability and reliability. Inf. Sci. 2024, 662, 119439. [Google Scholar] [CrossRef] [Scilit]
- Mazurek, J.; Strzałka, D. On the Monte Carlo weights in multiple criteria decision analysis. PLoS ONE 2022, 17, e0268950. [Google Scholar] [CrossRef] [Scilit]
- Chen, Y.; Yu, J.; Khan, S. Spatial sensitivity analysis of multi-criteria weights in GIS-based land suitability evaluation. Environ. Model. Softw. 2010, 25, 1582–1591. [Google Scholar] [CrossRef] [Scilit]
- Nunnally, J.C. Psychometric Theory, 2nd ed.; McGraw-Hill: New York, NY, USA, 1978. [Google Scholar]
- He, H.; Wang, H.; Zheng, L.; Zhao, T.; Zhang, P.; Zheng, K. Factors and Pathways to Enhance Resident Satisfaction in Old Residential Neighbourhood Renovation: A Configuration Analysis of Cases in Central Nanchang, China. Buildings 2025, 15, 1125. [Google Scholar] [CrossRef] [Scilit]
- Więckowski, J.; Sałabun, W. Sensitivity analysis approaches in multi-criteria decision analysis: A systematic review. Appl. Soft Comput. 2023, 148, 110915. [Google Scholar] [CrossRef] [Scilit]
- Cardozo, F.A.C.; Campos, H.J.S.; Petter, C.O.; Ambrós, W.M. Application of Monte Carlo Analytic Hierarchy Process (MAHP) in Underground Mining Access Selection. Mining 2023, 3, 773–785. [Google Scholar] [CrossRef] [Scilit]
- Jim, C.Y.; Chan, M.W.H. Urban greenspace delivery in Hong Kong: Spatial-institutional limitations and solutions. Urban For. Urban Green. 2016, 18, 65–85. [Google Scholar] [CrossRef] [Scilit]
- Seidu, S.; Chan, D.W.M.; Taiwo, R. Integrating green and grey infrastructure systems in dense urban regions: A synthesis of critical barriers and effective implementation guidelines. Clean Technol. Environ. Policy 2025, 27, 7555–7576. [Google Scholar] [CrossRef] [Scilit]
- Brown, R.R.; Farrelly, M.A. Delivering sustainable urban water management: A review of the hurdles we face. Water Sci. Technol. 2009, 59, 839–846. [Google Scholar] [CrossRef] [Scilit]
- Yuan, M.; Kim, J.-O. Unveiling Participation Dynamics: A Comparative Study of Green Infrastructure Practices. Land 2025, 14, 2267. [Google Scholar] [CrossRef] [Scilit]
- Mahmoud, I.H.; Morello, E.; Salvia, G.; Puerari, E. Greening Cities, Shaping Cities: Pinpointing Nature-Based Solutions in Cities between Shared Governance and Citizen Participation. Sustainability 2022, 14, 7011. [Google Scholar] [CrossRef] [Scilit]
- Boros, J.; Mahmoud, I. Urban Design and the Role of Placemaking in Mainstreaming Nature-Based Solutions. Learning From the Biblioteca Degli Alberi Case Study in Milan. Front. Sustain. Cities 2021, 3, 635610. [Google Scholar] [CrossRef] [Scilit]
- Rossman, L.A. Storm Water Management Model User’s Manual Version 5.1; EPA-600/R-14/413; U.S. Environmental Protection Agency: Cincinnati, OH, USA, 2015.
- Scannell, L.; Gifford, R. Defining place attachment: A tripartite organizing framework. J. Environ. Psychol. 2010, 30, 1–10. [Google Scholar] [CrossRef] [Scilit]
- Lewicka, M. Place attachment: How far have we come in the last 40 years? J. Environ. Psychol. 2011, 31, 207–230. [Google Scholar] [CrossRef] [Scilit]

Disclaimer/Publisher’s Note: The statements, opinions and data contained in all publications are solely those of the individual author(s) and contributor(s) and not of MDPI and/or the editor(s). MDPI and/or the editor(s) disclaim responsibility for any injury to people or property resulting from any ideas, methods, instructions or products referred to in the content. |
© 2026 by the authors. Licensee MDPI, Basel, Switzerland. This article is an open access article distributed under the terms and conditions of the Creative Commons Attribution (CC BY) license.