


Abstract
Urban railway networks play a central role in reshaping urban spatial structures, commercial activity, and population distribution. This study investigates how different transfer hub types in Seoul—a megacity with one of the world’s densest rail systems—affect nearby commercial clusters, active population agglomeration, and land values. We classify 298 stations into single-line (non-transfer) and multi-line transfer types and examine three aspects within a 500 m station catchment area: the density of surrounding commercial areas, active population agglomeration derived from mobile phone data, and land price changes using government-assessed land values from 2016 to 2024. To capture local variations, commercial areas were categorized as Developmental Commercial Areas, Commercial Alley Areas, and Traditional Markets. The results show that multi-line transfer hubs host denser commercial facilities and attract larger active populations than single-line stations. Active population varies significantly by station type, averaging approximately 1520 persons near single-line stations, 1969 near subway–subway transfer hubs, and 1637 near subway–rail transfer hubs. However, land price increases were more strongly influenced by the overlap and extent of station catchment areas than by transfer type alone. Robustness checks using alternative catchment specifications indicate that the main qualitative land-price patterns are stable with respect to the definition of the influence area. These findings contribute to understanding of how transfer hierarchy influences urban agglomeration and provide policy insights for typology-based transit-oriented development (TOD) planning in megacities.
1. Introduction
Urban railway networks are increasingly recognized as critical determinants of spatial restructuring, commercial activity, and population distribution in global megacities. Seoul, which operates the world’s third-largest subway system with 298 stations—including 78 transfer hubs as of 2020—exemplifies this phenomenon. With ongoing expansions such as the Great Train Express (GTX), the number and importance of transfer hubs are expected to increase further, highlighting the central role of transfer hubs in shaping urban dynamics.
In this study, agglomeration refers to the clustering of people and economic activity within a 500 m station catchment area. Prior studies suggest that accessibility provided by transfer hubs significantly affects surrounding land use and commercial development. For instance, Pagliara et al. (2006) [1] emphasized that residential location choice and property values reflect trade-offs among accessibility, housing costs, and amenities. Similarly, Heo & Kang (2012) [2] found that complex transfer centers in the Republic of Korea increased commercial land prices by attracting floating populations. In Japan, Chigusa et al. (2021) [3] demonstrated that land price increases tend to concentrate in large metropolitan transfer hubs.
Because administrative districts in Seoul often contain both transfer and non-transfer stations, we define the unit of analysis as station influence areas to ensure a consistent unit of comparison. In descriptive terms, transfer-station areas differ in baseline characteristics from non-transfer-station areas. For example, the mean active population within station influence areas is 1520 persons for non-transfer stations, compared with 1803 persons for transfer stations. Over 2016–2024, the government-assessed land value increased by 58.6% in non-transfer-station areas, compared with 53.9% in transfer-station areas. Commercial district indicators also differ by transfer status; for instance, the average number of developed commercial districts is 3.87 for non-transfer-station areas versus 5.76 for transfer-station areas. Note that active population and commercial-district measures are based on a cross-sectional snapshot due to data availability, whereas land prices are observed annually from 2016 to 2024; we use these descriptive statistics only to provide baseline context. Against this backdrop, understanding whether transfer-related station areas exhibit systematically different agglomeration patterns is particularly important in Seoul’s dense metro network.
A growing body of research has examined transit-oriented development (TOD), highlighting the heterogeneity of station areas and the importance of context-specific classifications. Su et al. (2021) [4] identified multiple TOD typologies across five Chinese cities, while Lyu et al. (2016) [5] stressed that local characteristics must be considered in Beijing’s TOD policies. In the Korean context, Hwang & Kim (2024) [6] and Kim et al. (2014) [7] highlighted the necessity of type-specific station management in Busan, showing that spatial and economic impacts vary significantly by station type.
At a broader metropolitan scale, Lee & Lee (2005) [8] argued that detailed analyses of regional travel patterns are essential for effective transportation policy, while Kim (2015) [9] demonstrated that the operational efficiency of transit facilities directly influences user satisfaction and convenience. These findings highlight the policy relevance of investigating station influence from multiple perspectives—land use, population concentration, and economic outcomes.
Despite these insights, relatively few studies provide empirical evidence on how different transfer system types (e.g., single-line vs. multi-line, subway–subway vs. subway–railway transfers) specifically shape agglomeration in Seoul. Given the city’s exceptionally dense station network—where the average inter-station distance is less than 1 km—understanding the differentiated impacts of transfer hubs is particularly urgent.
While numerous studies have examined the relationship between accessibility and land value, few have addressed how different types of transfer connectivity produce heterogeneous agglomeration effects within a single metropolitan system. This study fills this gap by quantifying how transfer hierarchy shapes commercial concentration, population density, and land price variation in Seoul.
Accordingly, the objectives of this study are three-fold. First, it examines variations in active population concentrations across transfer types. Second, it investigates commercial clustering around stations, distinguishing among Planned Commercial Hubs, Neighborhood Retail Clusters, and Traditional Marketplaces. Third, it employs a Difference-in-Differences (DID) framework to analyze land price changes over time, while also considering the overlap and spatial extent of multiple station catchment areas. By integrating these three dimensions, this study provides empirical insights into how transfer hubs shape agglomeration patterns in Seoul, contributing to the broader discourse on TOD strategies in dense metropolitan contexts.
This article extends our earlier EASTS conference proceedings paper [10] by adding additional data, expanded analyses, and a fuller discussion of results.
2. Literature Reviews
A comprehensive understanding of station influence dynamics is essential for sustainable urban transportation and urban economic outcomes.
In particular, the concept of transfer hierarchy provides an important theoretical lens through which to interpret the diverse effects of station influence. Recent research emphasizes that transfer hubs should be understood not merely as transport nodes but as multi-scale urban centers that integrate commercial, mobility, and social functions. Zemp et al. (2011) [11] developed a typology of railway stations based on their connectivity and functional roles, showing that higher connectivity is often associated with stronger land-use and commercial agglomeration effects. Similarly, Suzuki et al. (2013) [12] demonstrated that the effectiveness of transit-oriented development (TOD) in megacities depends on both institutional frameworks and the hierarchical structure of transit networks, where multi-line interchanges play distinct roles in shaping urban form. Building on these frameworks, this study conceptualizes transfer hierarchy as a determinant of how commercial concentration, population dynamics, and land price variation emerge within station influence areas.
Previous research can be broadly categorized into three themes: (1) transformations in commercial districts and economic activity, (2) changes in population movement and density, and (3) fluctuations in land prices and station area development.
2.1. Commercial District Changes and Economic Activities in Transit Hub Areas
Transit accessibility and connectivity are central drivers of changes in adjacent commercial districts. Both domestic and international studies show that improvements in transportation infrastructure reshape commercial activity and land use. In the Republic of Korea, Hong et al. (2015) [13] and Kang & Sung (2018) [14] demonstrated that subway accessibility stimulates the restructuring of nearby commercial districts. Internationally, Xu et al. (2016) [15] and Bhattacharjee & Goetz (2016) [16] found that public transit significantly increases the value of commercial real estate. Ding, Cao, & Liu (2019) [17] further emphasized that the built environment around stations strongly influences retail activity and transit usage. More recently, Hong (2023) [18] confirmed that accessibility is becoming an increasingly important factor in the formation and persistence of commercial centers in Seoul. Collectively, these studies show that transfer hubs function not only as mobility nodes but also as commercial focal points. However, few studies have investigated whether such effects vary by transfer type, particularly in dense metropolitan rail systems such as Seoul.
2.2. Population Movement and Density Changes Based on Transfer Levels
Population dynamics represent another critical dimension of station influence. In Seoul, Lim et al. (2013) [19] compared user characteristics across different transfer types and found that transfer hubs attract a wider range of trip purposes. Kim & Nam. (2013) [20] highlighted that the spatial extent of station catchment areas depends on actual travel behavior rather than fixed distance thresholds. Broader urban studies support these findings. AlQuhtani & Anjomani (2021) [21] showed that railway transfer hubs significantly influence population density, with higher connectivity linked to greater agglomeration. High-speed rail research provides further insights: Fang et al. (2022) [22] observed that HSR promotes population growth in major Chinese cities but accelerates decline in smaller ones, while Kim & Kim (2018) [23] found that service industries cluster around HSR stations, indirectly shaping local population agglomeration. Taken together, these findings suggest that the relationship between transit accessibility and population agglomeration cannot be explained by accessibility alone. It is also shaped by the hierarchical structure and transfer level of each station. In other words, transfer configurations—such as whether a station serves as a non-transfer station, a subway-to-subway hub, or a subway-to-railway interchange—can produce distinct spatial effects on population concentration. Therefore, when evaluating the influence of station areas on urban population dynamics, it is essential to consider not only general transit accessibility but also the structural complexity and functional hierarchy of transfer levels.
2.3. Land Price Changes and Station Area Development
The relationship between transfer hubs and land price dynamics is well established.
Debrezion, Pels, & Rietveld (2007) [24] quantified how property prices increase as the distance to stations decreases, while Bowes & Ihlanfeldt (2001) [25] explained that accessibility benefits directly translate into land price premiums. In the Republic of Korea, Heo & Kang (2012) [2] showed that complex transfer hubs raise commercial land prices by attracting large floating populations, and Choi & Kim (2021) [26] confirmed a strong positive correlation between accessibility improvements and land value increases in station areas.
Recent studies reinforce this pattern. Lee et al. (2018) [27] examined land price changes around Seoul’s stations, while Morikawa et al. (2023) [28] analyzed real estate value shifts near Japanese transfer hubs. From a policy perspective, Rungskunroch et al. (2020) [29] demonstrated that transit-oriented mixed-use developments exert upward pressure on surrounding land prices. Lee & Lee (2005) [8] argued that metropolitan travel patterns must be analyzed carefully for effective policy design, while Kim (2015) [9] showed that the operational efficiency of transit facilities may affect land values through its impact on user satisfaction.
Overall, these findings indicate that transfer hubs are pivotal in shaping land price dynamics. At the same time, most empirical evidence still relies on simplified station influence areas even though recent methodological work highlights access-sensitive delineations of station catchments and the resulting overlap in dense networks (Lahoorpoor & Levinson, 2020; Lahoorpoor et al., 2022) [30,31]. Accordingly, the rationale for our baseline buffer definition and robustness checks is provided in Section 4.4. However, quantitative evidence on heterogeneity in land-price dynamics by transfer hierarchy—particularly when overlapping catchments are explicitly considered—remains insufficiently documented.
Taken together, prior studies show that rail accessibility and connectivity shape commercial development, population concentration, and land-value premiums around stations, yet these effects are highly heterogeneous across contexts. In dense metropolitan systems such as Seoul, this heterogeneity is likely to depend not only on transfer hierarchy but also on how station influence areas are delineated and how overlapping catchments are handled. However, few empirical studies jointly examine commercial-district composition, mobile-derived active population agglomeration, and longitudinal land-price dynamics within a unified framework for a single megacity. To address this gap, this study classifies 298 stations by transfer type and integrates commercial-district and active-population indicators measured within the baseline catchment with DID-based land-price analyses over 2016–2024, complemented by robustness checks for the land-price component using alternative catchment specifications and overlap-aware analyses.
3. Data
To evaluate station influences on surrounding commercial districts and station-area active population, we first collected four types of data for Seoul: station location data, transfer information, commercial district location data, and building information. Table 1 presents an overview of these datasets and the information captured in each. Due to issues relating to the supply and demand of data, there is a discrepancy in the base year of commercial district, active population, and land price data.
Table 1.
Summary of datasets and key variables used for analysis.
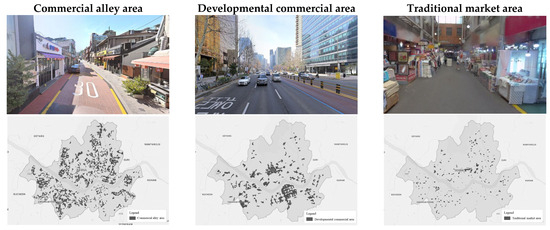
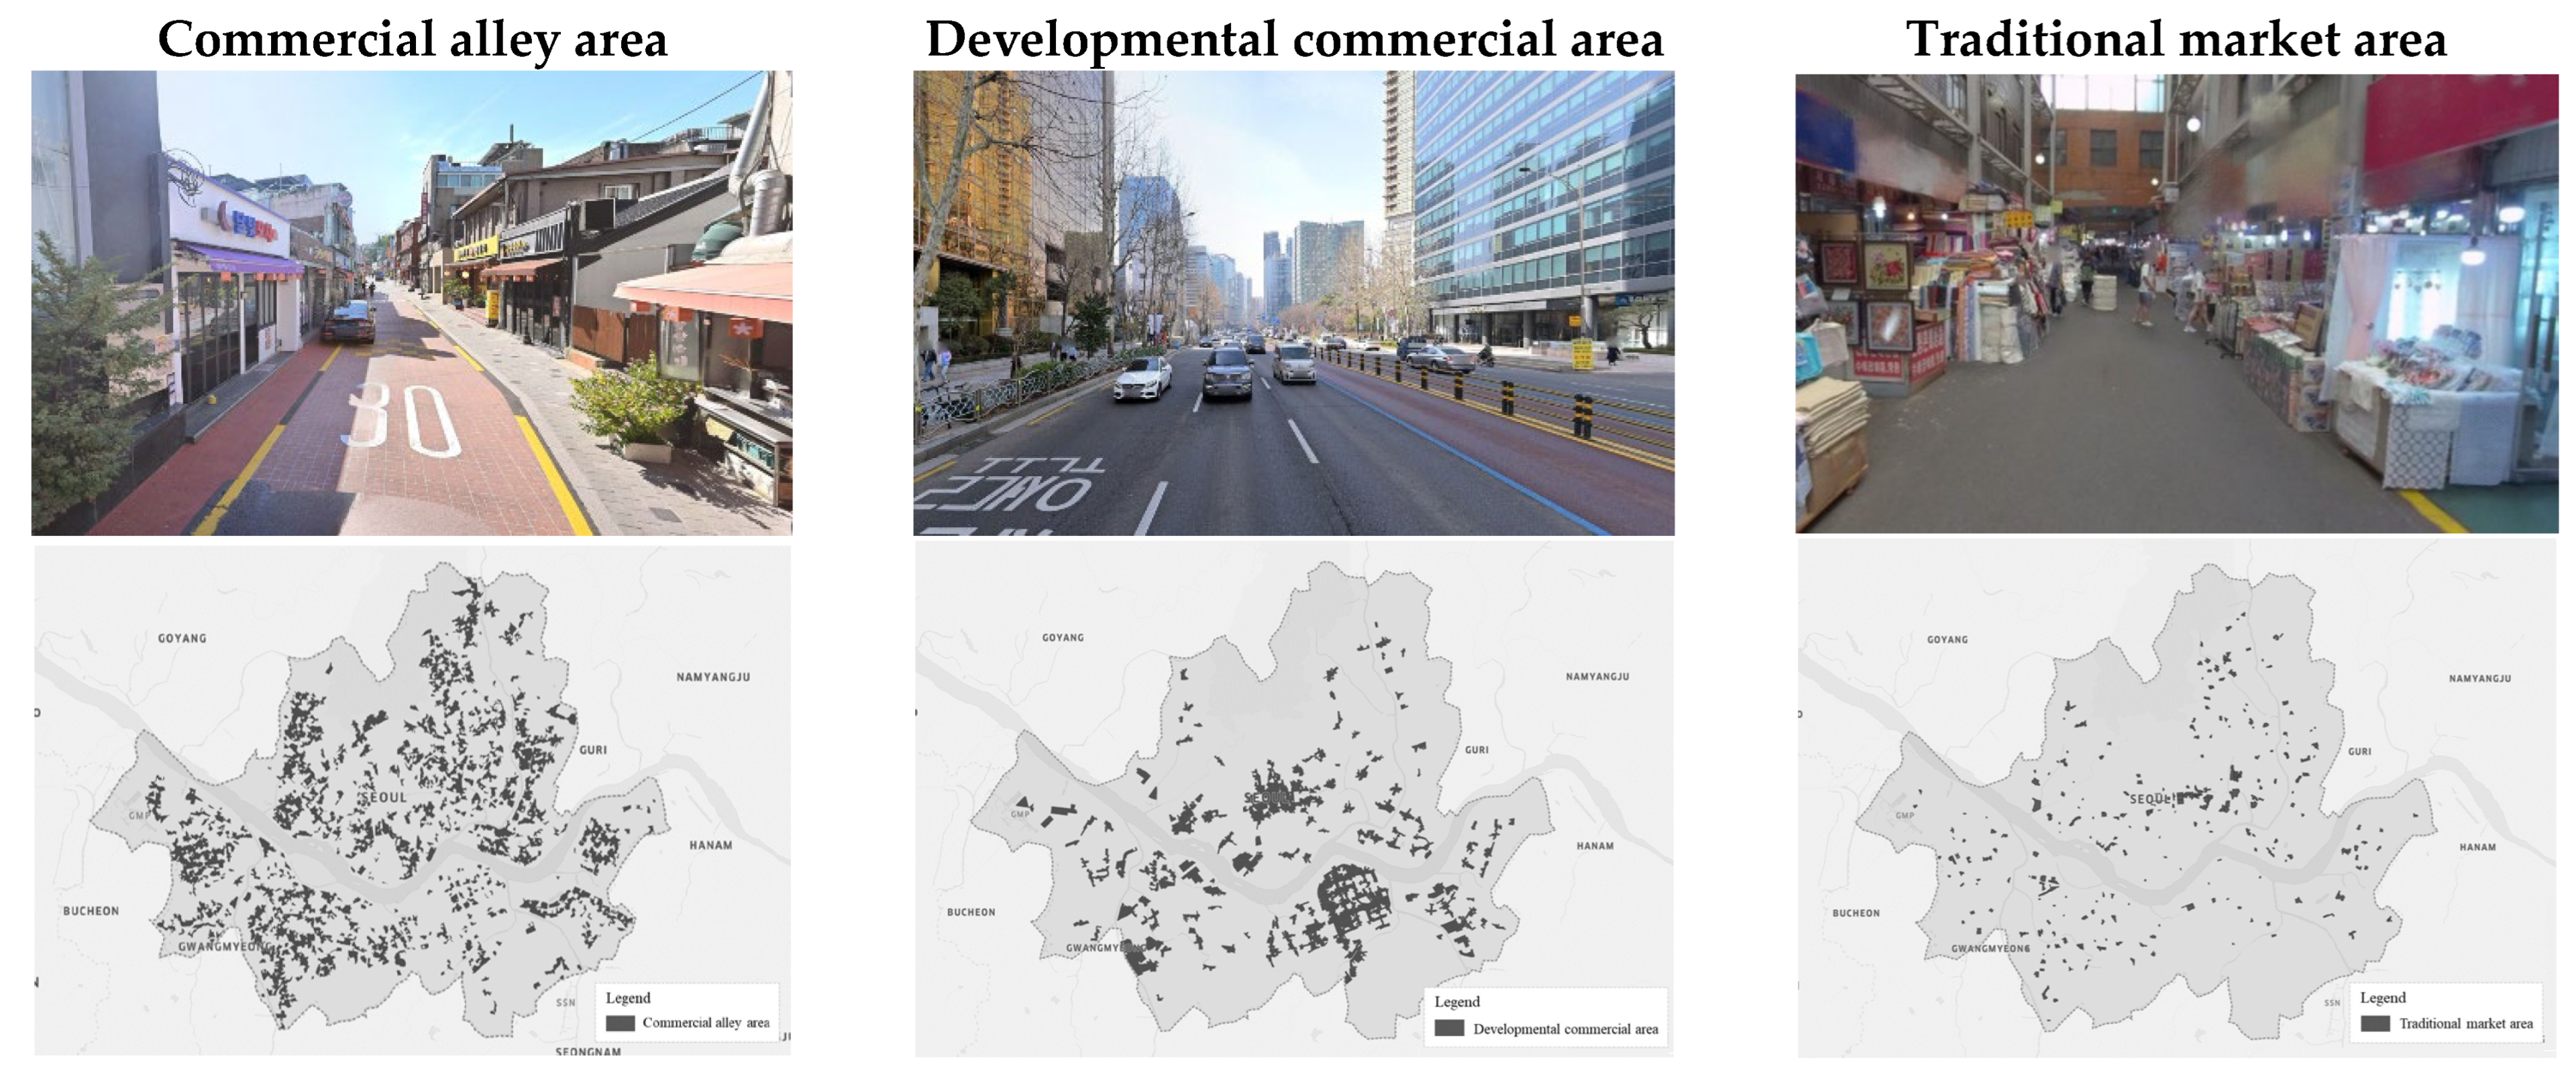
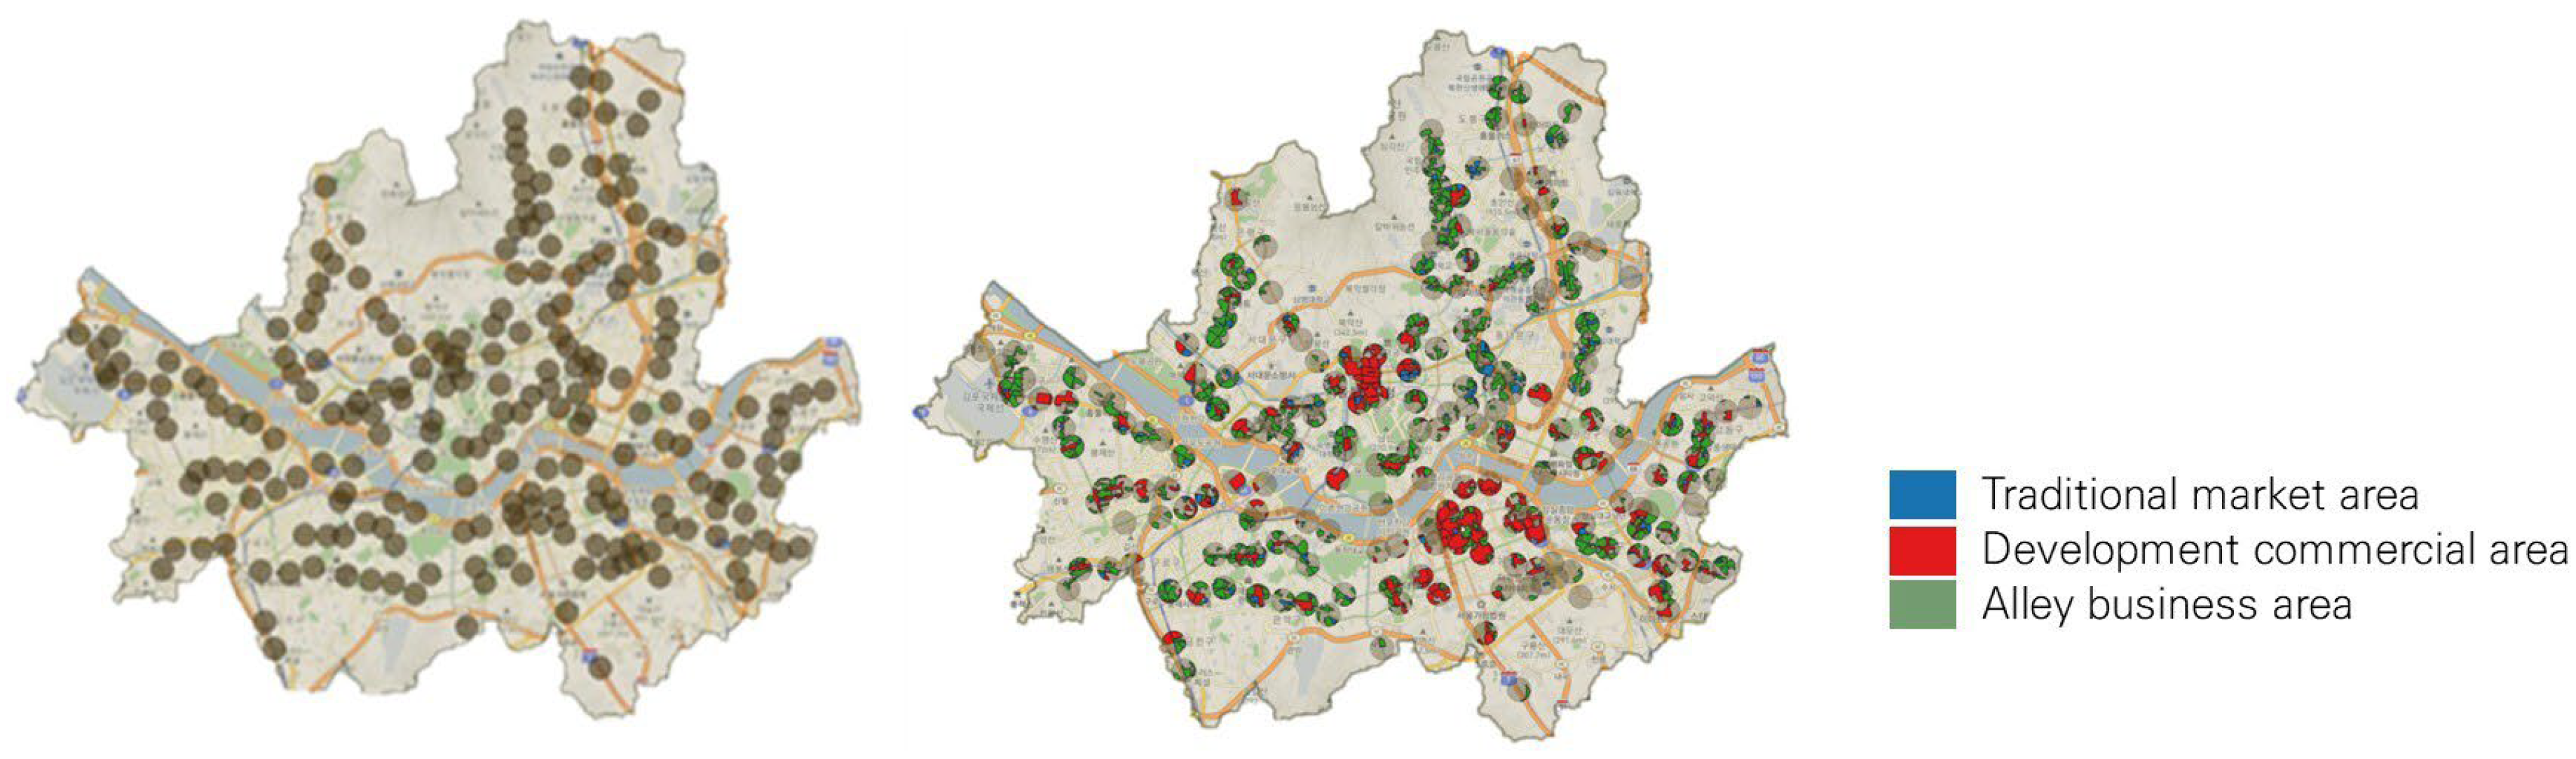
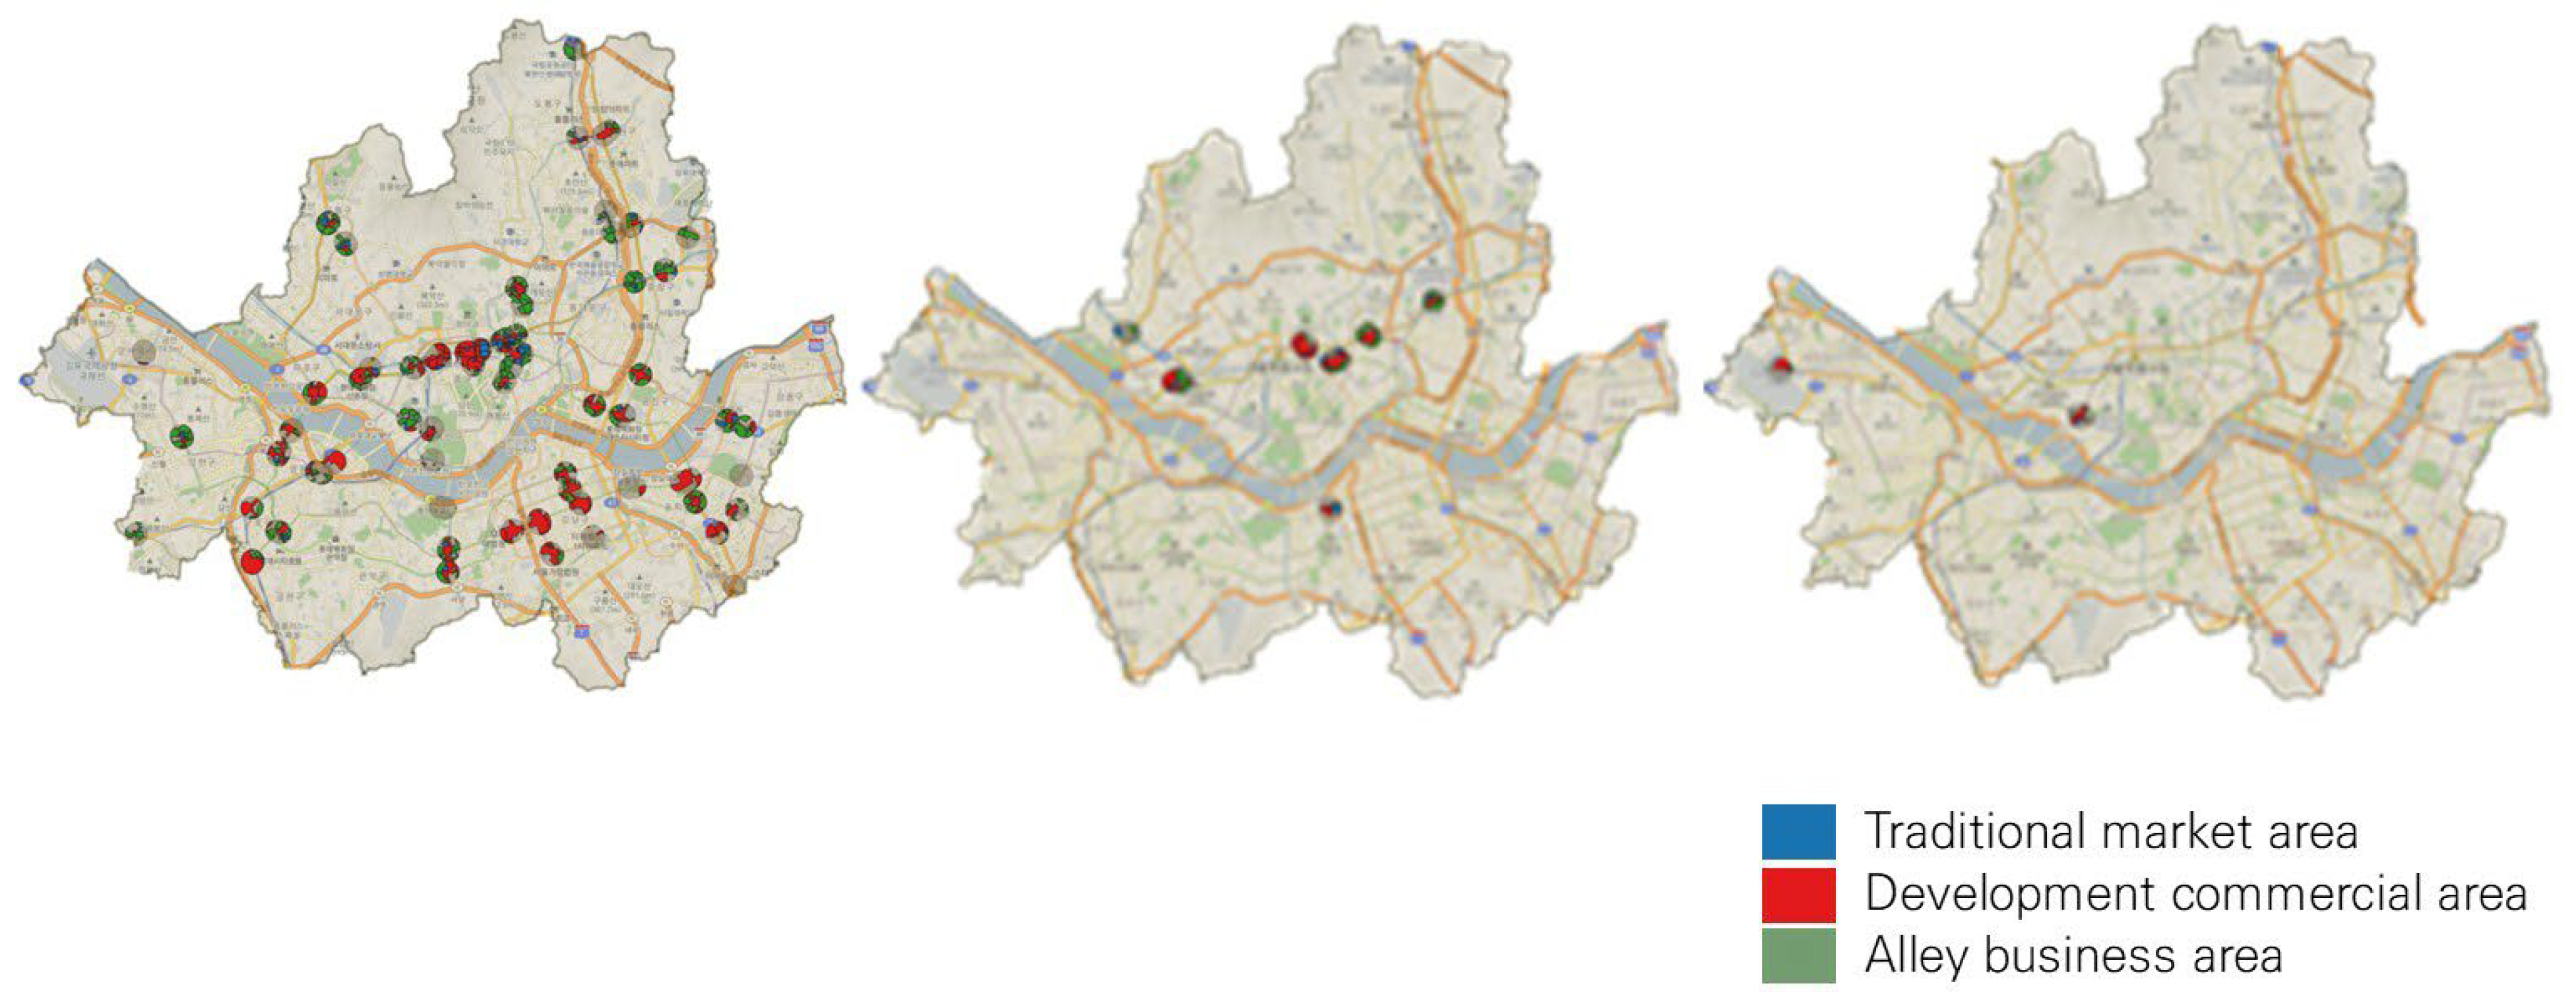
This study drew on public datasets released in 2020 through the Seoul Open Data Plaza and delineated a total of 1665 commercial districts citywide. The commercial districts are classified into three types: Developmental Commercial Areas, Commercial Alley Areas, and Traditional Market Areas. Figure 1 shows the citywide spatial pattern of commercial districts by type across Seoul, together with representative street-view images illustrating typical examples of each category. This visual reference aids in understanding the spatial characteristics and built environment differences among Commercial Alley Areas, Developmental Commercial Areas, and Traditional Market Areas.
Figure 1.
Spatial Distribution and Representative Street Views of Commercial District Types in Seoul.
A Commercial Alley Area is defined as a block unit with 30 or more storefronts offering daily necessities concentrated within a 200-m radius from a road centerline, excluding areas adjacent to major commercial hubs such as developed commercial areas, department stores, large discount stores, and supermarkets. We identified 1090 commercial alley areas. As shown in the left image of Figure 1, commercial alley areas include the largest number of blocks among all commercial district types and are widely distributed throughout Seoul.
A Developmental Commercial Area refers to a major commercial zone where a wide range of sectors are densely clustered within a walkable range—including but not limited to trade, food-service activities, accommodation services, personal/everyday services, financial services, real-estate services, educational services, health and welfare services, cultural/arts-related and religious services, and tourism- and leisure-related activities—without considering residential catchments. A total of 249 developmental commercial areas were identified. As shown in the center image of Figure 1, developmental commercial areas are densely clustered along the Han River corridor traversing Seoul. Although they contain the fewest number of blocks among all commercial district types, their total area is comparatively large.
A Traditional Market Area denotes a district composed of long-established or regular markets that have organically formed over time, based on the official traditional market lists designated by the central government and Seoul Metropolitan Government. A total of 326 traditional market areas were identified from the database used in the Seoul Commercial District Analysis Service. As shown in the right image of Figure 1, traditional market areas are dispersed throughout the city but occupy very small spatial extents compared to other commercial district types.
Active population figures were sourced from a Seoul municipal open dataset generated using KT mobile network signals recorded at about 6000 base stations throughout the city. The data provide time-specific estimates of the population present within each spatial unit, accounting for both resident and daytime populations. In this study, we analyzed the full 24-h active population profile observed on Tuesday, 6 December 2022. The data are aggregated into 19,153 census output areas, limiting spatial resolution. To examine neighborhood-level clustering within 500 m of each station, the active population was reallocated to higher-resolution spatial units. We first assigned values to individual buildings using floor area as the weighting factor and then reallocated those values to 50 m × 50 m grid cells for subsequent analysis. For building data, national GIS building information (2022) provided by the Ministry of Land, Infrastructure, and Transport was used, totaling 668,529 building records. The active population was distributed according to total floor area using these datasets.
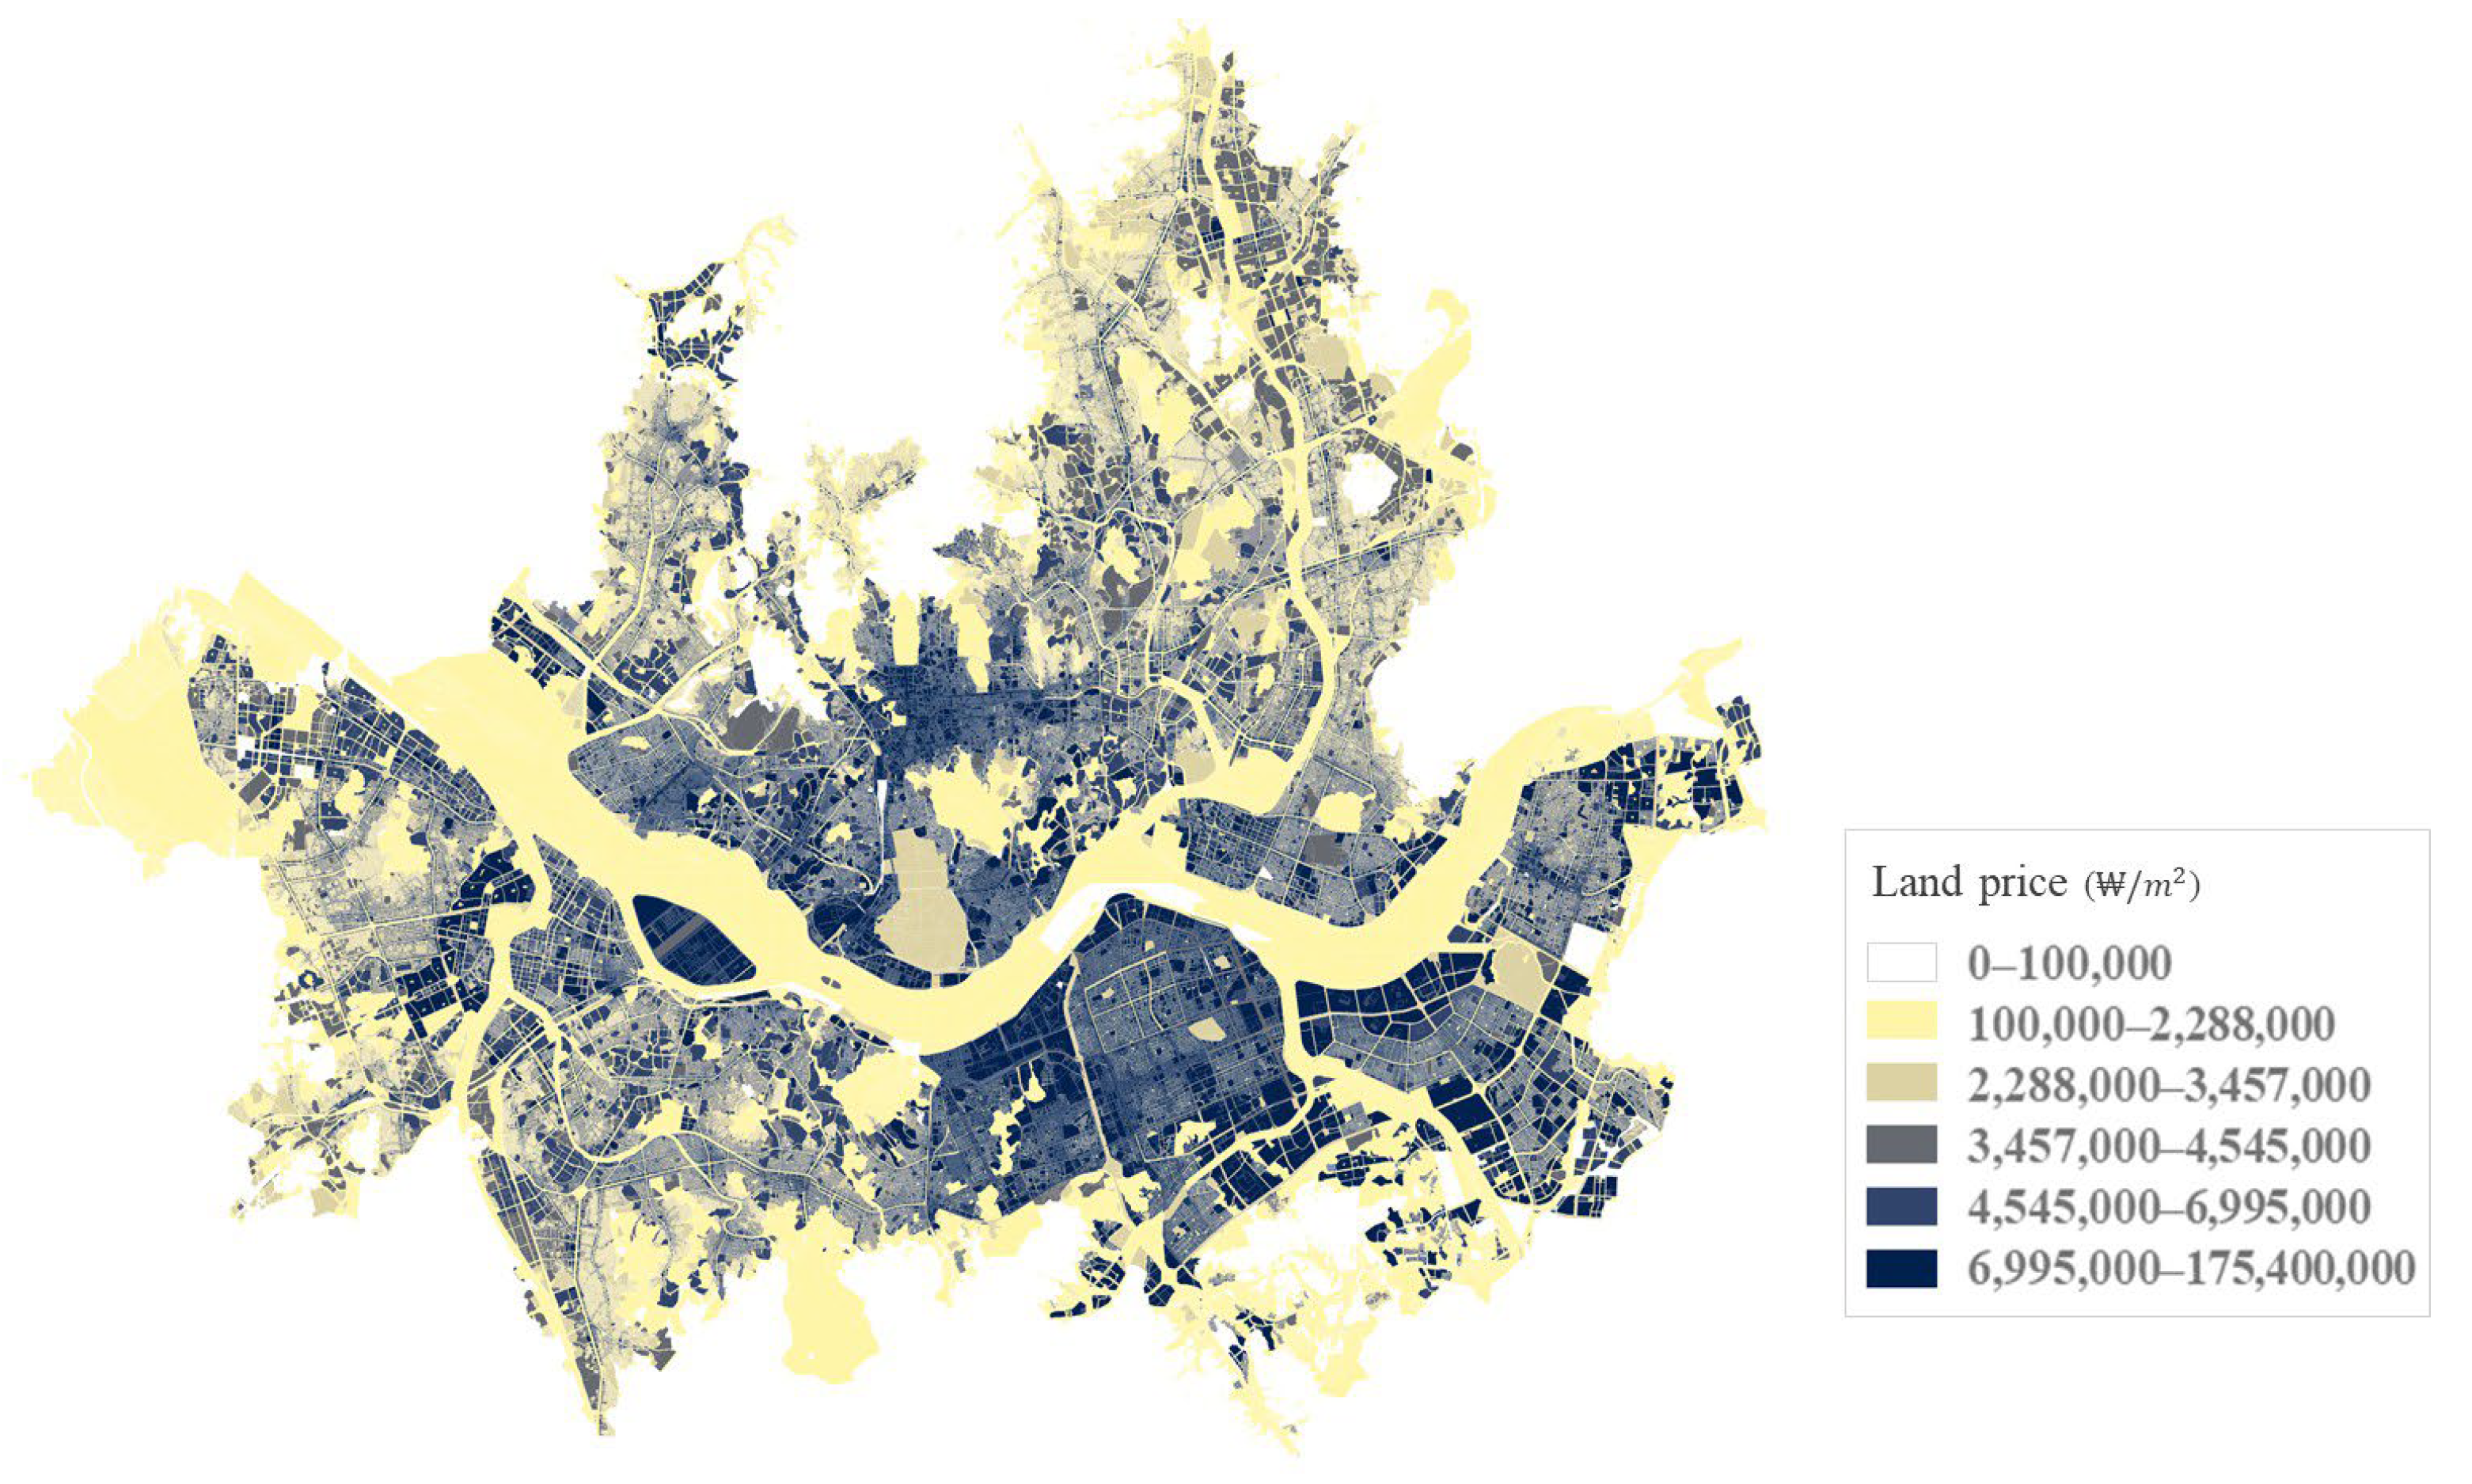
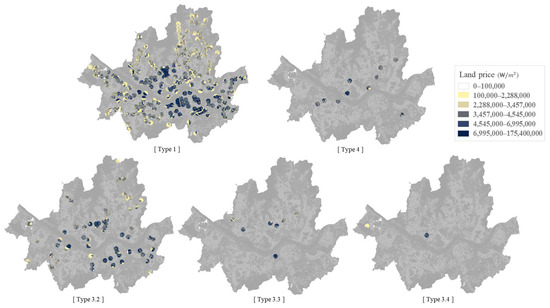
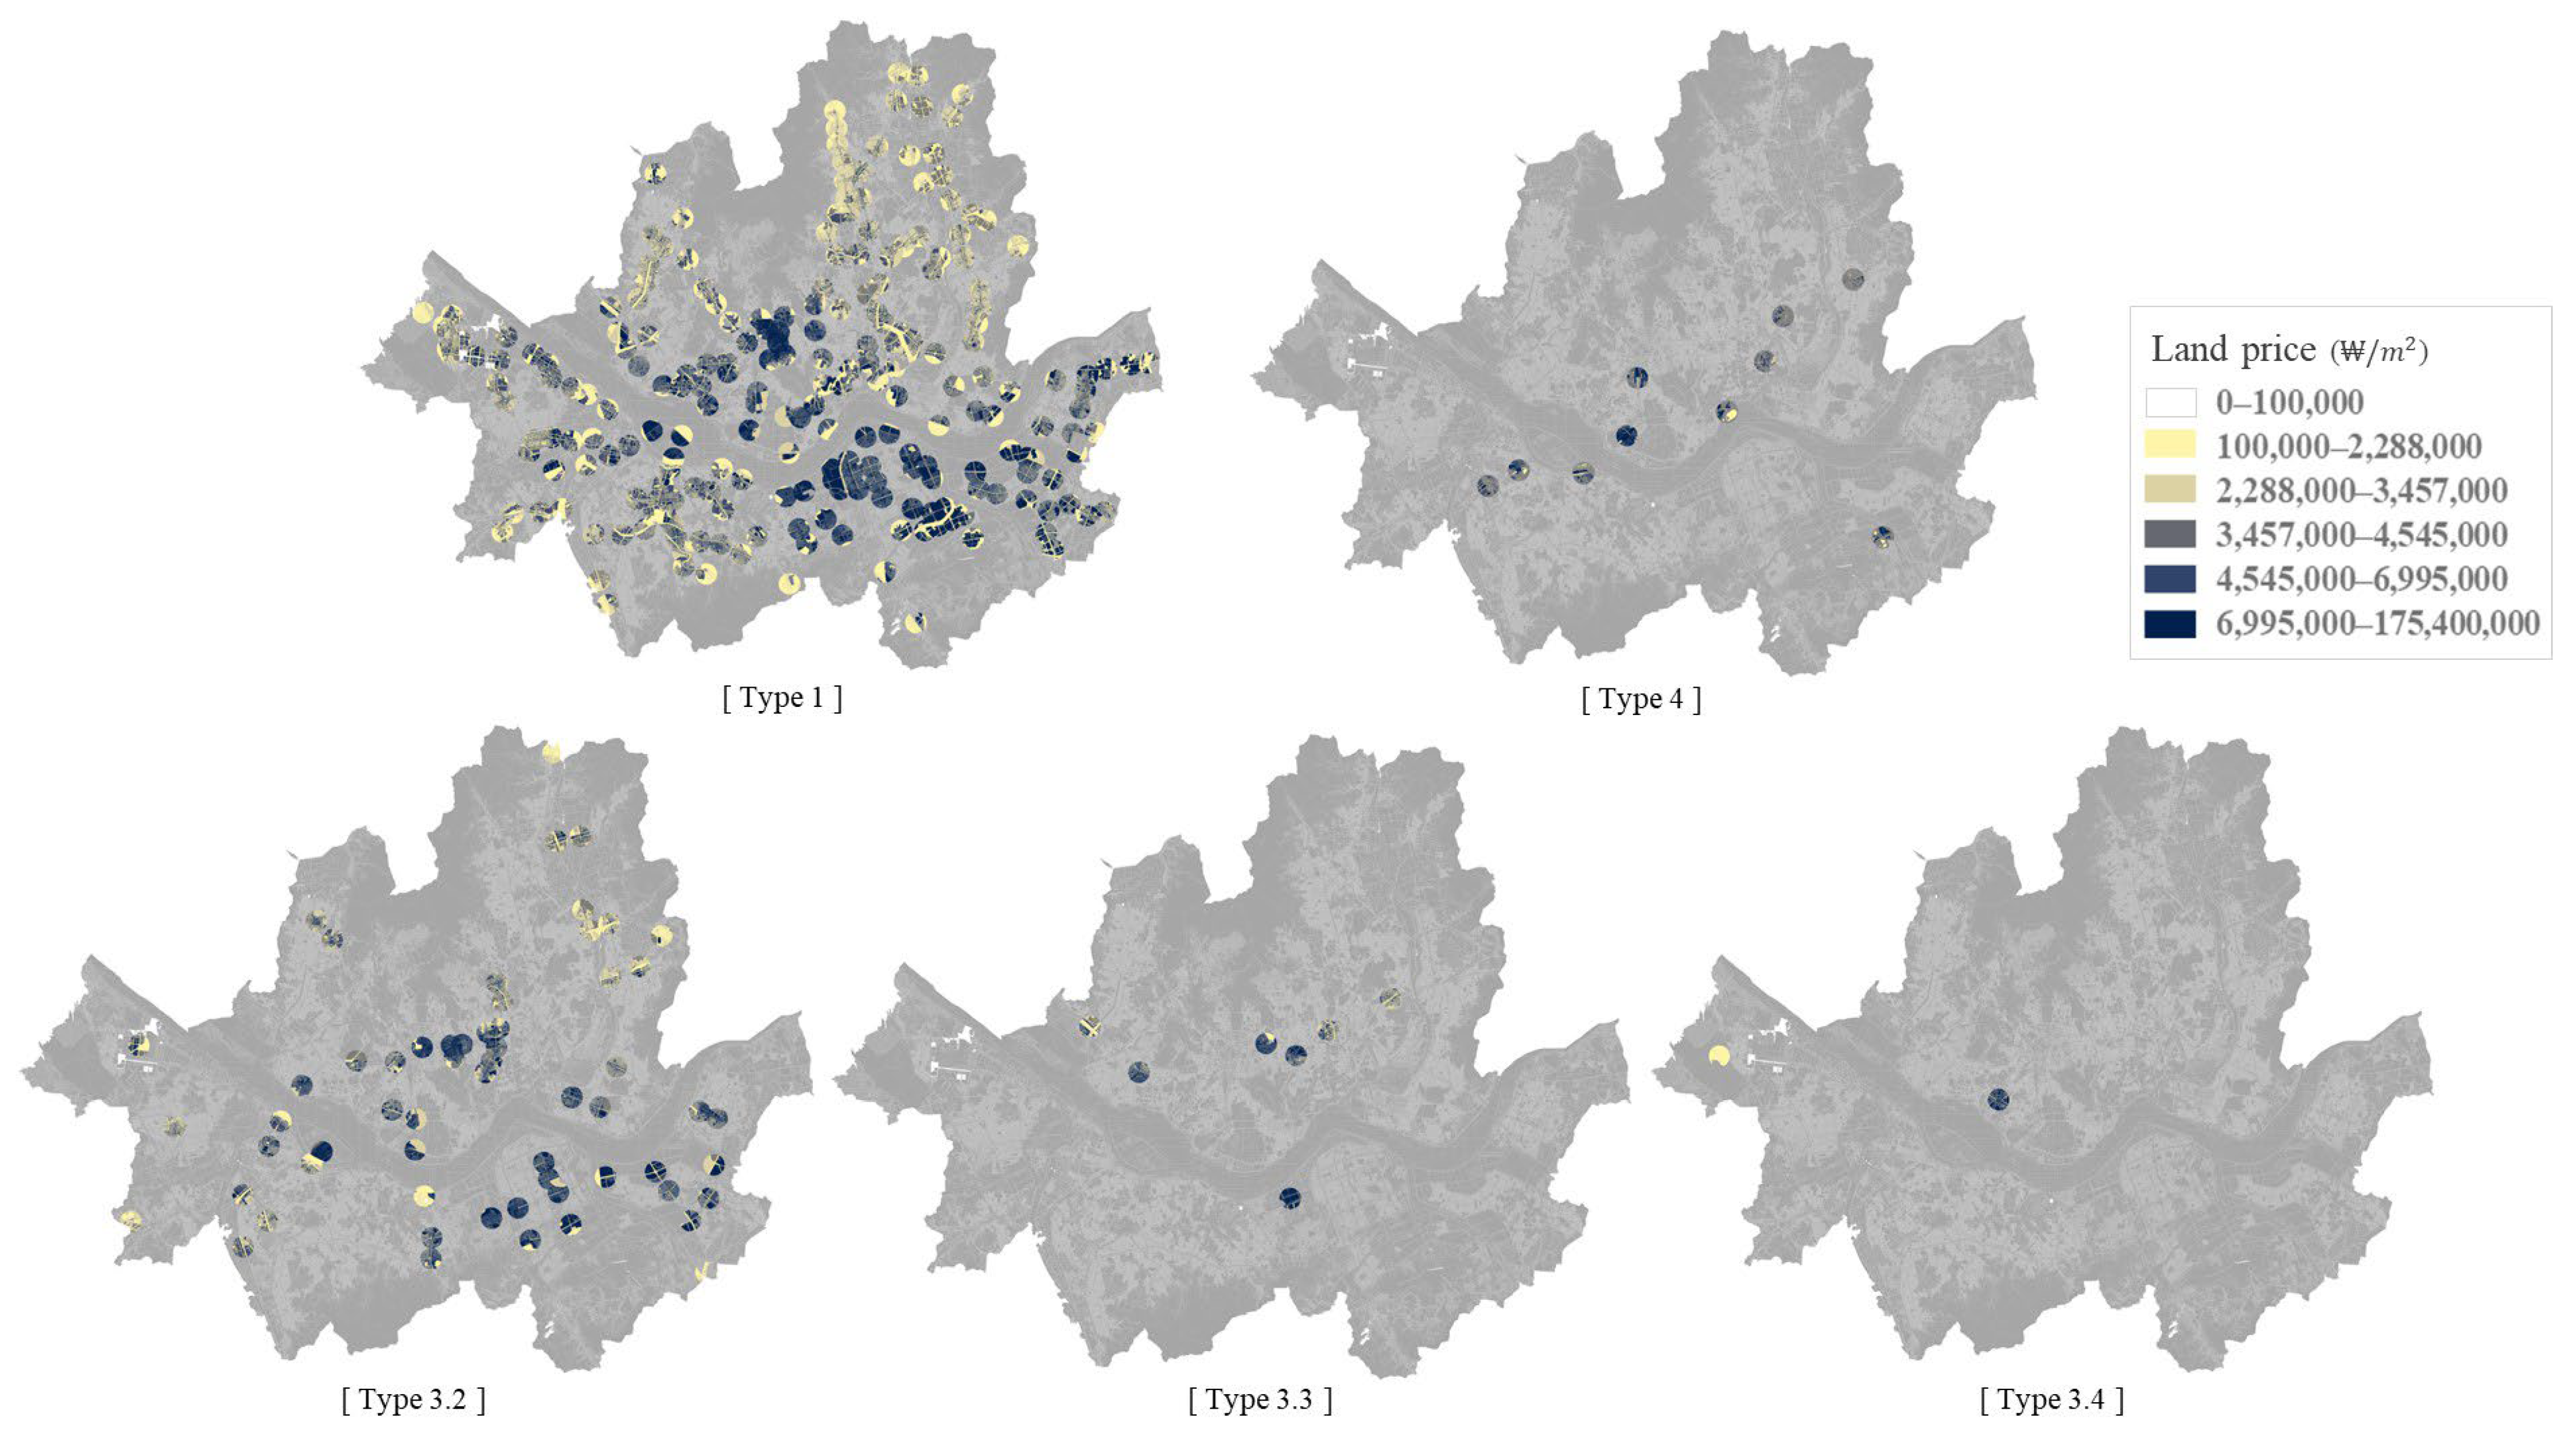
The land price refers to the price per unit area (₩/m2) of individual parcels of land. It is calculated by comparing the attributes of each parcel with those of standard reference land, as specified by the annually published standard land prices announced by the Minister of Land, Infrastructure, and Transport. Approximately 900,000 land parcels in Seoul were averaged within the designated range of each station’s influence area for analysis. As shown in Figure 2, the land parcels are evenly distributed across the city with no missing areas, and land prices gradually decrease from the central districts toward the outer regions of Seoul. The dataset spanning from 2016 to 2024 was analyzed to ascertain year-to-year fluctuations. The land price for each transfer type was estimated by calculating the mean of the land price within each station’s radius, while also accounting for stations whose transfer type changes over time.
Figure 2.
Distribution of land price.
4. Methodology
4.1. Classification of Station Type and Influence Area
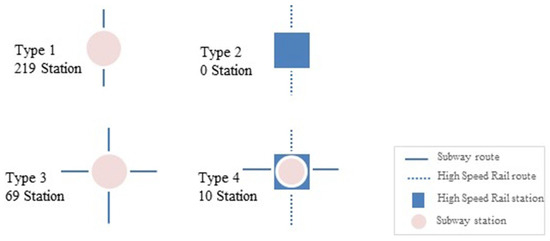
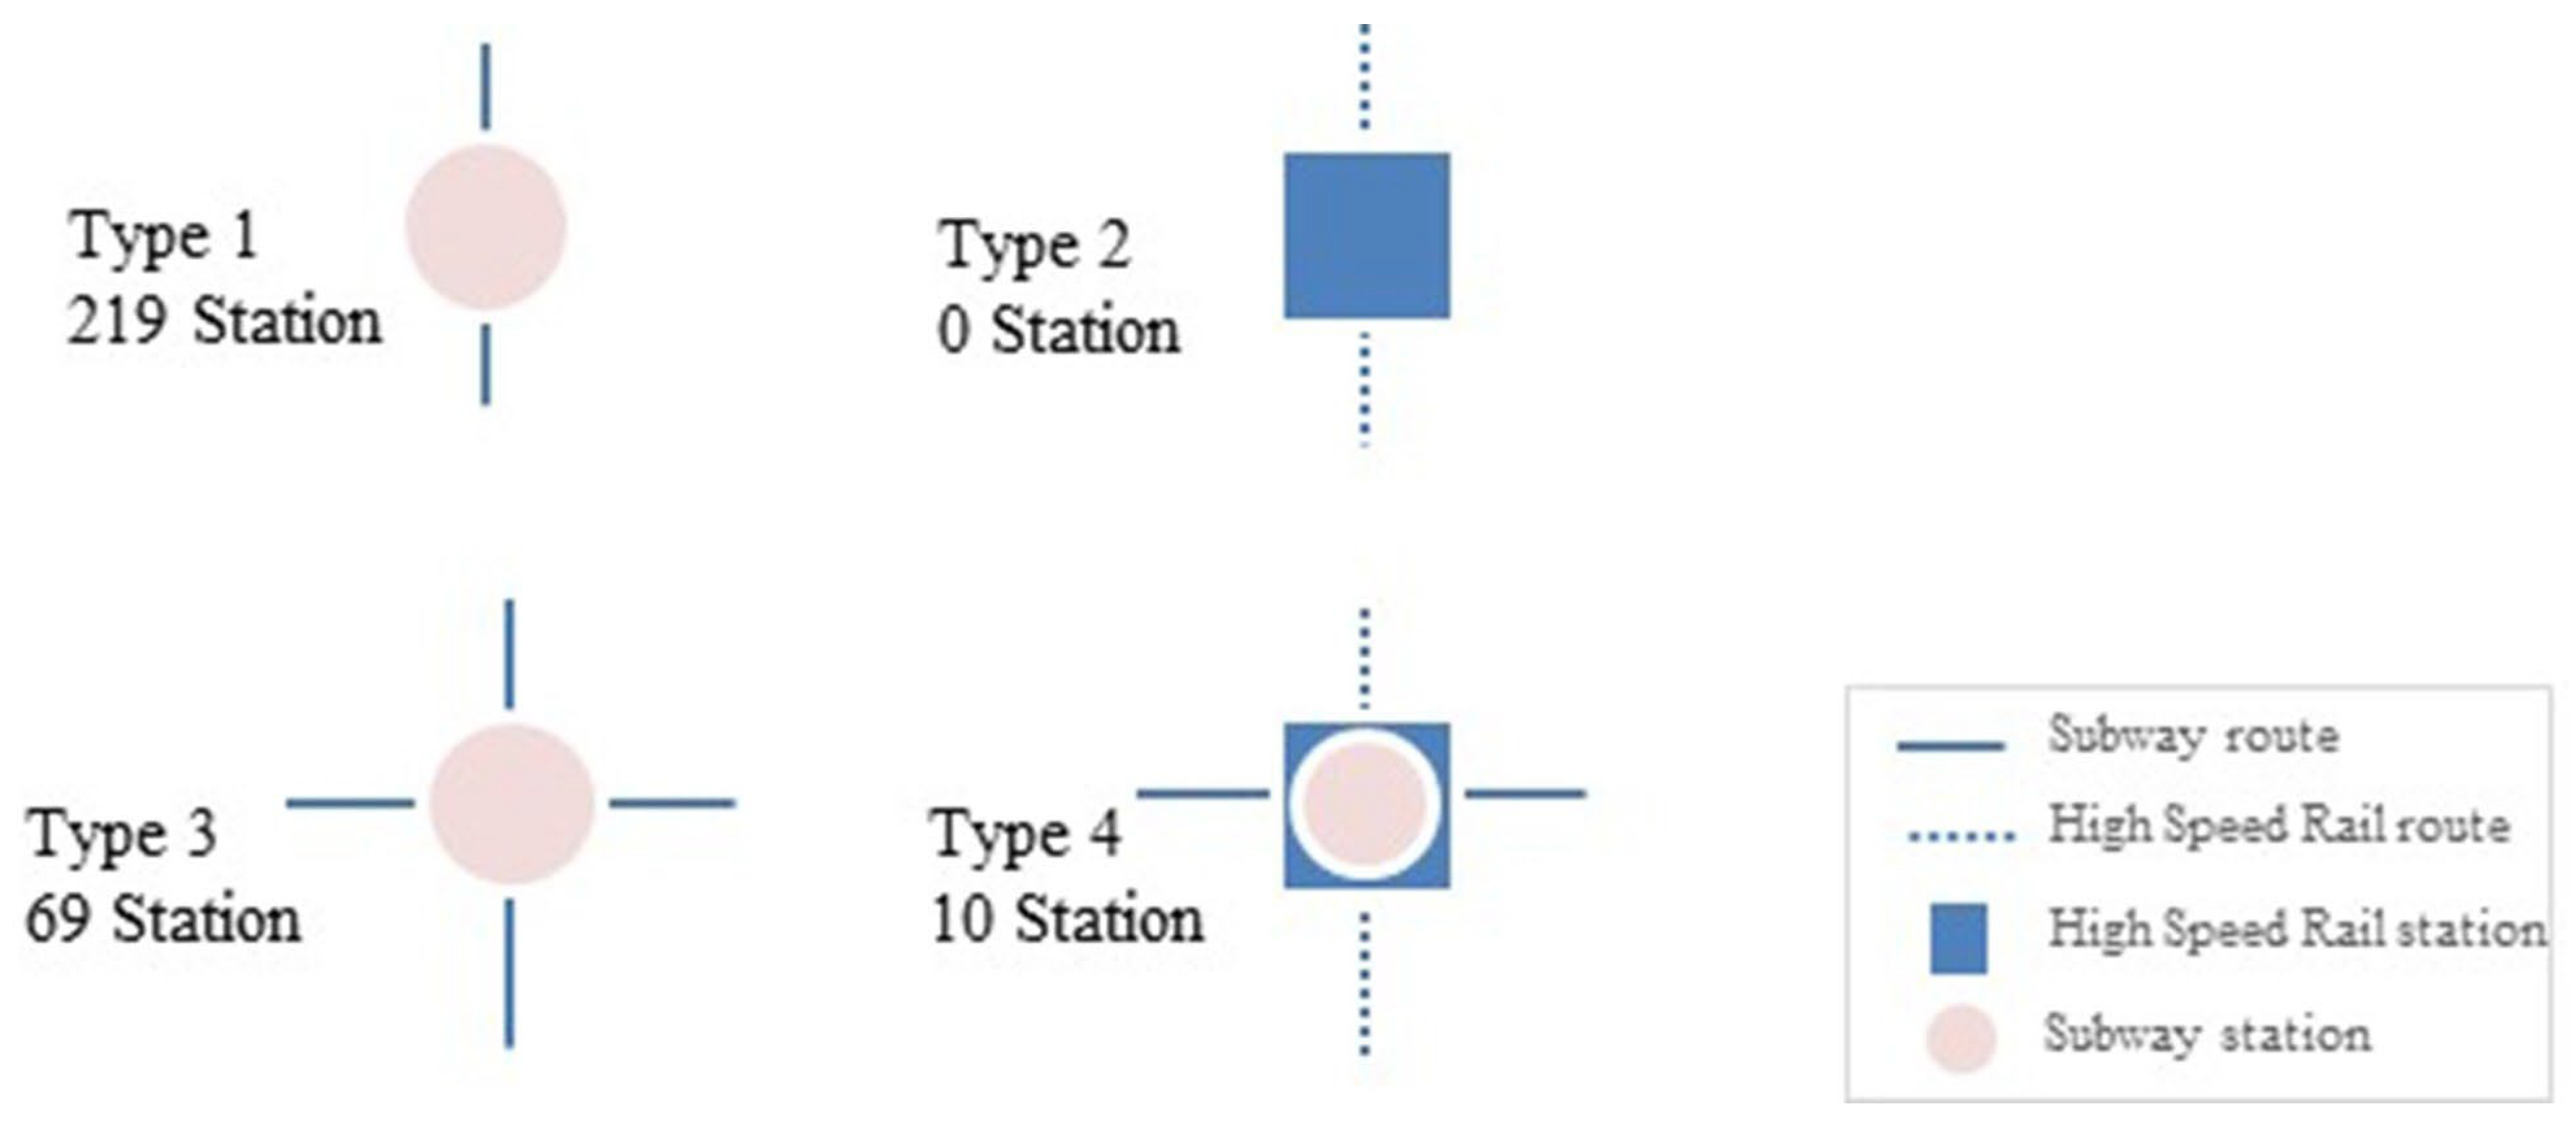
Subway and HSR stations were identified using the 2022 subway station dataset provided by the Forest Big Data Exchange, encompassing 298 subway and railway stations within Seoul. As illustrated in Figure 3, the transfer hierarchy of stations was systematically classified into four categories based on transfer availability, the number of connecting lines, and the presence of railway connections:
Figure 3.
Transfer type classification.
- (Type 1) Non-transfer subway station
- (Type 2) Non-transfer railway station
- (Type 3) subway–subway transfer hubs
- (Type 4) subway–railway transfer hubs
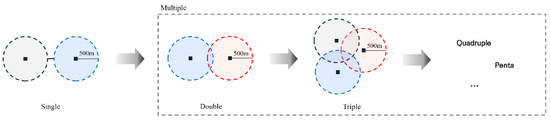
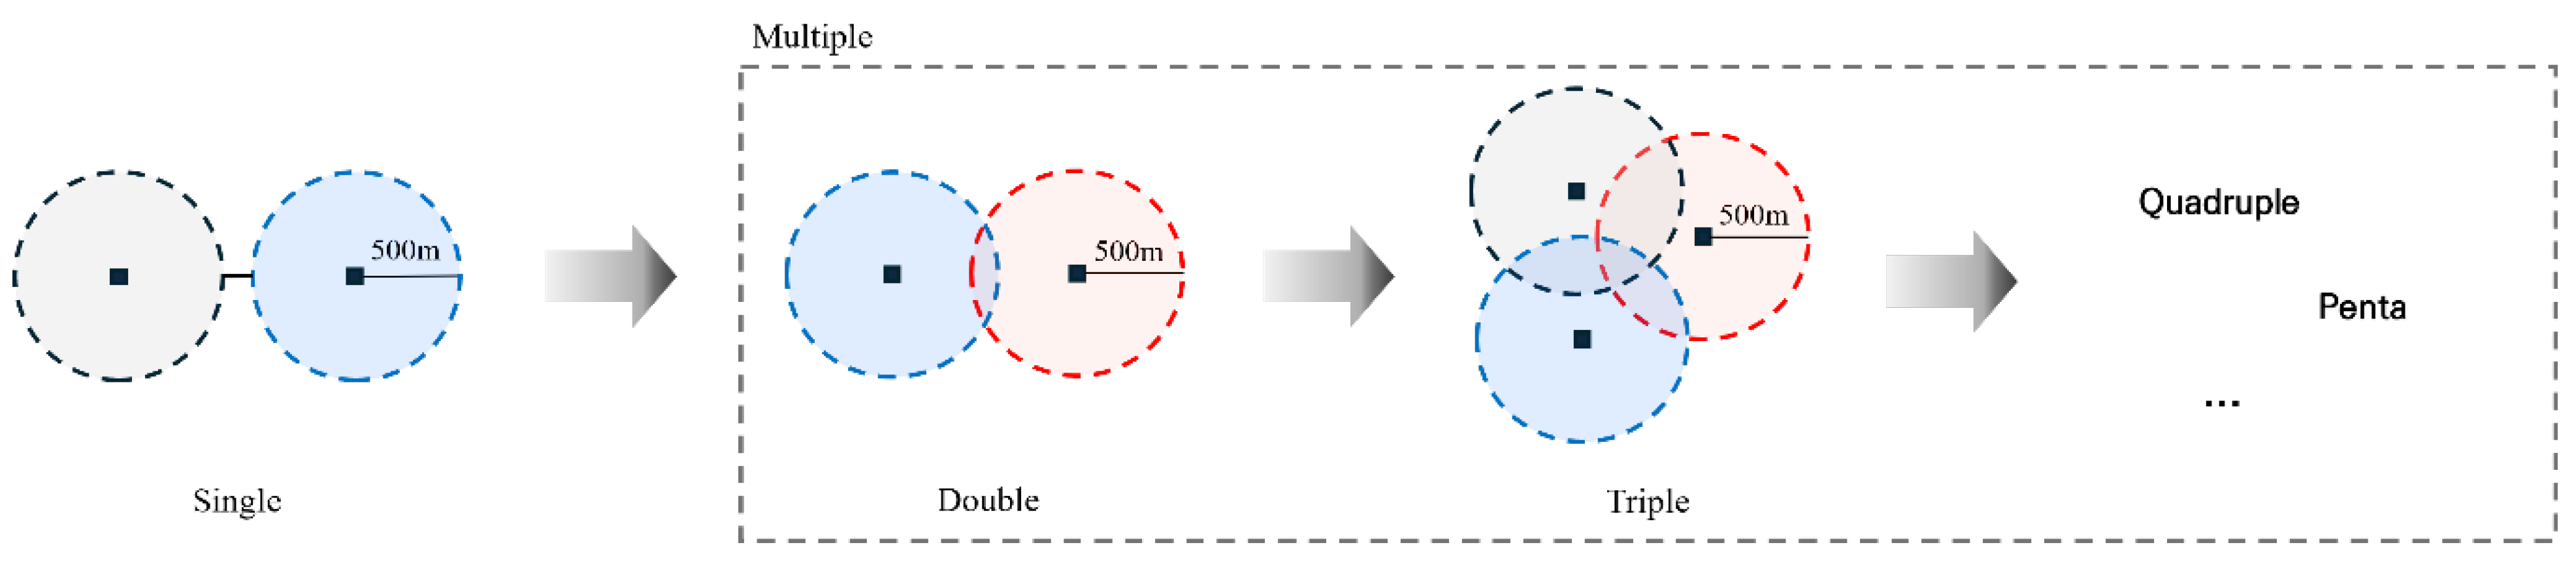
Subway and railway stations were categorized according to transfer type, and each location is summarized in Table 2. Station influence areas were defined as a 500 m radius from each station. Overlaps between station influence areas were observed, particularly in 249 of the 298 stations, due to the high accessibility of multiple stations within the same radius. The overlapping-influence-area concept is visualized in Figure 4 using the number of overlapping circular buffers as the key metric. Subway–subway transfer hubs serving more than four lines lacked distinct station influence areas, making direct comparisons between single-station and multi-station influence areas unfeasible. Because overlapping station influence areas are a structural feature of Seoul’s dense network, this study does not force each location to be uniquely assigned to a single station. Instead, overlap is explicitly characterized and incorporated into the empirical design by comparing single-station versus multi-station influence areas and by conducting a dedicated overlap-focused analysis. This approach helps diagnose how multi-station accessibility relates to observed land-price dynamics, rather than treating overlap as measurement noise.
Table 2.
Number of stations by transfer type.
Figure 4.
Multiple station area.
In Seoul’s subway system, the average spacing between stations is below 1 km, with certain station pairs less than 500 m apart. Given this unusually dense network, catchment standards commonly used in the international literature may not directly translate to the Seoul context. Table 3 reports the average inter-station distance for each Seoul subway line, and the Korean Urban Railway Act officially defines a station influence area as the area within approximately 500 m of a station. This legal standard has been widely adopted in domestic research. Accordingly, this study uses a 500 m radius as the baseline station influence area and examines commercial-district characteristics, land prices, and active population within this buffer. The 500 m buffer represents the primary zone of pedestrian accessibility and commercial activity around stations. Empirical evidence on walking accessibility also supports this baseline: Kim (2012) [32] suggested that the core walking-access range around stations is approximately 465 m, while Lee & Sohn (2012) [33] reported that pedestrian-oriented functions show significant effects within a 400 m radius. At the same time, the appropriate extent of station influence areas may vary by access mode and land-use context. Lee et al. (2013) [34] proposed a regression-based approach that uses key station-area variables to estimate the spatial extent of station influence areas across land-use types, implying that population distribution can be a major determinant of influence-area boundaries. Relatedly, Kim et al. (2013) [35] and Shin et al. (2024) [36] showed that appropriate station influence areas may differ depending on land-use characteristics.
Table 3.
Average station-to-station distance by Seoul subway line.
Reflecting this variability and to assess robustness, this study adopts 500 m as the baseline while additionally conducting sensitivity analyses using alternative buffers. The additional 300 m buffer analysis confirms that the key patterns are robust to buffer selection and remain consistent with the baseline 500 m and the extended 750 m analyses. Taken together, this suggests that the main conclusions are not sensitive to the specific radius within the commonly used station influence-area range; therefore, adding intermediate radii (e.g., 600 m) is unlikely to materially change the substantive interpretation. Finally, population data in this study refer to active population, derived from mobile-based spatial statistics collected for specific spatial units, time windows, and days of the week.
4.2. Data Processing
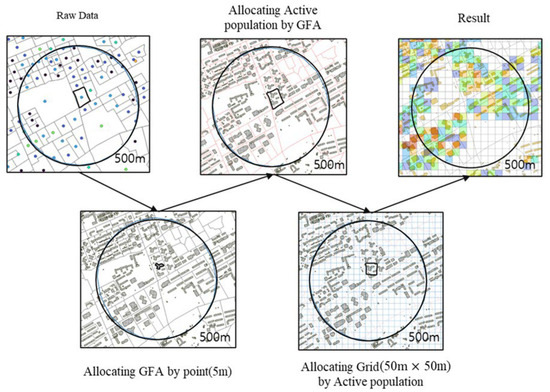
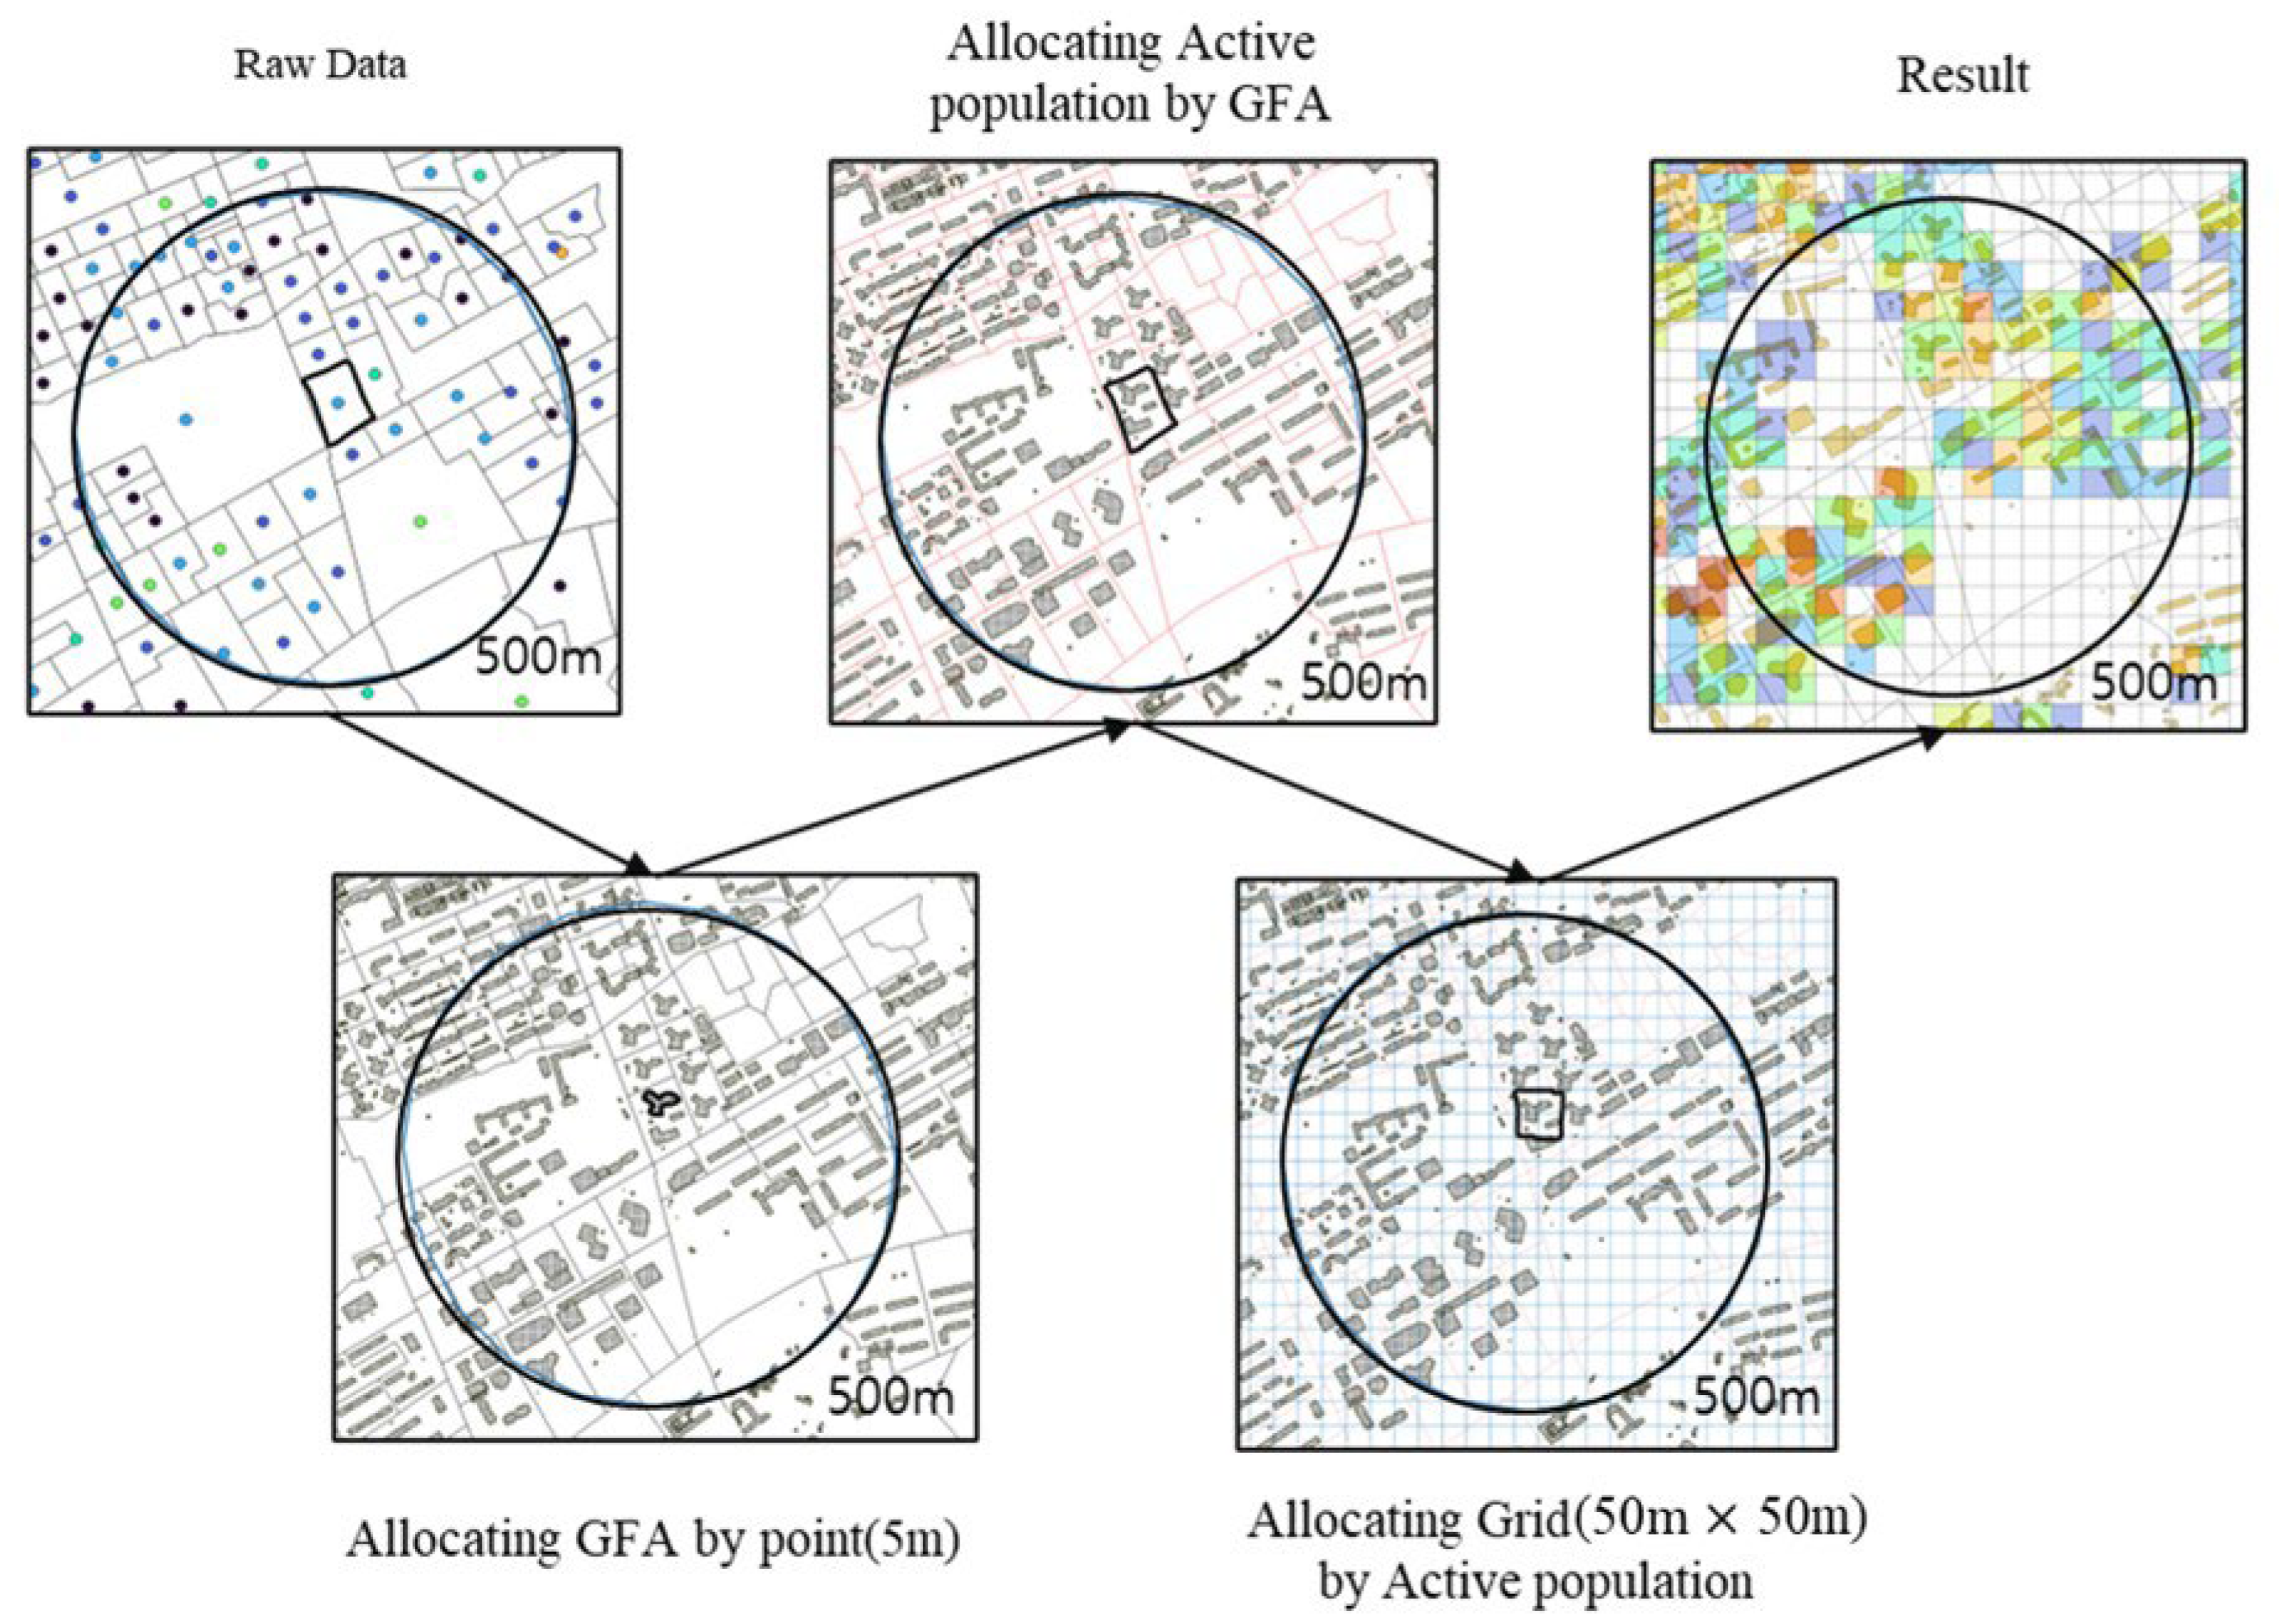
Seoul’s active population data are reported by census output areas, which means the spatial reporting units differ in size. Moreover, the active population is not allocated based on geographic features such as parks, mountains, or the presence of buildings, leading to limitations in the spatial accuracy of the data. However, the census output-area unit does not match the spatial scale of this study. With station spacing averaging about 1 km and the station influence area defined as a 500 m radius, we conduct the analysis using finer spatial units. Therefore, in this study, the active population was reallocated based on the assumption that buildings with larger gross floor area (GFA) can accommodate more people and generate greater demand. The procedure consisted of three steps:
- Seoul building polygons were converted to a point layer by generating points at 5 m spacing. For each building, its total floor area was divided by the number of points generated within the polygon, and the resulting floor-area share was assigned to each point.
- The active population reported at the census output area level was allocated to building points in proportion to GFA. This allocation assumes that buildings with larger GFA can accommodate more people and, in turn, are likely to be associated with higher levels of activity.
- A 50 m × 50 m grid covering Seoul was created, and grid-level active population was computed by summing the point-assigned values within each grid cell.
Figure 5 shows the procedure for reallocating the active population. This reallocation process ensured that the total number of active population within each census output area remained consistent before and after redistribution, maintaining data integrity. Moreover, by downscaling aggregated data from the census output area level to the building level, the method reduced spatial distortion and enabled more comparable estimates across heterogeneous station environments. The resulting dataset thus provides a fine-grained spatial representation of urban activity suitable for analyzing micro-scale agglomeration effects around transfer hubs.
Figure 5.
Active population reallocation procedure. Colors represent the resulting values; red lines show building parcels, black squares indicate 50 m grid cells, and arrows show the processing sequence.
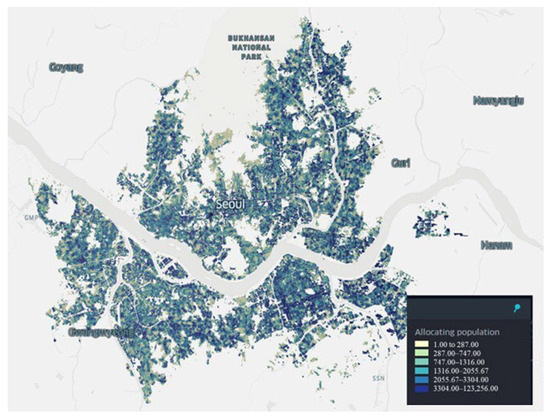
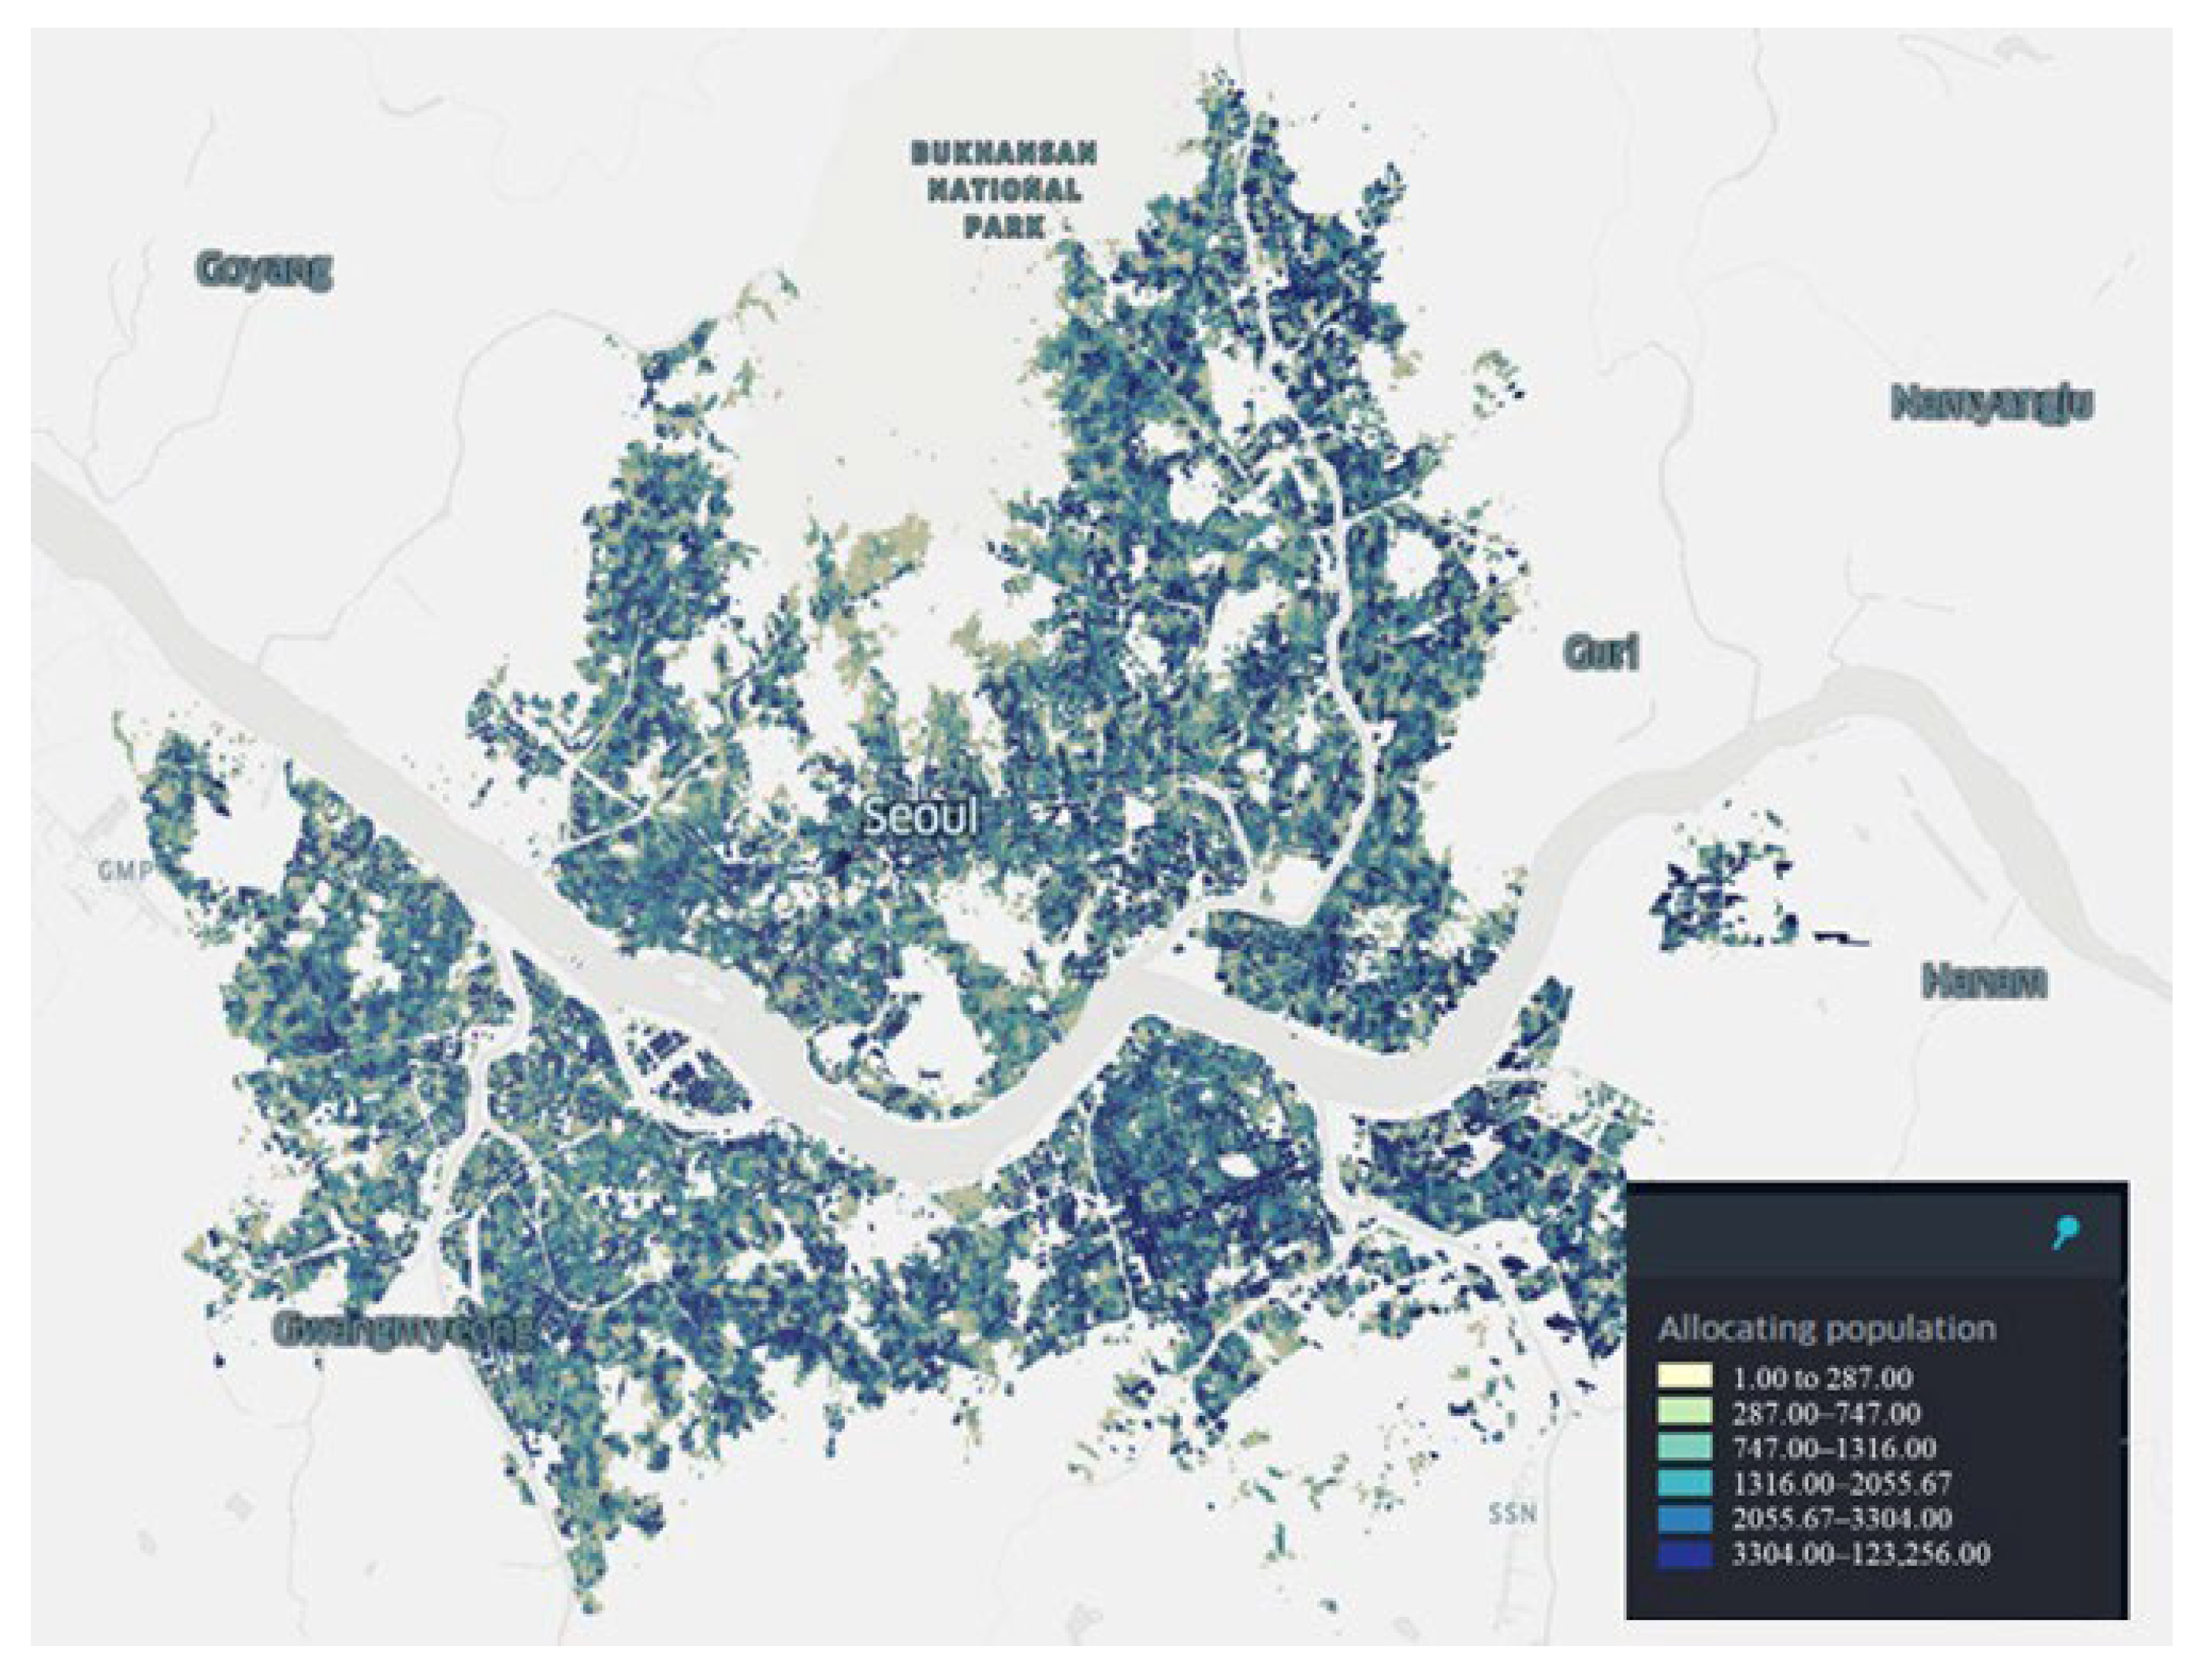
First, Seoul building polygons were converted to a point layer by generating points at 5 m spacing. For each building, its total floor area was divided by the number of points within its footprint, and the resulting floor-area share was assigned to each point. Second, active population totals reported at the census output area level were distributed to the building points in proportion to GFA, based on the assumption that buildings with larger GFA can accommodate more people and are associated with higher levels of activity. Third, a citywide 50 m × 50 m grid was created, and grid-level active population was obtained by summing the point-assigned values within each grid cell. Figure 6 illustrates the reallocated active population produced by this procedure. The figure confirms that the reallocation was successfully implemented, showing a spatially coherent distribution across the city while excluding river areas.
Figure 6.
Reallocated active population.
4.3. Difference-in-Differences (DID) Analysis
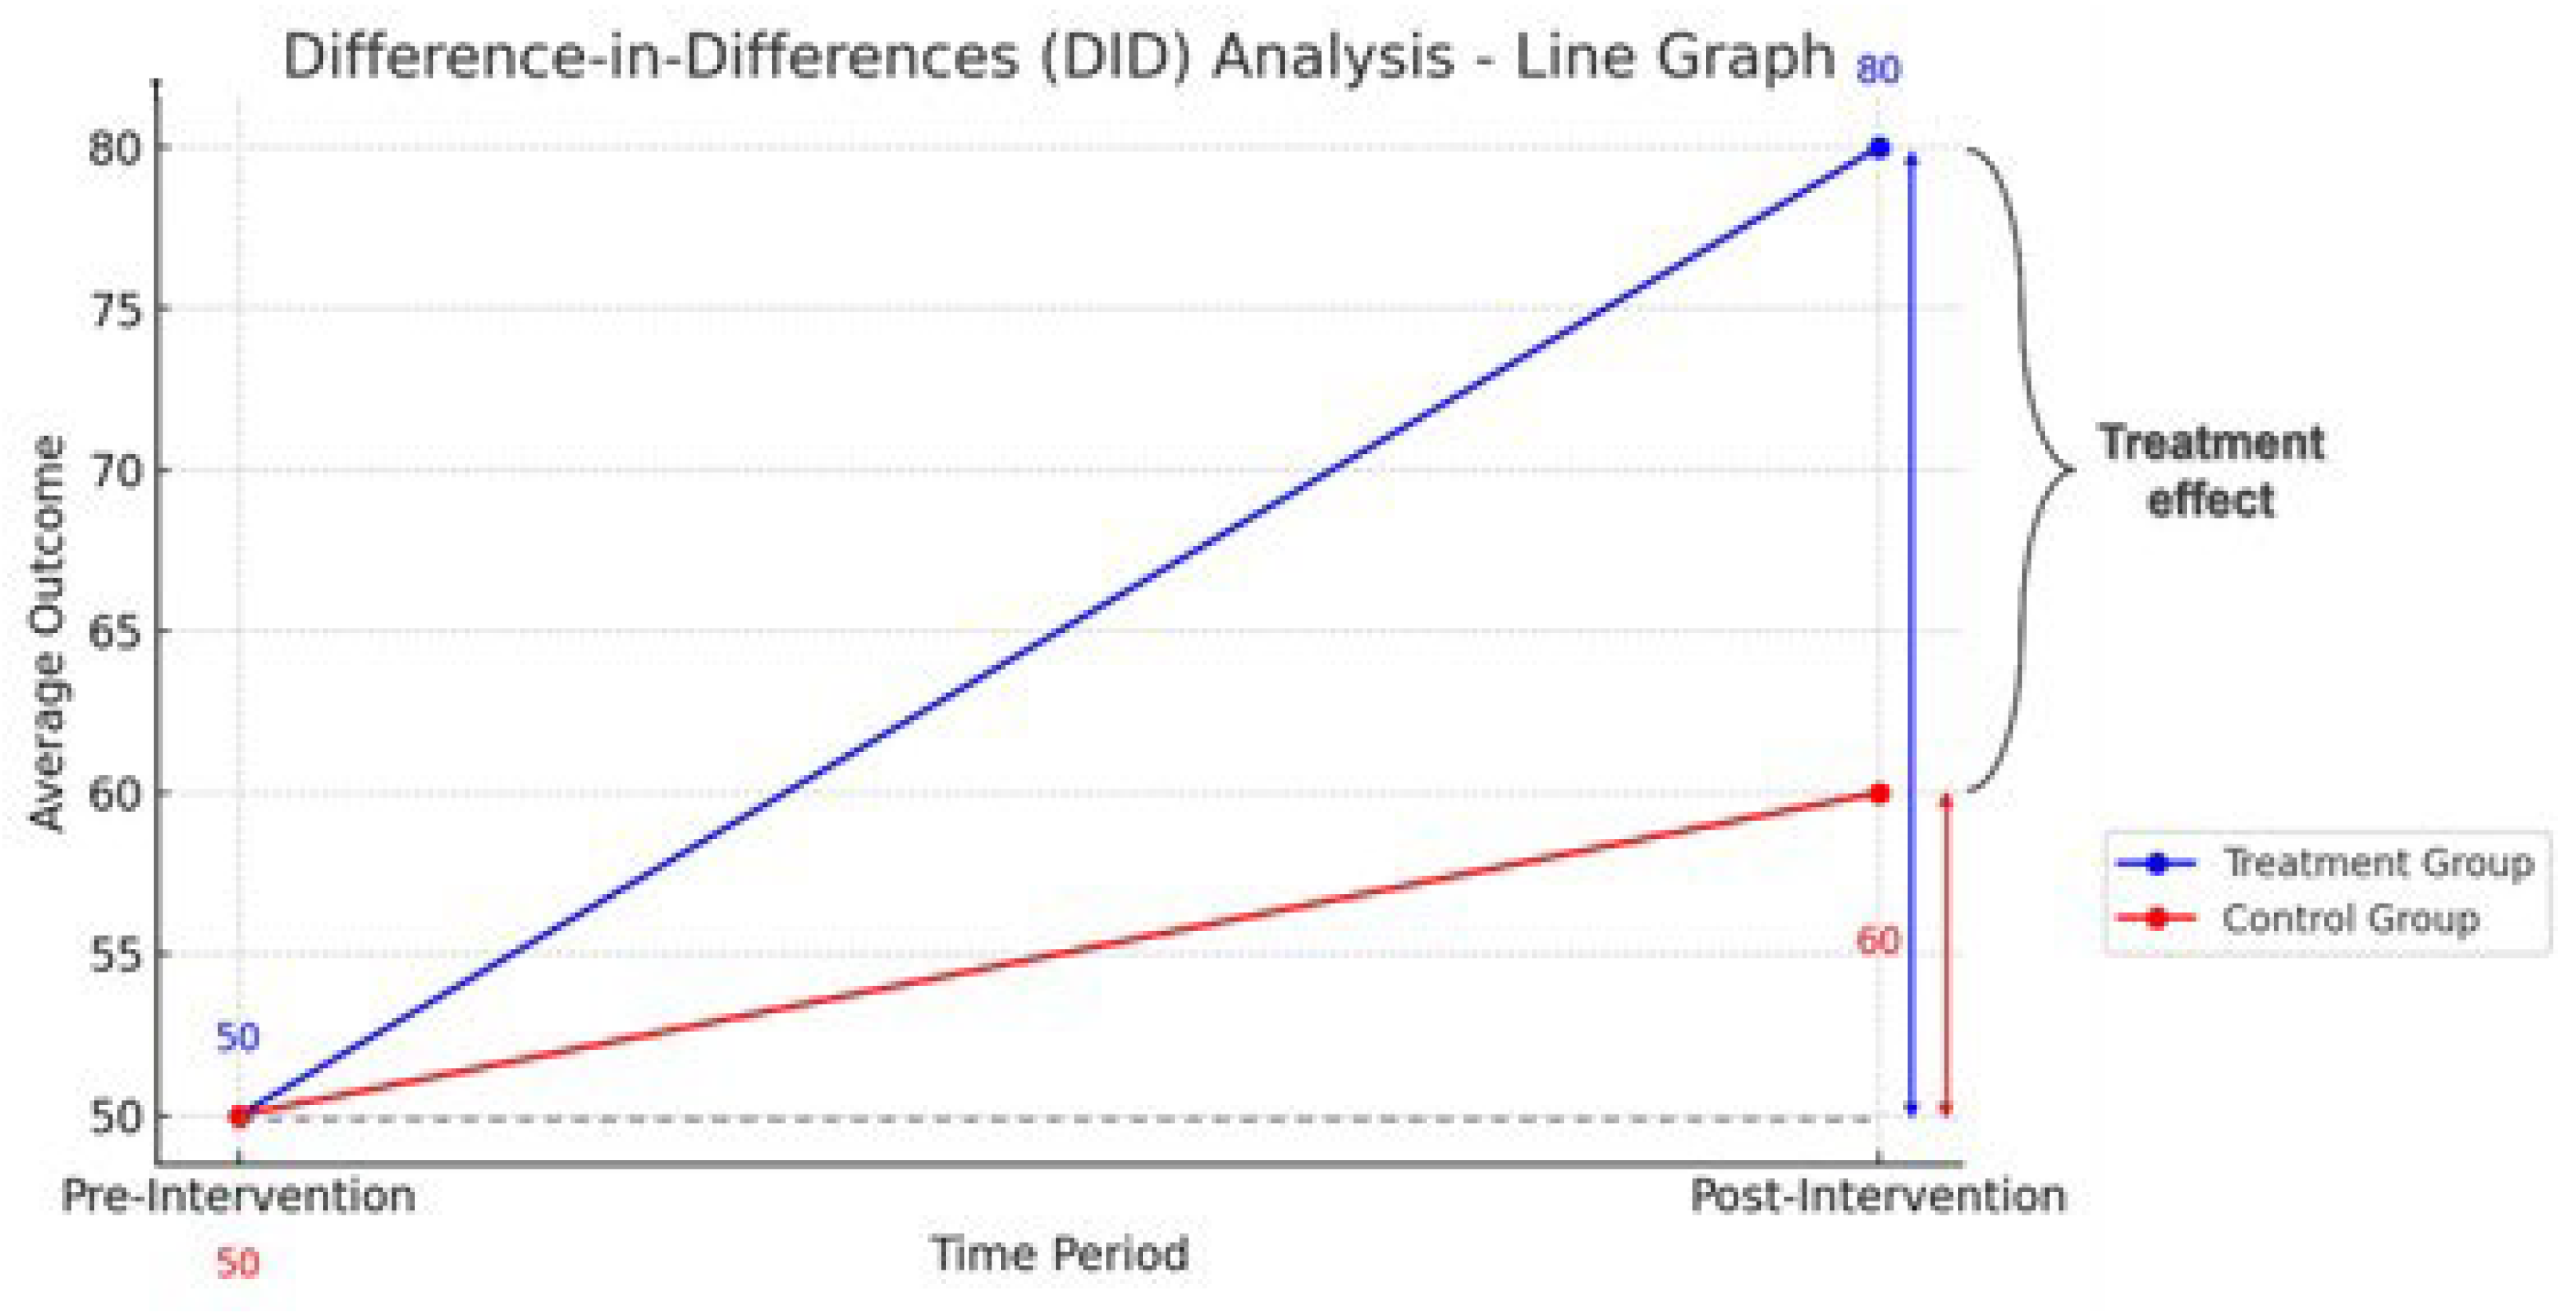
The DID approach compares changes in outcomes over time between a treated group and a control group. Under standard identification assumptions, most importantly the parallel-trends assumption in the absence of treatment, DID is widely used in quasi-experimental settings where randomized experiments are infeasible.
The DID estimand can be written as:
where Ypost,treat and Ypre,treat denote post- and pre-period outcomes for the treated group, and Ypost,control and Ypre,control denote the corresponding outcomes for the control group. A positive DID value indicates that the treated group experienced a larger increase than the control group over the same period, whereas a negative value indicates the opposite. Figure 7 provides a graphical illustration of this logic.
Treatment effect = (Ypost,treat − Ypre,treat) − (Ypost,control − Ypre,control)
Figure 7.
Difference-in-Differences (DID) Graphical Illustration.
DID has been applied to evaluate policy or market shocks when credible counterfactual trends can be approximated. For example, Zheng et al. (2021) [37] examined spatial spillovers of China’s home purchase restriction policy on land prices in adjacent cities, and Suh et al. (2024) [38] used DID to assess how the entry of early-morning delivery services affected offline commercial districts.
In this study, DID is used to examine differential changes in government-assessed land value across station-area groups over time. We set 2016 as the baseline year and estimate year-specific standardized DID coefficients (β) for the post period (2017–2024). In our station typology, Type 1 is defined as non-transfer stations and serves as the control group, while Types 3 and 4 are defined as transfer stations (served by two or more lines, including subway–subway and subway–railway transfer configurations) and serve as treated groups. Because Seoul’s rail network expanded during the study period, station transfer types are defined annually based on the number and configuration of lines in operation; when a station’s transfer connectivity changes due to line openings or added connections, its classification is updated from that year onward. Accordingly, the estimated β values represent how land-price changes for each transfer type differ from the Type 1 reference trend in each post-baseline year.
Because station locations and surrounding urban conditions are not randomly assigned, we interpret the DID estimates as associations in differential temporal change related to transfer connectivity, rather than as definitive causal effects attributable to a single factor. For transparency, we explicitly acknowledge key DID assumptions, including parallel trends (i.e., absent treatment, treated and control groups would have followed similar outcome trajectories), no anticipation, and stable composition. Moreover, in Seoul’s densely spaced network, empirical patterns may depend on how station influence areas are delineated and whether station influence areas overlap. Therefore, in addition to the baseline 0–500 m station influence area analysis, we assess robustness using a core buffer (0–300 m), a within-type outer-ring comparison (500–750 m) for 2024, and a restricted sample of overlapping transfer stations within 0–500 m. Together, these checks support that the main interpretations are not driven by a single distance definition or sample condition.
4.4. Robustness and Sensitivity Checks
To assess whether the findings depend on the delineation of station influence areas, we conduct robustness and sensitivity analyses using alternative distance definitions and overlap conditions. The main results are reported for the baseline station influence area of 0–500 m (Section 7.1), which is grounded in Korean standards and walking-access evidence (Section 4.1). We additionally test a core buffer (0–300 m) to examine whether key patterns persist within the most immediate walking-access zone (Section 7.3).
To evaluate sensitivity to peripheral areas beyond the baseline station influence area, we implement an outer-ring specification (500–750 m). This ring captures the marginal contribution of the area outside 0–500 m and enables within-type comparisons of whether patterns observed near stations extend into the peripheral band. Because 2024 is the year in which both the baseline station-type analysis (Section 7.1) and the overlapping station analysis (Section 7.2) show consistent statistical significance, we report the outer-ring comparison as a focused year-specific sensitivity check for 2024 (Section 7.4).
Finally, overlapping station influence areas are common in Seoul’s dense network, meaning that the same land-price observations can fall within the influence areas of multiple nearby stations. We identify overlapping station influence areas using GIS-based buffer intersection: an overlapping station influence area is defined as a 0–500 m station buffer that intersects with the 0–500 m buffer of at least one other station. We report an additional robustness analysis that restricts the sample to transfer stations whose 0–500 m station influence areas overlap with other stations (Section 7.2), thereby assessing whether temporal patterns persist under potential multi-station influence. This subset analysis is intended as a robustness for contexts where multi-station influence is plausible, rather than a claim that all overlapping effects are fully eliminated.
Taken together, these checks help ensure that the substantive interpretation is not an artifact of a single distance threshold or sample definition.
5. Impact of Commercials on Agglomeration
5.1. Result of the Analysis of Commercial Power
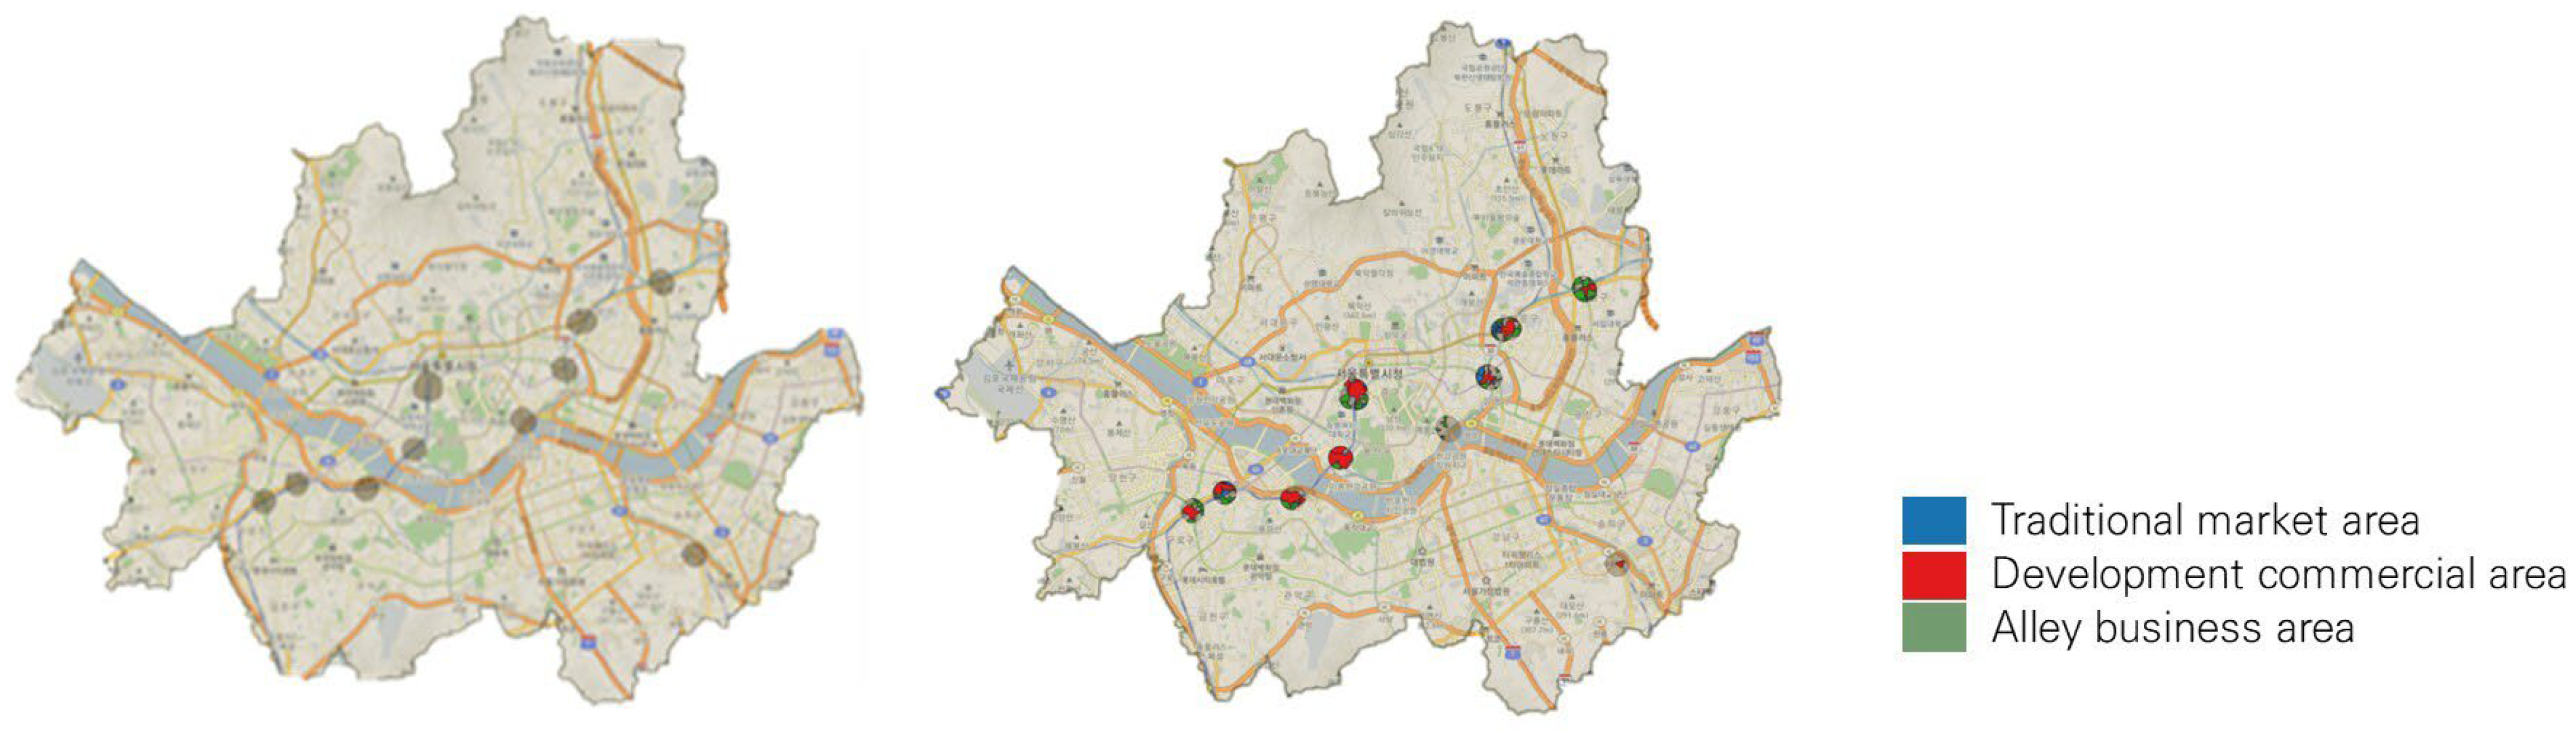
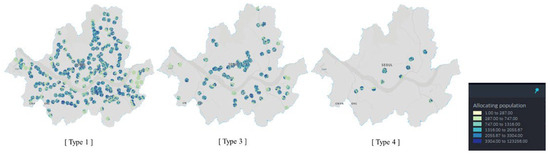
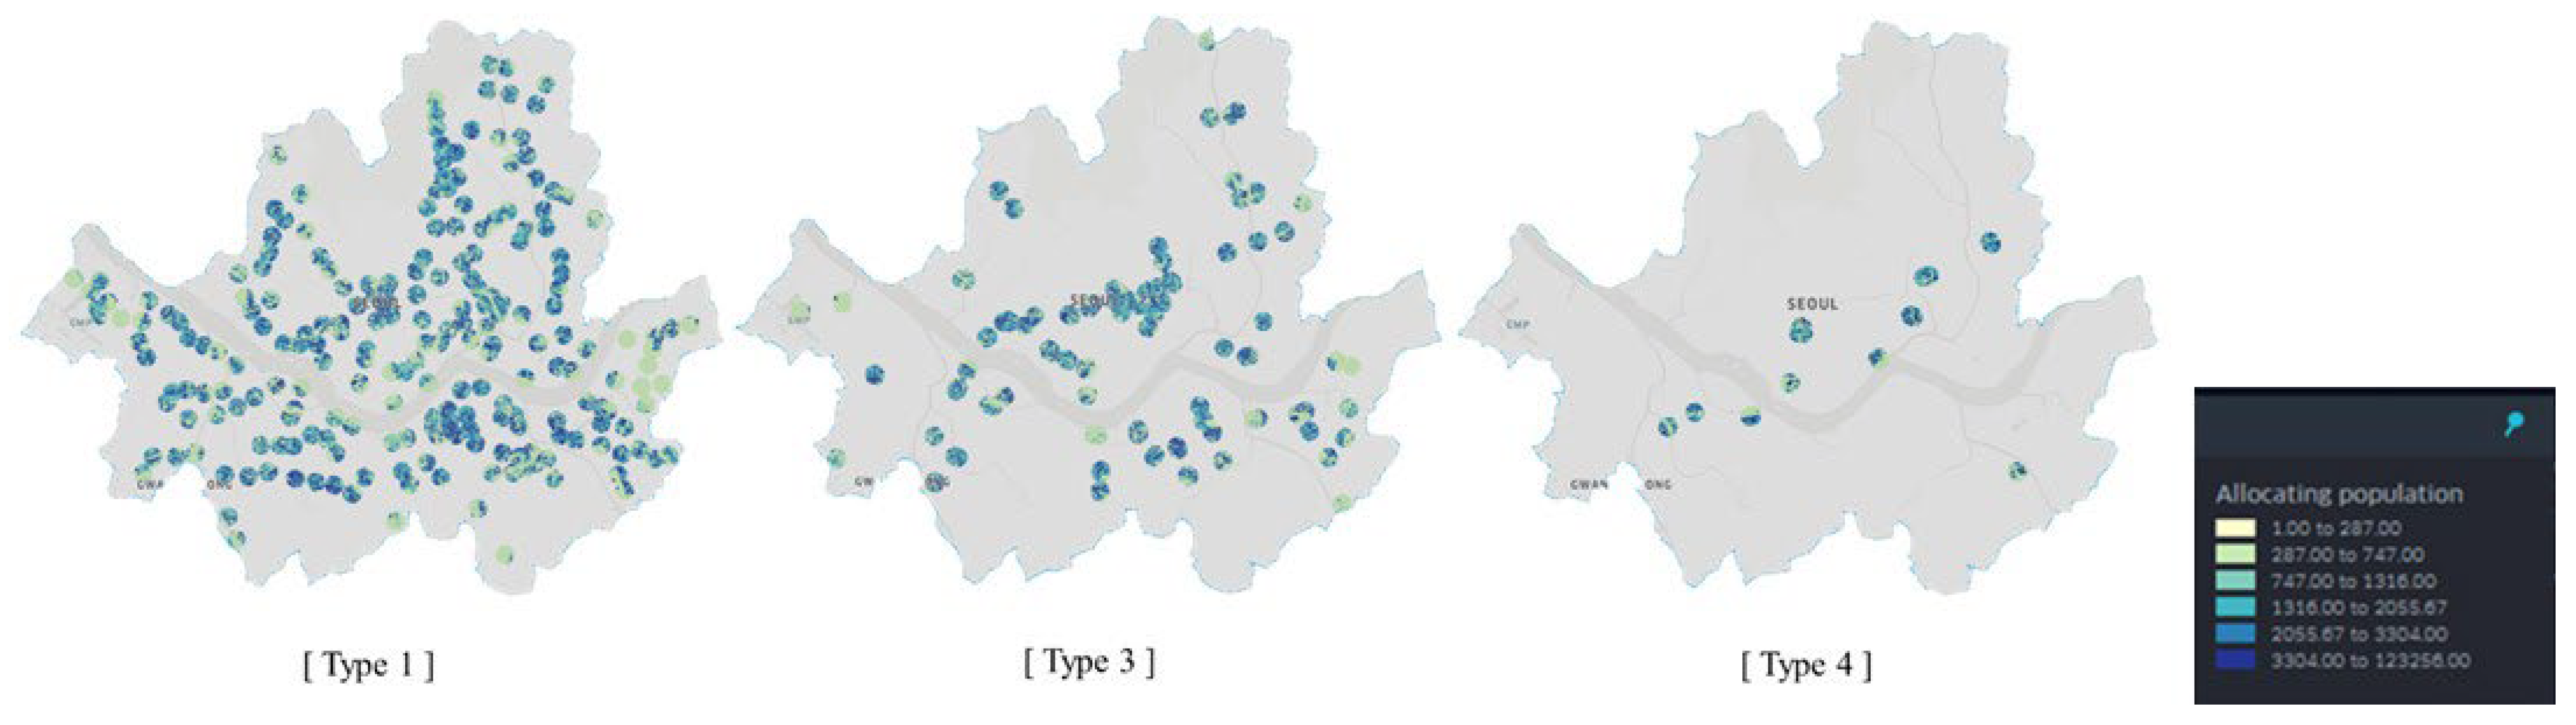
Type 1 comprises non-transfer subway stations (219 stations in Seoul). Commercial context within station influence areas is evaluated by counting three commercial categories within the 0–500 m station influence area: Developmental Commercial Areas, Commercial Alley Areas, and Traditional Market Areas. Figure 8, Figure 9 and Figure 10 illustrate the spatial configuration of station influence areas and commercial features by transfer type, while Table 4 summarizes the mean counts for each category.
Figure 8.
Station influence of type 1.
Figure 9.
Station influence of type 3.
Figure 10.
Station influence of type 4.
Table 4.
Average number of commercial districts by transfer type.
Type 3 denotes subway-subway transfer hubs (69 stations), further classified by the number of connecting lines (Types 3-2, 3-3, and 3-4). As shown in Figure 9, transfer hubs are concentrated in central Seoul and are frequently co-located with commercial districts, indicating a close spatial association between high-connectivity stations and commercial clustering. Type 4 consists of subway–railway transfer hubs (10 stations) and shows a similar concentration of commercial features within the 0–500 m station influence area (Figure 10).
Overall, Table 4 shows that Commercial Alley Areas are the most prevalent category across station types and that commercial intensity generally increases with transfer connectivity. Notably, subway–railway transfer hubs (Type 4) exhibit a distinct composition: despite higher connectivity, some categories (e.g., Developmental Commercial Areas and Traditional Market Areas) do not increase to the same extent as in subway–subway transfer hubs (Figure 10).
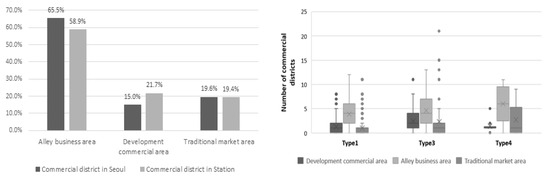
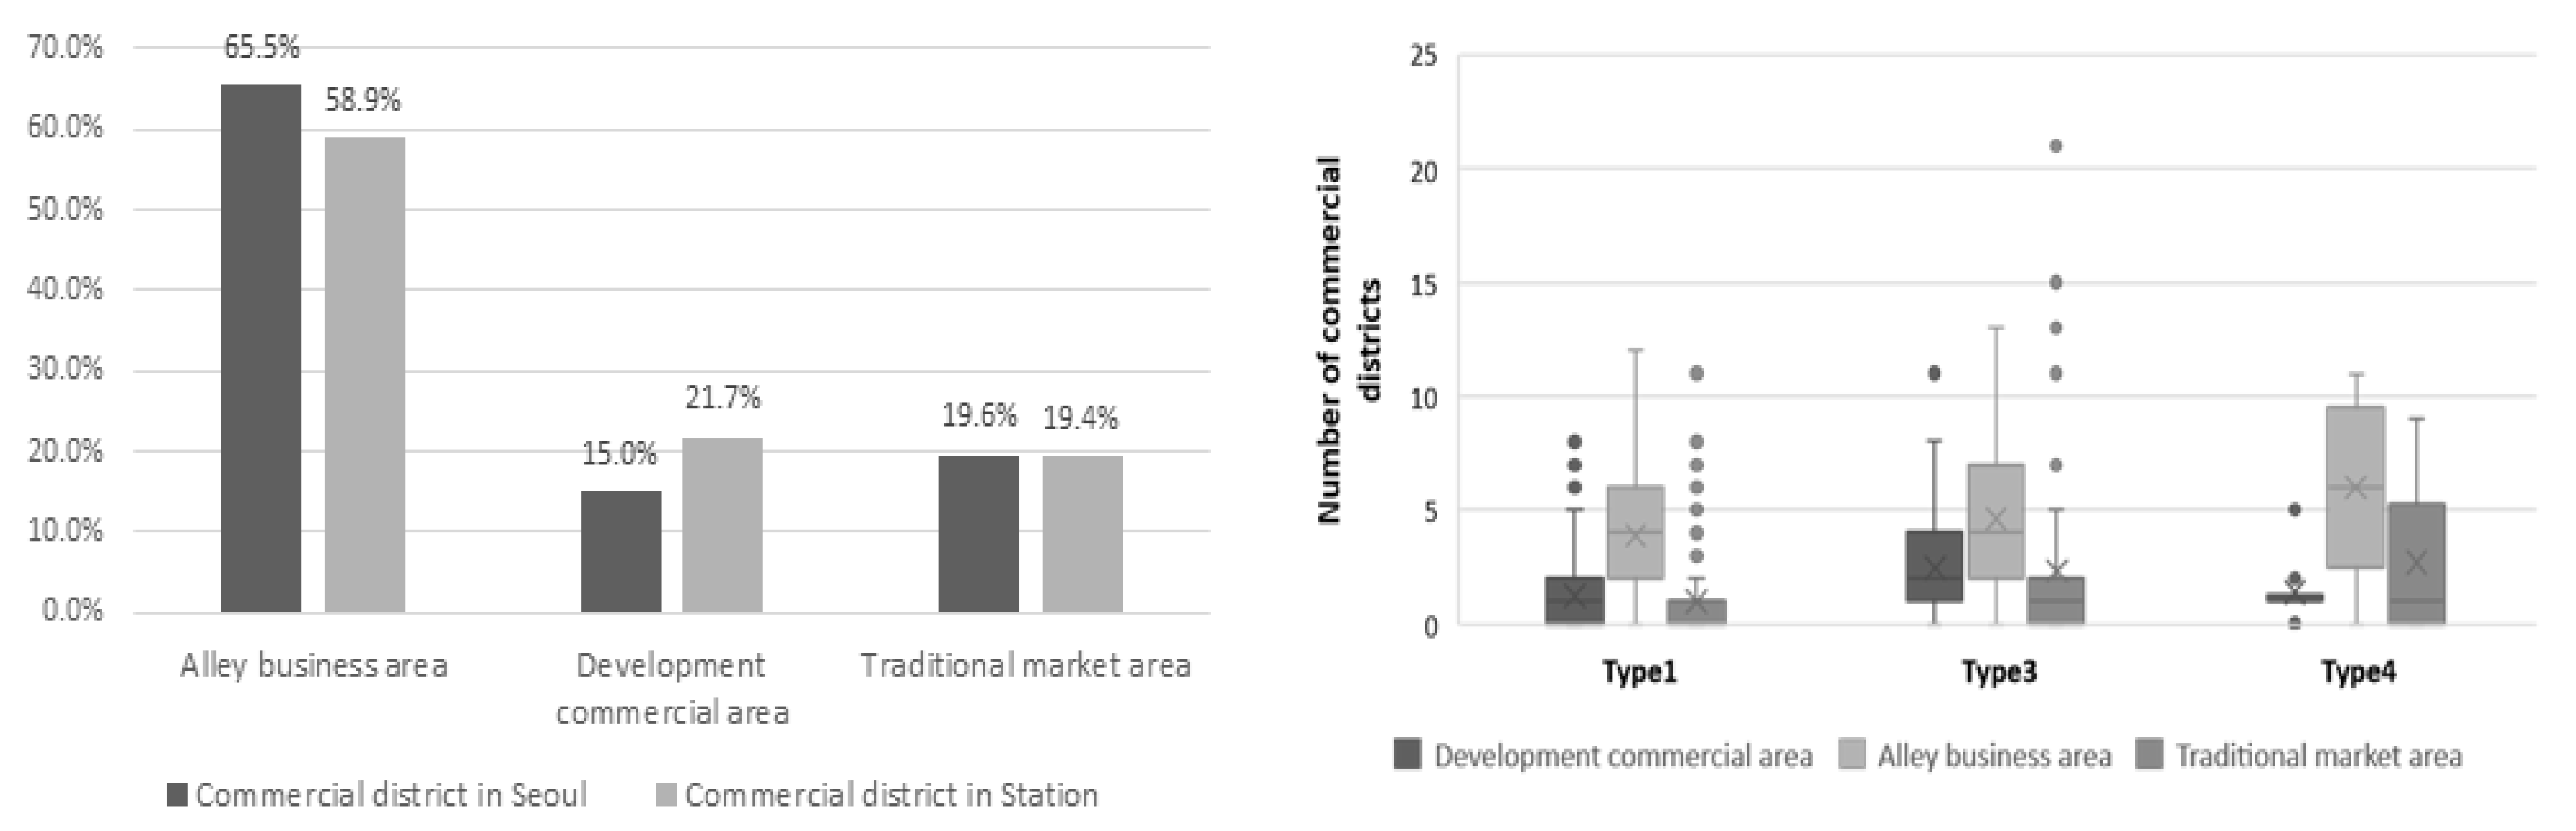
To place these findings in context, we compare the composition of commercial district types citywide with that observed within station influence areas (0–500 m) (Figure 11). Citywide, Commercial Alley Areas make up 65.5% of all districts, whereas Developmental Commercial Areas and Traditional Market Areas account for 15.0% and 19.6%, respectively. Within station influence areas, the corresponding shares shift to 58.9%, 21.7%, and 19.4%. This contrast suggests that Developmental Commercial Areas are relatively more concentrated around stations, while Commercial Alley Areas account for a smaller share than in the citywide distribution. Traditional Market Areas show little difference between station influence areas and the citywide distribution. Overall, this pattern indicates that station influence areas are more strongly associated with larger-scale developed commercial districts than other parts of the city.
Figure 11.
Comparison of commercial area ratios according to station presence or absence. Dots indicate outliers, and “×” indicates the mean.
Further, analysis by transfer type reveals differentiated patterns. Figure 11 presents a boxplot of commercial district counts by station type. Overall, higher transfer levels tend to coincide with a greater presence of Commercial Alley Areas and Traditional Market Areas. Relative to non-transfer stations (Type 1), subway–subway transfer hubs (Type 3) display higher values across all three commercial categories (Developmental, Alley, and Traditional). By contrast, subway–railway transfer hubs (Type 4) show further increases in the Alley and Traditional categories but a lower level of Developmental Commercial Areas when compared with Type 3.
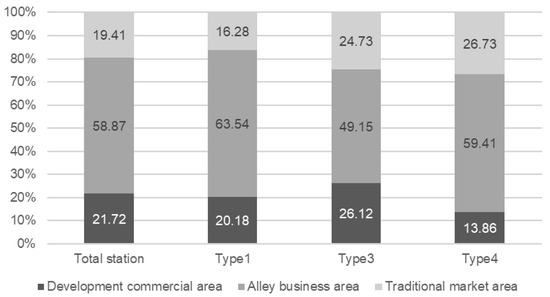
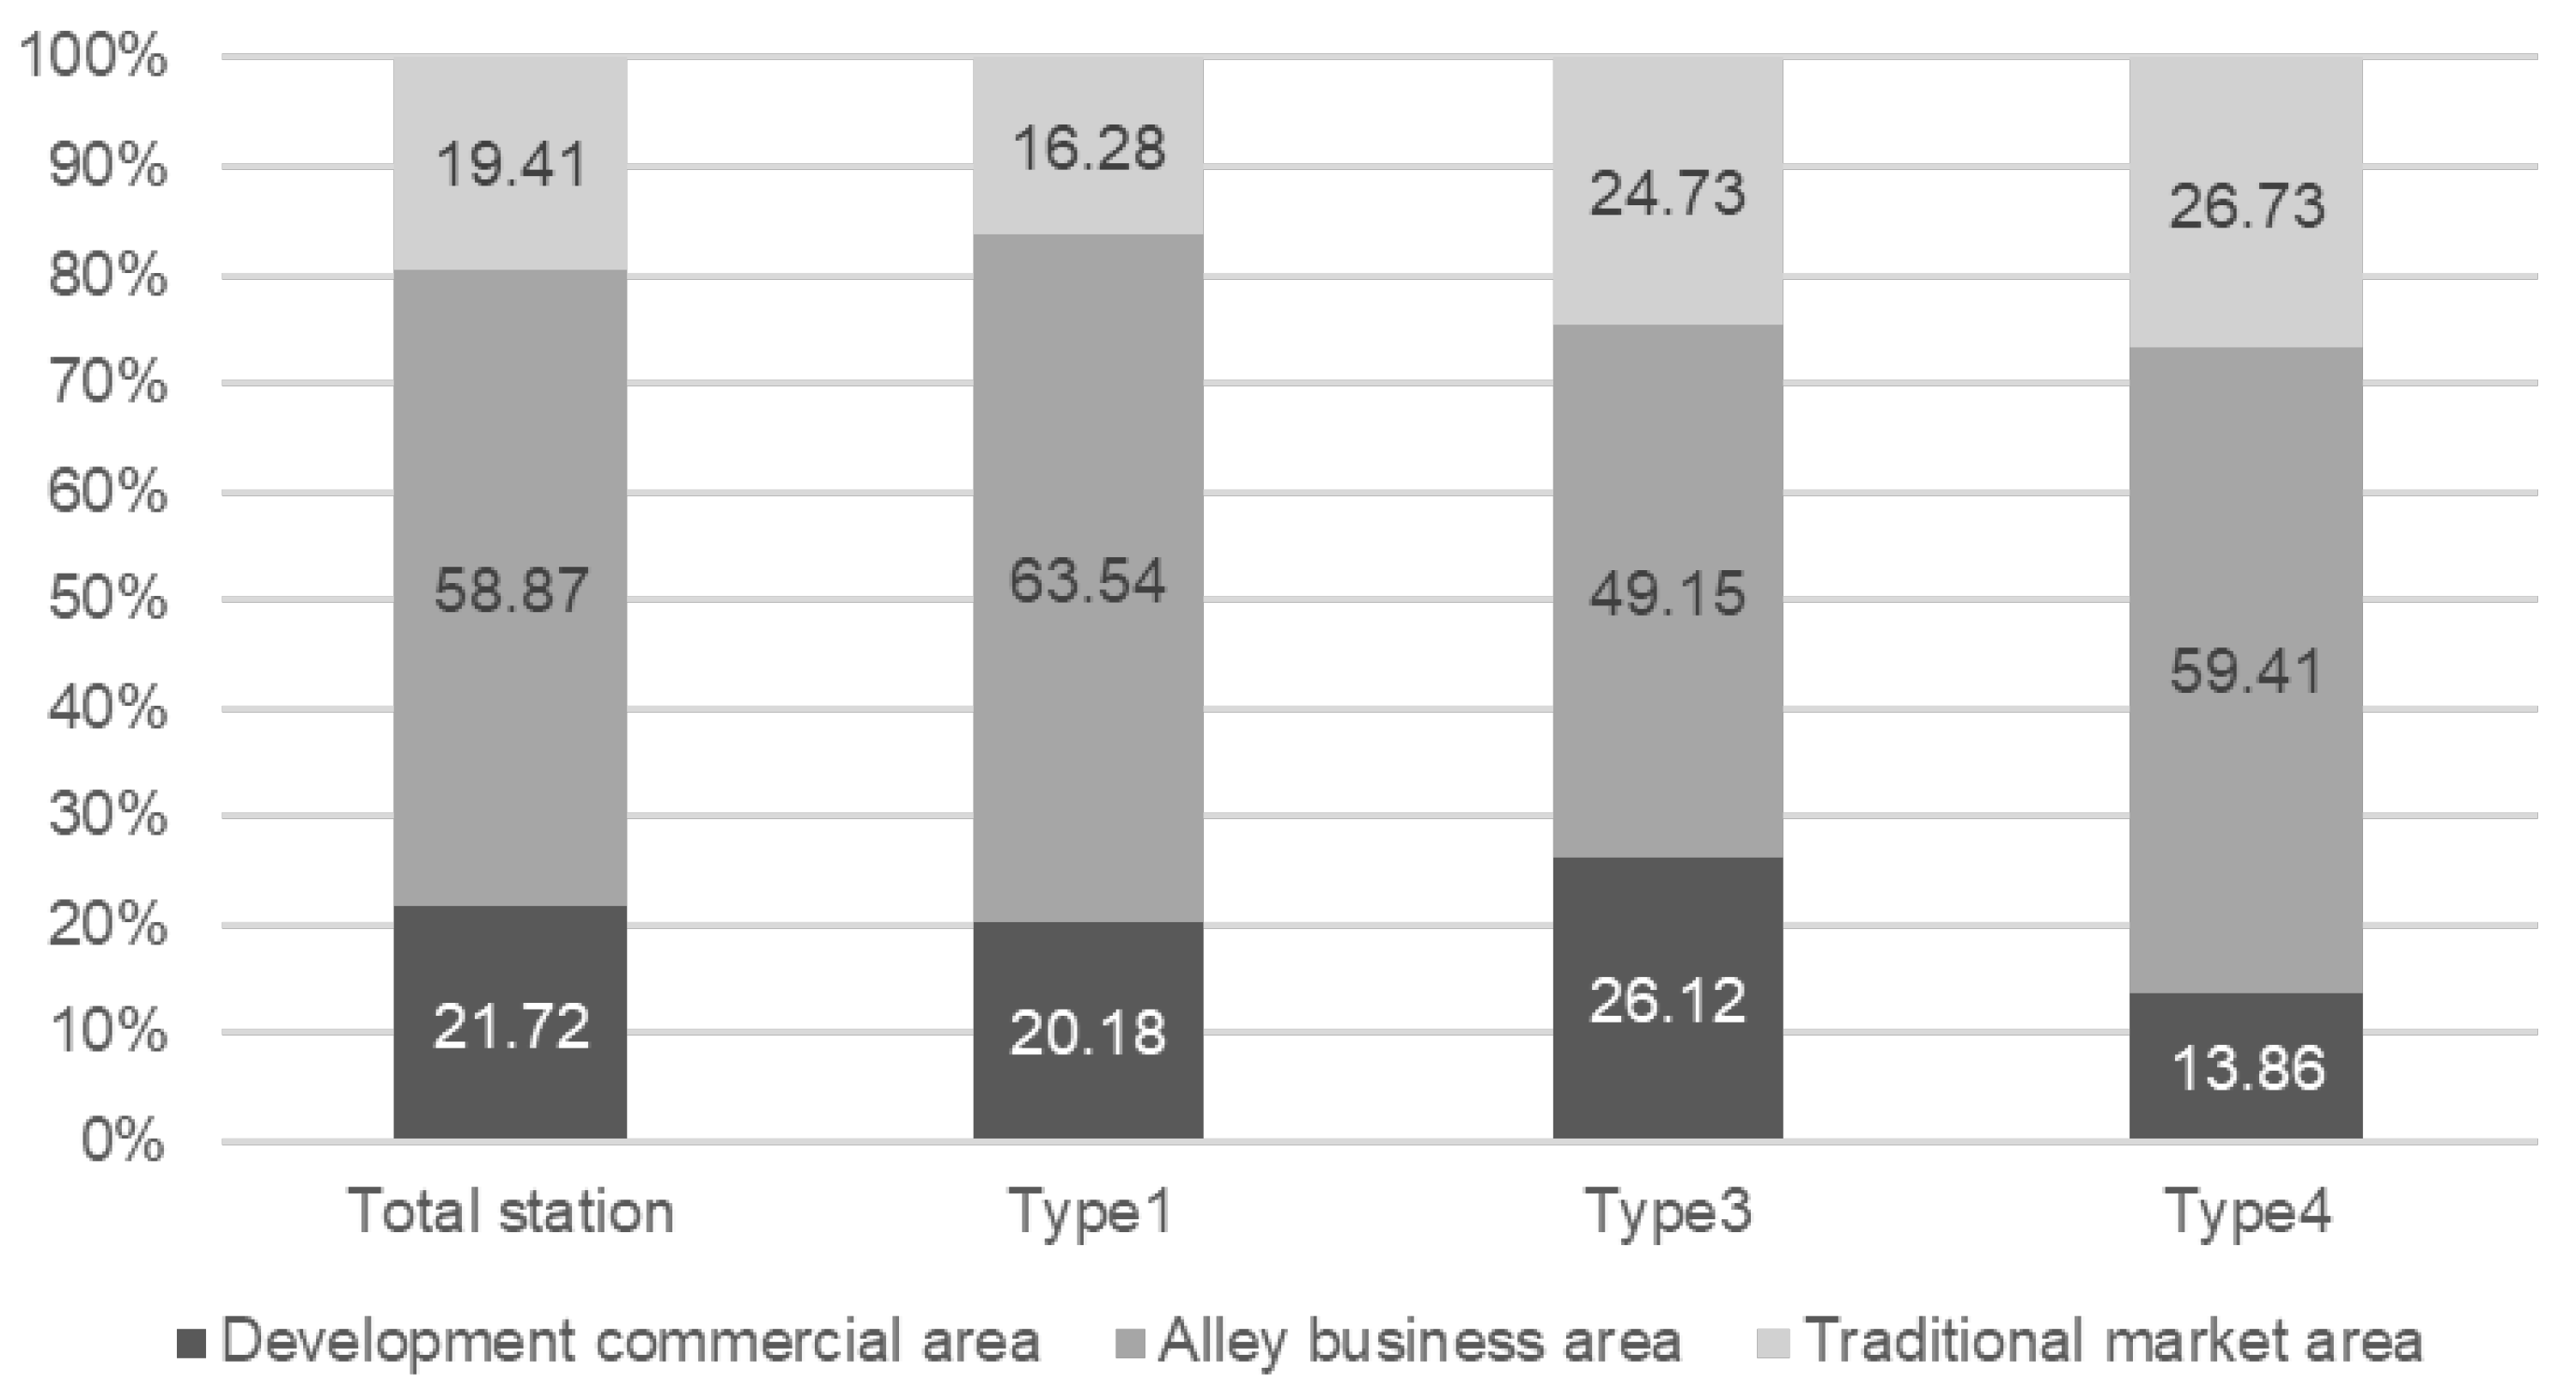
Figure 12 further shows the proportional distribution of commercial districts by transfer type. Commercial Alley Areas account for the largest share across all types, but the balance between Developmental Commercial Areas and Traditional Market Areas differs by transfer type. In particular, subway–railway transfer hubs (Type 4) demonstrate higher shares of Traditional Market Areas and Commercial Alley Areas, while subway–subway transfer hubs (Type 3) are more closely associated with Developmental Commercial Areas.
Figure 12.
Comparison of commercial district distribution by transfer type.
5.2. Statistical Significance Tests for Commercial Power Results
Statistical significance was evaluated via one-way ANOVA, supplemented by independent-samples t-tests where appropriate, to examine whether differences among transfer types were significant. Prior to analyzing overall transfer type differences, the analysis first focused on whether the degree of commercial district development varied with the number of connecting subway lines within each commercial district category. Specifically, we used a t-test to compare Type 3-2 (stations with two connecting subway lines) with Type 3-3 (stations with three connecting subway lines), while Type 3-4 was excluded from the analysis due to its limited sample size (n = 2).
The T-test comparing the Developmental Commercial Areas between Type 3-2 and Type 3-3 revealed a statistically significant difference, with a p-value of 0.024. This result, as presented in Table 5, indicates that the null hypothesis of equal means was rejected, and a significant difference exists between the two groups in the mean count of Developmental Commercial Areas.
Table 5.
T-test results comparing Type 3-2 and Type 3-3 for developmental commercial areas.
The ANOVA analysis considered four station groups (Type 1, Type 3-2, Type 3-3, and Type 4); Type 3-4 was not included given the small sample size. As shown in Table 6, the analysis yielded a statistically significant result, with a p-value less than 0.05, indicating that at least one group differs significantly from the others in terms of Developmental Commercial Areas.
Table 6.
ANOVA analysis result between types in the developed commercial area.
To identify where the differences lie, a post hoc analysis using the Bonferroni correction was performed to account for multiple comparisons. The results of the post hoc analysis, presented in Table 7, show statistically significant pairwise differences among the transfer-type groups. These findings indicate that not only are Developmental Commercial Areas more concentrated around transfer hubs compared to non-transfer ones, but also that stations with a higher number of transfer lines—particularly Type 3-3—exhibit notably greater levels of commercial development. Type 3-3 stations, which accommodate transfers among three subway lines, showed the highest average number of Developmental Commercial Areas among all groups, suggesting a pronounced role for three-line transfer hubs in fostering the growth of surrounding commercial zones.
Table 7.
Bonferroni analysis result between types in the developed commercial area.
An independent-samples t-test was performed to examine whether the mean number of Commercial Alley Areas differs between stations with two transfer lines (Type 3-2) and those with three transfer lines (Type 3-3). As reported in Table 8, the p-value was 0.20, so the null hypothesis of equal means was not rejected. In other words, the data do not provide evidence of a statistically significant difference in the average number of Commercial Alley Areas between the two groups. Given this result, the number of transfer lines was not treated as a distinguishing factor for Commercial Alley Areas, and Type 3-2 and Type 3-3 were merged into a single Type 3 category for subsequent analyses.
Table 8.
T-test analysis result between type 3-2 and type 3-3 in the commercial alley area.
An ANOVA analysis was conducted to examine differences in the number of Commercial Alley Areas among Type 1, Type 3, and Type 4 station groups. As presented in Table 9, the p-value was below 0.05, supporting rejection of the null hypothesis. This points to statistically significant differences between at least two groups.
Table 9.
ANOVA analysis result between types in the commercial alley area.
To further identify where the differences lie, a post hoc analysis was performed using the Bonferroni correction to account for multiple comparisons. As shown in Table 10, the post hoc test indicates a statistically significant difference only between Type 1 and Type 4. In descriptive terms, both Type 1 (non-transfer subway stations) and Type 4 (subway–railway transfer hubs) are associated with higher Commercial Alley Area counts than Type 3 (subway–subway transfer hubs). Taken together, this pattern suggests that variation in Commercial Alley Areas is more closely associated with railway connectivity than with subway-to-subway transfer connectivity.
Table 10.
Bonferroni analysis result between types in the commercial alley area.
An independent-samples t-test was performed to assess whether the mean number of Traditional Market Areas differs between stations with two transfer lines (Type 3-2) and those with three transfer lines (Type 3-3). As reported in Table 11, the p-value was 0.07; therefore, the null hypothesis was not rejected at the 0.05 significance level. This suggests that there is no statistically significant difference in the average number of Traditional Market Areas between the two groups. Based on this result, the number of subway transfer lines was not treated as a distinguishing factor for Traditional Market Areas. Consequently, Type 3-2 and Type 3-3 were consolidated and reclassified as Type 3 for subsequent analyses.
Table 11.
T-test analysis result between types in the traditional market area.
A one-way ANOVA was conducted to examine differences in the mean number of Traditional Market Areas across Type 1, Type 3, and Type 4 station groups. Table 12 shows a statistically significant result (p < 0.05). Accordingly, the null hypothesis of equal means is rejected, implying that at least one station group differs from the others in the average number of Traditional Market Areas.
Table 12.
ANOVA analysis result between types in the traditional market area.
To identify which groups accounted for this difference, a post hoc analysis was performed using the Bonferroni correction to address multiple comparisons. Table 13 indicates that the post hoc test detected a statistically significant difference only for the Type 1–Type 3 comparison.
Table 13.
Bonferroni analysis results between types in the traditional market area.
Based on these results, Traditional Market Area counts differ most clearly between Type 1 and Type 3, while Type 4 does not show a statistically distinguishable difference from the other groups. This pattern suggests that variation in Traditional Market Areas is more closely associated with subway-based connectivity (including subway-to-subway transfers) than with railway connectivity.
6. Impact of Population on Agglomeration
6.1. Result of the Analysis of Active Population on Agglomeration
Type 1 refers to non-transfer subway stations without railway connections; 219 stations in Seoul were included in the analysis. We examined the 24-h active population within a 500 m station influence area, summarized at a 50 m × 50 m grid resolution. The mean active population per grid cell within the Type 1 station influence area was 1520 persons.
Type 3 denotes subway–subway transfer hubs. We analyzed the 24-h active population within a 500 m station influence area for 69 stations in Seoul. As a result, the average active population of a 50 m × 50 m area cell within Type 3 station influence areas was 1969 people, which is approximately 449 higher than Type 1 on a per-cell basis.
Type 4 denotes subway–railway transfer hubs; 10 such stations in Seoul were included in the analysis. We examined the 24-h active population within a 500 m station influence area using 50 m × 50 m grid cells. The mean active population per grid cell was 1637 persons. This value is approximately 117 higher than Type 1 and about 332 lower than Type 3 on a per-cell basis. Figure 13 presents the distribution of the active population within station influence areas by station type.
Figure 13.
Distribution of active population in station influence area by station type.
6.2. Statistical Significance Tests for the Active Population Agglomeration Analysis
We analyzed the active population allocated to 50 m × 50 m grid cells within each station’s 0–500 m station influence area by station type to compare population agglomeration across transfer categories. A one-way ANOVA was performed to statistically assess whether differences in mean active population exist among the three station types—Type 1, Type 3, and Type 4. As shown in Table 14, the analysis yielded a p-value less than 0.05, indicating that at least two of the station types exhibited statistically significant differences in the average active population per grid cell.
Table 14.
ANOVA analysis result between types in the active population.
To further explore these differences, a post hoc analysis using the Bonferroni correction was conducted, accounting for unequal group sizes. As presented in Table 15, the results revealed that statistically significant differences existed between all pairwise combinations of station types, with p < 0.05 in each case. This finding confirms that the distribution of the active population varies significantly by station transfer type, suggesting that the structure and function of transit nodes are associated with patterns of population The overlapping elements are minor and do not affect scientific understanding or the interpretation of the results. Therefore, we did not revise the figure.concentration.
Table 15.
Bonferroni comparisons of active population between station types.
7. Impact of Land Price
This section distinguishes between station-level comparisons across transfer types within the baseline station area (Section 7.1) and area-level comparisons that reflect multi-station accessibility and alternative station influence area definitions (Section 7.2, Section 7.3 and Section 7.4). Section 7.3 replicates the station-type comparison in Section 7.1 under an alternative station influence area (0–300 m) to assess sensitivity to buffer choice. Specifically, Section 7.2 examines outcomes in multi-station influence areas, while Section 7.4 compares results by spatial position using an outer-ring band (500–750 m, 2024).
7.1. Results of the Analysis of Land Price in the Station Area
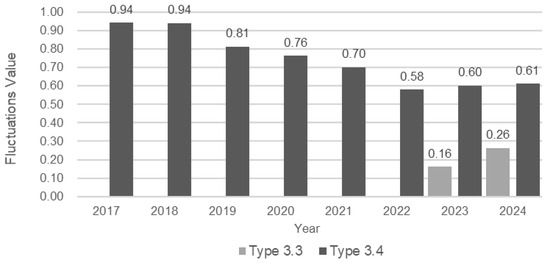
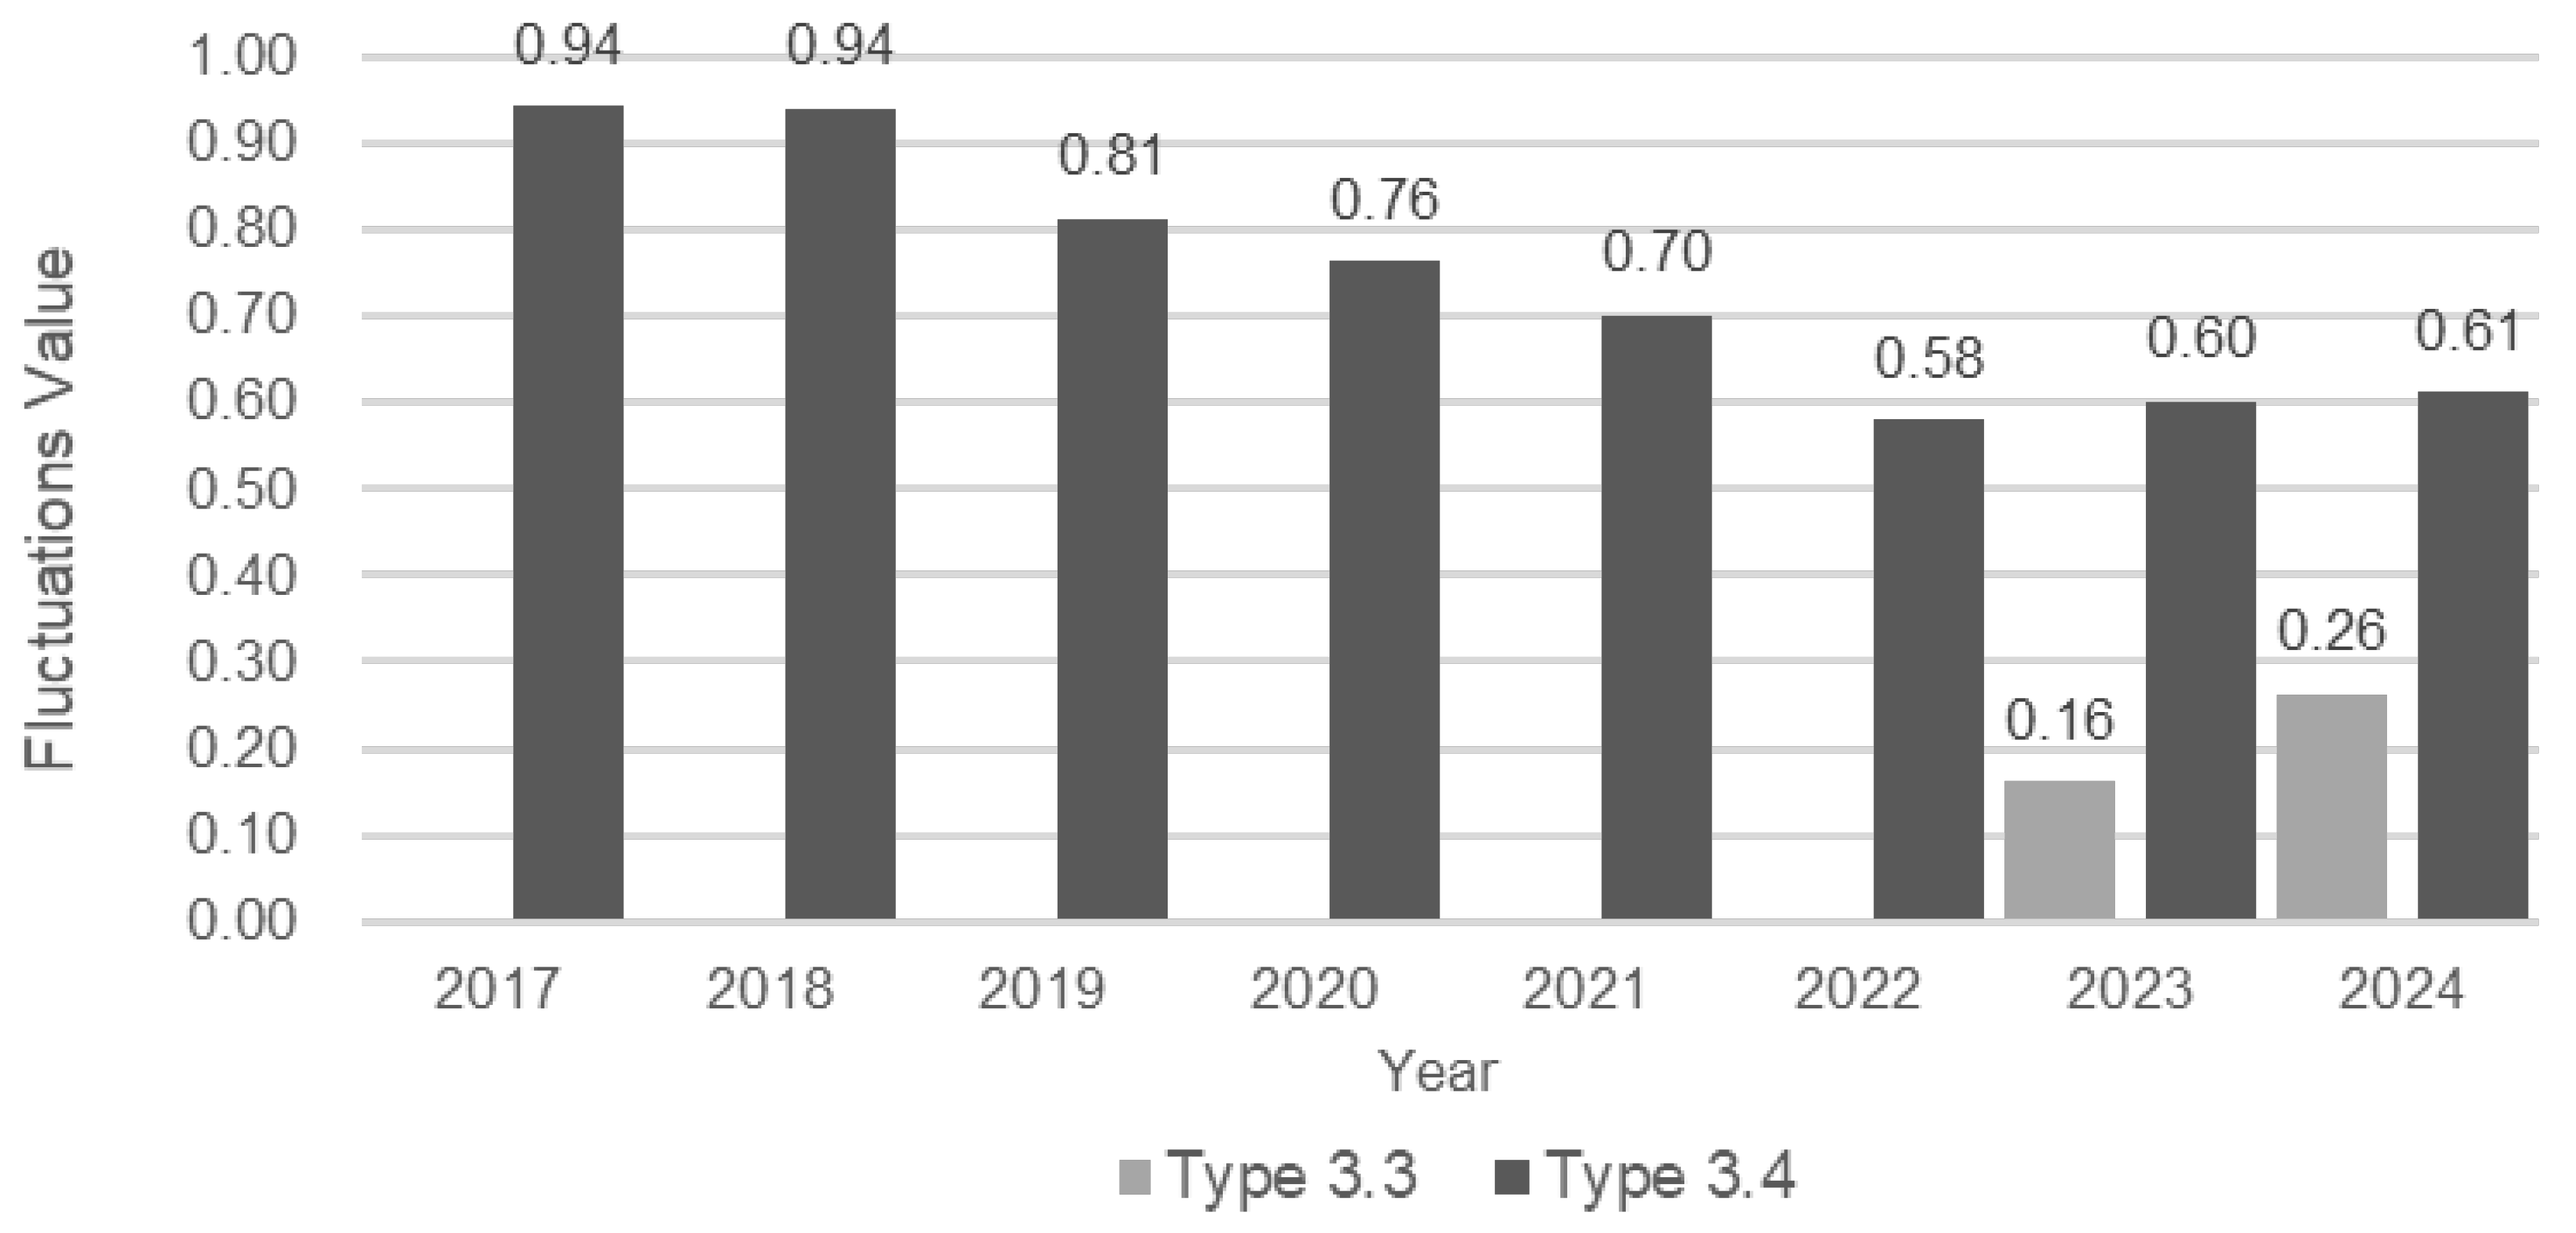
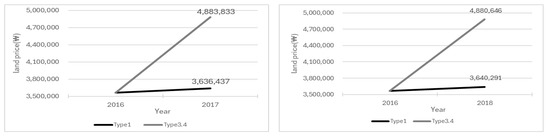
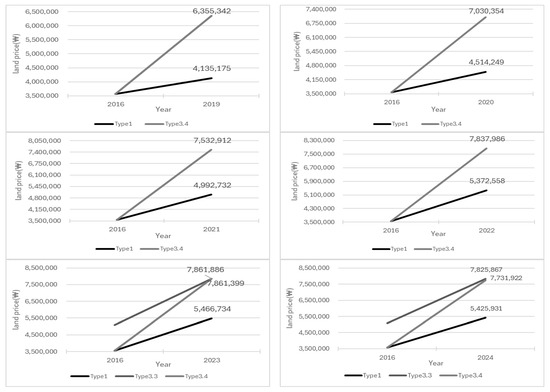
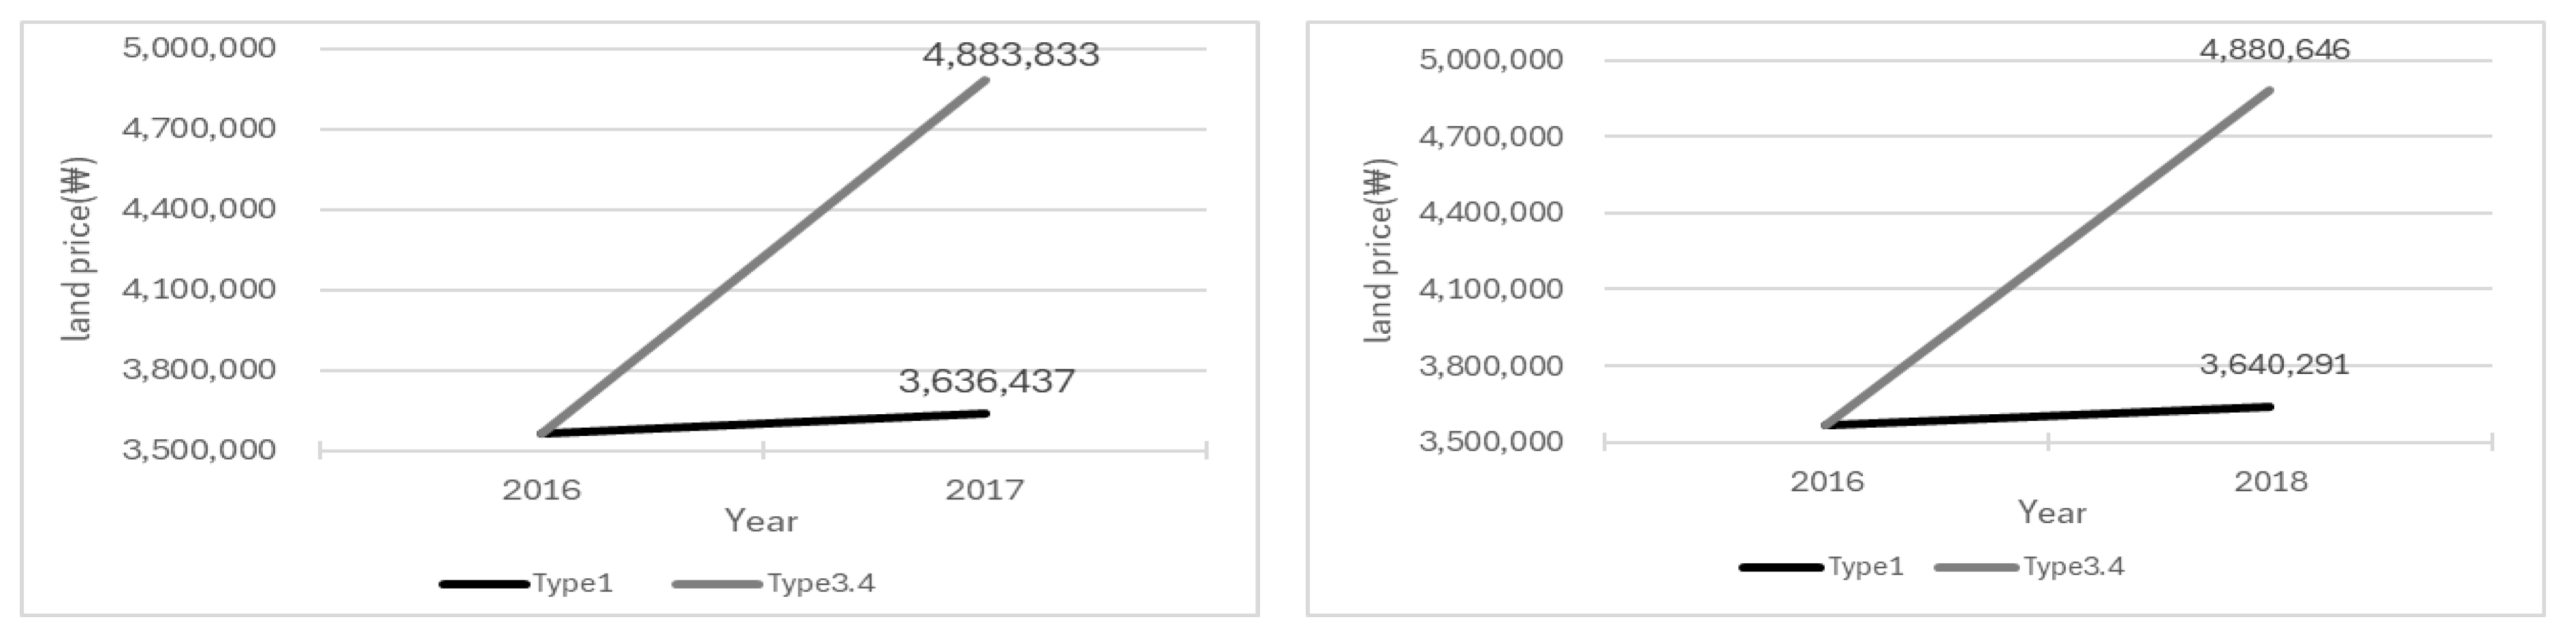
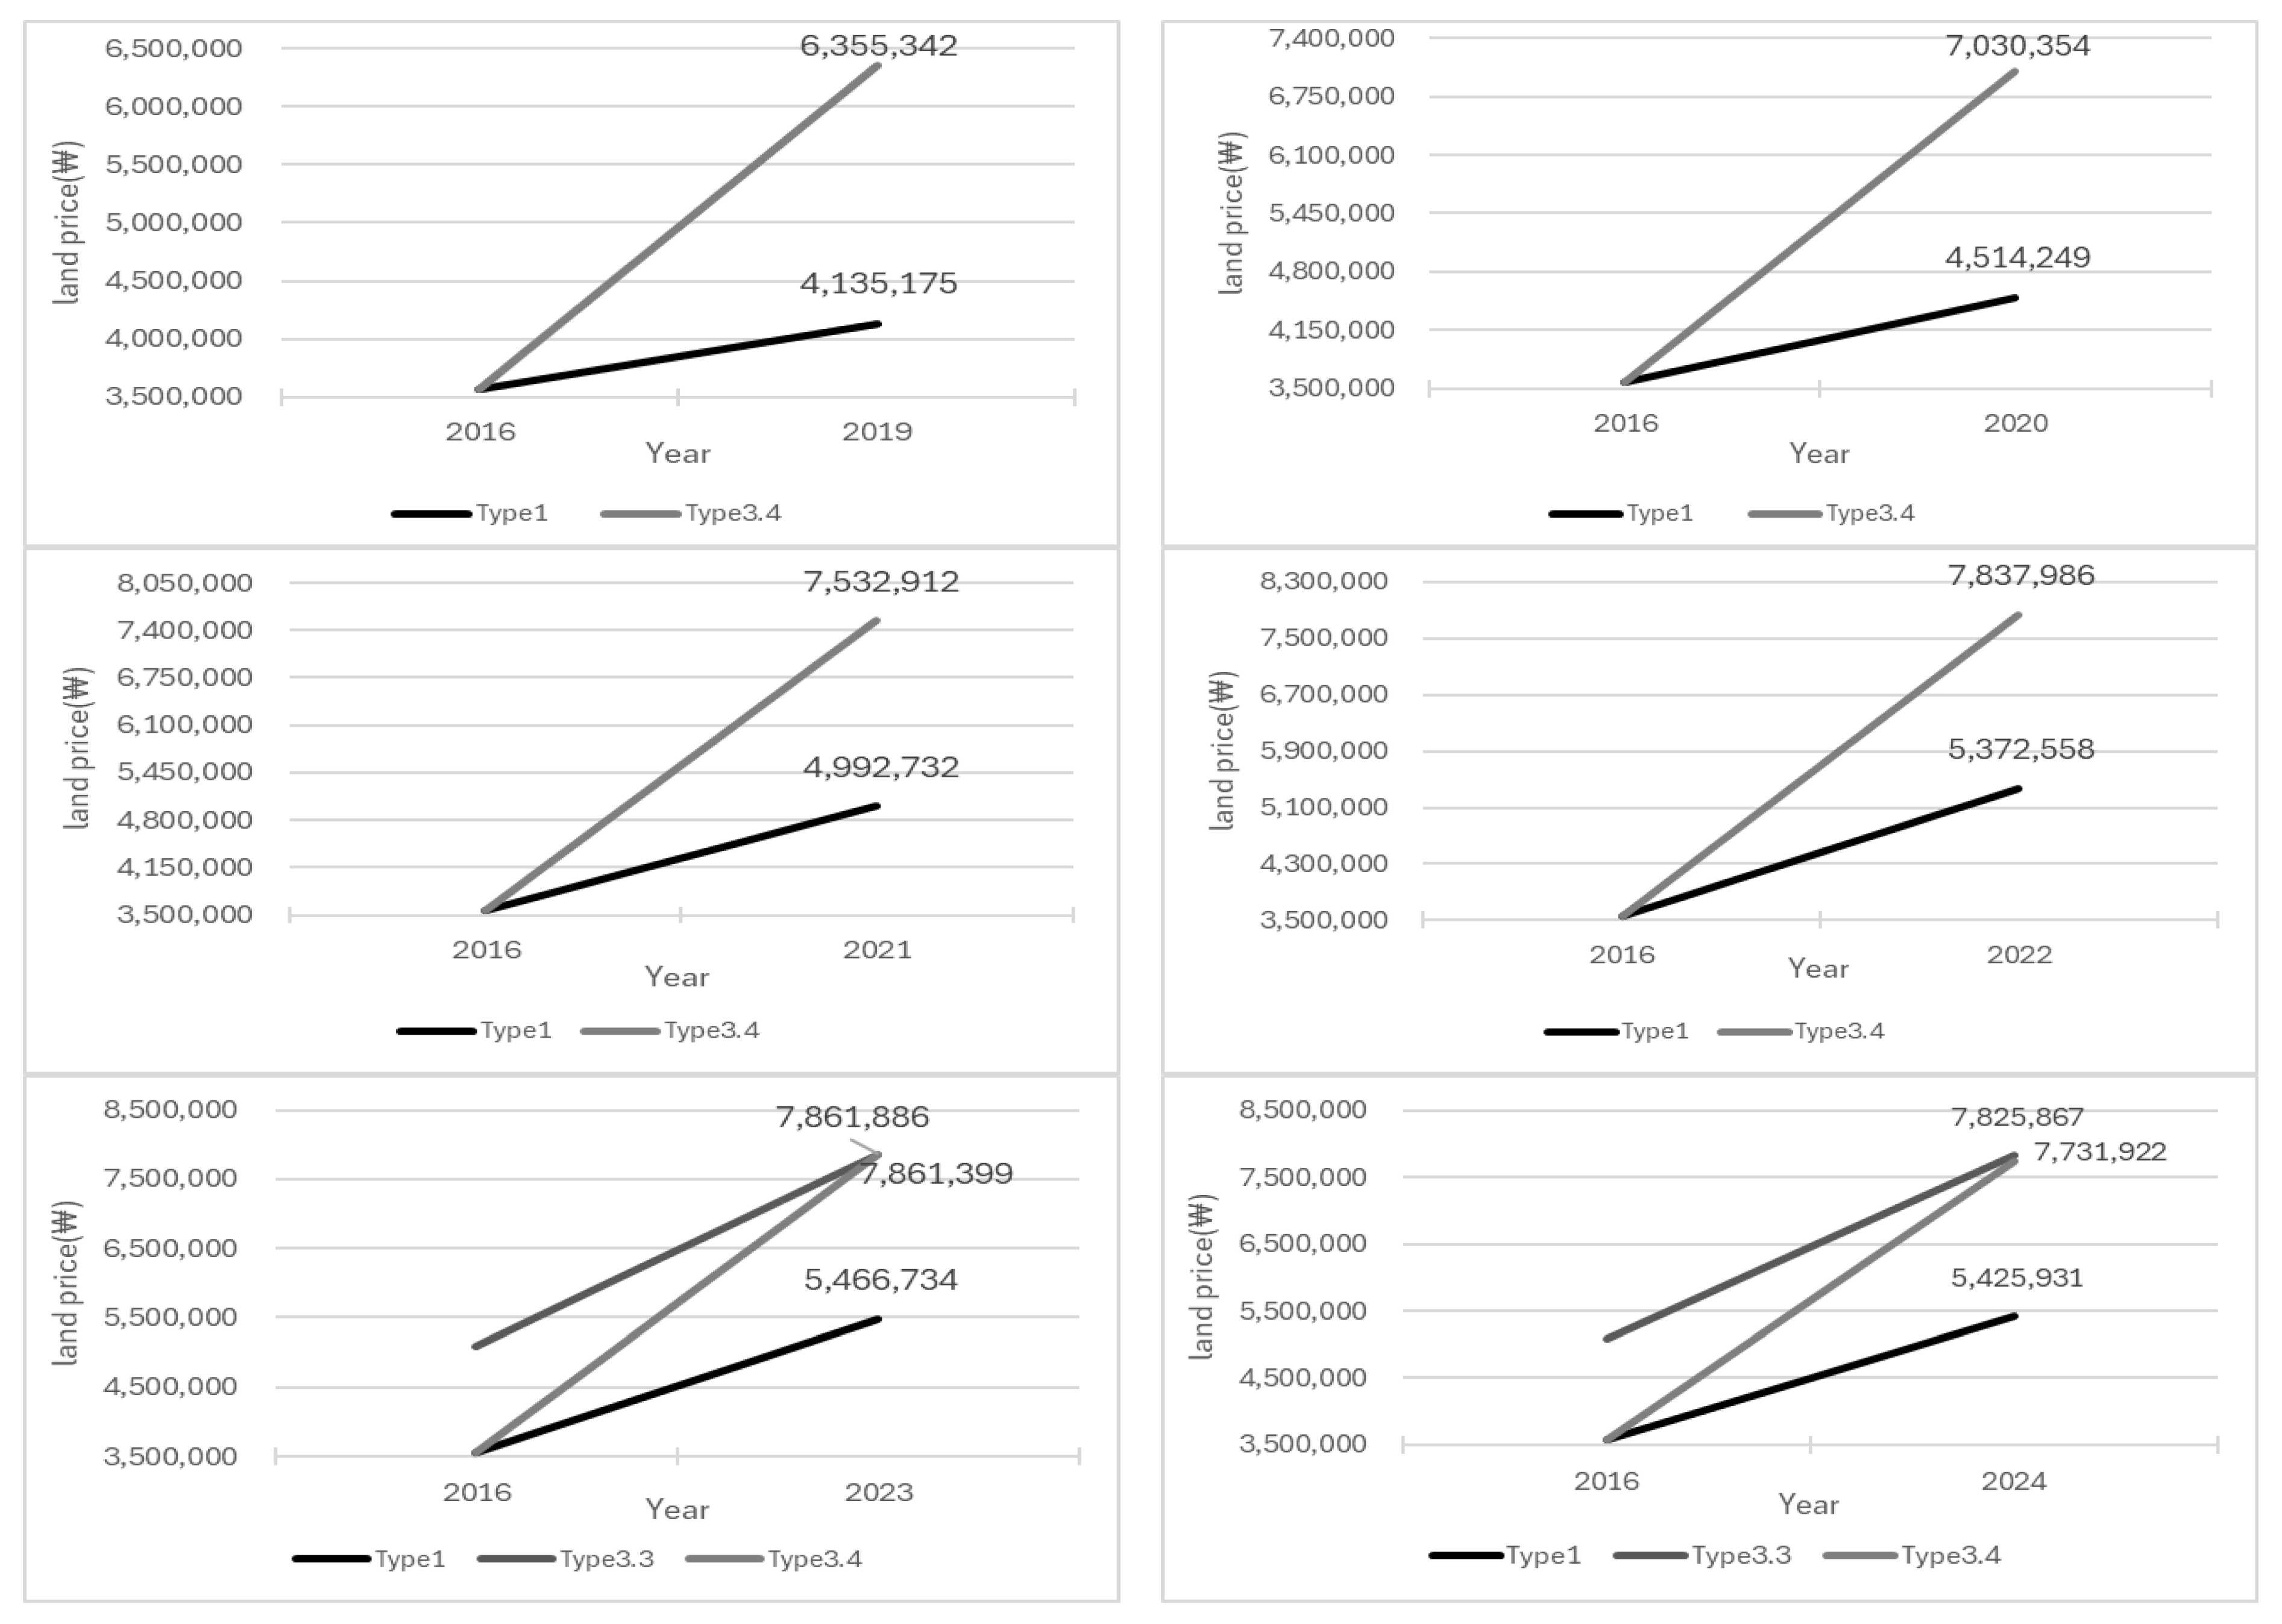
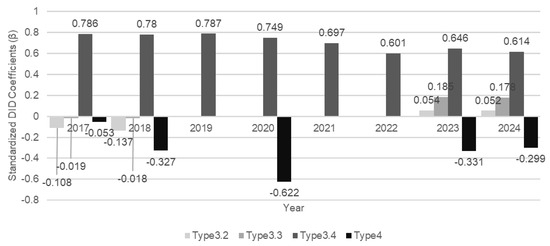
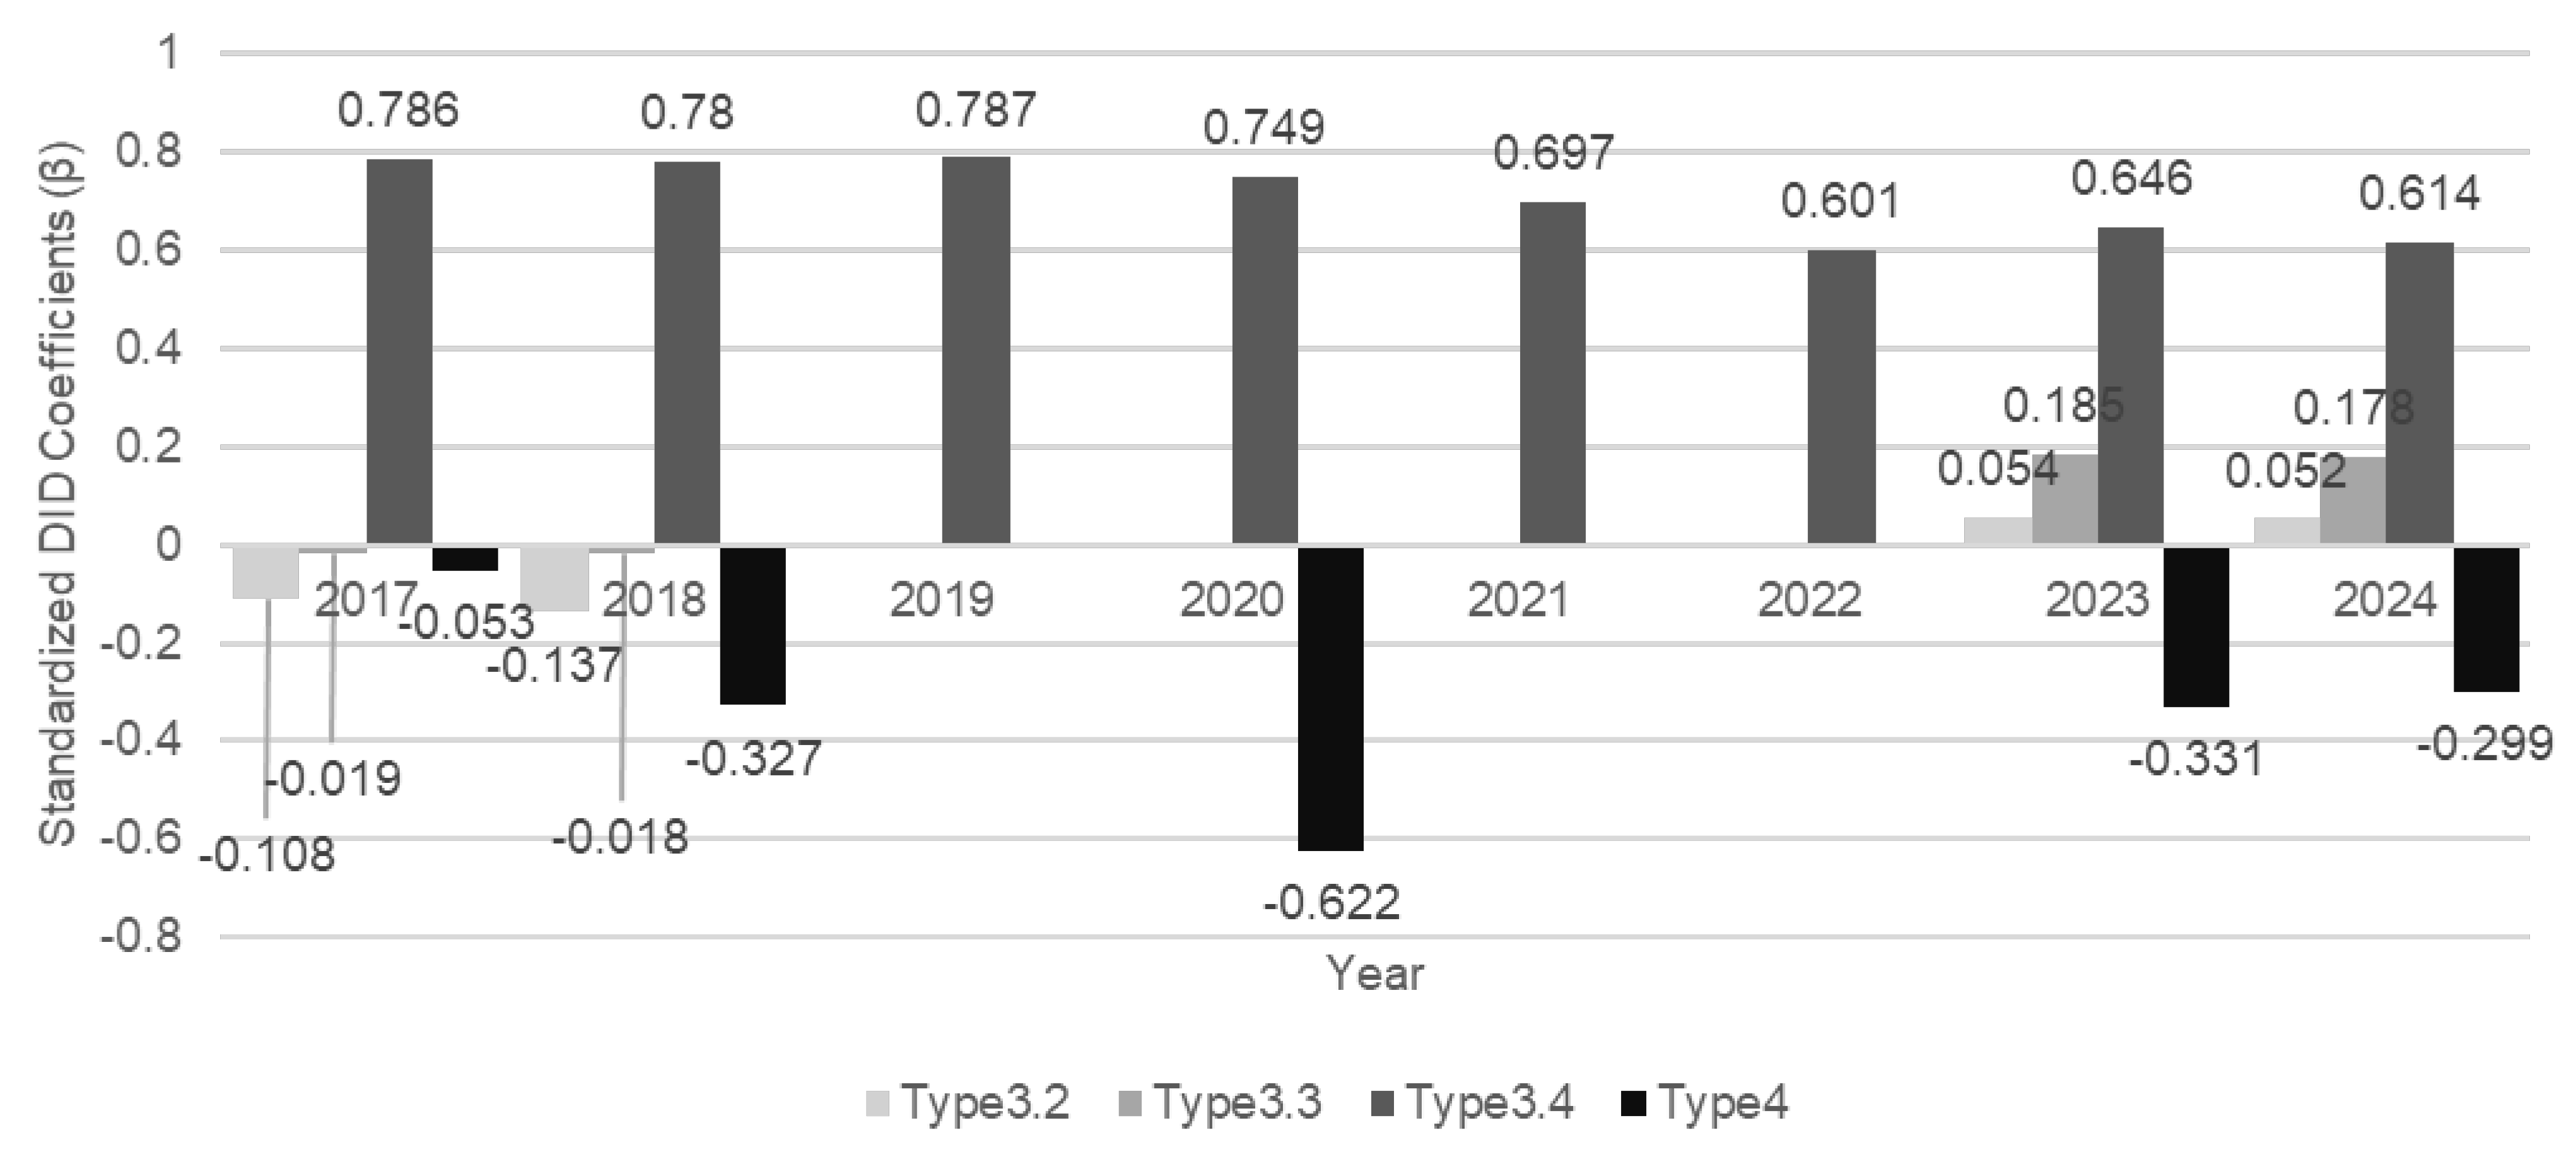
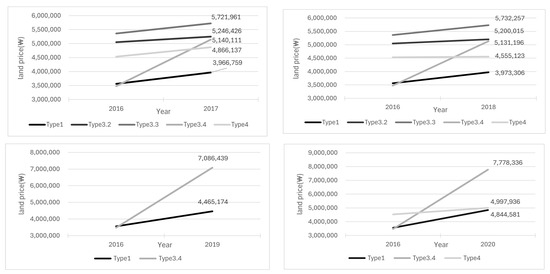
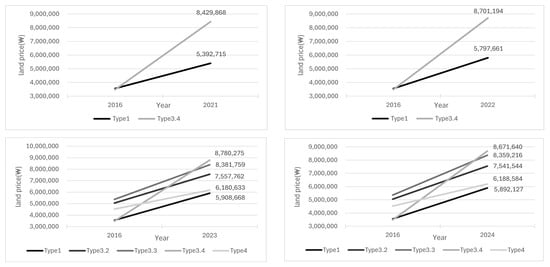
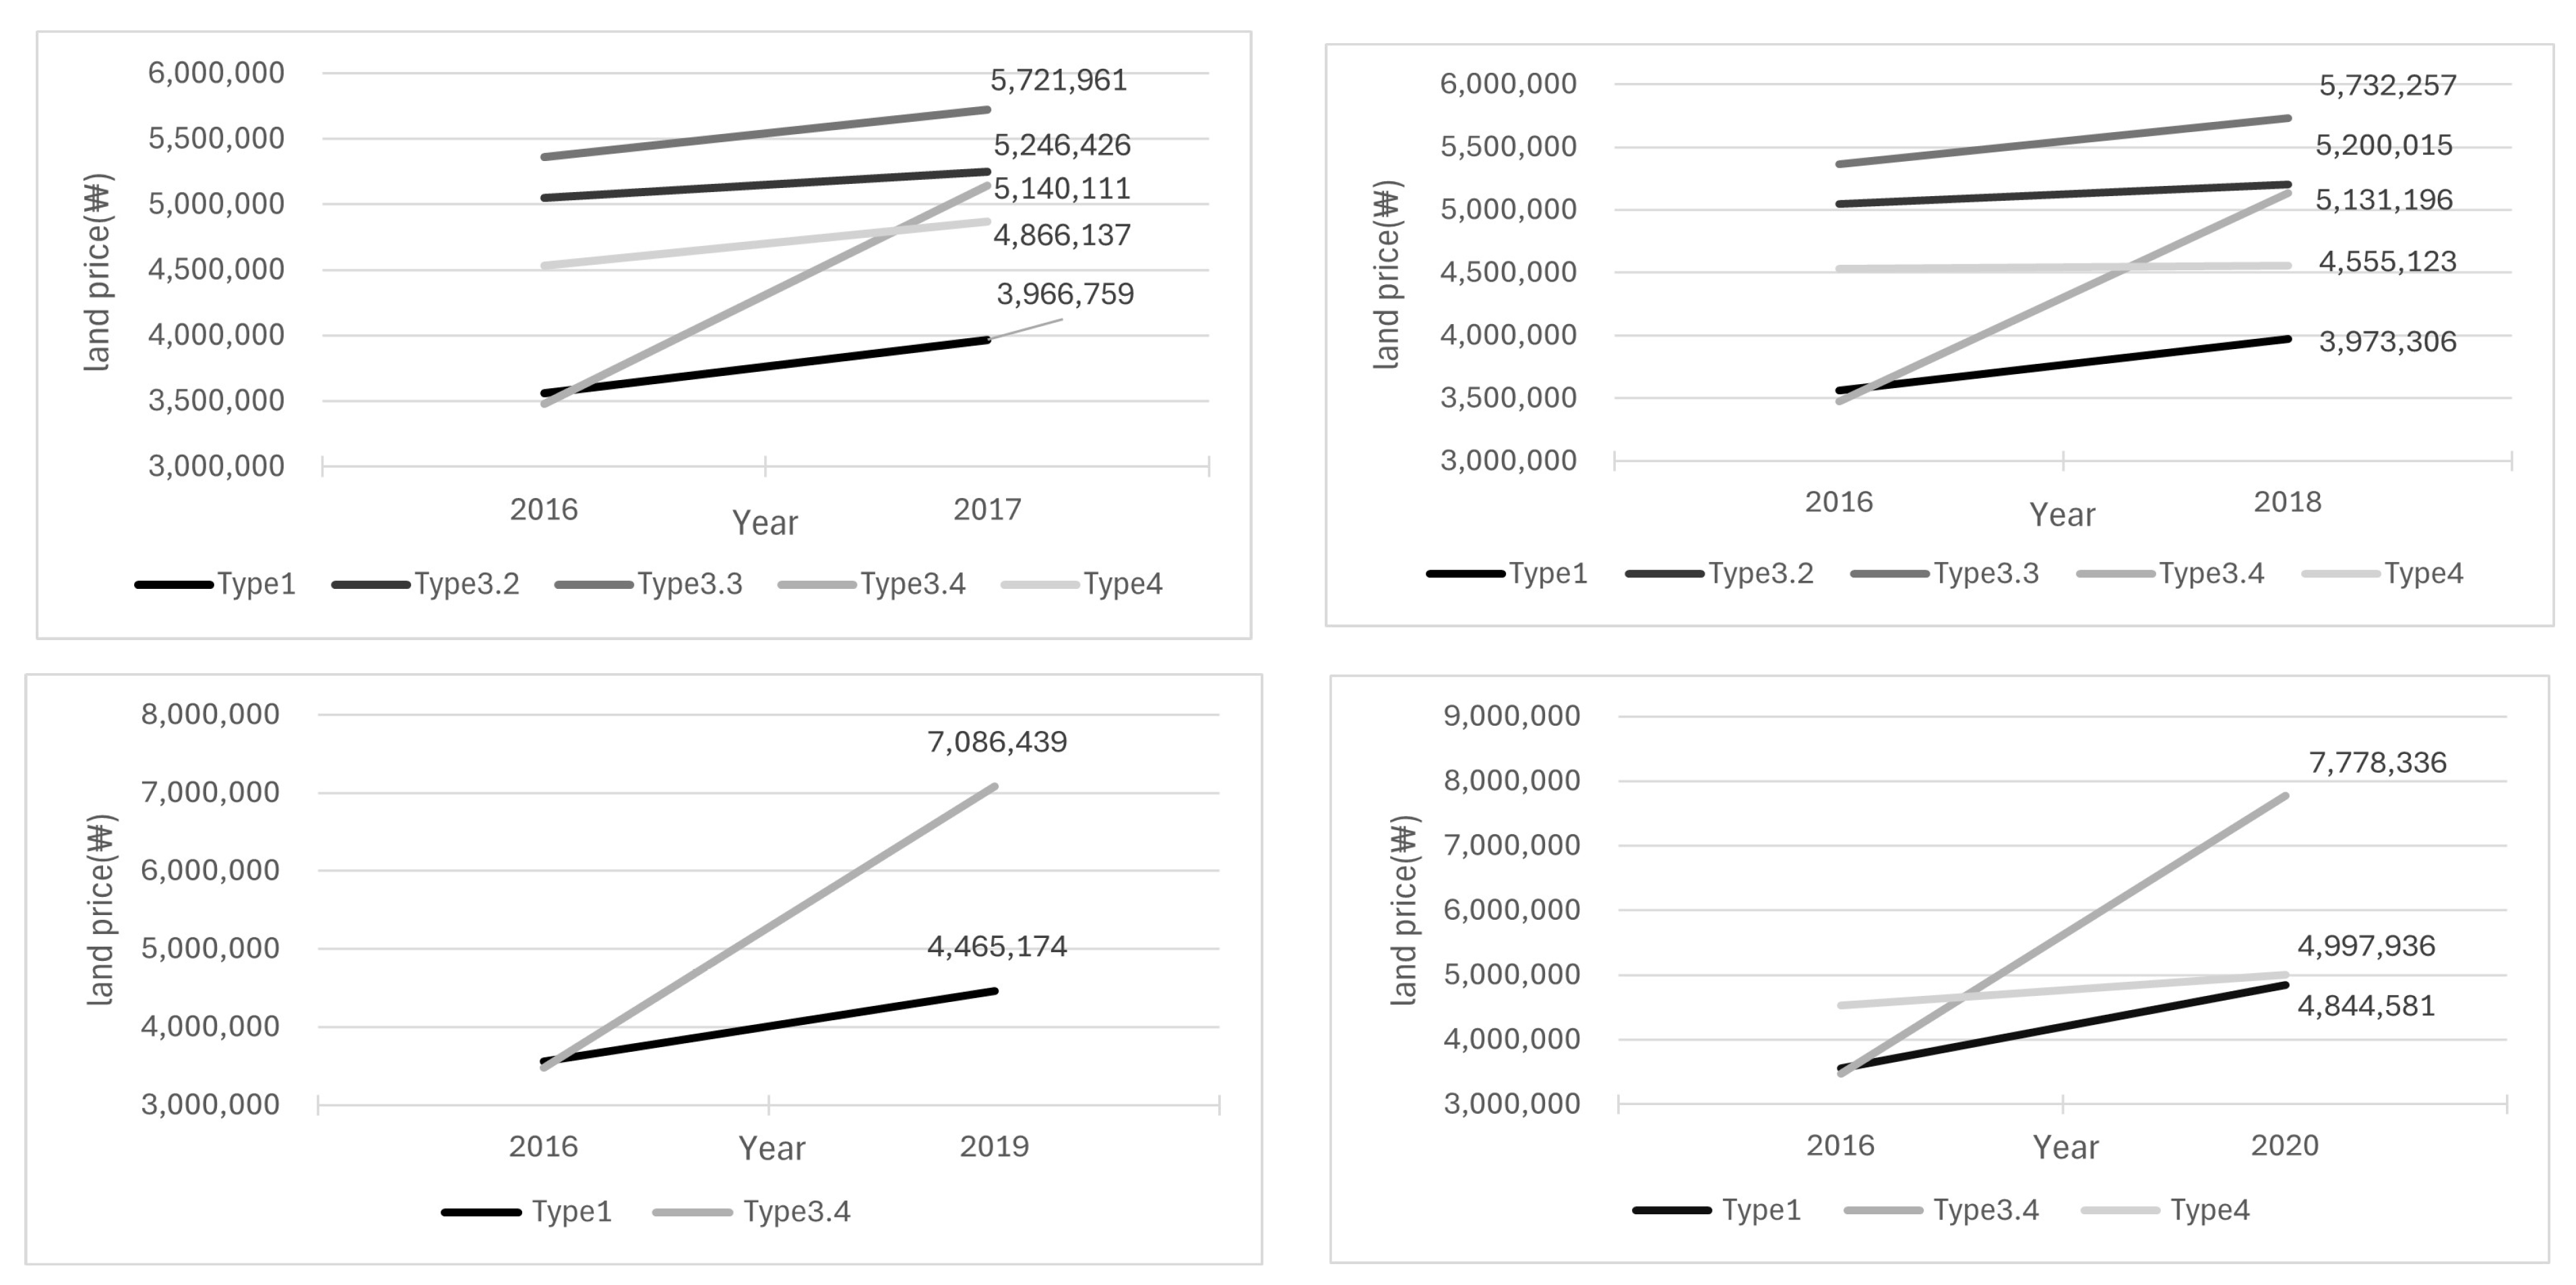
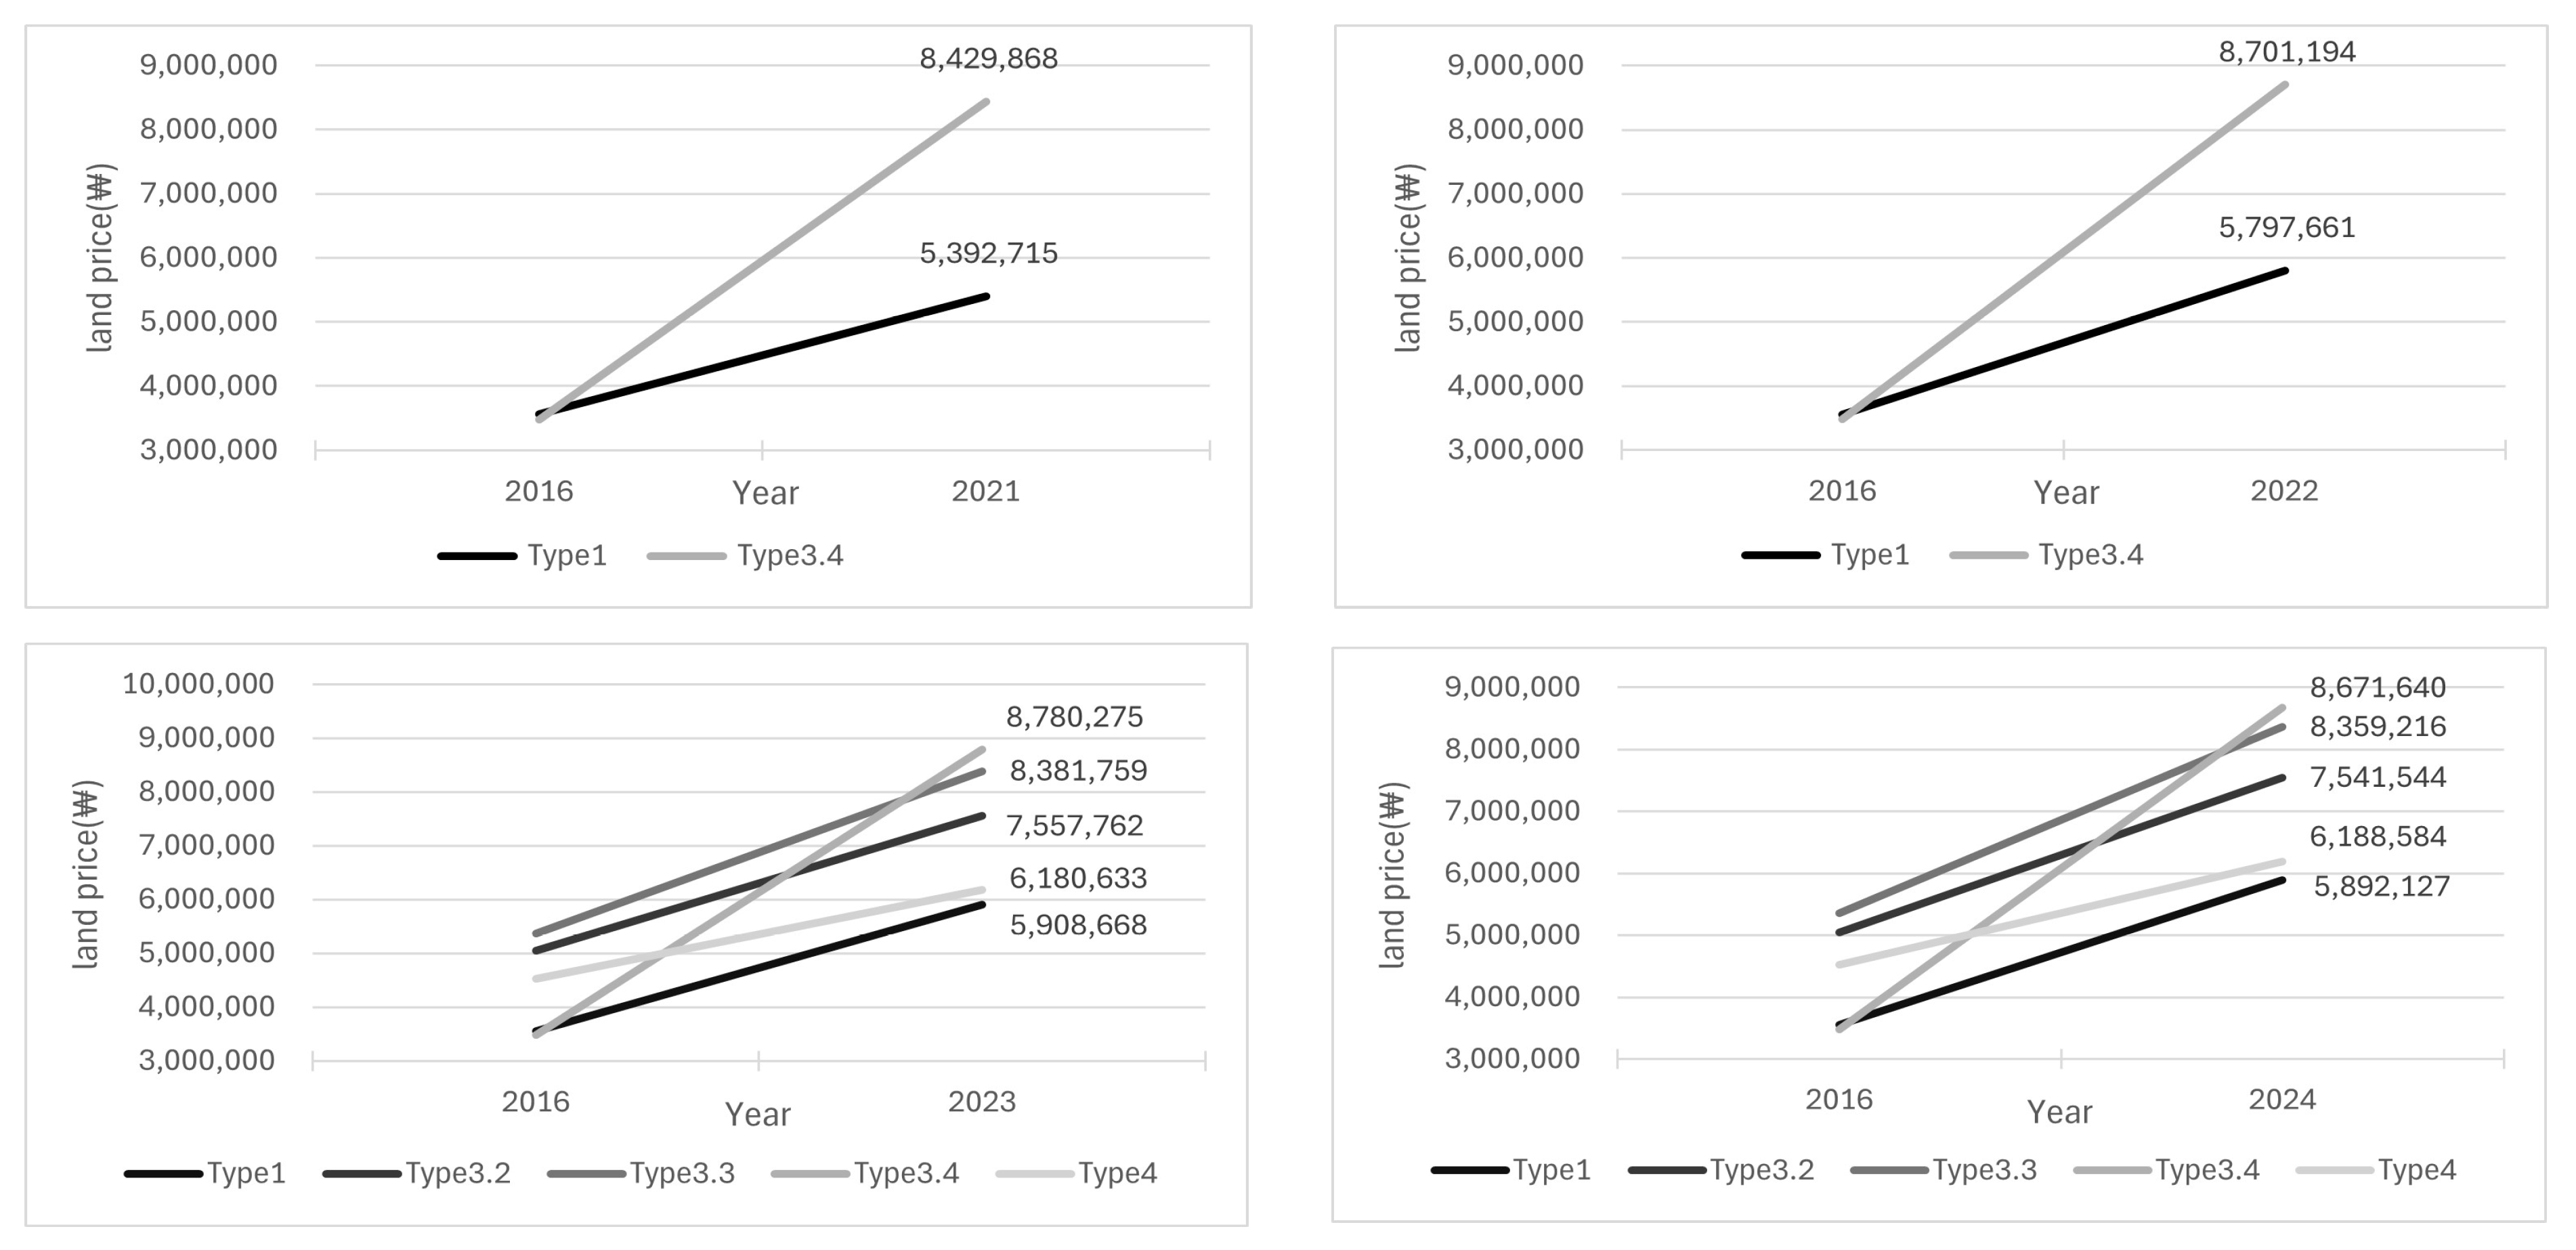
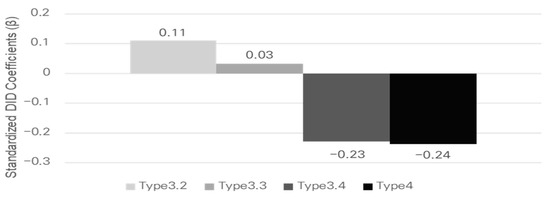
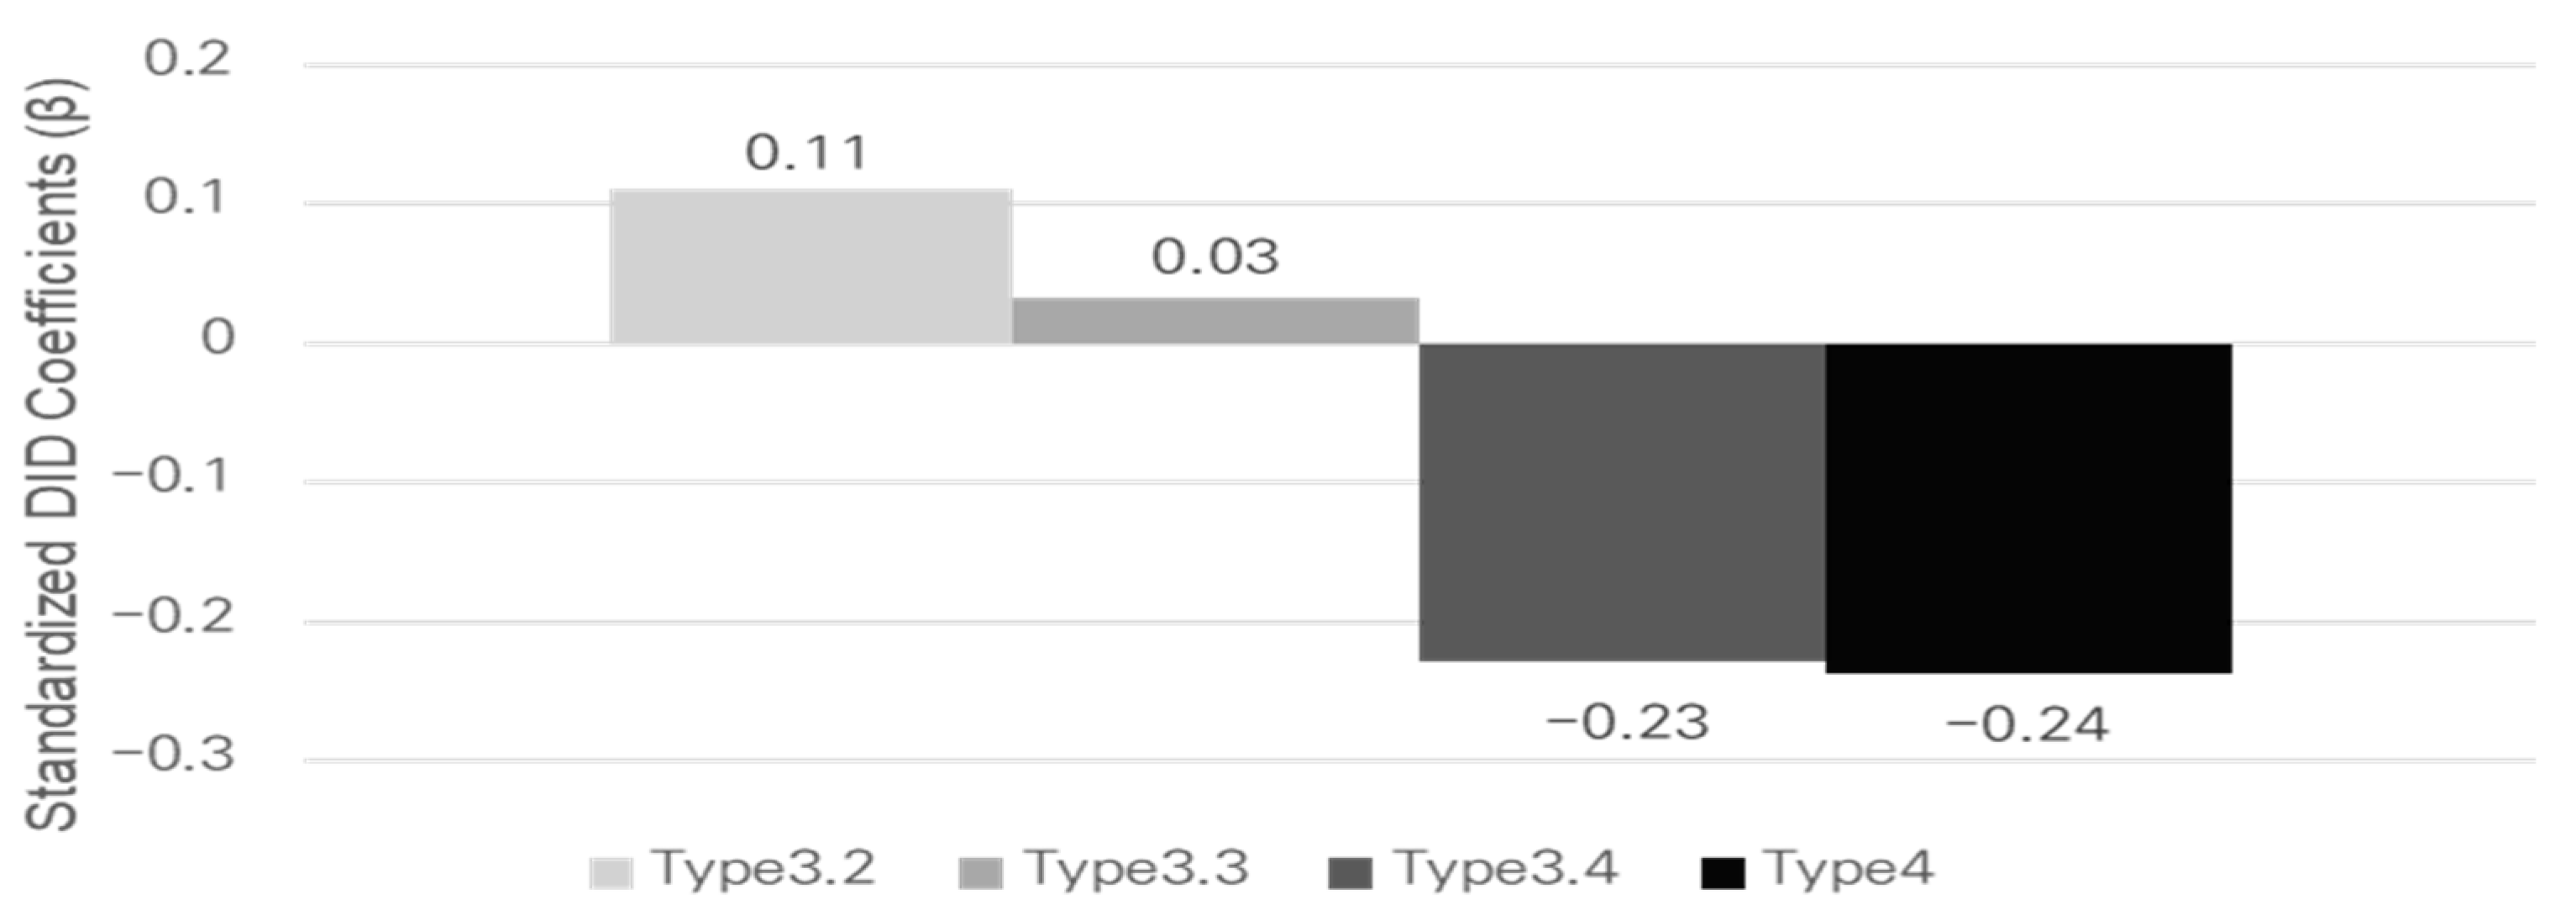
Figure 14 summarizes the distribution of Individual Official Land Price within the baseline 0–500 m station influence area by station type. Figure 15 and Figure 16 visualize year-specific standardized DID coefficients (β) for land-price changes within the same station influence area (2017–2024 relative to the 2016 baseline), while Table 16 reports the corresponding p-values. Across the post-baseline period, Type 3-4 shows the most robust and persistent divergence from the Type 1 reference trend, suggesting that land-price dynamics may be heterogeneous across transfer types.
Figure 14.
Distribution of land price in stations influence area by station type.
Figure 15.
Significant standardized DID coefficients (β) for land price between Type 1 and Type 3, Type 4 (0–500 m).
Figure 16.
Statistically significant DID analysis results for land price fluctuations (0–500 m) between single stations (Type 1) and transfer hubs (Type 3, Type 4).
Table 16.
Significance probability for DID analysis results (0–500 m) between single stations (Type 1) and transit stations (Type 3, Type 4) (p value).
By contrast, other transfer types exhibit more year-specific patterns, with significant deviations concentrated in particular years rather than consistently over the entire period. Notably, Type 3-3 displays a late-period increase, whereas Type 4 remains predominantly negative, underscoring that both the magnitude and direction of land-price changes vary by transfer configuration.
Accordingly, Section 7.2 examines whether the main temporal patterns persist when restricting the sample to transfer stations with overlapping 0–500 m station influence areas, thereby accounting for potential multi-station accessibility within dense station environments.
7.2. Results of the Analysis of Land Price in Multiple Station Areas
Section 7.2 examines whether land-price dynamics differ between single-station influence areas and multi-station influence areas within the baseline 0–500 m station influence area. Multi-station influence areas are defined based on the overlap criterion described in Section 4.1 (Table 2; Figure 4). Table 17 reports p-values from within-type DID tests comparing single- and multi-station influence areas.
Table 17.
Significance probability for DID analysis results between single-station areas and multiple-station areas (p-value).
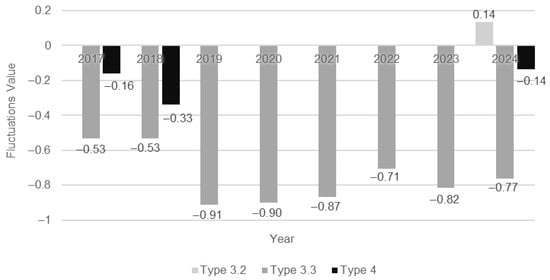
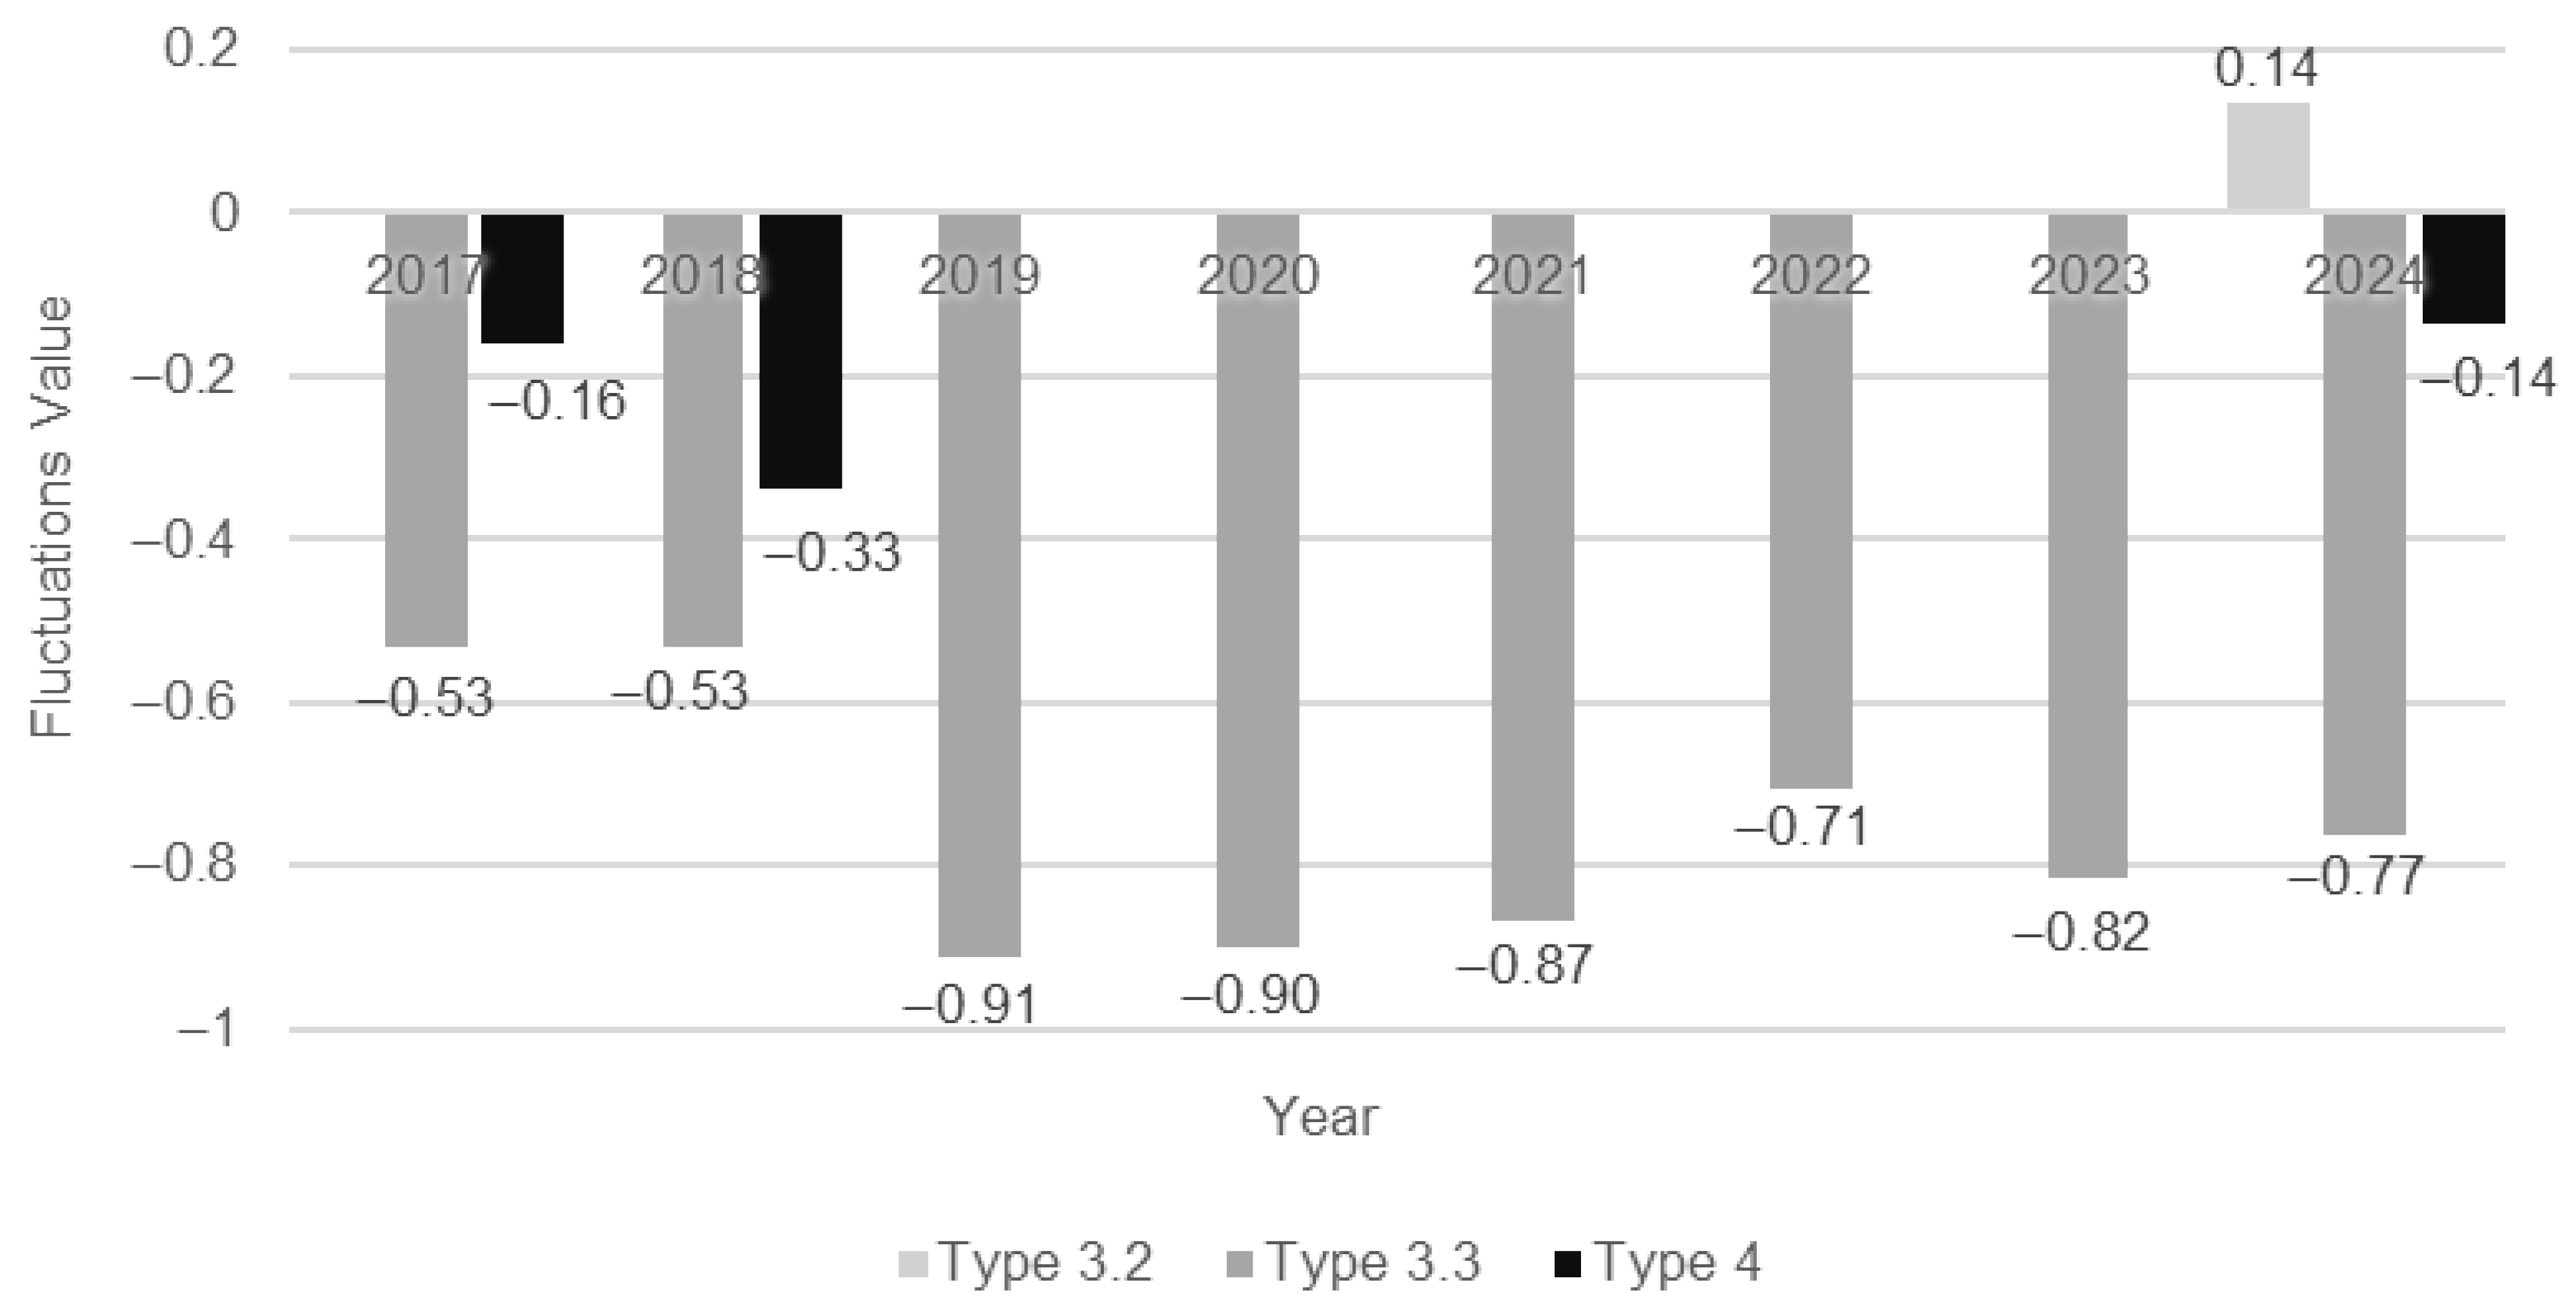
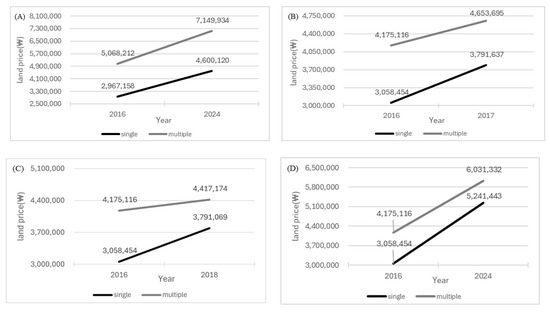
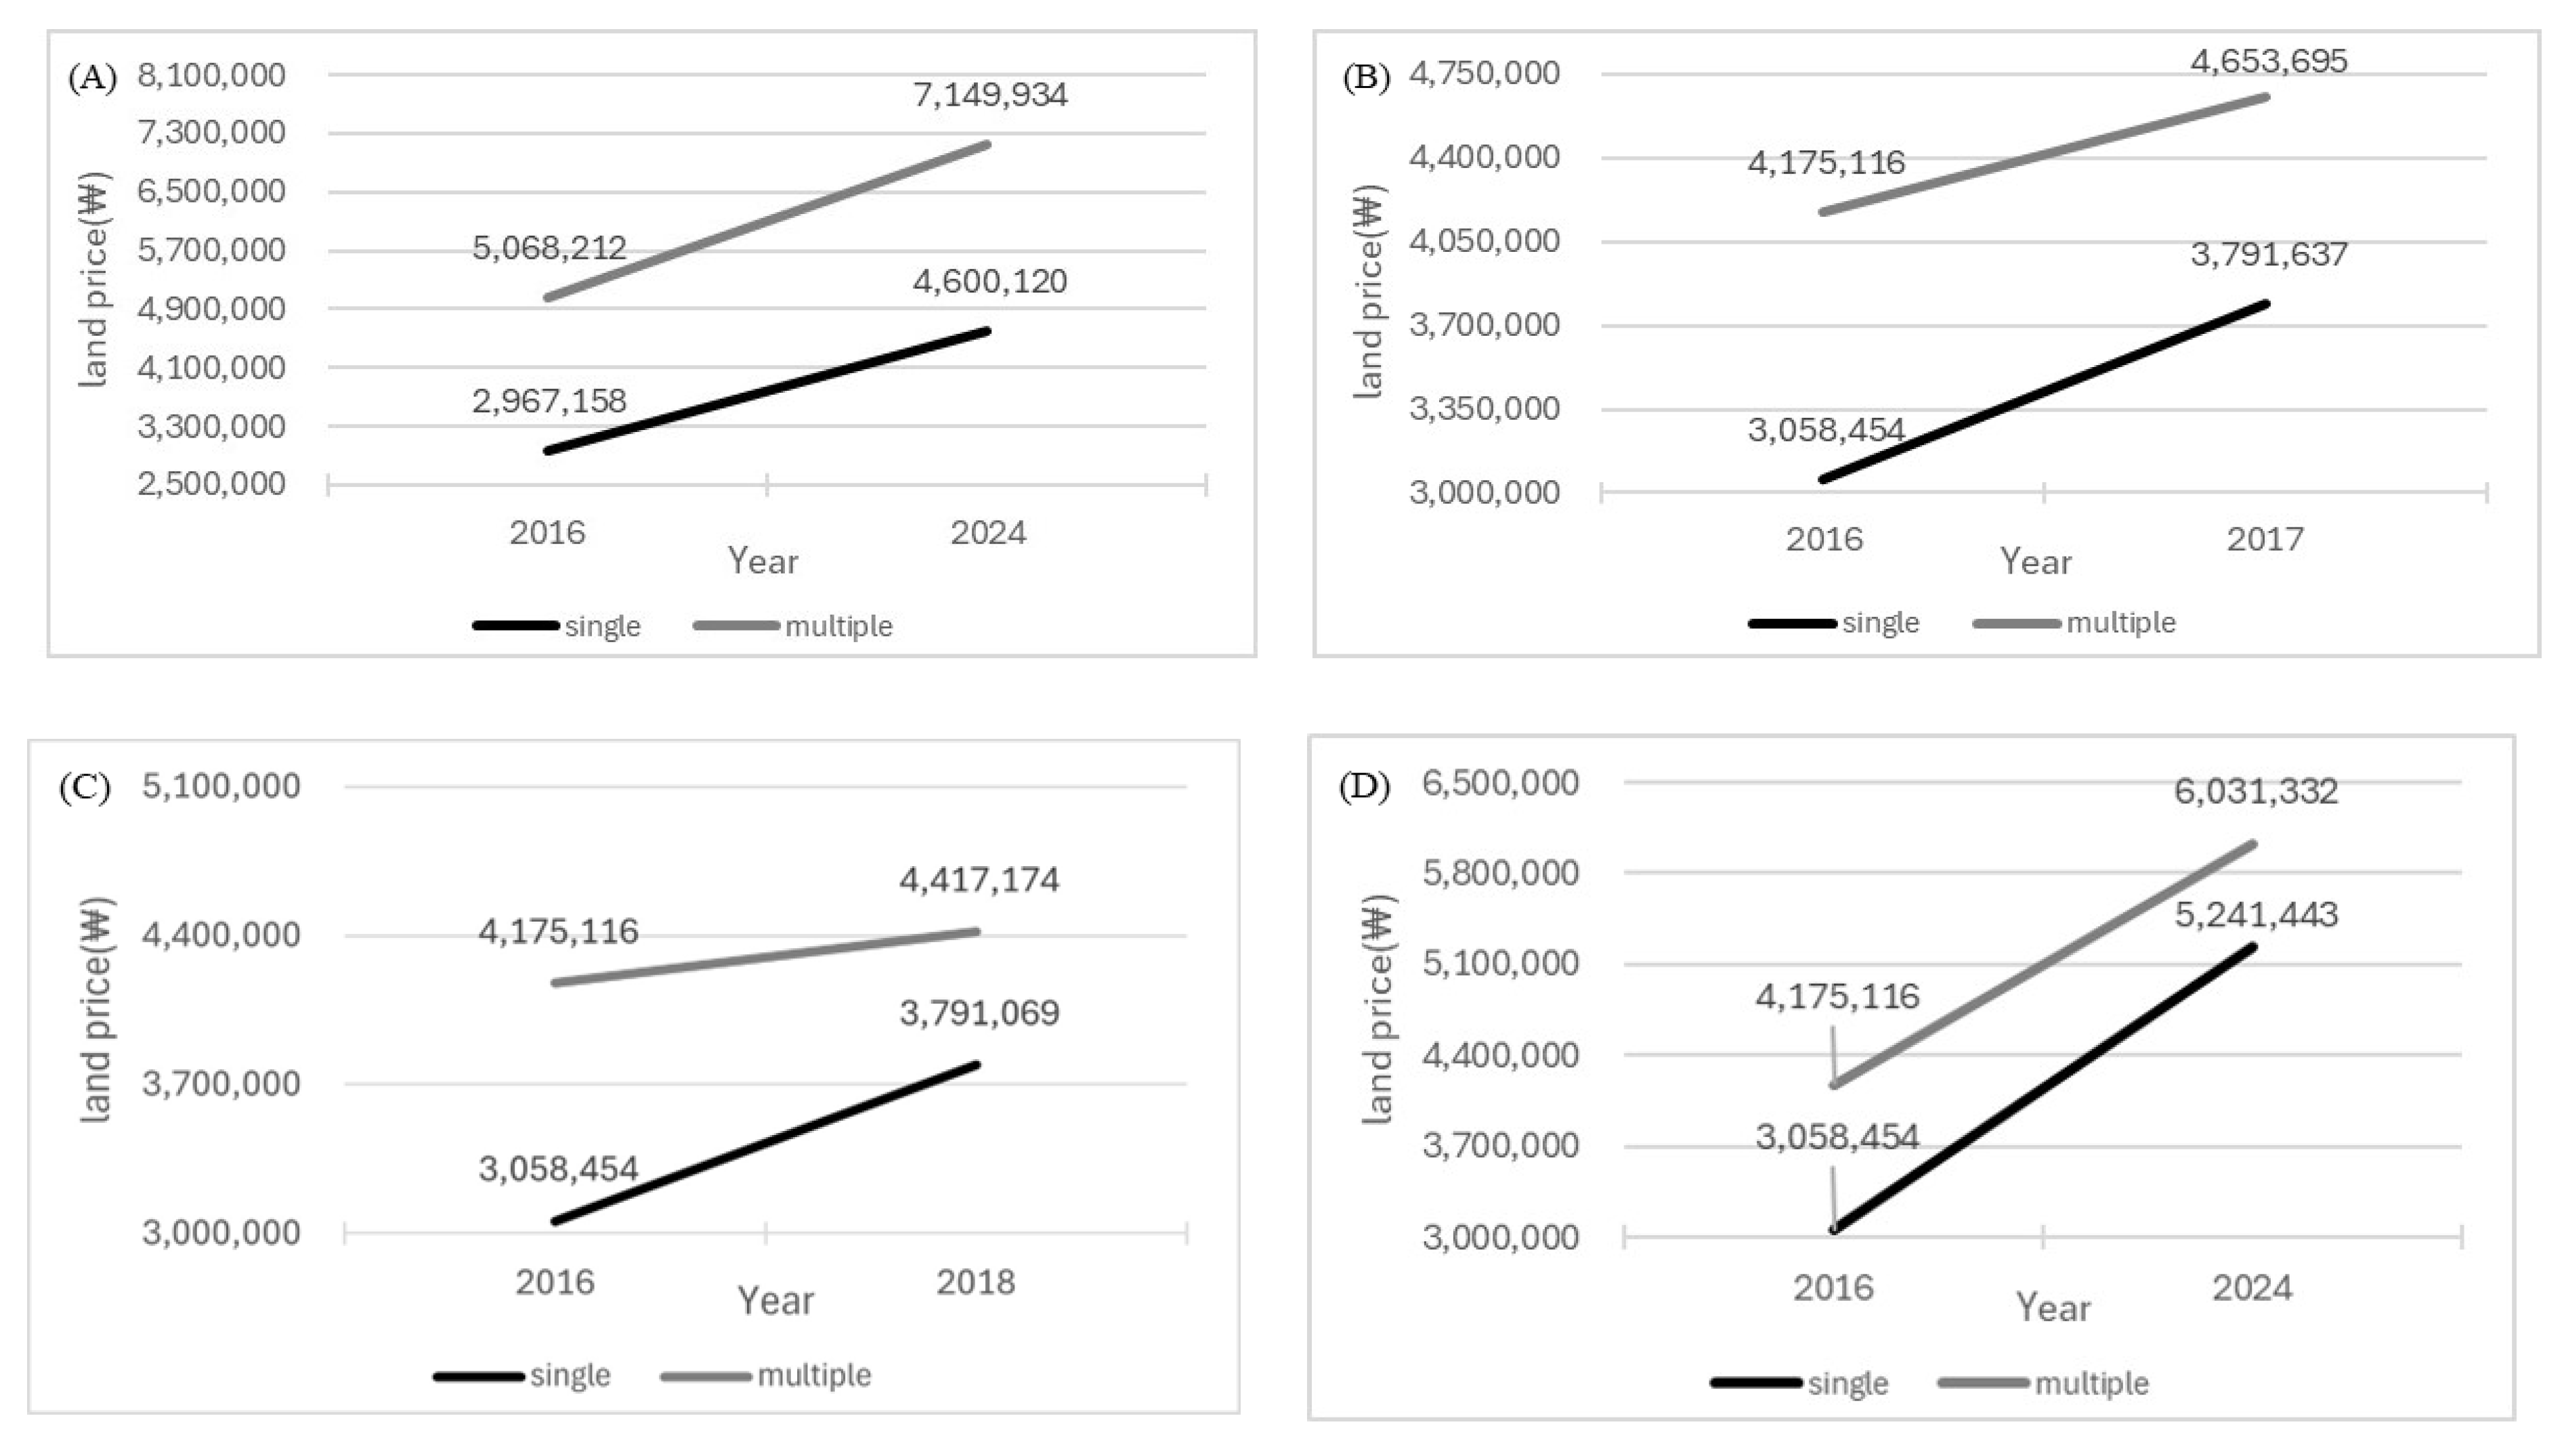
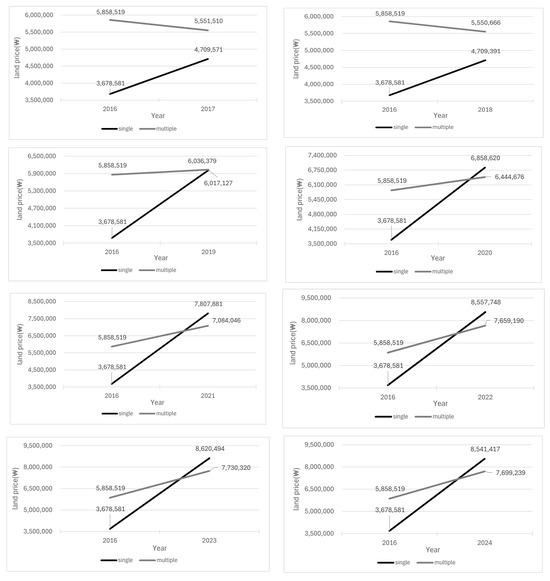
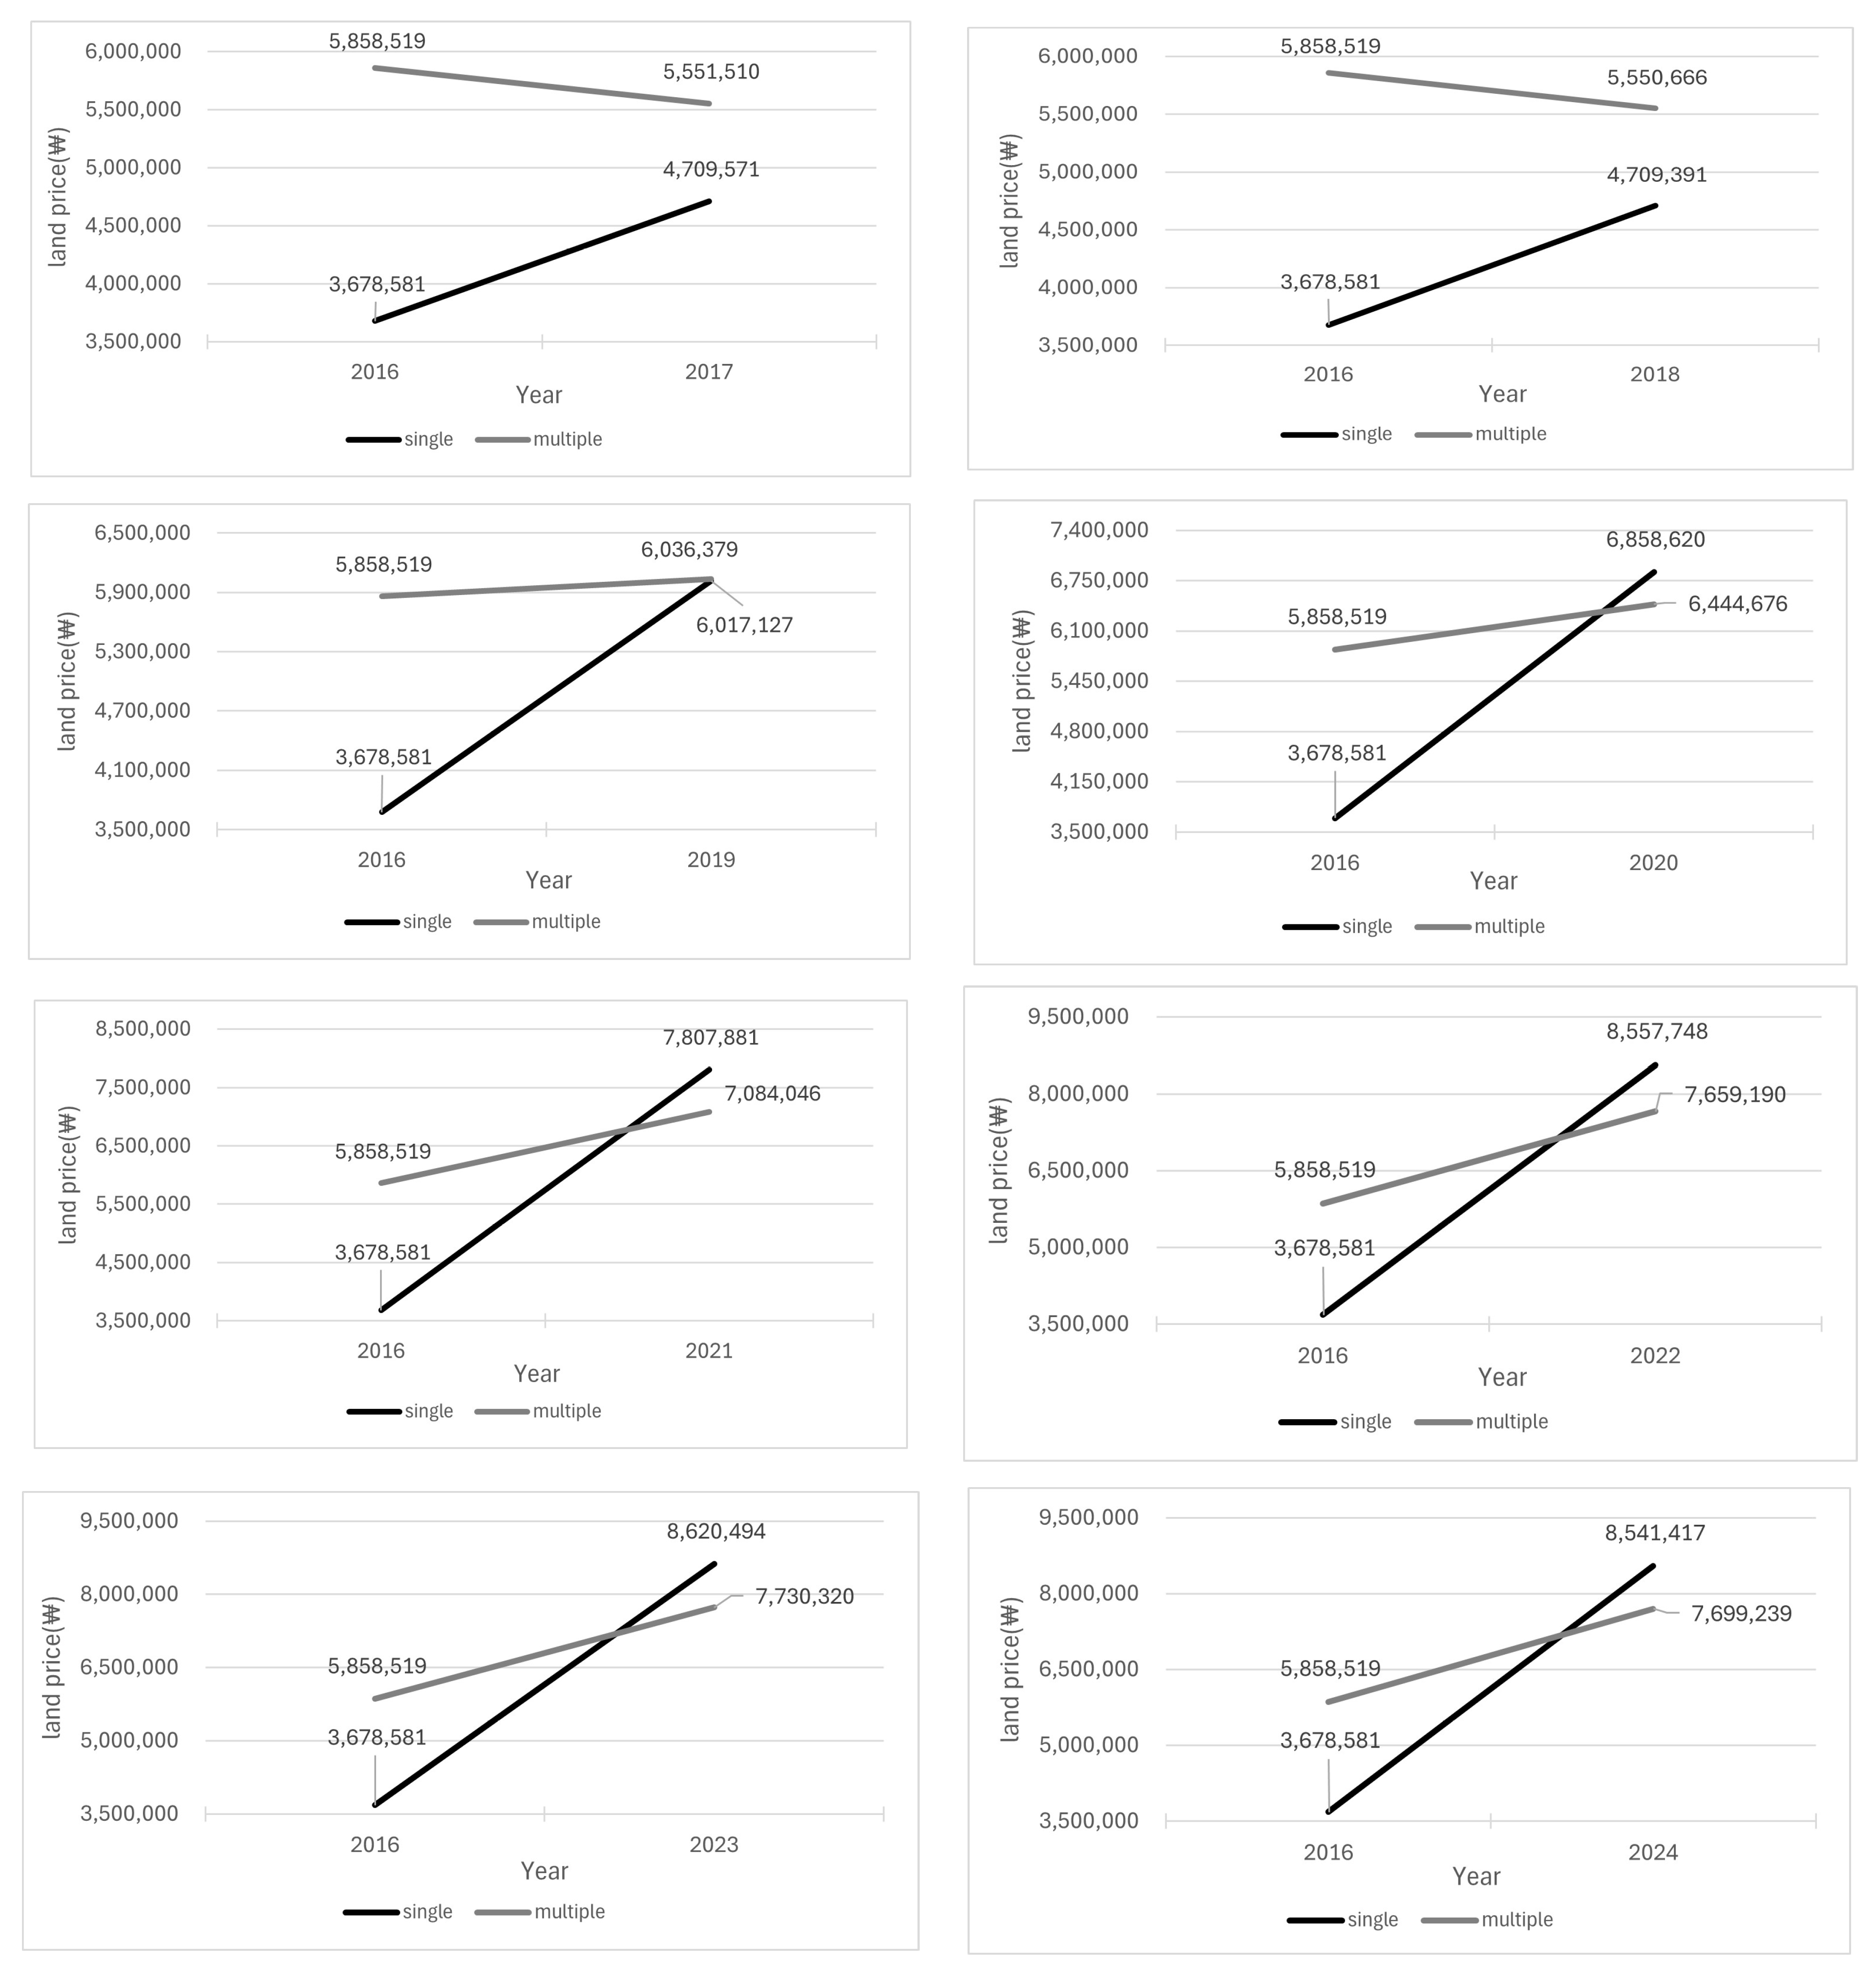
The results indicate that overlap conditions matter for some transfer configurations but not for others. For Type 1, the single-versus multi-station comparison is not statistically distinguishable in any year (p > 0.05), suggesting that overlap exposure alone does not produce clearly different land-price trends for non-transfer stations, even though overlap is common in this group. In contrast, Type 3-3 shows statistically significant differences in all post-baseline years (p ≤ 0.05), implying persistent divergence between single- and multi-station influence areas within this transfer type. Type 3-2 becomes significant only in 2024 (p ≤ 0.05), while Type 4 is significant in 2017–2018 and again in 2024 (p ≤ 0.05), indicating that overlap-related differences can be year-specific depending on transfer configuration. For Type 3-4, the single-versus multi-station comparison is not reported because distinct single-station influence areas are largely unavailable under the overlap setting described in Section 4.1. Figure 17 summarizes the years and transfer types for which the single-versus multi-station differences are statistically significant (Table 17). Figure 18 and Figure 19 then plot the statistically significant standardized DID coefficients (β) by year for the corresponding transfer types, illustrating the magnitude and direction of divergence between single- and multi-station influence areas.
Figure 17.
Significant standardized DID coefficients (β) for land-price changes between.
Figure 18.
Statistically significant DID analysis results for land price fluctuations between single-station areas and multiple-station areas Type 3.2 (A), Type 4 (B–D).
Figure 19.
Statistically significant DID analysis results for land price fluctuations between single-station areas and multiple-station areas (Type 3.3).
7.3. Results of the Land-Price Analysis Using the 0–300 m Catchment
Section 7.3 applies the same DID specification to a core station influence area (0–300 m) to examine whether the baseline station-type patterns are also evident within the most immediate station-access zone. Table 18 reports the year-specific significance of the DID estimates, while Figure 20 summarizes the significant standardized coefficients (β) for the comparison between Type 1 and transfer stations (Types 3 and 4). Figure 21 further presents the statistically significant DID results for land-price fluctuations by plotting the significant β values across years. Across the post-baseline period, the 0–300 m results closely mirror the baseline findings. Type 3-4 continues to show a robust and persistent divergence from the Type 1 reference trend, while Type 4 remains predominantly negative. The late-period increase for Type 3-3 is also preserved. Overall, these results indicate that the main transfer-type differences are similarly observed when focusing on the core station influence area.
Table 18.
Significance probability for DID analysis results (0–300 m) between single stations (Type 1) and transit stations (Type 3, Type 4) (p value).
Figure 20.
Significant standardized DID coefficients (β) for land price between Type 1 and Type 3, Type 4 (0–300 m).
Figure 21.
Statistically significant DID analysis results for land price fluctuations (0–300 m) between single stations (Type 1) and transfer hubs (Type 3, Type 4).
7.4. Results of the Land-Price Analysis Using the 500–750 m Outer Ring (2024)
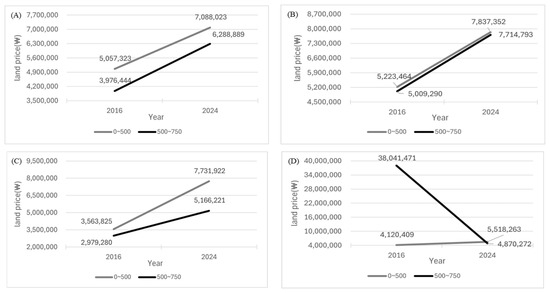
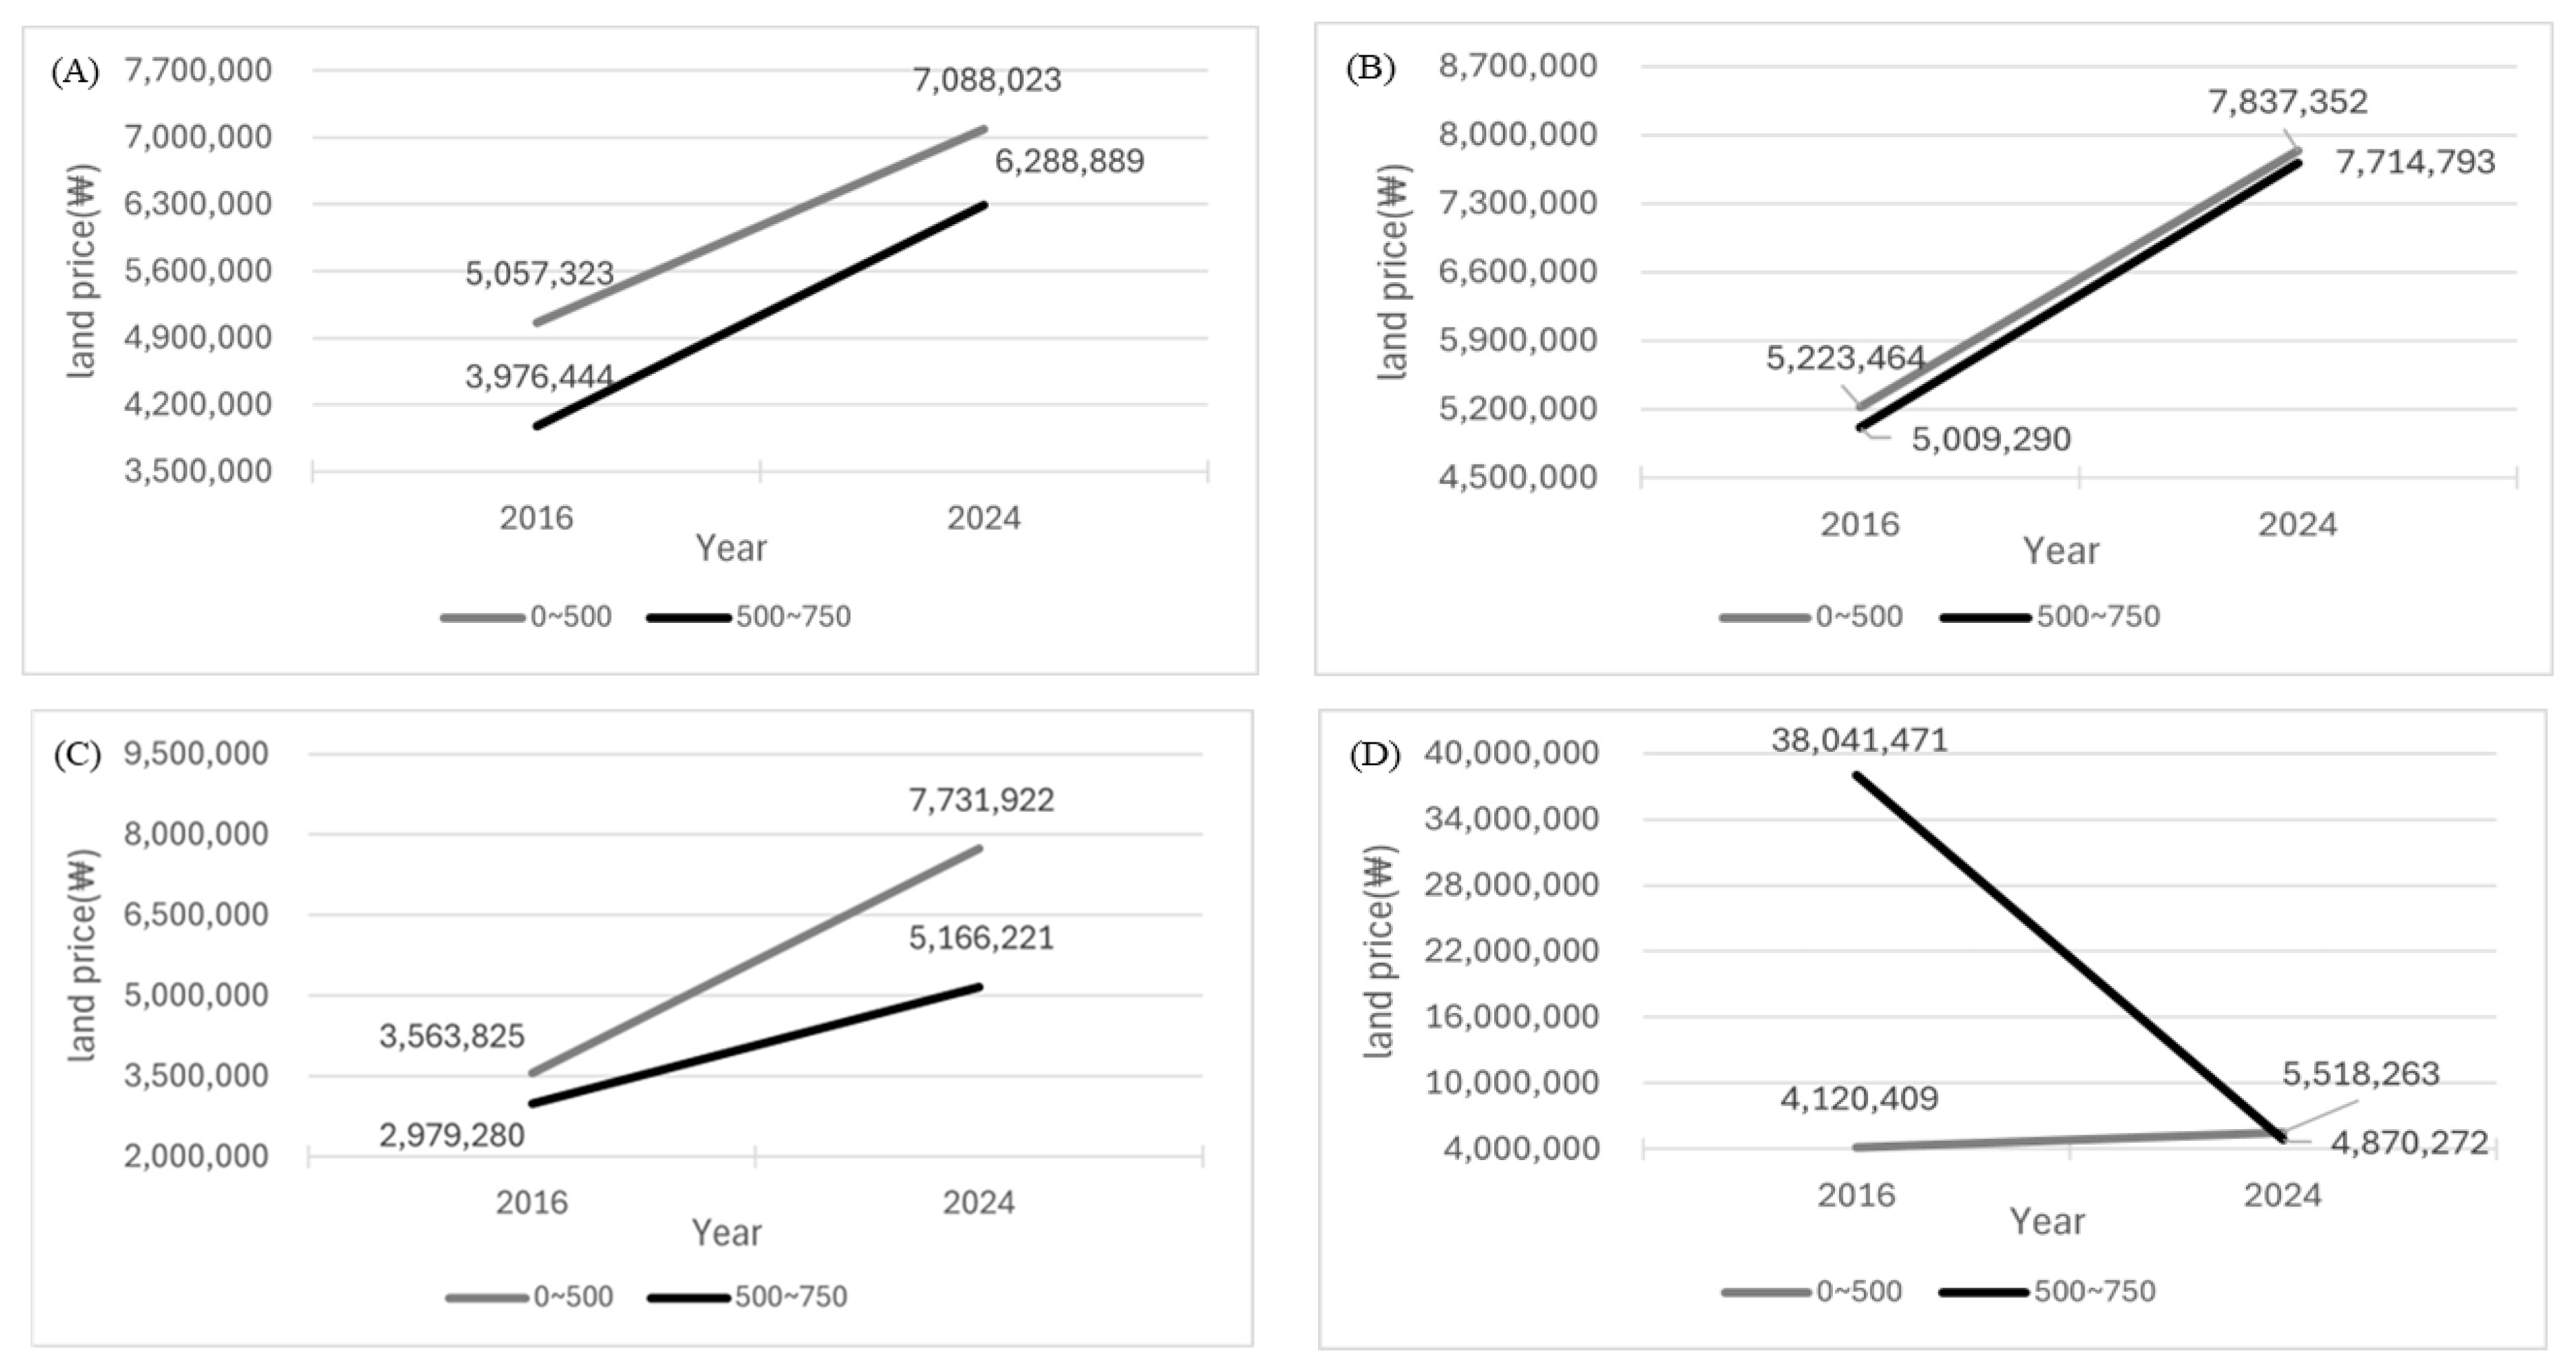
Section 7.4 examines within-station influence-area spatial heterogeneity by comparing land-price changes between the inner buffer (0–500 m) and the outer ring (500–750 m) in 2024 relative to the 2016 baseline. The inner–outer contrasts are statistically supported across transfer types (Table 19), and the magnitude and direction of significant differences are summarized in Figure 22 and Figure 23.
Table 19.
Significance probability for DID analysis results between 0–500 m radius and 500–750 m radius (p value).
Figure 22.
Significant standardized DID coefficients (β) for land-price changes between 0–500 m and 500–750 m.
Figure 23.
Statistically significant DID analysis results for land price fluctuations between 0–500 m radius and 500–750 m radius (A)Type 3.2, (B)Type 3.3, (C)Type 3.4, (D) Type 4.
The results show that inner and outer zones can exhibit systematically different land-price dynamics depending on transfer configuration. For Types 3-2 and 3-3, land-price changes are larger in the outer ring than in the inner buffer, indicating that price responses are not necessarily concentrated only in the immediate station vicinity. In contrast, Type 3-4 and Type 4 display a relative decline in the outer ring compared with the inner area, suggesting that high-order transfer environments may exhibit more concentrated or saturated effects near the core station influence area. Overall, these findings highlight that a single catchment-average measure may fail to capture important within-station influence-area variation and that core-versus-ring patterns differ by transfer type.
8. Conclusions
This study examines whether transfer connectivity is associated with differences in commercial-district composition, active population agglomeration, and land-price patterns within 0–500 m station influence areas across Seoul. By classifying 298 stations in Seoul into distinct transfer types—single-line non-transfer subway stations, subway-subway transfer hubs, and subway-railway transfer hubs—this research provides empirical evidence of how transfer hierarchy shapes spatial and economic agglomeration in one of the world’s densest urban rail networks.
The results revealed clear hierarchical differences across station types. Developed Commercial Areas were substantially more concentrated within transfer hub areas than in the city as a whole, demonstrating that higher accessibility fosters the clustering of large-scale retail and service functions. Subway-subway and subway-railway transfer hubs both showed enhanced commercial concentration compared to non-transfer stations, although the magnitude and form differed. While multi-line subway hubs attracted large-scale commercial clusters, subway–railway hubs were more closely associated with mixed neighborhood and market-type commercial patterns. By contrast, Commercial Alley Areas and Traditional Market Areas did not increase to the same extent, suggesting that small-scale retail activity is more closely related to local urban morphology and resident-based demand than to regional accessibility.
The active population analysis also confirmed a strong relationship between transfer complexity and population concentration. Within a 50 m × 50 m grid, the mean active population per grid cell density was approximately 1520 persons near single-line stations, 1969 near subway-subway transfer hubs, and 1637 near subway-railway transfer hubs, with statistically significant differences (p ≤ 0.05). These results indicate that multi-line transfer hubs function as focal nodes where human mobility, commercial activity, and economic interaction are most densely concentrated. Agglomeration around transfer hubs thus reflects not only physical clustering but also behavioral concentration associated with multi-directional trip generation.
Land price dynamics further demonstrated the differentiated impact of transfer levels. Using DID analysis from 2016 to 2024, the study found subway-subway transfer hubs—particularly those connecting three or more lines—showed statistically significant increases in land prices compared to single-line stations, whereas subway-to-railway hubs exhibited relatively stable trends. Robustness and sensitivity checks using alternative station influence-area specifications suggest that these qualitative patterns are stable with respect to influence-area definition in Seoul’s dense network, including a core 0–300 m buffer analysis, an overlapping-influence-area subsample, and an inner-versus-outer comparison (0–500 m vs. 500–750 m) for 2024. Interestingly, land price growth was sometimes higher in the outer 500–750 m band than within the inner 0–500 m zone, implying that TOD influence areas extend beyond conventional station perimeters. These spatial patterns reaffirm that accessibility-driven agglomeration translates into tangible economic value, although saturation and overlapping catchment effects may moderate the extent of land price appreciation. Accordingly, the DID estimates are interpreted as differential trends across station-area groups associated with transfer connectivity rather than as definitive causal effects attributable to a single mechanism.
Overall, the findings support core propositions of urban agglomeration theory by demonstrating that enhanced connectivity intensifies economic clustering and population concentration, but in differentiated ways depending on transfer hierarchy. In the context of Seoul, a polycentric metropolitan structure, multi-line subway hubs amplify urban centrality and land value. In contrast, railway interchanges may extend the spatial influence more horizontally, reflecting intercity accessibility. These nuanced effects underscore the need for typology-based station area planning within the broader TOD framework. For example, subway-to-subway hubs should prioritize integrated high-density, mixed-use redevelopment and pedestrian circulation management, while single-line stations can be strengthened through community-based commercial revitalization and pedestrian-oriented design. Subway–railway hubs, on the other hand, should serve as metropolitan interchange nodes that balance intercity accessibility with local land-use coordination.
Methodologically, this study contributes to urban spatial analysis by integrating multi-source datasets—commercial districts, mobile-derived active population, and government-assessed land prices—into a unified empirical framework. The fine-grained reallocation of mobile activity data using building-level floor area, coupled with DID-based trend estimation, offers a replicable approach for quantifying agglomeration effects in non-experimental urban environments. This methodological integration not only enhances analytical precision but also provides a foundation for data-driven planning of transit-oriented development in dense metropolitan settings. In particular, the combined use of station-typology comparisons and overlap-aware station influence-area checks provides a practical template for megacities where station catchments frequently intersect.
Nevertheless, several limitations should be noted. The commercial-district and active-population indicators are measured at a fixed time point, and unobserved local time-varying factors may still influence land-price dynamics despite the DID design. Detailed limitations and future research directions are discussed in Section 9.
9. Limitations and Future Directions
Despite the contributions of this study, several limitations should be noted. First, commercial-district indicators and mobile-derived active population were measured at a single time point, whereas land prices were analyzed longitudinally (2016–2024); thus, the three empirical components should be interpreted as complementary evidence rather than directly comparable time-series measures. Second, station locations and surrounding urban conditions are not randomly assigned, so the DID estimates are interpreted as differential trends associated with transfer connectivity rather than definitive causal effects. Third, results for high-order transfer hubs should be interpreted cautiously due to limited samples in some categories. Finally, although we assessed sensitivity to station influence-area delineation and overlap conditions for land prices, residual local time-varying confounding (e.g., redevelopment, zoning changes, and years since line opening) cannot be fully ruled out in a citywide setting. Future research should incorporate multi-temporal mobility data and richer local covariates and extend comparative applications to other megacities.
Author Contributions
Conceptualization, A.K. and J.K.; Methodology, A.K., H.K. and J.K.; Data curation, A.K. and H.K.; Formal analysis, H.K. and A.K.; Investigation, A.K. and H.K.; Writing—original draft preparation, A.K. and H.K.; Writing—review and editing, A.K., H.K., J.K. and N.U.; Visualization, A.K. and H.K.; Supervision, J.K. and N.U.; Project administration, J.K.; Funding acquisition, J.K. All authors have read and agreed to the published version of the manuscript.
Funding
This work was supported by the National Research Foundation of Korea (NRF) grant funded by the Korean government (MSIT) (RS-2025-00558731).
Institutional Review Board Statement
Not applicable.
Informed Consent Statement
Not applicable.
Data Availability Statement
Publicly available datasets were analyzed in this study. Source data are available from the Seoul Open Data Plaza (https://data.seoul.go.kr/; accessed on 11 September 2024) and the VWorld Digital Twin Korea platform (https://www.vworld.kr/; accessed on 18 April 2025). The data were preprocessed for analysis (e.g., clipping to the study area and spatial reallocation/aggregation to a 50 m × 50 m grid). The derived dataset and the code used for processing are available from the corresponding author upon reasonable request.
Acknowledgments
This article extends our earlier 2023 EASTS conference proceedings paper by adding additional data, expanded analyses, and a fuller discussion of results.
Conflicts of Interest
The authors declare no conflicts of interest.
References
- Pagliara, F.; Preston, J.; Kim, J.H. Trade-offs between Transportation, House Price and Amenities in Residential Location Choice in Oxfordshire, UK. Int. J. Urban Sci. 2006, 10, 1–18. [Google Scholar] [CrossRef] [Scilit]
- Heo, C.M.; Kang, M.G. Impact of the multi-complex station development on the neighbouring commercial land price. Int. J. Urban Sci. 2012, 16, 37–47. [Google Scholar] [CrossRef] [Scilit]
- Okamoto, C.; Sato, Y. Impacts of high-speed rail construction on land prices in urban agglomerations: Evidence from Kyushu in Japan. J. Asian Econ. 2021, 76, 101364. [Google Scholar] [CrossRef] [Scilit]
- Su, S.; Zhang, H.; Wang, M.; Weng, M.; Kang, M. Transit-oriented development (TOD) typologies around metro station areas in urban China: A comparative analysis of five typical megacities for planning implications. J. Transp. Geogr. 2021, 90, 102939. [Google Scholar] [CrossRef] [Scilit]
- Lyu, G.; Bertolini, L.; Pfeffer, K. Developing a TOD typology for Beijing metro station areas. J. Transp. Geogr. 2016, 55, 40–50. [Google Scholar] [CrossRef] [Scilit]
- Hwang, J.Y.; Kim, J.H. A Study on the Typology and Management Strategy of the Subway Station Area in Busan Metropolitan City, Korea. J. Korea Plan. Assoc. 2024, 59, 18–30. [Google Scholar] [CrossRef] [Scilit]
- Kim, H.B.; Ahn, W.Y.; Lee, S.H. Importance Factor Analysis on Transfer Facilities by Considering Characteristics of Urban Railway Station. J. Korean Soc. Transp. 2014, 32, 487–496. [Google Scholar] [CrossRef] [Scilit]
- Lee, S.; Lee, S. Transport Policy Directions Based on Travel Pattern Analysis in the Seoul Metropolitan Area. Int. J. Urban Sci. 2005, 9, 40–48. [Google Scholar] [CrossRef] [Scilit]
- Kim, H.B. Analysis of User Satisfaction by Types of Subway Platforms and Transit Stations. J. Korean Soc. Civ. Eng. 2015, 35, 437–445. [Google Scholar] [CrossRef] [Scilit]
- Kim, H.; Kim, J.; Yoo, S.; Uno, N. Exploring Agglomeration Pattern According Transfer of Urban Rail System in Seoul, Korea. In Proceedings of the Eastern Asia Society for Transportation Studies, Shah Alam, Malaysia, 4–7 September 2023. [Google Scholar]
- Zemp, S.; Stauffacher, M.; Lang, D.J.; Scholz, R.W. Classifying railway stations for strategic transport and land use planning: Context matters! J. Transp. Geogr. 2011, 19, 670–679. [Google Scholar] [CrossRef] [Scilit]
- Suzuki, H.; Cervero, R.; Iuchi, K. Transforming Cities with Transit: Transit and Land-Use Integration for Sustainable Urban Development; The World Bank: Washington, DC, USA, 2013. [Google Scholar] [CrossRef] [Scilit]
- Hong, S.P.; Yi, C.H.; Lee, S.I. Analyzing the Land-use Pattern of the Station Area of the Seoul Metropolitan Railway by Based on the Network Centrality. J. Korea Plan. Assoc. 2015, 50, 209–226. [Google Scholar] [CrossRef] [Scilit]
- Kang, J.W.; Sung, H.G. Impact on Land Use Change in Rail Station Areas Using the Triple Difference Regression Modeling: Focusing on the Ten-Years Operation since Opening of Subway Line 1 in the Daejeon metropolitan city. J. Korea Plan. Assoc. 2018, 53, 171–183. [Google Scholar] [CrossRef] [Scilit]
- Xu, T.; Zhang, M.; Aditjandra, P.T. The impact of urban rail transit on commercial property value: New evidence from Wuhan, China. Transp. Res. Part A Policy Pract. 2016, 91, 223–235. [Google Scholar] [CrossRef] [Scilit]
- Bhattacharjee, S.; Goetz, A.R. The rail transit system and land use change in the Denver metro region. J. Transp. Geogr. 2016, 54, 440–450. [Google Scholar] [CrossRef] [Scilit]
- Ding, C.; Cao, X.; Liu, C. How does the station-area built environment influence Metrorail ridership? Using gradient boosting decision trees to identify non-linear thresholds. J. Transp. Geogr. 2019, 77, 70–78. [Google Scholar] [CrossRef] [Scilit]
- Hong, S.P. The Land Price Impact Analysis near the Station Area due to Network Accessibility Improvement after the Ui-sinseol Light Rail Transit Opening. J. Korea Plan. Assoc. 2023, 58, 114–127. [Google Scholar] [CrossRef] [Scilit]
- Lim, S.J.; Park, J.T.; Kim, T.H. Comparative Study on the Characteristics of Public Transport Users According to the Types of Transit Station Influence Areas in Seoul’s Urban Railway’s. J. Korean Soc. Railw. 2013, 16, 129–137. [Google Scholar] [CrossRef] [Scilit]
- Kim, H.S.; Nam, J.H. The size of the station influence area in Seoul, Korea: Based on the survey of users of seven stations. Int. J. Urban Sci. 2013, 17, 331–349. [Google Scholar] [CrossRef] [Scilit]
- AlQuhtani, S.; Anjomani, A. Do Rail Transit Stations Affect the Population Density Changes around Them? The Case of Dallas-Fort Worth Metropolitan Area. Sustainability 2021, 13, 3355. [Google Scholar] [CrossRef] [Scilit]
- Fang, W.; Zhao, L.; Pengcheng, X.; Anrong, D. High-speed railway development and its impact on urban economy and population: A case study of nine provinces along the Yellow River, China. Sustain. Cities Soc. 2022, 87, 104172. [Google Scholar] [CrossRef] [Scilit]
- Kim, K.T.; Kim, J.H. An Observation on the SocioeconomicSpatial Structure of Industry near High-Speed Rail Station-Area with Consideration for Proximity to the Station. Korean Public Adm. Q. 2018, 30, 627–650. [Google Scholar] [CrossRef] [Scilit]
- Debrezion, G.; Pels, E.; Rietveld, P. The Impact of Railway Stations on Residential and Commercial Property Value: A Meta-analysis. J. Real Estate Financ. Econ. 2007, 35, 161–180. [Google Scholar] [CrossRef] [Scilit]
- Bowes, D.R.; Ihlanfeldt, K.R. Identifying the Impacts of Rail Transit Stations on Residential Property Values. J. Urban Econ. 2001, 50, 1–25. [Google Scholar] [CrossRef] [Scilit]
- Choi, U.J.; Kim, J.H. Impact of Large-scale Transportation Infrastructure Plan on the Housing Markets-Focus on GTX, Housing Consumer Confidence Index and Sales Prices. J. Digit. Converg. 2021, 19, 9–18. [Google Scholar] [CrossRef]
- Lee, C.M.; Ryu, K.M.; Choi, K.C.; Kim, J.Y. The dynamic effects of subway network expansion on housing rental prices using a repeat sales model. Int. J. Urban Sci. 2018, 22, 529–545. [Google Scholar] [CrossRef] [Scilit]
- Morikawa, S.; Aoyama, M.; Kato, H. Development of railway station plazas: Impact on land prices of surrounding areas. Transp. Policy 2023, 142, 1–14. [Google Scholar] [CrossRef] [Scilit]
- Rungskunroch, P.; Yang, Y.; Kaewunruen, S. Does High-Speed Rail Influence Urban Dynamics and Land Pricing? Sustainability 2020, 12, 3012. [Google Scholar] [CrossRef] [Scilit]
- Lahoorpoor, B.; Levinson, D.M. Catchment if you can: The effect of station entrance and exit locations on accessibility. J. Transp. Geogr. 2020, 82, 102556. [Google Scholar] [CrossRef] [Scilit]
- Lahoorpoor, B.; Rayaprolu, H.; Wu, H.; Levinson, D.M. Access-oriented design? Disentangling the effect of land use and transport network on accessibility. Transp. Res. Interdiscip. Perspect. 2022, 13, 100536. [Google Scholar] [CrossRef] [Scilit]
- Kim, N.J. Estimating the Subway Station Influence Area by the Distribution of Walking Distance and the Changes of Housing Sale Prices–Focused on the Subway Stations of Jungang Line in Gury and Namyangju City. J. Korea Plan. Assoc. 2012, 47, 29–38. [Google Scholar]
- Lee, Y.S.; Sohn, D.W. A Relationship Analysis between Subway Transit Demand and Urban Spatial Characteristics in the Subway Station Area. J. Urban Des. Inst. Korea 2012, 13, 23–32. [Google Scholar]
- Lee, E.A.; Shon, E.Y.; Kim, S.J.; Hwang, B.Y. Estimating Urban Railway Demand Based on Catchment Area. Korea Spat. Plan. Rev. 2013, 77, 189–203. [Google Scholar] [CrossRef] [Scilit]
- Kim, S.Y.; Eom, S.Y.; Lee, M.H. A Study on Spatial Range of Seoul Subway Station Area on Characteristics of Land Use. J. Korea Plan. Assoc. 2013, 48, 23–37. [Google Scholar]
- Shin, J.B.; Kim, C.H.; Lee, C.S. Land Use Changes around Urban Railway Stations in Integrated Urban-Rural Cities: A Case Study of the Gyeonggang Line Stations in Gwangju City, Gyeonggi Province. Land Hous. Rev. 2024, 15, 61–77. [Google Scholar] [CrossRef]
- Zheng, X.; Chen, X.; Yuan, Z. Exploring the spatial spillover effect of home purchase restrictions on residential land prices based on the difference-in-differences approach: Evidence from 195 Chinese cities. Land Use Policy 2021, 102, 105236. [Google Scholar] [CrossRef] [Scilit]
- Suh, J.; Chung, H.; Cho, C.; Kim, J. A comparative study of Difference-in-Differences (DID), Synthetic Control Method (SCM), and Synthetic Difference-in-Differences (SDID): Effects of early-morning delivery. J. Channel Retail. 2024, 29, 121–148. [Google Scholar] [CrossRef] [Scilit]

Disclaimer/Publisher’s Note: The statements, opinions and data contained in all publications are solely those of the individual author(s) and contributor(s) and not of MDPI and/or the editor(s). MDPI and/or the editor(s) disclaim responsibility for any injury to people or property resulting from any ideas, methods, instructions or products referred to in the content. |
© 2026 by the authors. Licensee MDPI, Basel, Switzerland. This article is an open access article distributed under the terms and conditions of the Creative Commons Attribution (CC BY) license.