


Abstract
Rapid, objective, and accurate crop damage assessment is essential to minimizing farmers’ financial loss and enabling early settlement of crop insurance. The present study proposes a framework for assessing the impact of heavy rainfall-induced flood on Kharif rice over West Bengal under a satellite-based crop insurance program. Daily actual and normal rainfall data from India Meteorological Department (IMD) were used to study the pattern and magnitude of rainfall to confirm the heavy rainfall incidence over affected districts of West Bengal. The Sentinel-1-derived temporal VH backscatter validated using ground observations was utilized to identify the rice crop areas. The backscatter difference images between pre-and post-peril periods, along with threshold and histogram approaches, were adopted to discriminate the inundated areas from non-inundated areas. The information on the inundated rice crop was derived by intersecting the rice layer with the inundated area. The behavior of temporal backscatter profiles, i.e., pre- and post-peril periods, was analyzed to ascertain the impacts of flood-induced inundation on rice crop health. Further, the phenological information during floods was identified from transplanting periods in backscatter profiles, and damage severity was assessed by integrating inundation, the affected area, and rice crop stage information. The outcomes, validated with ~1500 crop loss surveys (CLSs), show that the framework is effective and useful for crop insurance.
1. Introduction
Agriculture remains one of the major drivers for the global economy and plays a pivotal role in the food security of a nation. Over half of the total geographical area of India is cultivated, and 54.6% of the total workforce is engaged in agriculture and related activities. A significant portion of cultivable land depends on rainfall, making it vulnerable to changes in local climate conditions [1,2,3,4]. The effects of climate change are projected to intensify and become more frequent [5,6]. Moreover, a number of studies have highlighted the negative impact of climate change on agriculture and food security [7] due to the increased frequency of extreme weather events like floods, droughts, heatwaves, etc. [5,8]. The number of studies has increased, showing that there could be a decrease in yield in response to extreme weather events [9,10,11]. Weather-dependent farming, due to the increased risk under a changing climate scenario and projected crop loss, highlights the critical need for crop insurance to minimize risks and promote sustainable farming [12,13].
Crop insurance serves as an indispensable tool for the farming community, shielding farmers from the devastating financial impact of crop losses [14]. This protection goes beyond mere compensation, empowering farmers to swiftly recover, facilitating reinvestment in agriculture, ensuring uninterrupted agricultural pursuits, fostering sustainable agricultural practices, etc. [15]. To mitigate various aspects of crop risks and ensure subsequent reimbursement, there exist several types of crop insurance models, which are mainly yield-based and revenue-based policies. Yield-based models cover the losses that arise due to weather-induced reduced yield, whereas revenue-based models protect against income declines caused by both production losses and price fluctuations [16]. However, crop insurance schemes vary widely across countries, and are influenced by factors such as agricultural systems, risk profiles and government support. Developed countries often have robust programs. For Example, the United States’ Federal Crop Insurance Program (FCIP) offers comprehensive coverage through yield-based and revenue-based insurance [17]. Canada’s AgriInsurance Program provides multi-peril coverage for various crops, with costs shared between farmers and the government [18]. In developing countries, index-based insurance and government-subsidized programs are gaining traction, particularly among smallholder farmers. In China, crop insurance includes both traditional yield-based policies and innovative weather-index insurance, with significant government subsidies [19]. In Europe, agricultural insurance systems vary, with countries like Germany relying on private, unsubsidized insurance, while Spain and Italy offer heavily subsidized programs through public–private partnerships [20]. Australia provides drought-specific insurance and supports farmers through its Rural Assistance Scheme. In India, crop insurance schemes are implemented both by the central and state governments. The country primarily offers four crop insurance schemes, viz., the Pradhan Mantri Fasal Bima Yojana (PMFBY), the Weather-Based Crop Insurance Scheme (WBCIS), the Coconut Palm Insurance Scheme (CPIS), and the Pilot Unified Package Insurance Scheme (UPIS).
West Bengal, a region rich in rice biodiversity and often called the “rice bowl of India,” is situated in a fragile geographical area, covering nearly 53% of the total agricultural land [4,21]. Kharif season, i.e., June to December, is the main season for rice cultivation in this area, contributing approximately 70% of the state’s total rice production [4,22,23]. However, a major challenge during the wet season is the widespread occurrence of flooding, waterlogging or submergence due to heavy rainfall, making agriculture in these regions highly challenging, risky, and economically unviable for farmers [24,25]. Furthermore, floods, as one of the most common [26] and costliest [27] of natural disasters, can have sudden impact not only on agriculture but on life in the surrounding area. In West Bengal, the Bangla Sasya Bima (BSB) scheme has been implemented as crop insurance since 2019 [28]. It is a technology-driven program that financially assists farmers, covering a range of crops, including food crops, oilseeds, and commercial crops, against various production risks such as prevented sowing, damage to standing crops due to mid-season adversity, seasonal crop loss, and post-harvest losses. The risks posed by non-preventable factors like droughts, floods, pests, and localized disasters can be addressed under this scheme [29,30].
Geospatial technology, leveraging satellite imagery and weather data, is a crucial component of the technology-driven crop insurance scheme. This technology is a key tool in agricultural disaster management, offering critical resources and insights for planning, execution, and recovery [31,32]. Moreover, with the advent of freely available moderate-resolution satellite data, both optical and synthetic aperture radar (SAR), the monitoring and assessment of waterlogged and flooded areas become effective and less time-consuming. Remote sensing-based flood or waterlogged area estimations are being carried out worldwide [26,27,33,34,35], including in India [36,37,38] and specifically for West Bengal [39,40]. The United Nations’ platform Space-based Information for Disaster Management and Emergency Response (UN-SPIDER Knowledge Portal, n.d.) has provided general recommendations and best practices for detecting and monitoring floods, with an adjustable threshold approach based on regional suitability. The advent of cloud-based computing (Google Earth Engine, Microsoft Planetary Computer, etc.) has also enabled rapid assessment of the flood or waterlogging [26,35]. Moreover, the impacts of river flooding on crops have been studied by several researchers [31,33,41].
Despite several remote sensing-based flood assessment studies, a detailed framework considering the extent of waterlogging or flooding due to heavy rainfall, identification of crop stages, and subsequent assessment of crop recovery and loss is limited. Most existing approaches focus primarily on flood extent mapping [42], without linking inundation mapping with phenology-based analysis and damage severity, which is crucial for insurance decision making. While remote sensing-based flood assessments exist, studies integrating crop phenology into severity classification to map crop loss for insurance applications remain scarce. The present study attempts to provide a framework to address the heavy rainfall-induced mid-season adversity of rice crop by utilizing phenological analysis using satellite-based temporal backscatter and ground-based information.
2. Study Area
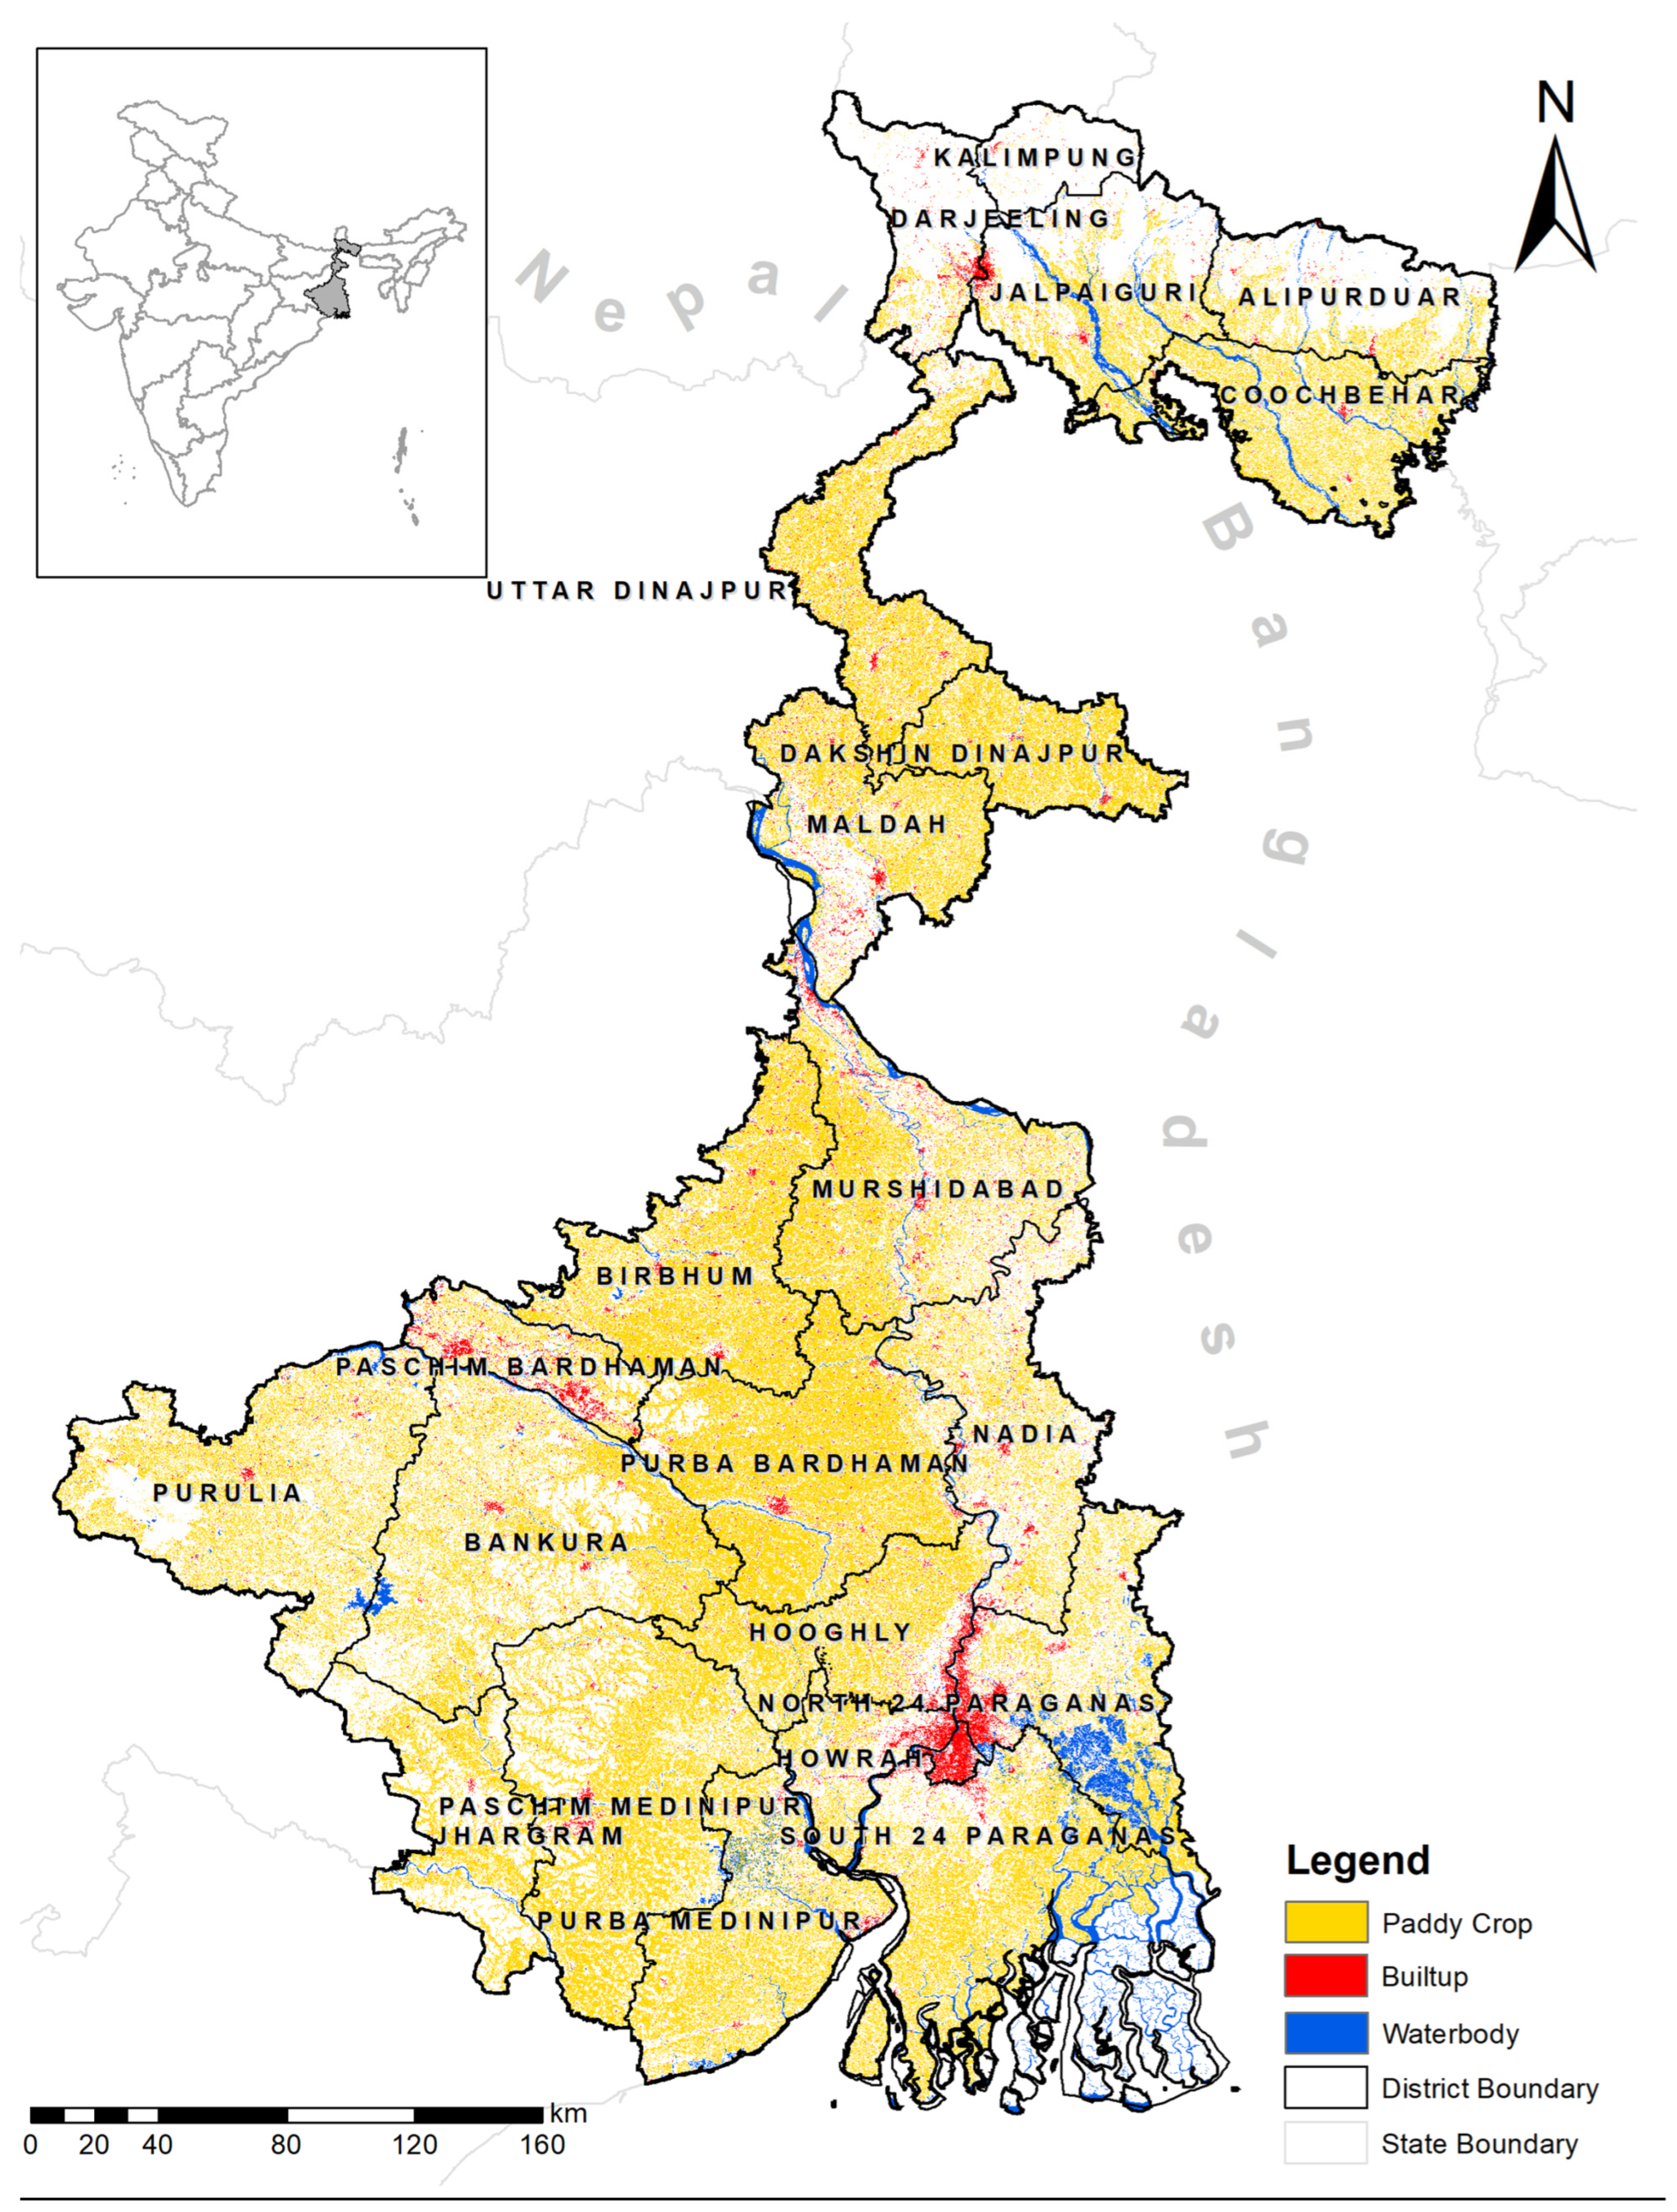
West Bengal is situated in eastern India, spanning latitudes 21°31′ to 27°14′ in the north and longitudes 85°91′ to 89° in the east. It borders Bhutan and Sikkim to the north, Bangladesh and Assam to the east, the Bay of Bengal to the south, Orissa to the southwest, Nepal to the northwest, and Bihar to the west (Figure 1). The state is located in a fertile delta, featuring three agro-climatic zones (Lower Gangetic Plain, Eastern Himalaya, Eastern Plateau and Hill region) with high landscape diversity. The state relies heavily on monsoon rains with an average annual of 195.98 cm [21,43,44]. Rainfall varies from 2500 to 3500 mm in the northern hills to 1100–1400 mm in the lateritic zone, often causing waterlogging and flood risk. Temperatures range from 16 to 26 °C (min) to 30–40 °C (max) during March–October. The state has diverse soils, with fertile alluvial soils in the delta and Ganga River floodplains supporting extensive rice cultivation [21,44]. Rice is the dominant Kharif crop, comprising the majority of the state’s food grain production.
Figure 1.
Study area: West Bengal with district boundaries and Kharif Rice, 2024.
3. Datasets
3.1. Rainfall Data Analysis
Heavy rainfall over different parts of West Bengal was reported during 12–20 September 2024. As per ground reports, the affected districts were Birbhum, Hooghly, Howrah, Murshidabad, Nadia, North 24 Parganas, Paschim Bardhaman, Paschim Medinipur, Purba Bardhaman, and Purba Medinipur. It was reported that the heavy rainfall and subsequent water released from Damodar Valley Corporation (DVC) led to crop submergence in many parts of the districts.
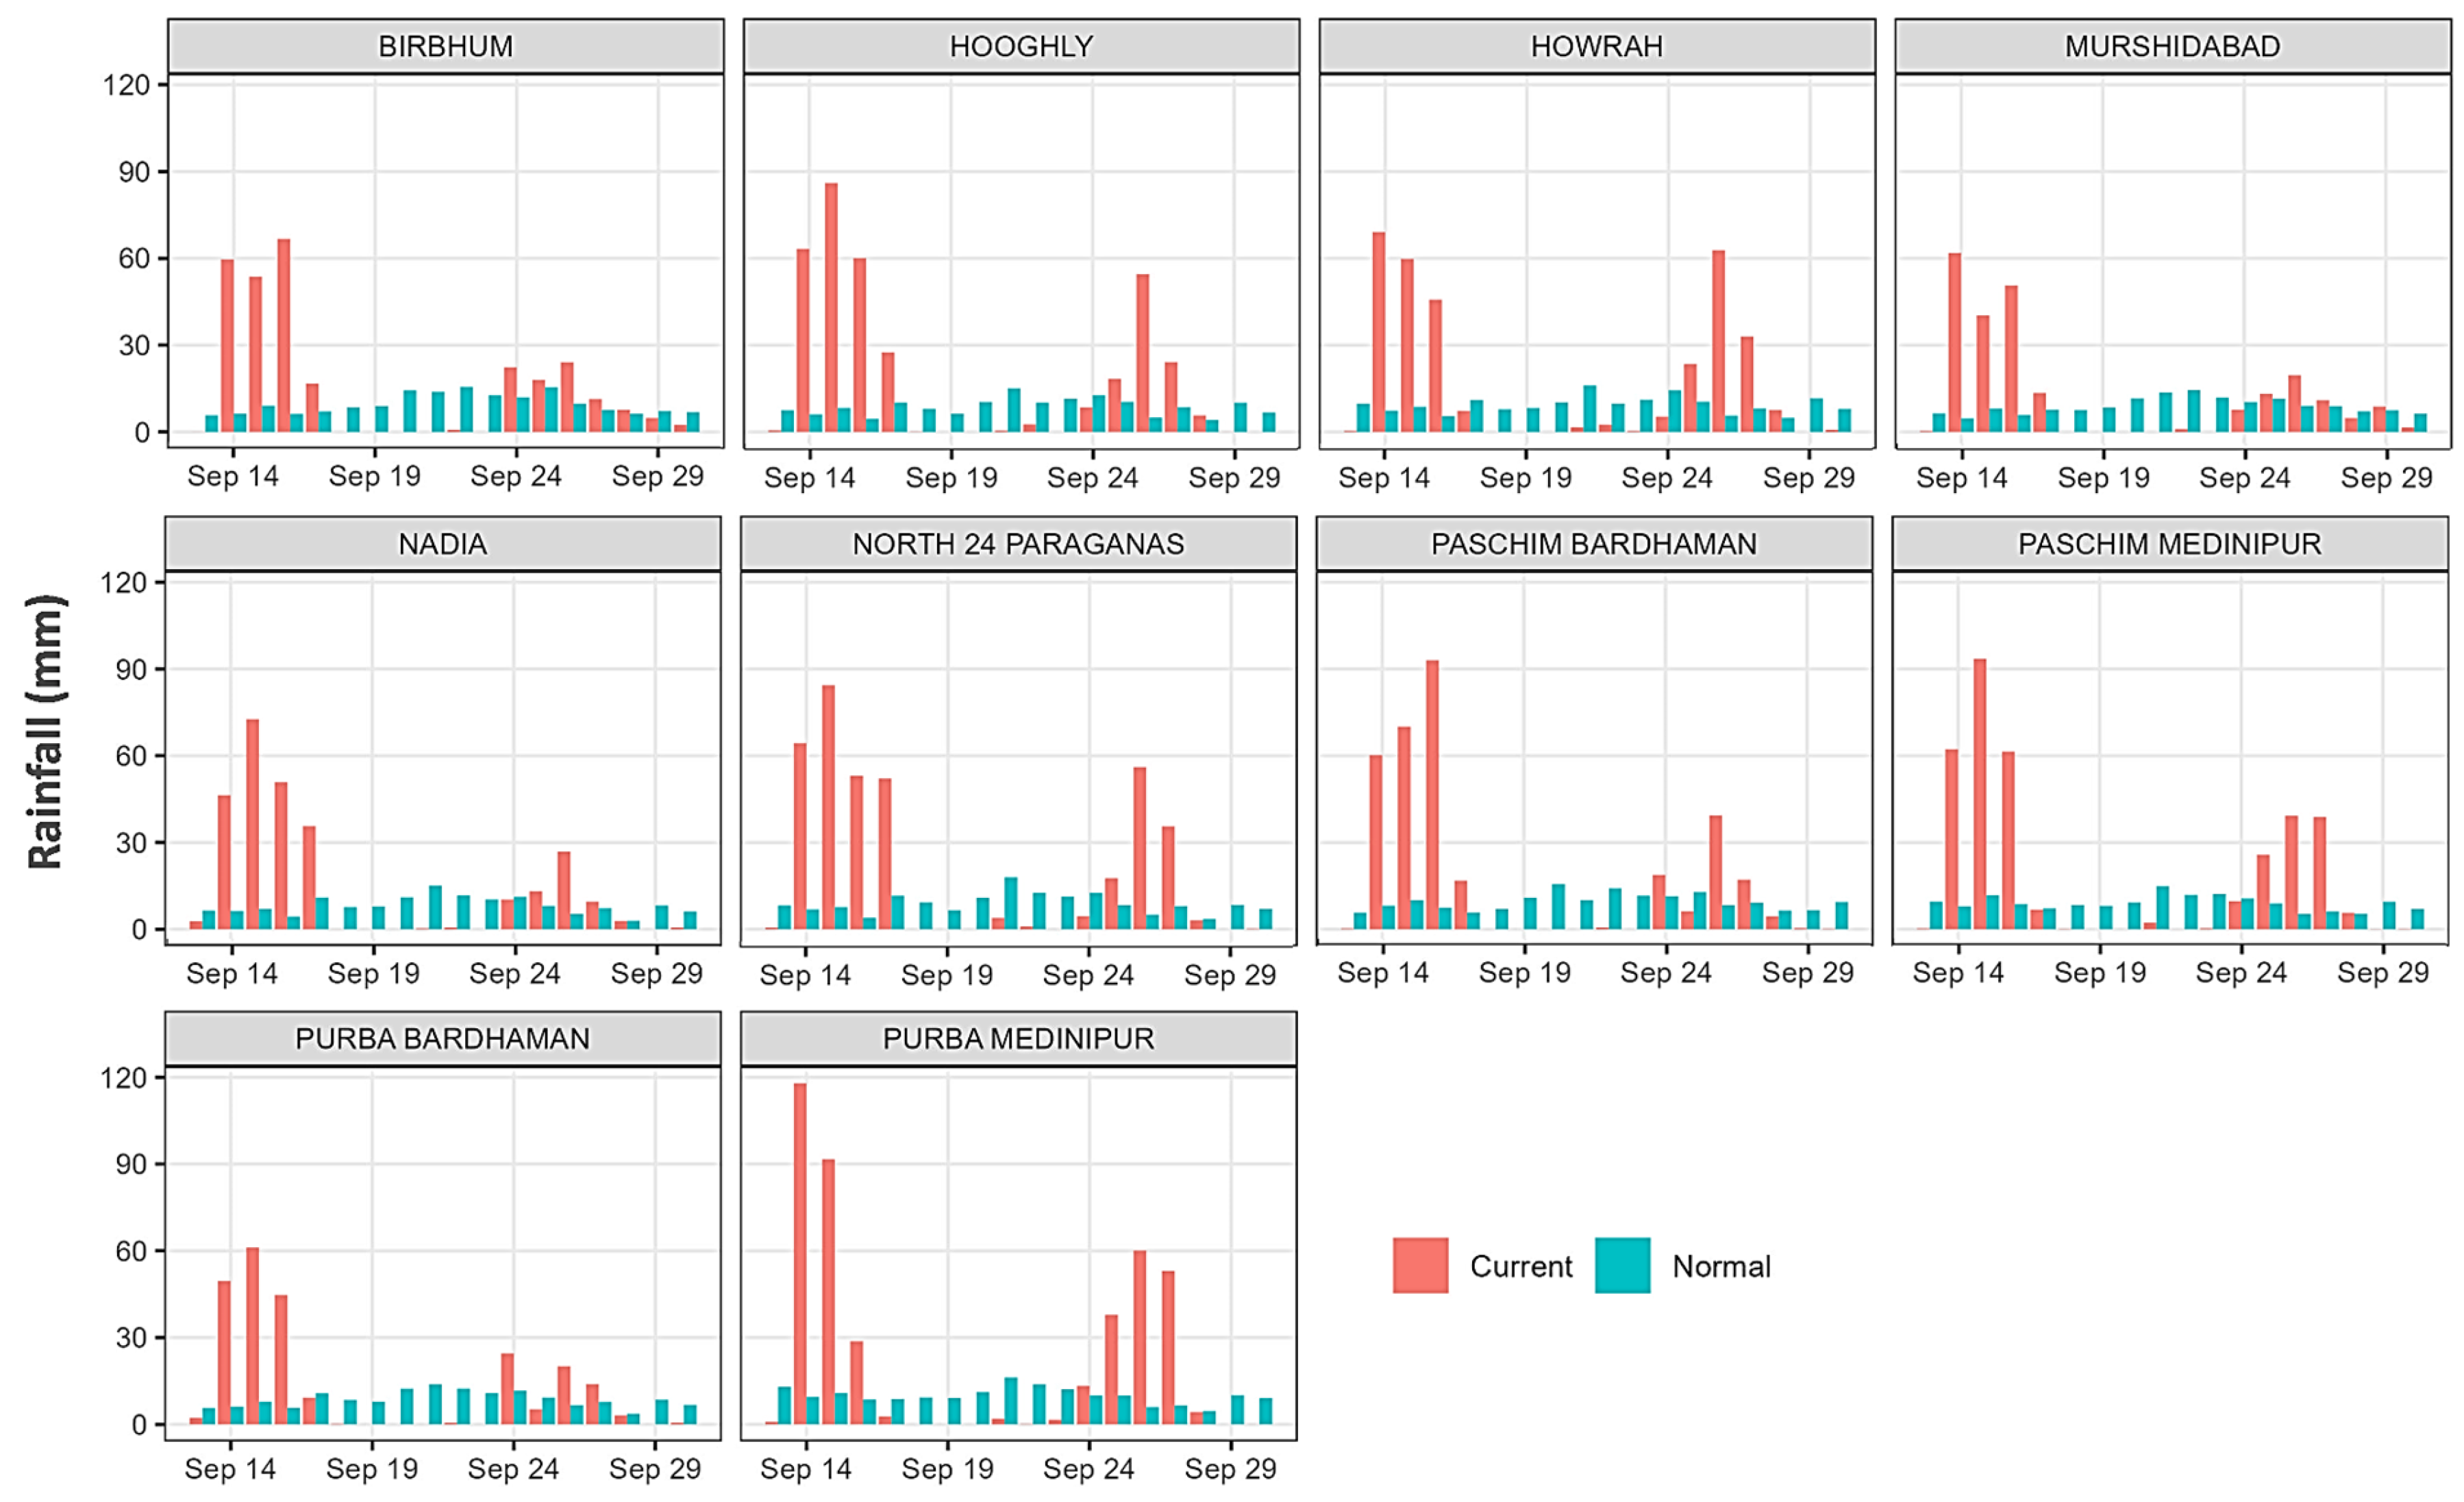
This research utilizes daily rainfall data from the Indian Meteorological Department (IMD) [45] to assess the rainfall depth (mm). This high-resolution gridded dataset, compiled from observations made at weather stations, offers daily rainfall measurements at a 0.25° spatial resolution. The daily rainfall during 12th to end of September was analyzed along with long-term daily normal rainfall (1993–2023) to confirm the occurrence of heavy rainfall events at the district level (Figure 2). Notable rainfall peaks were observed, particularly between 14 and 18 September in the selected districts, where current rainfall reached up to three times the normal values. For instance, Hooghly district received ~110 mm on 15 September compared to a normal measurement of ~35 mm, while Birbhum recorded ~95 mm rainfall compared to a norm of ~25 mm. Murshidabad accumulated ~300 mm rainfall during this period, exceeding the long-term average by ~180 mm. Similar anomalies were seen in Paschim Bardhaman and Nadia, where the total rainfall was more than double the normal amount (Figure 2). The frequent and widespread occurrence of these anomalies confirms a period of excess rainfall throughout mid-to-late September (Figure 2). The high rainfall dates along with Government-referenced flood events information were identified as peril dates (Table 1).
Figure 2.
Distribution of actual and normal rainfall in selected districts of West Bengal during parts of September 2024.
Table 1.
District-specific peril dates along with dates of satellite pass.
3.2. Satellite Data Preparation
Sentinel-1 refers to a pair of polar orbiting satellites, i.e., Sentinel-1A and Sentinel-1B, equipped with C-band synthetic aperture radar (SAR) sensors for scanning the Earth’s surface systematically in ascending and descending modes [46,47]. The data is collected in interferometric wide (IW) swath mode and provided in a Single-Look Complex (SLC) format. The data includes both VV (vertical transmit and receive) and VH (vertical transmit and horizontal receive) polarizations [48]. In the present study, Sentinel-1 SAR Ground Range-Detected (GRD) data in interferometric wide (IW) mode, specifically the Vertical–Horizontal (VH) polarization band with a 10 m resolution, acquired during July to October 2024, was utilized for analysis. The refined Lee algorithm was adopted for spackle filtering. The VH backscatter data was composited at fortnightly intervals for effective crop classification. However, for inundated area identification and impact assessment, high temporal sensitivity was essential. Therefore, date-specific backscatter images were used to capture short-term changes in surface water and crop conditions, allowing precise identification of inundated pixels and evaluation of crop damage immediately after heavy rainfall events. The details of the district-specific peril dates, along with the dates of the satellite passes (both ascending and descending) used for the pre- and post-event analysis, are presented in Table 1.
4. Methodology
4.1. Rice Crop Area Delineation
The world cover agricultural dataset from ESA 2021 was utilized to confine the present analysis within the agricultural area only (https://worldcover2021.esa.int/, accessed on 12 June 2024). Ground truth data comprising crop type, stage, and health information was collected at around 75,000 locations over the entire study area. The ground data were filtered by analyzing the temporal VH–backscatter profiles by considering factors like controlled flooding stages, transplanting and growth phases, etc. The district-wise signature profiles for rice crop were generated based on the transplanting period, crop growth, etc., and the same information was used to classify the rice area using the Random Forest (RF) classification algorithm, configured with 100 decision trees (n_estimators = 100) and the Gini index as the splitting criterion. Model assessment was performed using the K-fold cross-validation method and classification accuracy assessment was performed through the standard matrix, i.e., overall accuracy and kappa coefficient. The rice crop map for Kharif 2024 is presented in Figure 1. The accuracy of the estimated rice crop acreage was evaluated using exclusive sets of ground truth points and the values were found to be more than 90% in most of the districts.
4.2. Inundation Area Mapping
As discussed earlier, the synthetic aperture radar (SAR) backscatter values can be effectively utilized for identifying inundated or flood pixels. The backscatter is strongly influenced by moisture levels, and during waterlogging or inundation, the values become very low. This phenomenon arises mainly due to specular reflection, where the incident radar waves reflect away from the sensor rather than coming back towards it [49,50,51], causing the area to appear very dark.
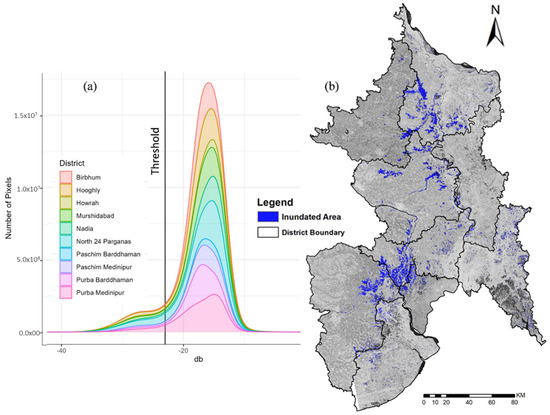
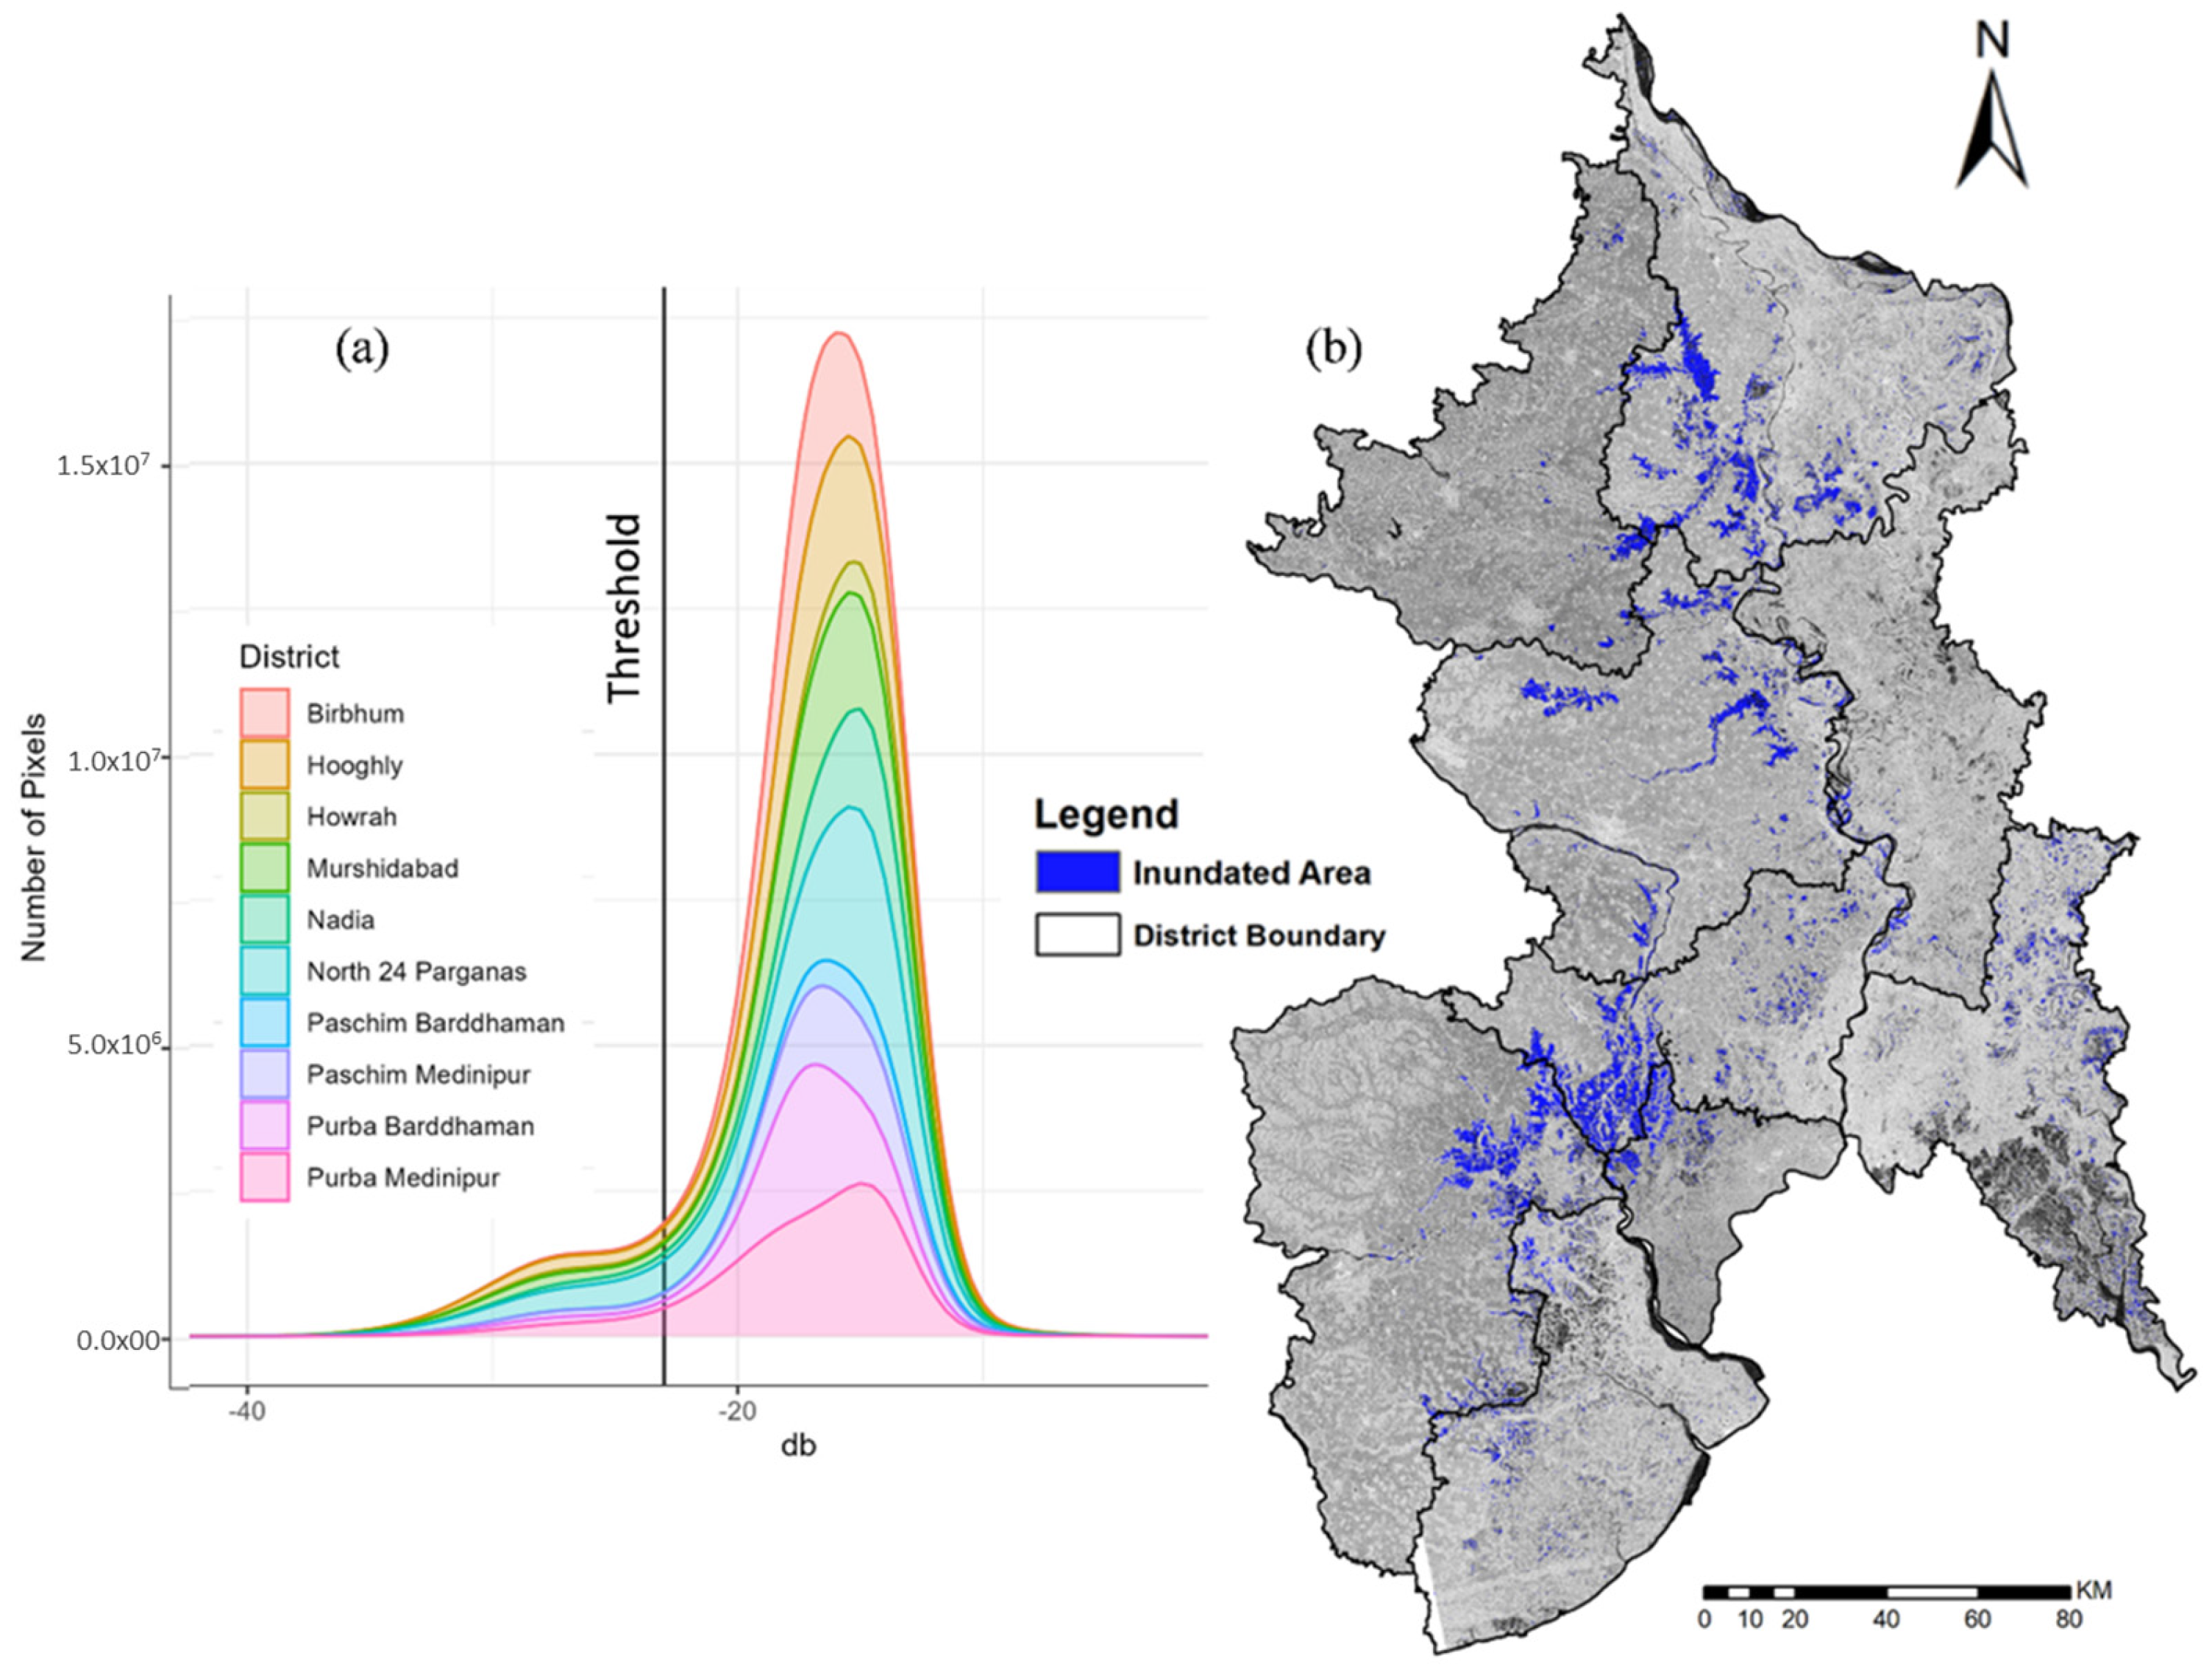
The change detection technique on pre- and post-peril backscatter was performed to detect the inundated areas based on backscatter difference values. Difference images were generated by dividing the pre- and post-event images and the pixels with values greater than 1.2 were identified as areas with a significant decrease in backscatter, indicative of inundation [52,53]. Moreover, a threshold-based approach, which typically relies on a bimodal image histogram, was employed on the post-peril backscatter images to detect the inundated pixels with better accuracy. This method assumes that the backscatter distribution of a scene containing both waterlogged and non-waterlogged pixels form a bimodal pattern, where the first peak corresponds to low backscatter (flooded/inundated areas) and the second peak corresponds to higher backscatter (non-flooded land). The threshold is derived at the valley point between the two peaks, which serves as an objective criterion for separating inundated and non-inundated pixels [51,54]. In the present study, the bimodal patterns of backscatter histograms (Figure 3a) for targeted districts were analyzed to estimate the threshold value for discriminating the boundaries between waterlogged pixels and those which were not waterlogged (Figure 3b).
Figure 3.
(a) Bimodal distribution of pixel values and backscatter thresholds; (b) inundation map for selected districts of West Bengal.
4.3. Crop Loss Area Assessment
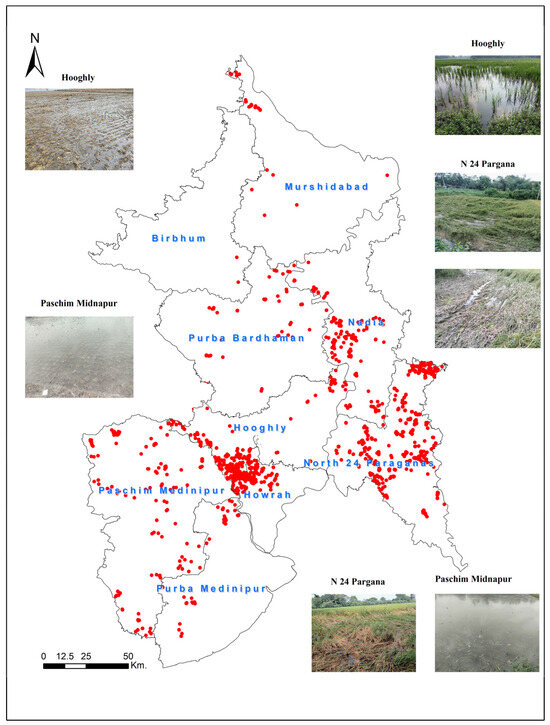
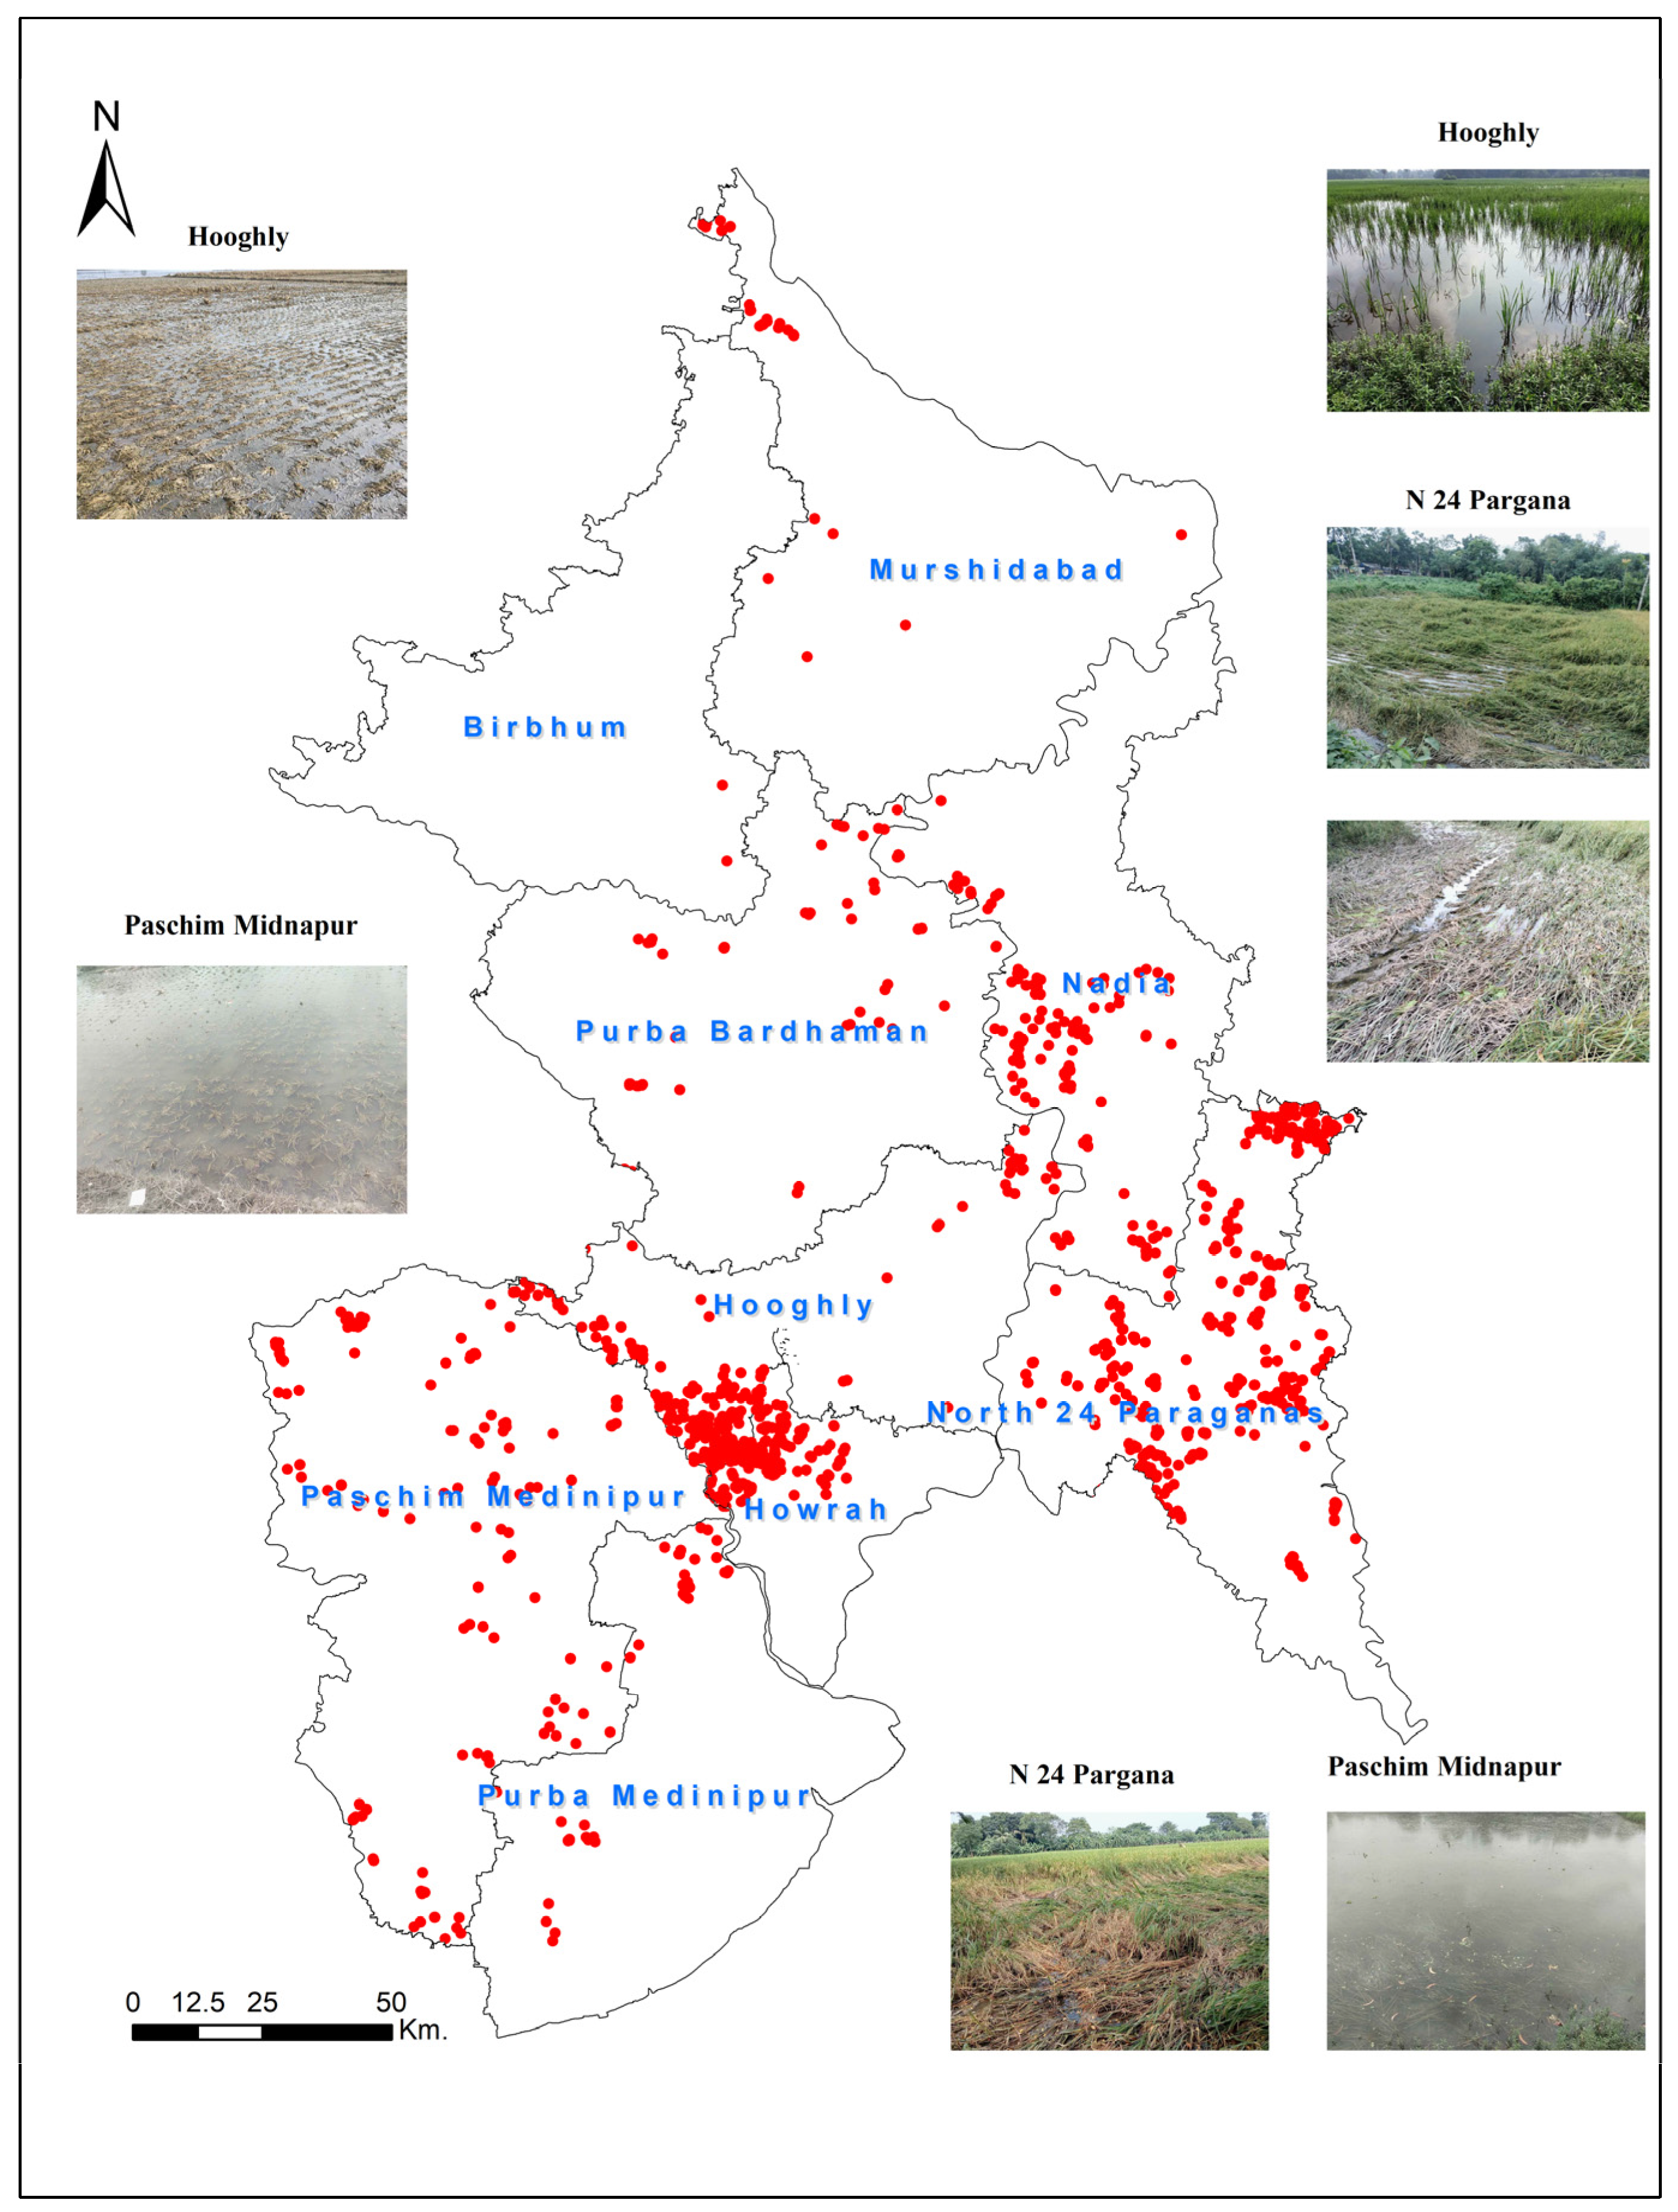
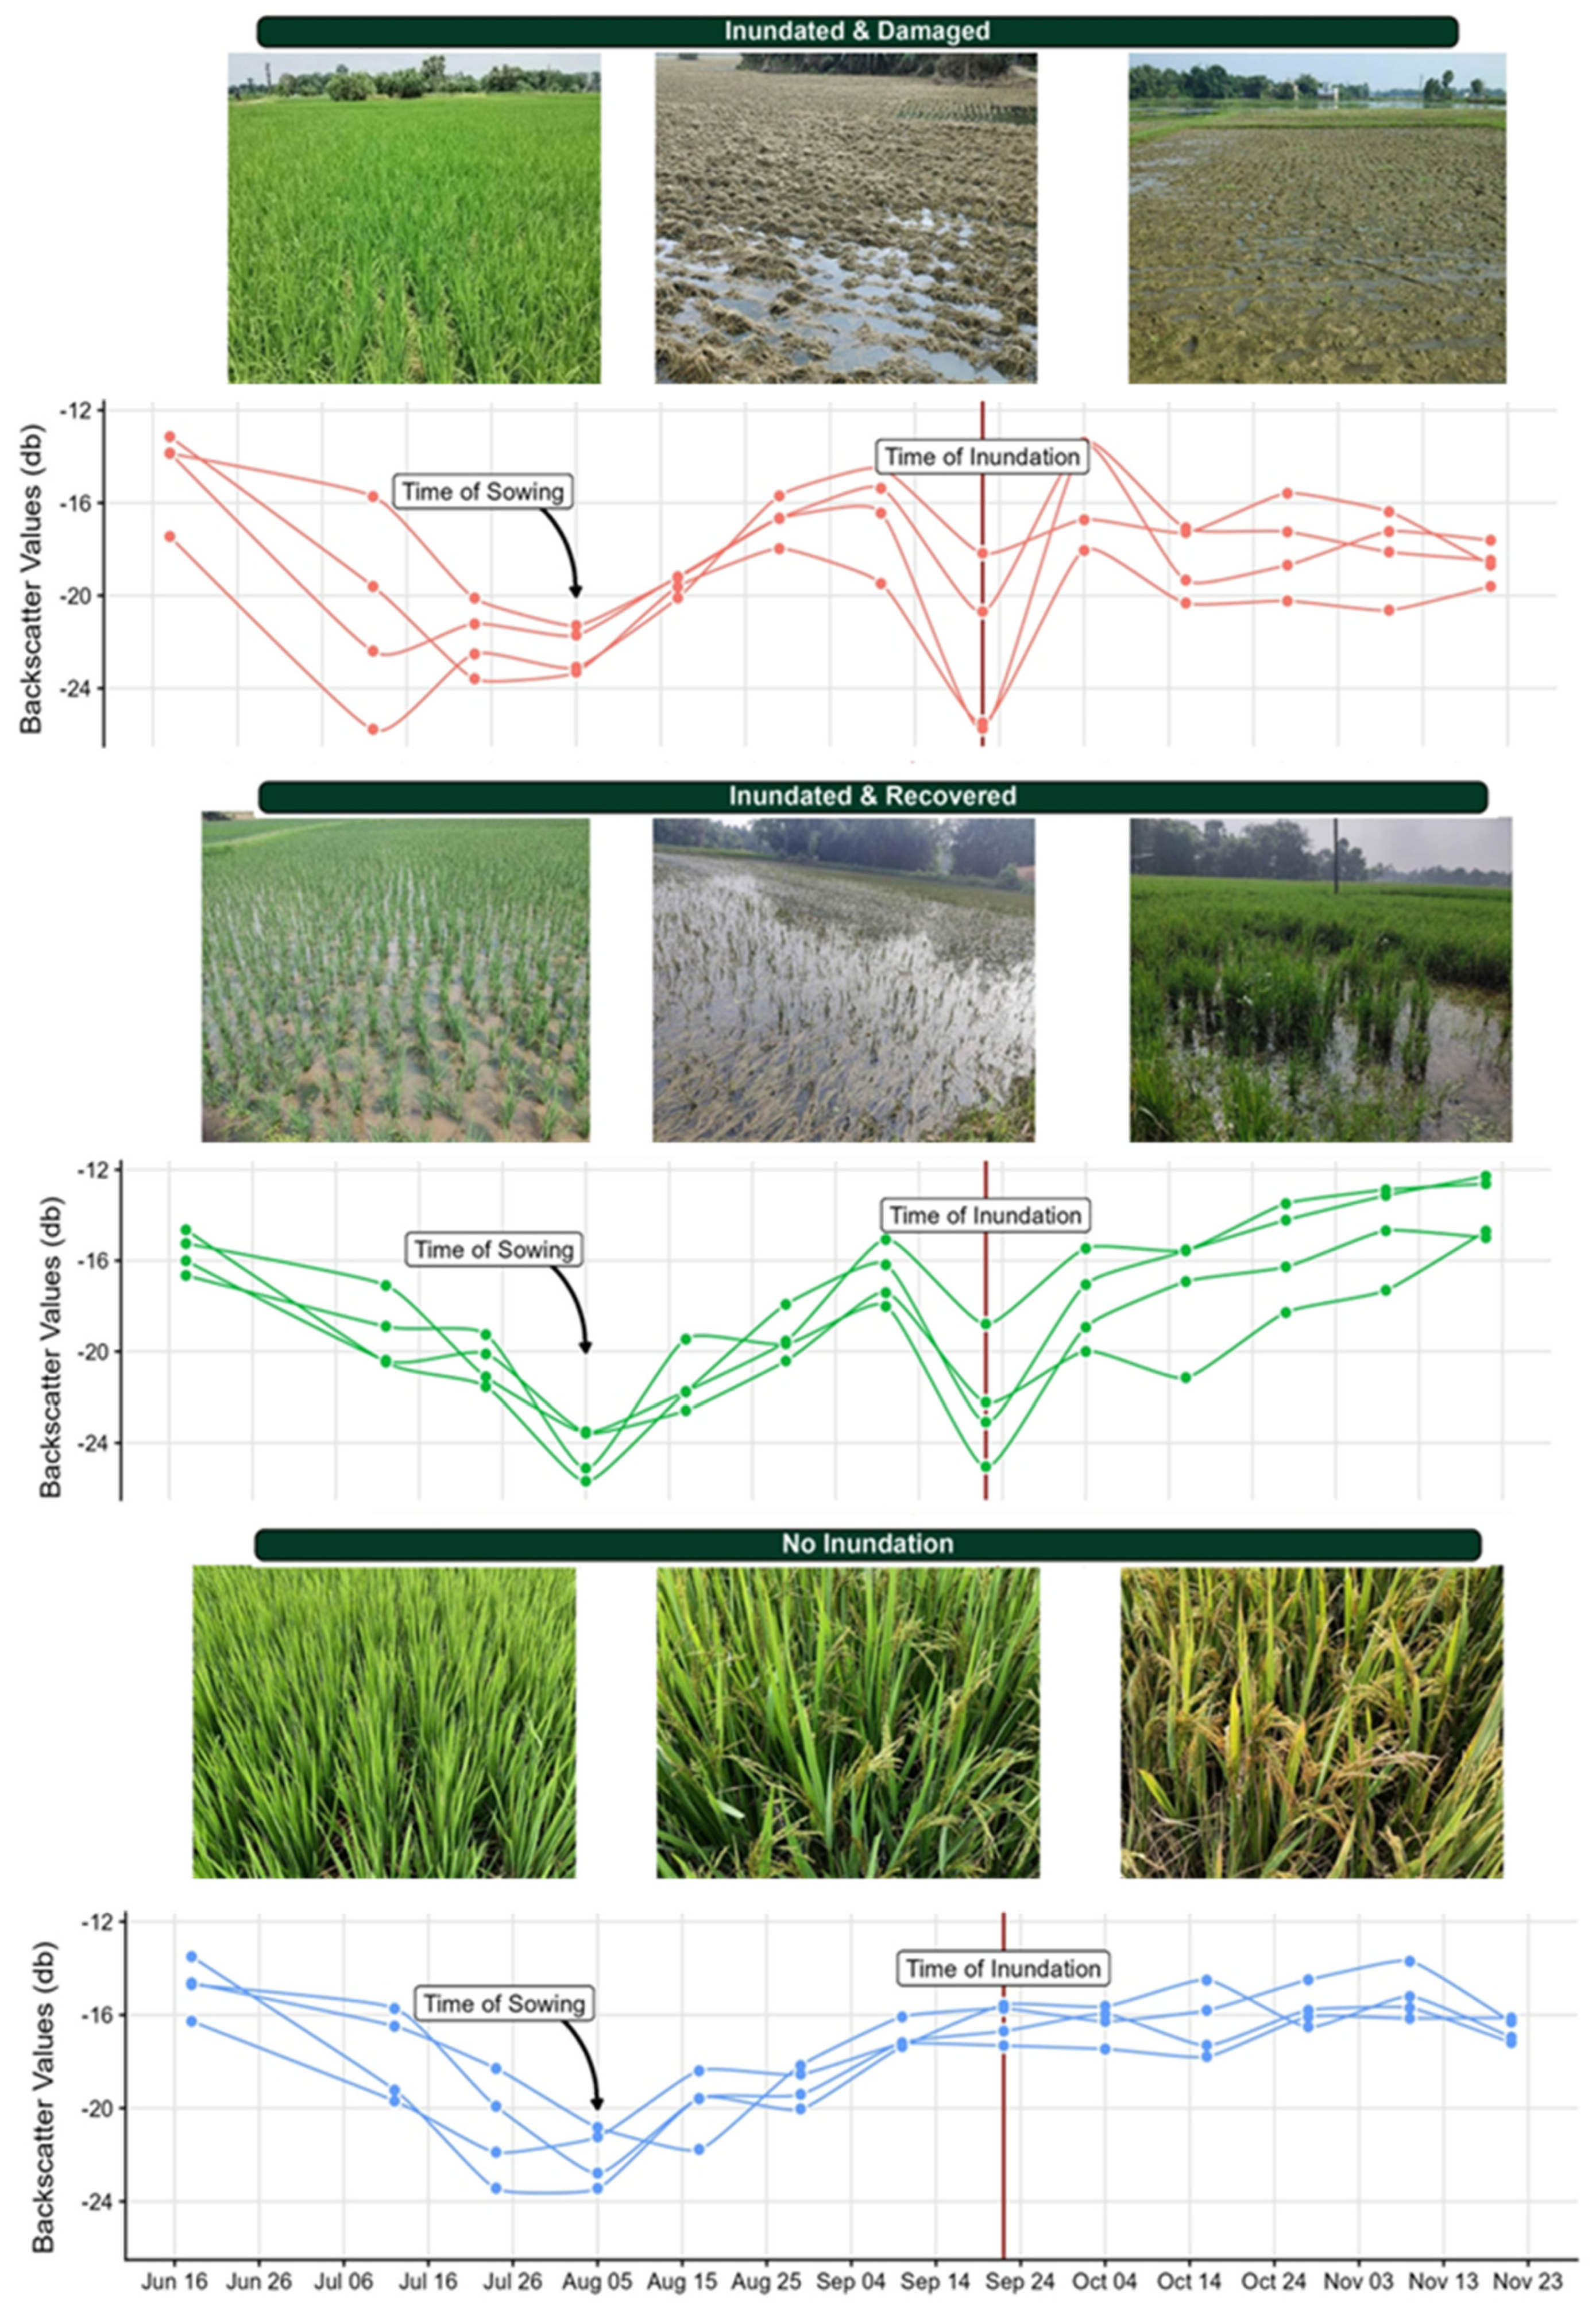
The inundated rice area was derived by overlaying the inundated layer with the classified rice area. Accurate delineation of inundation extent is essential for understanding hydrological, ecological and agricultural processes; for instance, controlled field studies focused on paddy crop have shown that optical inundation depth (≈15 cm) can enhance crop yield and water quality and increase soil carbon sequestration, underscoring the value of inundation mapping for sustainable crop management [55]. The impact of inundation on rice crop depends on several factors, like the duration of inundation, post-peril rainfall, withstanding capacity of the rice varieties, etc. The impacts on submerged crop increase with the period of water receding from the crop field. Generally, the impact is minimal if the water recedes within 2–3 days of inundation, as the plant’s internal oxygen reserves and limited anaerobic respiration can support survival for brief periods [56]. However, it is considered detrimental beyond 7 days due to oxygen deficiency in the root zone and impaired photosynthesis [56,57]. Intermediate impacts are expected for submerged periods between 3 and 7 days [57,58]. Hence, the temporal backscatter images of the post-peril dates were analyzed to study the water receding period and crop status. The images utilized for the same purpose are shown in Table 1. In the present study, a backscatter thresholding approach was adopted for both the pre- and post-peril SAR images. The former threshold was used for confirmation of standing crop in the given area before the event, and the latter for assessing the status of the crop after the peril. Generally, the backscatter values are lower than pre-event backscatter for damaged crop, and subsequently, a decrease in the values represents the dying of the crop, whereas for marginally affected surviving crops, the backscatter values increase as the crop survives. Around 1500 pieces of ground-based information on the crop (Figure 4), its stages, and its damage and recovery status were collected for better interpretation and calibration of the proposed model (Figure 5).
Figure 4.
Spatial distribution of the ground observation points (red color) used for validation.
Figure 5.
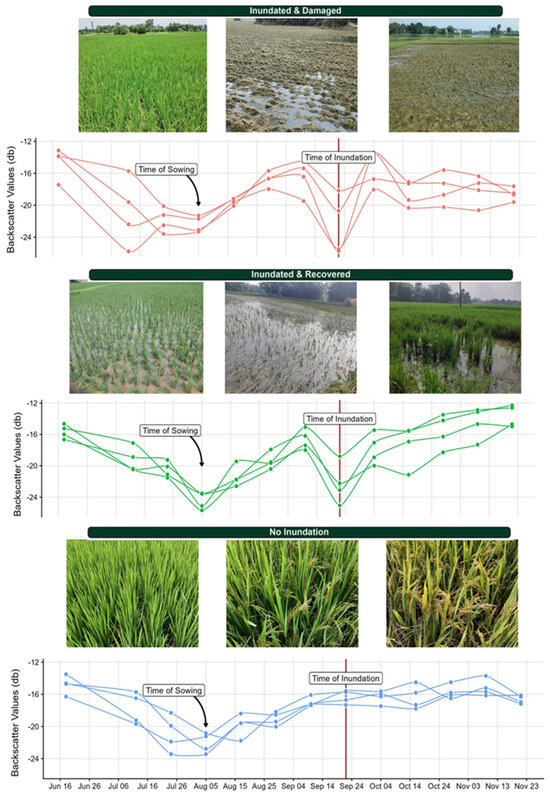
Multitemporal backscatter profiles and ground-based photographs for inundated, non-inundated, affected, and non-affected rice crop.
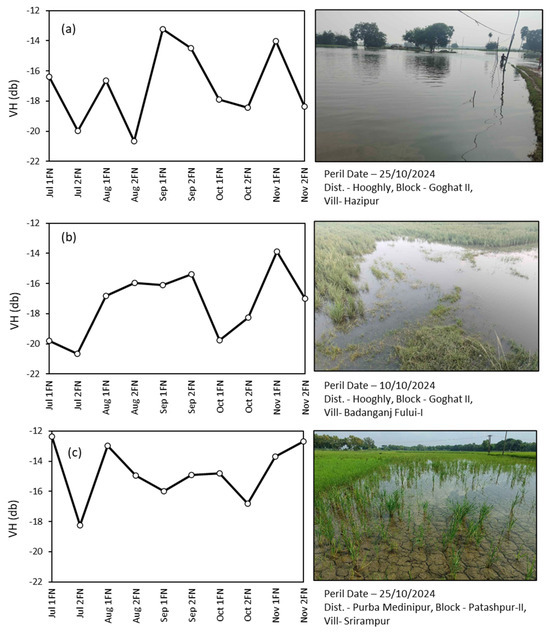
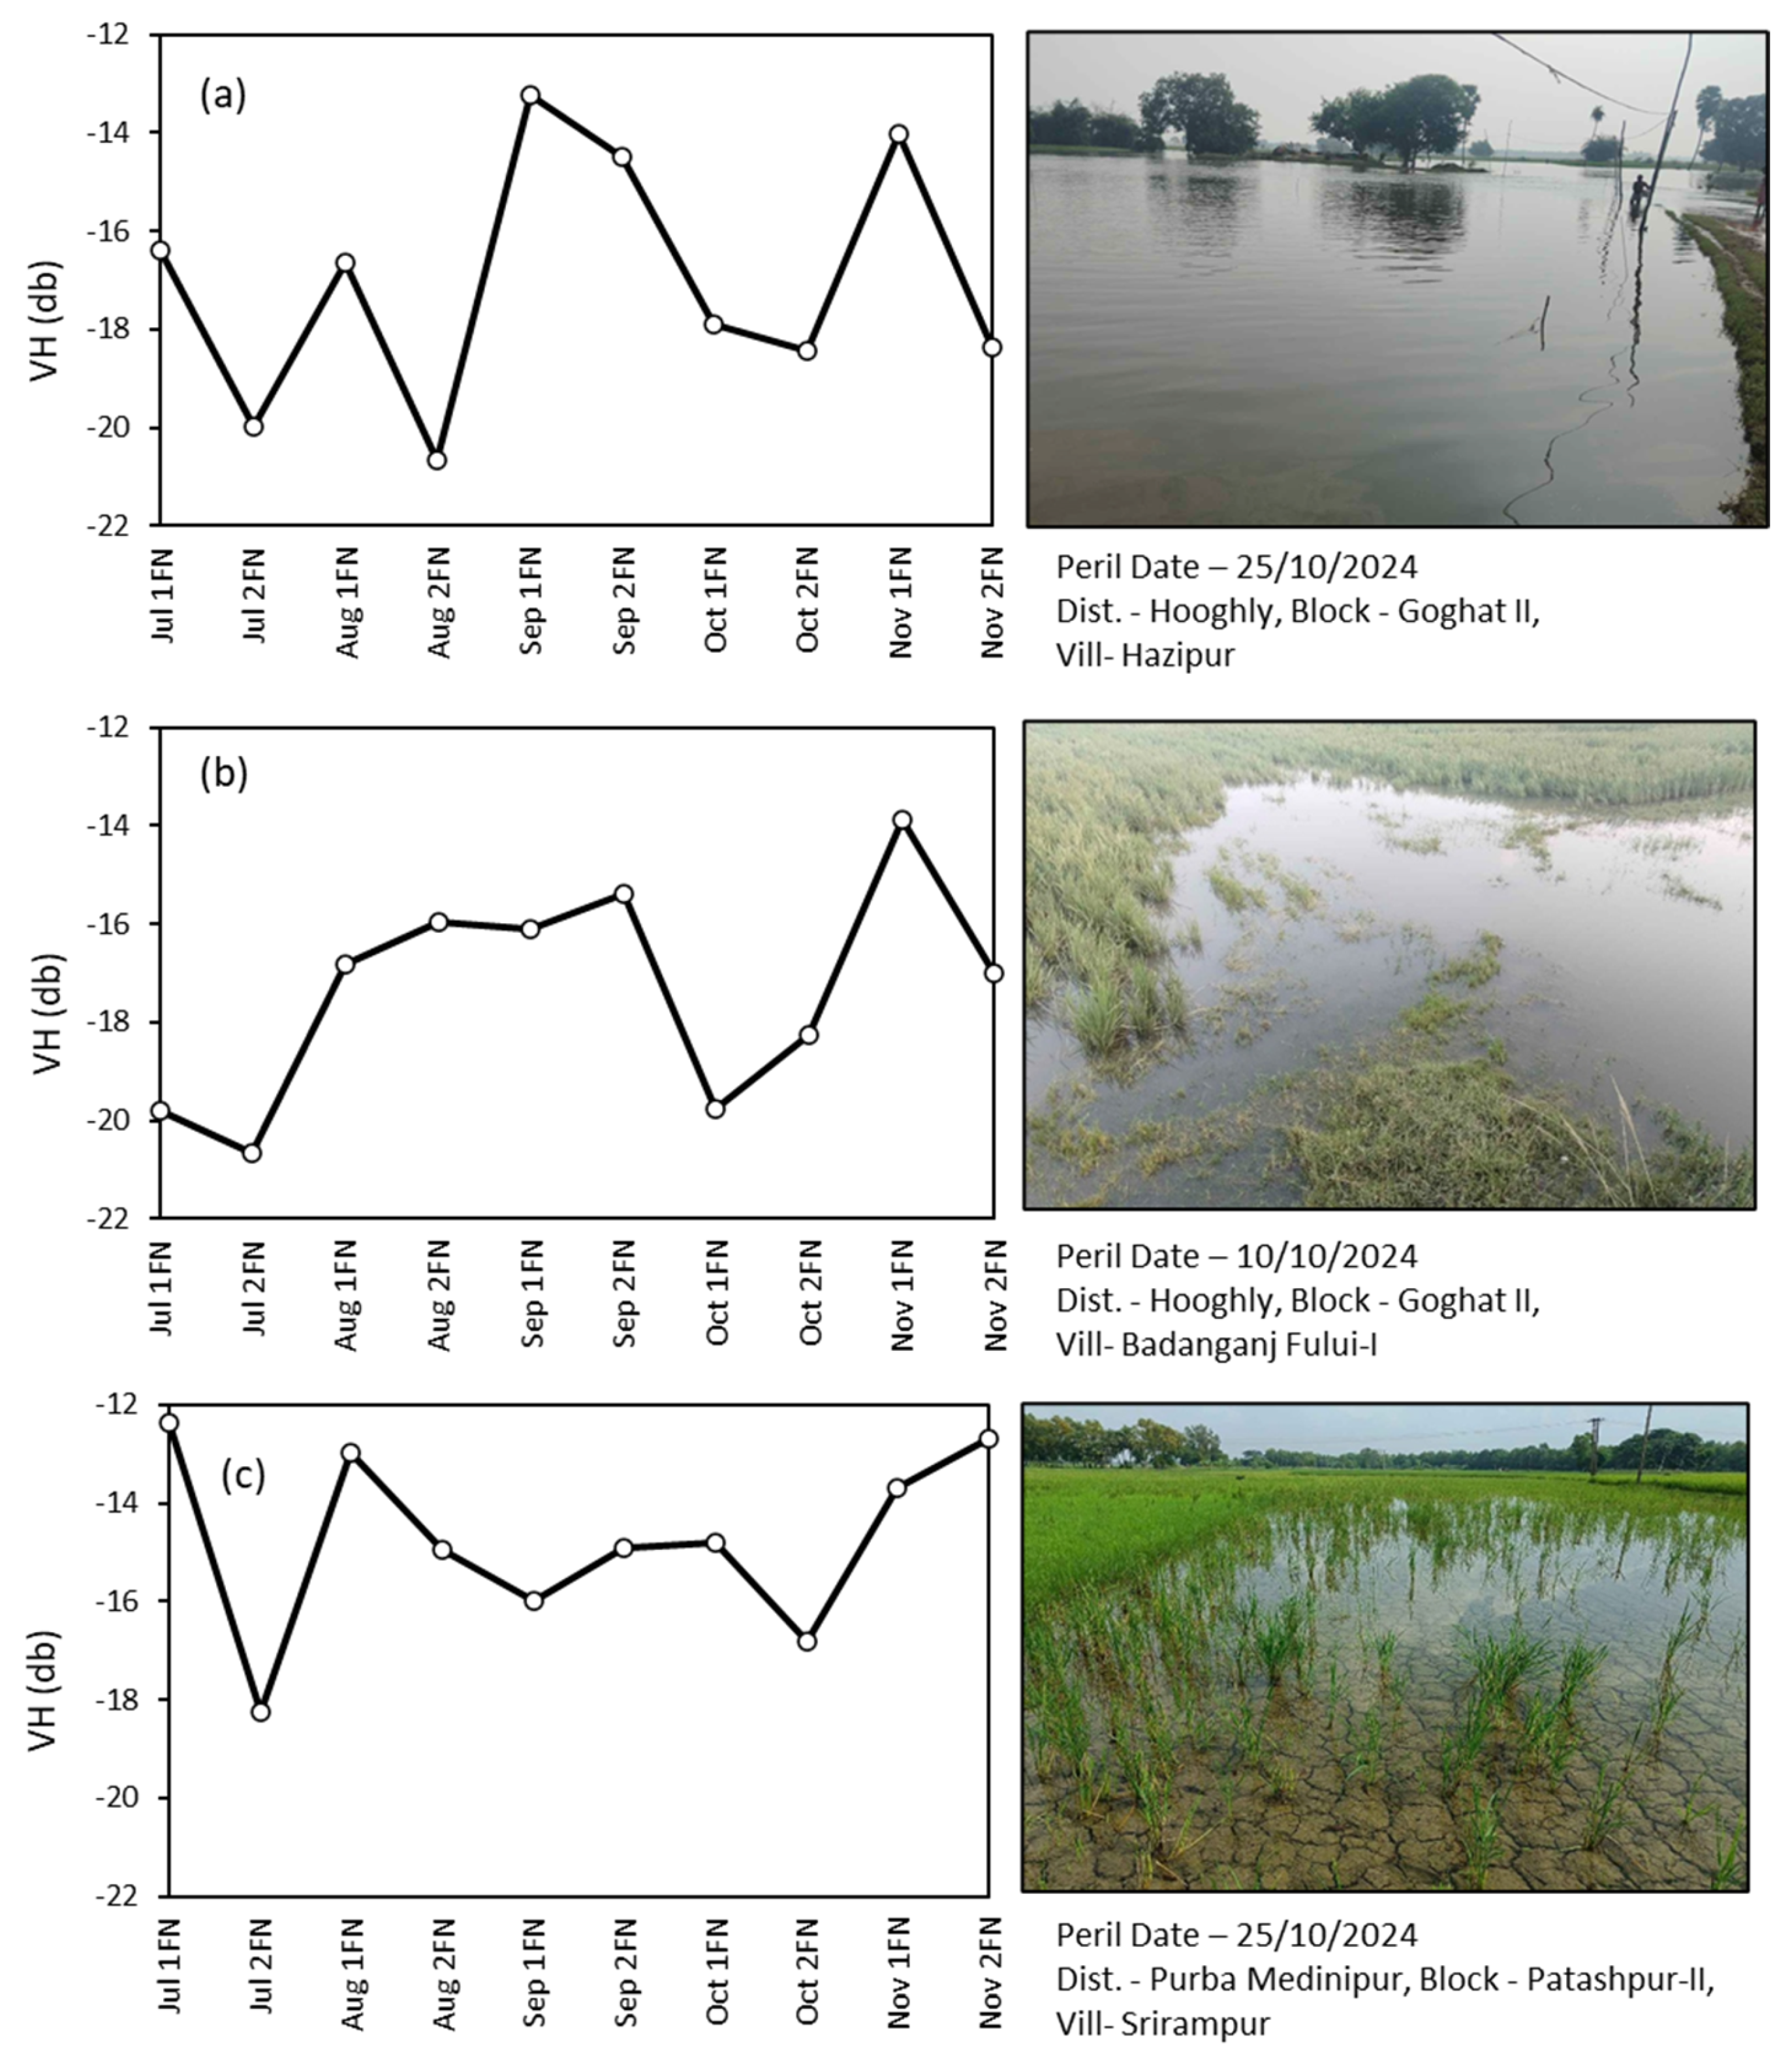
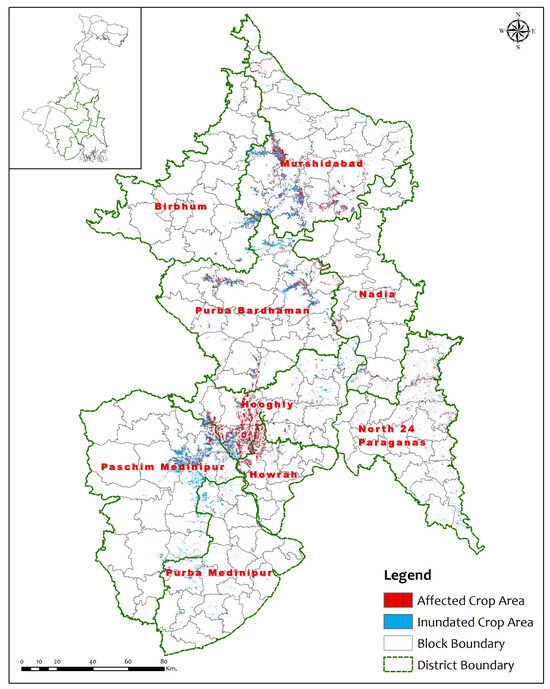
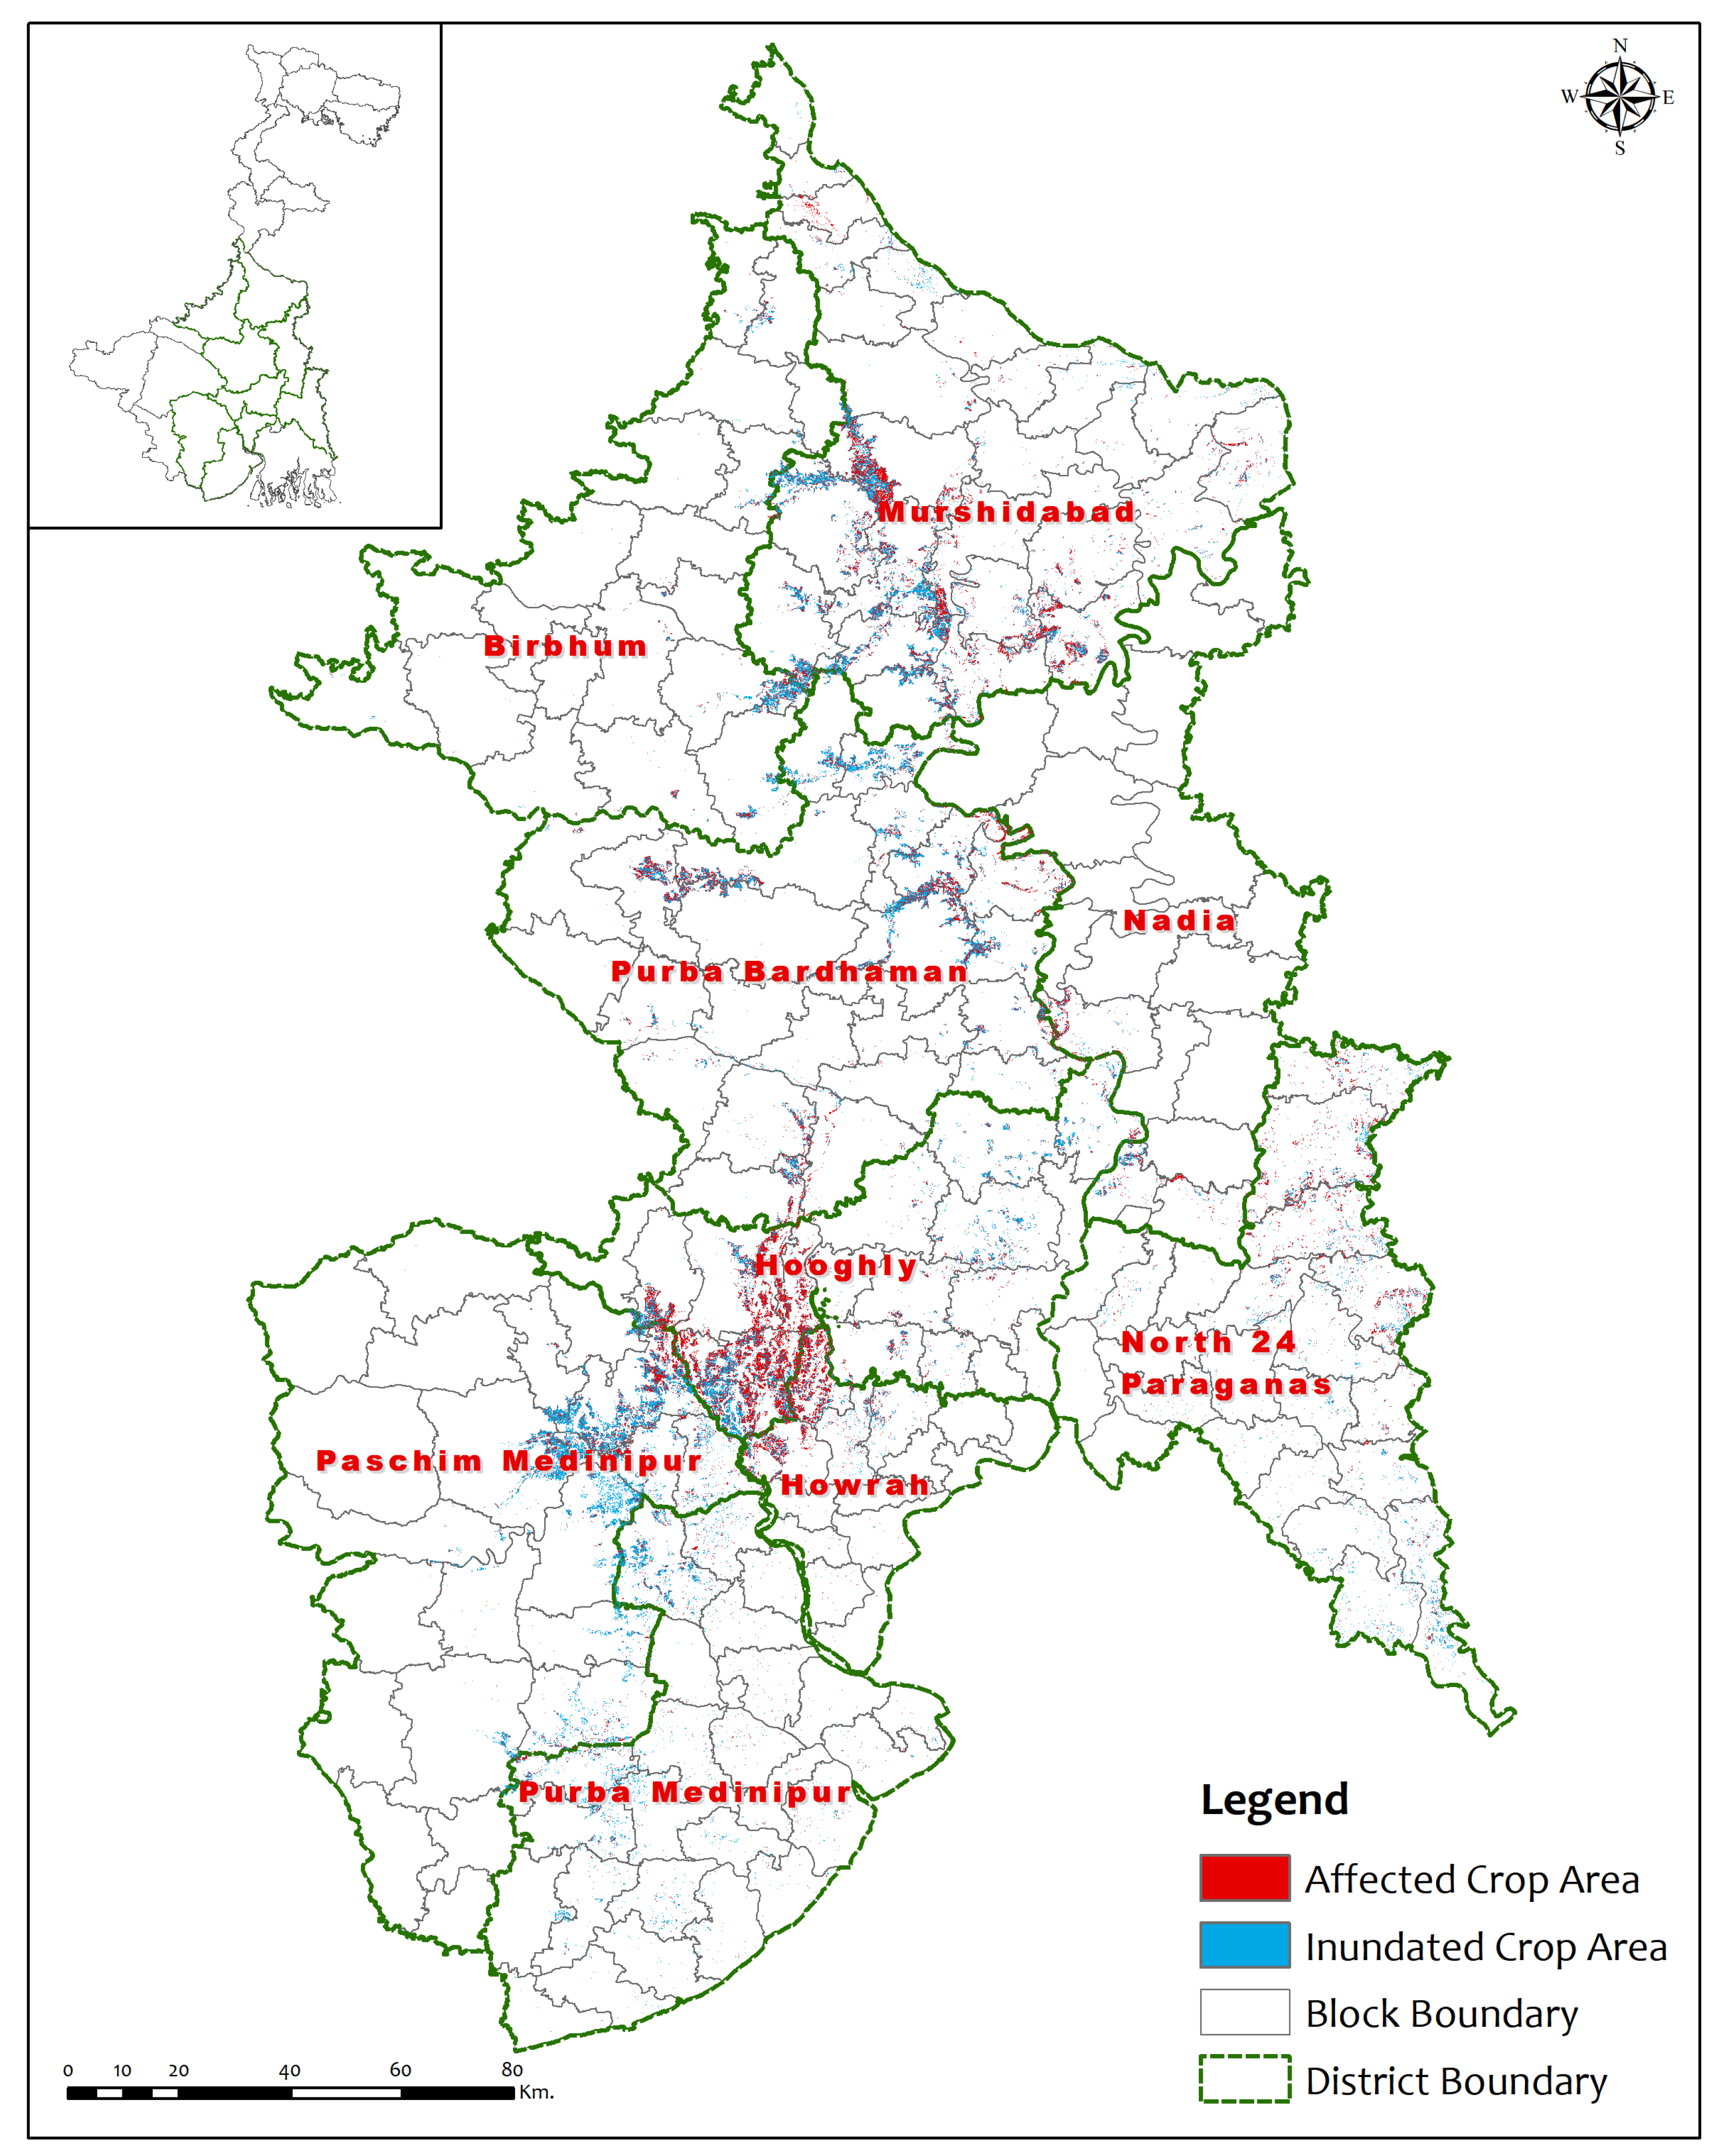
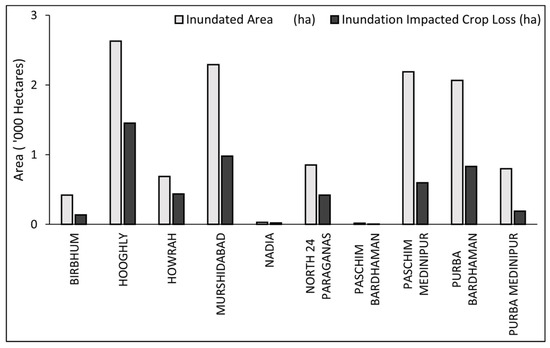
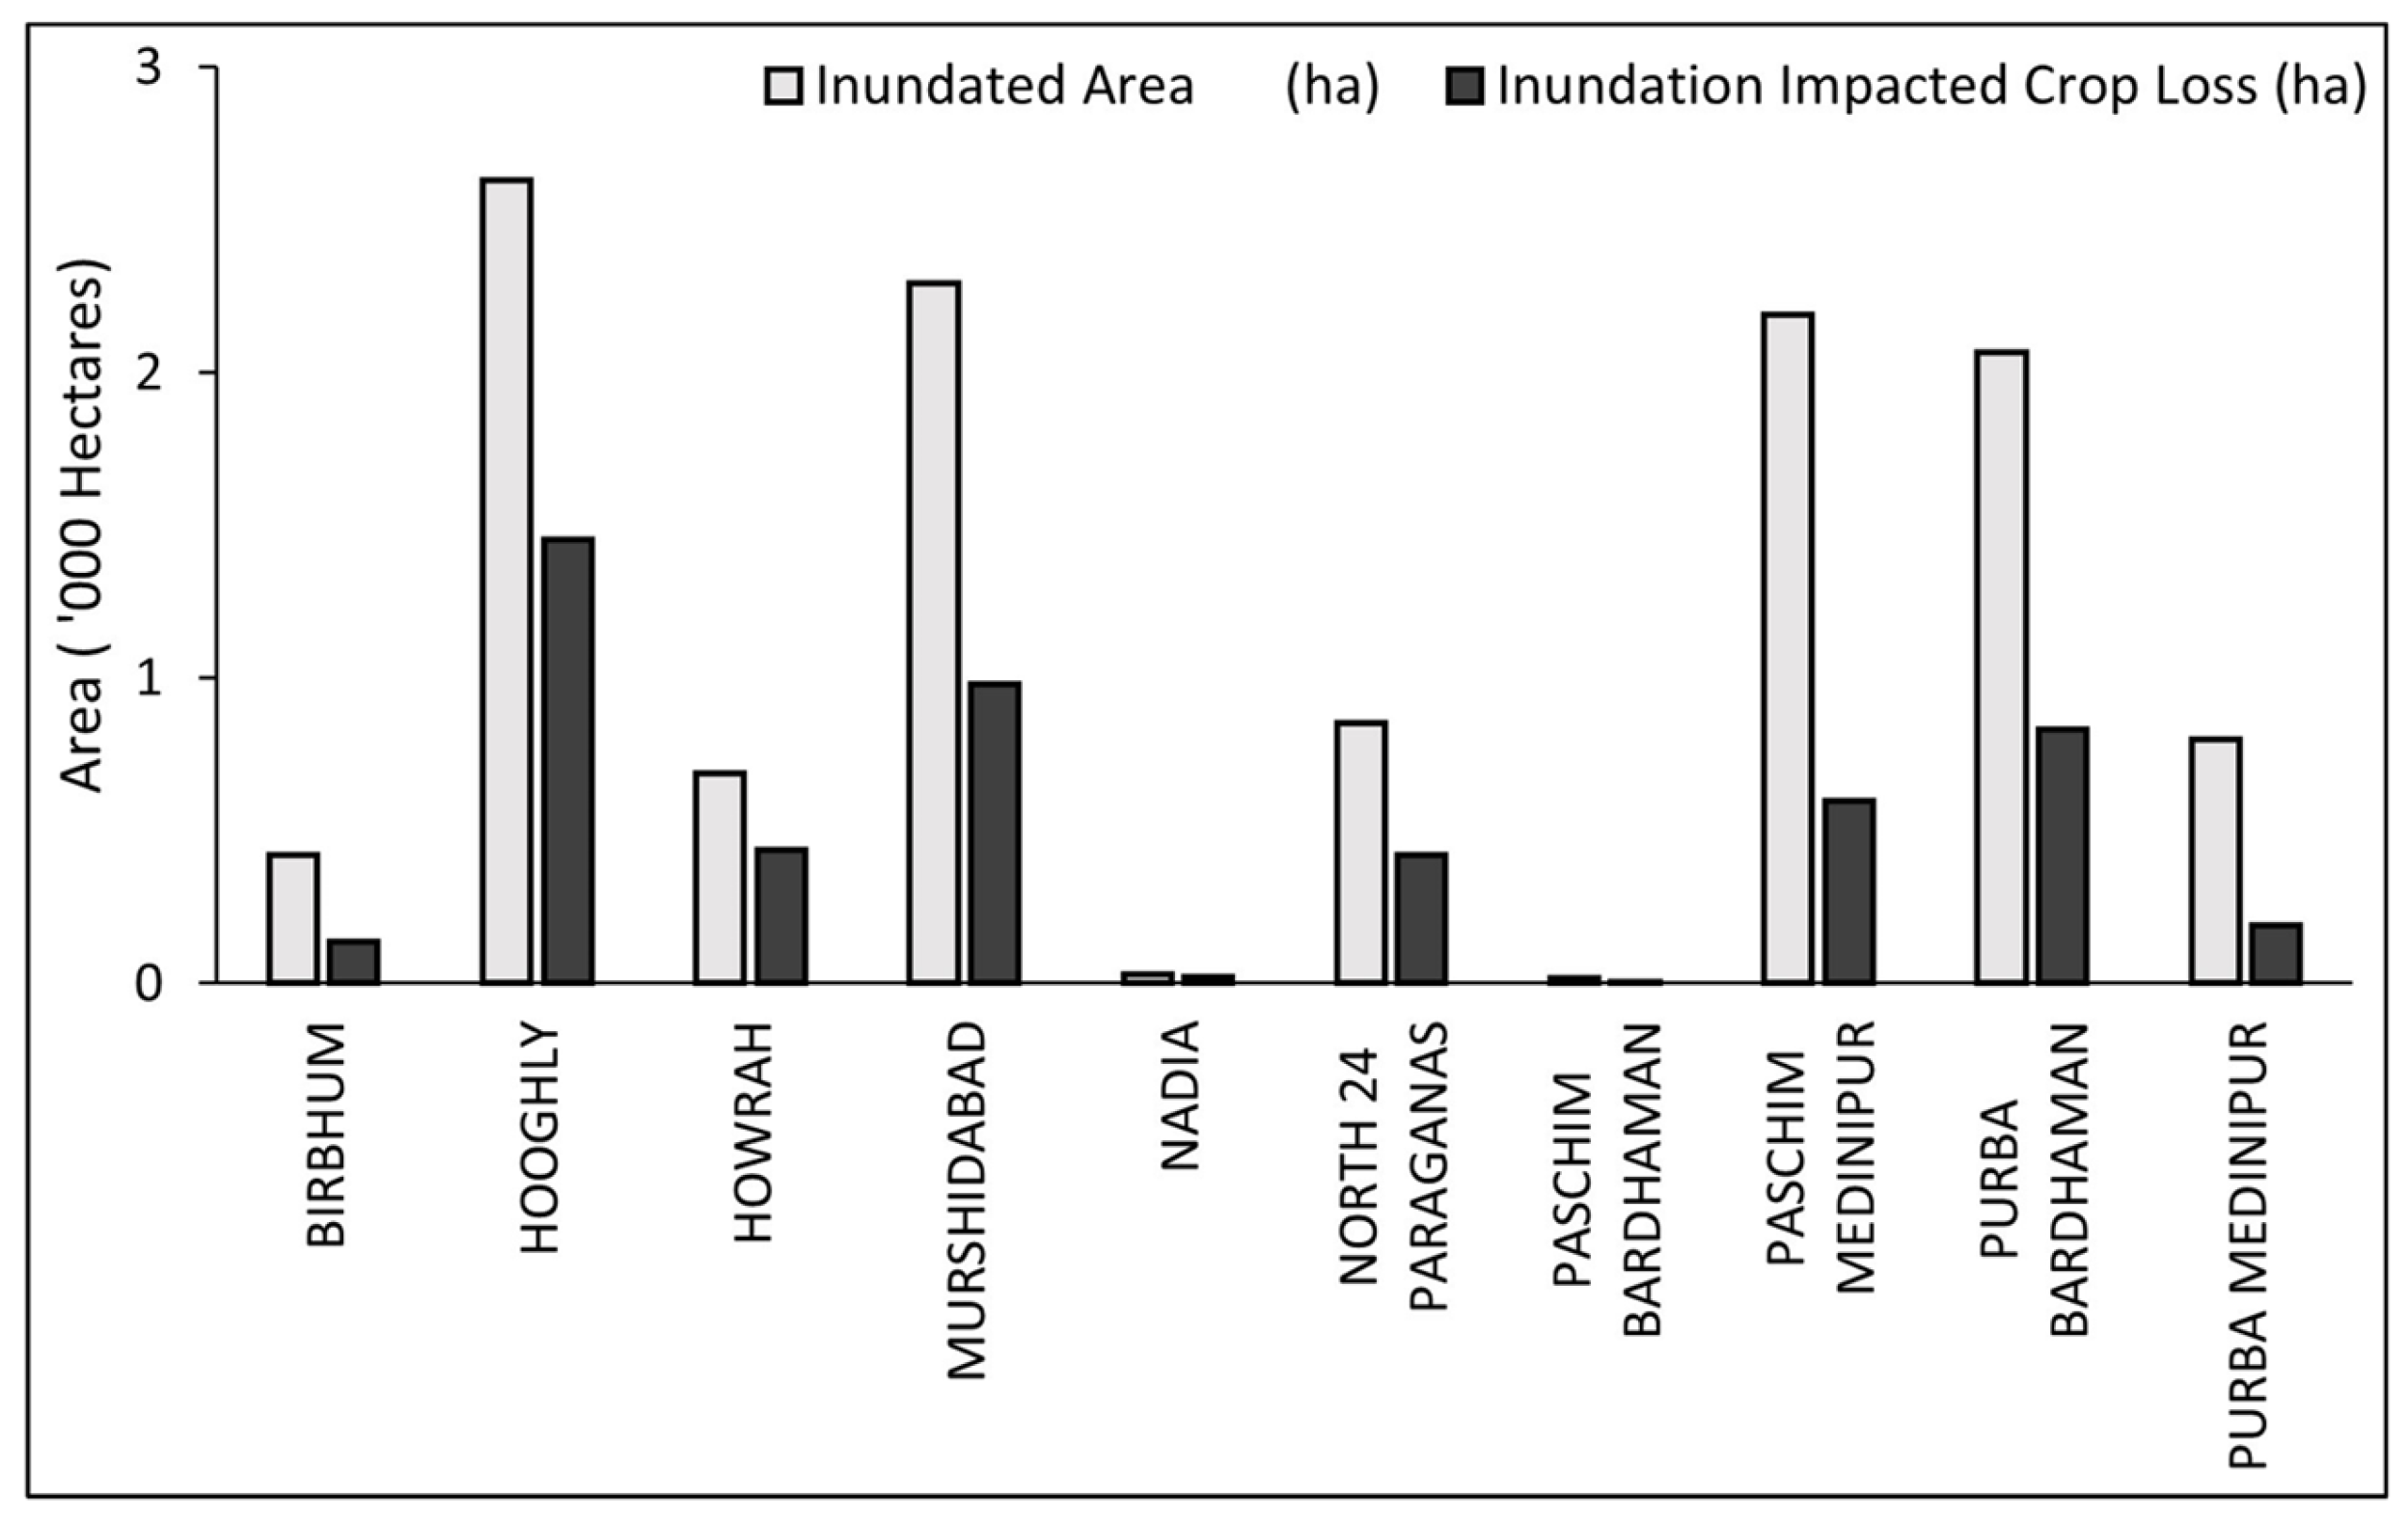
Site-specific fortnightly time-series profiles of VH backscatter were analyzed to identify damaged crop (Figure 6). In the study, district specific pre- and post-peril backscatter thresholds were identified to represent standing and damaged crops based on the ground truth information. The spatial information of inundated along with affected rice areas is provided in Figure 7, and the statistics are presented in form of a curve in Figure 8.
Figure 6.
Site-specific VH backscatter profiles (measured fortnightly July–November) along with field photographs. (a) Dist.—Hooghly; Block—Goghat II, Village—Hazipur (b) Dist.—Hooghly, Block—Goghat II, Village—Badanganj Fului-I (c) Dist.—Purba Medinipur, Block—Patashput-II, Village Srirampur.
Figure 7.
Spatial distribution of inundated and affected crop area at pixel level over parts of West Bengal.
Figure 8.
Inundated and inundation-impacted crop area for selected districts in West Bengal.
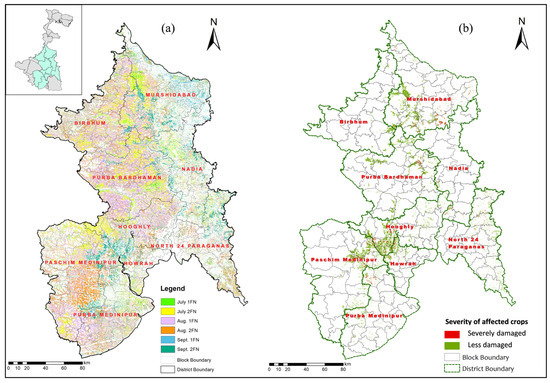
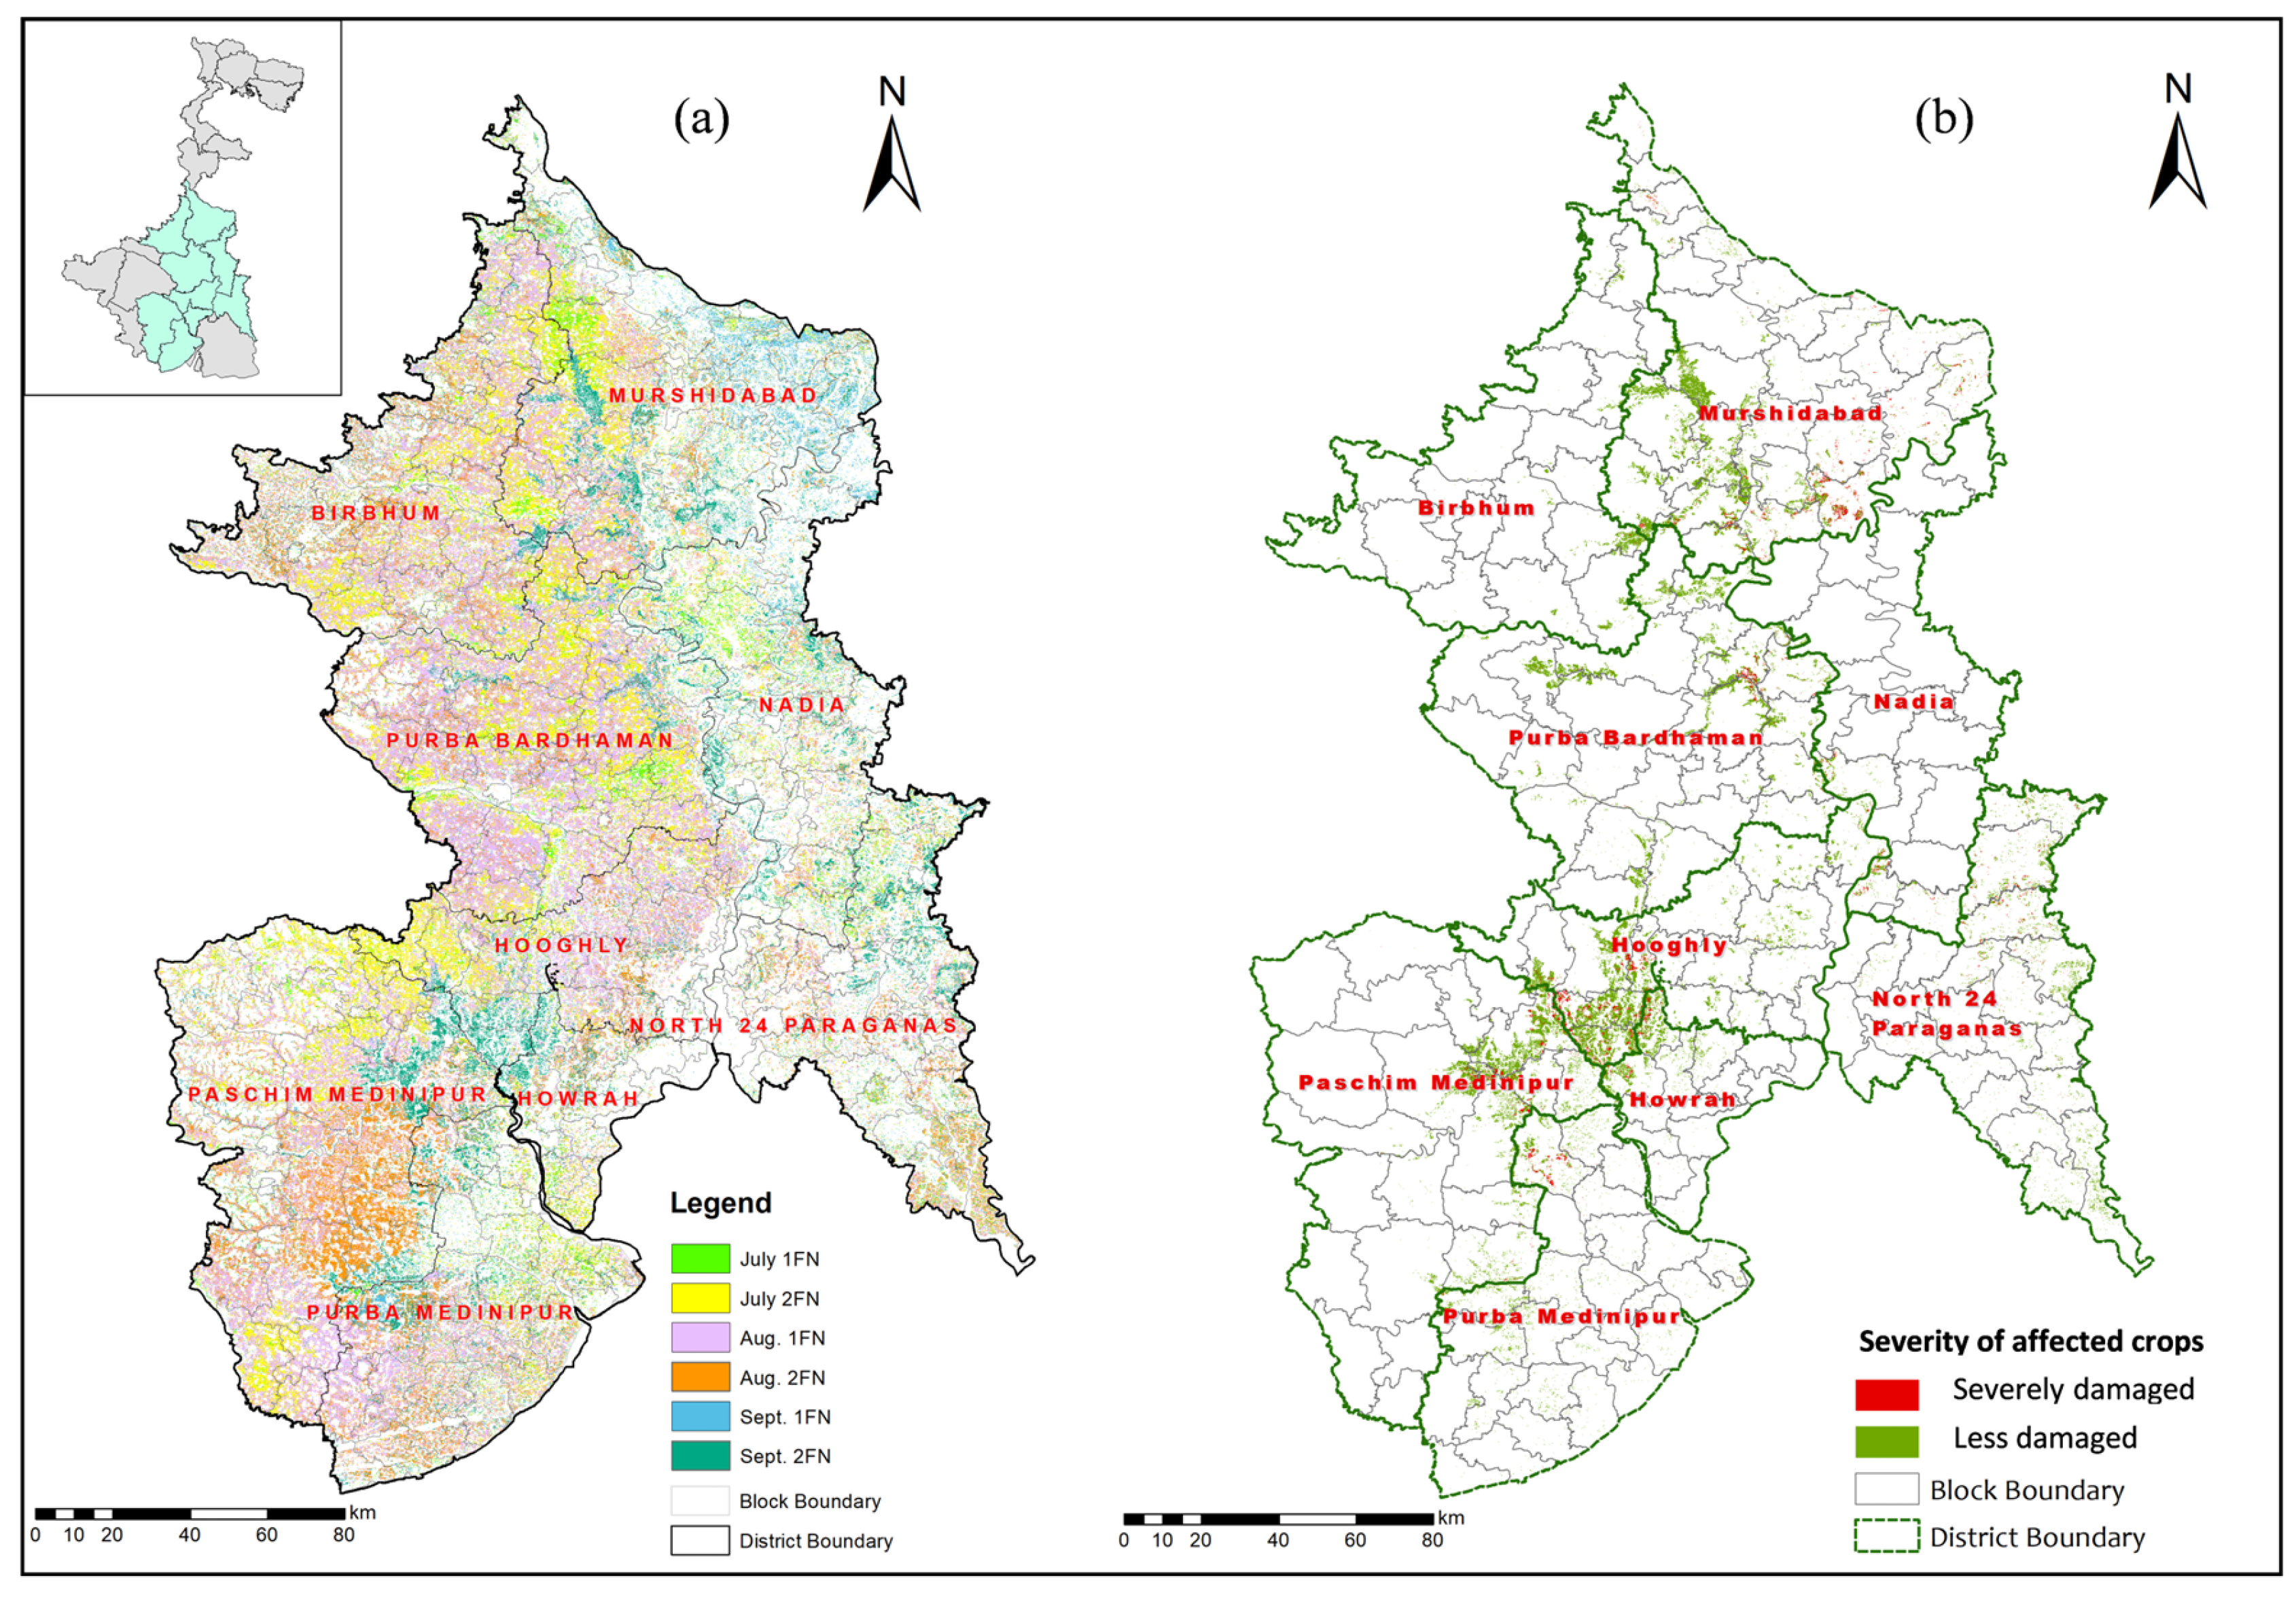
As the crop growth stages have differential impacts against heavy rainfall and subsequent inundation, the stage information was analyzed to further characterize the impacted rice crop pixels based on severity. During the vegetative stages, the requirement of water for rice crop is much higher than in the reproductive stages; moreover, heavy rainfall may have a greater impact for crops with reproductive stages [59,60,61,62]. The transplanting dates at a fortnightly level were estimated from the temporal backscatter profiles for individual pixels (Figure 9a) and validated using ground-based information. The block-specific major rice varietal information was utilized to determine the average days required for achieving different phenological stages. Finally, both the transplanting and phenological information were coupled at the individual pixel level to derive the existing crop stages, in terms of vegetative and reproductive stages, to determine the severity of the impact of inundation on rice crop (Figure 9b).
Figure 9.
Spatial distribution of (a) kharif rice transplantation period; (b) severity of damage for standing rice crop during flood.
5. Results and Discussion
5.1. Excess Rainfall and Backscatter Response
As evident from Figure 2, some districts in West Bengal had two major wet spells during September 2024. The former spell during 14th September was wetter than the latter one recorded on 25 September. Moreover, in some districts, like Purba Medinipur, the amount of rainfall was as high as 120 mm in a single day. The rainfall depths were much greater in comparison to the normal rainfall depth in those days, creating extraordinary situations and leading to flooding in many of the districts.
The behavior of backscatter in the three distinct scenarios—namely inundated and damaged, inundated and recovered, and no inundation (Figure 5)—was studied. These conditions were analyzed to capture the variations in backscatter patterns across different stages and scenarios. For the first scenario, the VH values showed a significant drop (~4–6 dB) during the time of inundation, suggesting that inundation has led to specular reflection, resulting in sharp drop in backscatter. In the post-inundation period, the backscatter values were minimal and showed a reducing trend (~−27 dB), indicating that the damage was severe, and the crops may not have recovered. In the second scenario, the backscatter values decreased by ~2–3 dB during the time of inundation, similarly due to specular reflection. More importantly, the backscatter values showed a clear recovery trend after the inundation event (~25 dB), suggesting that the crops were able to recover from the impact of flooding. In the no inundation situation, the VH values showed a gradual increase (from ~−24 dB to ~−15 dB) over time, reflecting the normal phenology of the crop. The corresponding field images for all the scenarios were also provided for reference. Multiple studies were carried out to identify the flooded areas and assess their impact using sentinel-1 satellite image [63,64,65,66].
Figure 6 demonstrates the temporal VH backscatter profiles capturing crop growth dynamics across three distinct regions. Each profile represents a unique pattern of crop response to inundation, indicating varying degrees of crop loss. In Figure 6a,c, a notable decline in VH backscatter can be observed during the second fortnight of October, corresponding to the peril date of 25 October 2024. In contrast, Figure 6b shows a significant drop during the first fortnight of October, aligning with the peril date of 10 October 2024. These temporal anomalies in backscatter values reflect the impact of heavy rainfall events and subsequent crop damage in the respective regions.
5.2. Flood-Impacted Crop Area and Crop Loss Analysis
Flood- and crop-impacted areas in the affected districts, particularly in the districts of Murshidabad, Birbhum, Paschim Bardhaman, Purba Bardhaman, Nadia, Hooghly, North 24 Parganas, Howrah, Paschim Medinipur, and Purba Medinipur, are shown in Figure 7. The larger inundated area and associated crop loss indicate severe flooding with a prolonged period of inundation.
Hooghly district experienced significant inundation over 2630 ha., with a substantial impact on crops in a 1450 ha. area (Figure 8). In Hooghly district, Khanakul-I, Khanakul-II, Arambagh, and Amta-II were the worst-hit blocks with affected crop areas of 740, 260, 250 and 150 ha., respectively.
Murshidabad district appeared to have the next most extensive area affected, in terms of both crop stress and inundation (Figure 7). Out of a total 2290 ha. of inundated area, Murshidabad experienced a crop loss in 980 ha. (Figure 8). The Nabagram block of Murshidabad suffered the most, with 510 ha. of inundated area and impacted crop area of 280 ha., followed by Khargram block (390 ha. Inundated and 140 ha. affected crop) and Kandi Sadar block (360 ha. Inundated and 130 ha. affected crop). It was interesting to note that in Burwan block, though the inundation was observed over an area of 210 ha., the impact on the crop was confined within 80 ha. only, which may be attributed to early receding of water from crop field and subsequent crop recovery.
In the Paschim Medinipur district, the heavy rainfall led to 2190 ha. of inundated and 600 ha. of affected crop area (Figure 8). Ghatal was the worst-hit block with 870 ha. of inundated and 300 ha. of affected crop area. Keshpur, Daspur-I and Debra blocks experienced severe inundation with a 270, 260, and 260 ha. area, but the affected crop area was confined within very small area of around 60 ha. The gap in the inundated and affected crop area may be attributed to inundation for the short duration and recovery of the crop.
Purba Bardhaman district witnessed significant crop stress, i.e., 830 ha. and widespread inundation, i.e., 2070 ha. (Figure 8). Katwa I and II, Ketugram I and II, Ashugram-I, and Mongolkot were severely impacted, with inundation areas ranging from 170 to 240 ha. Crop losses were also substantial in these blocks. Similar levels of inundation, ranging from 400 to 800 ha., were observed in other districts, including Purba Medinipur, North 24 Parganas, and Birbhum.
5.3. Crop Phenological Stages of Affected Crops
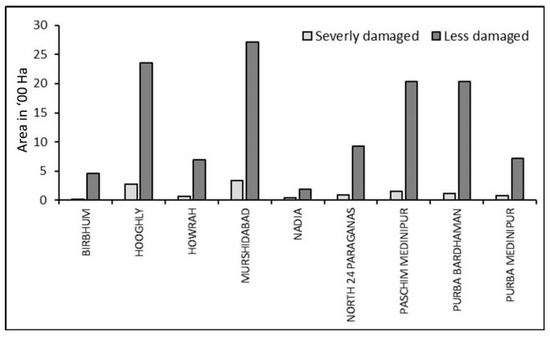
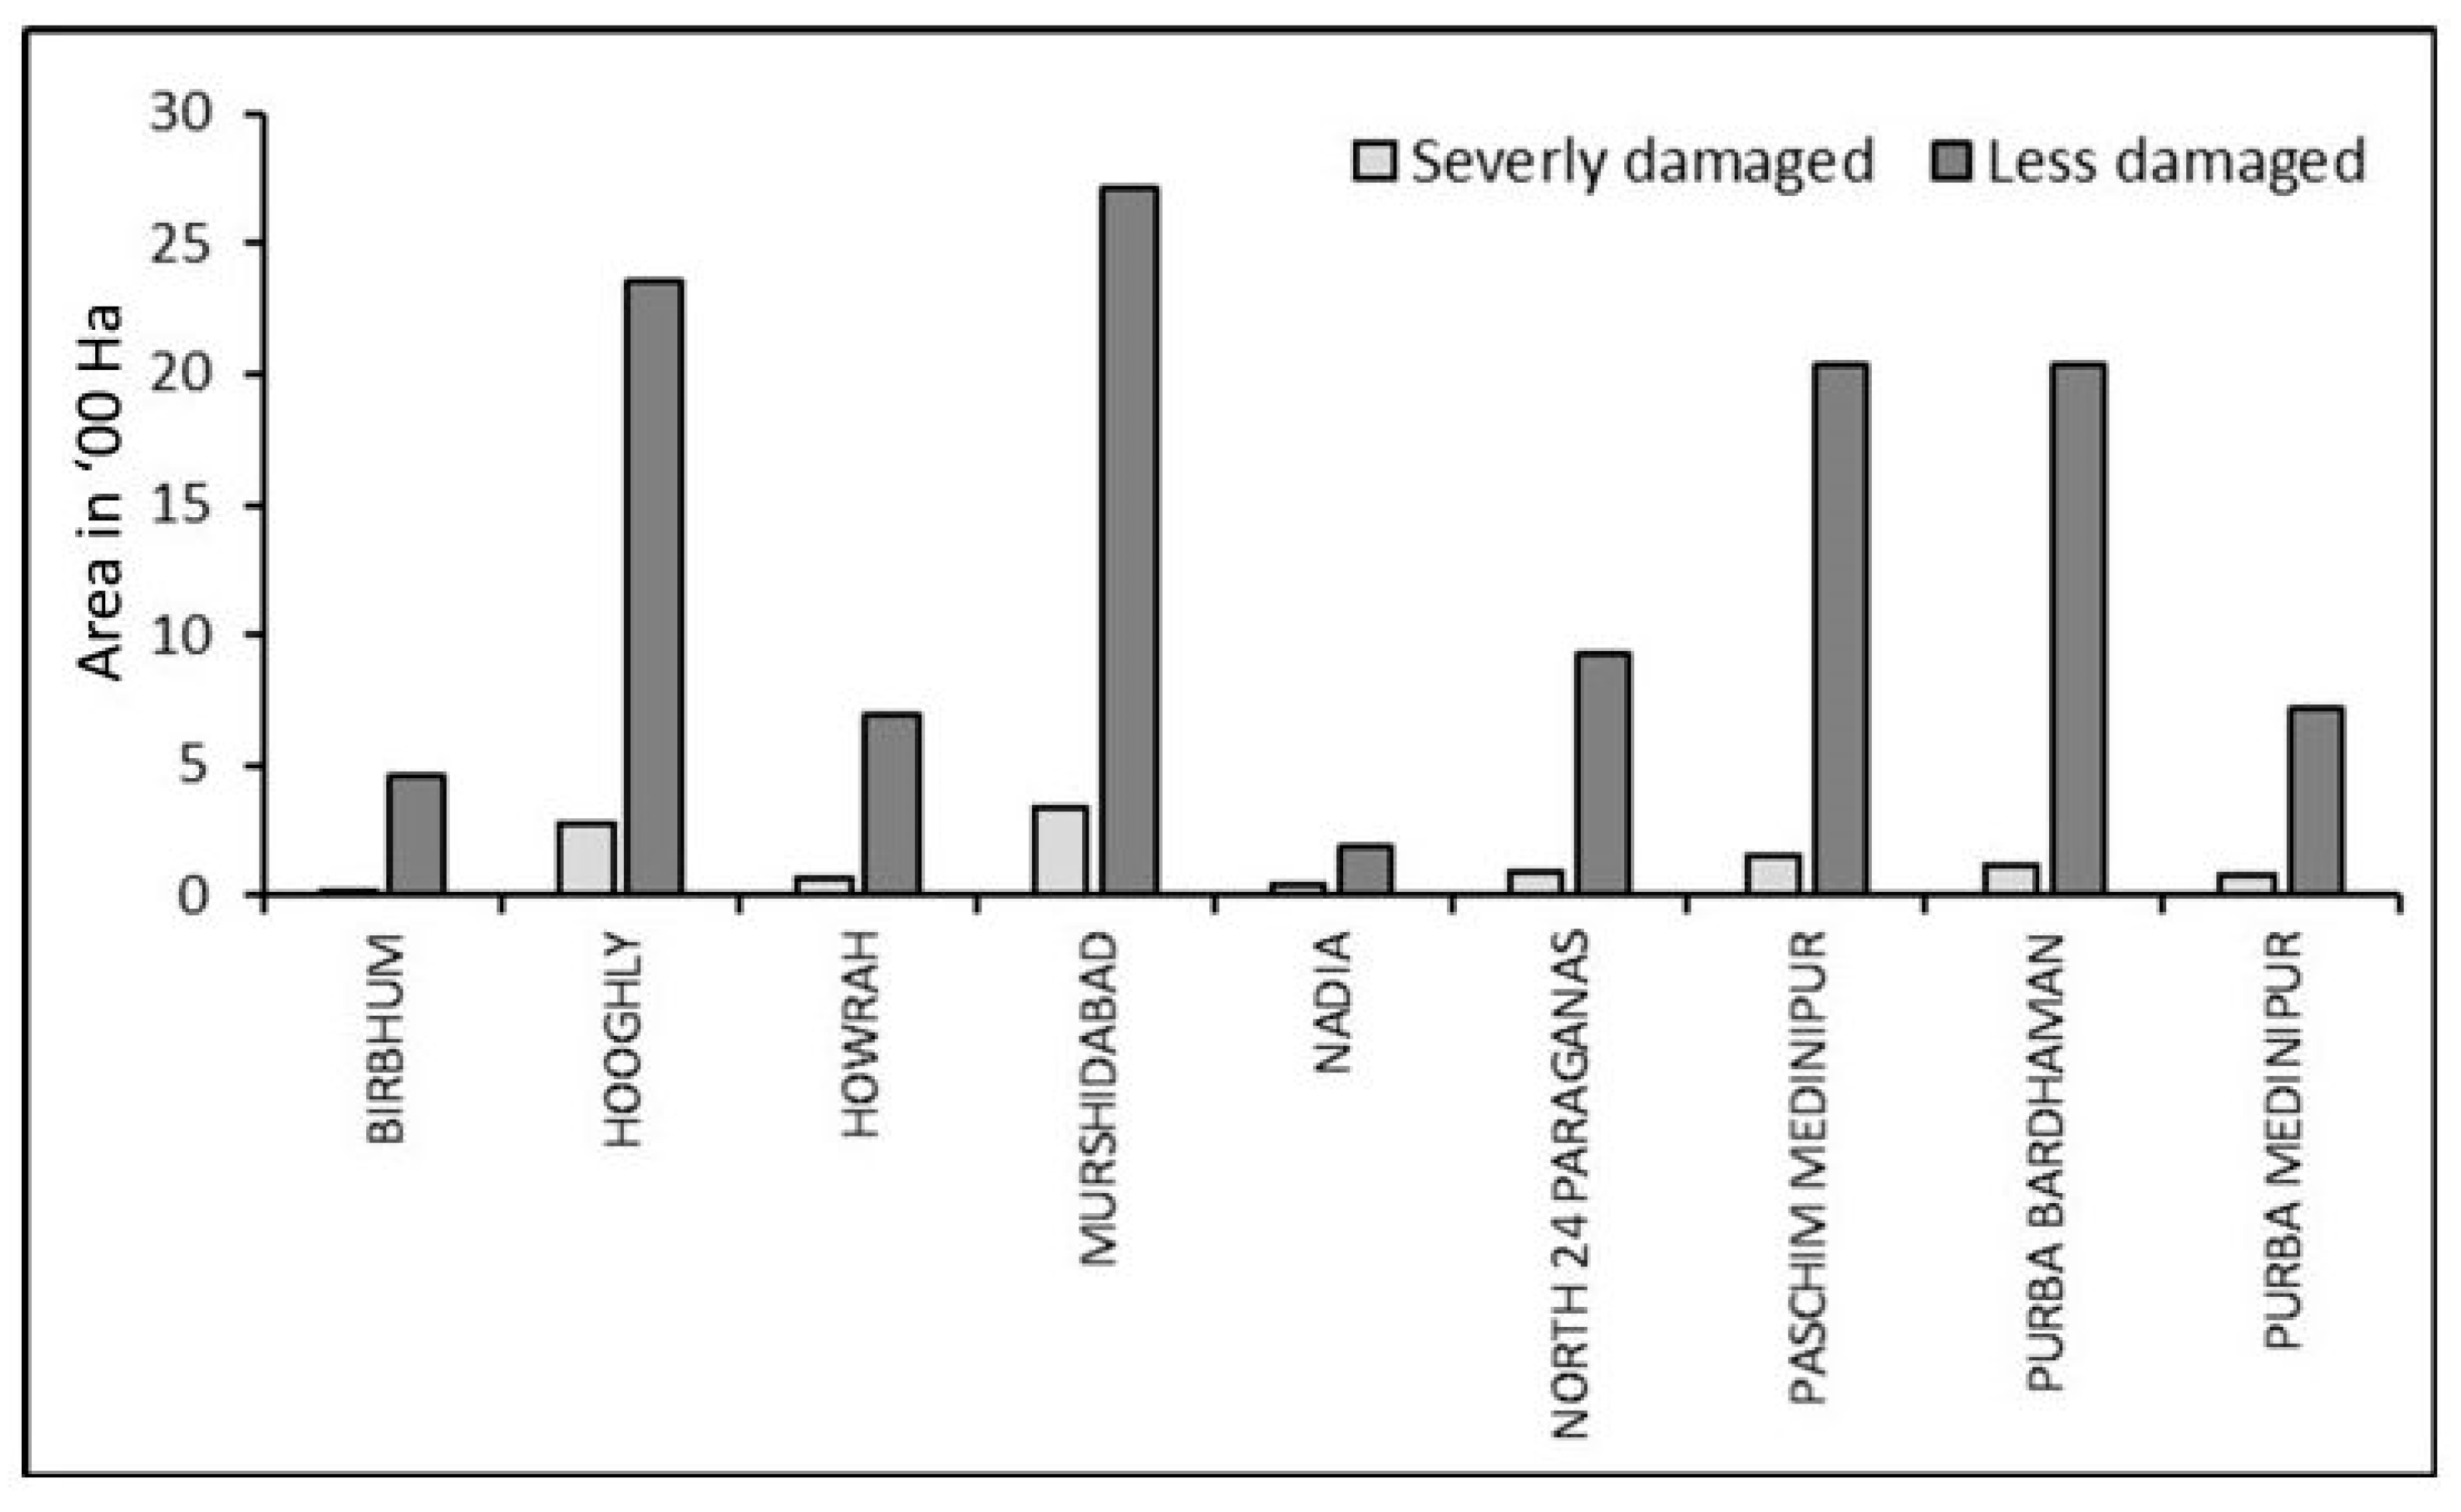
Along with duration of inundation, the impact of flooding on crops depends upon the existing crop phenological stage. Therefore, Figure 9 revealed the varying impact of the inundation based on the crop stage. Inundation during the early vegetative stage of rice may hinder tillering and overall plant growth. On the contrary, flooding during the panicle initiation stage may significantly reduce the number of panicles reproduced, leading to a major drop in potential yield. In the present scenario, the rice with vegetative stages were mostly found to be in the maximum tillering stage, and had a relatively lower impact in comparison to the rice with the panicle initiation stage. The estimation showed that approximately 2700 ha in Murshidabad and 3300 ha in Hooghly were undergoing the reproductive stage, indicating high vulnerability to crop loss, as panicle initiation during this phase is highly sensitive to stress (Figure 10). Paschim Medinipur and Purba Bardhaman districts showed large affected areas (2000 ha each), mostly in the less damaged category, with 1000 ha of severe damage. In the remaining districts, the percentage of affected rice crop under reproductive stage was much lower, representing a relatively lower impact on standing crop (Figure 10). However, the rice crop that survived flooding may exhibit adverse impacts either in the form of delayed progress of the reproductive stage or issues developing a sufficient number of panicles, ultimately leading to potential yield loss.
Figure 10.
District-wise distribution of severity of crop damaged area in ‘00 Ha.
6. Conclusions
The present study proposes a framework for near-real-time mapping of rainfall-induced inundation and impacted crop loss areas. Daily rainfall analysis showed two intense rainfall spells with significantly higher-than-normal magnitudes. The inundation was detected using backscatter analysis with pre- and post-peril dates and bimodal histogram thresholding. Hooghly, Murshidabad, Paschim Medinipur, and Purba Bardhaman were among the worst-hit districts, followed by Howrah, Purba Medinipur, North 24 Parganas and Birbhum. However, the impact of heavy rainfall was marginal over Nadia and Paschim Bardhaman. Multitemporal backscatter profiles with ground observations supported impact assessment of rainfall-induced flooding on rice crop. Thresholding and bimodal histogram methods facilitated inundation detection but were sensitive to landscape heterogeneity, diverse cropping patterns, and missed pixels. Integrating SAR profiles, optical indices, topography, and field data with machine learning can improve accuracy. The inclusion of crop phenology improved crop damage assessment, but average varietal timelines may not reflect local variability. Integrating local crop calendars and ground level inputs like farmer-reported transplanting dates can improve accuracy when capturing pixel-level phenological differences. This framework has been practically implemented in West Bengal under the Bangla Sasya Bima crop insurance scheme, demonstrating its applicability in supporting insurance claim validation and impact decision making. The study provides a relative assessment of the flooding affecting a standing rice crop based on the duration of inundation, recovery of crop during the post-peril period, and phenological information. However, inundation adversely affects crop health and yield, varying with the crop, soil and environment. Ground data during the pre- and post-peril period is essential for accurate impact assessment. This framework enhances transparency and accuracy in insurance claim settlements.
Author Contributions
Conceptualization: P.K.D.; methodology: P.K.D.; manuscript preparation: P.K.D.; data preparation: P.K.D., V.R. and T.K.; map output generation: V.R.; data curation: S.B.P.; development of model: S.B.P.; supervision: S.P. All authors have read and agreed to the published version of the manuscript.
Funding
The APC was funded by Bajaj General Insurance Ltd.
Institutional Review Board Statement
Not applicable.
Informed Consent Statement
Not applicable.
Data Availability Statement
Daily rainfall data were obtained from the Indian Meteorological Department (IMD) and are available upon request from the IMD (https://www.imdpune.gov.in/). Sentinel-1 Synthetic Aperture Radar (SAR) data are openly accessible through the Copernicus Open Access Hubs (https://scihub.copernicus.eu/). Government-referenced flood event information was sourced from official reports and is available upon resealable request from the respective government agencies.
Acknowledgments
The authors are thankful to Prakash Chauhan, Director, NRSC and S.K Srivastava, Chief General Manager, Regional Centers, NRSC for their continuous support and encouragements during the investigation. Authors are thankful to Arindam Guha, Head Applications, RRSC-East, NRSC for his suggestions and guidance. We thank Rituparna Das, RRSC-East for her support during preparation of revised manuscript. Authors duly acknowledge the contribution of Department of Agriculture, Government of West Bengal for providing necessary administrative and financial support under Bangla Shasya Bima Scheme. We also acknowledge the support received from Bajaj General Insurance Ltd. for field data collection, processing and funding the Article Processing Charges (APC) for publication.
Conflicts of Interest
Vikram Ranga was employed by Bajaj Allianz General Insurance Company. The remaining authors declare that the research was conducted in the absence of any commercial or financial relationships that could be construed as a potential conflict of interest.
References
- Mahapatra, S.; Paltasingh, K.R.; Peddi, D.; Sahoo, D.; Sahoo, A.K.; Mohanty, P. Evaluating Seasonal Risks in Cereal Yield Distributions in Southern India. J. Quant. Econ. 2025; online first. [CrossRef] [Scilit]
- Shukla, M.; Jangid, B.; Khandelwal, V.; Keerthika, A.; Shukla, A. Climate Change and Agriculture: An Indian Perspective: A Review. Agric. Rev. 2023, 44, 223–230. [Google Scholar] [CrossRef] [Scilit]
- Zhang, T.; Jiang, X.; Yang, S.; Chen, J.; Li, Z. A Predictable Prospect of the South Asian Summer Monsoon. Nat. Commun. 2022, 13, 7080. [Google Scholar] [CrossRef] [Scilit] [PubMed]
- Dhekale, B.S.; Nageswararao, M.M.; Nair, A.; Mohanty, U.C.; Swain, D.K.; Singh, K.K.; Arunbabu, T. Prediction of kharif rice yield at Kharagpur using disaggregated extended range rainfall forecasts. Theor. Appl. Climatol. 2017, 133, 1075–1091. [Google Scholar] [CrossRef] [Scilit]
- Vogel, E.; Donat, M.G.; Alexander, L.A.; Meinshausen, M.; Rau, D.K.; Karoly, D.; Meinshausen, N.; Frieler, K. The effects of climate extremes on global agricultural yields. Environ. Res. Lett. 2019, 14, 054010. [Google Scholar] [CrossRef] [Scilit]
- Ministry of Finance, GoI. Climate, Climate Change, and Agriculture. In Economic Survey 2017-18; Ministry of Finance, GoI.: New Delhi, India, 2018; Volume I. Available online: https://www.indiabudget.gov.in/budget2018-2019/economicsurvey2017-2018/index.html (accessed on 21 July 2025).
- Saleem, A.; Anwar, S.; Nawaz, T.; Fahad, S.; Saud, S.; Rahman, T.U.; Khan, M.N.R.; Nawaz, T. Securing a sustainable future: The climate change threat to agriculture, food security, and sustainable development goals. J. Umm Al-Qura Univ. Appl. Sci. 2024, 11, 595–611. [Google Scholar] [CrossRef] [Scilit]
- FAO. The Unjust Climate—Measuring the Impacts of Climate Change on Rural Poor, Women and Youth; FAO: Rome, Italy, 2024. [Google Scholar] [CrossRef] [Scilit]
- Ray Deepak, K.; James, S.G.; Graham, K.M.; Paul, C.W. Climate Variation Explains a Third of Global Crop Yield Variability. Nat. Commun. 2015, 6, 5989. [Google Scholar] [CrossRef] [Scilit]
- Davis, K.F.; Ashwini, C.; Narasimha, D.R.; Deepti, S.; Ruth, D. Sensitivity of Grain Yields to Historical Climate Variability in India. Environ. Res. Lett. 2019, 14, 064013. [Google Scholar] [CrossRef] [Scilit]
- Lesk, C.; Weston, A.; Angela, R.; Onoriode, C.; Jonas, J.; Sonali, M.; Kyle, F.D.; Megan, K. Compound Heat and Moisture Extreme Impacts on Global Crop Yields under Climate Change. Nat. Rev. Earth Environ. 2022, 3, 872–889. [Google Scholar] [CrossRef] [Scilit]
- Ghosh, R.K.; Gupta, S.; Singh, V. Demand for Crop Insurance in Developing Countries: New Evidence from India. J. Agric. Econ. 2020, 72, 293–320. [Google Scholar] [CrossRef] [Scilit]
- Yadav, A.; Megeji, N. Technology interventions in crop insurance. Insur. Regul. Dev. Auth. 2018, 16, 24–27. [Google Scholar]
- Mishra, A. Agriculture crop insurance in India: Key issues and way forward. Insur. Regul. Dev. Auth. 2018, 16, 21–23. [Google Scholar]
- Available online: https://pmfby.gov.in/ (accessed on 21 July 2025).
- Available online: https://geopard.tech/ (accessed on 21 July 2025).
- Available online: https://www.ers.usda.gov/ (accessed on 21 July 2025).
- Available online: https://agriculture.canada.ca/ (accessed on 21 July 2025).
- Ye, T.; Hu, W.; Barnett, B.J.; Wang, J.; Gao, Y. Area Yield index insurance or farm yield crop insurance? Chinese Perspectives on Farmers’ Welfare and government subsidy Effectiveness. J. Agric. Econ. 2019, 71, 144–164. [Google Scholar] [CrossRef] [Scilit]
- Bucheli, J.; Conrad, N.; Wimmer, S.; Dalhaus, T.; Finger, R. Weather insurance in European crop and horticulture production. Clim. Risk Manag. 2023, 41, 100525. [Google Scholar] [CrossRef] [Scilit]
- Adhikari, B.; Bag, M.K.; Bhowmick, M.K.; Kundu, C. Status paper on rice in West Bengal. Rice Knowl. Manag. Portal 2011, 27. Available online: https://www.researchgate.net/publication/255742981 (accessed on 21 July 2025).
- Ghosh, K.; Singh, A.; Mohanty, U.C.; Acharya, N.; Pal, R.K.; Singh, K.K.; Pasupalak, S. Development of a rice yield prediction system over Bhubaneswar, India: Combination of extended range forecast and CERES-rice model. Meteor. Appl. 2014, 22, 525–533. [Google Scholar] [CrossRef] [Scilit]
- Biswas, R. Study on ARIMA Modelling to forecast area and production of kharif rice in West Bengal. Cut. -Edge Res. Agric. Sci. 2021, 12, 142–151. [Google Scholar] [CrossRef] [Scilit]
- CGWB. Report on Status of Ground Water Quality in Coastal Aquifers of India; Government of India, Ministry of Water Resources, Central Ground Water Board: Faridabad, India, 2014; 121p.
- Bhowmick, M.K.; Srivastava, A.K.; Singh, S.; Dhara, M.C.; Aich, S.S.; Patra, S.R.; Ismail, A.M. Realizing the potential of coastal Flood-Prone areas for rice production in West Bengal: Prospects and challenges. In New Frontiers in Stress Management for Durable Agriculture; Springer: Singapore, 2020; pp. 543–577. [Google Scholar] [CrossRef] [Scilit]
- Islam, M.T.; Meng, Q. An Exploratory Study of Sentinel-1 SAR for Rapid Urban Flood Mapping on Google Earth Engine. Int. J. Appl. Earth Obs. Geoinf. 2022, 113, 103002. [Google Scholar] [CrossRef] [Scilit]
- DeVries, B.; Chengquan, H.; John, A.; Wenli, H.; John, W.J.; Megan, W.L. Rapid and Robust Monitoring of Flood Events Using Sentinel-1 and Landsat Data on the Google Earth Engine. Remote Sens. Environ. 2020, 240, 111664. [Google Scholar] [CrossRef] [Scilit]
- Available online: https://en.vikaspedia.in/ (accessed on 27 June 2025).
- Available online: https://irdai.gov.in/documents/ (accessed on 27 June 2025).
- Available online: https://banglashasyabima.net/downloadr4 (accessed on 27 June 2025).
- Goswami, J.; Senpakapriya, V.; Goswami, C.; Sarma, K.K.; Aggarwal, S.P. Disaster Preparedness and capacity building for Resilience in Agriculture. Int. Arch. Photogramm. Remote Sens. Spat. Inf. Sci. 2024, XLVIII-5-2, 17–22. [Google Scholar] [CrossRef] [Scilit]
- Adedeji, O.; Olusola, A.; James, G.; Shaba, H.A.; Orimoloye, I.R.; Singh, S.K.; Adelabu, S. Early warning systems development for agricultural drought assessment in Nigeria. Environ. Monitor. Ass. 2020, 192, 798. [Google Scholar] [CrossRef] [Scilit]
- Tellman, B.; Sullivan, J.A.; Kuhn, C.; Kettner, A.J.; Doyle, C.S.; Brakenridge, G.R.; Erickson, T.A.; Slayback, D.A. Satellite Imaging Reveals Increased Proportion of Population Exposed to Floods. Nature 2021, 596, 80–86. [Google Scholar] [CrossRef] [Scilit]
- Tavus, B.; Kocaman, S.; Nefeslioglu, H.A.; Gokceoglu, C. A fusion approach for flood mapping using sentinel-1 and sentinel-2 datasets. The Int. Arch. Photogramm., Remote Sens. Spatial Inf. Sci. 2020, XLIII-B3-2020, 641–648. [Google Scholar] [CrossRef] [Scilit]
- McCormack, T.; Campanyà, J.; Naughton, O. A Methodology for Mapping Annual Flood Extent Using Multi-Temporal Sentinel-1 Imagery. Remote Sens. Environ. 2022, 282, 113273. [Google Scholar] [CrossRef] [Scilit]
- Bhageerath, Y.V.S.; Babu, A.V.S.; Rao, K.H.V.D.; Sreenivas, K.; Chauhan, P. Flood period estimation using multi-sensor satellite data: Case study on Punjab floods 2023. J. Earth Syst. Sci. 2025, 134, 43. [Google Scholar] [CrossRef] [Scilit]
- Madushani, J.A.T.; Withanage, N.C.; Mishra, P.K.; Meraj, G.; Kibebe, C.G.; Kumar, P. Thematic and bibliometric review of Remote Sensing and Geographic Information System-Based Flood Disaster Studies in South Asia during 2004–2024. Sustainability 2025, 17, 217. [Google Scholar] [CrossRef] [Scilit]
- Saha, A.K.; Agrawal, S. Mapping and Assessment of Flood Risk in Prayagraj District, India: A GIS and Remote Sensing Study. Nanotechnol. Environ. Eng. 2020, 5, 11. [Google Scholar] [CrossRef] [Scilit]
- Panda, G.K.; Kishor, D. A Geographic Information System-Based Approach of Flood Hazards Modelling, Paschim Medinipur District, West Bengal, India. Jamba J. Dis. Risk Studies 2018, 10, 518. [Google Scholar] [CrossRef] [Scilit]
- Sanyal, J.; Lu, X.X. Remote Sensing and GIS-Based Flood Vulnerability Assessment Human Settlements: A Case Study of Gangetic West Bengal, India. Hydrol. Process. 2005, 19, 3699–3716. [Google Scholar] [CrossRef] [Scilit]
- Goswami, J.; Senpakapriya, V.; Goswami, C.; Sarma, K.K.; Aggarwal, S.P. Crop damage assessment in Assam due to floods 2021 (Kharif season). NESAC-SR 2021, 271. Available online: https://nerdrr.gov.in/assets/pdf/Cropdam/Crop%20damage%20assessment%20flood%202021.pdf (accessed on 29 July 2025).
- Kumar, S.; Parida, B.R. Crop insurance using geo-information: A strategy for climate change mitigation. Earth Obs. 2025, 79–95. [Google Scholar] [CrossRef] [Scilit]
- De, M.; Dey, S.R. Numerical Taxonomic analysis for the estimation of Genetic Diversity among some traditional rice (Oryza sativa L.) varieties of West Bengal. Int. J. Exp. Res. Rev. 2022, 29, 48–54. [Google Scholar] [CrossRef] [Scilit]
- Annual Report, 2010–2011; Department of Agriculture and Cooperation, Government of India, March 2011. Available online: https://agricoop.nic.in/sites/default/files/Annual-Report-2010-11.pdf (accessed on 29 July 2025).
- Available online: https://www.imdpune.gov.in/ (accessed on 15 September 2024).
- Torres, R.; Navas-Traver, I.; Bibby, D.; Lokas, S.; Snoeij, P.; Rommen, B.; Osborne, S.; Ceba-Vega, F.; Potin, P.; Geudtner, D. Sentinel-1 SAR system and mission. In Proceedings of the 2022 IEEE Radar Conference (RadarConf22), Seattle, WA, USA, 8–12 May 2017; pp. 1582–1585. [Google Scholar] [CrossRef] [Scilit]
- Kaur, R.; Tiwari, R.K.; Maini, R.; Singh, S. A framework for crop yield estimation and change detection using image fusion of microwave and optical satellite dataset. Quaternary 2023, 6, 28. [Google Scholar] [CrossRef] [Scilit]
- Razi, P.; Sumantyo, J.T.S.; Perissin, D.; Kuze, H. Long-Term land deformation monitoring using Quasi-Persistent Scatterer (Q-PS) technique observed by Sentinel-1A: Case Study Kelok Sembilan. Adv. Remote Sens 2018, 7, 277–289. [Google Scholar] [CrossRef]
- Sharma, V.K.; Azad, R.K.; Chowdary, V.M.; Jha, C.S. Delineation of frequently flooded areas using remote sensing: A case study in part of Indo-Gangetic Basin. In Water Science and Technology Library; Springer International Publishing: Cham, Switzerland, 2021; pp. 505–530. [Google Scholar] [CrossRef] [Scilit]
- Baghermanesh, S.S.; Jabari, S.; McGrath, H. Urban flood detection using TerraSAR-X and SAR Simulated reflectivity maps. Remote Sens. 2022, 14, 6154. [Google Scholar] [CrossRef] [Scilit]
- Shen, X.; Wang, D.; Mao, K.; Anagnostou, E.; Hong, Y. Inundation Extent Mapping by Synthetic Aperture Radar: A review. Remote Sens. 2019, 11, 879. [Google Scholar] [CrossRef] [Scilit]
- Mokhtarisabet, S.; Okoduwa, A.K. Geospatial assessment of environmental factors and flooding occurrences in Borno Metropolis, Northeastern Nigeria (1987–2024). Environ. Monit. Assess. 2025, 197, 615. [Google Scholar] [CrossRef] [Scilit]
- Singh, G.; Rawat, K.S. Mapping flooded areas utilizing Google Earth Engine and open SAR data: A comprehensive approach for disaster response. Discov. Geosci. 2024, 2, 5. [Google Scholar] [CrossRef] [Scilit]
- Matgen, P.; Hostache, R.; Schumann, G.; Pfister, L.; Hoffmann, L.; Savenije, H. Towards an automated SAR-based flood monitoring system: Lessons learned from two case studies. Phys. Chem. Earth Parts a/B/C 2010, 36, 241–252. [Google Scholar] [CrossRef] [Scilit]
- Fan, Y.; Amgain, N.R.; Rabbany, A.; Manirakiza, N.; Bai, X.; VanWeelden, M.; Bhadha, J.H. Assessing flood-depth effects on water quality, nutrient uptake, carbon sequestration, and rice yield cultivated on Histosols. Clim. Smart Agric. 2024, 1, 100005. [Google Scholar] [CrossRef] [Scilit]
- Hendrawan, V.S.A.; Komori, D. Developing flood vulnerability curve for rice crop using remote sensing and hydrodynamic modelling. Int. J. Disaster Risk Reduct. 2021, 54, 102058. [Google Scholar] [CrossRef] [Scilit]
- Bailey-Serres, J.; Lee, S.C.; Brinton, E. Waterproofing Crops: Effective Flooding Survival Strategies. Plant Physiol. 2012, 160, 1698–1709. [Google Scholar] [CrossRef] [Scilit]
- Sarkar, R.K.; Bhattacharjee, B. Genotypes with SUB1 QTL Differ in Submergence Tolerance, Elongation Ability during Submergence and Re-generation Growth at Re-emergence. Rice Sci. 2011, 5, 7. [Google Scholar] [CrossRef] [Scilit]
- Mullangie, D.P.; Thiyagarajan, K.; Swaminathan, M.; Ramalingam, J.; Natarajan, S.; Govindan, S. Breeding Resilience: Exploring Lodging Resistance Mechanisms in Rice. Rice Sci. 2024, 31, 659–672. [Google Scholar] [CrossRef] [Scilit]
- Liu, J.; Wang, Z.; Guo, X. Stem Characteristic Associated with Lodging Resistance of Rice Changes with Varied Alternating Drought and Flooding Stress. Agronomy 2022, 12, 3070. [Google Scholar] [CrossRef] [Scilit]
- Shrestha, B.B.; Kawasaki, A.; Zin, W.W. Development of flood damage functions for agricultural crops and their applicability in regions of Asia. J. Hydrol. Reg. Stud. 2021, 36, 100872. [Google Scholar] [CrossRef] [Scilit]
- Agusta, H.; Santosa, E.; Dulbari Guntoro, D.; Zaman, S. Continuous heavy rainfall and wind velocity during flowering affect rice production. Agrivita 2022, 44, 290–302. [Google Scholar] [CrossRef] [Scilit]
- Agnihotri, A.K.; Anurag, O.; Shishir, G.S.; Nilendu, D.; Sachin, M. Flood Inundation Mapping and Monitoring Using SAR Data and Its Impact on Ramganga River in Ganga Basin. Environ. Monit. Assess. 2019, 191, 760. [Google Scholar] [CrossRef] [Scilit]
- Kumar, R.; Seema, R.; Pyarimohan, M. Assessing the Impacts of Amphan Cyclone over West Bengal, India: A Multi-Sensor Approach. Environ. Monit. Assess. 2021, 193, 283. [Google Scholar] [CrossRef] [Scilit]
- Das, P.K.; Kumar, T.; Bandyopadhyay, S.; Banerjee, S. Impact assessment of cyclone Amphan on agriculture over parts of West Bengal using remote sensing. J. Indian Soc. Coast. Agric. Res. 2021, 40, 100–109. [Google Scholar] [CrossRef] [Scilit]
- Singh, A.K.; Thendiyath, R.; Vivekanand, S. Evaluating the Association of Flood Mapping with Land Use and Land Cover Patterns in the Kosi River Basin (India). Acta Geophys. 2024, 72, 4649–4669. [Google Scholar] [CrossRef] [Scilit]

Disclaimer/Publisher’s Note: The statements, opinions and data contained in all publications are solely those of the individual author(s) and contributor(s) and not of MDPI and/or the editor(s). MDPI and/or the editor(s) disclaim responsibility for any injury to people or property resulting from any ideas, methods, instructions or products referred to in the content. |
© 2026 by the authors. Licensee MDPI, Basel, Switzerland. This article is an open access article distributed under the terms and conditions of the Creative Commons Attribution (CC BY) license.