


Abstract
In the context of China’s “dual-carbon” strategy, the Beijing 2022 Winter Olympics provides a critical case for examining whether carbon-neutral commitments can be translated into measurable and lasting environmental outcomes through a closed-loop governance mechanism. This study develops an integrated analytical framework linking institutional design, policy tools, monitoring–reporting–verification (MRV), and environmental legacy, and evaluates full life-cycle carbon-neutral governance and post-event environmental performance using officially verified carbon accounting materials, governmental disclosures, and publicly available statistical data from 2016–2022. We synthesize the emission structure across preparation and Games-time phases, examine key mitigation and offset portfolios, and assess multi-dimensional environmental indicators in Beijing and Zhangjiakou, including atmospheric quality, energy structure transition, ecological restoration, and low-carbon transport systems. The results suggest that an MRV-centered governance chain strengthened accounting transparency and compliance-oriented implementation, while environmental indicators in the competition zones exhibited sustained improvement over the study period. To reduce over-attribution under concurrent national clean-air policies and macro-level environmental governance trends, we benchmarked host-zone indicators against external reference statistics and interpret the observed improvements as an “acceleration effect” under bounded inference rather than a strict net causal contribution. The findings highlight the importance of hotspot-oriented asset-chain governance (transport infrastructure and venue construction), robust MRV disclosure, and quality-controlled offsets in shaping credible environmental legacies, and provide policy implications for future mega-events seeking to balance carbon neutrality with long-term regional sustainability.
1. Introduction
Large-scale international sports events are increasingly regarded as “stress tests” for urban governance and sustainable development due to their high investment intensity, concentrated construction activities, and substantial environmental externalities [1,2,3]. Venue construction, transport infrastructure expansion, and event-time operations may generate short-term pressures on energy systems and local ecosystems, while well-designed governance arrangements can also convert mega-events into time-bound “policy windows” that accelerate infrastructure upgrading, energy transition, and regulatory innovation with potential long-term legacy benefits [3].
As the first Olympic Games hosted after the release of the Olympic Agenda 2020+5, the Beijing 2022 Winter Olympics (Beijing 2022) committed to whole-life-cycle carbon-neutral management from the bidding stage. The “Green Olympics” vision was promoted in parallel with China’s national “dual-carbon” strategy, positioning the Games as a high-profile governance experiment to integrate top-down climate commitments with implementation tools, transparency mechanisms, and legacy-oriented regional development objectives [4,5,6,7]. In addition to the Games-time operational measures, Beijing 2022 involved extensive preparation-phase activities, particularly in transport infrastructure and venue-related asset chains, which are critical for understanding the governance priorities and the structural sources of emissions across the event life cycle.
Despite the release of official verification materials such as the Low-Carbon Management Report (pre-event) and the Low-Carbon Management Report (Games-time), existing research on Beijing 2022 remains constrained by two limitations. First, many studies focus on isolated elements of carbon-neutral practice—such as accounting results, offset schemes, or operational energy efficiency—while providing insufficient integration of how institutional design, policy instruments, and MRV jointly translate commitments into measurable environmental performance [8,9,10]. Second, evidence is often concentrated on the Games period, with limited attention to post-event environmental legacy and the sustainability of observed improvements beyond the event window [11,12,13]. In particular, when host-zone air quality and ecological indicators improve monotonically over time, it becomes methodologically challenging to distinguish the marginal contribution of the event from concurrent nationwide environmental policies, including the broader context of China’s air-pollution control and “Blue Sky” initiatives.
To address these gaps, this study proposes a closed-loop analytical framework linking institutional design, policy tools, MRV, and environmental legacy outcomes, using Beijing and Zhangjiakou as the empirical settings. Institutional design functions as the top-down driver that establishes strategic orientation and governance legitimacy through national climate targets and Olympic sustainability requirements [14]. Policy tools act as the implementation engine that operationalizes carbon-neutral actions via coordinated instrument mixes, including low-carbon transport systems, ecological restoration projects, energy structure adjustment, and market-enabled mechanisms where applicable [15,16]. MRV serves as the transparency bridge that connects actions and outcomes through standardized inventories, disclosure practices, and third-party verification [17,18]. Environmental legacy is conceptualized as the measurable and persistent improvement in atmosphere, ecology, energy structure, and low-carbon mobility capacity in the host regions.
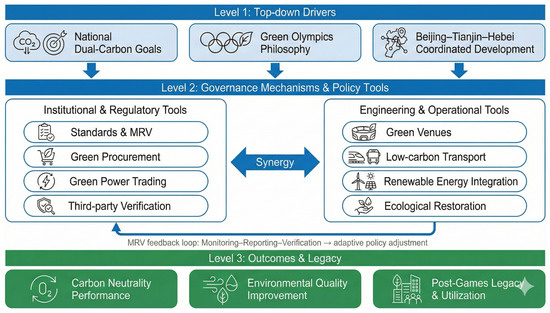
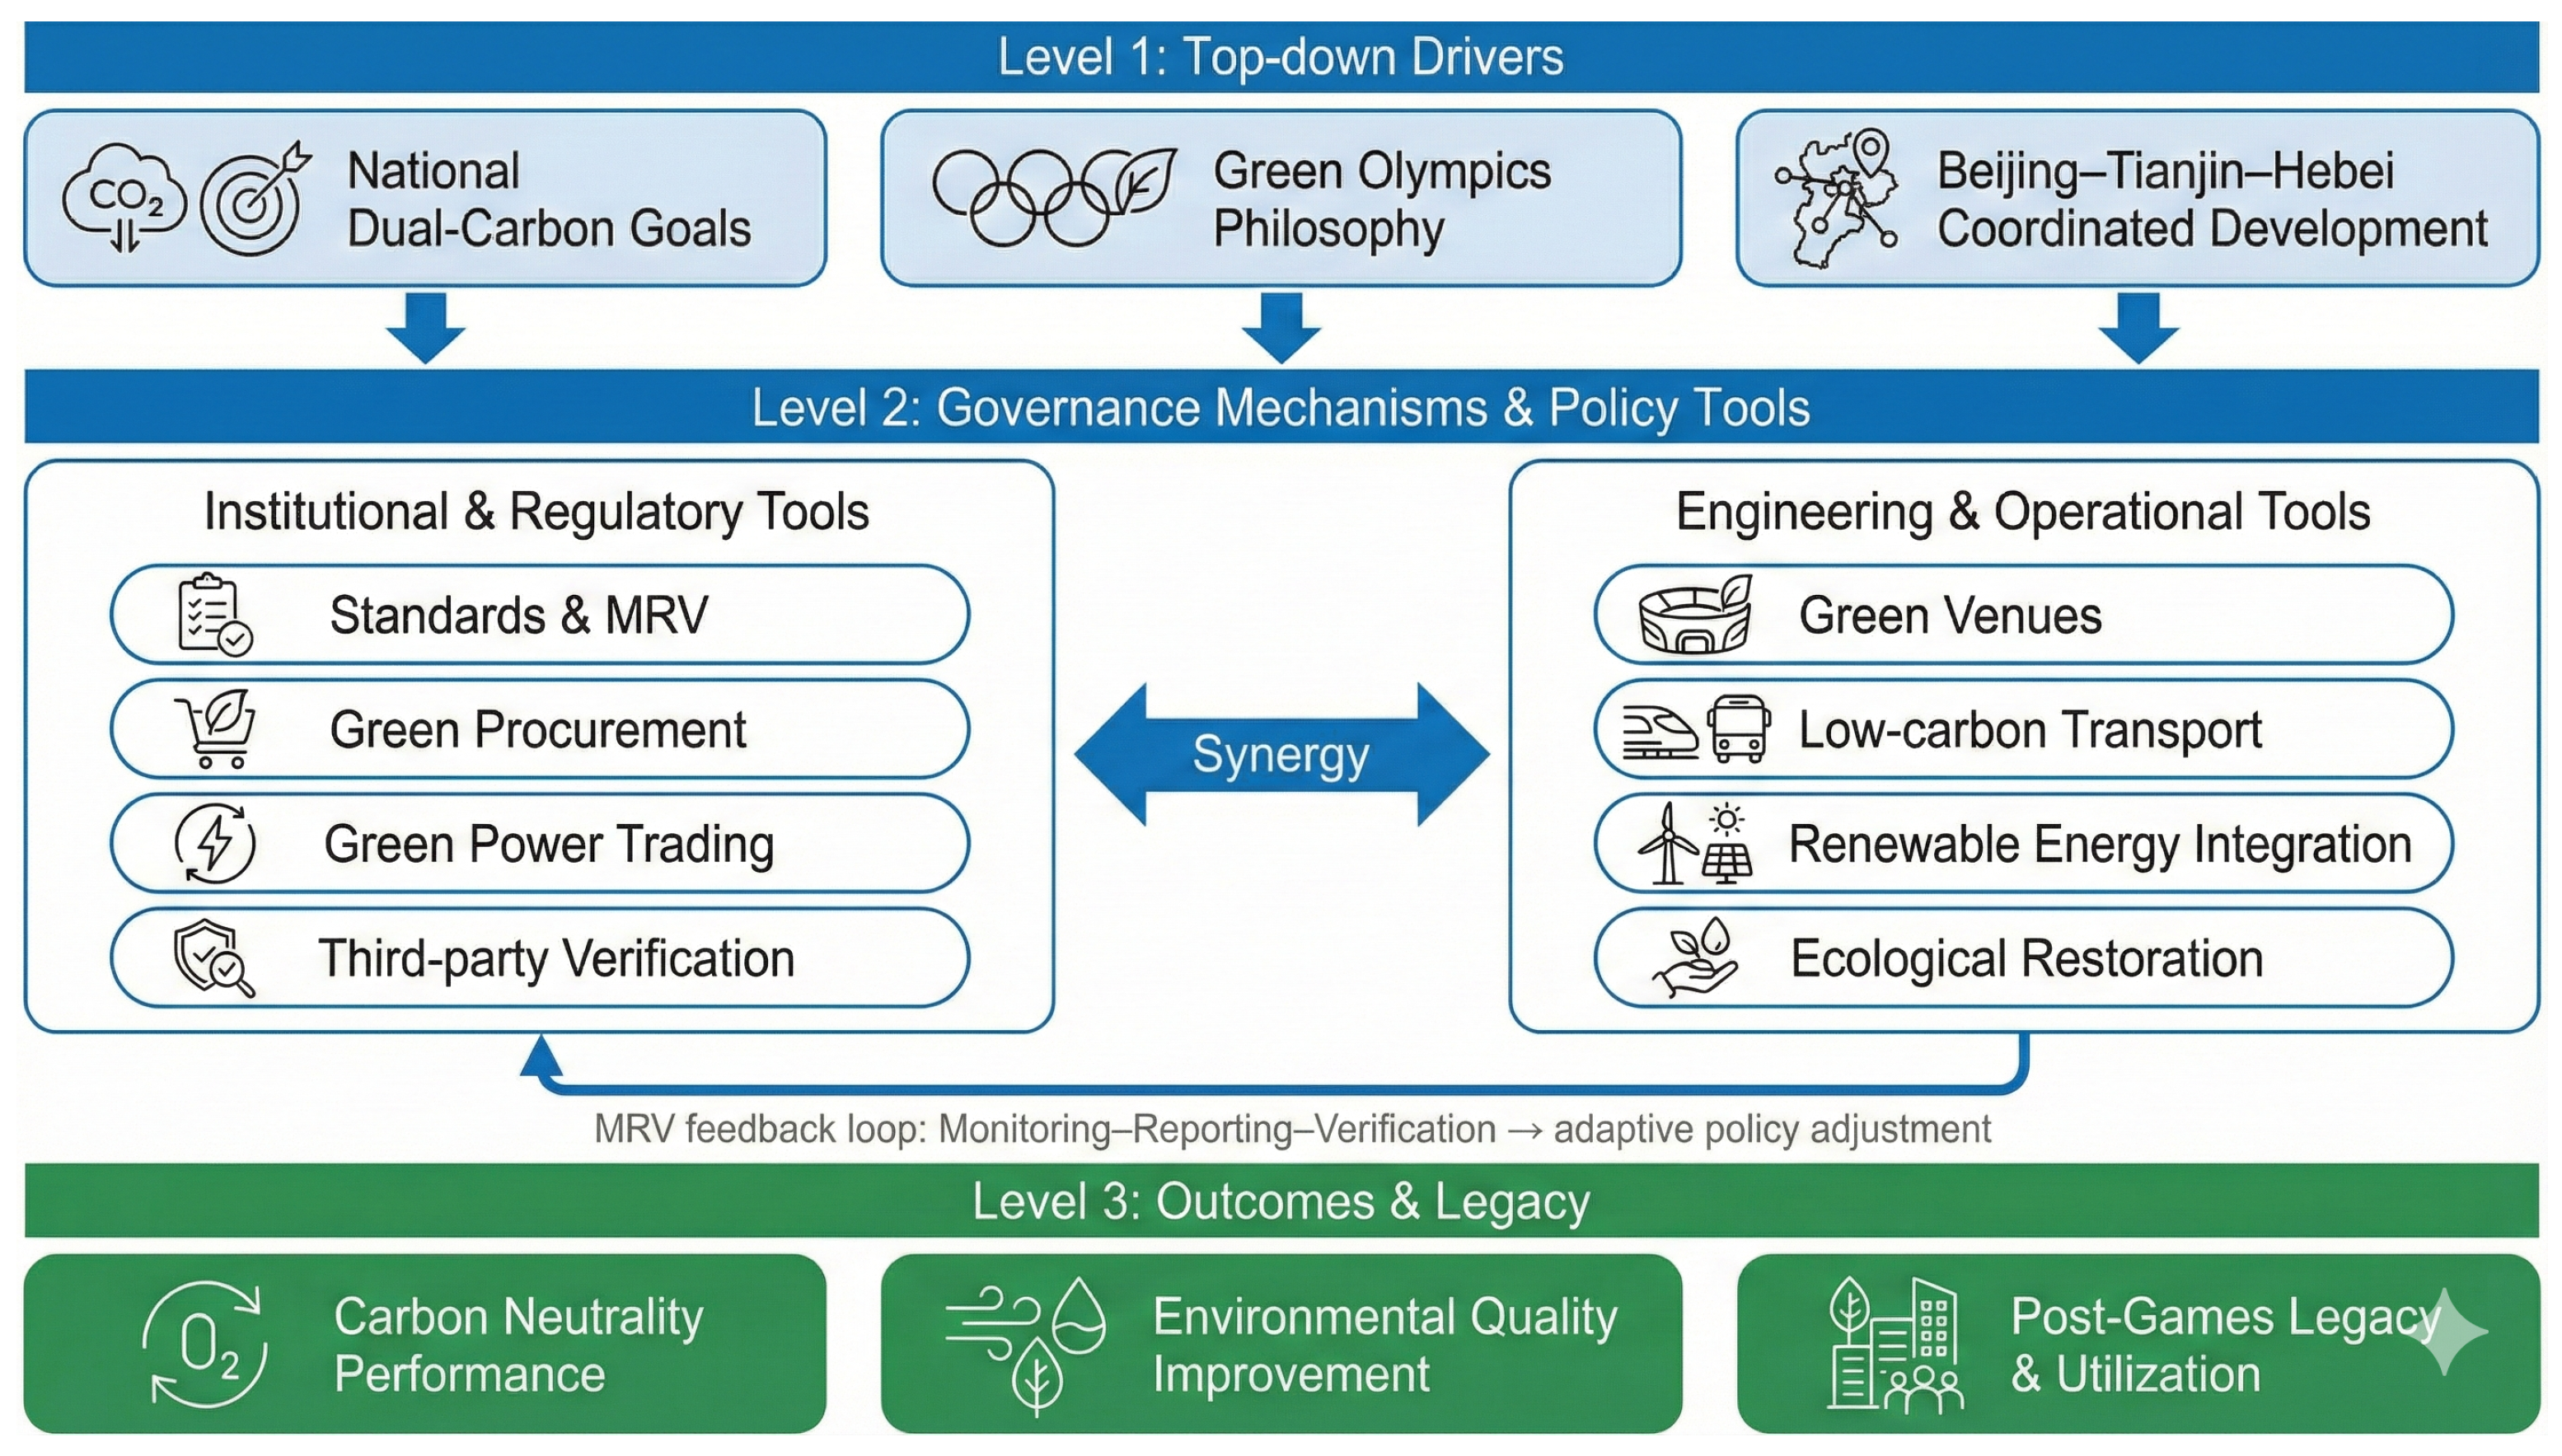
To clarify the analytical logic and improve the alignment between governance mechanisms and outcome evaluation, Figure 1 visualizes the proposed closed-loop framework and its corresponding “tools–mechanisms–indicators” pathway.
Figure 1.
Conceptual framework of closed-loop environmental governance for the Beijing 2022 Winter Olympics (Institutional Design–Policy Tools–MRV–Environmental Legacy). Source: Developed by the authors for this study.
Based on this framework, this study organizes evidence along a “tools–mechanisms–indicators” logic to enhance analytical alignment between governance mechanisms and outcome evaluation, while explicitly acknowledging data-access constraints and attribution boundaries. Using officially verified carbon accounting materials and multi-source public statistics from 2016 to 2022, the study aims to answer three questions: (1) From a full life-cycle perspective, what are the quantified performances of Beijing 2022 in carbon neutrality governance and multi-dimensional environmental outcomes? (2) How did the policy instrument mix function across administrative levels and sectors to generate implementation synergies under a closed-loop governance design? (3) What institutional lessons and policy implications can be derived for future carbon-neutral mega-events seeking credible environmental legacies under varying governance capacities and market conditions?
2. Materials and Methods
2.1. Study Design and Analytical Framework
This study adopts a framework-driven evaluation design to examine whether and how carbon-neutral commitments in mega-events can be translated into measurable environmental outcomes and long-term environmental legacy through a closed-loop governance mechanism. Guided by the proposed “Institutional Design–Policy Tools–MRV–Environmental Legacy” framework (Figure 1), the analysis is structured along a “tools–mechanisms–indicators” logic, linking governance arrangements to both carbon-neutrality performance and post-event environmental outcomes. The empirical focus covers Beijing and Zhangjiakou as the core host areas, and the analytical window spans 2016–2022 to capture key dynamics across the preparation period, Games-time implementation, and early post-event legacy phase.
2.2. Data Sources and Transparency Constraints
This study relies on three categories of data sources: (1) officially verified carbon accounting materials and MRV-related disclosures released by the organizing committee and relevant authorities, including pre-event and Games-time carbon-neutral management reports; (2) governmental policy documents and official disclosures describing instrument implementation in areas such as energy transition, ecological restoration, low-carbon transport, and venue/infrastructure development; and (3) publicly available statistical data and environmental bulletins for Beijing and Zhangjiakou during 2016–2022, used to evaluate multi-dimensional environmental performance trends.
It should be acknowledged that activity-level datasets underlying certain accounting components (e.g., facility-level energy consumption, project-level construction activity logs, and granular mitigation baselines) are not fully accessible through public channels. This limits the ability to conduct strict causal identification of the marginal environmental contribution attributable solely to the Beijing 2022 Winter Olympics. To improve transparency under data opacity, this study explicitly distinguishes between (i) MRV-verifiable evidence reported in official verification materials and (ii) macro-level environmental performance indicators derived from public statistics. Where feasible, external benchmark comparisons are introduced to reduce over-attribution under concurrent national air-pollution control and broader environmental governance trends. Accordingly, empirical interpretations are presented under bounded inference, emphasizing consistency, plausibility, and triangulation rather than net causal attribution.
2.3. Indicator System and Measurement Logic
To evaluate full life-cycle carbon-neutral governance and environmental legacy outcomes, we construct a multi-dimensional indicator system covering carbon accounting structure, mitigation and offset portfolios, and environmental performance outcomes. Carbon-neutrality indicators include total life-cycle emissions, stage-specific emission shares (preparation vs. Games-time), and categorized sources such as venue construction, transport infrastructure, energy systems, and event operations. Governance indicators include institutional arrangements, policy tool types, and implementation pathways that enable carbon-neutral actions through coordinated instrument mixes. Environmental legacy indicators capture measurable trends in atmospheric quality, energy structure transition, ecological restoration, and low-carbon transport capacity in the host regions.
In line with the life-cycle emission structure, the policy-tool analysis follows a hotspot-oriented asset-chain principle, prioritizing transport infrastructure and venue construction segments as the primary governance battlegrounds, while treating Games-time operational tools as complementary measures. This design aligns analytical emphasis with structural emission hotspots and directly addresses potential misalignment between emission contributions and policy discussion.
2.4. Analysis Strategy and Presentation
The empirical assessment proceeds in three steps. First, we synthesize the emission structure and carbon-neutral governance chain using official verification materials, reporting stage-specific emissions and the composition of mitigation and offset portfolios. Second, we map institutional drivers and policy tools onto the closed-loop framework, identifying cross-sector implementation mechanisms and MRV arrangements that support transparency and accountability. Third, we evaluate environmental legacy outcomes using multi-source public indicators and interpret long-term trends with explicit attribution boundaries. To reduce over-attribution under concurrent national policy interventions, environmental trends are triangulated using external reference statistics when available, and improvements are interpreted as a plausible acceleration effect under bounded inference rather than strict net causal attribution.
3. Results: MRV Evidence, Instrument Performance, and Environmental Legacy
3.1. MRV Carbon Accounting Evidence: Baseline Revision vs. Counterfactual Comparison
3.1.1. Baseline–Revised Baseline–Actual/Estimated Emissions
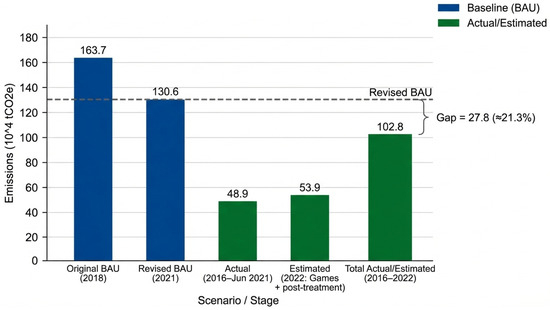
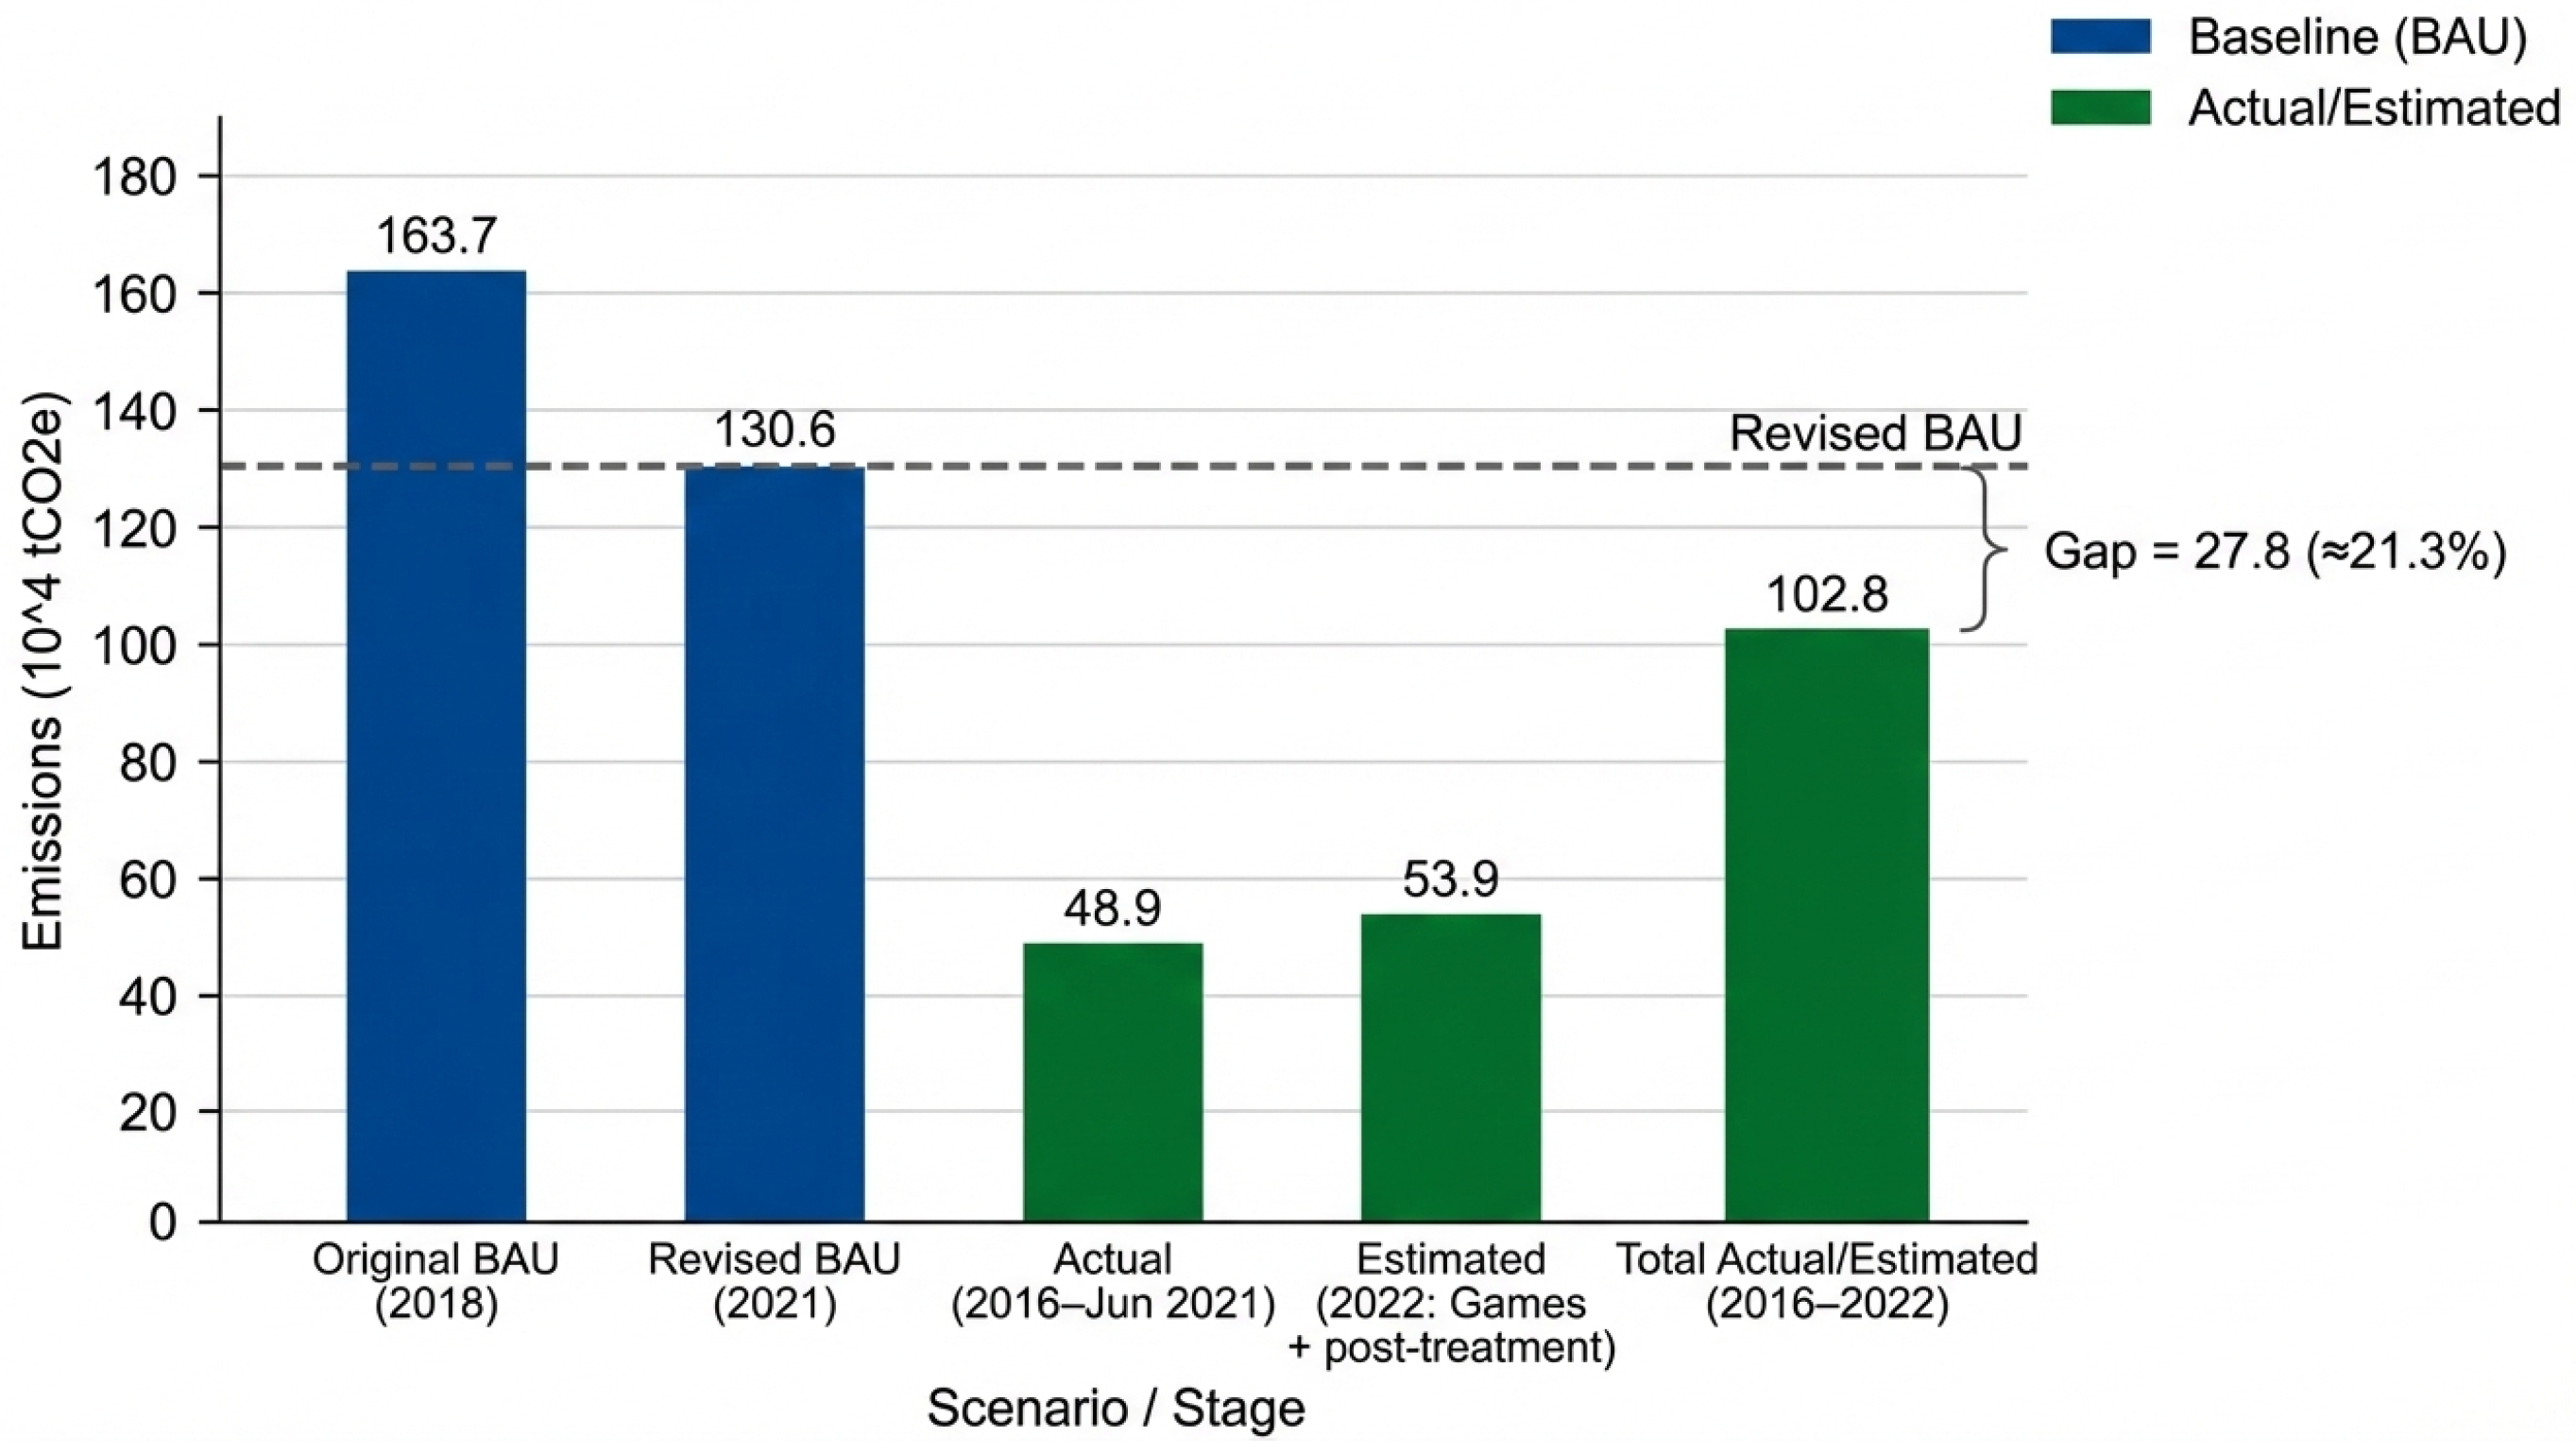
As shown in Figure 2, the Beijing 2022 Winter Olympics adopts a three-tier scenario comparison framework of “original baseline–revised baseline–actual/estimated emissions”. The original baseline scenario estimated in 2018 is 163.7 × 10⁴ tCO2e. After updating activity levels and emission factors to form the revised baseline, emissions are 130.6 × 10⁴ tCO2e. The actual emissions during the preparation period (June 2016–2021) are 48.9 × 10⁴ tCO2e, and the estimated emissions for the Games-time and post-Games treatment phase in 2022 are 53.9 × 10⁴ tCO2e, with a combined actual/estimated total of 102.8 × 10⁴ tCO2e for 2016–2022 [19,20,21].
Figure 2.
Life-cycle GHG emissions: baseline (BAU) vs. actual/estimated emissions (2016–2022).
Figure 2 shows that a significant “opening” has been created between the revised baseline and actual/estimated emissions, providing a counterfactual basis for interpreting the performance of integrated mitigation and governance arrangements. In the subsequent discussion, this difference is not mechanically attributed solely to the Winter Olympics, but is interpreted within the broader context of national environmental governance, with the event potentially functioning as an acceleration factor that compresses policy delivery and coordination intensity during the event window. Table A1 (in Appendix A) provides detailed values for the above scenarios.
3.1.2. Identification of Emission Hot Spots: High-Carbon Asset Segments as the Main Battlefield of Governance
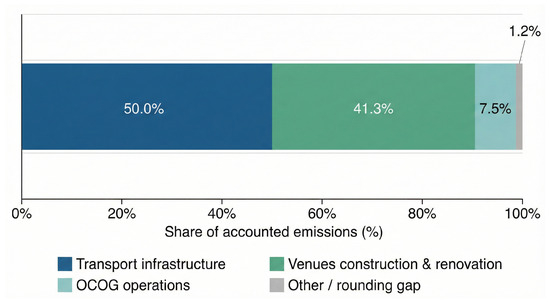
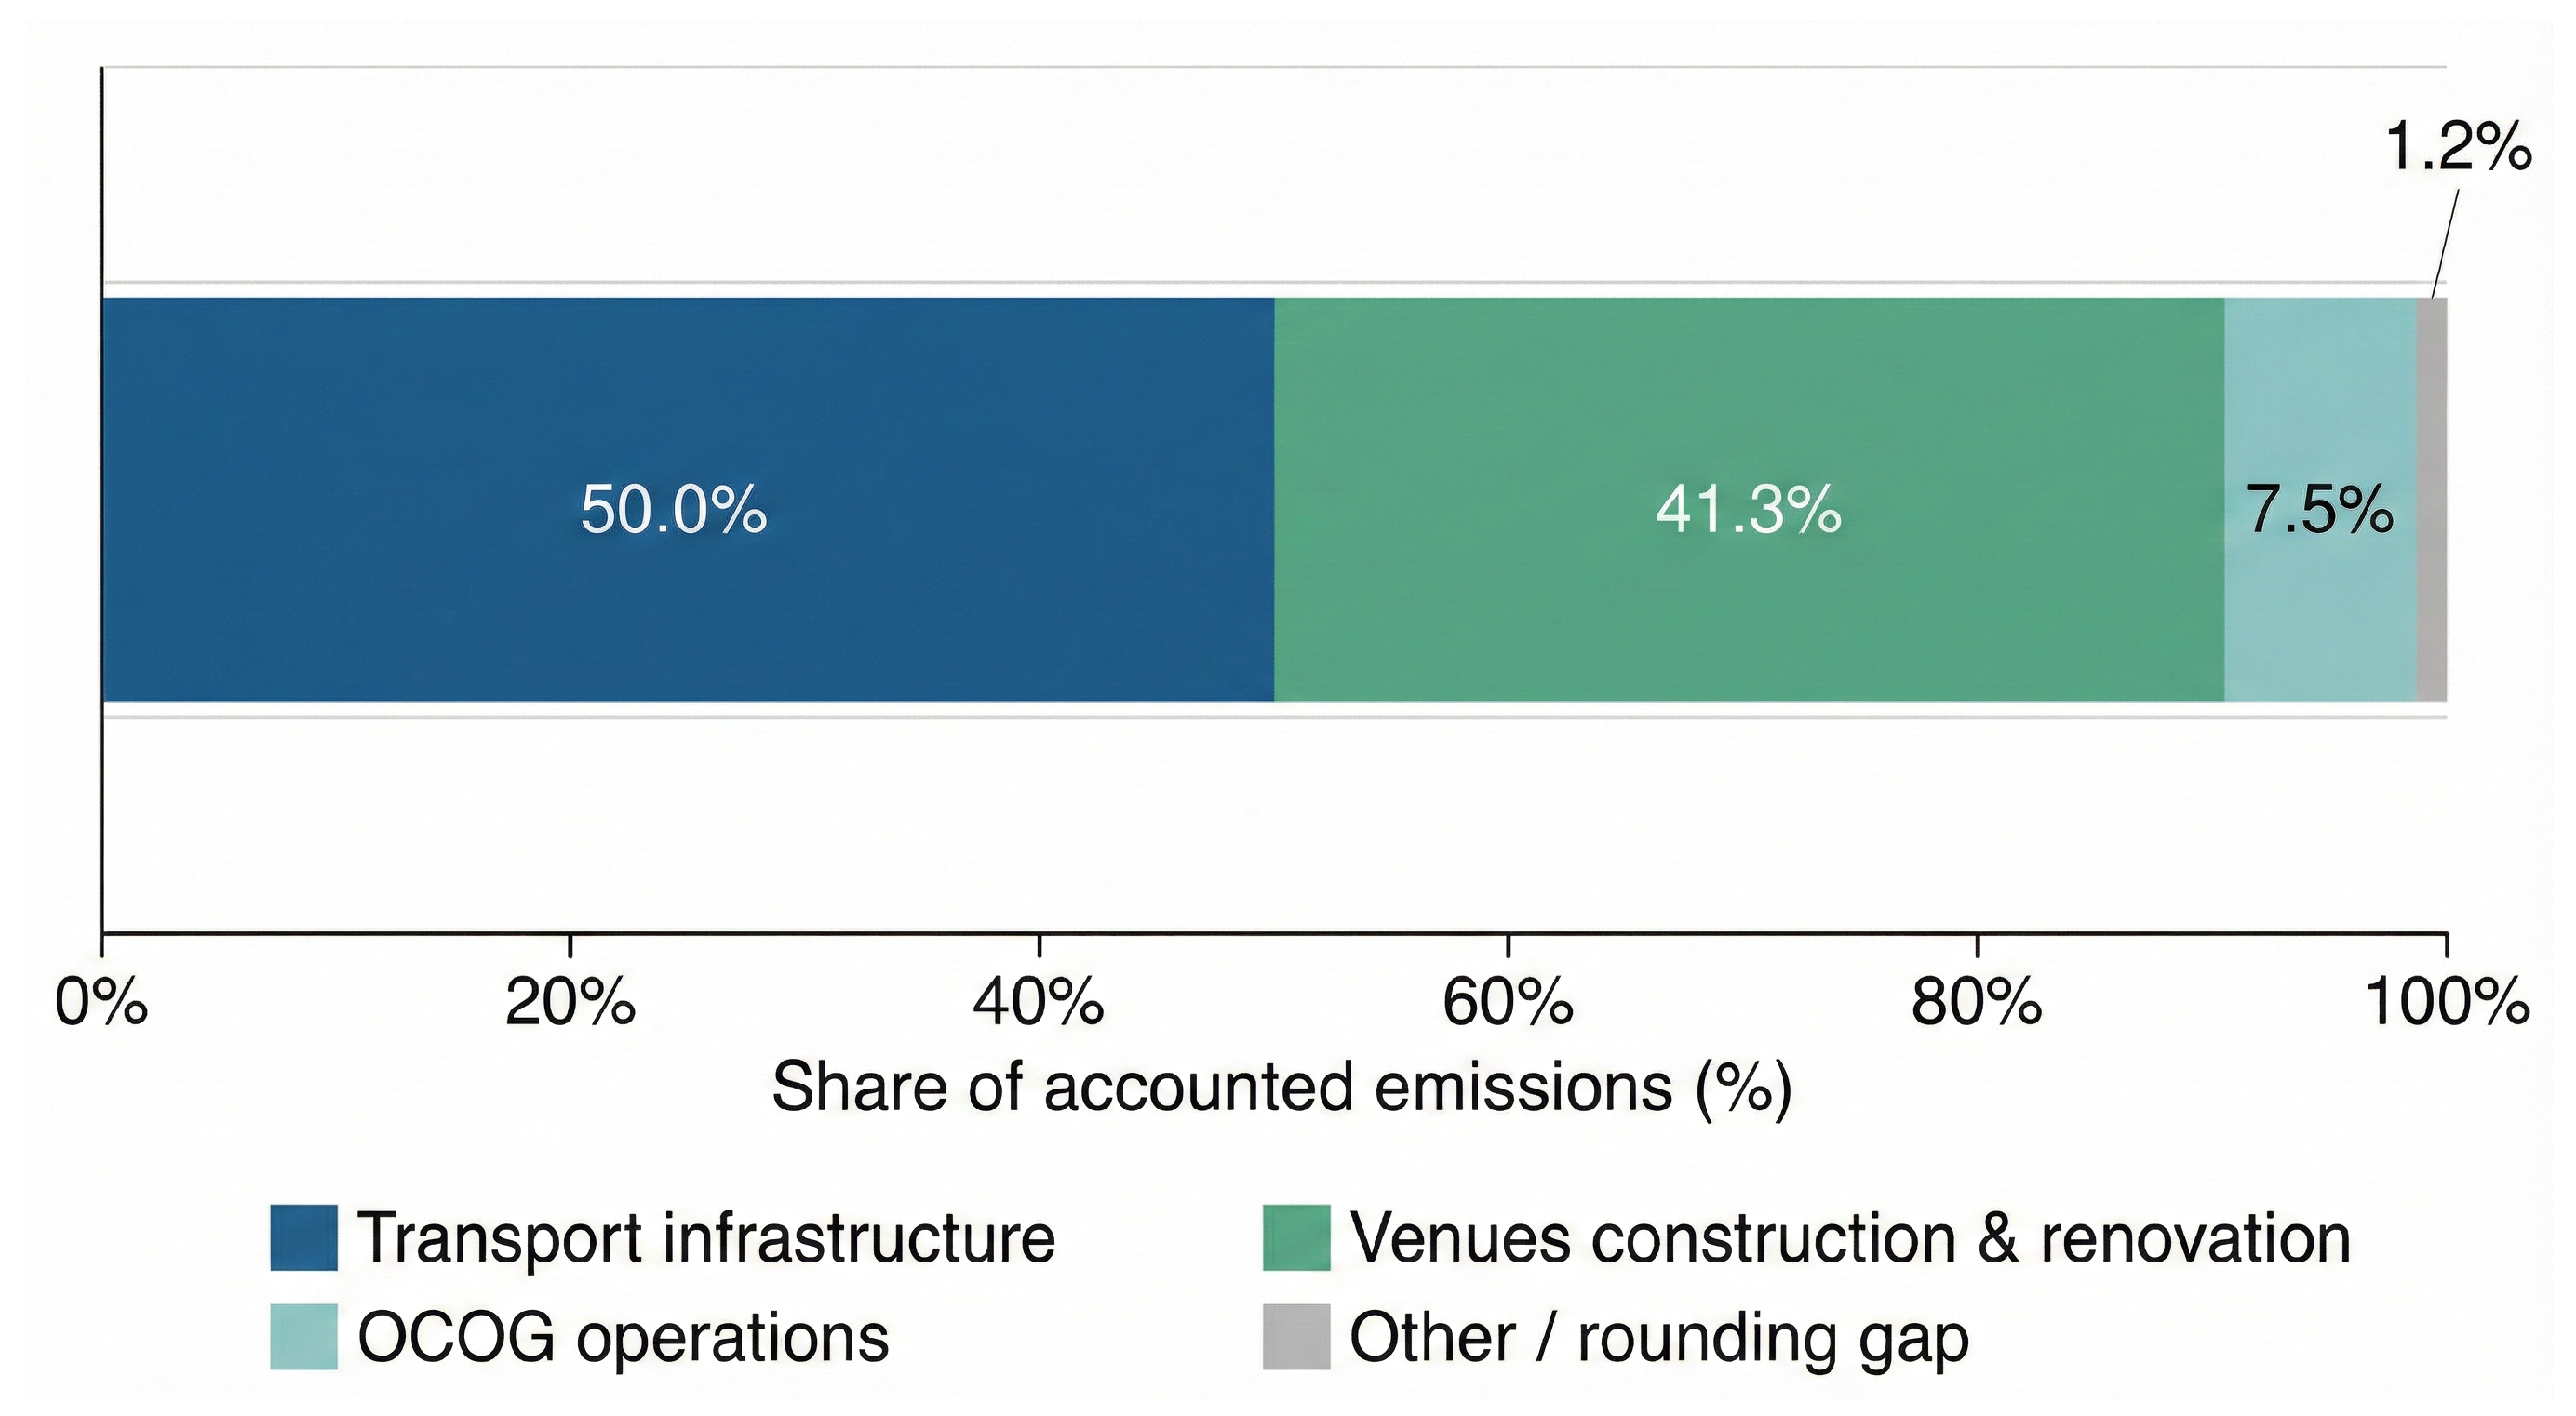
As shown in Figure 3, the emissions during the preparation period are highly concentrated in the two high-carbon asset segments of transportation infrastructure and venue construction and renovation, which together account for more than 90% of the total. The office and operational emissions of the organizing committee were about 3.67 × 10⁴ tCO2e, which accounted for a relatively low proportion of total emissions.
Figure 3.
Structure of GHG emissions during the preparation period: share of emissions from transportation infrastructure, venue construction and renovation, and organizing committee operation.
Figure 3 indicates that it will be difficult to achieve substantial emission reduction performance if governance focuses mainly on small-scale and symbolic behavioral advocacy measures, while ignoring high-carbon asset chains such as transportation infrastructure and venues. Therefore, this study emphasizes the “hotspot-first” governance logic and focuses on structural mitigation toolchains associated with energy systems, venues, and transportation infrastructure in the subsequent analysis.
3.2. Accounting–Emission Reduction–Offsetting–Net Balance: A Verifiable Closed Loop of Carbon-Neutral Pathways
As shown in Table 1, the MRV system not only provides the total emissions during the preparation period, but also reports high-granularity information in terms of sub-emissions, sub-area emission reductions, offset structures, and public participation.
Table 1.
Key carbon accounting, mitigation, and offsetting indicators (2016–2021).
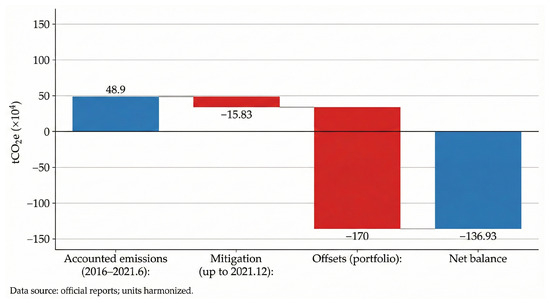
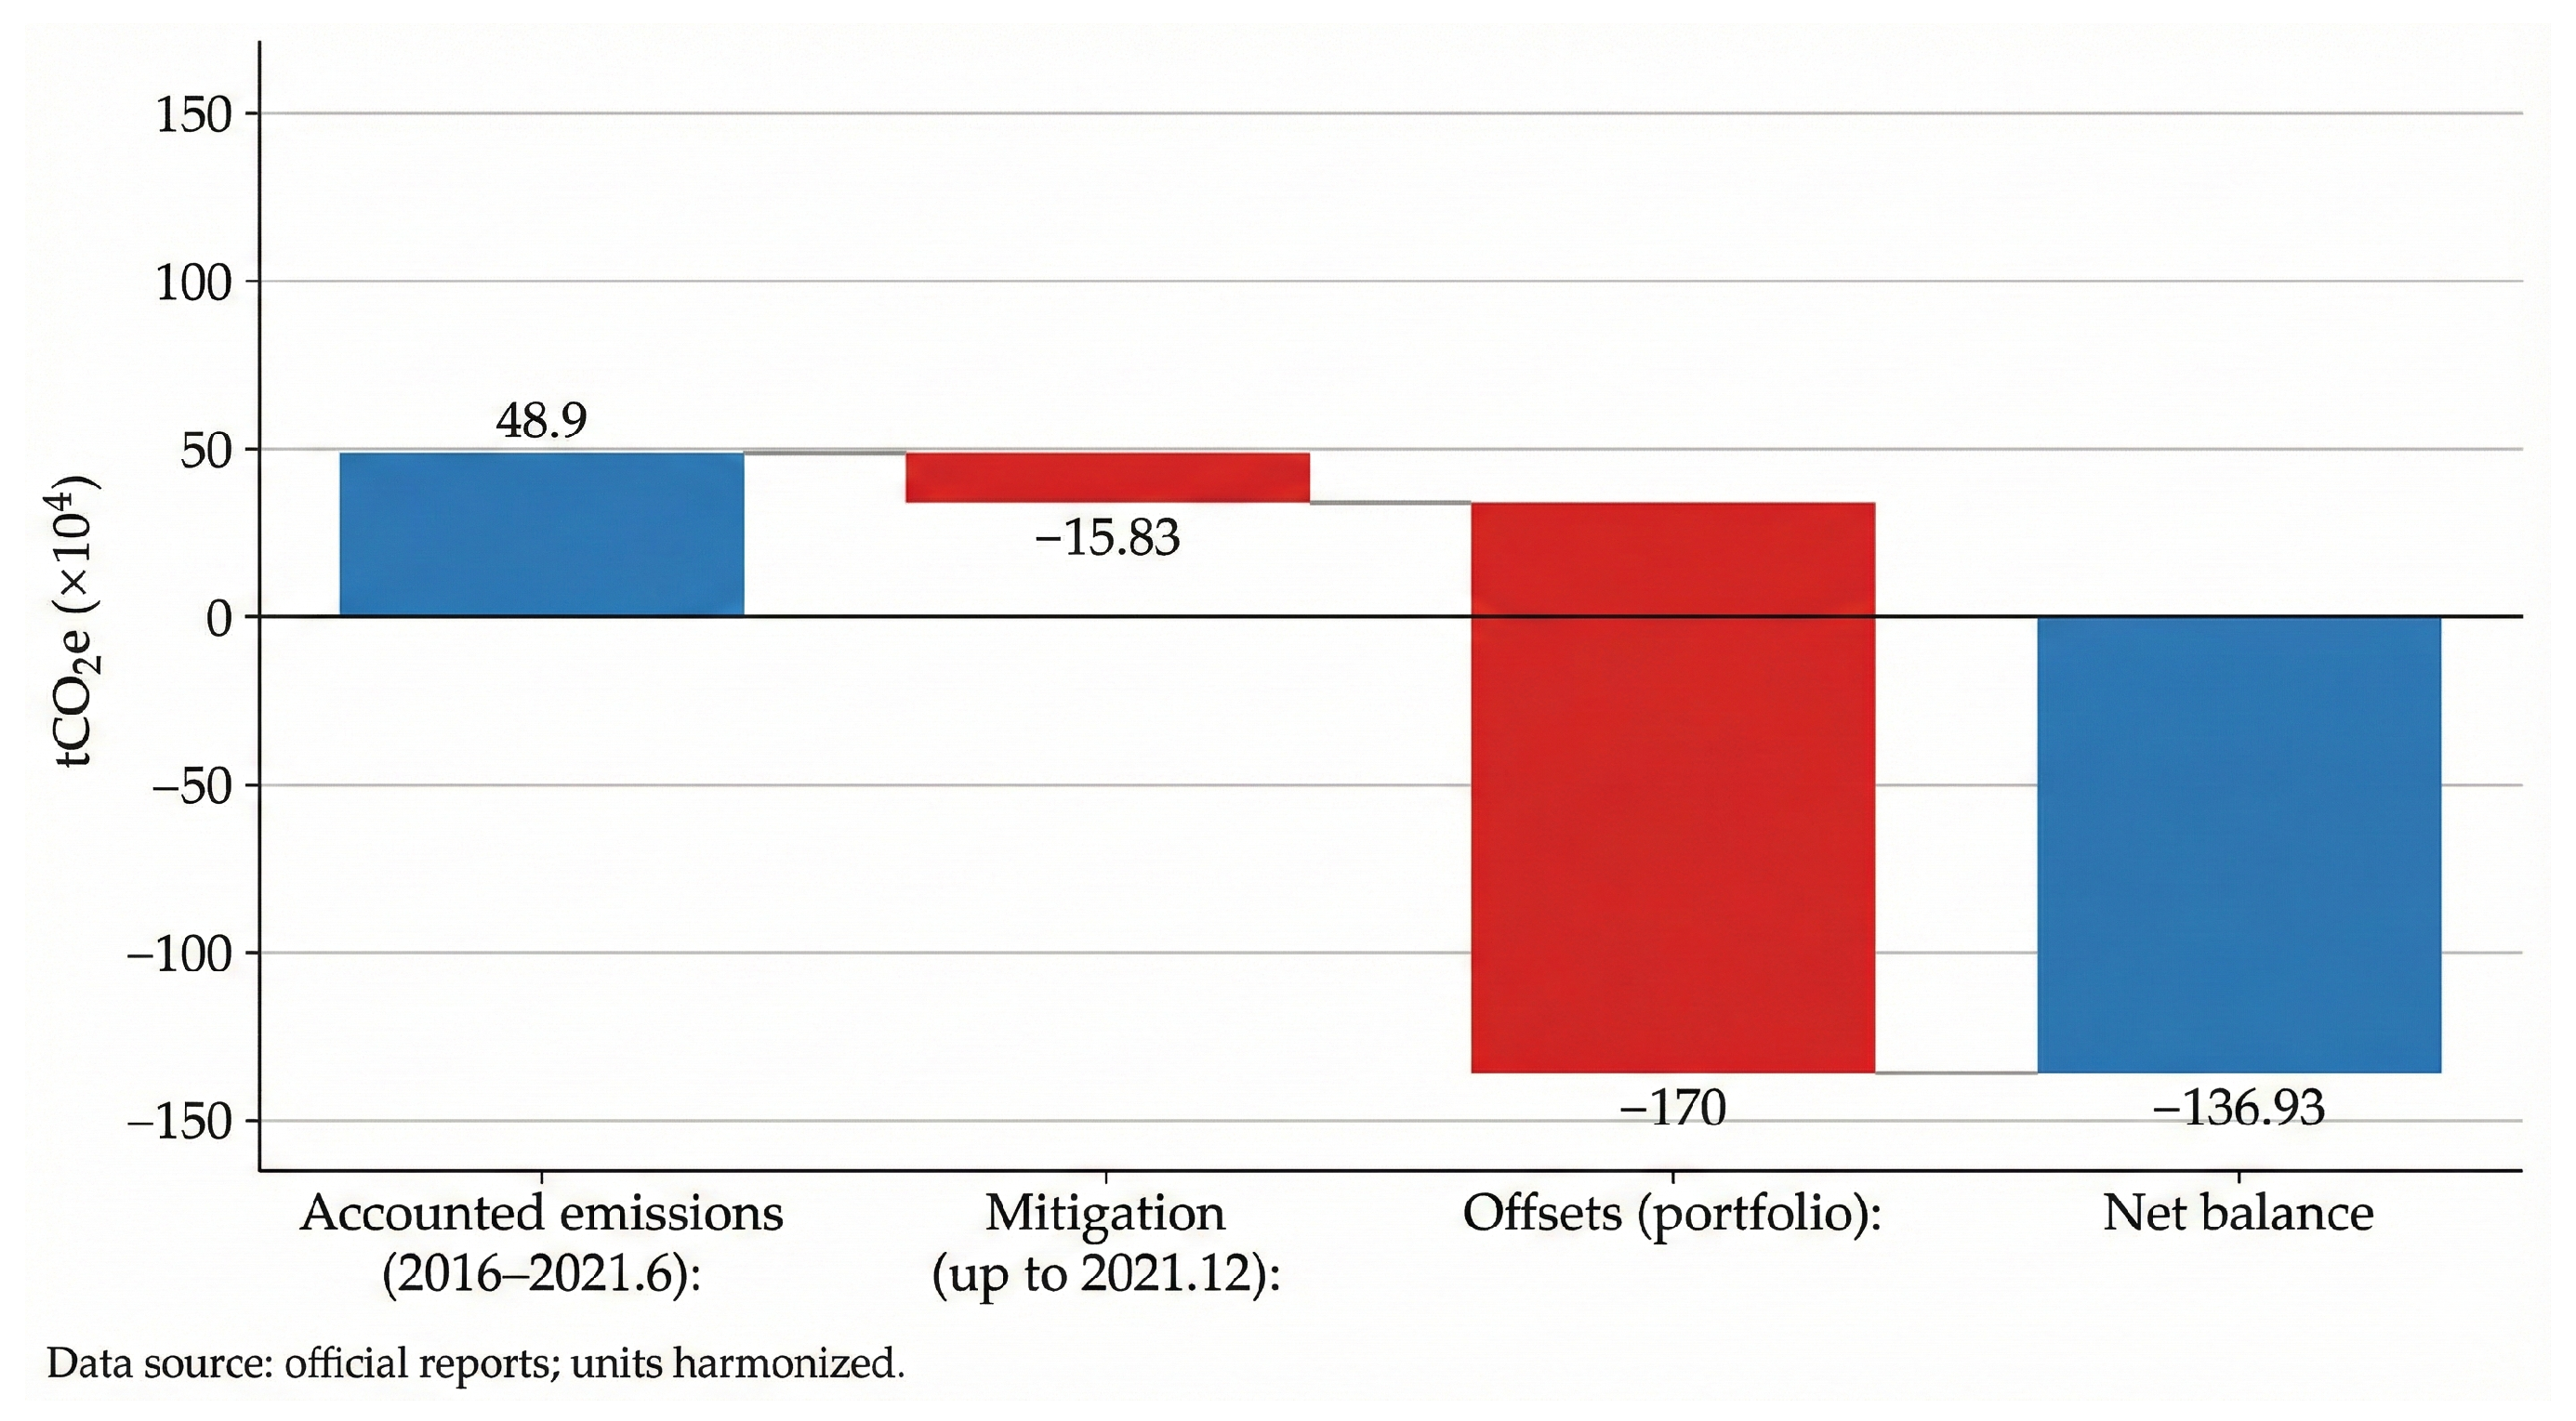
Based on the MRV disclosure and verified accounting materials, Figure 4 summarizes the closed-loop pathway of carbon-neutral governance in the preparation period, which follows the sequence of “accounting emissions–prioritizing emission reduction–offsetting remaining emissions–net balance”. This closed-loop structure clarifies the quantitative linkage between accounting boundaries, mitigation tools, and offsetting portfolios, thereby supporting transparent verification of the carbon-neutral claim.
Figure 4.
Carbon-neutral pathway in the preparation period: accounting emissions–prioritizing emission reduction–offsetting remaining emissions–net balance.
3.3. Market Incentives and Systemic Support: Green Power Trading and Energy Infrastructure Performance
As shown in Table 2, green power trading, as a market-incentive tool, is auditable in terms of coverage, trading scale, and discounted emission reduction. Meanwhile, systemic energy-support tools such as pumped storage provide a capacity base for clean power access and peak shifting.
Table 2.
Quantitative evidence for green electricity trading and systemic energy-support tools (market-incentive toolchain).
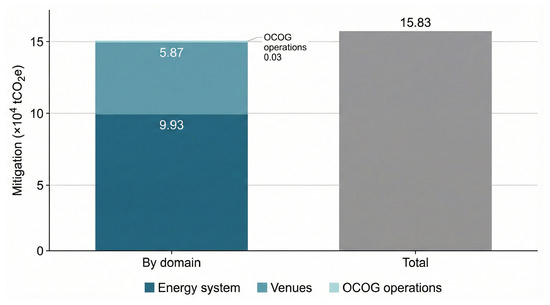
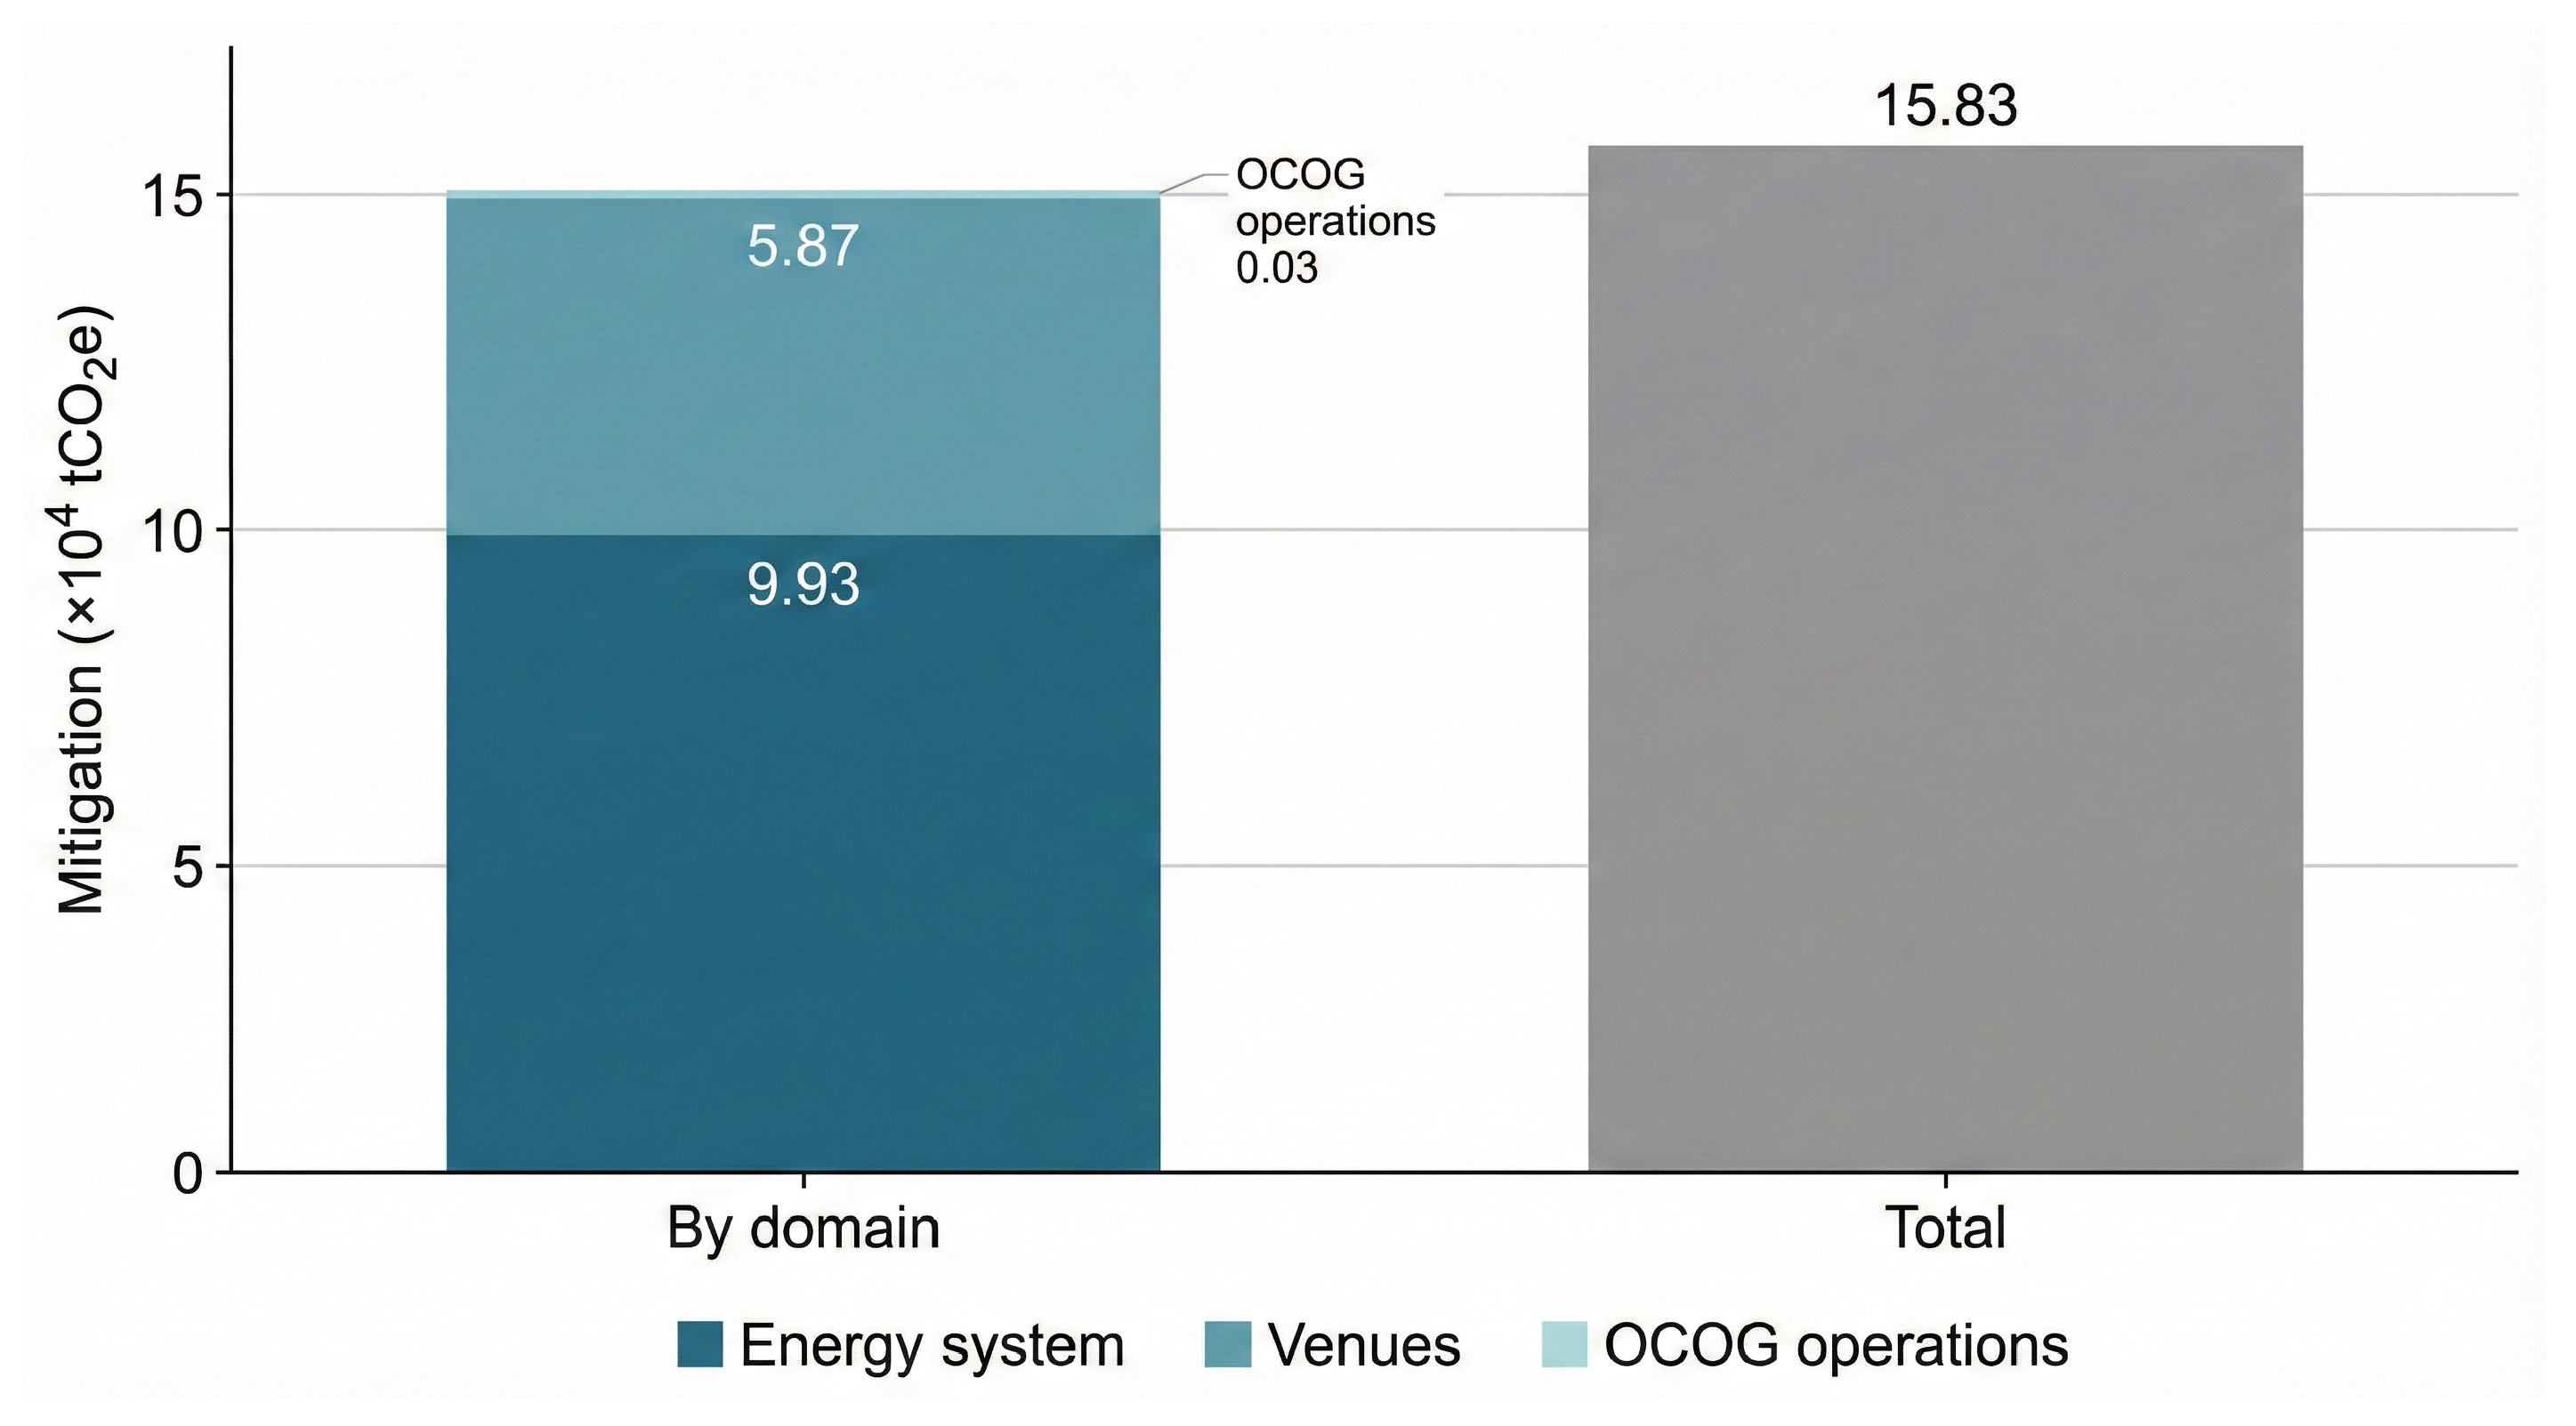
As shown in Figure 5, the contribution of emission reduction during the preparation period mainly comes from the energy side and venue side, while the contribution from the operation side of the organizing committee is relatively small. This result is consistent with the hotspot pattern shown in Figure 3, suggesting that mitigation performance is primarily anchored in structural interventions related to asset chains and system-level adjustments.
Figure 5.
Contribution of emission reductions by sector and total emission reductions: energy side, venue side, and organizing committee operation side.
3.4. Offset Portfolio and Public Participation: Evidence at the Offset End of the Net Balance
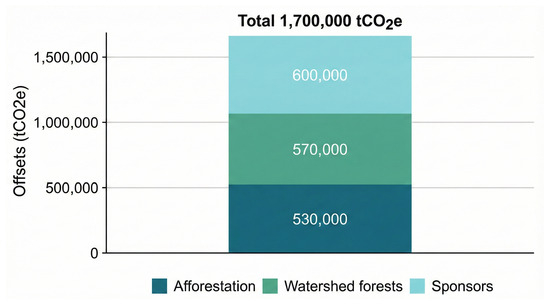
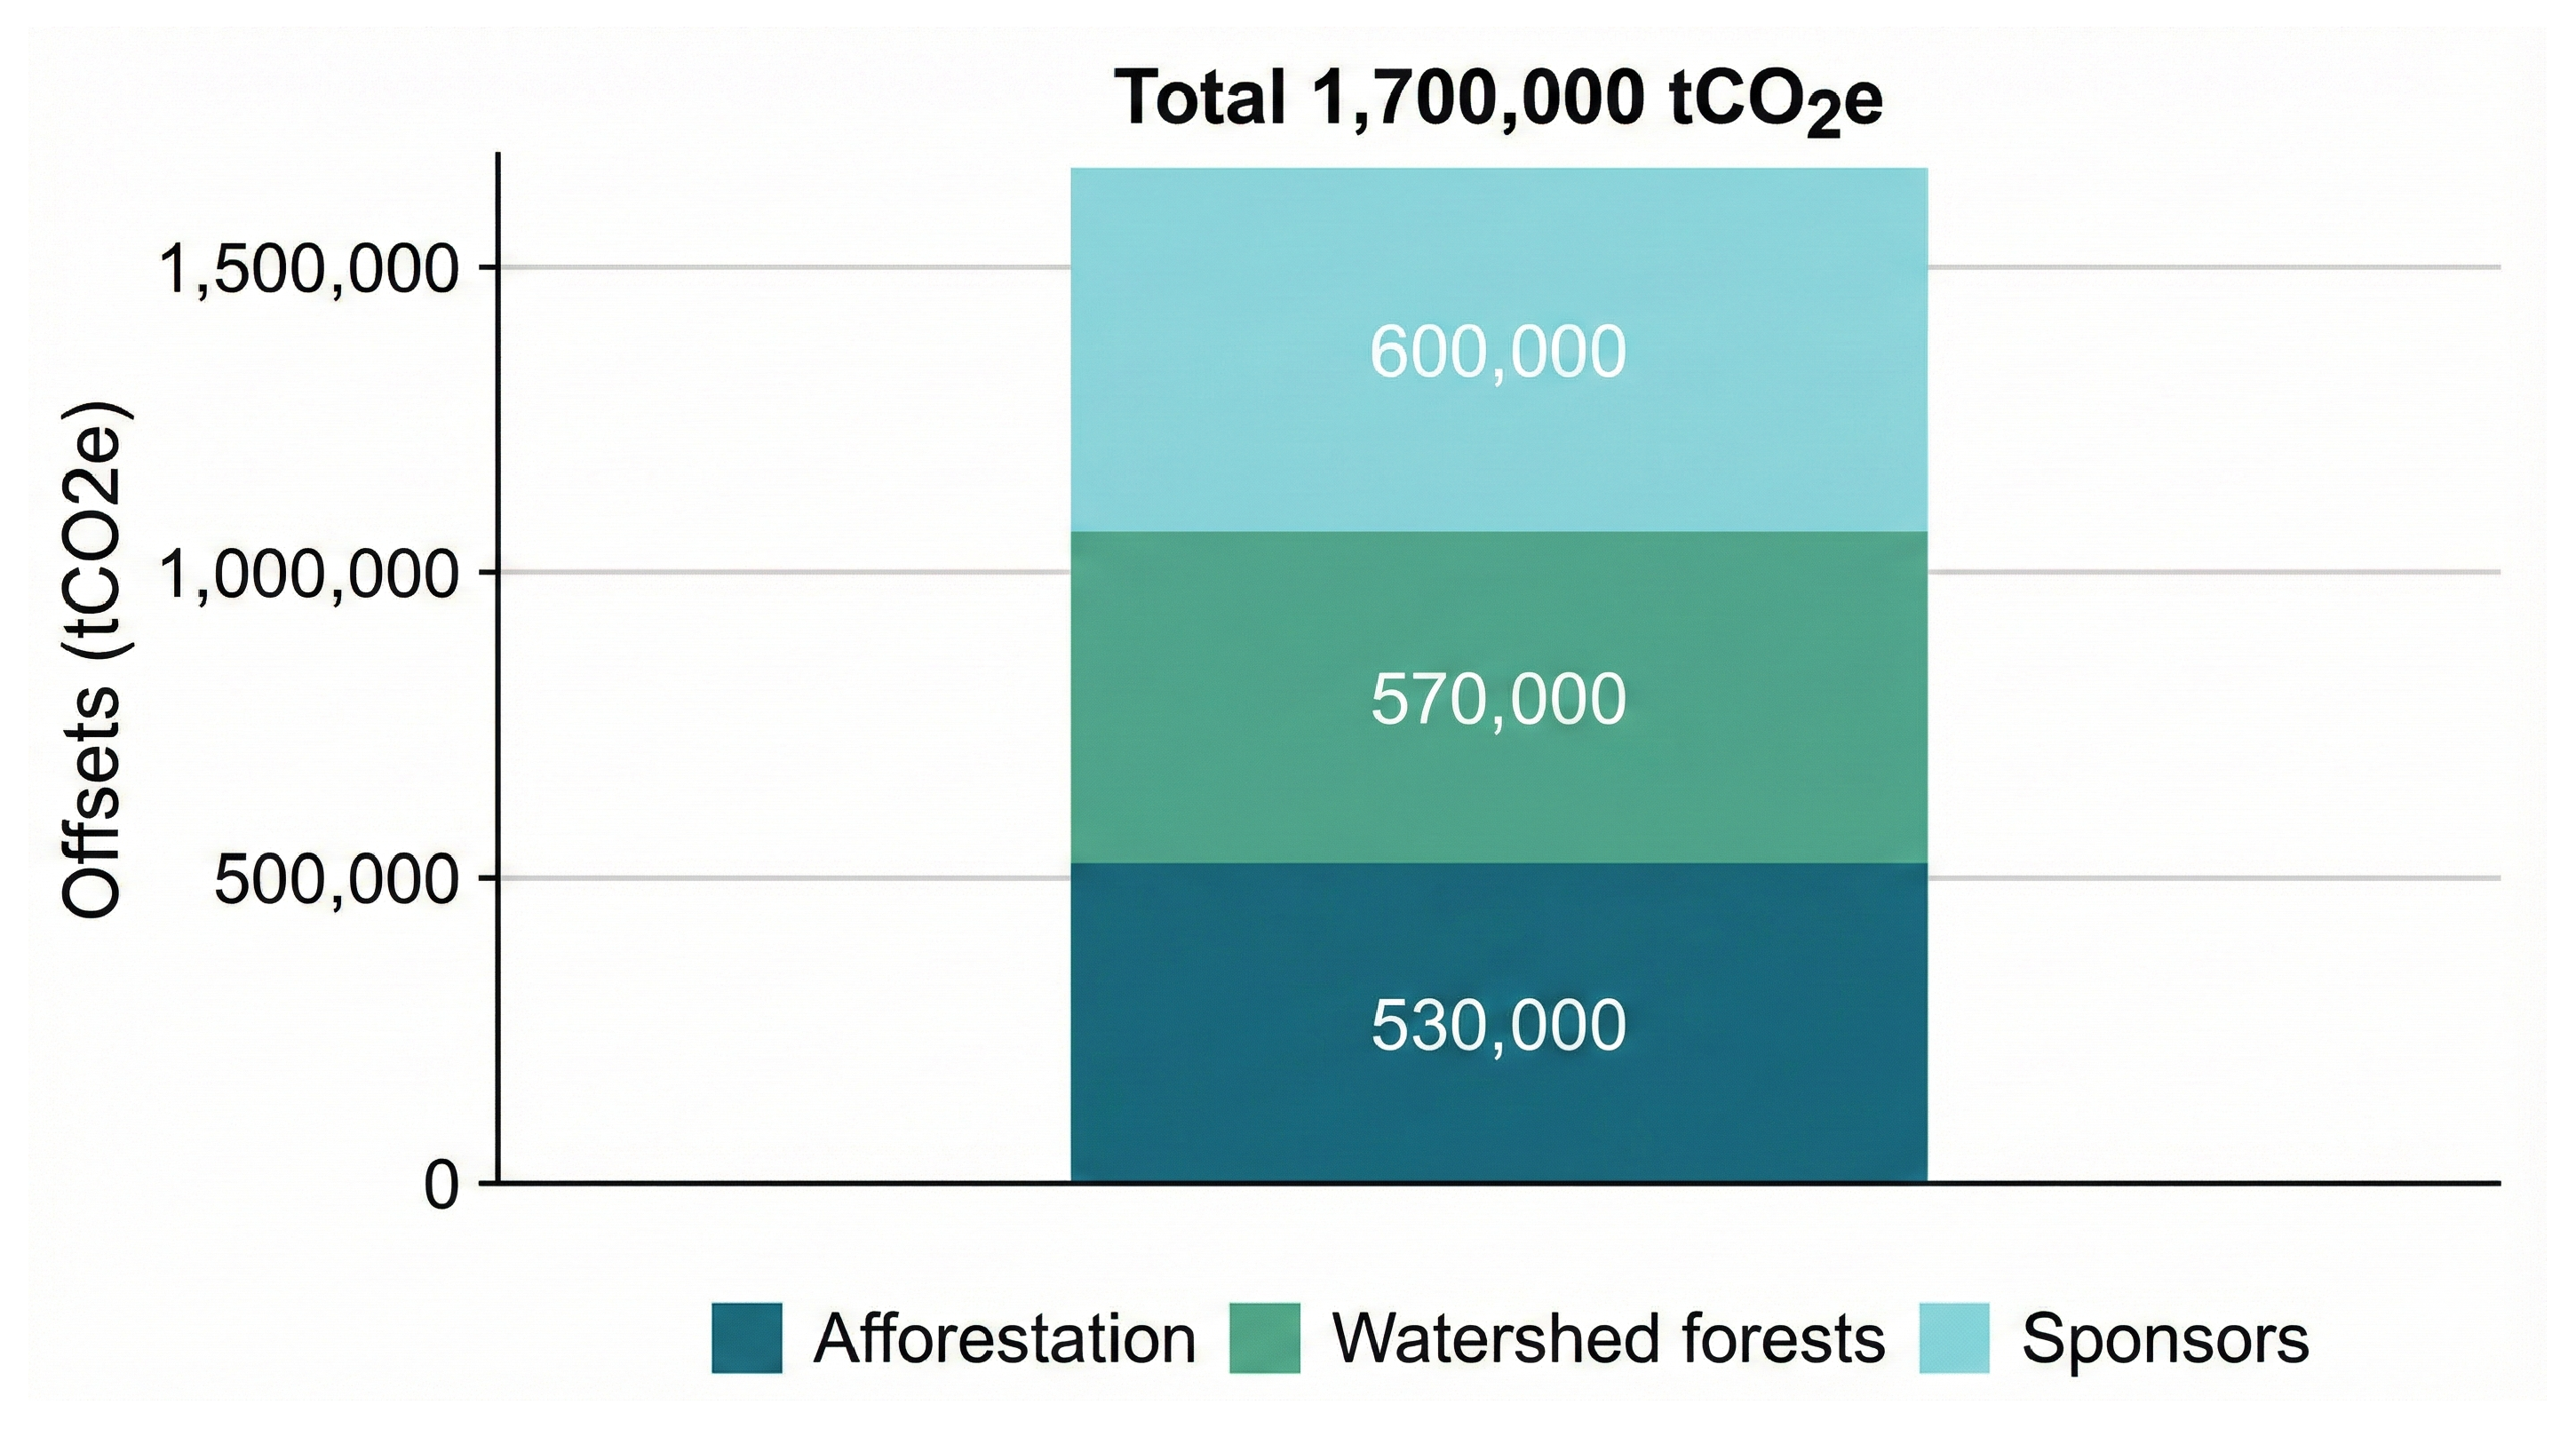
As shown in Figure 6, the remaining emissions are offset through multiple pathways such as afforestation carbon sinks, ecological water conservation forests, and partner actions, totaling about 1.7 million tCO2e [22]. Figure 6 shows that offsets are structured as a portfolio rather than a single project, providing an empirical basis for subsequent discussion of offset quality dimensions such as additionality, permanence, and post-Games maintenance requirements.
Figure 6.
Structure of the offset portfolio: afforestation carbon sinks, ecological water conservation forests, and partner actions.
As shown in Table 1, the Low Carbon Action applet has more than 110,000 registered users, suggesting that information disclosure and public engagement tools also generated observable outputs [23]. Although such participation is difficult to directly convert into quantified emission reductions, it can serve as a complementary indicator reflecting governance transparency and social mobilization capacity.
3.5. Environmental Heritage Performance: Multidimensional Indicators for Air–Energy–Ecology–Water–Transportation
As noted above, Beijing has made significant progress in air-quality and energy-structure transition (Table 3). For example, the annual average PM2.5 concentration declined from 80.6 g/m3 in 2015 to 38 g/m3 in 2020, and the share of days with good air quality increased from 46.6% to 87.5% over the same period [24,25]. Recent empirical studies further document air-quality changes during the Beijing 2022 Winter Olympics and its spillover effects across North China [26,27]. Key objectives and measures were also specified in the official Sustainability Plan for Beijing 2022 [28], alongside Olympics-linked interventions such as regional low-carbon energy transition and green electricity trading mechanisms [22,29].
Table 3.
Multidimensional environmental legacy indicators (air–energy–ecology–water–transport) [24,25].
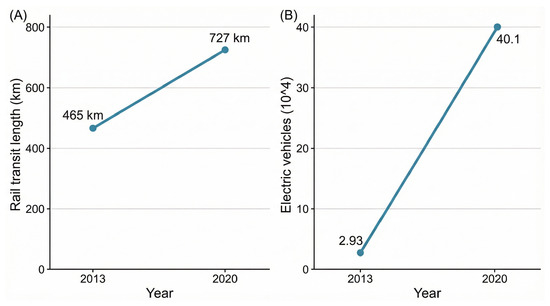
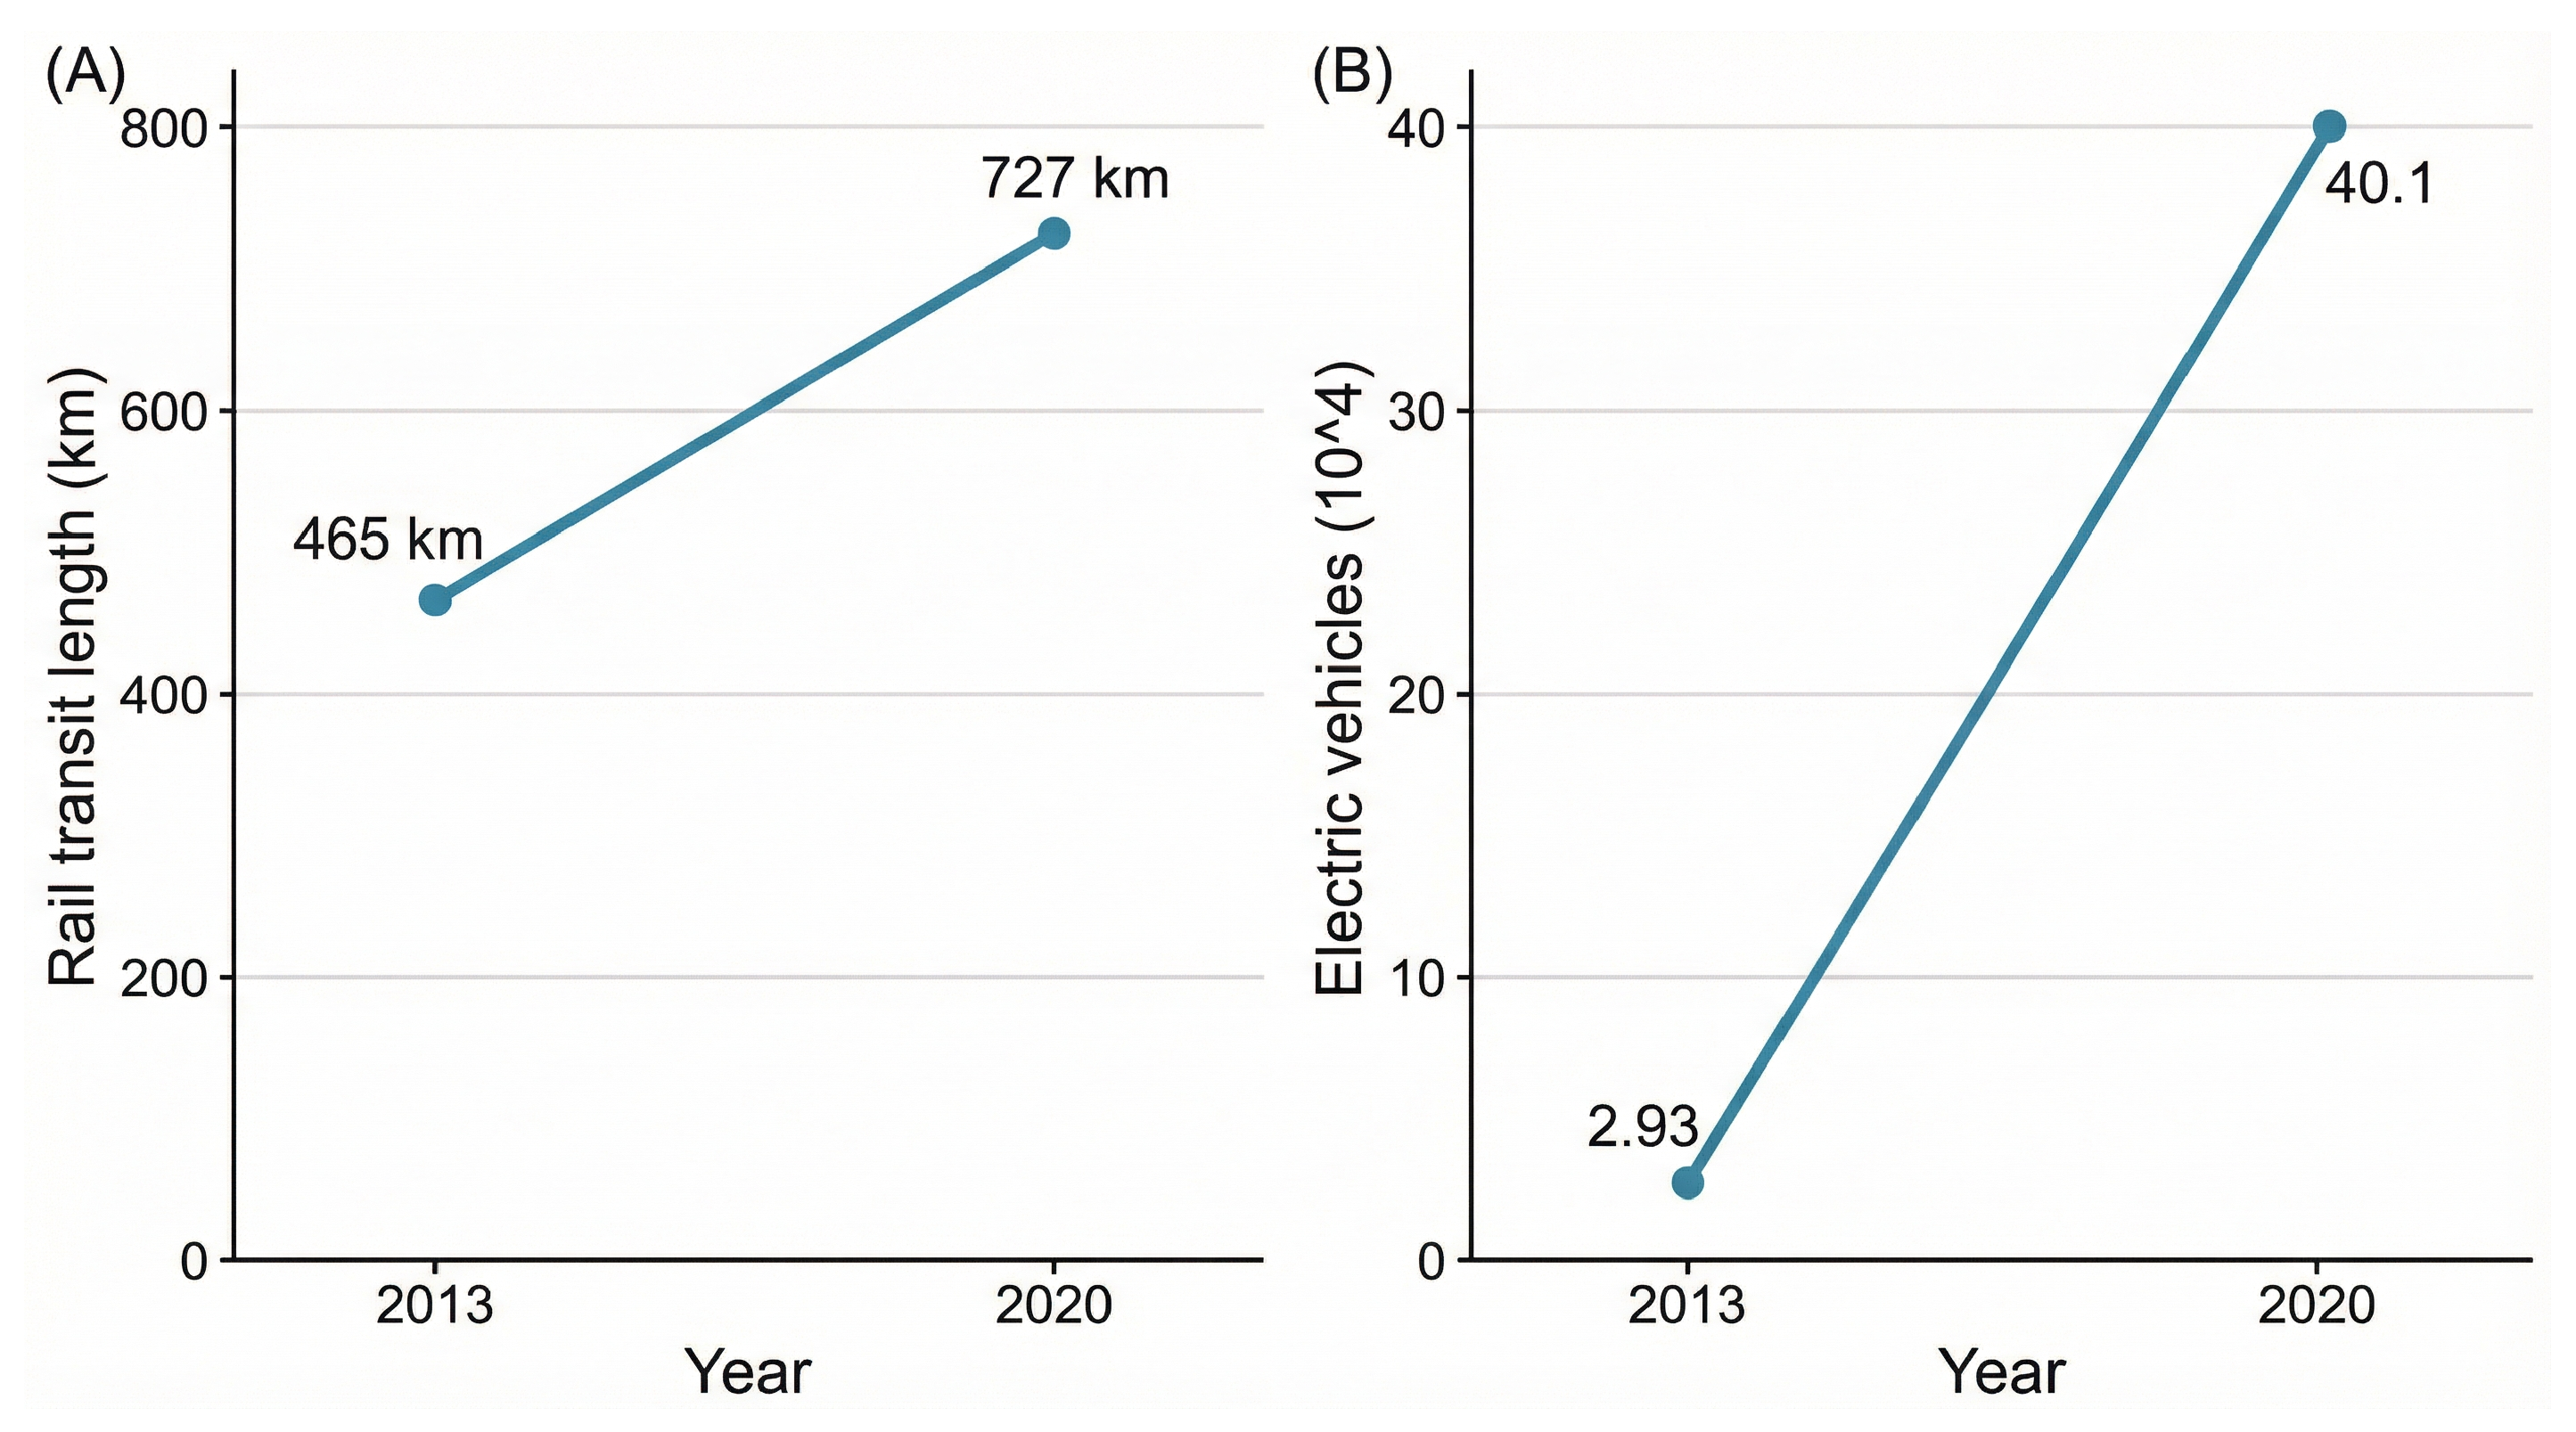
As shown in Figure 7, low-carbon transportation capacity indicators show a consistent upward trend in the host region from 2016 to 2022, supporting the inference that integrated transport governance served as a structural accelerator during the mega-event [30,31,32,33].
Figure 7.
Temporal trend of low-carbon transport indicators: (A) rail transportation; (B) new-energy buses and green travel.
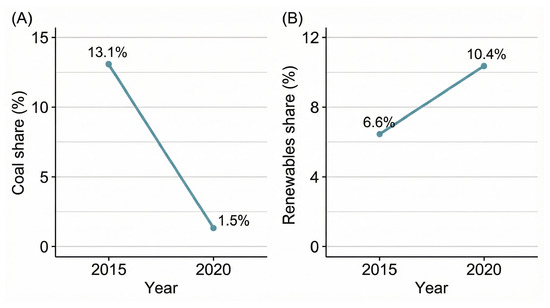
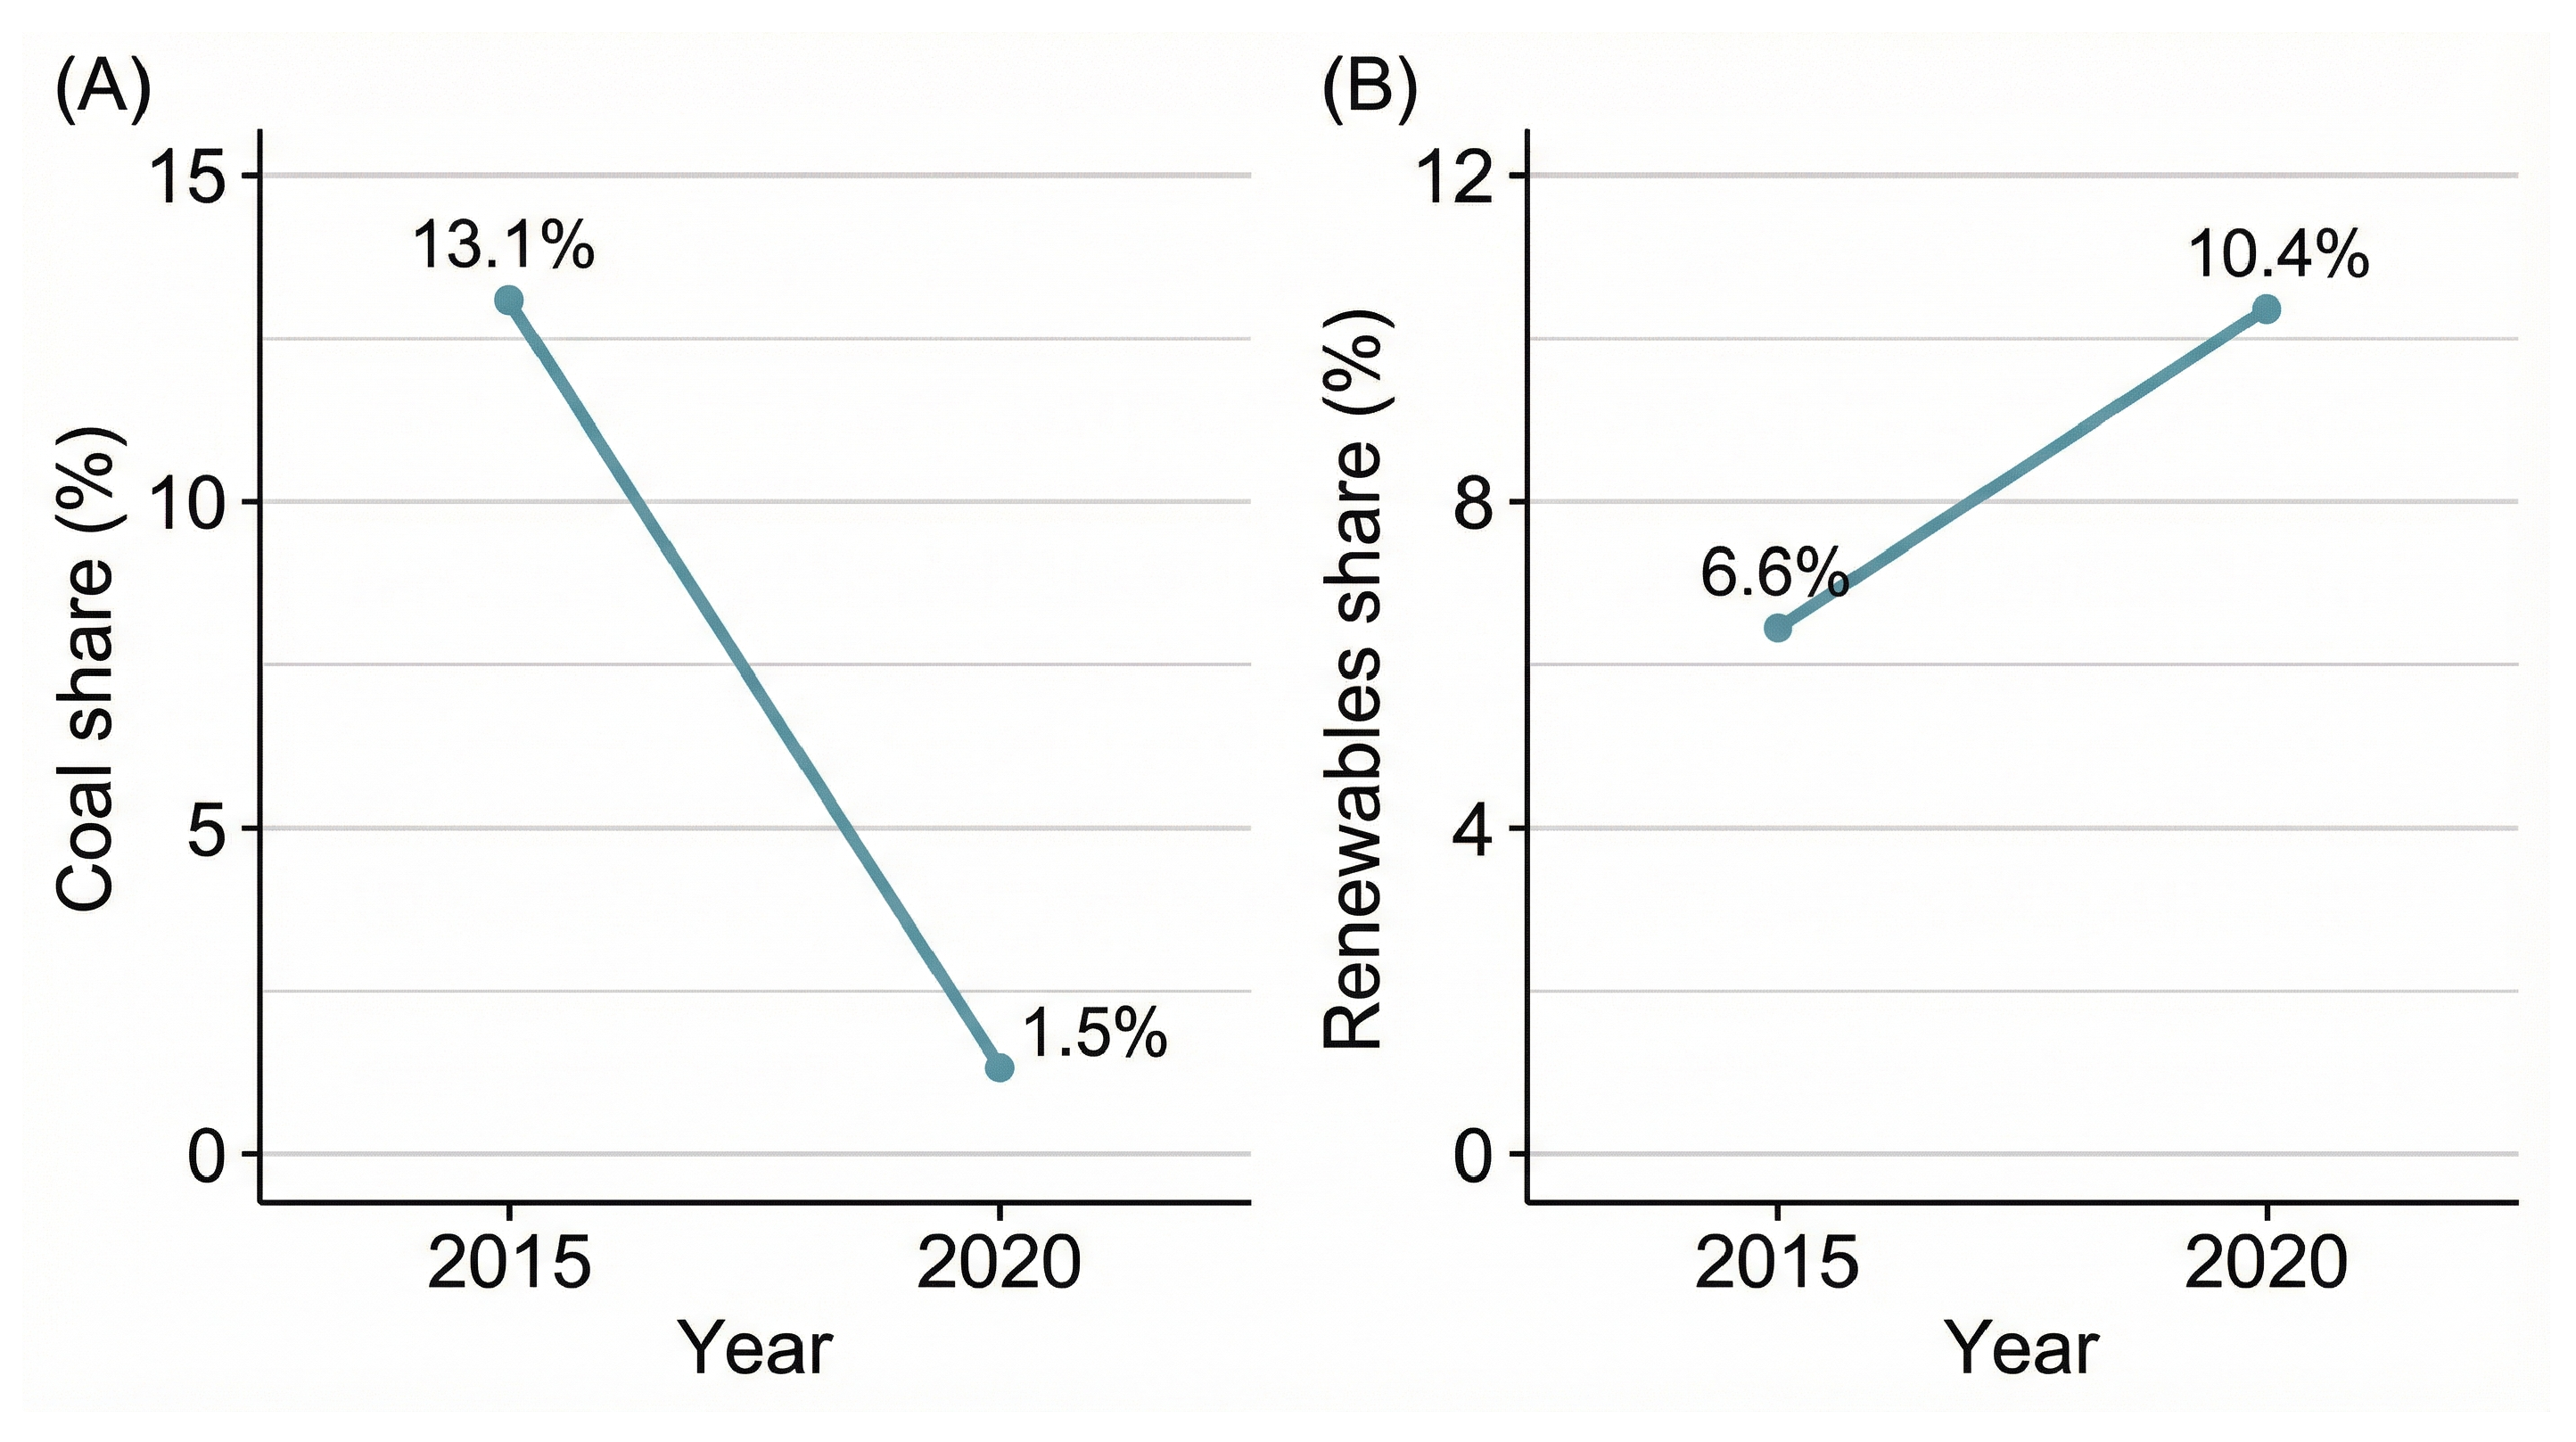
As shown in Figure 8, Beijing’s share of coal consumption has declined significantly and the share of new and renewable energy has steadily increased, providing systematic conditions for green power substitution and low-carbon operation.
Figure 8.
Temporal trend of energy-structure transition indicators: (A) coal consumption and its share; (B) share of new and renewable energy.
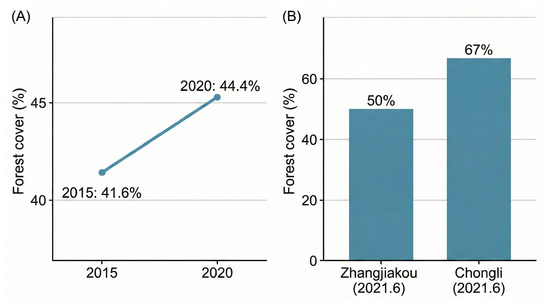
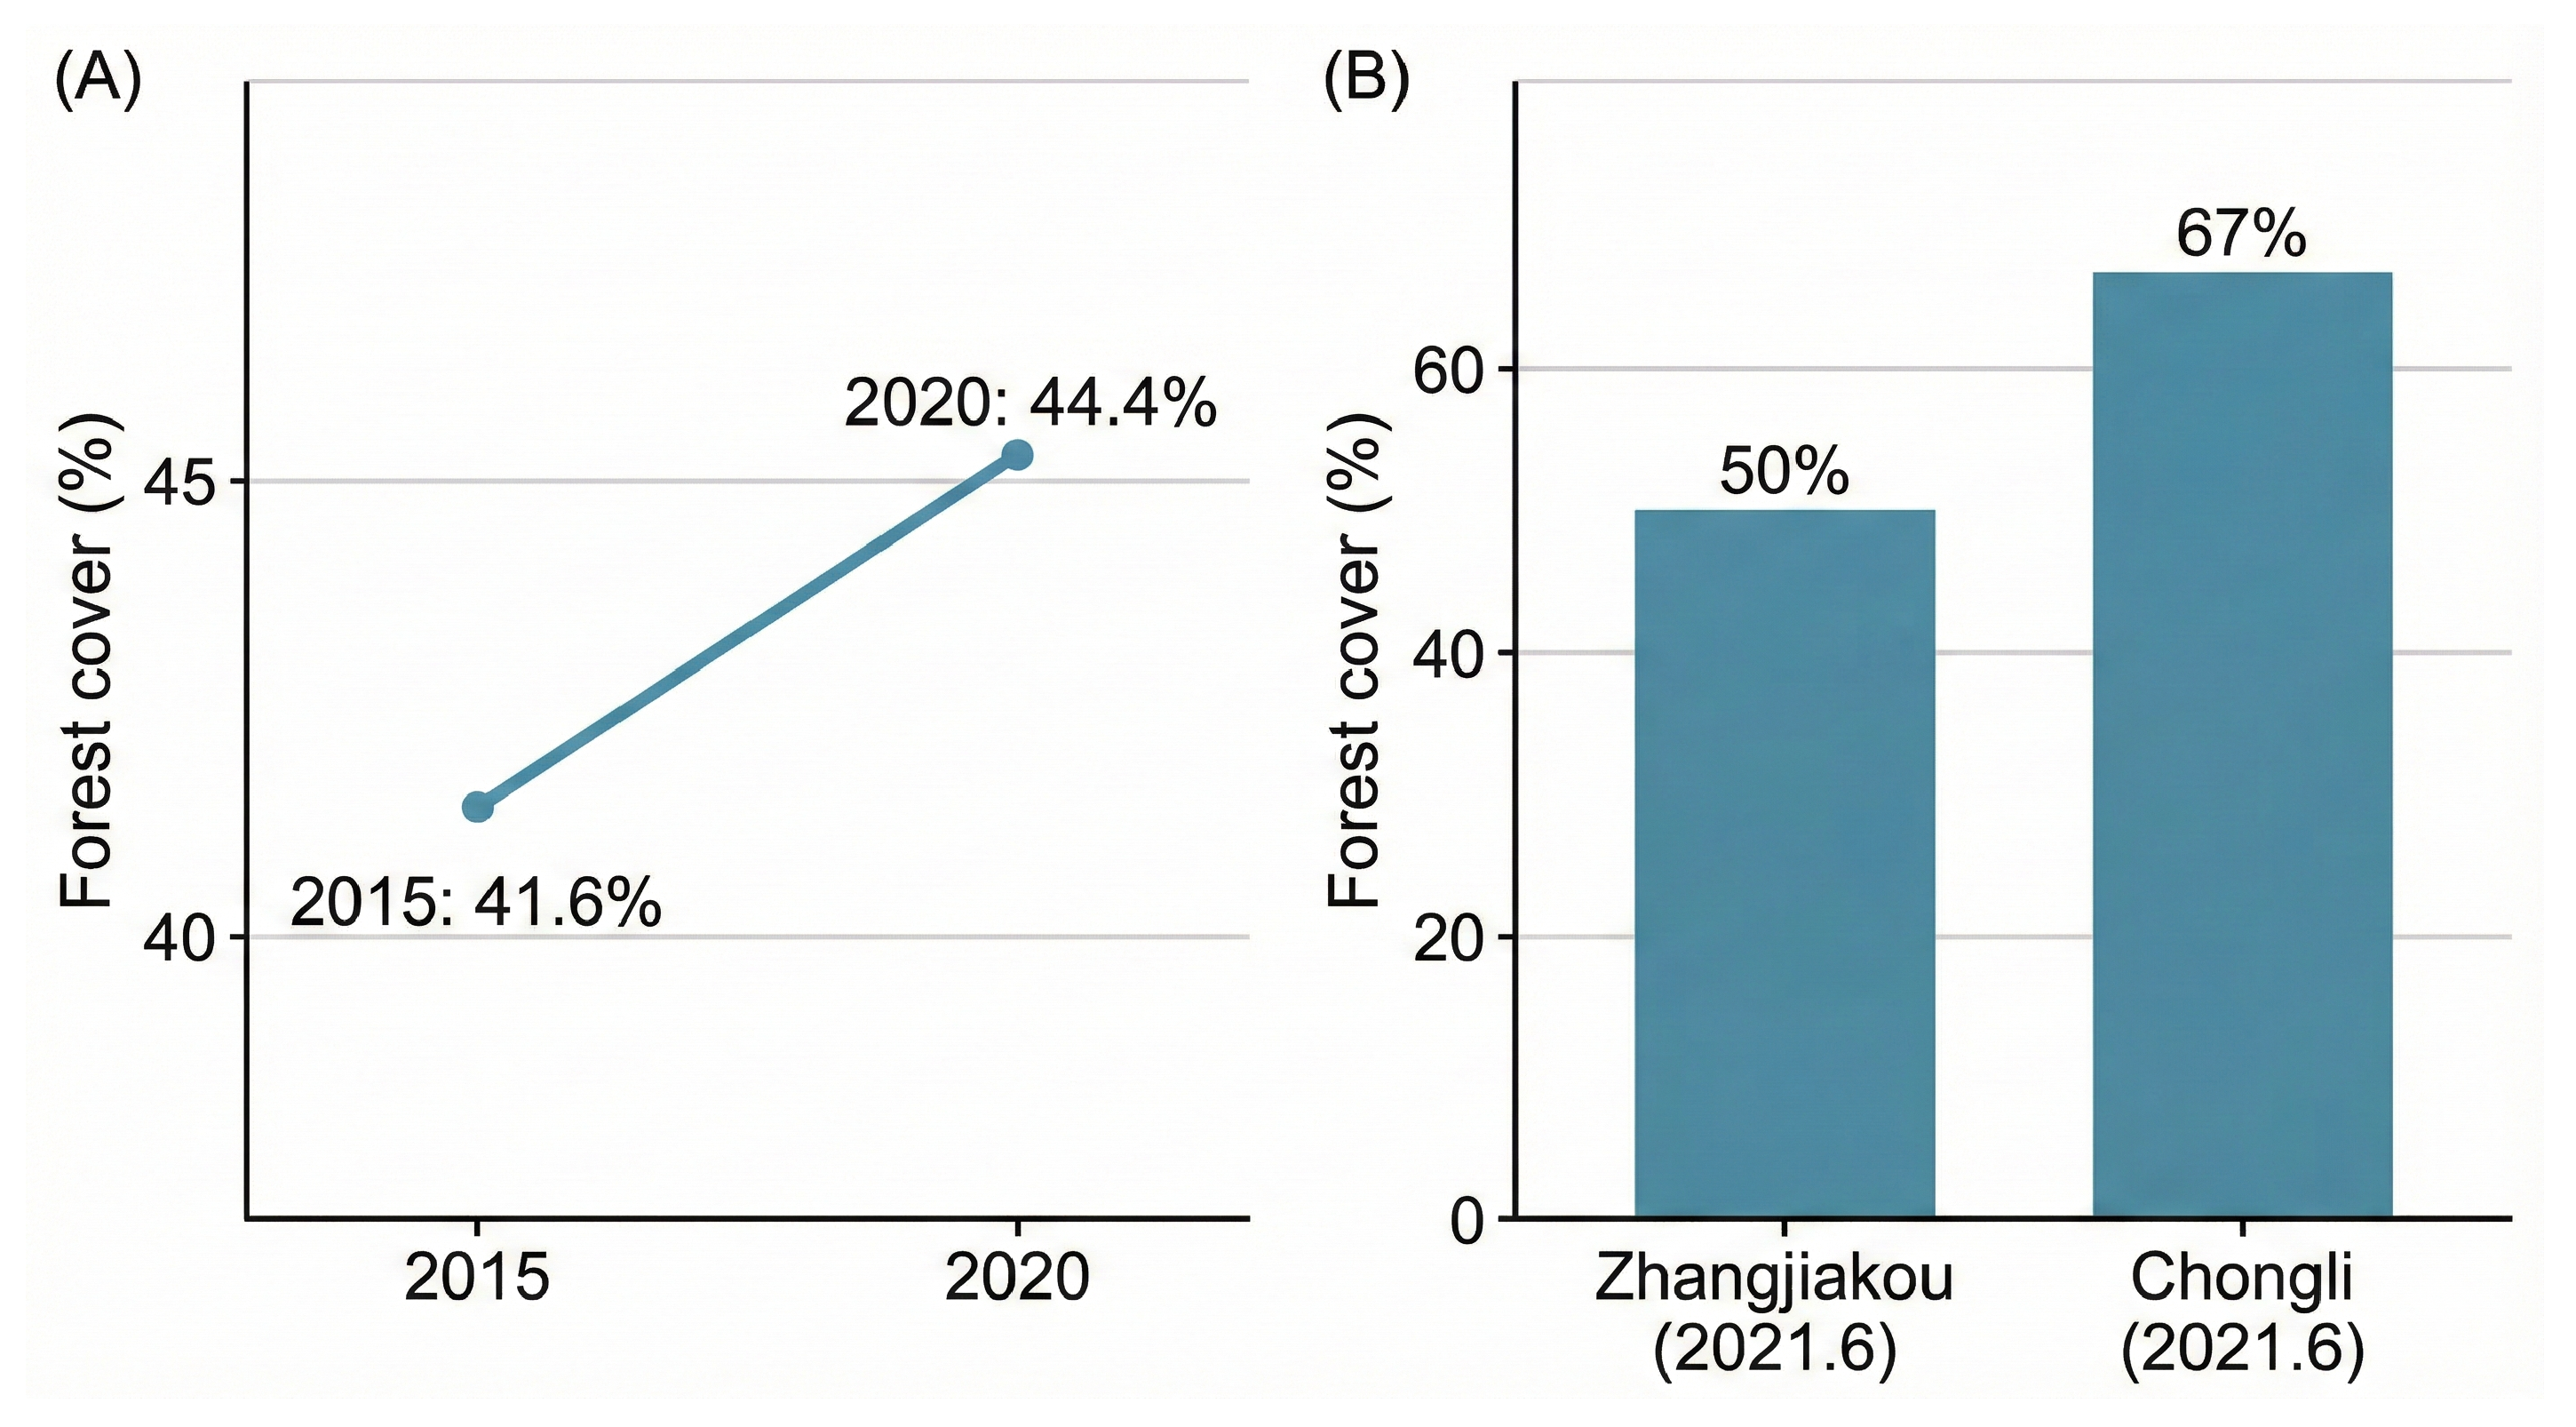
As shown in Figure 9, the host region shows a stable improvement trend in ecological restoration indicators, reflecting the positive legacy effect of nature-based solutions and venue-zone rehabilitation [34,35,36].
Figure 9.
Ecological restoration indicators (forest cover): (A) Beijing; (B) Zhangjiakou/Chongli.
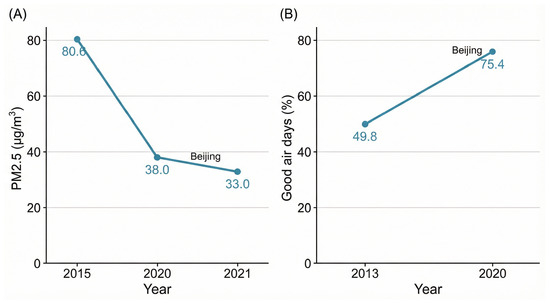
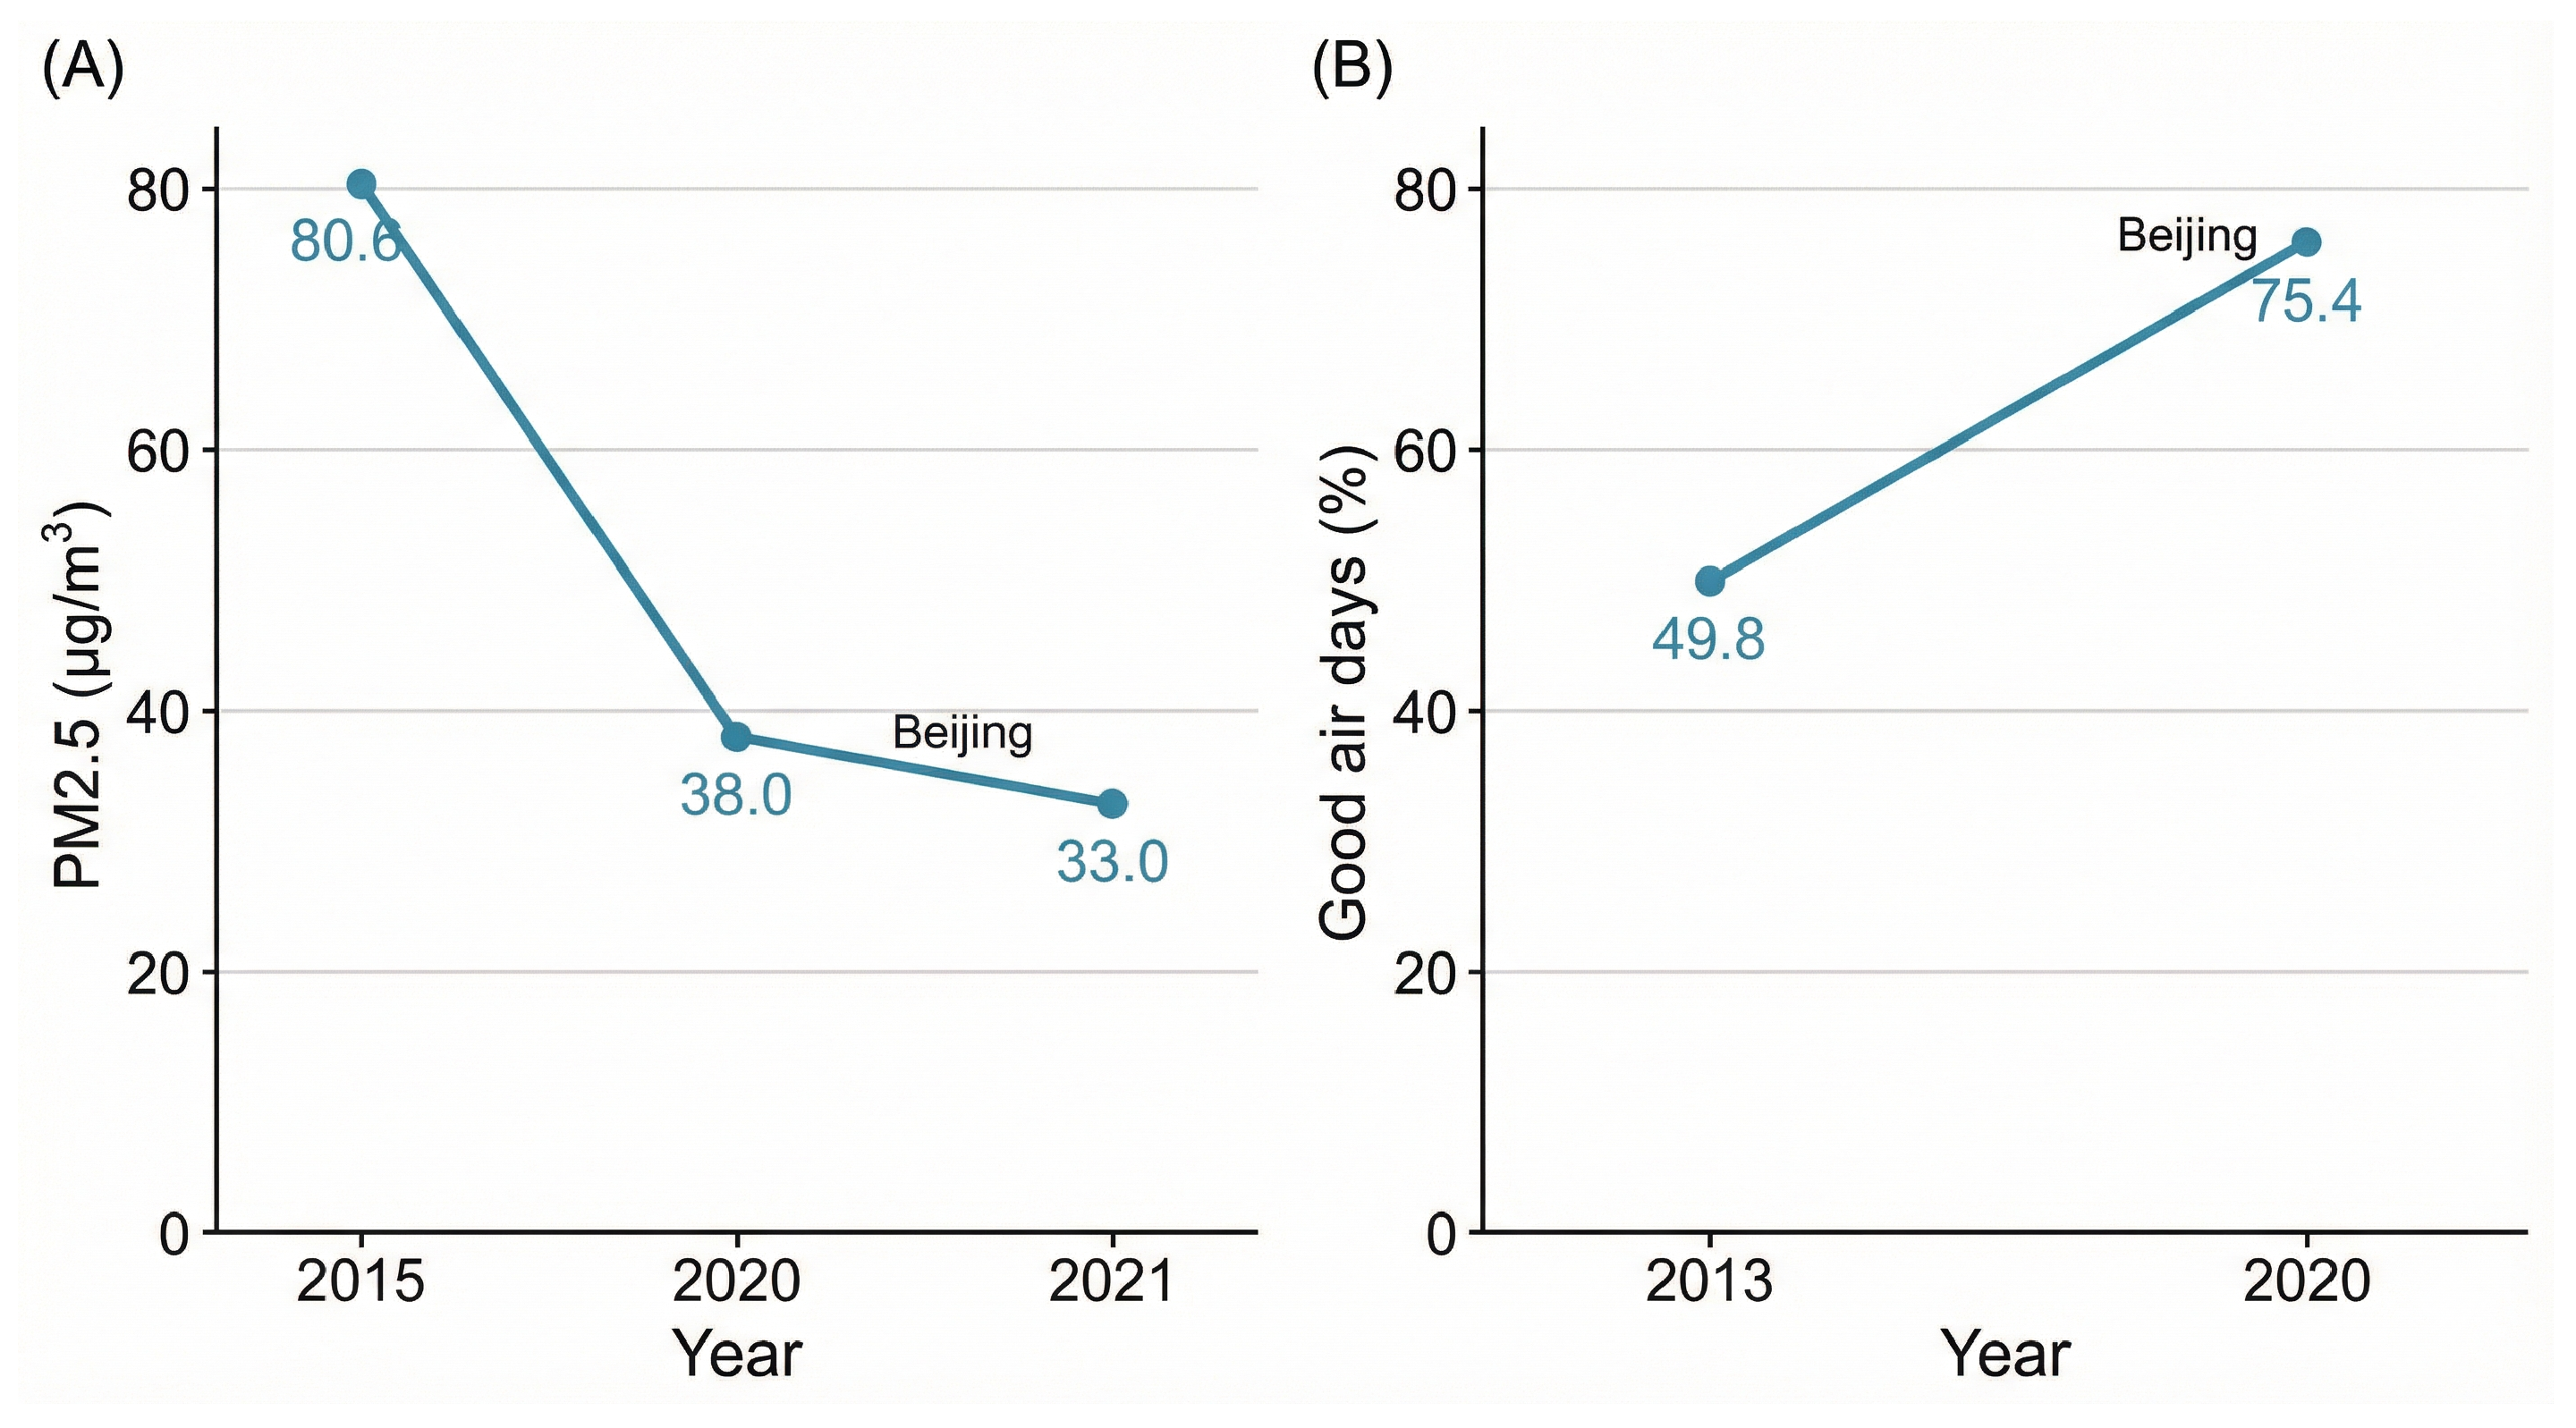
As shown in Figure 10, Beijing’s air quality has improved substantially across multiple indicators; however, such long-term trends are also consistent with broader national and regional environmental governance efforts. Therefore, this study adopts a bounded interpretation strategy (i.e., “acceleration effect” framing) in the discussion section to avoid over-attributing monotonically improving environmental trends solely to the Winter Olympics.
Figure 10.
Air-quality improvement indicators in the host zone: (A) annual mean PM2.5 concentration; (B) air-quality days (good vs. heavy pollution days).
To ensure data consistency and avoid potential bias from incomplete city-level time series, we adopt a conservative provincial-level benchmark for external comparison. As summarized in Table 4, Hebei Province recorded a continuous decline in annual mean PM2.5 concentration from 56.0 g/m3 in 2018 to 36.8 g/m3 in 2022, while the number of good air-quality days increased from 208 to 270 and heavy pollution days decreased from 17 to 4. This trend provides contextual evidence for the regional effectiveness of air-pollution control policies within the Beijing–Tianjin–Hebei area during the Beijing 2022 preparation and hosting period.
Table 4.
Hebei Province air-quality benchmark indicators (2018–2022).
3.6. Summary of the Chapter
This chapter builds a closed loop of empirical evidence across three levels of MRV disclosure, policy instruments, and environmental legacy outcomes. First, the counterfactual “baseline–revised baseline–actual/estimated emissions” framework is illustrated in Figure 2 and Table A1, providing an auditable representation of integrated mitigation performance. Second, the emission hotspot structure is identified in Figure 3, indicating that transport infrastructure and venue-related asset chains constitute the main battlefield of governance. Third, through Table 3 and Table 4 and Figure 7, Figure 8, Figure 9 and Figure 10, multidimensional environmental legacy indicators for air, energy, ecology, water environment, and transportation are presented, providing quantitative anchors for subsequent discussion regarding attribution boundaries, governance acceleration effects, and replicability under different institutional settings.
4. Discussion: Governance Mechanisms, Attribution Boundaries, and Replicability
4.1. From Outcome Demonstration to Mechanism Closure: What Beijing 2022 Adds to Mega-Event Sustainability Research
As illustrated in Figure 1, the sustainable environmental governance of the Beijing 2022 Winter Olympics should not be understood as a simple aggregation of fragmented measures. Instead, it operated as a closed-loop governance chain that connects institutional design, an integrated policy tool mix, MRV, and the diffusion of post-event environmental legacy. The rigidity of the event schedule and international visibility transformed environmental objectives from “governance that can be postponed” into “governance that must be delivered on schedule”. Under this time-bound constraint, policy instruments were organized toward high-carbon assets and key urban systems, forming a “hotspot-first” implementation logic; MRV translated complex processes into auditable evidence; and multi-dimensional legacy indicators tested whether improvements could persist beyond the event window. Therefore, the academic value of Beijing 2022 lies not merely in showing that “some indicators improved”, but in clarifying how top-down commitments can be operationalized into measurable performance through a structured toolchain, MRV closure, and legacy-oriented governance alignment.
4.2. Attribution Boundaries: Replacing “All the Credit” with a Conservative “Acceleration Effect”
Within the broader national policy context of China’s long-term air-pollution control (“Blue Sky” initiatives), energy transition, and ecological civilization construction, Beijing and Zhangjiakou exhibited sustained improvements in air quality and low-carbon transition indicators over time [26,27]. Table 4 summarizes the Hebei provincial air-quality benchmark indicators (2018–2022), which provide contextual evidence for interpreting host-zone improvements under the broader regional governance trend [37,38,39,40,41]. A full causal attribution of these monotonic improvements to a single event would be scientifically vulnerable. Existing quasi-natural experimental evidence has reported short-term air-quality improvements associated with the Beijing 2022 Winter Olympics in the Beijing–Tianjin–Hebei region [29]. Related studies have also examined transport-emission impacts and traffic control effectiveness linked to the Winter Olympics and associated mobility/transport systems [30,31,32,33], as well as ecological restoration and venue-area environmental/land-use legacies in the competition zones [34,35,36]. However, due to the lack of activity-level ledgers and the limited availability of fully comparable counterfactual datasets, this study does not pursue strict causal identification (e.g., DID designs).
Instead, we adopt a bounded inference strategy and interpret the event contribution as an “acceleration effect” rather than a net causal proof. This bounded interpretation rests on three considerations. First, baseline governance trends should be explicitly respected, as long-term improvements are likely driven by multi-year national and local reforms. Second, the Olympics served as a high-salience political task and an international commitment, compressing governance timelines and strengthening cross-regional coordination and resource concentration. Such mobilization can accelerate the implementation of already planned reforms, particularly those requiring system-level coordination, including green power deployment, transport system upgrading, and city-wide emission control. Third, to reduce over-attribution, we introduced external benchmarking (Table 4) using Hebei as a provincial-level reference to anchor host-zone trends within a broader policy environment. This approach does not claim strict causality, but improves interpretability and supports a conservative statement that Beijing 2022 likely accelerated improvements under bounded inference.
4.3. Aligning Emission Hotspots with the Toolchain: Why Asset-Chain Governance Matters
A central methodological challenge in mega-event sustainability assessment is the potential misalignment between “where emissions concentrate” and “what governance tools emphasize”. Life-cycle evidence shows that preparation-phase emissions are typically dominated by transport infrastructure expansion and venue construction, while Games-time operations are smaller in magnitude but more visible. In this study, the emission structure shown in Figure 3 indicates that transport infrastructure and venue-related asset chains are major emission hotspots, implying that credible carbon-neutral governance cannot rely solely on operational greening or symbolic interventions. Instead, effectiveness depends on whether tool portfolios are prioritized toward high-carbon asset chains, and whether implementation is reinforced by MRV transparency and compliance mechanisms.
Accordingly, the policy toolchain can be interpreted as a layered system: (i) asset-chain tools targeting infrastructure construction and venue investment, which shape the structural baseline and long-term lock-in effects; (ii) systemic tools improving energy supply, grid flexibility, and low-carbon substitution capacity; and (iii) operational tools governing Games-time logistics, mobility, and facility management, which enhance demonstration effects and short-term performance. Importantly, in this revision, we emphasize hotspot-oriented asset-chain governance as the analytical priority and interpret green electricity trading and operational measures as systemic and operational layers, respectively. This layered logic strengthens consistency between emission structure (Table 1 and Figure 3), tool configuration (Table 2), and legacy outcomes (Table 3 and Table 4 and Figure 7, Figure 8, Figure 9 and Figure 10), thereby improving the mechanism–indicator alignment.
4.4. Theoretical Contribution: A Life-Cycle Net-Negative Governance Paradigm
Building on the above findings, this study conceptualizes Beijing 2022 as a case of “life-cycle net-negative governance”, defined as a systematic pathway that integrates full life-cycle boundaries, hotspot prioritization, MRV credibility, and legacy validation. This governance paradigm includes four key features: (1) the governance boundary covers preparation, Games-time, and post-Games phases, treating infrastructure and institutions as core governance objects; (2) the performance logic follows “emission reduction prioritization–offset transparency–auditability and verification”, ensuring carbon-neutral claims remain reviewable rather than rhetorical; (3) tools are organized around high-carbon asset segments, combining asset-chain interventions with systemic support mechanisms into a coherent toolchain; and (4) legacy tests rely on multi-dimensional indicators to evaluate persistence after the event. This mechanism-based framing provides a comparable research lens for cross-event studies and improves the analytical depth beyond outcome demonstration [42,43].
4.5. Critical Reflection: Costs, Offset Quality, and Data Transparency Constraints
To avoid “perfect narratives”, this study highlights several constraints that bound the interpretation of Beijing 2022. First, costs and opportunity costs remain insufficiently assessed. Infrastructure upgrading, ecological restoration, and system transformation require substantial investment and long-term operation and maintenance expenditure, which are not fully observable through publicly available disclosures. Future work should integrate fiscal and operational datasets to support cost–benefit assessment.
Second, post-Games sustainability is not automatically guaranteed. The durability of low-carbon venue operation, green power mechanisms, and ecological restoration depends on institutionalized maintenance, stable budgeting, and incentives. Without institutional continuity, governance may shift from “sprinting during the Games” to post-event decline.
Third, offset quality should be interpreted cautiously. The offset portfolio (Figure 6) includes ecological projects and approximately 600,000 tons of “partner sponsorship actions” [44]. For this component, publicly available materials are insufficient for independent verification of additionality, permanence, leakage risks, and certification boundaries. Therefore, this portion should be treated as a disclosed compliance component within the MRV framework rather than a fully verified empirical mitigation contribution. In practice, credible offsets require clearer documentation of standards, certification procedures, and verification scopes, particularly when “partner actions” constitute a non-trivial share of total offsets.
Fourth, data transparency is a binding constraint for independent scientific verification. Because activity-level inventories and emission-factor ledgers are not fully accessible, external studies are limited in conducting finer-grained decomposition or strict causal identification. In this study, we strengthen interpretability through mechanism-based tool–indicator pairing and external benchmarking, but attribution boundaries remain conservative under data-access constraints.
4.6. Replicability: Layered Replication Rather than Wholesale Copying
The governance features of Beijing 2022 indicate that “replicability” should be understood as layered replication rather than wholesale copying. At the institutional level, clear strategic mandates and cross-department legitimacy enable coordination. At the toolchain level, hotspot-oriented asset-chain governance and systemic energy-support instruments form a modular implementation engine. At the MRV level, standardized accounting boundaries, disclosure practices, and third-party verification constitute the minimum credibility infrastructure for carbon-neutral claims.
However, the life-cycle net-negative pathway is strongly enabled by high-capacity government mobilization. In contexts dominated by market mechanisms, constrained fiscal capacity, or weaker governance, feasible replication may prioritize MRV transparency, hotspot prioritization, and offset quality control rather than attempting a full-scale mobilization package. Future host cities should adopt replication strategies consistent with local governance capacity and institutional constraints, aiming for auditable and credible legacies rather than symbolic neutrality claims.
5. Conclusions
This study examined whether and how carbon-neutral commitments in a mega-event can be translated into measurable and lasting environmental outcomes through a closed-loop governance mechanism, using the Beijing 2022 Winter Olympics as a representative case. Building on an integrated framework of “Institutional Design–Policy Tools–MRV–Environmental Legacy”, the analysis synthesized officially verified carbon accounting materials and publicly available statistics to evaluate life-cycle carbon-neutral governance performance and post-event environmental indicators in Beijing and Zhangjiakou.
Three main findings can be highlighted. First, the life-cycle accounting evidence indicates that carbon-neutral governance for Beijing 2022 is structurally anchored in high-carbon asset chains during the preparation phase, particularly transport infrastructure and venue-related construction and renovation. This hotspot-oriented emission structure implies that credible carbon-neutral pathways cannot rely solely on Games-time operational optimization, but must prioritize long-cycle mitigation actions that shape the emission baseline and carbon lock-in effects.
Second, the instrument mix reflects a system-level governance logic in which market-enabled mechanisms (e.g., green electricity trading) are reinforced by energy-system support tools and capacity conditions, while MRV disclosure provides an auditable link connecting accounting boundaries, mitigation actions, and offset portfolios.
Third, the multidimensional environmental legacy indicators considered in this study include ambient air quality (PM2.5), energy structure (share of green electricity), ecological restoration (forest coverage and NDVI), and low-carbon transportation capacity (public transport share and new-energy vehicles), which exhibit sustained improving trends in the host zones during the observation period [26,27,30,31,32,33,34,35,36].
The study contributes to mega-event sustainability research in two ways. Conceptually, it clarifies a mechanism-based pathway from carbon-neutral claims to legacy outcomes by aligning policy tools with both emission hotspots and measurable indicators, rather than treating governance as a narrative listing of initiatives. Empirically, it demonstrates how MRV-centered disclosure and verification can serve as a minimum credibility infrastructure for large-scale event sustainability evaluation under constrained data transparency.
Several practical implications follow. Future carbon-neutral mega-events should (i) prioritize hotspot-oriented governance of high-carbon asset chains (transport infrastructure and venues), (ii) institutionalize MRV disclosure and third-party verification to ensure auditability and public accountability, and (iii) adopt quality-controlled offset portfolios that explicitly address additionality, permanence, and governance risks, rather than using offsets as a substitute for direct mitigation. At the same time, policymakers should treat environmental legacy as a capacity-building outcome—such as low-carbon mobility systems and energy structure transition—whose durability depends on post-event institutional arrangements and stable operation [45]. Finally, this study recognizes the boundary conditions of replicability. The Beijing 2022 pathway is strongly enabled by high-capacity top-down coordination and governmental mobilization. In host settings where market mechanisms dominate or governance capacity is weaker, wholesale replication may be unrealistic. Instead, a layered replication strategy is recommended, emphasizing MRV transparency, hotspot prioritization, and offset quality control as transferable components, while adapting tool portfolios to local institutional constraints. Future research should incorporate more granular activity-level data and quasi-experimental designs where possible to quantitatively isolate event marginal contributions and strengthen causal inference on environmental legacy outcomes.
Author Contributions
Conceptualization, L.K. and H.T.S.; methodology, L.K.; software, Z.Z.; validation, M.Z.A. and Z.Z.; formal analysis, H.T.S.; investigation, L.K.; resources, L.K.; data curation, Z.Z.; writing–original draft preparation, L.K.; writing–review and editing, H.T.S. and M.Z.A.; visualization, Z.Z.; supervision, L.K.; project management, H.T.S. All authors have read and agreed to the published version of the manuscript.
Funding
This research received no external funding.
Institutional Review Board Statement
Not applicable.
Informed Consent Statement
Not applicable.
Data Availability Statement
Publicly available datasets were analyzed in this study. The official MRV materials and carbon accounting disclosures are described in the Materials and Methods section (Section 2) and can be found in the Low-Carbon Management Reports and related official statements [19,20,24,25]. The external benchmarking data used for Table 4 were compiled from publicly released environmental bulletins and statistical disclosures for Beijing, Zhangjiakou, and Hebei Province (2016–2019), and the corresponding sources are reported in the figure/table notes and the Section 2.
Acknowledgments
The authors would like to thank the institutions and agencies that provided public disclosure materials and environmental statistics supporting this study.
Conflicts of Interest
The authors declare no conflicts of interest.
Abbreviations
The following abbreviations are used in this manuscript:
| MRV | Monitoring, Reporting, and Verification |
| GHG | Greenhouse Gas |
| CO2e | Carbon Dioxide Equivalent |
| IOC | International Olympic Committee |
| BOCOG | Beijing Organising Committee for the 2022 Olympic and Paralympic Winter Games |
| PM2.5 | Particulate Matter with a diameter of 2.5 m or less |
| RSEI | Remote Sensing Ecological Index |
| CCER | China Certified Emission Reduction |
| LMDI | Logarithmic Mean Divisia Index |
| BAU | Business as Usual |
Appendix A. Method and Data Supplement
Brief Description of LMDI Decomposition Method
After obtaining the activity level and emission factor ledgers classified by sector and segment, the Logarithmic Mean Divisia Index (LMDI) method can be used to decompose emission changes. Let the total emissions be
where A is the total activity level (e.g., total electricity consumption, passenger turnover), is the structural share of the i-th sector, and is the emission intensity of that sector. The change in emissions between two periods can be decomposed into activity effect, structural effect, and intensity effect:
Using the LMDI additive form:
where is the logarithmic mean weight. This method decomposes emission changes into scale, structure, and intensity effects, providing an interpretable analytical basis for identifying drivers of emission variation.
Table A1.
Life cycle scenario GHG emissions data (Baseline vs. Actual/Estimated).
References
- Müller, M.; Gogishvili, D.; Wolfe, S.D.; Gaffney, C.; Hug, M.; Leick, A. The Olympic Games: How sustainable are they? Nat. Sustain. 2021, 4, 340–348. [Google Scholar] [CrossRef] [Scilit]
- Chappelet, J.-L. The Olympic Games, legacy and sustainability. Sport Soc. 2023, 26, 123–139. [Google Scholar] [CrossRef]
- Orr, M.; Inoue, Y. Sport versus climate: Introducing the climate vulnerability of sport organizations framework. Sport Manag. Rev. 2019, 22, 452–463. [Google Scholar] [CrossRef] [Scilit]
- Liu, Z.; Deng, Z.; He, G.; Wang, H.; Zhang, X.; Lin, B.; Qi, Y.; Liang, X. Challenges and opportunities for carbon neutrality in China. Nat. Rev. Earth Environ. 2022, 3, 141–155. [Google Scholar] [CrossRef] [Scilit]
- Fan, Y.; Bai, Y. Analysis of the Coupling Coordination Degree of the Ice-Snow Sports Industry and Regional Sustainable Development in China. Sustainability 2022, 14, 15993. [Google Scholar] [CrossRef] [Scilit]
- Yeerkenbieke, P.; Chen, Q.; He, Y. Evaluation of the Coordinated Development of the Ice-Snow Industry and Regional Economy in Xinjiang. Sustainability 2023, 15, 2345. [Google Scholar] [CrossRef] [Scilit]
- Ding, X.; Jiang, Y.; Yang, B.; Su, J.; Chen, L.; Li, N. The Development of Green Olympic Games: A Comparison of CO2 Emission Reduction Strategies between PyeongChang 2018 and Beijing 2022. Procedia Comput. Sci. 2022, 214, 1270–1276. [Google Scholar] [CrossRef] [Scilit]
- Cury, R.P.; Kennelly, M.; Howes, M. Environmental sustainability in sport: A systematic literature review. Eur. Sport Manag. Q. 2023, 23, 131–151. [Google Scholar] [CrossRef] [Scilit]
- Geeraert, A. The limits of governing through standards: The case of the ISO 20121 sustainable event management standard. Sport Manag. Rev. 2023, 26, 1–22. [Google Scholar] [CrossRef]
- Chang, S.; Wang, X.; Yang, Z. Carbon footprint analysis of large-scale sports events: A case study of the 14th National Games of China. Heliyon 2024, 10, e30349. [Google Scholar] [CrossRef] [Scilit]
- McCullough, B.P.; Orr, M.; Kellison, T. Sport ecology: Conceptualizing an emerging subdiscipline within sport management. J. Sport Manag. 2020, 34, 509–520. [Google Scholar] [CrossRef] [Scilit]
- Zhang, S.; Chen, B.; Feng, K. Carbon neutrality of the Olympic Games: Achievements, challenges and future directions. J. Clean. Prod. 2024, 434, 139821. [Google Scholar] [CrossRef] [Scilit]
- Ross, W.J.; McCullough, B.P. A framework for sustainable spectator sport: The role of industry, policy, and consumer behavior. Manag. Sport Leis. 2021, 26, 1–15. [Google Scholar] [CrossRef]
- Liu, G.; Bian, S.; Lu, X. Green technologies behind the Beijing 2022 Olympic and Paralympic winter games. Innovation 2022, 3, 100293. [Google Scholar] [CrossRef] [Scilit]
- Zhao, Y.; Wang, S.; Zhou, C. The impact of the Beijing Winter Olympics on regional air quality: An empirical study based on DID model. Sustain. Cities Soc. 2023, 89, 104270. [Google Scholar] [CrossRef] [Scilit]
- Huang, H.; Wang, J.; Li, Z. Evaluation of the Green Performance of the Beijing Winter Olympics: A Case Study of the Yanqing Competition Zone. Sustainability 2022, 14, 5628. [Google Scholar] [CrossRef] [Scilit]
- International Olympic Committee. Olympic Agenda 2020+5; IOC: Lausanne, Switzerland, 2021; Available online: https://stillmed.olympics.com/media/Document%20Library/OlympicOrg/IOC/What-We-Do/Olympic-agenda/Olympic-Agenda-2020-5-15-recommendations.pdf (accessed on 20 December 2025).
- International Olympic Committee. Carbon Footprint Methodology for the Olympic Games; IOC: Lausanne, Switzerland, 2018. [Google Scholar]
- Beijing Organizing Committee for the 2022 Olympic and Paralympic Winter Games. Beijing 2022 Pre-Games Sustainability Report (Preparatory Phase, 2018–2021); BOCOG: Beijing, China, 2022. [Google Scholar]
- Beijing Organizing Committee for the 2022 Olympic and Paralympic Winter Games. Beijing 2022 Post-Games Sustainability Report (Games-Time and Post-Games Assessment, 2022); BOCOG: Beijing, China, 2022. [Google Scholar]
- ISO 14064-1; Greenhouse Gases–Part 1: Specification with Guidance at the Organization Level for Quantification and Reporting of Greenhouse Gas Emissions and Removals. International Organization for Standardization: Geneva, Switzerland, 2018.
- Pan, X.; Wang, L.; Zhang, J. Low-carbon energy transition in the Beijing-Tianjin-Hebei region: Driven by the Winter Olympics. Adv. Clim. Change Res. 2023, 14, 112–124. [Google Scholar] [CrossRef]
- Su, M.; Li, Y.; Wang, Y. Public Perceived Effects of 2022 Winter Olympics on Host City Sustainability. Sustainability 2021, 13, 3787. [Google Scholar] [CrossRef] [Scilit]
- Beijing Organizing Committee for the 2022 Olympic and Paralympic Winter Games. Beijing 2022 Legacy Report; BOCOG: Beijing, China, 2022. [Google Scholar]
- Beijing Municipal Ecology and Environment Bureau. Beijing Ecology and Environment Statement 2021; Beijing Municipal Government: Beijing, China, 2022.
- Wang, Y.; Li, X.; Zhang, M. Assessing the impact of the Beijing Winter Olympics on air quality in North China. J. Environ. Sci. 2023, 124, 55–66. [Google Scholar] [CrossRef] [Scilit]
- Li, S.; Chen, L.; Huang, G. Air quality changes during the Beijing 2022 Winter Olympics and Paralympics. Atmosphere 2022, 13, 176. [Google Scholar] [CrossRef] [Scilit]
- Beijing Organizing Committee for the 2022 Olympic and Paralympic Winter Games. Sustainability Plan for the Beijing 2022 Olympic and Paralympic Winter Games; BOCOG: Beijing, China, 2020. [Google Scholar]
- Wu, Q.; Liu, H.; Wang, X. Green electricity trading mechanism for the Beijing Winter Olympics: Design and practice. Sustainability 2023, 15, 2875. [Google Scholar] [CrossRef] [Scilit]
- Zhang, L.; Xu, W.; Li, Y. Impact of the Beijing Winter Olympics on regional transport emissions. Environ. Pollut. 2022, 312, 120536. [Google Scholar] [CrossRef] [Scilit]
- Liu, X.; Zhang, Q.; Wang, K. Quantifying the emission reduction effectiveness of the Beijing Winter Olympics traffic control policies. Atmos. Chem. Phys. 2023, 23, 6663–6678. [Google Scholar] [CrossRef] [Scilit]
- Zhang, X.; Li, M.; Wang, S. Evaluation of low-carbon transport in the Zhangjiakou competition zone. IOP Conf. Ser. Earth Environ. Sci. 2021, 791, 012018. [Google Scholar] [CrossRef] [Scilit]
- Beijing Municipal Commission of Transport. Beijing Transport Development Annual Report 2020; Beijing Municipal Government: Beijing, China, 2021.
- Chen, X.; Wang, Y.; Li, Z. Ecological restoration of the Beijing Winter Olympics ski venues: Technologies and effectiveness. Sustainability 2022, 14, 4521. [Google Scholar] [CrossRef] [Scilit]
- Song, Y.; Li, H.; Wang, J. Vegetation recovery in the Chongli competition zone of the Beijing Winter Olympics. Ecol. Indic. 2022, 142, 109673. [Google Scholar] [CrossRef] [Scilit]
- Li, X.; Wang, H.; Hao, X. Sustainable land use and green ecology: A case from the Beijing 2022 Winter Olympics venue legacy. Front. Environ. Sci. 2022, 10, 944764. [Google Scholar] [CrossRef] [Scilit]
- Hebei Provincial Department of Ecology and Environment. Hebei Province Ecology and Environment Condition Bulletin (2018); Hebei Provincial Department of Ecology and Environment: Shijiazhuang, China, 2019. (In Chinese)
- Hebei Provincial Department of Ecology and Environment. Hebei Province Ecology and Environment Condition Bulletin (2019); Hebei Provincial Department of Ecology and Environment: Shijiazhuang, China, 2020. (In Chinese)
- Hebei Provincial Department of Ecology and Environment. Hebei Province Ecology and Environment Condition Bulletin (2020); Hebei Provincial Department of Ecology and Environment: Shijiazhuang, China, 2021. (In Chinese)
- Hebei Provincial Department of Ecology and Environment. Hebei Province Ecology and Environment Condition Bulletin (2021); Hebei Provincial Department of Ecology and Environment: Shijiazhuang, China, 2022. (In Chinese)
- Hebei Provincial Department of Ecology and Environment. Hebei Province Ecology and Environment Condition Bulletin (2022); Hebei Provincial Department of Ecology and Environment: Shijiazhuang, China, 2023. (In Chinese)
- Ma, S.C.; Kirilenko, A.P.; Stepchenkova, S. Carbon Footprint Management of the Tokyo 2020 Olympics: A Comparative Analysis. Sustainability 2022, 14, 3421. [Google Scholar] [CrossRef] [Scilit]
- Collins, A.; Munday, M.; Roberts, A. Assessing the environmental impact of mega-sporting events: Two decades of the ecological footprint. J. Sustain. Tour. 2024, 32, 1–19. [Google Scholar] [CrossRef]
- Babiak, K.; Trendafilova, S. CSR and environmental responsibility: Motives and pressures to adopt green management practices. Corp. Soc. Responsib. Environ. Manag. 2011, 18, 11–24. [Google Scholar] [CrossRef] [Scilit]
- Shi, P.; Bairner, A. Sustainable Development of Olympic Sport Participation Legacy: A Scoping Review Based on the PAGER Framework. Sustainability 2022, 14, 8056. [Google Scholar] [CrossRef] [Scilit]

Disclaimer/Publisher’s Note: The statements, opinions and data contained in all publications are solely those of the individual author(s) and contributor(s) and not of MDPI and/or the editor(s). MDPI and/or the editor(s) disclaim responsibility for any injury to people or property resulting from any ideas, methods, instructions or products referred to in the content. |
© 2026 by the authors. Licensee MDPI, Basel, Switzerland. This article is an open access article distributed under the terms and conditions of the Creative Commons Attribution (CC BY) license.