


Abstract
This study examines sector-specific patterns of remarketing implementation in manufacturing and service industries and evaluates their effectiveness during digital transformation from a sustainability perspective. Using a mixed-method approach, the research combines descriptive analysis of enterprises’ digital maturity with Monte Carlo simulation modeling of remarketing campaign performance based on key parameters such as budget allocation, conversion efficiency, customer lifetime value, personalization intensity, and investment in AI-driven analytics. The results demonstrate that remarketing enhances traffic, user engagement, and return on investment; however, its sustainability depends on sectoral characteristics and behavioral responsiveness. AI-powered personalization is identified as a critical factor in reducing ad fatigue and improving conversion stability. While manufacturing firms tend to achieve higher but more volatile returns, service-sector companies demonstrate more stable outcomes due to greater digital adaptability and more intensive use of dynamic advertising tools. The findings highlight that sustainable remarketing strategies require sector-specific adaptation to balance economic efficiency, technological investment, and long-term consumer engagement, thereby supporting resilient and sustainable business development in the digital economy.
1. Introduction
Contemporary technological changes play a key role in redefining business models, particularly through the active implementation of digital marketing tools, e-commerce, data analytics, and artificial intelligence [1,2,3,4]. However, in digital markets, the key challenge for marketing is not the adoption of technologies per se, but the management of consumer behavior under information overload and rapidly changing attention patterns. Digital platforms generate large volumes of behavioral data, enabling personalized communication and real-time engagement, yet also increasing the risk of digital fatigue and intrusive advertising. Therefore, the effectiveness of digital marketing depends not only on technological adoption but also on firms’ digital maturity and their ability to use personalization responsibly. This enables enterprises not only to optimize operational processes but also to strengthen consumer engagement by integrating online and offline communication channels [5,6]. Such transformations reflect the overarching trend towards a knowledge-based economy grounded in the extensive use of digital technologies across all management spheres [7,8,9,10]. In this context, digital transformation fundamentally alters the structure and dynamics of business processes, fostering greater efficiency, global market expansion, and personalized consumer interactions [11,12]. Digital marketing systems enable precise targeting, automated customer segmentation, and dynamic content delivery, which are especially relevant for remarketing. However, personalization in remarketing requires high digital maturity, as firms need analytics capabilities, AI tools, and integration of customer data across channels. In low-maturity sectors, remarketing may be limited to basic retargeting, while in digitally advanced industries, it becomes a strategic tool embedded in customer lifecycle management. The adoption of modern technologies, including artificial intelligence, data analytics, and automation, enables companies to reduce costs, increase productivity, and adapt rapidly to market changes [13,14,15]. These processes are cross-industry in nature: digitalization is actively penetrating agriculture [16,17,18], the food industry [19,20,21], the energy sector [22], the financial sector [23], tourism and hospitality [24], and high-tech manufacturing [14]. Digital platforms increasingly influence company operations regardless of their size or industry, providing new opportunities for consumer engagement, data collection, and personalized communication [25,26,27,28]. In this study, the distinction between manufacturing and service is used as an analytical categorization. In contrast, service industries (as part of the non-manufacturing group) often overlap with B2C markets, while manufacturing firms operate in B2B contexts; these dimensions do not fully coincide and are therefore treated separately. Here, the term non-manufacturing refers to service-oriented industries such as tourism, hospitality, retail, IT, and financial services. Within this transformational process, digital marketing technologies play a strategic role in shaping effective channels to impact target audiences and manage development [29,30,31]. From a theoretical perspective, the effectiveness of digital marketing strategies can be explained through several complementary frameworks. First, behavioral economics emphasizes that consumer decision-making in digital environments is characterized by bounded rationality, cognitive biases, and heuristic-based choices, particularly under conditions of information overload and time pressure. In such contexts, repeated and personalized marketing stimuli may significantly affect attention allocation, perceived value, and the probability of conversion. Second, digital marketing and customer relationship management theories conceptualize remarketing not as an isolated promotional tool but as a strategic mechanism of consumer re-engagement embedded within long-term relationship-building processes. Within this framework, remarketing helps reduce customer acquisition costs, increase customer lifetime value, and improve communication efficiency by targeting users with demonstrated prior interest. Third, from a risk–return perspective, remarketing campaigns involve a trade-off between expected marketing returns (e.g., higher conversion rates and revenue stabilization) and potential risks such as consumer irritation, digital fatigue, and declining trust in digital communication. This perspective highlights the need for analytical approaches that capture uncertainty and probabilistic outcomes in marketing decision-making. One such technology is remarketing—a tool that enhances campaign effectiveness by re-engaging individuals who have previously shown interest in a product or service but have not completed the desired action. Its application becomes particularly relevant amid the growing information saturation of the digital environment. However, despite its widespread use, remarketing poses an important managerial and sustainability challenge: balancing marketing effectiveness with responsible digital engagement in an environment marked by information overload, digital fatigue, and declining trust in online interactions. In this study, sustainability is therefore understood as the ability of remarketing systems to achieve stable, long-term performance without increasing digital pressure on consumers or marketing resource intensity.
Research findings [32] also confirm the effectiveness of remarketing as a technology that adapts to changing consumer behavior and improves the accuracy of marketing performance forecasts. Remarketing is viewed as a response to challenges such as declining trust in online interactions [33], digital fatigue, and increased demand for individualized communication approaches [34]. It allows companies not only to attract but also to effectively retain consumers [35], which is especially important for firms operating in emerging markets [36]. From a sustainability standpoint, improved retention through remarketing may lead to longer customer relationships, reduced customer-acquisition pressure, and more stable demand patterns, thereby supporting economic sustainability at the firm level. Such stability-oriented outcomes align with sustainability frameworks that emphasize efficiency, resilience, and long-term value creation rather than short-term performance maximization. Predicting consumer behavior online is critical for developing personalized marketing strategies in the context of digitalization [37]. Modeling probable scenarios of future consumer-brand interactions is highly relevant in today’s digital environment, where user behavior is becoming increasingly complex and less predictable [38]. Specifically, Cui, Tobossi, and Vigouroux [32] demonstrated the potential of combining neural networks with Monte Carlo simulations to estimate the likelihood of user conversion within remarketing campaigns. By employing flexible machine learning models, the authors enabled accurate predictions of which users are most likely to complete a target action after repeated exposure to advertising. When integrated with the simulation approach, this allowed accounting for the uncertainty of behavioral responses, a characteristic feature of the online environment. From a modeling perspective, key variables underlying remarketing effectiveness, such as the probability of return visits, conversion likelihood, and response timing, can be theoretically linked to behavioral uncertainty and heterogeneous consumer preferences. Behavioral economics highlights the stochastic nature of such variables, while digital marketing theory emphasizes their dependence on prior interactions and contextual signals. Consequently, simulation-based methods, including Monte Carlo modeling, provide a theoretically consistent framework for capturing probabilistic consumer responses and evaluating expected outcomes under alternative strategic scenarios. This makes Monte Carlo simulation particularly suitable for sustainability analysis, where long-term performance stability depends on managing behavioral uncertainty and variability rather than optimizing deterministic outcomes. Despite widespread adoption of remarketing across industries, systematic research comparing its effectiveness by sector is lacking, particularly between manufacturing and service segments. Such analysis enables the identification of differences in the use of digital channels, levels of consumer engagement, and adaptability of remarketing tools to different market types. The theoretical and methodological contribution of this study is threefold. First, it offers a cross-sectoral comparison of remarketing effectiveness (e.g., ROI, conversion, and engagement metrics) between manufacturing and service, which is rarely addressed in existing Monte Carlo research. Second, it introduces ROI volatility as a key outcome indicator, capturing the uncertainty and sustainability-related risks associated with digital marketing decisions, such as excessive resource use and consumer fatigue. Third, the study integrates sustainability logic into remarketing evaluation by linking marketing outcomes with resource use intensity, consumer well-being, and long-term business resilience. In this context, sustainability is operationalized through performance indicators focused on efficiency and stability, enabling the assessment of sustainable remarketing outcomes across sectors. Unlike prior Monte Carlo studies that focus on single sectors or technical performance metrics, this research combines sectoral heterogeneity, behavioral uncertainty, and sustainability considerations within a simulation-based framework. Existing studies rarely provide a systematic comparison of remarketing effectiveness across sectors, particularly between manufacturing and service industries, from a theory-informed perspective. This gap represents both a theoretical and managerial problem: theoretically, it limits understanding of how sectoral characteristics shape digital consumer behavior; managerially, it constrains the development of sustainable, sector-specific marketing strategies.
Addressing this issue is particularly relevant for sustainability research, as sectoral differences determine the intensity of resource use, customer engagement cycles, and the long-term effects of digital marketing practices. Understanding these differences enables the development of marketing strategies that are more economically efficient, less resource-intensive, and less burdensome for consumers. A comparative analysis of remarketing across sectors thus supports the design of more tailored and responsible digital marketing practices.
In this context, the Monte Carlo method is appropriate for scenario analysis in an environment characterized by high uncertainty and limited reliable data [39]. As demonstrated by Huang [40], this simulation technique allows modeling consumer behavior, forecasting marketing outcomes, and assessing risks to facilitate more informed strategic decisions in promotion and customer engagement. This approach transforms marketing data into practical managerial decisions through simulation, result visualization, and risk evaluation in the digital environment. The application of Monte Carlo simulation enables an a priori assessment of the effectiveness of various budget scenarios. It helps enterprises in both manufacturing and service sectors select the optimal allocation of marketing resources under uncertainty. Despite the widespread adoption of remarketing across digital markets, its effectiveness remains theoretically and managerially ambiguous under contemporary conditions of information overload, digital fatigue, and declining consumer trust. From a theoretical perspective, existing research lacks a coherent framework to explain how behavioral uncertainty and sector-specific characteristics jointly shape remarketing outcomes, particularly across the manufacturing and service industries. Managerially, firms face a persistent dilemma: balancing marketing efficiency with responsible digital engagement, as excessive or poorly targeted remarketing can cause digital fatigue, erode trust, and undermine long-term customer relationships. This issue is significant for sustainable development, as sustainability encompasses not only environmental outcomes but also stable business models and social responsibility, which require balanced, responsible digital engagement. Moreover, the lack of comparative, sector-specific evidence constrains the development of data-driven, sustainable remarketing strategies tailored to different business environments. This uncertainty is further amplified by the stochastic nature of online consumer behavior, which challenges traditional deterministic evaluation approaches. Consequently, there is a clear need for theory-informed, simulation-based analysis capable of capturing probabilistic outcomes and supporting sustainable marketing decision-making. The purpose of this study is to examine the sector-specific features of remarketing implementation and to model its effectiveness in manufacturing and service industries through Monte Carlo simulation, thereby supporting more efficient, responsible, and sustainable marketing decision-making in digital environments. By doing so, the study contributes to sustainability research by demonstrating how digital marketing performance can be evaluated in terms of resource efficiency, consumer well-being, and long-term stability rather than short-term gains alone.
2. Materials and Methods
This study conducted a comparative analysis of the effectiveness of remarketing implementation across the manufacturing and service sectors in the context of digital transformation, using a multi-stage research design that combined comparative descriptive analysis and probabilistic simulation modeling. To achieve this objective, a comprehensive approach was applied, combining a descriptive analysis of companies’ digital maturity with probabilistic modeling of marketing campaign performance. This design also enables the evaluation of sustainability-related aspects of remarketing by linking performance outcomes with resource use intensity, behavioral uncertainty, and long-term stability.
The first stage of the research focused on assessing the digital maturity of companies in both sectors. Secondary data from Gartner and McKinsey & Company analytical reports [41,42,43] were used, as these sources provide standardized, internationally comparable indicators of digital transformation. The analysis focused on average sectoral values across key dimensions, including digital investment intensity, customer engagement practices, and the level of business process digitalization. These dimensions are directly related to sustainability, as higher digital maturity allows firms to achieve more stable marketing outcomes with lower marginal resource consumption and reduced consumer pressure. Based on the collected data, profile charts were constructed, enabling the identification of structural features of digital transformation in each sector. These sectoral profiles were used to formulate hypotheses about the expected heterogeneity in remarketing effectiveness between the manufacturing and service sectors. In the second stage, a mixed-methods approach was applied, integrating quantitative benchmarking data with qualitative insights from industry reports. The analysis covered the use of Google Ads, email remarketing, dynamic advertising, social media remarketing, CRM systems, and analytics platforms The data sources included analytical reports by Gartner and McKinsey & Company [41,42,43], aggregated data from marketing platforms Google Ads [44] and Meta Business Tools [45], as well as reports from eMarketer and Statista [46,47,48]. The results of this stage informed the simulation model’s parameterization by identifying realistic ranges and sector-specific patterns in remarketing practices. This step ensured that the modeled scenarios reflect not only performance variability but also sustainability-related constraints, such as limits to consumer attention and efficient allocation of marketing resources. To quantitatively assess the effectiveness of remarketing campaigns under uncertainty, a Monte Carlo simulation approach was employed. The method allows the estimation of probabilistic outcome distributions rather than single-point estimates, which is particularly relevant in conditions of market uncertainty. Such probabilistic modeling is particularly appropriate for sustainability assessment, as long-term digital performance depends on managing uncertainty, variability, and risk rather than maximizing short-term outcomes. Key input parameters were treated as stochastic variables. This approach allows capturing fluctuations in consumer behavior and in marketing responses, which are critical for evaluating the stability and sustainability of remarketing performance. For each sector, 5000 simulations were conducted to ensure the stability of the resulting distributions and convergence of key outcome measures. To ensure the relevance and reliability of the results, a systematic approach was employed to develop and validate input parameters, based on up-to-date analytical sources, case studies, and digital trends from 2024 to 2025. The simulation model incorporated key performance and investment variables, including remarketing budget, click-through rate (CTR), conversion rate (CR), customer lifetime value (CLV), personalization level, investment in AI and analytics tools, and mobile application coverage. Together, these variables represent both performance outcomes and resource inputs, enabling assessment of sustainability in terms of value creation relative to invested digital resources. Key variables were selected from open sources, including HubSpot [48], WordStream [49], Google Ads Benchmarks [44], LinkedIn Marketing Solutions [50], and Statista Digital Marketing Statistics [46,47,48]. All input parameters were treated as stochastic variables, with uniform or beta distributions applied depending on the nature of the variable and its empirical properties. Distribution ranges were defined based on minimum and maximum values reported in industry benchmarks for 2024–2025. The assumption of independence among input variables was adopted as a deliberate modeling choice to isolate the marginal contribution of each factor to campaign performance. While correlations between parameters may exist in practice, this assumption enhances interpretability and is commonly applied in exploratory Monte Carlo simulations. This modeling choice supports sustainability analysis by clarifying the isolated impact of individual factors on performance stability and resource efficiency. Data processing and analysis were performed using Excel and Statistica 12 software, which facilitated effective data management, simulation execution, and visualization of results.
3. Results
3.1. Theoretical Foundations of Digital Transformations
Among the wide variety of approaches to assessing digital transformation at the enterprise level, framework models developed by leading consulting agencies are widely used as reference structures. In this study, these frameworks are applied as contextual analytical benchmarks rather than as instruments of empirical validation or performance comparison. McKinsey’s [42] digital reinvention model envisions integrating strategy, innovation, customer experience, process automation, organizational structure, and data analytics. The breakthrough transformation concept by BCG 2016 [51] emphasizes a three-stage approach: achieving quick wins, implementing medium-term changes, and pursuing long-term sustainability, while considering cultural transformation. Gartner’s [41] digital leadership model proposes a six-step path to building a digital enterprise involving strategists, marketing executives, and business unit leaders. Cognizant’s [52] digital customer experience concept covers all levels of digitalization from products and services to operations, organization, and customer engagement. Additionally, the Open-ROADS digital maturity model provides a unified approach to assessing the current state of transformation.
Collectively, these frameworks highlight digital maturity, customer interaction, and data-driven decision-making as structurally relevant dimensions of enterprise transformation. In the context of the present study, they justify the selection of digital maturity indicators and remarketing-related parameters applied in subsequent simulation modeling.
3.2. Structural Determinants of Remarketing Under Digital Transformation
Systematization of data from leading scientific and applied sources has identified key factors driving the transition from traditional marketing to remarketing strategies in the context of digital transformation. Based on a comparative analysis of approaches across different sectors, several leading determinants were established:
- -
- The growth of digital presence, especially on social media platforms, opens opportunities for a broader target audience reach, with over 75% of remarketing campaigns executed via Facebook and Instagram [53];
- -
- Content personalization and the use of behavioral algorithms are directly linked to increased conversion rates (CR), particularly evident in the service sector, where bounce rates are significantly lower;
- -
- A strategic focus by enterprises on clearly defined business goals positively impacts remarketing ROI, as supported by empirical data;
- -
- The dissemination of content with high social value, which has viral potential, is especially notable among B2C companies actively utilizing visual formats on social media.
Equally important is the economic efficiency of remarketing strategies, which reduce customer acquisition costs (CAC) while simultaneously increasing conversion metrics. Finally, the adaptability of digital strategy in real time helps stabilize ROI even amid market uncertainty. Thus, the identified factors demonstrate that the effectiveness of remarketing in the context of digital transformation depends not only on enterprises’ technological capabilities but also on the level of personalization, the quality of customer interaction, and the strategic orientation of digital campaigns toward sustainable digital marketing development. At the same time, these factors are closely linked to the level of digital maturity of enterprises, which warrants further analysis in the B2C and B2B sectors.
Remarketing is relevant for both manufacturing and service enterprises, as well as for B2B and B2C segments. In manufacturing, purchase decisions are often complex and involve multiple stakeholders, which requires prolonged customer engagement. Remarketing supports this process by maintaining contact and providing relevant technical information and case studies. In the service sector, where competition is high and purchase decisions are frequently based on trust, remarketing strengthens brand recall and encourages repeat purchases. Moreover, while B2B remarketing focuses on nurturing long decision cycles, B2C remarketing aims to accelerate purchase decisions and increase conversion rates.
3.3. Digital Maturity Profiles of Manufacturing and Service Sectors
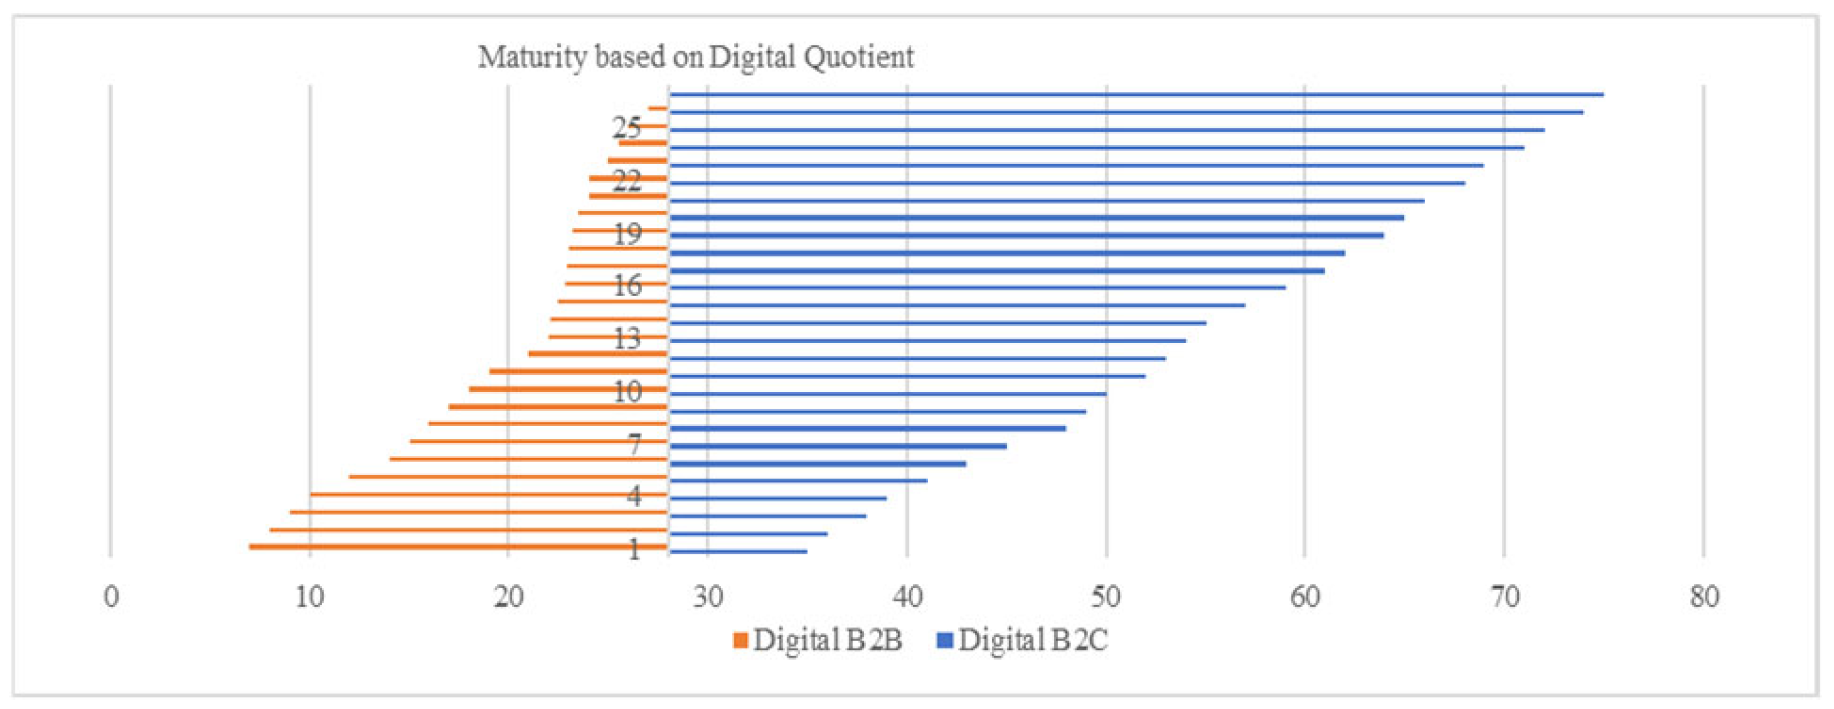
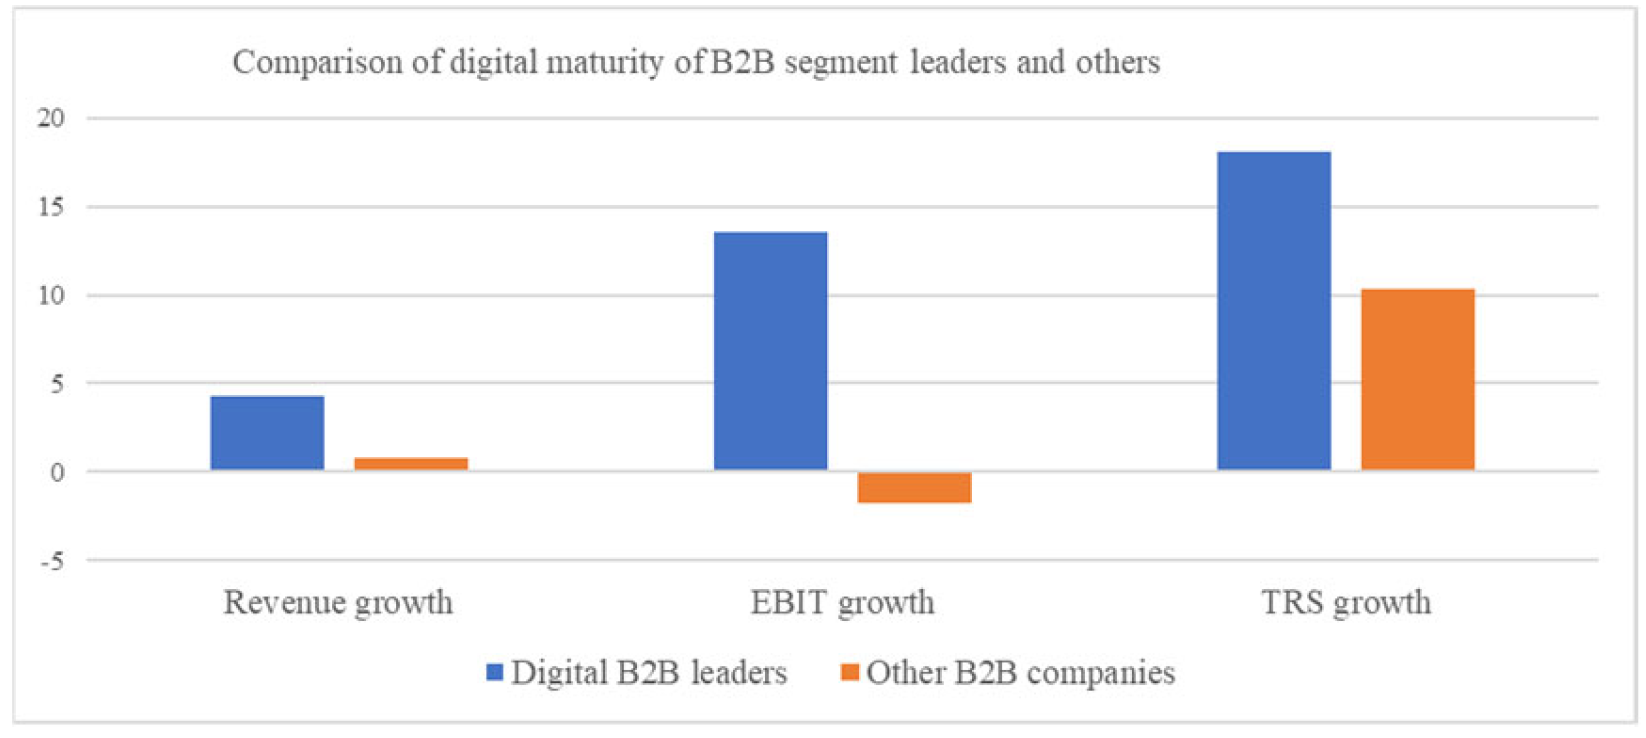
The analysis of digital maturity among enterprises in the B2C and B2B sectors was conducted across three main categories: the level of digital investment, the depth of customer engagement, and the degree of business process digitalization. For clarity, the service category in this study is used as an aggregated analytical group encompassing service-oriented activities (e.g., tourism, IT, hospitality). It is not equivalent to the entire service sector. To visualize the identified structural differences within each sector, profile charts were constructed (Figure 1 and Figure 2).
Figure 1.
Digital maturity of B2C companies. Source: authors developed.
Figure 2.
Comparison of the digital maturity of B2B and B2B companies. Source: authors developed.
The obtained data indicate that B2C companies demonstrate a higher level of digital maturity in customer engagement and digital investments, whereas B2B enterprises focus more on optimizing internal business processes. The digital maturity leadership of B2C companies correlates with improved financial performance, innovative potential, and stronger market positions. At the same time, B2B enterprises show a significant increase in profitability, up to 5 times that of less digitally mature competitors.
The higher digital maturity in the B2C sector reflects greater use of technologies to interact with end consumers, which drives growth in financial and innovative metrics. For the B2B sector, the notable impact of digital processes on operational efficiency and profitability is significant. At the same time, these results are reported as descriptive structural differences and are not interpreted as evidence of superior real-world performance of one sector relative to another. These sector-specific patterns suggest distinct sustainability logics and value-creation pathways, which are further explained by the different technological priorities in each sector.
3.4. Practical Adoption of Remarketing Technologies
Large companies across various industries are pursuing active digital transformation initiatives, as evidenced by the efforts of Adobe, Airbnb, AUDI, Endesa, ING Bank, Starbucks, and Shell (Table 1).
Table 1.
Examples of digital transformation of enterprises.
Table 1 illustrates practical examples of digital transformation implementation by leading companies across various industries, demonstrating that these changes encompass both technological and organizational aspects of their operations. The examples presented serve an illustrative purpose and do not constitute a representative or exhaustive sample. Over 25% of users re-engage with web resources through remarketing campaigns, underscoring the importance of selecting effective remarketing technologies. In this context, it is critically important for enterprises in the service and manufacturing sectors to understand the level of adoption of key remarketing tools. Aggregated comparative data on this indicator are presented in Table 2. As shown in Table 2, service sector enterprises more actively utilize remarketing technologies such as Email Remarketing and Social Media tools, whereas manufacturing companies prefer CRM systems. These differences reflect the specificities of business processes in the respective sectors.
Table 2.
Usage level of remarketing technologies across sectors.
The next phase of the study focused on a comparative analysis of the implementation of remarketing tools in the manufacturing and service sectors. The evaluation covered the most used digital tools: Google Ads, email remarketing, dynamic advertising, social media, app remarketing, Google Analytics, and CRM systems (Table 2).
Table 2 shows that service companies use remarketing tools more actively, especially in their communication channels. Manufacturing enterprises prefer CRM systems and Google Analytics, which align with their B2B orientation. These patterns reflect structural sectoral characteristics such as sales cycle length, interaction frequency, and data availability rather than the behavioral preferences of individual users.
The differentiation in technology adoption is related to the structural characteristics of the sectors: a longer sales cycle and technical product specifics in manufacturing versus high communication intensity and broad traffic in the service sector, as illustrated in Table 3.
Table 3.
Comparison of remarketing implementation in manufacturing and service enterprises.
Similarweb analytics [54] indicate a lower bounce rate in the service sector (25–32%) compared to manufacturing (over 38%), suggesting deeper user engagement. According to Todorov [55], returning customers acquired through remarketing cost on average 65% more than during their initial purchase. The evaluation of remarketing effectiveness was based on metrics such as web traffic, conversion rates, email analytics, SEO, backlinks, and ROI. The results confirm higher remarketing efficiency in sectors with greater digital maturity and customer orientation.
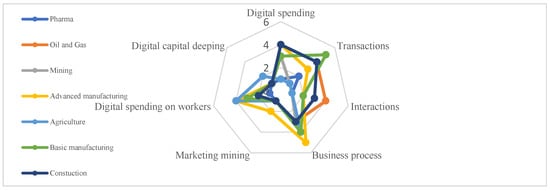
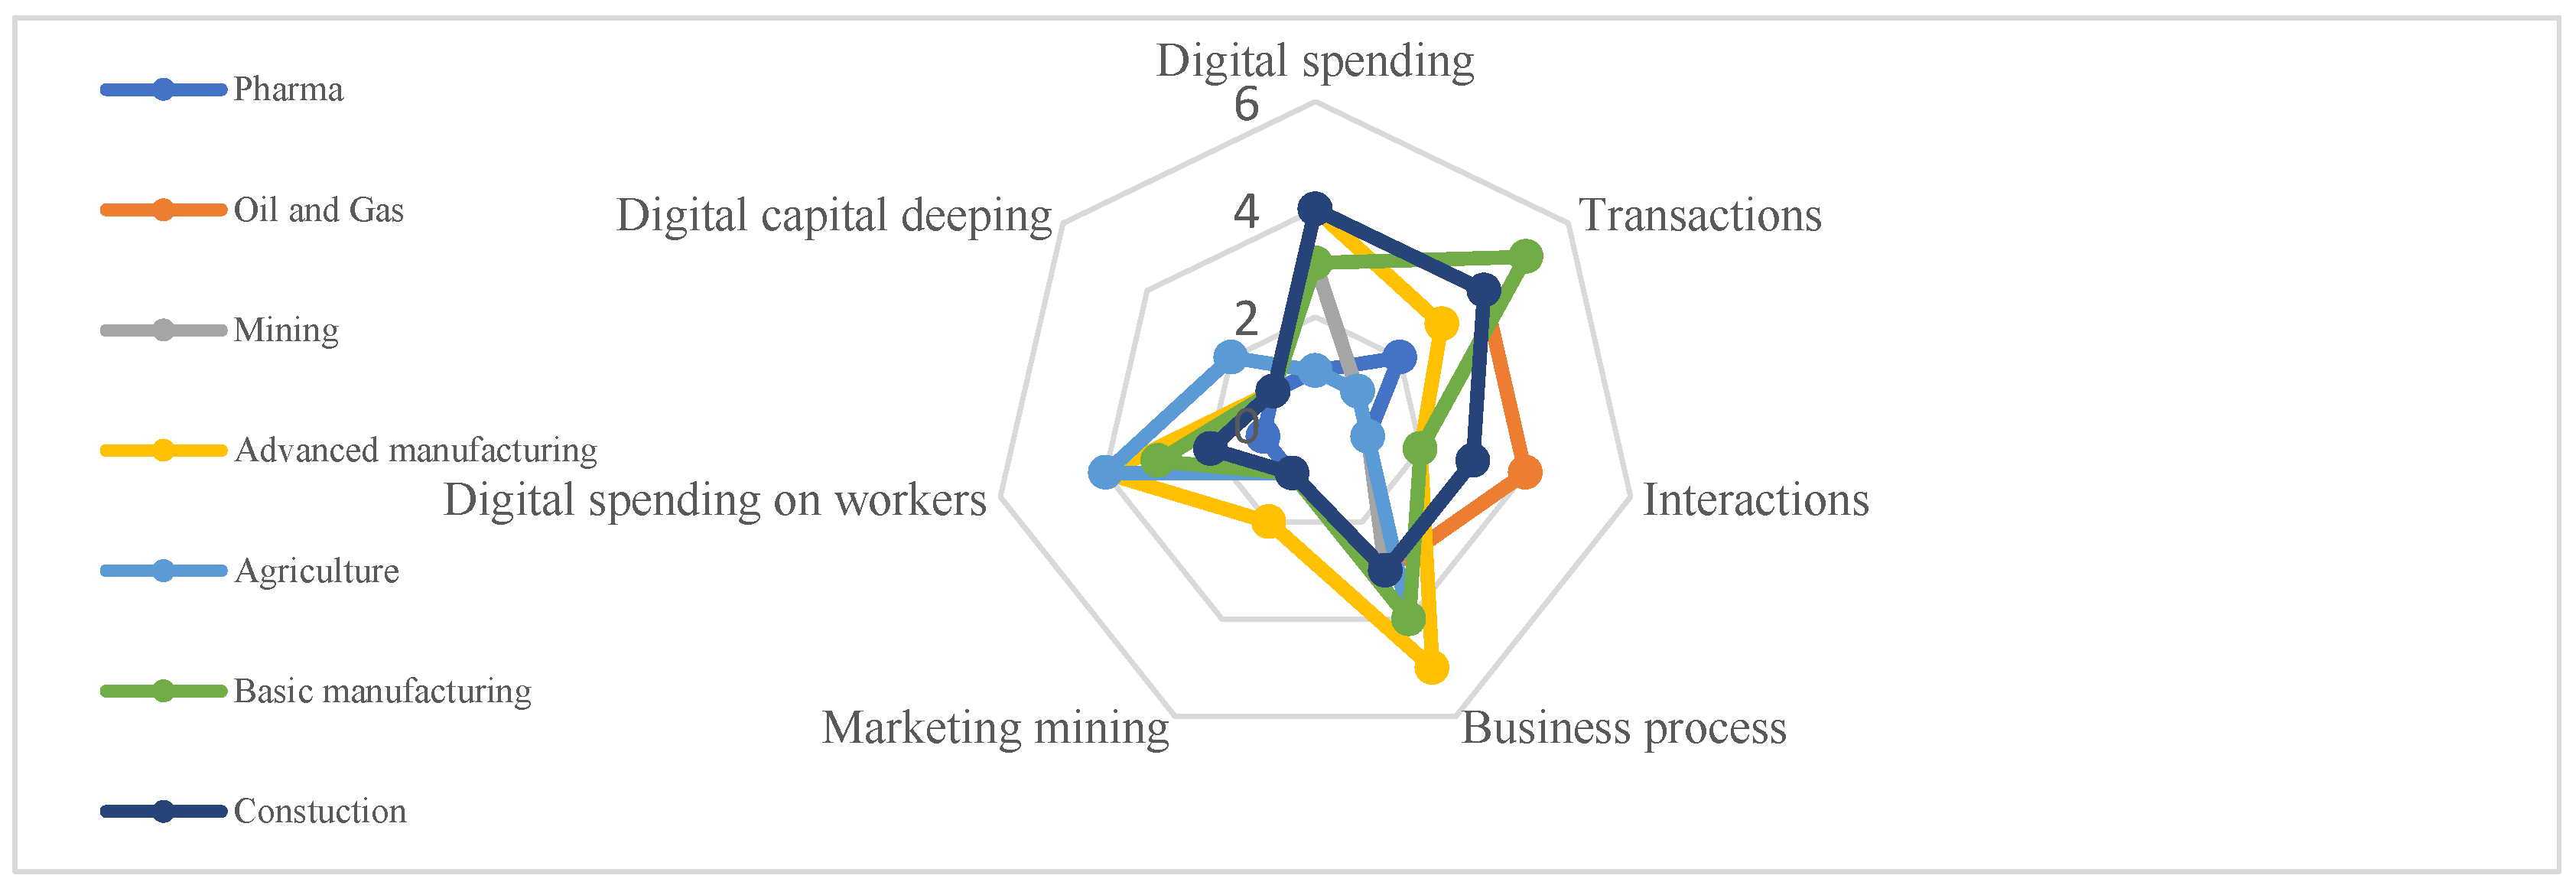
The assessment of digitalization levels in manufacturing and service enterprises worldwide (Figure 3) revealed that the leading positions are held by the IT sector, media industry, finance, insurance, and professional services. These findings reflect a faster pace of digital adaptation and greater flexibility in service enterprises compared to manufacturing ones. To evaluate the use of tools such as Google Ads, email remarketing, dynamic advertising, social media, CRM systems, and analytics platforms, profile charts illustrating sectoral differences and implementation specifics were constructed (Figure 3).
Figure 3.
Profiles of digital transformations at enterprises of the manufacturing and service spheres. Source: authors developed.
The analysis of digital transformation indicators revealed significant differences between the manufacturing and service sectors. The service sector is characterized by a moderate to high level of digitalization (mean values ranging from 3.25 to 4.38). In contrast, the manufacturing sector shows lower, more variable scores (1.43–3.00), indicating a digital lag. Within the service sector, the highest values were recorded in the categories of “Interactions” and “Marketing mining” (both at 4.38), while in manufacturing, the highest scores were observed in “Business process” (3.00) and “Transactions” (2.86), reflecting a prioritization of digitalization in operational and business processes. The most significant gaps between the sectors were noted in “Digital spending” (3.75 vs. 1.43), “Interactions” (4.38 vs. 1.71), and “Marketing mining” (4.38 vs. 2.00), highlighting substantial differences in investments and digital engagement. Meanwhile, differences in “Business process” (3.88 vs. 3.00) and “Digital spending on workers” (3.25 vs. 2.71) were less pronounced, indicating a more active digitalization of internal processes in manufacturing.
Therefore, the identified disparities in digitalization levels between the manufacturing and service sectors necessitate separate modeling of the effectiveness of remarketing campaigns for each sector. To illustrate the characteristics of the service and manufacturing sectors, Table 1 presents the main input parameters used in the simulation modeling, including remarketing budget, CTR, conversion rates, personalization level, and investments in AI and analytics. Table 4 provides a description of the key input parameters of the service and manufacturing sector’s model:
Table 4.
Key parameters.
For the construction of the simulation table in the service sector, the remarketing budget was set within the range of $5000 ± 1500, based on aggregated recommendations from leading platforms: HubSpot [49] suggests spending $1000–2000 per month for small businesses, WordStream by LocaliQ [50] indicates starting budgets from $500, and LinkedIn Marketing Solutions [56] recommends a minimum of $1500 per month for B2B communications. This range ensures flexibility and relevance for simulating different types of service campaigns. Threshold values for CTR (3–12%) and CR (8–18%) are based on industry averages for the service sector, characterized by faster consumer decision cycles and lower interaction costs [49,50]. The CR was modeled using a beta distribution with parameters (4, 20), which best reflects the actual variability in service user behavior. Correlations between budget and behavioral metrics were also considered, thereby improving the reliability of ROI estimates [57].
To ensure simulation reliability in the manufacturing sector, the remarketing budget was set at $7500 ± 500, reflecting average remarketing expenditures for medium- and large-sized companies with multi-level sales funnels [55]. This budget level aligns with B2B marketing practices, where campaigns require longer decision cycles and higher costs per contact [56]. To improve the accuracy of ROI estimates, correlation dependencies among budget, CTR, and CR were accounted for, thereby avoiding internally inconsistent scenarios [55].
Additionally, threshold values for CTR (6–9%) and CR (9–13%) were established based on industry benchmarks for manufacturing remarketing campaigns, which often show higher engagement due to personalized actions in long-term interactions [44,46,47,48]. Correlations between variables, particularly between budget and conversion rates, were considered to prevent illogical scenarios and to enhance the reliability of ROI estimates.
The selection of key parameters provides a comprehensive evaluation of remarketing effectiveness, accounting for both economic and behavioral factors, consistent with modern digital marketing practices amid dynamic digital transformation.
3.5. Simulation-Based Modeling of Remarketing Effectiveness
To identify probabilistic differences in the effectiveness indicators of remarketing campaigns between the manufacturing and service sectors, a Monte Carlo simulation was conducted. This approach allowed for the assessment of remarketing performance under digital transformation by varying key variables in a context of heightened uncertainty.
To achieve the research goal, the following hypotheses were formulated:
H0 (null hypothesis).
There are no statistically significant differences in remarketing effectiveness metrics between the manufacturing and service sectors.
H1 (alternative hypothesis).
Statistically significant differences exist between sectors in terms of remarketing campaign effectiveness indicators.
The multi-level implementation structure of the Monte Carlo method included the following analytical stages:
- Construction of descriptive statistics matrices for each sector to characterize the distribution of input variables (budget, CTR, CR, CLV, Personalization Level, AI/Analytics Investment, Mobile App Coverage (%) and evaluate their suitability for modeling;
- Formation of a correlation matrix to investigate inter-variable relationships and avoid scenarios with illogical parameter combinations;
- Calculation of ROI metrics based on 5000 simulated scenarios per sector to estimate the range of effectiveness;
- Construction of Box Plots for ROI to visualize distribution, identify median values, asymmetry, and statistical outliers;
- Statistical significance testing of ROI differences between sectors using a two-sample t-test assuming unequal variances;
- Construction of a three-dimensional (3D) surface plot to determine the relationship among CTR, CR, and ROI, aiming for spatial visualization of behavioral factors’ impact on performance.
All stages were carried out in parallel across both sectors, ensuring reliability, validity, and comparable results within the study. To ensure internal consistency and analytical transparency, this study uses two analytically distinct ROI-based indicators derived from Monte Carlo simulations. First, an absolute simulated ROI (ROI_abs) is calculated for each scenario, reflecting the profit potential of remarketing campaigns under sector-specific cost structures, customer lifetime value (CLV), and budget scales. Second, a normalized ROI index (ROI_norm) is constructed and subsequently used for statistical testing and sensitivity analysis to enable meaningful comparison between sectors characterized by structurally different transaction sizes and revenue distributions. All comparative statistical conclusions reported in Section 3 are based exclusively on ROI_norm. This distinction is methodologically necessary to avoid scale-driven bias in comparative statistical inference. The matrices based on the outcomes of 5000 simulations are presented in Table 5 and Table 6.
Table 5.
Descriptive statistics (manufacturing sector).
Table 6.
Descriptive statistics (service sector).
The comparative analysis of descriptive statistics revealed significant differences between the manufacturing and service sectors in the context of remarketing campaigns. The average remarketing budget in the manufacturing sector was $7494.3, with a standard deviation of 393.65, indicating a relatively stable level of investment. In contrast, the service sector demonstrated a substantially lower average budget of $4005.6, but with greater variability (standard deviation of 996.48), suggesting a more flexible approach to resource allocation. Audience engagement indicators, including CTR and CR, were higher in the service sector—8% and 13%, respectively—than in manufacturing—7.5% and 11%, respectively. These differences may be attributed to the more emotional nature of services and quicker consumer response cycles. Meanwhile, the average Customer Lifetime Value (CLV) was significantly higher in the manufacturing sector, at $194,790.8, compared with $25,066.31 in the service sector, reflecting the larger scale and long-term nature of transactions in manufacturing. Personalization levels remained high in both sectors: 74.2% in manufacturing and 77.4% in services, with greater variability observed in the latter, suggesting a more active application of individualized strategies. Investment in analytics and artificial intelligence was also higher in manufacturing (32.5 units), underscoring the greater technological intensity of marketing processes in that sector. Mobile app reach was considerably higher in the service sector (68.06%) than in manufacturing (29.5%), driven by interaction patterns typical of B2C communications. Overall, the manufacturing sector is characterized by stable but higher investments, a long-term transaction focus, and a strong emphasis on data-driven technologies. In contrast, the service sector demonstrates more dynamic audience behavior, greater personalization, and a broader use of mobile-based digital interaction tools.
To further assess the direction and strength of linear relationships between key remarketing parameters, correlation matrices were constructed for each sector (Table 7).
Table 7.
Correlation matrix for manufacturing (below the diagonal) and the service sector (above the diagonal).
The correlation matrices for both sectors indicate a general trend of weak or non-existent linear relationships among the key parameters of remarketing campaigns. The correlation coefficients range from −0.04 to 0.04, indicating negligible linear dependence between the variables in the simulated dataset. Since the variables were generated under the assumption of independence, these results confirm that the simulation design successfully preserved this property. Therefore, the input variables are suitable for further analysis.
3.6. ROI Distribution and Comparative Outcomes
To assess the effectiveness range of remarketing campaigns across simulated scenarios, ROI indicators were calculated for each sector (Table 8).
Table 8.
Results for ROI in the service and manufacturing spheres.
The results (Table 8) revealed significant differences between the manufacturing and service sectors in key characteristics of ROI distribution. These distributions describe the structural properties of the simulated systems rather than observed market outcomes. Table 8 reports the distributional characteristics of the simulated absolute ROI (ROI_abs), capturing the structural profit potential of remarketing campaigns across sectors under the assumed input parameter ranges. These values are reported for descriptive purposes only and are not used for cross-sector efficiency comparison or hypothesis testing. The reported values reflect modeled system behavior rather than empirical performance and are primarily driven by sector-specific factors, including average CLV, investment scale, and revenue concentration. In the service sector, the mean ROI was 7.06, with the same median value (7.06), indicating a symmetrical distribution of outcomes. The minimum ROI was 0.90, the maximum reached 13.22, and the standard deviation was 8.71, suggesting relative stability and moderate variability in the effectiveness of remarketing campaigns. This pattern aligns with the lower risk and higher predictability typical of B2C markets, where customer interactions are generally more direct and standardized.
In contrast, the manufacturing sector reported a higher average ROI of 10.31, with a median also at 10.31, confirming the symmetry of the distribution. However, the ROI range was considerably wider, spanning 0.24 to 20.38, and the standard deviation was 14.24. These results point to greater volatility and risk compared with the service sector, which can be attributed to the more complex nature of B2B interactions, longer decision-making cycles, and higher financial stakes per transaction. The elevated standard deviation observed in the manufacturing simulations is consistent with the properties of Monte Carlo modeling, which accounts for a broad spectrum of probable outcomes and emphasizes the influence of stochastic factors. The alignment between the mean and median values in both sectors confirms the absence of skewness, thereby validating the model’s statistical robustness. In summary, while the manufacturing sector offers higher profit potential from remarketing campaigns, it also entails greater instability and a higher risk of loss. Conversely, the service sector delivers moderate but stable ROI values, which may be critically important for companies prioritizing predictable outcomes, risk minimization, and consistent budget planning in digital strategy formulation.
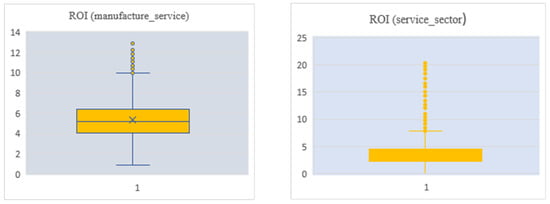
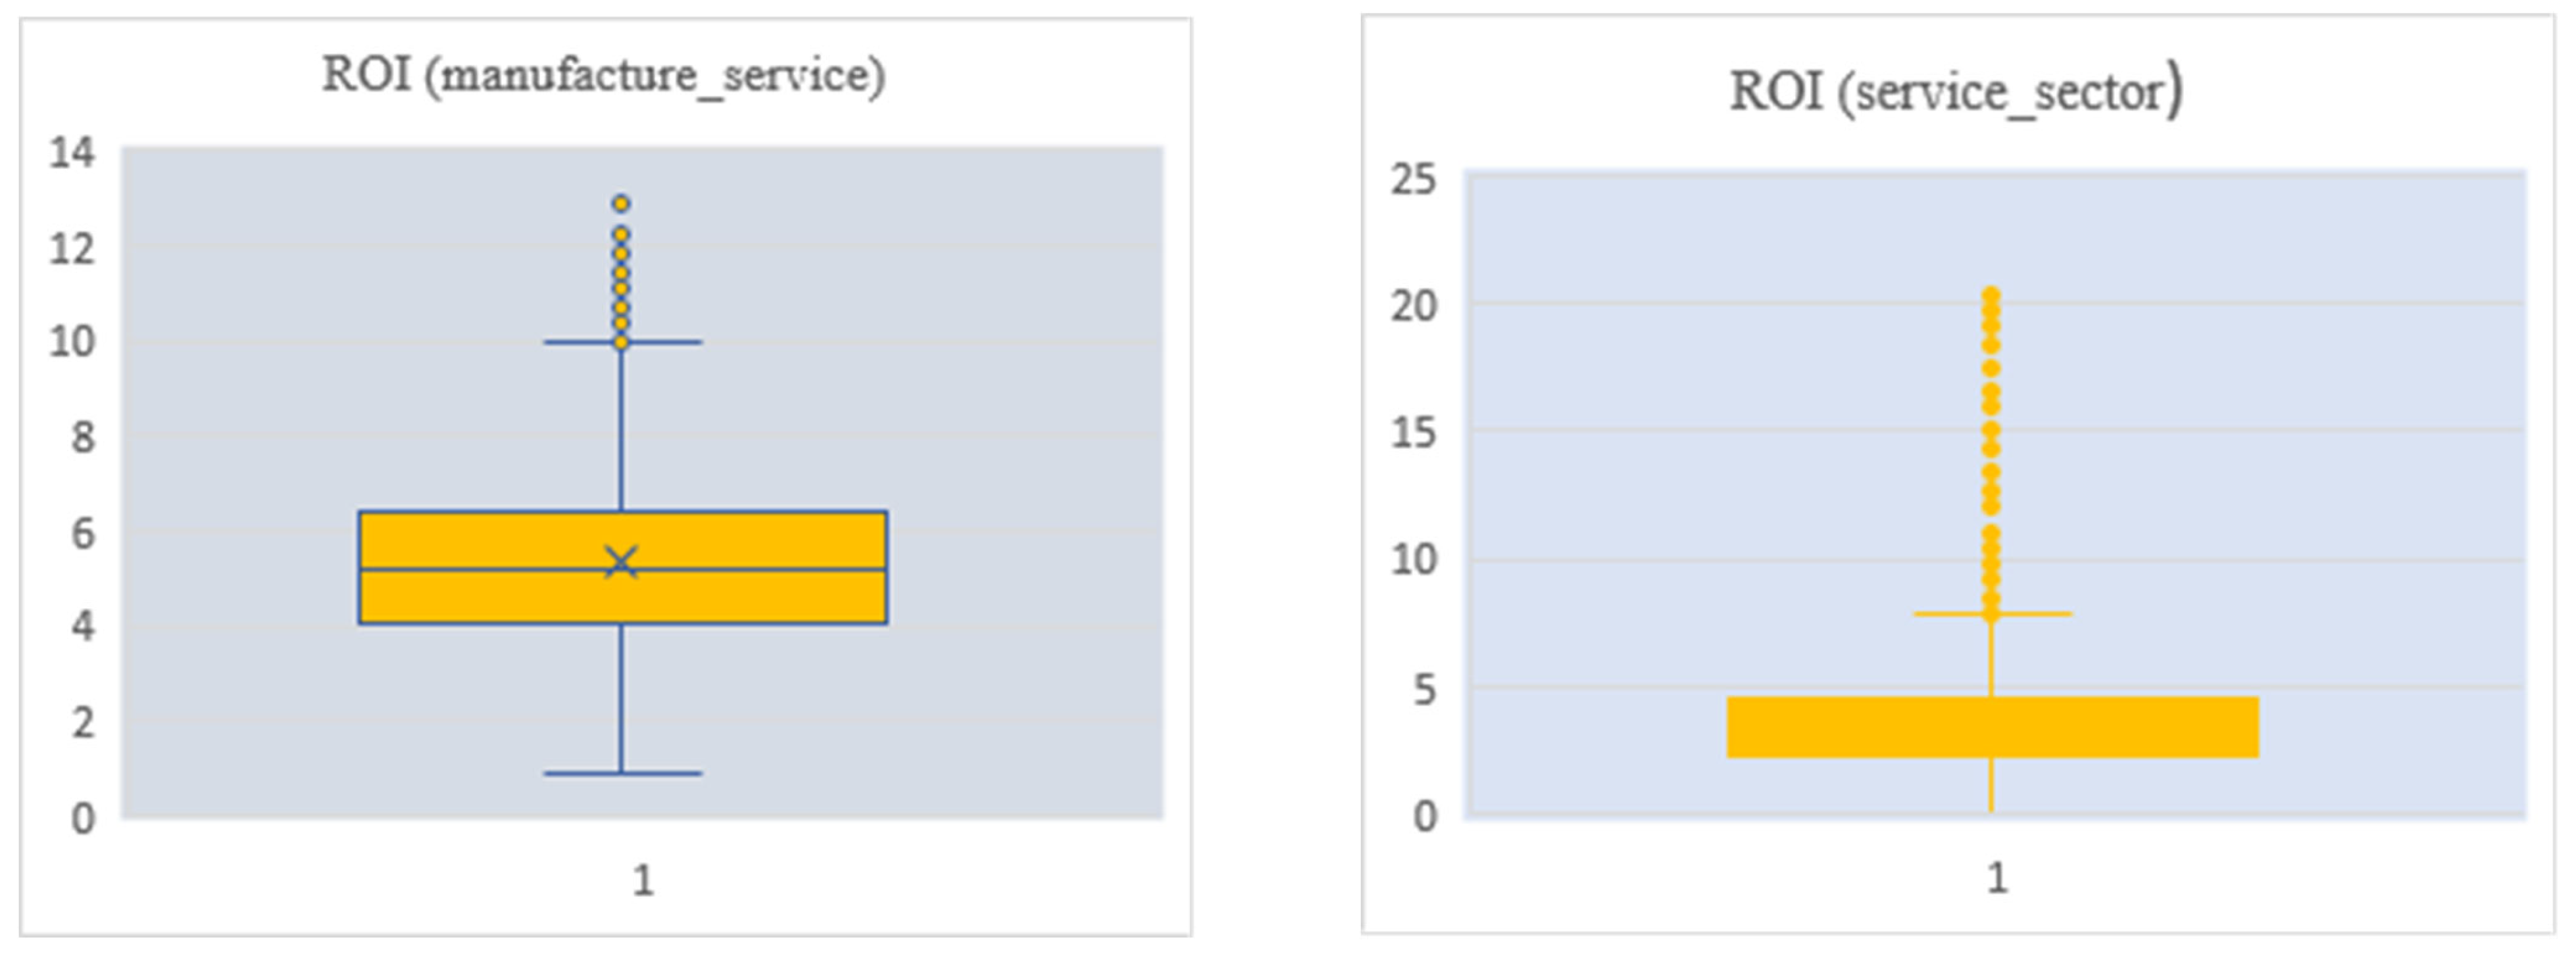
The distribution of ROI values, their variability, and potential statistical anomalies were clearly visualized using Box Plots (Figure 4), which enabled the identification of key characteristics of the simulated data, including the median, interquartile range, distribution asymmetry, and outliers.
Figure 4.
Distribution of ROI illustrated via box plot based on Monte Carlo simulation results (n = 5000). Source: own calculations.
Figure 4 (manufacturing sector) illustrates a concentration of simulation outcomes within the 4–8 ROI range, with a median value around 5, indicating a moderate level of effectiveness under typical conditions. The box represents the interquartile range (IQR); the horizontal line inside the box indicates the median; whiskers denote the non-outlier range; and dots represent outliers. The presence of numerous outliers above the upper quartile (up to 13.2) suggests strong potential for high-return campaigns. In manufacturing, elevated ROI may result from large-scale orders and long-term contracts, where even slight increases in conversion rates can substantially boost profits. Moreover, remarketing costs may be lower because targeting previously interested audiences, thereby enhancing investment efficiency. However, the minimum ROI value of 0.9 highlights the risk of underperformance in specific scenarios. The Box Plot for the service sector displays a narrower interquartile range (approximately 2–6.5), with a median ROI of 5 and a lower bound near 0.9. This pattern reflects a high level of predictability in results and ROI stability across most campaigns. Despite outliers, most simulations remain below a threshold of 7, indicating moderate variability within the service domain.
The analysis revealed that the manufacturing sector has greater profitability potential, albeit with higher risk, whereas the service sector is characterized by greater stability in performance outcomes.
3.7. Statistical Testing and Model Sensitivity
To statistically confirm significant differences in ROI indicators between the manufacturing and service sectors, a two-sample t-test with unequal variances was conducted (Table 9). The test was performed using the normalized ROI index (ROI_norm) rather than absolute ROI values to control for structural differences in transaction scale and revenue dispersion between the two sectors. As the analysis is based on simulated observations rather than empirical firm-level data, the results support internal model differentiation rather than causal inference. The test evaluates simulated observations rather than empirical firm-level data and therefore supports internal model differentiation rather than causal inference.
Table 9.
Two-sample t-Test assuming unequal variances.
To perform the t-test, 500 random observations were selected from each sector out of the total 5000 simulated scenarios. Since the data are generated through simulation, the t-test is used to confirm internal differentiation between modeled sectors rather than to infer population parameters from empirical observations. This approach is statistically sound, as a sample size of 500 is generally considered sufficient for parametric testing, particularly the t-test, provided that assumptions of observation independence and near-normality of distributions are met—conditions satisfied by the nature of Monte Carlo simulations. The results showed that the mean ROI in the service sector (M = 2.64) was significantly higher than in the manufacturing sector (M = 1.23). The obtained t-statistic (t = 62.26; df = 858) substantially exceeds the critical values for both one-tailed (1.65) and two-tailed (1.96) tests at a 0.05 significance level. In both cases, the p-value was < 0.001, allowing us to reject the null hypothesis confidently. Thus, the t-test results confirm a statistically significant difference in the effectiveness of remarketing campaigns between the service and manufacturing sectors.
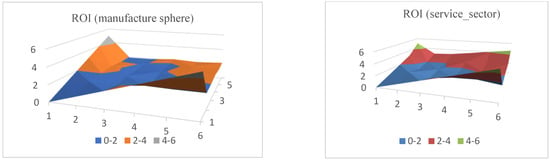
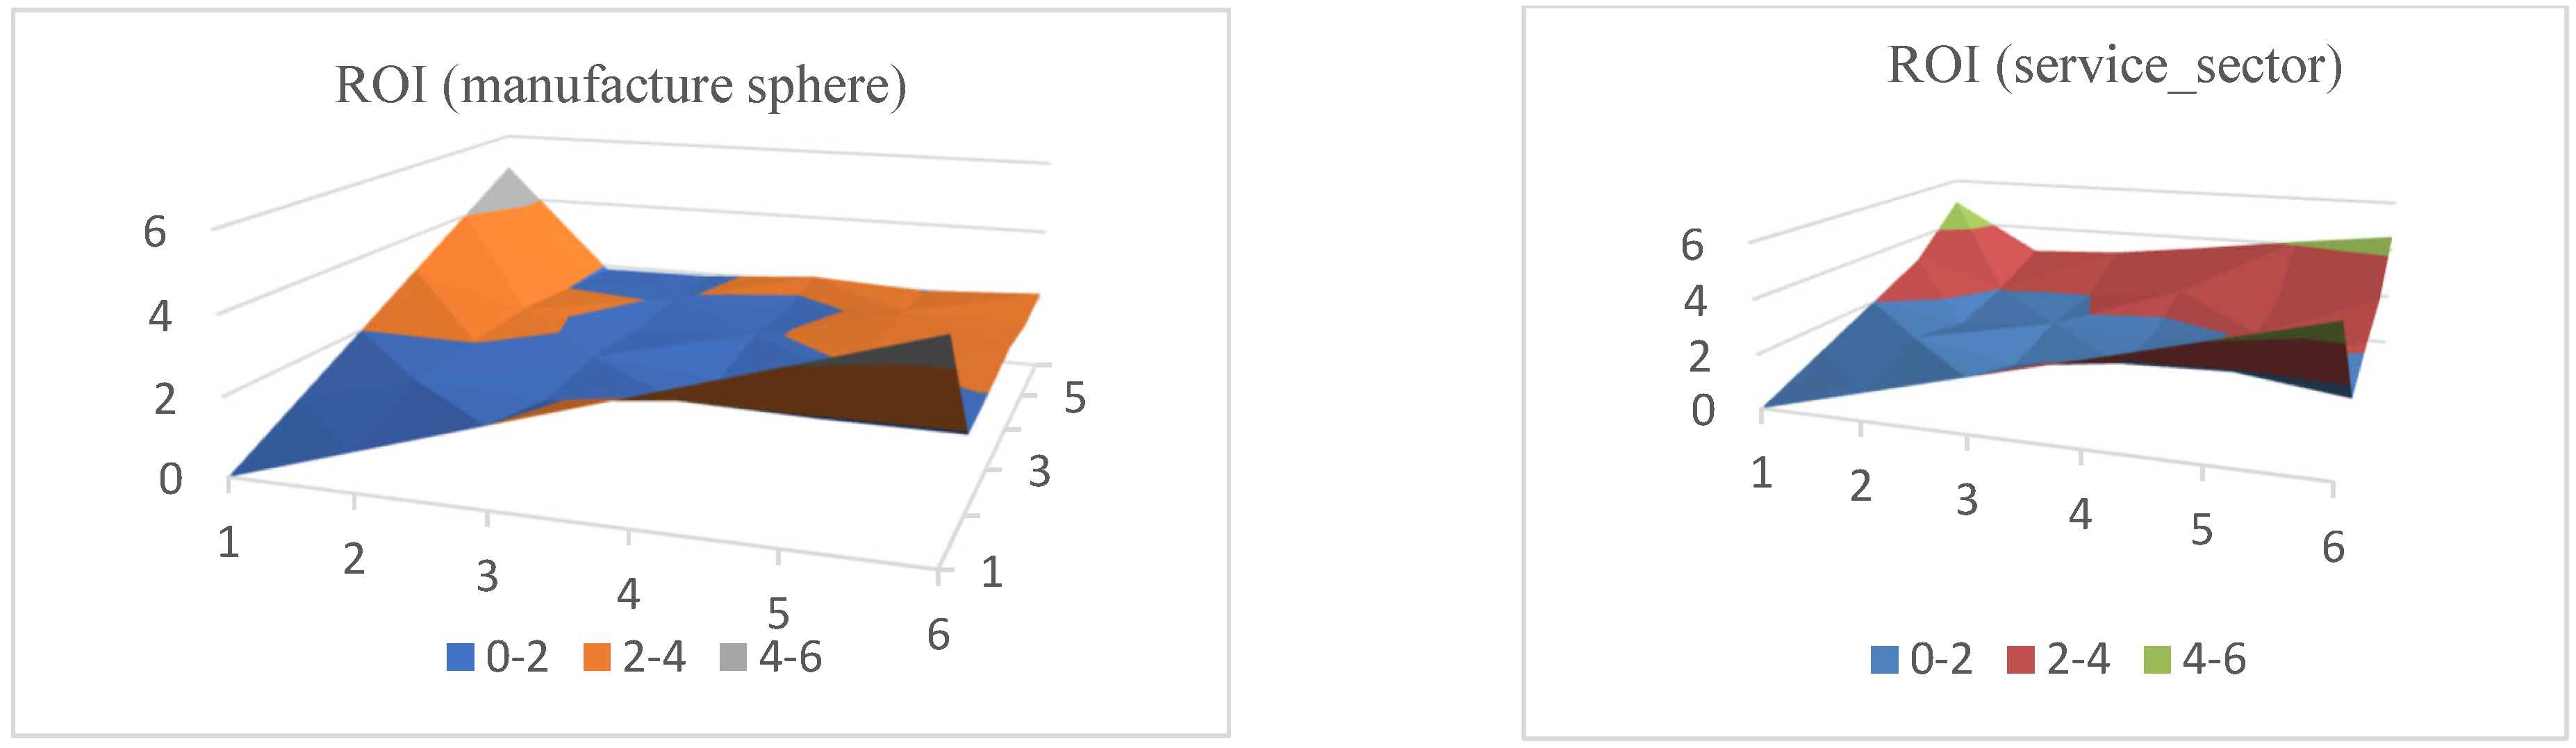
Since CTR (Click-Through Rate) and CR (Conversion Rate) are among the key determinants of ROI in remarketing campaigns, it was deemed appropriate to visualize their relationship using a 3D surface plot. A three-dimensional (3D) surface chart was constructed to spatially illustrate the interaction between these behavioral metrics and remarketing effectiveness, as measured by ROI (Figure 5). It should be noted that CTR and CR are exogenous input parameters in the simulation design. Therefore, the observed sensitivity patterns reflect the structural properties of the modeled system within the selected input ranges, rather than direct behavioral causation by real users.
Figure 5.
Mean ROI by CTR and Conversion Rate levels. Source: own calculations.
The surface plot for the manufacturing sector (Figure 5) showed a relatively uniform distribution of ROI values between 1.60 and 2.19, with no clear dependence on CTR or CR levels. The surface is smooth and continuous, lacking sharp gradients or local maxima, indicating a limited sensitivity of ROI to behavioral metrics in this sector. Higher ROI values were generally observed at medium-to-high levels of CTR and CR, reflecting the structural characteristics of B2B markets with long-term contracts and large transactions, where profitability is less dependent on digital engagement intensity.
In contrast, the surface plot for the service sector (Figure 5) demonstrated a clear positive correlation between ROI and the simultaneous increase in CTR and CR. The plot’s surface shows greater complexity, with noticeable gradients and local peaks, particularly in the upper-right quadrant, where high CTR and CR values are observed. This indicates the presence of a synergistic effect and a strong dependence of campaign performance on user behavior. Such dynamics are typical of B2C markets, where digital user engagement directly influences financial outcomes.
The comparative surface analysis confirms that the manufacturing sector is characterized by stable ROI and lower behavioral sensitivity. In contrast, the service sector shows greater variability and a higher ROI responsiveness to customer interactions. These differences are critical for tailoring adaptive remarketing strategies in the context of digital transformation. These differences are essential for designing an adaptive, sustainability-oriented remarketing strategy in the context of digital transformation.
4. Discussion
In this study, sustainability is interpreted through the lens of digital resource efficiency, consumer well-being, and the long-term stability of remarketing performance, rather than solely through environmental indicators. Within this framework, sustainability is defined as the ability of digital remarketing systems to maintain stable performance over time without increasing resource intensity or consumer pressure.
Effective implementation of digital marketing tools, particularly remarketing, requires a strategic balance between engagement intensity and consumer tolerance. Excessive advertising frequency increases cognitive load and leads to ad fatigue, reducing campaign effectiveness, especially in digitally saturated environments. From a sustainability perspective, such effects indicate inefficient resource use and declining consumer well-being, which undermine the long-term viability of remarketing strategies. From a consumer behavior perspective, this reflects bounded rationality and attention scarcity, in which repeated stimuli lose persuasive power as perceived relevance declines. This mechanism is particularly evident in the service sector, where emotionally driven, experience-oriented consumption dominates decision-making. As expectancy and behavioral response theories suggest, service consumers react more strongly to personalization quality and message timing, which explains the observed sensitivity of ROI to CTR and CR dynamics in this sector.
AI-driven personalization emerges as a critical moderating mechanism in this process. By dynamically adjusting content, frequency, and targeting, AI tools reduce perceived intrusiveness and support sustained engagement. This finding aligns with recent studies emphasizing the role of advanced analytics, feeling AI, and adaptive algorithms in stabilizing digital marketing performance and improving consumer trust [5,9]. In contrast, manufacturing-sector remarketing reflects more rational, analytically driven decision-making, where technical specifications, long-term guarantees, and cost optimization prevail. As a result, remarketing effectiveness in manufacturing shows weaker dependence on behavioral engagement metrics and greater reliance on structural factors, such as customer lifetime value and contract scale. Service-sector remarketing thus demonstrates a sustainability-oriented trajectory characterized by moderate yet stable returns, lower consumer pressure, and greater efficiency in attention-based resources. This pattern reflects a sustainability pathway based on engagement quality rather than intensity, supporting long-term value creation under conditions of limited consumer attention.
From a digital maturity perspective, these differences are consistent with established transformation frameworks [41,42,51]. Service firms typically demonstrate higher maturity in customer interaction, omnichannel integration, and real-time data use, leading to more predictable but moderate returns [55]. Manufacturing firms, while often digitally advanced in internal processes and analytics, exhibit lower engagement maturity, resulting in higher but more volatile ROI outcomes. This distinction supports the view that digital maturity influences not only efficiency but also risk exposure in marketing investments. Accordingly, higher digital maturity contributes to sustainability by reducing performance volatility and enabling more predictable and resource-efficient remarketing outcomes.
Finally, the results align with a risk–return logic in strategic management. From this perspective, normalized ROI (ROI_norm) serves as an operational proxy for sustainable digital performance, capturing value creation relative to invested resources while minimizing scale-driven distortions. Unlike absolute performance metrics, ROI_norm allows sustainability assessment by emphasizing performance stability and efficiency under constrained digital resources. Manufacturing remarketing resembles high-risk, high-return investment behavior, whereas service-sector remarketing prioritizes stability and sustainability. These insights reinforce the need for sector-specific, adaptive remarketing strategies that balance economic efficiency, technological intensity, and responsible digital engagement to support long-term sustainable business development. This approach is particularly relevant for sustainability analysis, as long-term performance stability inherently depends on managing uncertainty and behavioral variability. The findings are particularly relevant for organizations with advanced digital infrastructure and access to consumer data. Nevertheless, the model does not replace empirical research and should be viewed as a decision-support tool rather than a predictive substitute for real-market observation. From a strategic management perspective, service-sector remarketing emphasizes stability and sustainable engagement, whereas manufacturing remarketing follows a higher-risk, higher-return investment logic. Further research should expand to include interregional analyses of perceptions of remarketing, considering cultural and social specificities, and should integrate firm-level or panel data.
5. Conclusions
This study addressed the managerial and theoretical problem of optimizing remarketing strategies under conditions of digital uncertainty and sustainability constraints. This problem was examined within a simulation-based framework designed to explore plausible strategic scenarios rather than to describe observed market behavior. The study identified key remarketing metrics essential for effective user re-engagement, conversion optimization, and enhanced brand awareness in the simulated environment. The simulation results suggested that AI-driven message personalization reduces ad fatigue and improves campaign effectiveness by aligning content intensity with consumer attention limits across the customer journey. The research also confirmed significant differences in digital maturity between B2C and B2B enterprises within the modeled scenarios. In the simulation, B2C companies invest more in customer interaction and digital marketing, reflected in higher innovation and engagement indicators. Conversely, B2B firms focus primarily on optimizing internal business processes, leading to substantial profit growth sometimes up to 5 times that of less digitally mature competitors. This magnitude reflects relative differences observed in simulated outcomes and should not be interpreted as predictive estimates of actual financial performance. These patterns reflect distinct sustainability logics: engagement sustainability in B2C markets versus efficiency sustainability in B2B contexts.
At the global level, service sectors demonstrate faster digital adaptation and greater flexibility, supported by higher levels of digitalization and greater marketing investments. Manufacturing companies emphasize digitalization of internal processes, whereas service firms actively deploy remarketing tools and engage customers.
Monte Carlo simulation results indicate statistically significant differences in remarketing campaign performance between sectors. The manufacturing sector shows a higher average ROI with greater variability, indicating increased risk alongside higher profitability potential. In contrast, the service sector offers more stable, though moderate, ROI, emphasizing predictability and lower marketing risk. This confirms the applicability of the risk–return trade-off framework to the design of digital marketing strategies. This provides scenario-based support for the applicability of the risk–return trade-off framework to the design of digital marketing strategy.
Three-dimensional analysis of the relationships among CTR, CR, and ROI confirmed that remarketing effectiveness in manufacturing is less dependent on behavioral factors. In contrast, in the service sector, it strongly correlates with audience engagement levels. This insight is critical for adaptive budget allocation and supports sustainable marketing by reducing inefficient advertising pressure. The practical significance of these results lies in providing tools in the form of decision-support insights derived from modeled scenarios under uncertainty for optimizing marketing strategies tailored to sector-specific characteristics; supporting managerial decision-making through risk and scenario modeling via Monte Carlo methods; developing individualized recommendations for B2B and B2C segments regarding personalization, budgeting, and campaign duration; enhancing business competitiveness by rapid adoption of digital innovations and minimizing expenditures on ineffective channels; and universal application in consulting, digital strategy development, and professional training.
Limitations of the study include reliance on benchmark-based parameters, absence of firm-level empirical data, and potential sectoral and regional biases. The Monte Carlo model does not replace empirical analysis; rather, it complements it by exploring plausible scenarios under uncertainty. Accordingly, the conclusions drawn from this study should be viewed as exploratory rather than definitive. Future research should integrate proprietary datasets, panel data, or experimental designs to validate and extend the proposed framework.
Thus, the study not only established statistically validated sectoral differences amid digital transformation but also demonstrated how simulation modeling can support economically efficient, behaviorally informed, and ethically balanced remarketing strategies in the digital economy. Significantly, these conclusions are based on Monte Carlo simulations and reflect modeled scenarios rather than observed market behavior. Therefore, the findings should be interpreted as probabilistic tendencies and decision-support insights under uncertainty, rather than as deterministic or causal claims applicable to real-world markets.
Author Contributions
Conceptualization, O.S., K.V. and N.P.; methodology, M.P., O.S. and K.V.; software, M.P. and Y.A.; validation, K.V., Y.A. and N.P.; formal analysis, K.V., Y.A. and N.P.; investigation, O.S. and K.V.; resources, K.V. and Y.A.; data curation, O.S., K.V. and Y.A.; writing—original draft preparation, M.P., O.S., K.V., Y.A. and N.P.; writing—review and editing, M.P., O.S. and N.P.; visualization, K.V., Y.A. and N.P.; supervision, M.P. and O.S.; project administration, M.P. and O.S.; funding acquisition, M.P. and O.S. All authors have read and agreed to the published version of the manuscript.
Funding
This research received no external funding.
Institutional Review Board Statement
Not applicable.
Informed Consent Statement
Not applicable.
Data Availability Statement
The original contributions presented in this study are included in the article. Further inquiries can be directed to the corresponding author.
Conflicts of Interest
The authors declare no conflicts of interest.
References
- Ozkan-Ozay, M.; Akin, E.; Aslan, O.; Kosunalp, S.; Iliev, T.; Stoyanov, I.; Beloev, I. A comprehensive survey: Evaluating the efficiency of artificial intelligence and machine learning techniques on cyber security solutions. IEEE Access 2024, 12, 12229–12256. [Google Scholar] [CrossRef] [Scilit]
- Popova, P.; Petrova, M. The role of AI for smart environments based on big data and IoT. In Proceedings of the 2024 5th International Conference on Communications, Information, Electronic and Energy Systems (CIEES), Veliko Tarnovo, Bulgaria, 20–22 November 2024; IEEE: New York, NJ, USA, 2024; pp. 1–8. [Google Scholar] [CrossRef] [Scilit]
- Rahmoune, M.; Alsaggaf, M. Digital marketing for sustainable supply chains: Integrating green strategies into the digital economy. Access Sci. Bus. Innov. Digit. Econ. 2026, 7, 8–20. [Google Scholar] [CrossRef] [Scilit] [PubMed]
- Huynh, Q.L.; Nguyen, V.K. Role of digital marketing in competitive advantage. Access Sci. Bus. Innov. Digit. Econ. 2026, 7, 61–78. [Google Scholar] [CrossRef] [Scilit] [PubMed]
- Werke, S.Z.; Agazu, B.G. A systematic review of social media marketing during and after COVID-19 pandemic. Access Sci. Bus. Innov. Digit. Econ. 2023, 4, 453–467. [Google Scholar] [CrossRef] [Scilit]
- Kazbekova, D.; Petrova, M.; Sushchenko, O.; Belgibayeva, A.; Mitkov, M. Mechanisms of stimulation of small- and medium-sized entrepreneurship: The experience of Kazakhstan. J. Risk Financ. Manag. 2024, 17, 257. [Google Scholar] [CrossRef] [Scilit]
- Aloshyna, T.; Kozenkov, D. Analysis of supply and demand in the labor market of Ukraine: Regional aspect. Access Sci. Bus. Innov. Digit. Econ. 2022, 3, 177–184. [Google Scholar] [CrossRef] [Scilit]
- Likhonosova, G.; Mamanazarov, M.; Adilchaev, R.; Mamanazarov, A. Socio-economic development management: Marketing the use of reserves and potentials. Access Sci. Bus. Innov. Digit. Econ. 2025, 6, 319–335. [Google Scholar] [CrossRef] [Scilit]
- Chornous, G.; Dimitrov, R.; Fareniuk, Y.; Penkova, M.; Nosko, R. Integration of feeling AI tools to support marketing solutions in e-commerce. Access Sci. Bus. Innov. Digit. Econ. 2025, 6, 415–436. [Google Scholar] [CrossRef] [Scilit]
- Petrova, M.; Sushchenko, O.; Pohuda, N.; Vovk, K. International indices and their impact on tourism competitiveness: Analysis in the context of global instability. In Globalization, Global Security, and New International Realities for Modern Democracies; Alaverdov, E., Abuseridze, G., Eds.; IGI Global: Hershey, PA, USA, 2025; Chapter 17; pp. 433–464. ISBN 978-8-337-31356-6. [Google Scholar] [CrossRef] [Scilit]
- Elia, G.; Margherita, A.; Passiante, G. Digital entrepreneurship ecosystem: How digital technologies and collective intelligence are reshaping the entrepreneurial process. Technol. Forecast. Soc. Change 2020, 150, 119791. [Google Scholar] [CrossRef] [Scilit]
- Chen, M.; Sinha, A.; Hu, K.; Shah, M.I. Impact of technological innovation on energy efficiency in Industry 4.0 era: Moderation of shadow economy in sustainable development. Technol. Forecast. Soc. Change 2021, 164, 120521. [Google Scholar] [CrossRef] [Scilit]
- Caruso, L. Digital innovation and the fourth industrial revolution: Epochal social changes? AI Soc. 2018, 33, 379–392. [Google Scholar] [CrossRef] [Scilit]
- Lin, S.; Lin, R.; Sun, J.; Wang, F.; Wu, W. Dynamically evaluating technological innovation efficiency of high-tech industry in China: Provincial, regional and industrial perspective. Socio-Econ. Plan. Sci. 2021, 74, 100939. [Google Scholar] [CrossRef] [Scilit]
- Antonova, D.; Beloeva, S.; Todorova, A. The dual impact of artificial intelligence: Catalyst for innovation or threat to stability. Strateg. Policy Sci. Educ.-Strateg. Na Obraz. I Nauchnata Polit. 2024, 32, 49–58. [Google Scholar] [CrossRef] [Scilit]
- Karunathilake, E.M.; Le, A.T.; Heo, S.; Chung, Y.S.; Mansoor, S. The path to smart farming: Innovations and opportunities in precision agriculture. Agriculture 2023, 13, 1593. [Google Scholar] [CrossRef] [Scilit]
- Beloev, I.; Kinaneva, D.; Georgiev, G.; Hristov, G.; Zahariev, P. Artificial intelligence-driven autonomous robot for precision agriculture. Acta Technol. Agric. 2021, 24, 48–54. [Google Scholar] [CrossRef] [Scilit]
- Georgiev, G.; Beloev, I.; Hristov, G.; Zahariev, P. LoRa network-based system for remote monitoring of agricultural crops. In Proceedings of the 30th National Conference with International Participation, TELECOM 2022; IEEE: New York, NJ, USA. [CrossRef] [Scilit]
- Galanakis, C.M.; Rizou, M.; Aldawoud, T.M.; Ucak, I.; Rowan, N.J. Innovations and technology disruptions in the food sector within the COVID-19 pandemic and post-lockdown era. Trends Food Sci. Technol. 2021, 110, 193–200. [Google Scholar] [CrossRef] [Scilit] [PubMed]
- Tireuov, K.; Mizanbekova, S.; Kalykova, B.; Nurmanbekova, G. Towards food security and sustainable development through enhancing efficiency of grain industry. Entrep. Sustain. Issues 2018, 6, 446–455. [Google Scholar] [CrossRef] [Scilit]
- Akhmedyarov, Y.; Kurmanov, N.; Petrova, M.; Gordeeva, Y. The Kazakhstan dairy enterprises’ problem analysis and innovative potential of an agricultural enterprise. IOP Conf. Ser. Earth Environ. Sci. 2023, 1269, 012037. [Google Scholar] [CrossRef] [Scilit]
- Xiao, R.; Chen, B. Marketing strategy of digital transformation of electricity market in the internet era. In Proceedings of the International Conference on Smart Technologies and Systems for Internet of Things, Singapore; Springer Nature: Singapore, 2021; pp. 271–279. [Google Scholar]
- Khan, M.A.; Máté, D.; Abdulahi, M.E.; Sadaf, R.; Khan, M.A.; Popp, J.; Oláh, J. Do institutional quality, innovation and technologies promote financial market development? Eur. J. Int. Manag. 2024, 22, 484–507. [Google Scholar] [CrossRef] [Scilit]
- Boiko, M.; Bosovska, M.; Vedmid, N.; Melnychenko, S.; Stopchenko, Y. Digitalization: Implementation in the tourism business of Ukraine. Probl. Perspect. Manag. 2022, 20, 24–41. [Google Scholar] [CrossRef] [Scilit]
- Popova, P.; Popov, V.; Marinova, K.; Petrova, M. The role of digital platforms and big data analytics as a base for digital service innovation. In Proceedings of the 2023 4th International Conference on Communications, Information, Electronic and Energy Systems (CIEES), Plovdiv, Bulgaria; IEEE: New York, NJ, USA, 2023; pp. 1–8. [Google Scholar] [CrossRef] [Scilit]
- Petrova, M.; Popova, P.; Popov, V.; Shishmanov, K.; Marinova, K. Potential of big data analytics for managing value creation. In Proceedings of the 2022 International Conference on Communications, Information, Electronic and Energy Systems (CIEES); IEEE: New York, NJ, USA, 2022; pp. 1–6. [Google Scholar] [CrossRef] [Scilit]
- Singh, S.K.; Singh, S.S.; Singh, V.L. Predicting adoption of next generation digital technology utilizing the adoption-diffusion model fit: The case of mobile payments interface in an emerging economy. Access Sci. Bus. Innov. Digit. Econ. 2023, 4, 130–148. [Google Scholar] [CrossRef] [Scilit]
- Popova, P.; Petrova, M.; Popov, V.; Marinova, K.; Sushchenko, O. Potential of the digital ecosystem for the sustainable development of the tourist destination. IOP Conf. Ser. Earth Environ. Sci. 2023, 1126, 012021. [Google Scholar] [CrossRef] [Scilit]
- Pohuda, N. Research of the implementation level of information and communication technologies by tourism enterprises. Econ. Dev. 2023, 22, 8–19. [Google Scholar] [CrossRef] [Scilit]
- Chornous, G.; Fareniuk, Y. Marketing mix modeling for pharmaceutical companies on the basis of data science technologies. Access Sci. Bus. Innov. Digit. Econ. 2021, 2, 274–289. [Google Scholar] [CrossRef] [Scilit] [PubMed]
- Pohuda, N.; Stefanov, T.; Vovk, K.; Sushchenko, O.; Petrova, M. International Environmental Standards in Sustainable Tourism: A Globalized Perspective and Security Challenges. In Globalization, Global Security, and New International Realities for Modern Democracies; Alaverdov, E., Abuseridze, G., Eds.; IGI Global: Hershey, PA, USA, 2025; Volume 18, pp. 465–498. [Google Scholar] [CrossRef] [Scilit]
- Cui, Y.; Tobossi, R.; Vigouroux, O. Modelling customer online behaviours with neural networks: Applications to conversion prediction and advertising retargeting. arXiv 2018, arXiv:1804.07669. [Google Scholar] [CrossRef] [Scilit]
- Chatterjee, S.; Datta, P. Examining inefficiencies and consumer uncertainty in e-commerce. Commun. Assoc. Inf. Syst. 2008, 22, 29. [Google Scholar] [CrossRef] [Scilit]
- Bosovska, M.; Boiko, M.; Bovsh, L.; Okhrimenko, A. Models of the Industrial Revolution 5.0. In Proceedings of the 2022 IEEE 4th International Conference on Modern Electrical and Energy Systems (MEES); IEEE: New York, NJ, USA, 2022; pp. 1–4. [Google Scholar] [CrossRef] [Scilit]
- Moroz, O.; Trunina, I.; Moroz, M.; Zahorianskyi, V.; Vasylkovska, K. Digital marketing communications transformation in wartime. In Proceedings of the 2023 IEEE 5th International Conference on Modern Electrical and Energy Systems (MEES); IEEE: New York, NJ, USA, 2023; pp. 1–6. [Google Scholar] [CrossRef] [Scilit]
- Sushchenko, O.; Kasenkova, K.; Sushchenko, S. Innovative marketing technologies in the development of the tourism specialized types. Bus. Manag. 2022, 3, 5–16. [Google Scholar]
- Vovk, K. Sociological Aspects of Tourism Digitalization. In Directions for the Development of Science in the Context of Global Transformations; Baltic Publishing: Tallinn, Estonia, 2025; pp. 183–217. [Google Scholar] [CrossRef] [Scilit]
- Dorokhova, L.; Kuusik, A.; Dimitrov, R.; Pentus, K.; Dorokhov, O.; Petrova, M. Planning the digital marketing budget: Computer modelling for decision making. Access Sci. Bus. Innov. Digit. Econ. 2023, 4, 248–260. [Google Scholar] [CrossRef] [Scilit]
- Liu, Y.; Laguna, J.; Wright, M.; He, H. Media mix modeling—A Monte Carlo simulation study. J. Mark. Anal. 2014, 2, 173–186. [Google Scholar] [CrossRef] [Scilit]
- Huang, X. Consumer and marketing research using the Monte Carlo simulation. Adv. Econ. Manag. Political Sci. 2023, 32, 35–41. [Google Scholar] [CrossRef] [Scilit]
- Gartner. Gartner Identifies Six Key Steps to Build a Successful Digital Business; Gartner: Stamford, CT, USA, 2014; Available online: https://www.gartner.com/en/newsroom/press-releases/2014-05-21-gartner-identifies-six-key-steps-to-build-a-successful-digital-business (accessed on 1 May 2025).
- McKinsey & Company. Digital Reinvention; McKinsey & Company: New York, NY, USA, 2017; Available online: https://www.mckinsey.com/~/media/mckinsey/business%20functions/mckinsey%20digital/our%20insights/digital%20reinvention/digital%20reinvention.ashx (accessed on 3 May 2024).
- McKinsey & Company. The World of ‘Ands’: Consumers Set the Tone; McKinsey & Company: New York, NY, USA, 2023; Available online: https://www.mckinsey.com (accessed on 1 July 2025).
- Google Analytics. Audience Behavior and Website Performance Data; Google Analytics: Mountain View, CA, USA, 2025; Available online: https://analytics.google.com (accessed on 1 July 2025).
- Google. Google Ads Benchmarks by Industry—Q1 2024; Think with Google: Mountain View, CA, USA, 2024; Available online: https://www.thinkwithgoogle.com (accessed on 11 April 2025).
- Meta Business Tools. Advertising and Remarketing Platform Insights; Meta Business Tools: Menlo Park, CA, USA, 2025; Available online: https://business.facebook.com (accessed on 11 April 2025).
- Statista. Average Conversion Rates in E-Commerce and B2b Sectors Worldwide; Statista: New York, NY, USA, 2023; Available online: https://www.statista.com/markets/413/topic/458/b2b-e-commerce/#statistic1 (accessed on 1 May 2025).
- Statista. Digital Advertising—Worldwide; Statista: New York, NY, USA, 2023; Available online: https://fr.statista.com/outlook/dmo/digital-advertising/worldwide#ad-spending (accessed on 1 May 2025).
- HubSpot. How Much Should You Budget for Marketing in 2023? HubSpot: Cambridge, MA, USA, 2023; Available online: https://medium.com/@InfinitegrowthS/how-much-should-you-budget-for-marketing-in-2023-0f22b4e077cd (accessed on 11 April 2025).
- WordStream by LocaliQ. Google Ads Industry Benchmarks for 2024; WordStream: Waltham, MA, USA, 2024; Available online: https://www.wordstream.com/blog/2024-google-ads-benchmarks (accessed on 1 May 2025).
- Boston Consulting Group (BCG). Transformation; BCG: Boston, MA, USA, 2016; Available online: https://media-publications.bcg.com/transformation-ebook/BCG-Transformation-Nov-2016.pdf (accessed on 1 May 2025).
- Cognizant. How to Win at Digital Transformation; Cognizant: Teaneck, NJ, USA, 2022; Available online: https://www.cognizant.com/us/en/services/digital-strategy (accessed on 1 May 2025).
- Kumar, N. Trends in digital remarketing technologies. J. Digit. Mark. 2023, 12, 45–60. [Google Scholar]
- Similarweb. Website Analytics Report for Service and Manufacturing Sectors; Similarweb: Boston, MA, USA, 2025; Available online: https://www.similarweb.com (accessed on 1 July 2025).
- Todorov, G. 40+ Stunning Retargeting Stats and Trends; THRIVE: Arlington, TX, USA, 2023; Available online: https://thrivemyway.com/retargeting-stats (accessed on 1 May 2025).
- LinkedIn Marketing Solutions. LinkedIn Ads Guide: Budgeting and Bidding Best Practices; LinkedIn Marketing Solutions: Sunnyvale, CA, USA, 2024; Available online: https://business.linkedin.com/marketing-solutions/ads (accessed on 1 July 2025).
- Beloeva, S.; Venelinova, N. Digital Discrimination Risks in the Transformation of Higher Education. Strateg. Policy Sci. Educ.-Strateg. Na Obraz. I Nauchnata Polit. 2024, 32, 98–108. [Google Scholar] [CrossRef] [Scilit]

Disclaimer/Publisher’s Note: The statements, opinions and data contained in all publications are solely those of the individual author(s) and contributor(s) and not of MDPI and/or the editor(s). MDPI and/or the editor(s) disclaim responsibility for any injury to people or property resulting from any ideas, methods, instructions or products referred to in the content. |
© 2026 by the authors. Licensee MDPI, Basel, Switzerland. This article is an open access article distributed under the terms and conditions of the Creative Commons Attribution (CC BY) license.