


Abstract
Africa is a continent experiencing the highest yearly rate of deforestation. As a result, there is debate about the causes and consequences of this phenomenon, as well as on the effectiveness of actions undertaken to address this problem. This study offers insights into economic aspects of deforestation in Africa with regard to the use of econometric and spatial data analysis and the inclusion of determinants not considered by previous research. Special attention is paid to the participation of African countries in UN-REDD (United Nations Collaborative Program on Reducing Emissions from Deforestation and Forest Degradation in Developing Countries) and grouping countries according to the level of their forest cover. We demonstrate a negative relationship between economic activity and forest cover using both econometric modeling and spatial data analysis, and present some moderate arguments in favor of the UN-REDD program and its effectiveness in mitigating deforestation in Africa. Importantly, there are no universal patterns across countries characterized by different levels of forest cover. Therefore, we conclude that advancement of this research area requires new methodological approaches based on big data, machine learning, and artificial intelligence to supplement existing approaches and enhance our understanding of the interplay between forest loss and economic growth.
1. Introduction
Mutual relationships between the natural environment and economic activity are complex and include both virtuous and vicious circles. A primary example of this complexity is the role of forests, which preserve biodiversity, protect the soil, sequester and store carbon, purify the air, regulate the climate, and ensure a stable water supply [1]. Simultaneously, forest products play an important role in the economies of many countries, especially developing ones. About 20% of rural income is derived from forests, and for some countries, they are the only source of income [2]. Many countries, particularly those characterized by dynamic demographic processes, experience a greater demand for arable land and overharvesting. It is estimated that 15 billion trees are cut each year, and since the inception of mankind, the global number of trees has fallen by about 46% [3].
Deforestation is a process of environmental degeneration marked by the reduction in the forest area [4] and associated with numerous dangers. Forests are home to 70% of all land animal and plant species; thus, loss of habitat is one of the most conspicuous consequences [5]. Animals migrate to cities, spreading zoonotic diseases [6]. At the same time, deforestation increases greenhouse gas emissions, contributing to climate change [7]. Finally, forest degradation can be a threat to food security [8].
The process of deforestation is noticeable on every continent of the world, but Africa is the continent experiencing the largest annual rate of net forest loss, equal to 3.9 million hectares per year during 2010–2020 [1]. Over the past decades, the forest cover in the vast majority of African countries has decreased [9]. Only Algeria, Tunisia, Eswatini, and Cabo Verde observed an opposite trend, while the developments of forest cover in Burundi and Rwanda bear signs of forest transition, which means switching from net forest area loss to net gain [1].
Many African countries cooperate under the framework of UN-REDD (United Nations Program on Reducing Emissions from Deforestation and Forest Degradation) and the REDD+ program. REDD and REDD+ are two complementary programs supported by the United Nations. REDD aims to reduce emissions in developing countries by providing economic incentives to prevent deforestation and forest degradation, while REDD+ aims to supplement REDD activities by implementing forest protection, sustainable forest management, and improved forest removal [10]. UN-REDD was established in 2008 and involves 65 countries. It aims to reduce tropical deforestation by promoting sustainable land use, advancing international cooperative approaches to climate mitigation, and mobilizing climate finance. UN-REDD promotes participation in REDD+ processes led by national governments [11]. African countries constitute the largest group involved in these initiatives. However, the implementation of REDD and REDD+ in Africa is associated with greater technological, political, institutional, and socio-economic challenges [12].
The body of literature addressing the issue of deforestation in Africa is extensive, and several classification approaches are possible. Based on studies included in the Web of Science database, we distinguish three main groups of works. The first pertains to geographic and geological aspects. These articles tend to focus on maps and analyze how forest cover changes in selected regions of the world. They usually do not refer to the socio-economic or political situation but rather to biophysical processes [7], land-use dynamics [13], or environmental impacts [14]. The International Monetary Fund [15] points out that poor agricultural practices have a negative impact on forest cover in Sub-Saharan Africa. In turn, deforestation makes it difficult to capture CO2 and adversely affects weather conditions, which puts agricultural land at risk—leading to landslides, desertification, and erosion.
The second group of publications focuses on the socio-economic causes and consequences of deforestation. In Africa, deforestation goes back to pre-colonial times, but between 1500 and 1900, the rainforests were mostly cut in response to the demand for wood by colonial governments [16]. Later, dynamic population growth became the leading cause of deforestation. Ref. [17] highlights increasing demand for farmland and fuelwood, while [18] emphasizes the combined effect of population pressure and common resource exploitation. Many researchers also demonstrate a positive relationship between GDP per capita and deforestation. Increasing economic activity in Africa contributes to an increase in the demand for wood products and subsequent deforestation [19]. Ref. [20] confirms the Environmental Kuznets Curve (EKC) hypothesis, indicating that deforestation initially increases with rising income but declines after reaching a certain threshold level. In turn, Ref. [21] notes that economic growth, driven by oil and mineral revenues in Congo Basin countries, influences deforestation patterns by reducing agricultural pressure, while regions with slower growth experience higher forest loss. Ref. [22] indicates that economic growth negatively affects forests, particularly in countries where agricultural and forest products constitute a large share of total exports and GDP. About two thirds of Africa’s population depends on forest resources, and 90% of the population uses firewood and charcoal as energy sources [23]. Of all the identified factors influencing deforestation, human activities appear to be most responsible for the loss of forest resources.
The third group of studies analyzes both geographic and economic aspects. The authors present results of spatial analysis, but also available secondary data on the population size, GDP per capita, use of wood products, and their exports. For instance, Ref. [21] highlights that sub-Saharan countries with less dense forests and plenty of dry land unsuitable for agriculture experience higher rates of deforestation and points to deforestation around cities and along transport corridors between cities. This resembles later attempts by Ref. [24] who apply high-resolution maps and Bayesian spatial models to predict deforestation hotspots, showing forest edge density and road proximity as key predictors for targeted conservation (however, their research focuses not on African countries, but on the Brazilian Amazon). Finally, Ref. [25] uses Landsat and GIMMS satellite data to map deforestation in East Africa and identify drivers such as population and climate, finding major forest loss near Kilimanjaro and Mau Forest.
This study is closely linked to all three groups mentioned above, as the relationship between forest cover and economic activity is examined from two different perspectives. Moreover, the study supplements the literature concerning forest policy evaluation with regard to UN-REDD. Even though many African countries are involved in UN-REDD programs, there are no unambiguous conclusions regarding their effectiveness in the literature. For instance, Ref. [26] argue that implementation of these programs in Africa is often faced with many obstacles, which means that these programs are implemented slowly or insufficiently. In the same vein, Ref. [27] highlights forest-related conflicts in African countries and points out problems related to poor land ownership arrangements, conflicting interests in agriculture, corruption, and land grabbing.
Most of the existing research about deforestation in Africa is based on data up to 2015, covers selected countries or regions, and is not conclusive with regard to the causes of deforestation or the effectiveness of policy measures undertaken. There are already works extending the period of analysis (e.g., Ref. [28]), but these works typically focus on a sample of countries. Therefore, the aim of this study is twofold: (1) to contribute to the existing literature and inspect the relationship between economic activity and deforestation in Africa as a whole; (2) to assess the effectiveness of the UN-REDD program. We also point to the need to use new methods to analyze the causes of deforestation and evaluate policy effectiveness.
Our empirical goals are realized in two complementary settings. Firstly, we investigate the relationship between economic activity, demographic processes, participation in the UN-REDD program, and forest cover over the period 2000–2020 econometrically, exploiting a rich set of control variables. Secondly, increased data availability also allows us to resort to satellite data showing the relationship between the probability of covering the area with forest, trees, and shrubs (according to Ref. [29]) and the probability of finding built-up areas, which are treated as a proxy for economic activity on a micro scale. Therefore, apart from the scope of analysis, the novelty of the research consists of supplementing traditional econometric methods with GIS methods, as well as including participation in the UN-REDD program and introducing shocks that have not been analyzed so far (such as floods or the outbreak of the COVID-19 pandemic). In addition, the study considers heterogeneity of the continent, and, in addition to analyzing the whole sample, it clusters African countries into four groups based on their average degree of forest cover level.
The remainder of the paper is structured as follows. Section 2 introduces data and methods applied in empirical research. Section 3 presents the results of econometric investigations and spatial data analysis. Section 4 presents a short discussion concerning the obtained results, limitations of the study, and the potential to use new research methods based on big data, machine learning, and artificial intelligence. The final section concludes.
2. Data and Methods
In econometric modeling of the relationship between economic activity and forest cover, we build on the literature reviewed in the previous section to examine how selected factors contribute to deforestation. In particular, apart from the share of forest cover in total country area and its change, we take into account variables associated with economic activity (logarithm of GDP per capita, the rate of economic growth, and variables associated with the structure of GDP), demographic situation (logarithm of population, population density, changes in urban and rural population, and share of urban population in total population), participation in UN-REDD and several control variables, such as the floods that took place in many African countries between 2009 and 2010 (see Table 1).
Table 1.
Descriptive statistics of variables employed in econometric analysis.
The conducted analysis is confined to the period of 2000–2020. The outbreak of the COVID-19 pandemic has brought forest protection to a new meaning, as it has been proven that deforestation contributes to an increased risk of pandemic zoonoses [30]. Over the first weeks following the implementation of confinement measures to reduce the spread of COVID-19 disease, deforestation increased by 63% in America and Asia-Pacific, and by as much as 136% in Africa [30]. This justifies the introduction of a binary variable COVID-19 for the year 2020.
In the macroeconomic analysis, the study resorts to static panel models with fixed effects (FE). In order to facilitate comparisons with research conducted by others, we present results for two dependent variables: the absolute value of forest cover and its annual changes (despite the problems of autocorrelation concerning the former).
where refers to forest cover or forest cover change in country i in year t, is the vector of independent variables (related to economic activity, demographic situation, UN-REDD participation, and control variables), is a set of unobservable characteristics for each country, and is the error term. Regressions are run for the whole sample and four groups of countries clustered on the basis of the average value of their forest cover throughout the analyzed period (see Table 2). Estimations run for the first group can be treated as a robustness check, since weaker relationships are expected in their case.
Table 2.
Groups of countries by average forest cover level.
In the spatial data analysis, the changes in forest cover on the African continent between 2015 and 2019 are illustrated using Copernicus Global Land Service data [29] and vector data from the IGAD Climate Prediction and Applications Center [31]. The raw data shared as a grid (EPSG: 4326) with the ellipsoid WGS 1984 (terrestrial radius = 6378 km) and a pixel resolution of 100 m × 100 m are trimmed in QGIS 3.18.3 to the limits of the continent’s reach.
The goal of the analysis is to show the relationship between the forest cover (Tree-CoverFraction) and the economic activity (BuiltUp-CoverFraction) expressed by the correlation coefficient calculated on the basis of a 1 ha square analytical grid. This approach is difficult to implement, not only due to the size of the maps (each raster contained over 7.6 billion points), but also because of the lack of data proxying economic activity at this scale.
Maps representing the state of economic activity can be approximated using statistical data subject to interpolation; however, this raises a problem of determining a country’s centroid and selecting an appropriate interpolation method (which leads to the accumulation of errors). The second approach is to use substitutes such as maps that are positively and strongly correlated with indicators of economic activity. Ultimately, a map presenting areas classified as built-up was selected, giving them priority over lighting maps for substantial reasons (night lighting is not always an indicator of prosperity, as it may arise both from necessity and aesthetic or fashion-related choices) and technical reasons (different methodologies of creating maps may affect the results). On the other hand, built-up maps are directly related both to the location of a country’s population and the production of goods and services.
Finally, Pearson correlation coefficients are calculated in the quasi-natural course of the regional boundaries, based on data for 6226 spatial units. For calculation purposes, the original data (Tree-CoverFraction and BuiltUp-CoverFraction maps) are averaged in the system of vector boundaries of spatial units.
3. Results
3.1. Determinants of Forest Cover and Its Change: Econometric Perspective
Main results of the econometric analysis pertaining to the determinants of forest cover conducted at the country level are presented in Appendix A in Table A1 and Table A2, which show the determinants of forest cover and its change, respectively (as already noted, the results in Table A1 are less reliable due to autocorrelation).
Table A1 identifies demographic pressure as a primary driver of deforestation, with the log of population and changes in urban population showing significant negative coefficients across the total sample and specific subgroups. Interestingly, population density is associated with higher forest cover in very low-cover areas (group 1) and significantly lower in medium- and high-cover countries (groups 3 and 4). GDP growth rates negatively affect forest cover in Africa as a whole and in medium-forested countries (group 3). Moreover, the share of forest rents and industry in GDP correlates with lower forest cover, especially in countries with limited existing forest resources, while in high-cover countries, it is the share of agriculture, forestry, and fishing in GDP that exerts a more pronounced, negative impact on a country’s forest cover.
Table A2 demonstrates that GDP per capita is significantly associated with negative annual changes in forest cover, particularly in countries with very low (group 1) or medium (group 3) forest cover, while in countries characterized by a low level of forest cover (group 2), this relationship is positive. The UN-REDD participation consistently yields positive coefficients across all models, achieving statistical significance in group 2, which provides some moderate support for the program’s role in slowing the pace of deforestation. Furthermore, income inequality (Gini coefficient) and rural population changes further strain forest dynamics in low-cover countries (group 2), whereas Net Official Development Assistance (ODA) shows a significant positive impact on forest cover change in the total sample, suggesting that international aid may support conservation efforts. Interestingly, the share of agricultural land showed a positive relationship with forest change in high-cover countries (group 4), but a negative one in the case of low-cover countries (group 2), suggesting different land-use dynamics in those regions compared to the rest of the continent.
The obtained results do not exclude the situation in which the higher standard of living proxied by the GDP per capita will increase domestic demand for environmental goods (including forests). Nevertheless, the analyzed countries seem not to have reached such a turning point. In addition, the situation is further complicated by existing income inequalities. Demand for environmental goods by the richer strata may coexist with demand for forest products by poorer strata. Interestingly, in countries with low levels of forest cover (group 2), inequality has a negative impact on forest cover change (Table A2), while in the case of other countries, the relationship is positive but not statistically significant.
Exogenous shocks such as floods or the outbreak of the COVID-19 pandemic, on average, had a negative (albeit often not statistically significant) effect on the forest cover and its change.
Finally, analyzing the R-squared values presented in Table A1 and Table A2, one can see that the model’s explanatory power is significantly higher for specific groups than for the continent as a whole. Higher R-squared values for regressions run for specific groups confirm that the clustering approach is successful, as it allows for capturing more homogeneous groups, where independent variables (such as GDP per capita, GDP growth rate, and UN-REDD participation) possess much higher predictive power. As expected, R-squared values are also higher for high-cover countries (group 4) compared to countries characterized by a very low forest cover (group 1).
The primary reason for the lower R-squared values in the total sample is the significant heterogeneity of the African continent. As presented above, some determinants act in contradictory ways across different groups, which weakens the aggregate model. One can infer that lower R-squared values for the total sample reflect the complexity of the relationship between forest cover and economic activity at a continental scale. This implies that a “one-size-fits-all” forest policy is likely to be ineffective, as the drivers of deforestation are highly dependent on a country’s specificity.
3.2. Relationship Between the Forest Cover and the Economic Activity: Spatial Data Analysis
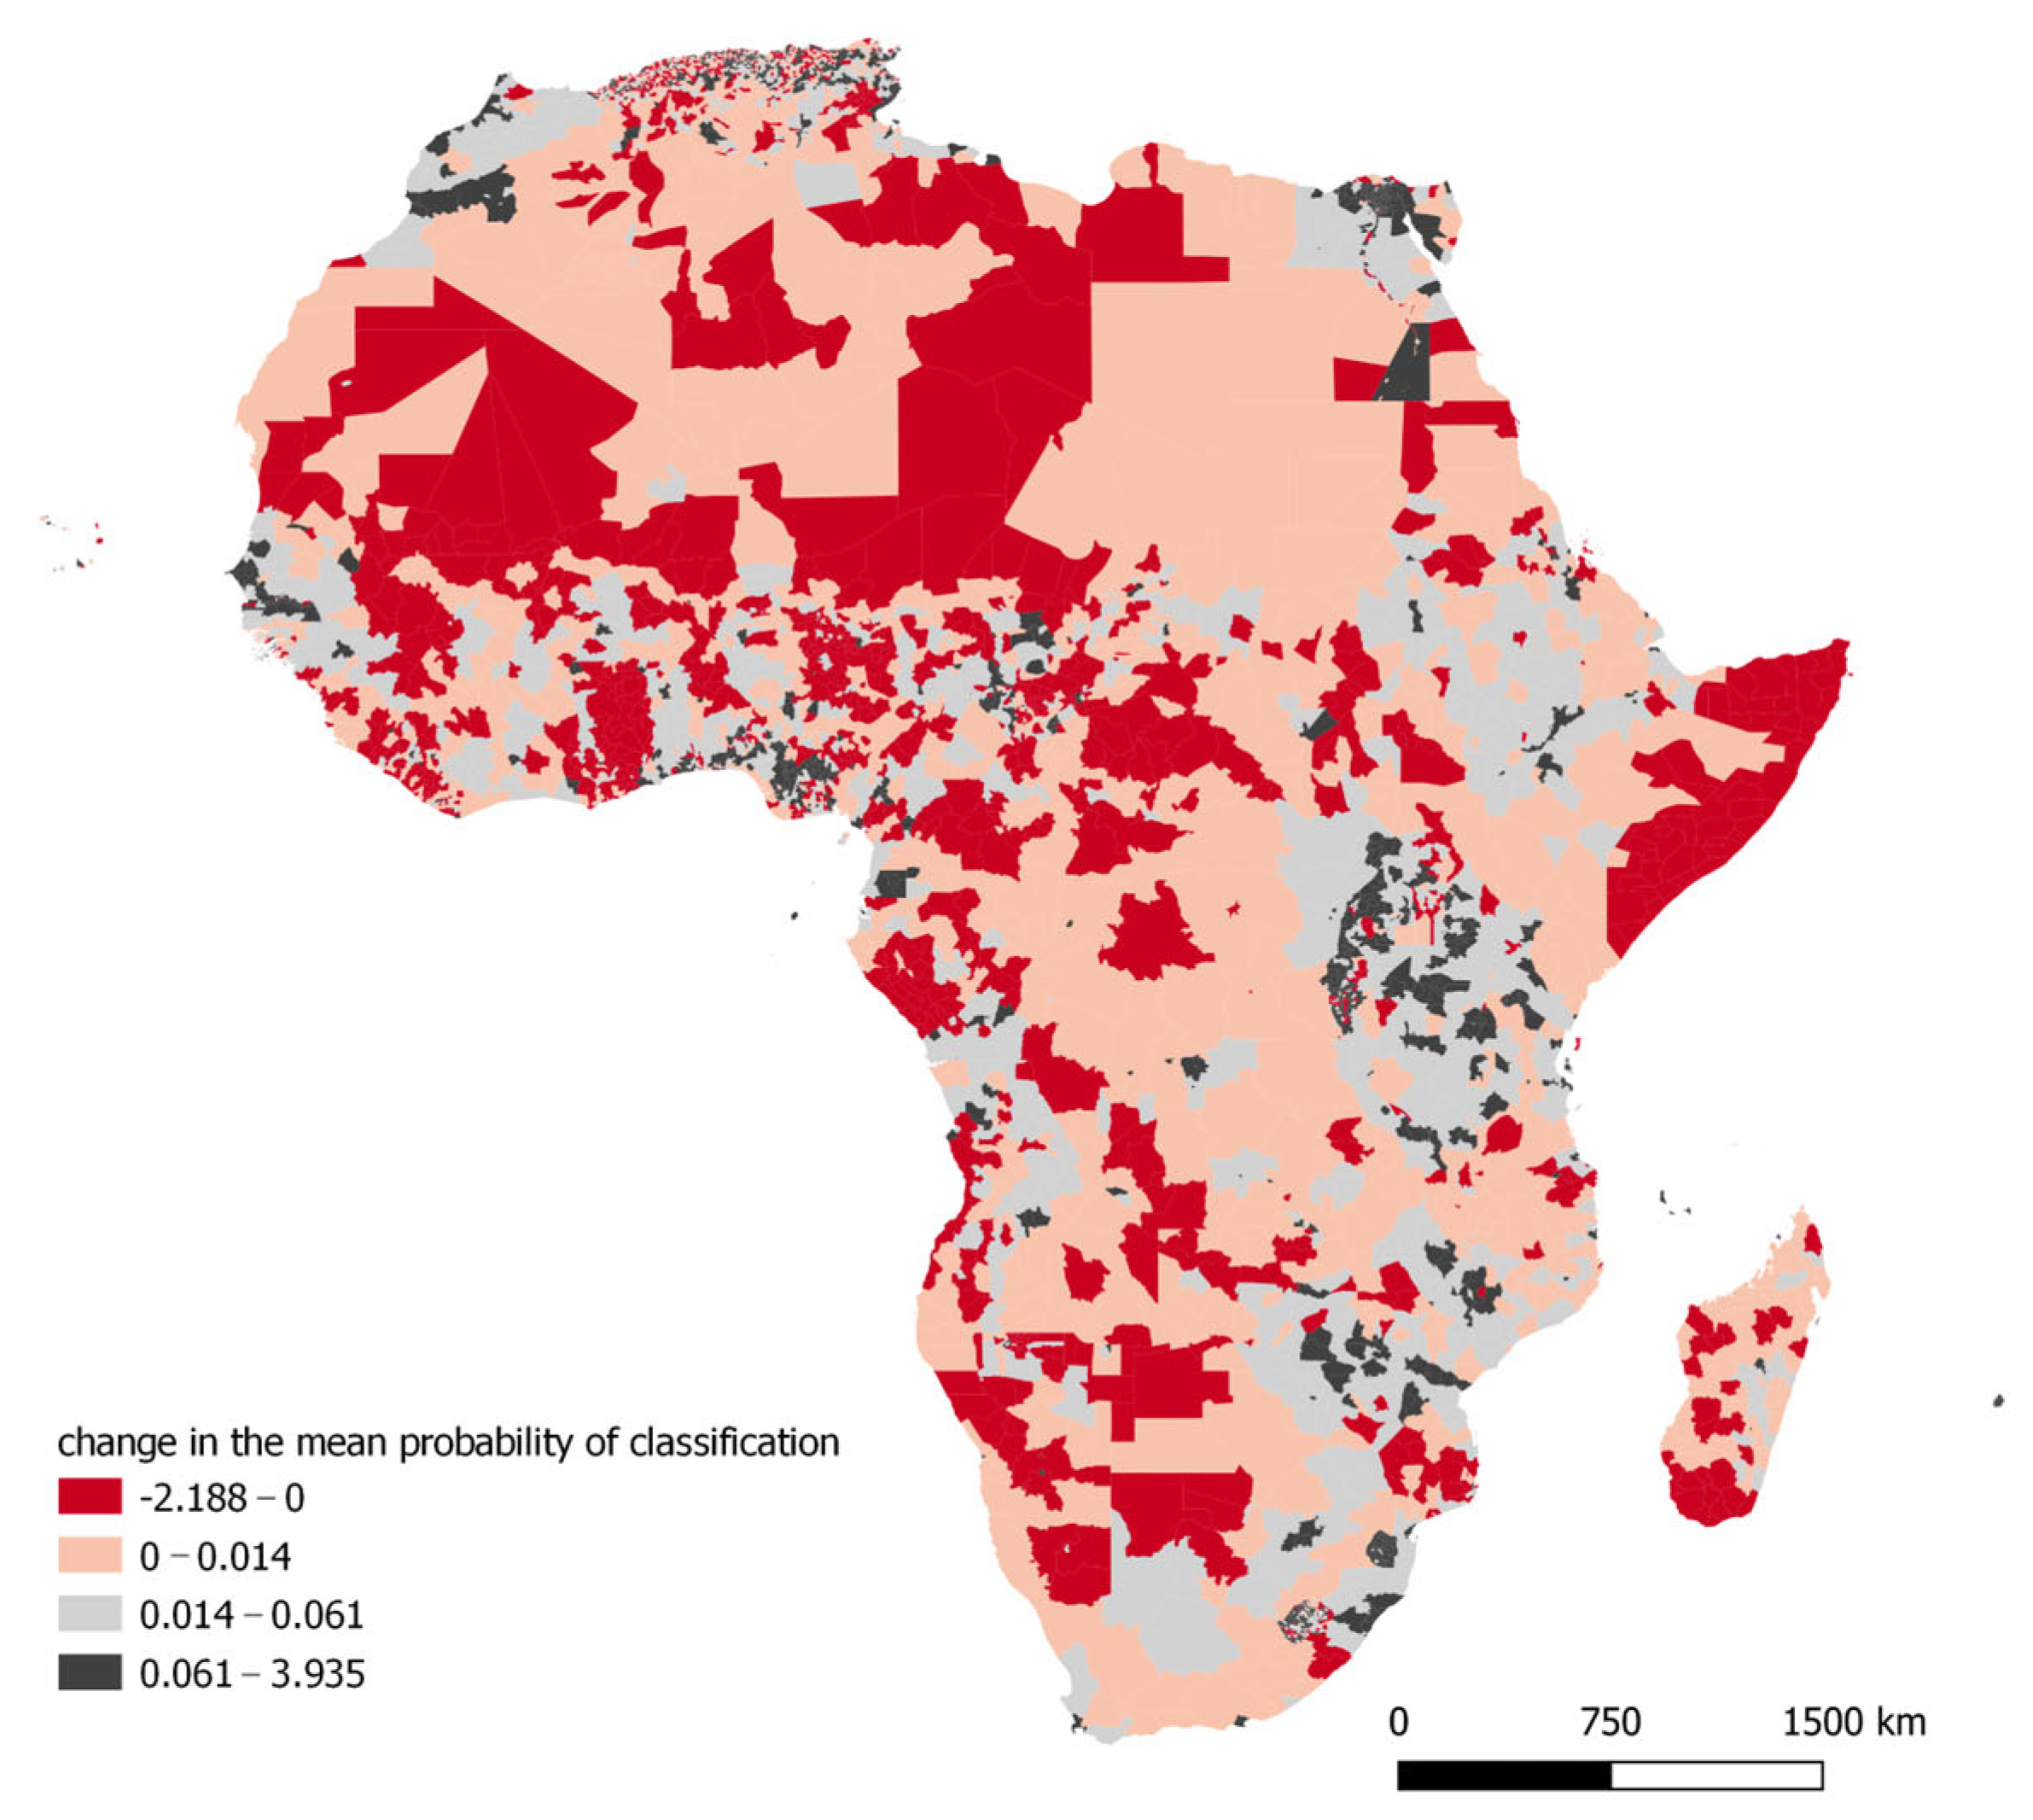
Our maps are presented in Appendix B. Figure A1 and Figure A2 present the mean classification probability of the area as tree cover in 2015 and 2019, respectively. Figure A3 and Figure A4 focus on the probabilities for built-up areas, while Figure A5 and Figure A6 illustrate changes in calculated probabilities over the analyzed period. Data visualization was performed using the natural breaks (Jenks) classification.
The central-western part of the continent (equatorial forests) exhibits the highest average probability of being classified as a forest cover in the space of individual administrative units, and this probability diminishes with distance from this part. The decline, however, is not the same—the more rapid decline of forest cover to the North and East is noticeable. The average probability of forest cover occurrence has increased locally in more regions (areas in Angola and Zambia). Additionally, there is a rather high probability (over 67.1%) that forests will exist in Liberia, Côte d’Ivoire, or along Madagascar’s eastern coast. Despite this, a sizable portion of Africa is devoid of forest cover (virtually all the North, with the exception of a few small coastal regions), and a big portion of southwestern Africa is a desert. The situation has not altered dramatically between 2015 and 2019, although an increase in the average probability of classifying a pixel as forest cover has been observed on the scale of the continent, which can be recognized, among others, by the cut-off values for the classes presented in Figure A1 and Figure A2. At the same time, areas with a greater average probability of classifying pixels as forest areas are declining.
A high probability of classifying an area as built-up is much more concentrated, especially in capital areas (e.g., Accra in Ghana, Lome in Togo, Pretoria in South Africa, or Khartoum in Sudan) or in areas rich in water (e.g., the Nile Valley and Delta). What is also worth noting is the relatively heavily built-up area between Cameroon and Mali and a slightly less built-up strip along the great African lakes, from South Sudan to Zimbabwe. In contrast to forest areas, the average probability of classifying an area as a built-up area declines in the quartile system, as evidenced by the lower initial values of the middle ranges of values shown in Figure A3 and Figure A4.
Quartiles presenting changes in the average level of qualifying an area to be classified as forest show that the greatest changes in this aspect occurred in the subtropical belt between the Chad Basin and the Congo Basin, as well as in large areas between Southern Africa, apart from the southwestern part of the Kalahari Basin. However, these changes are not uniform. Relatively large areas to the south and northeast of the Congo Basin experienced a rise in probability (on a scale of 1.83 to 17.02%), whereas big areas to the north and southeast of this basin have a fall in the average probability level (from 0.23 to 21.53%). In the coastal strip between Nigeria and Cameroon, as well as between Uganda and Tanzania, the probability of classifying a pixel as a forest cover has decreased (see Figure A5).
Changes in the cover classified as built-up areas are not as pronounced in the case of forest cover. Over the years 2015–2019, the greatest changes in the probability of classification were observed in the belt between Egypt and Lesotho: the area located directly next to Cairo, the Aswan area, then a large area between Kampala in Uganda, Lilongwe and Blantyre in Malawi, the area between Lusaka in Zambia and Harare in Zimbabwe, Pretoria and Johannesburg in South Africa. The Gulf of Guinea belt, the area between Dakar in Senegal and Bissau in Guinea-Bissau, and the area around Marrakech in Morocco are the last areas of reasonably vigorous urban growth (see Figure A6).
In order to offer a synthetic overview of these results, Table 3 and Table 4 present correlation coefficients calculated for the mean probability of classification of an area as built-up and the mean probability of classification of an area as tree-covered for African countries clustered in five geographical regions (Table 3) and in four groups introduced earlier in Table 2 (Table 4).
Table 3.
Correlation coefficients between the mean probability of classification of an area as built-up and the mean probability of classification of an area as tree-covered: geographical regions.
Table 4.
Correlation coefficients between the mean probability of classification of an area as built-up and the mean probability of classification of an area as tree-covered: UN-REDD participating and non-participating countries.
Table 3 clearly demonstrates a negative correlation between the average probabilities of classifying a pixel as a forest or built-up area, which is consistent with expectations. At the same time, however, the scale of correlation varies spatially, ranging from −0.059 in Southern Africa to −0.247 in Eastern Africa. It is noteworthy that in absolute terms, these values grew in 2019 and ranged between −0.081 and −0.258. This indicates that positive changes in economic development in the East of the continent occur more frequently at the expense of forest loss than in other parts of Africa. The relatively rapid deforestation process due to industrialization also covers locations situated north of the Sahara Desert. Acceleration of deforestation processes occurs in West Africa as well; however, these regions experience both an increase in forest cover and its loss, so the assessment cannot be straightforward. This fact is also influenced by demographic processes, which force specific land use patterns. For instance, Nigeria’s more densely inhabited areas have a greater impact on the loss of tree cover than Burkina Faso’s relatively less populated areas.
Table 4 includes a similar comparison for the UN-REDD participating and non-participating countries.
In the case of the data presented in Table 4, the Pearson correlation coefficients are also negative for every group of countries. In line with simple intuition and regression results, the correlation is the weakest for countries with scarce forest cover (group 1) and more pronounced for countries with more extensive forest cover. Interestingly, the correlation was stronger for UN-REDD participating countries.
To recapitulate, both dimensions of our analysis confirm a negative impact of economic activity and increased urban population on forest cover. We conclude that there are no universal patterns across the continent with regard to the relationship between economic activity and deforestation. Throughout the analyzed period, countries participating in UN-REDD experienced higher gains or smaller losses in the forest cover compared to non-participating countries. As already mentioned, the coefficient of the UN-REDD dummy variable in regressions depicting changes in forest cover bears a positive sign and is statistically significant in the case of one group of countries (group 2).
4. Discussion
4.1. Drivers of Deforestation in Africa: Economic, Spatial, and Institutional Dimensions
The prevailing pace of deforestation in Africa, combined with population growth projections, indicates a challenging outlook for forest conservation on this continent. Our findings are consistent with previous studies highlighting the role of economic growth in accelerating deforestation [19,20,21]. Similarly, agriculture is confirmed to be among the primary drivers of forest conversion, consistent with earlier evidence for Africa and global patterns [19,21,32,33]. These results correspond with global assessments showing that cropland expansion accounts for most tropical deforestation [34].
Spatial data analysis reveals an inverse correlation between built-up areas (used as a proxy for economic activity) and forest cover, which supports the hypothesis that urbanization and infrastructure development exert additional pressure on forest ecosystems. This relationship varies across regions, reflecting governance and enforcement differences [35].
Participation in the UN-REDD program is associated with positive outcomes in some countries, although its overall effectiveness remains mixed. This observation aligns with global evaluations emphasizing that institutional capacity and sustained funding are critical for success [36]. Recent research also underscores the importance of benefit-sharing mechanisms and integration with national development strategies [37].
4.2. Methodological Limitations and Future Directions
The conducted analysis shows two distinct dimensions of the same complex relationship between economic activity and deforestation in Africa. There are no universal patterns across the continent, and the heterogeneity of results pertaining to selected groups of countries brings about questions concerning appropriate methods of collecting data and their analysis.
There are several limitations to our analysis. Key issues of using fixed effects panel regressions include the reliance on strict exogeneity, the inability to estimate time-invariant factors, and sensitivity to serial correlation [38]. In the case of spatial data analysis, this issue corresponds to the way in which map visualizations are generated on the basis of satellite data and, subsequently, presented at a given resolution. The clustering methods currently applied to similar objects may lead to the misclassification of raster map pixels into specific categories, and, moreover, the resolution of the raster (the size of a pixel in relation to actual space) is of considerable importance. As a consequence, the maps used in this study do not display afforestation belts narrower than 100 m, which may in fact be relatively numerous [39]. To minimize the effects of these shortcomings, maps presenting the probability of forest or built-up land cover were deliberately selected instead of unequivocal land-cover categories. Nevertheless, the results presented would be more accurate if maps of higher resolution were employed or if vector data representing land-cover maps included in topographic datasets were analyzed. This approach constitutes a promising direction for future research.
In addition, we believe that the relationships analyzed in this study call for new methodological approaches based on big data (not only satellite data), machine learning, and artificial intelligence to supplement existing approaches. These new tools could enhance our understanding of the deforestation–economic activity nexus on the macro and micro scale, as well as facilitate the development of more adequate frameworks relevant for policy evaluation. Importantly, they allow us to integrate the macro and micro dimensions and to see forests for the trees in line with the title of our study. Machine learning algorithms (e.g., random forests or gradient boosting) are likely to improve the accuracy of analysis over traditional GIS methods when handling the high-dimensional and heterogeneous data from satellites, sensors, and econometric models. These approaches enable researchers to predict which areas represent a high risk of deforestation by identifying non-linear relationships between economic variables and land use or forest cover change, as well as to assess forest density and identify illegal logging from high-resolution satellite imagery. In fact, machine learning is already transforming forest management by enabling more accurate and efficient monitoring and decision-making across forest ecosystems [40]. Some approaches (e.g., graph neural networks with transformers) are particularly well-suited to modeling deforestation as a spatial and dynamic phenomenon and linking it to local economic activity [41]. Taken together, these methods are likely to bring about data-driven forest governance with earlier intervention and more effective conservation outcomes.
5. Conclusions
This study focuses on the negative relationship between economic activity and forest cover in Africa, supported by econometric modeling and spatial data analysis. In many countries, higher GDP per capita, faster economic growth, and a larger share of agriculture or industry in GDP correlate with forest loss. While UN-REDD participation shows some promise in mitigating deforestation, its effectiveness requires deeper investigation. Policy implications are clear: African governments should adopt integrated land-use planning that balances agricultural expansion with forest conservation. Introducing payment for ecosystem services, promoting climate-smart agriculture, and strengthening tenure security can reduce incentives for uncontrolled deforestation. Governments are expected to engage in reforestation parallel to deforestation [42], regulate the global logging industry, establish and maintain protected forest areas, and offer pro-environmental education. Ref. [43] also shows that more democratic institutions help to reduce deforestation. International mechanisms, such as UN-REDD, should be complemented by domestic governance reforms, including transparent monitoring systems and participatory decision-making. Regional cooperation is essential to address cross-border spillovers and harmonize forest protection standards.
Future research could examine both short-run and long-run implications of the outbreak of the COVID-19 pandemic on the forest cover in Africa. For instance, according to the recent reports from the World Resource Institute [44], the highest forest loss from 2020 to 2021 in Africa was noticed in the Democratic Republic of the Congo (499,059 hectares). An important extension would be to incorporate UN-REDD participation into such analyses. From a methodological perspective, future studies could exploit multilevel modeling approaches that combine the analysis of the macro- and micro-level data. Additionally, methods drawing on big data, machine learning, and AI-based approaches offer promising avenues for advancing research on the complexity of the process of deforestation and its causes. Future research could also benefit from conducting in-depth case study analyses that involve local experts, as their contextual knowledge may deepen interpretation of the findings (which is particularly important for AI-based approaches) and contribute to more nuanced, region-specific policy recommendations.
Author Contributions
Conceptualization, M.B., P.G. and J.W.; methodology, M.B., P.G. and J.W.; formal analysis, P.G. and J.W.; resources, M.B. and P.G.; writing—original draft preparation, M.B., P.G. and J.W.; writing—review and editing, M.B., P.G. and J.W. All authors have read and agreed to the published version of the manuscript.
Funding
This research received no external funding.
Institutional Review Board Statement
Not applicable.
Informed Consent Statement
Not applicable.
Data Availability Statement
This study uses publicly available data from FAO, UNCTAD, UNFCCC, UNOCHA, WHO, World Bank, World Inequality Database, Copernicus Global Land Service data, and IGAD Climate Prediction and Applications Centrer.
Acknowledgments
M.B. is grateful to the participants of the IARIW-TNBS Conference on Measuring Income, Wealth, and Well-being in Africa (Arusha, 11–13 November 2022) for their valuable comments and discussions.
Conflicts of Interest
The authors declare no conflicts of interest.
Abbreviations
The following abbreviations are used in this manuscript:
| GDP | Gross Domestic Product |
| GDPpc | Gross Domestic Product per capita |
| UN-REDD | United Nations Collaborative Program on Reducing Emissions from Deforestation and Forest Degradation in Developing Countries |
Appendix A
Table A1.
Dependent variable: forest cover (share of total area). FE regressions.
Table A2.
Dependent variable: forest cover change. FE regressions.
Appendix B
Figure A1.
Tree cover fraction in 2015 (mean of classification probability). Source: Authors’ elaboration based on Copernicus Global Land Service data.
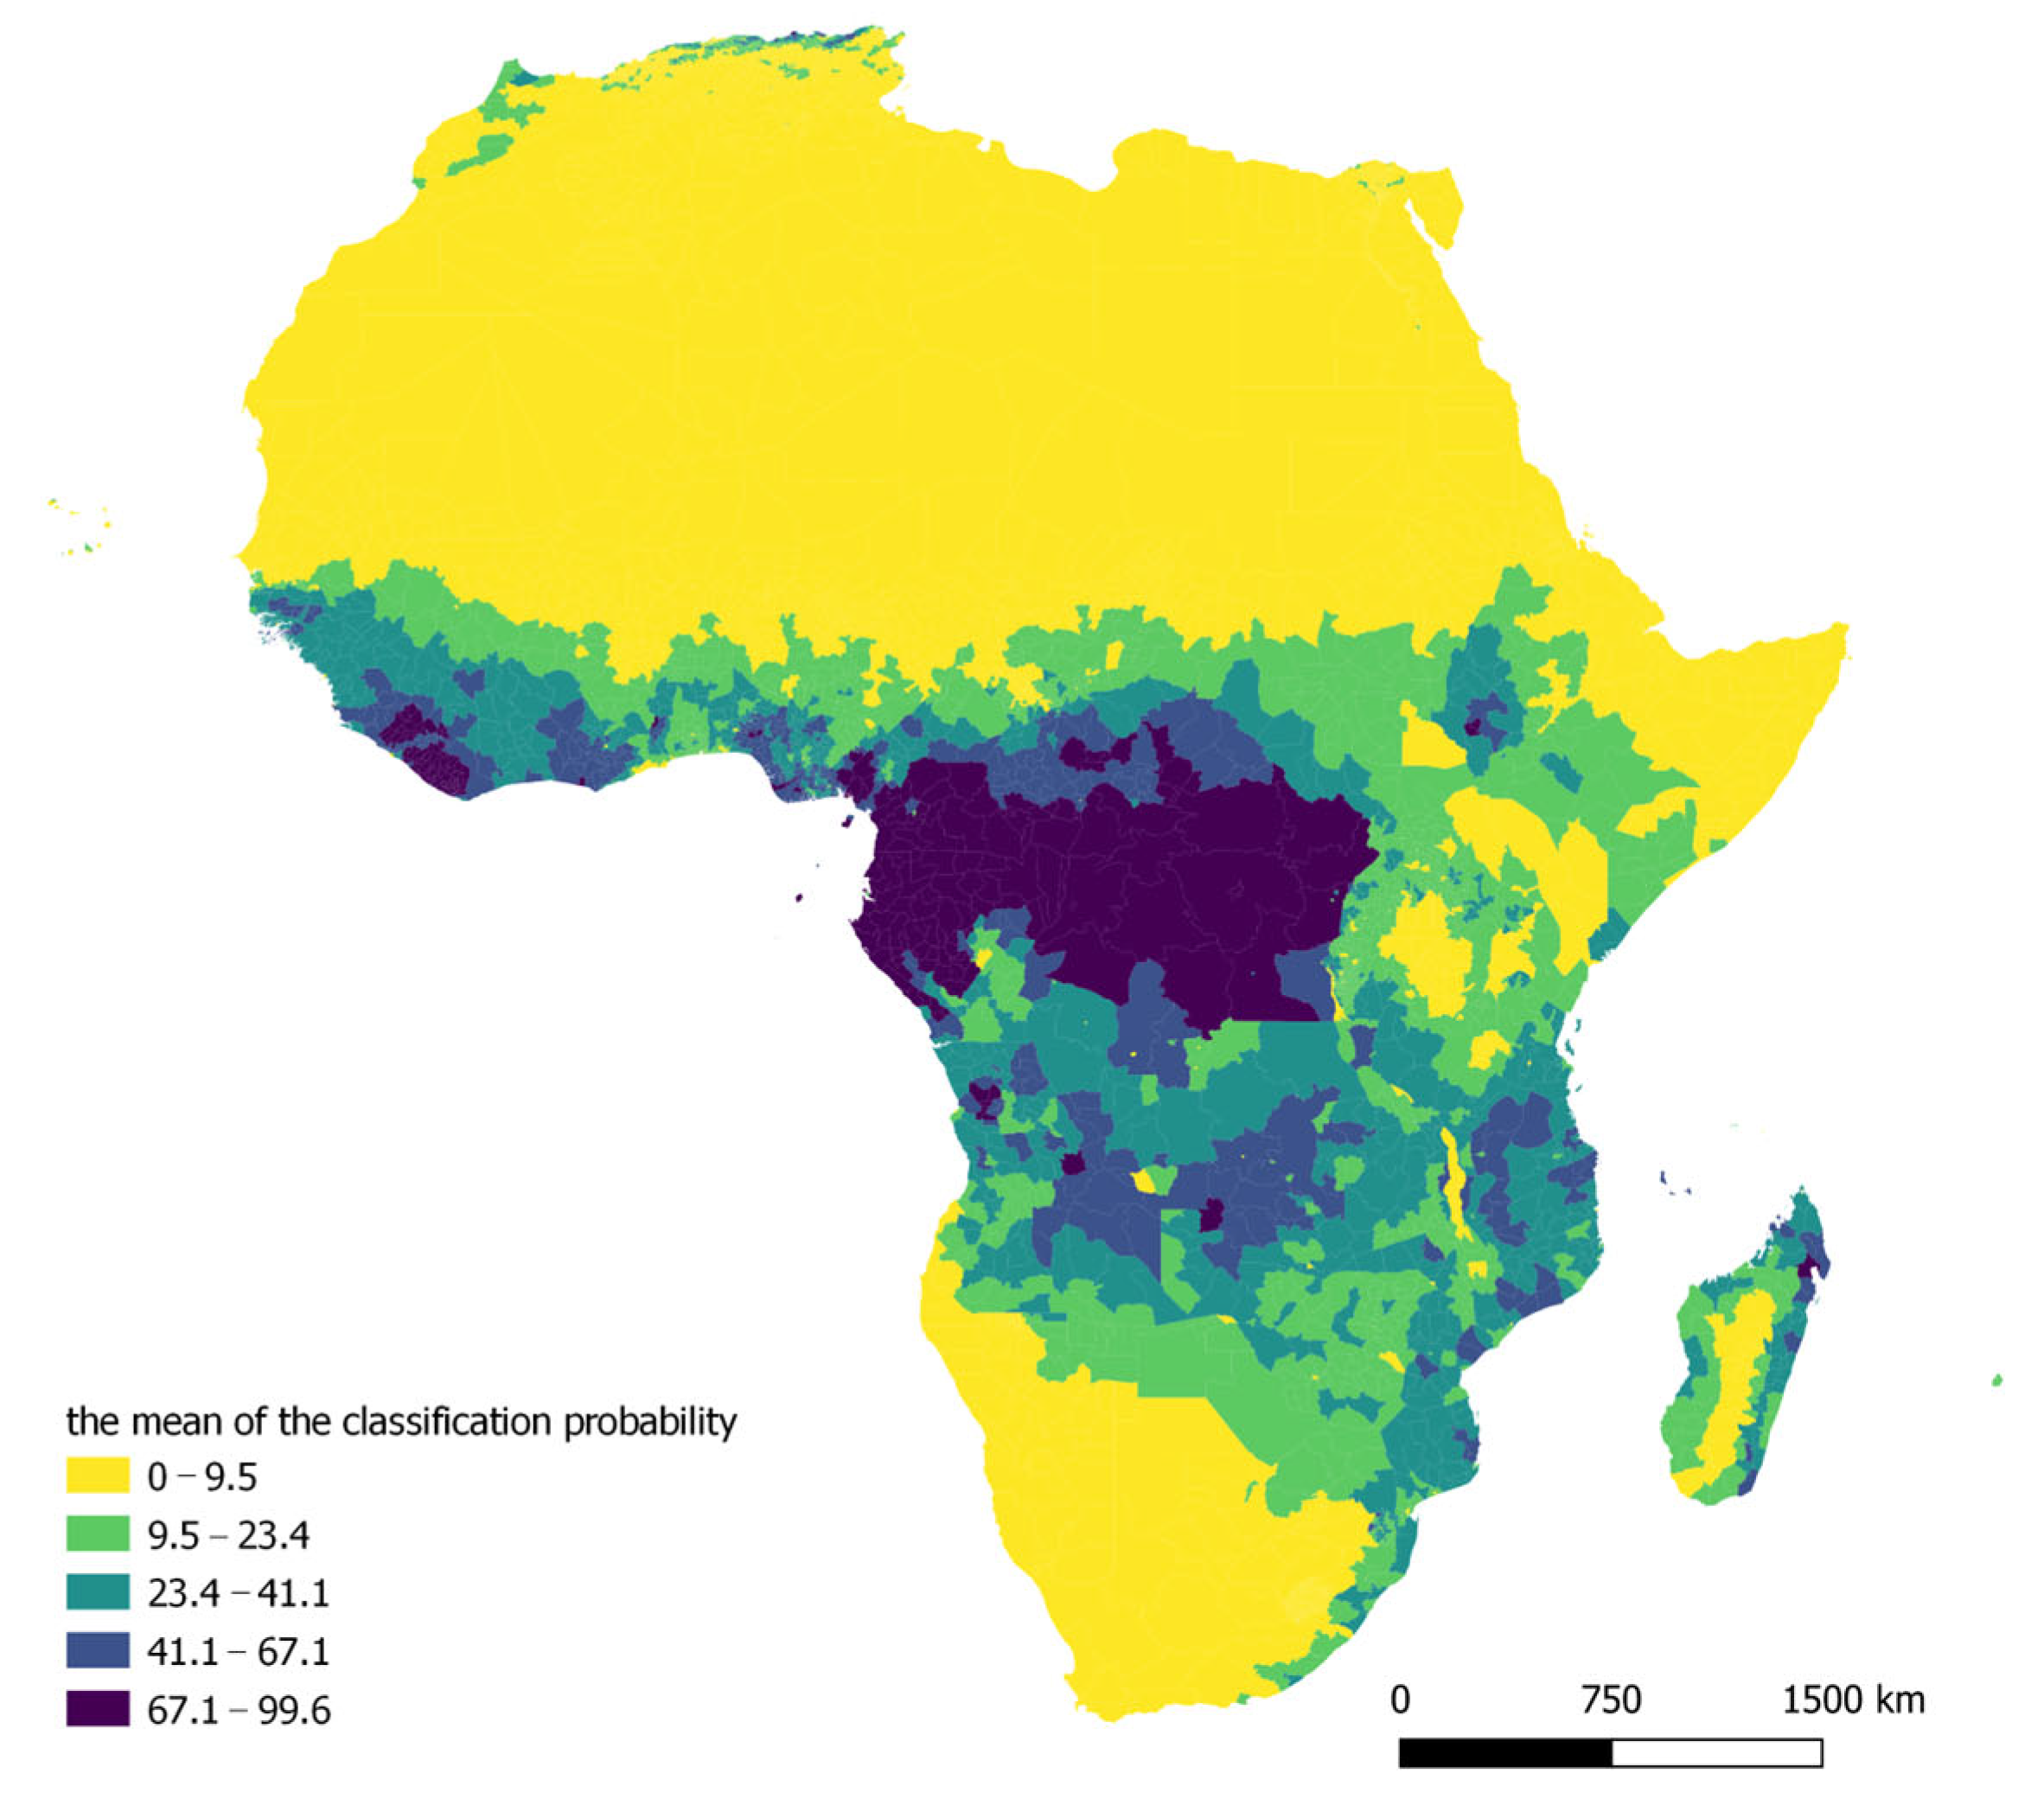
Figure A2.
Tree cover fraction in 2019 (mean of classification probability). Source: Authors’ elaboration based on Copernicus Global Land Service data.
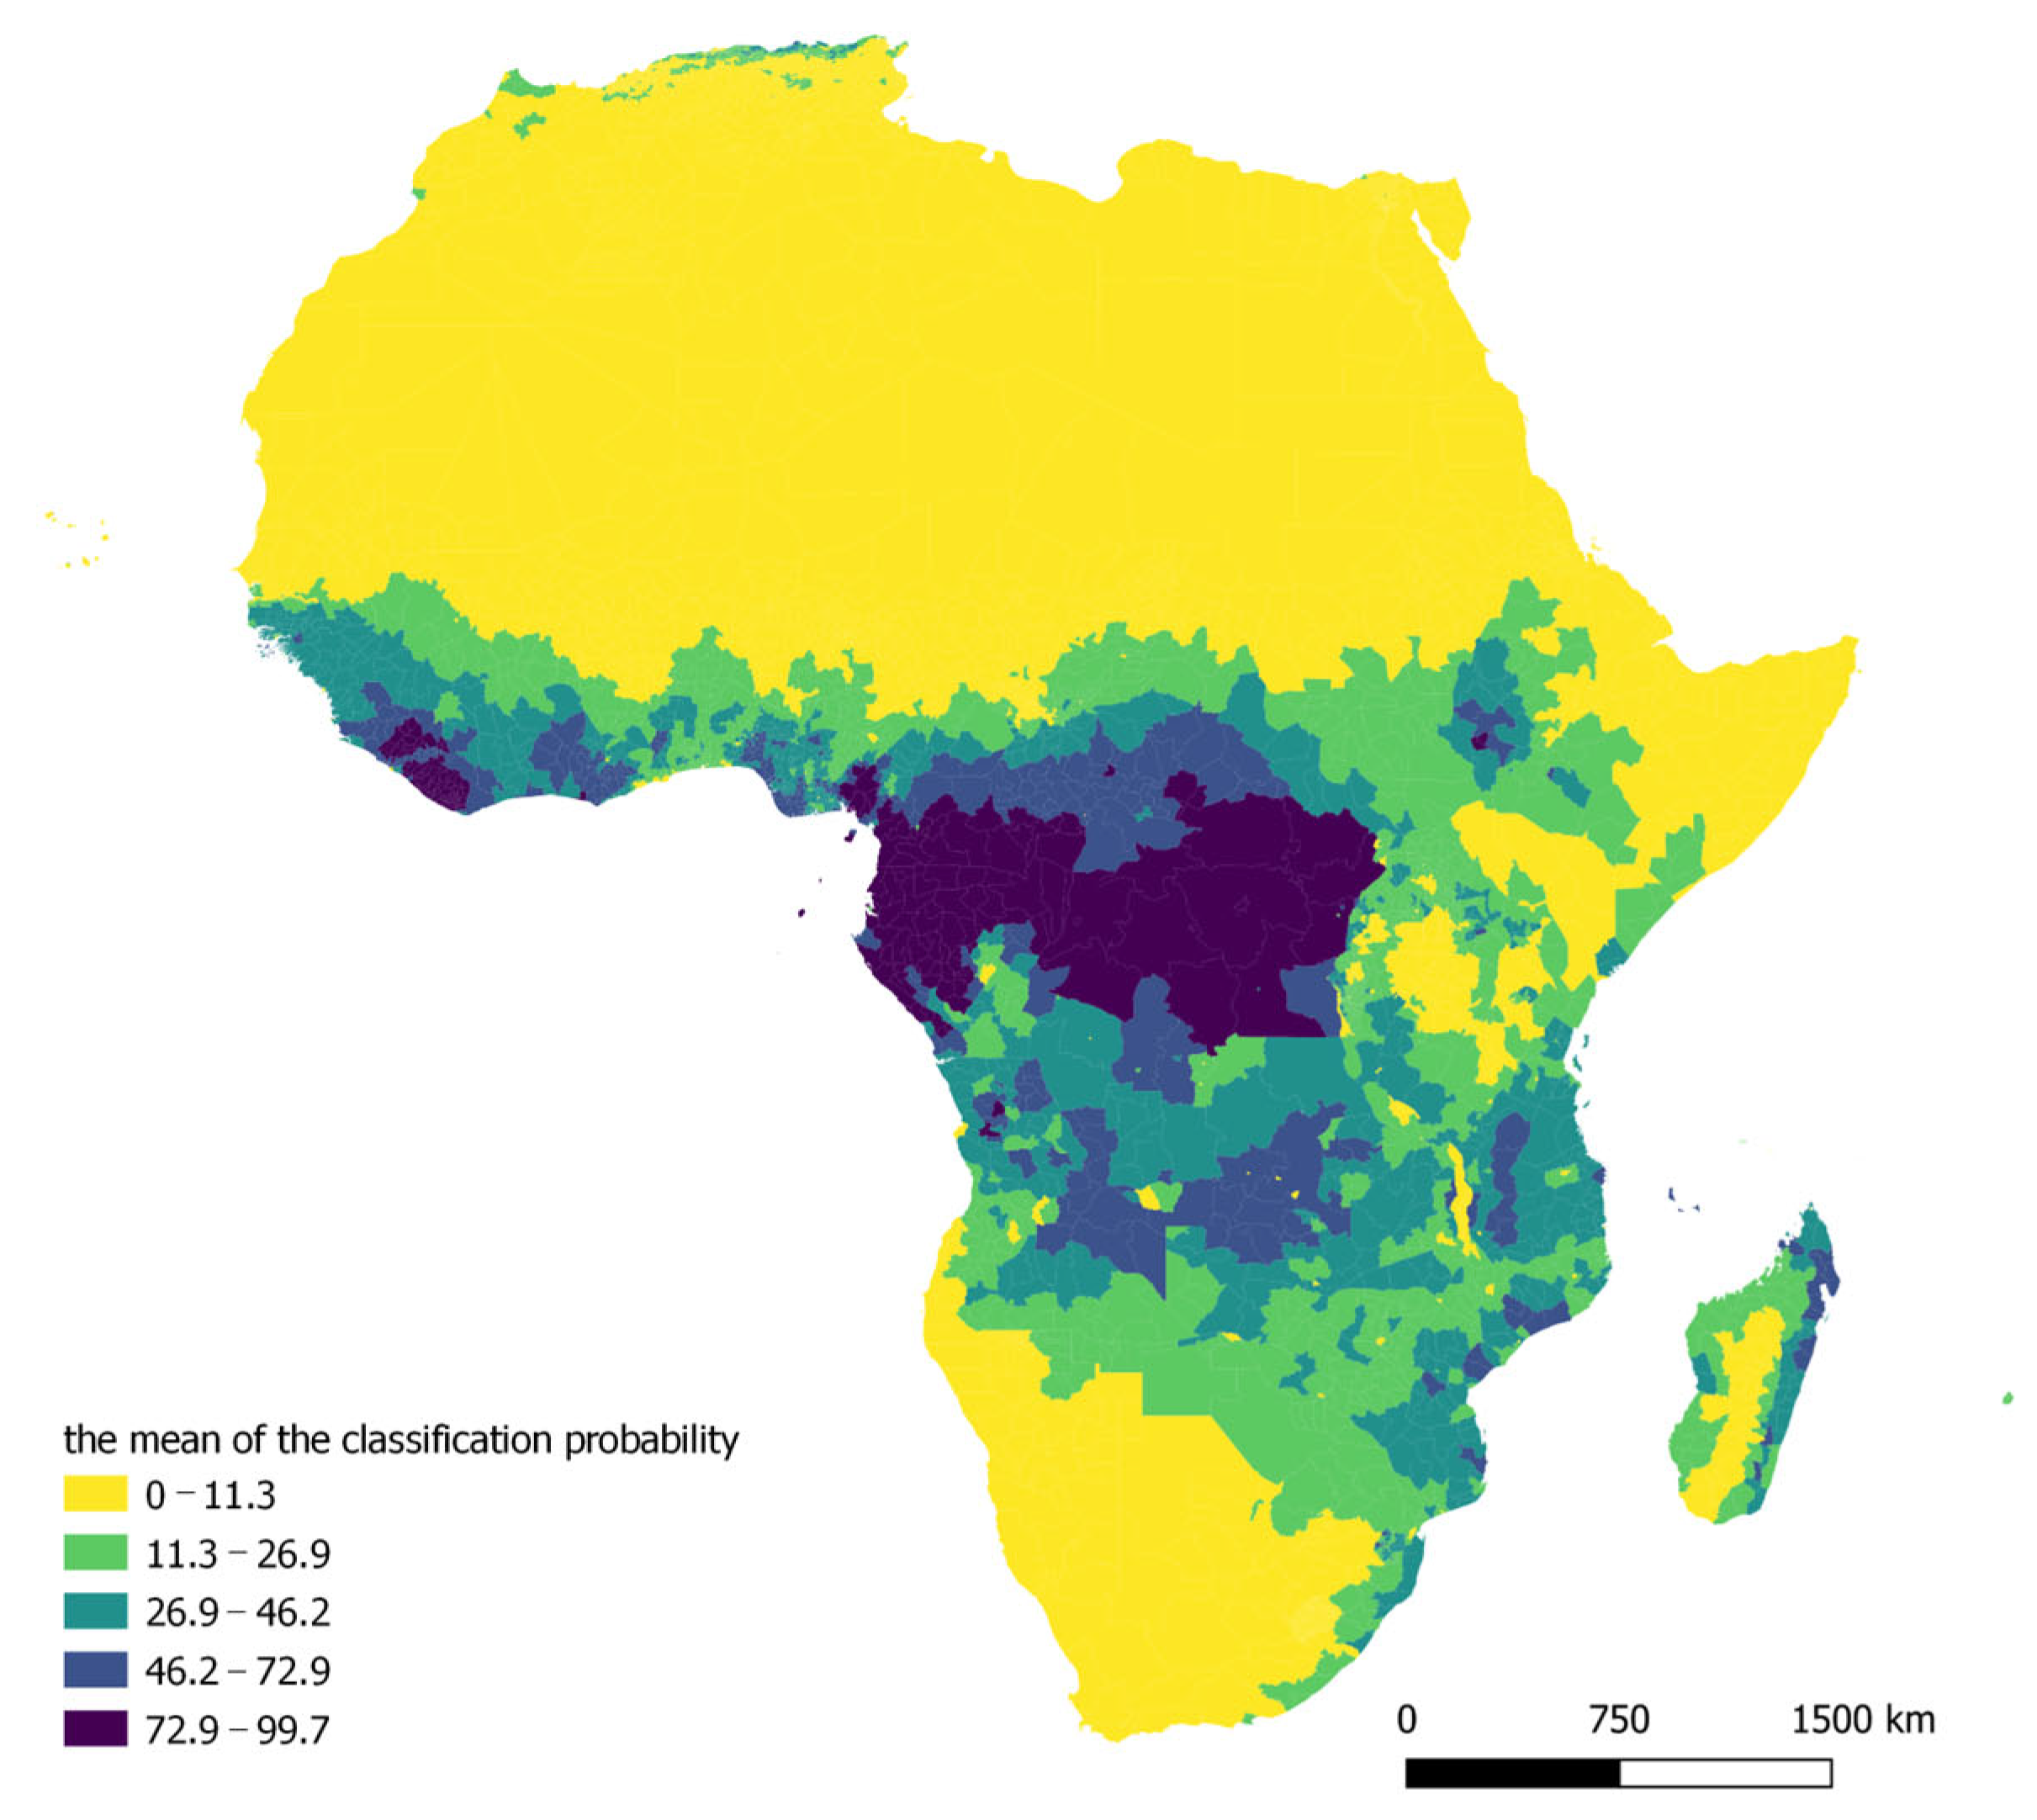
Figure A3.
Build-up cover fraction in 2015 (mean of classification probability). Source: Authors’ elaboration based on Copernicus Global Land Service data.
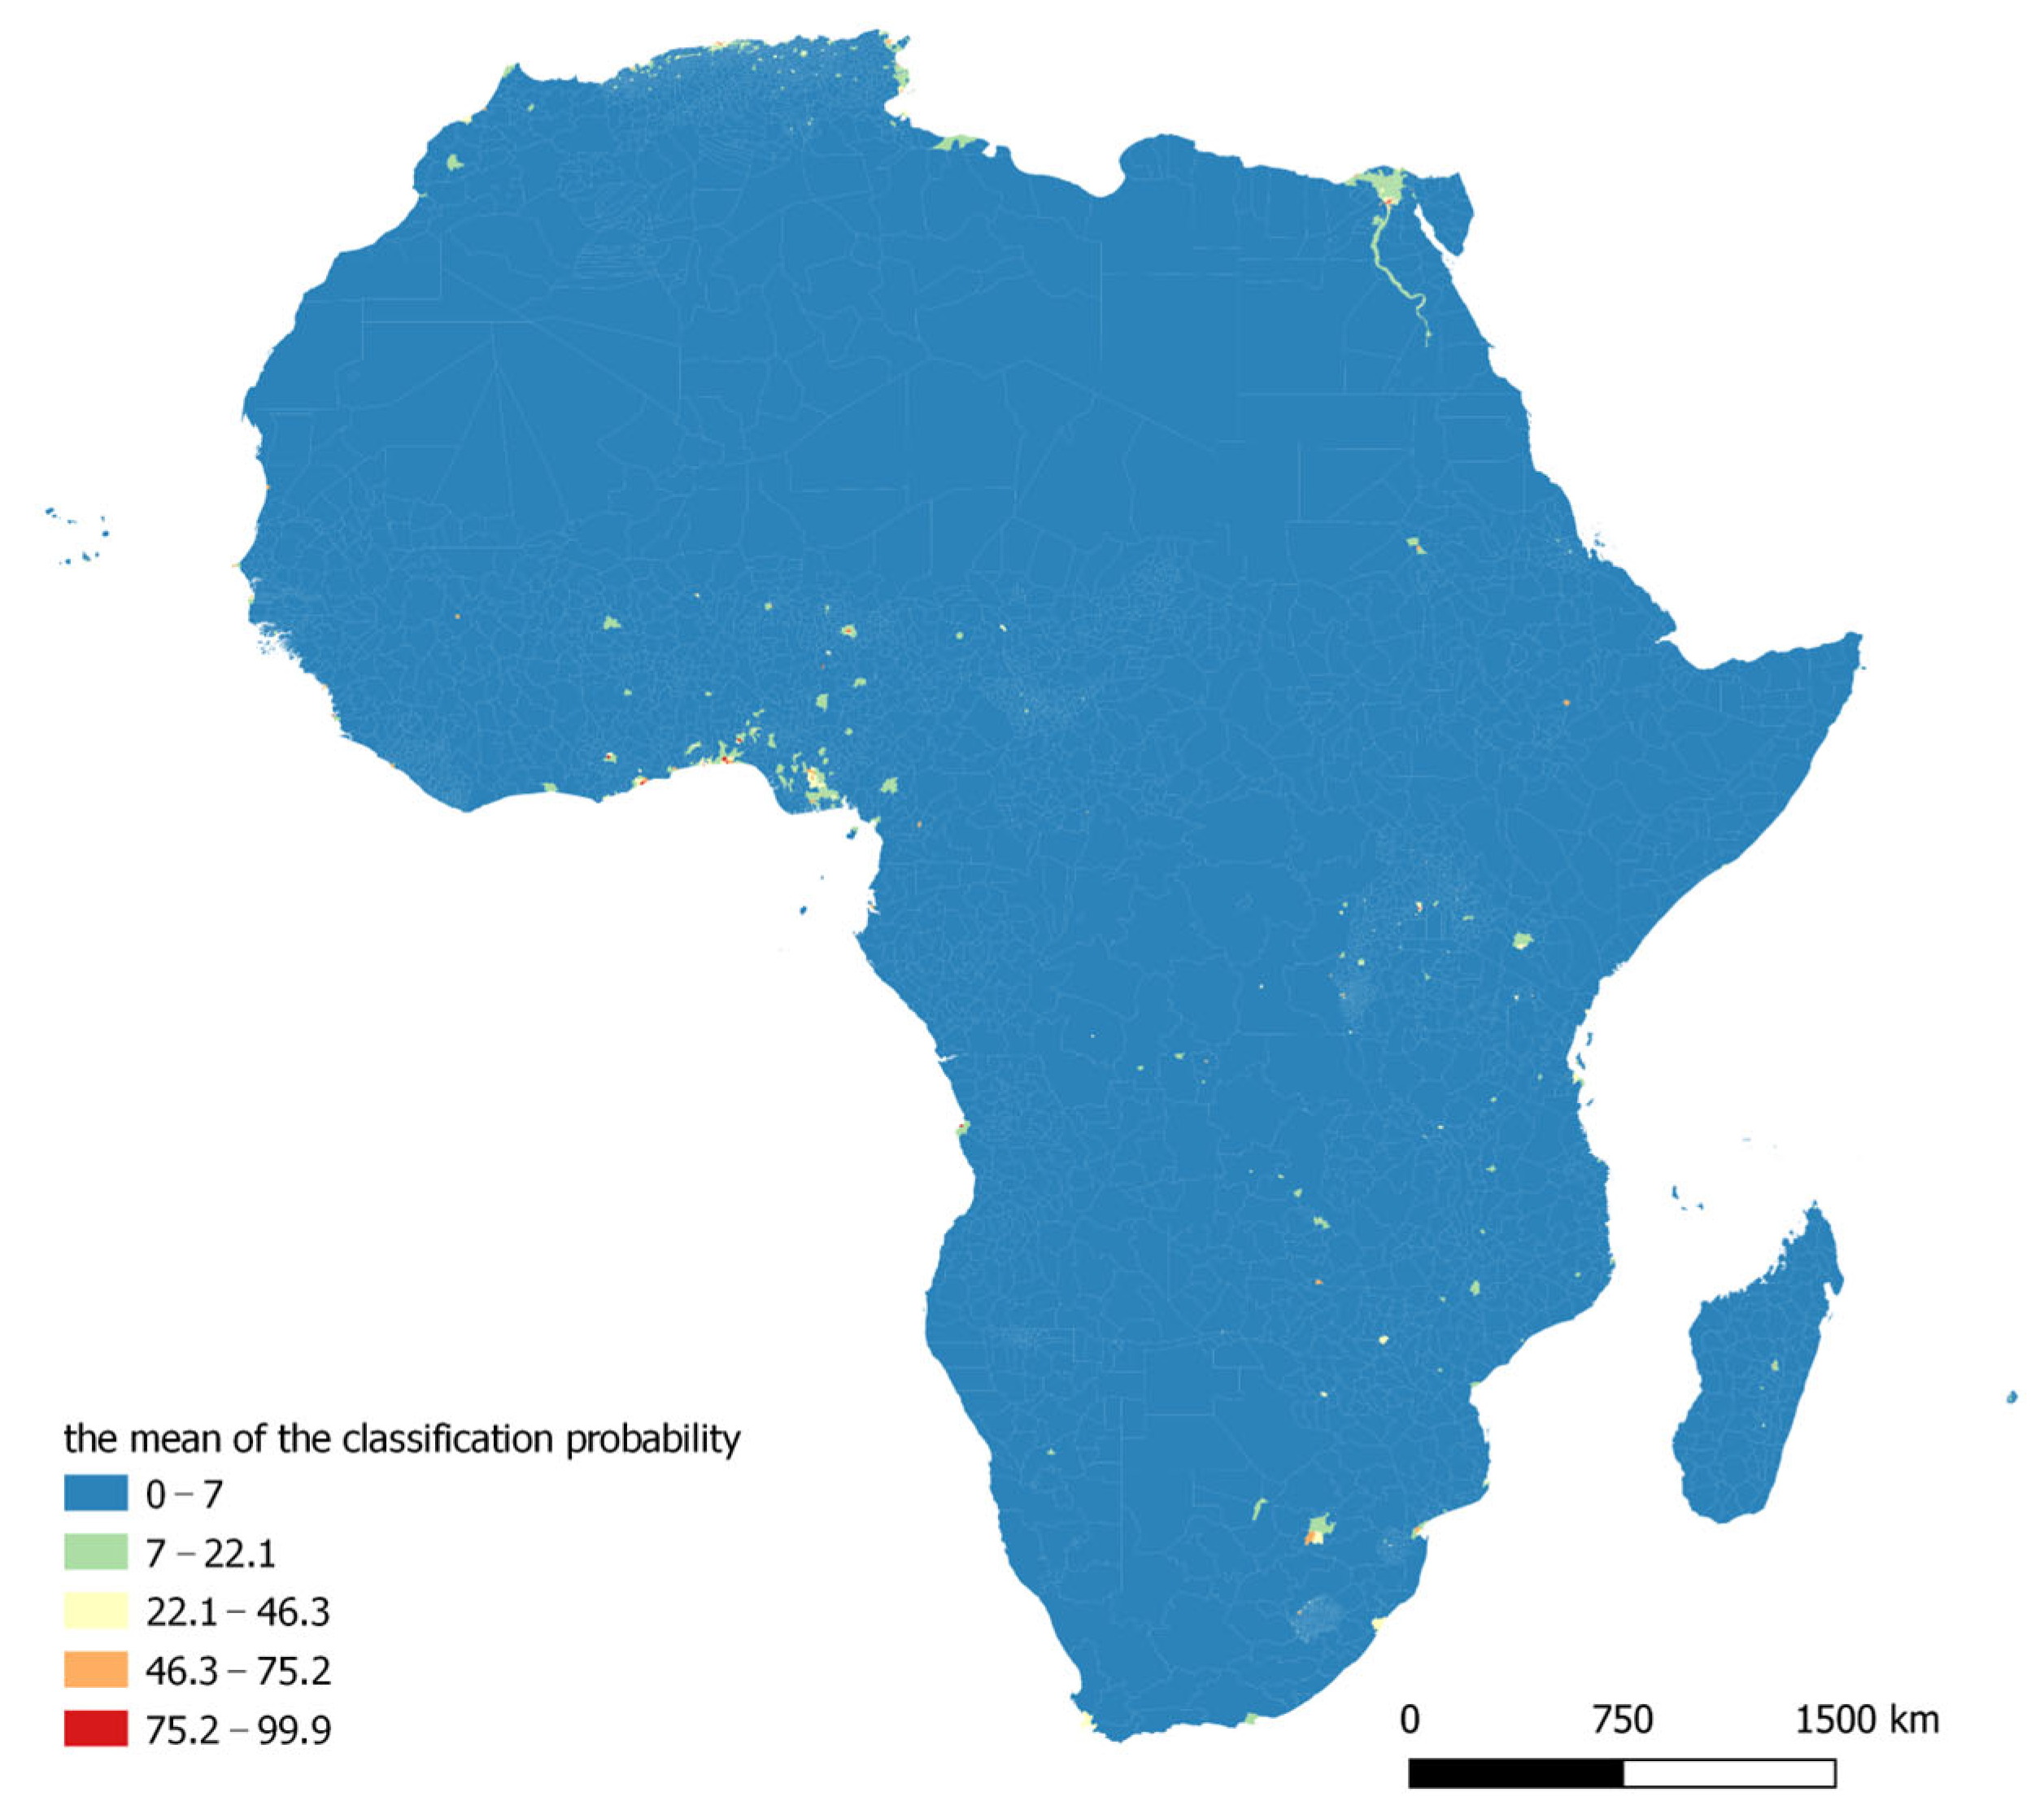
Figure A4.
Build-up cover fraction in 2019 (mean of classification probability). Source: Authors’ elaboration based on Copernicus Global Land Service data.
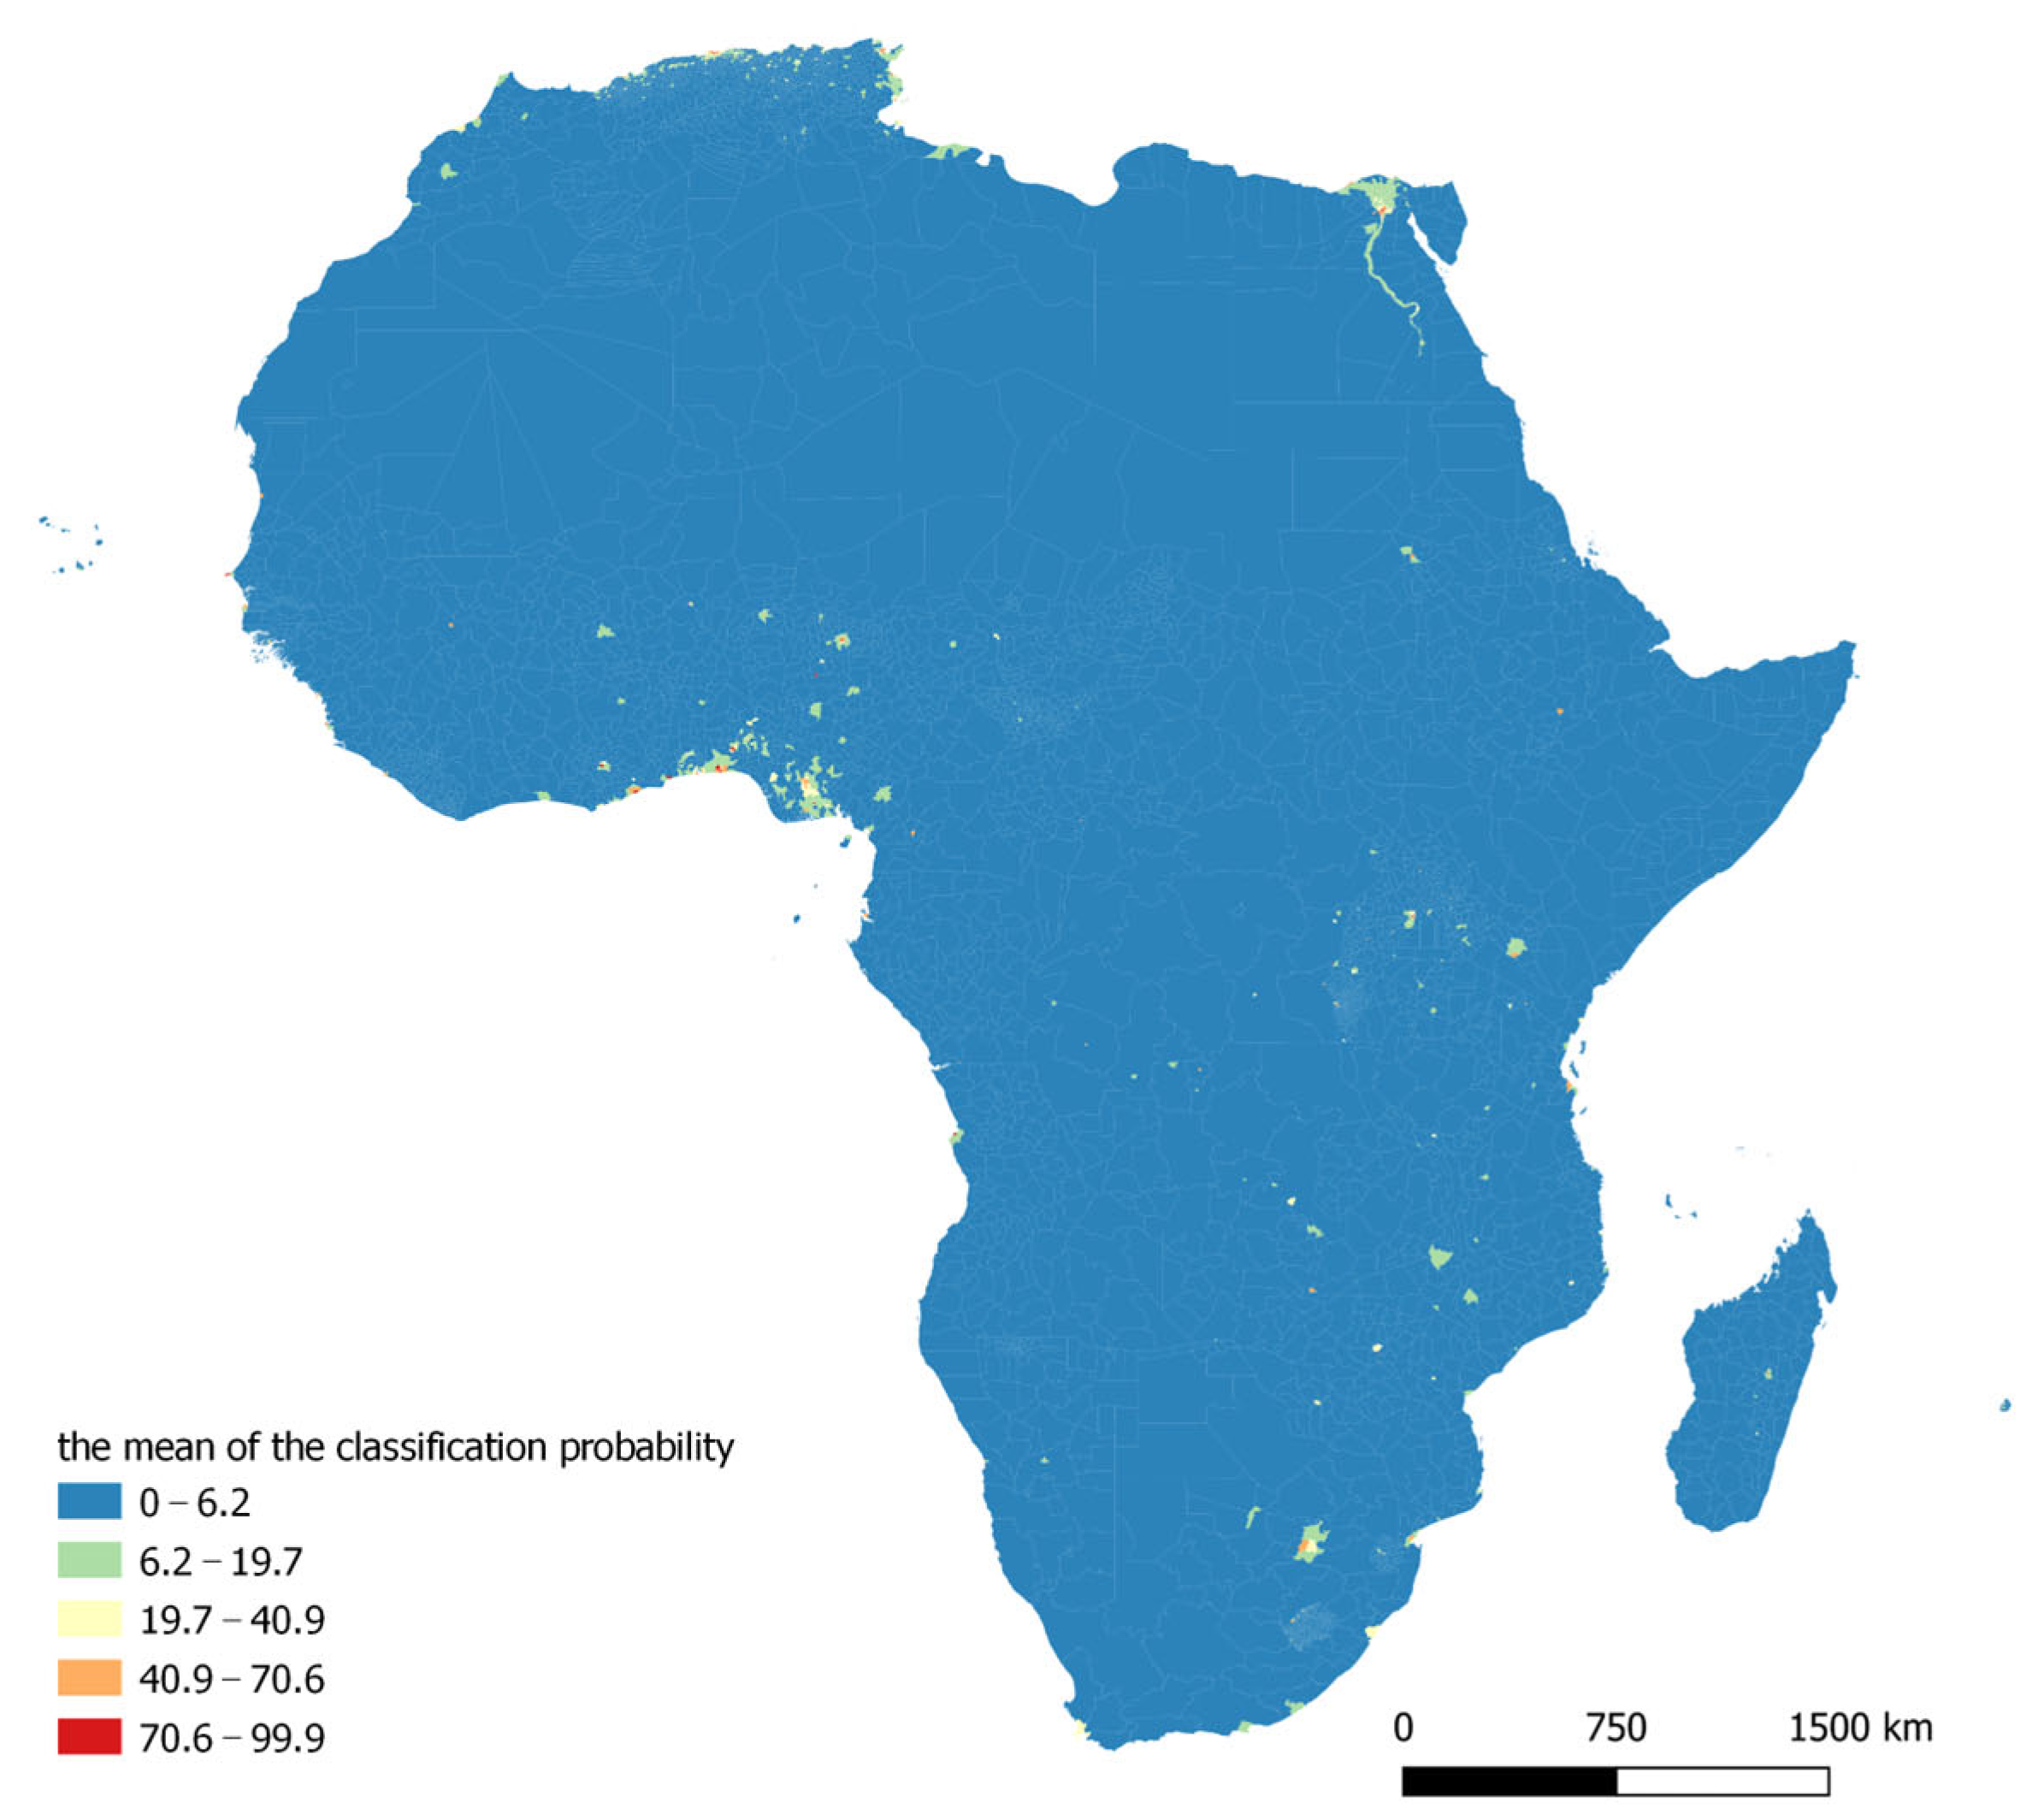
Figure A5.
Change in the mean probability of classification of area as tree-covered (2015–2019). Source: Authors’ elaboration based on Copernicus Global Land Service data.
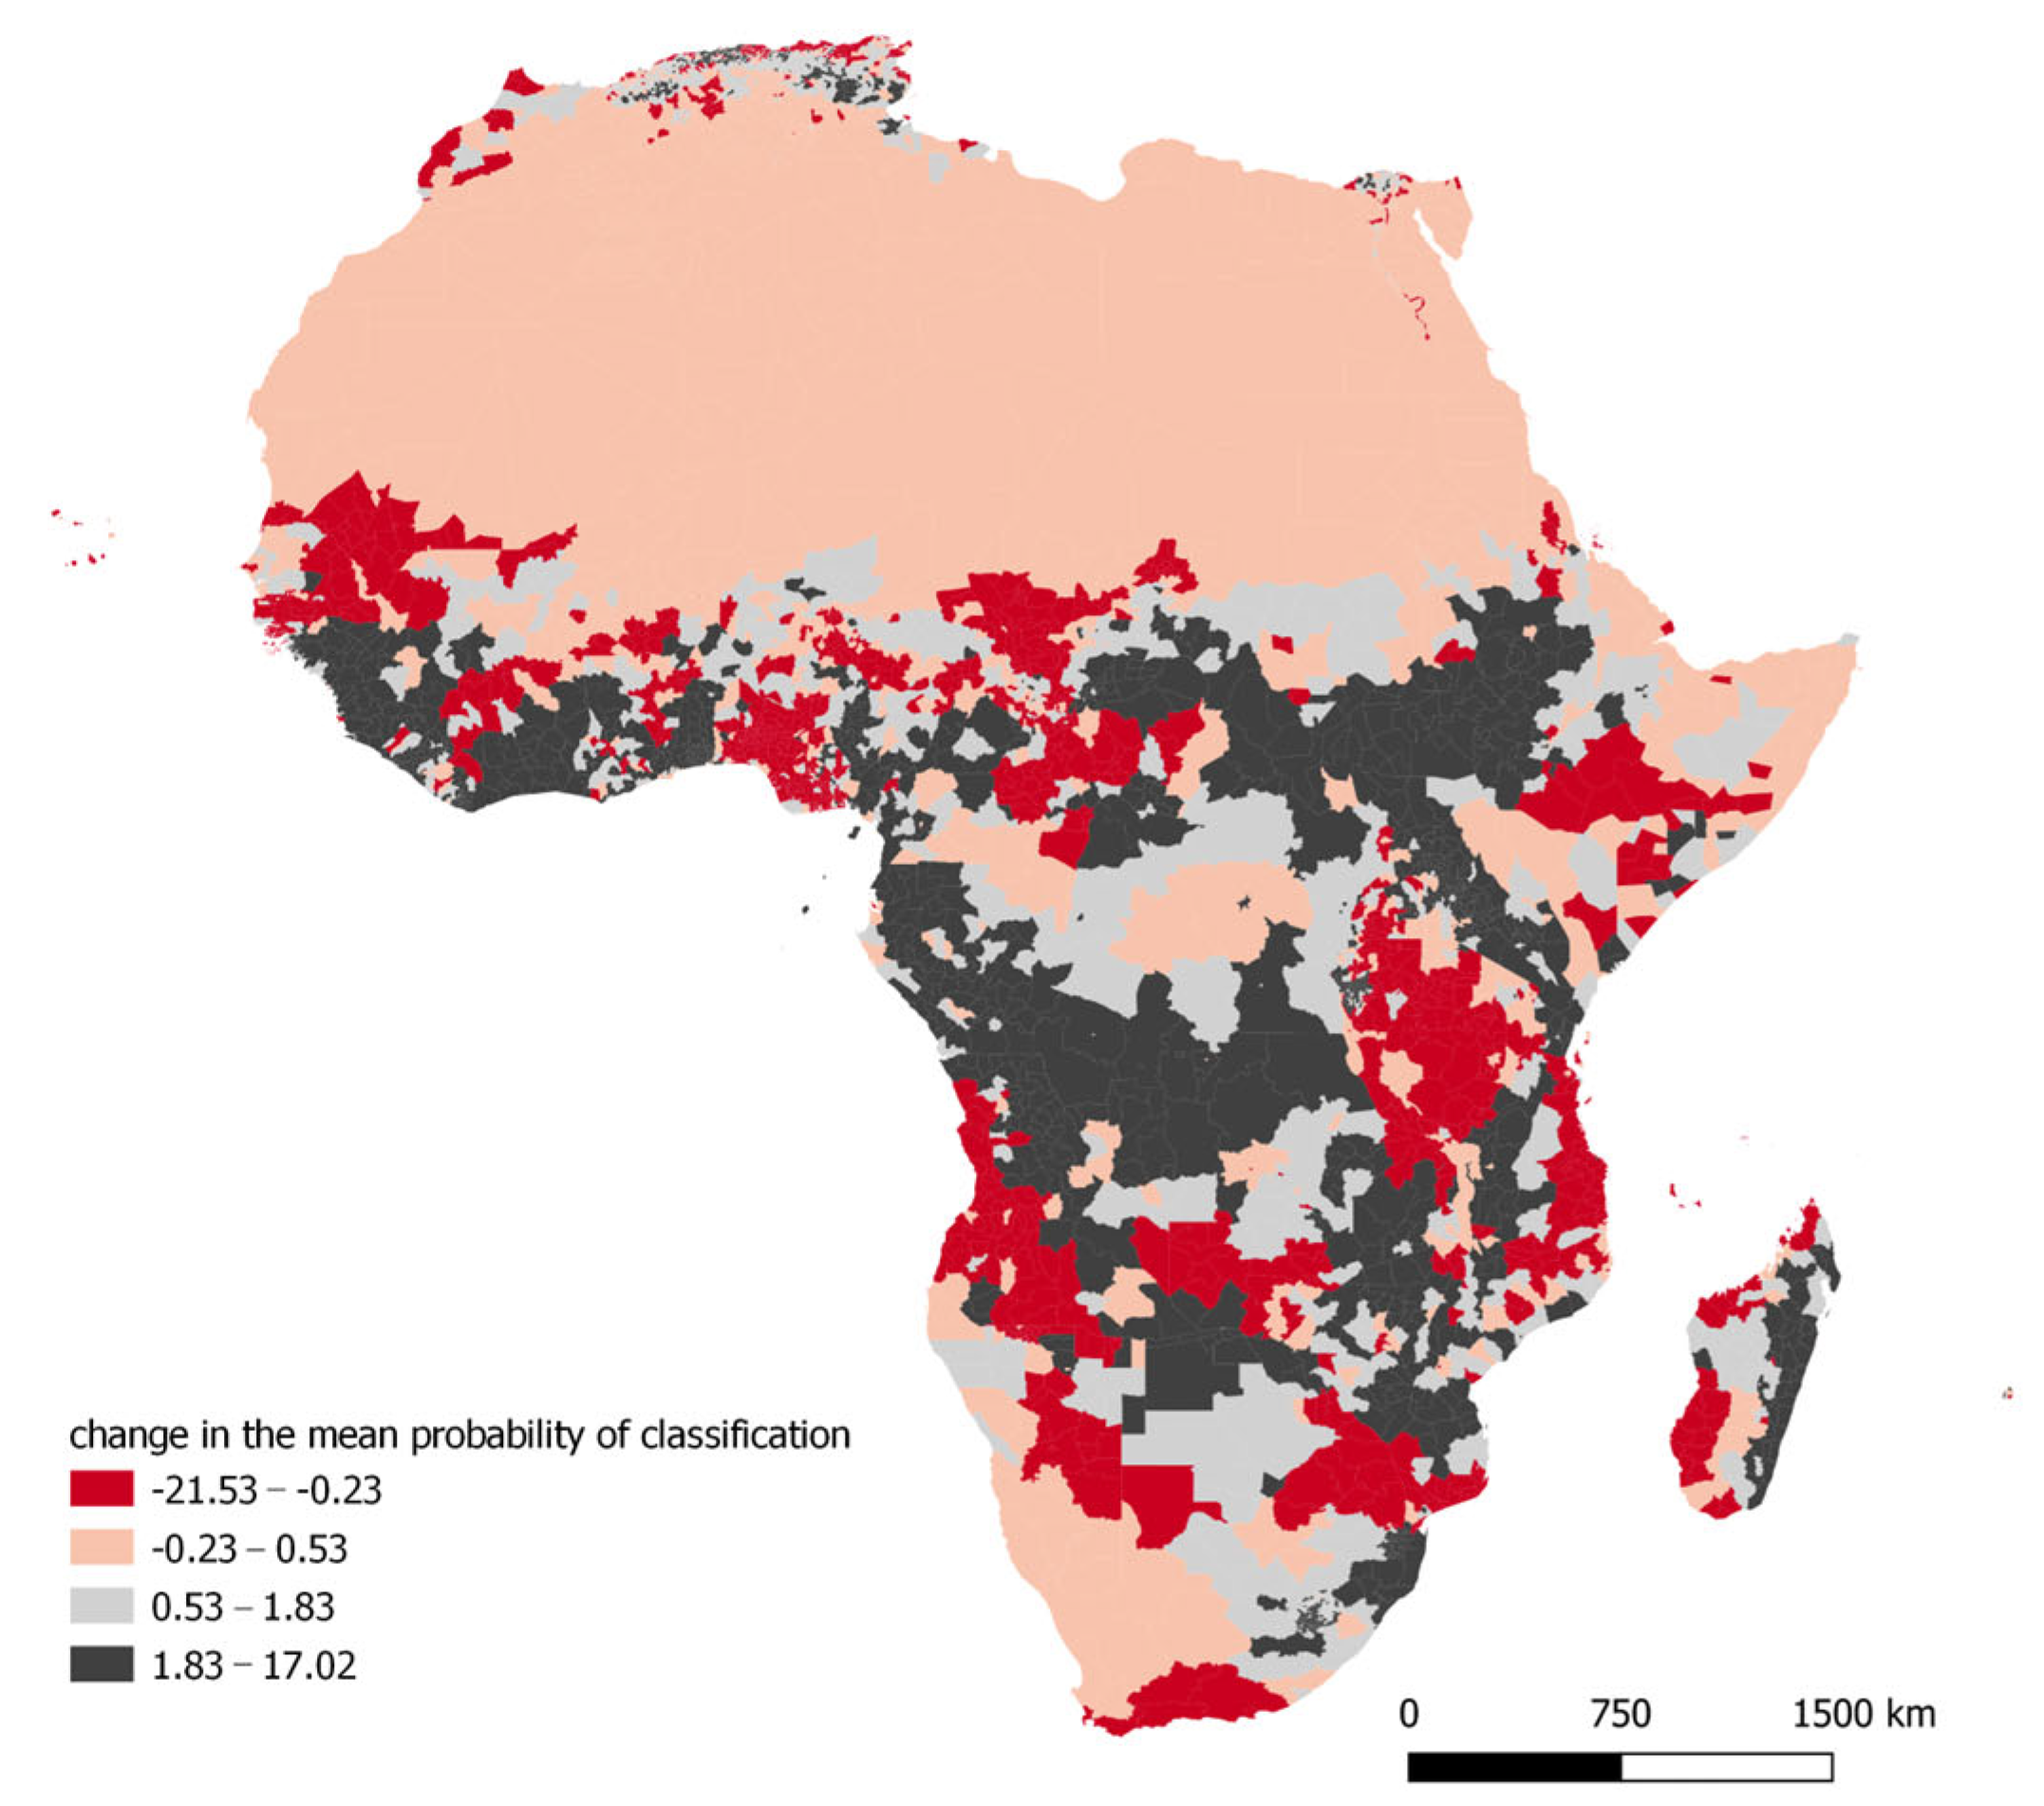
Figure A6.
Change in the mean probability of classification of area as built-up (2015–2019). Source: Authors’ elaboration based on Copernicus Global Land Service data.
References
- FAO. Global Forest Resources Assessment: Main Report; FAO: Rome, Italy, 2020. [Google Scholar] [CrossRef] [Scilit]
- Hogarth, N.J.; Belcher, B.; Campbell, B.M.; Stacey, N. The Role of Forest-Related Income in Household Economies and Rural Livelihoods in the Border-Region of Southern China. World Dev. 2013, 43, 111–123. [Google Scholar] [CrossRef] [Scilit]
- Crowther, T.W.; Glick, H.B.; Covey, K.R.; Bettigole, C.; Maynard, D.S.; Thomas, S.M.; Smith, J.R.; Hintler, G.; Duguid, M.C.; Amatulli, G.; et al. Mapping tree density at a global scale. Nature 2015, 525, 201–205. [Google Scholar] [CrossRef] [Scilit]
- Ribeiro, R.; Senetra, A.; Biegańska, J.; Środa-Murawska, S. Social perception of deforestation—The case study of Mata Atlântica biome in Brazil. Stud. Mater. CEPL Rogów 2015, 17, 74–83. [Google Scholar]
- Zemanova, M.; Perotto-Baldivieso, H.; Dickins, E.; Gill, A.B.; Leonard, J.; Wester, D. Impact of deforestation on habitat connectivity thresholds for large carnivores in tropical forests. Ecol. Process 2017, 6, 21. [Google Scholar] [CrossRef] [Scilit]
- Tajudeen, Y.A.; Oladunjoye, I.O.; Bajinka, O.; Oladipo, H.J. Zoonotic Spillover in an Era of Rapid Deforestation of Tropical Areas and Unprecedented Wildlife Trafficking: Into the Wild. Challenges 2022, 13, 41. [Google Scholar] [CrossRef] [Scilit]
- Pearson, T.R.H.; Brown, S.; Murray, L.; Sidman, G. Greenhouse gas emissions from tropical forest degradation: An underestimated source. Carbon Balance Manag. 2017, 12, 3. [Google Scholar] [CrossRef] [Scilit] [PubMed]
- FAO. Available online: https://www.fao.org/3/x7273e/x7273e01.htm (accessed on 20 March 2023).
- Moon, H.; Solomon, T. Forest Decline in Africa: Trends and Impacts of Foreign Direct Investment: A Review. Int. J. Curr. Adv. Res. 2018, 7, 16356–16361. [Google Scholar]
- Carbon Market Express. Available online: https://forestcarbonpartnership.org/topics (accessed on 30 December 2025).
- UN-REDD. Available online: https://www.un-redd.org (accessed on 30 December 2022).
- African Development Bank Group. REDD+ in Africa. Available online: https://www.afdb.org/fileadmin/uploads/afdb/Documents/Publications/REDD_in_Africa_-_Context__challenges_and_next_steps_of_REDD__mechanisms_in_the_continent.pdf (accessed on 30 December 2022).
- Achard, F.; Beuchle, R.; Mayaux, P.; Stibig, H.J.; Bodart, C.; Brink, A.; Carboni, S.; Desclée, B.; Donnay, F.; Eva, H.D.; et al. Determination of tropical deforestation rates and related carbon losses from 1990 to 2010. Glob. Change Biol. 2014, 8, 2540–2554. [Google Scholar] [CrossRef] [Scilit]
- Vijay, V.; Pimm, S.L.; Jenkins, C.N.; Smith, S.J. The Impacts of Oil Palm on Recent Deforestation and Biodiversity Loss. PLoS ONE 2016, 11, e0159668. [Google Scholar] [CrossRef] [Scilit] [PubMed]
- Salgado Baptista, D.M.S.; Farid, M.; Fayad, D.; Kemoe, L.; Lanci, L.S.; Mitra, P.; Muehlschlegel, T.S.; Okou, C.; Spray, J.A.; Tuitoek, K.; et al. Climate Change and Chronic Food Insecurity in Sub-Saharan Africa; Departmental Papers; International Monetary Fund: Washington, DC, USA, 2022. [Google Scholar] [CrossRef] [Scilit]
- Mfon, P.; Akintoye, O.A.; Mfon, G.; Olorundami, T.; Ukata, S.U.; Akintoye, T.A. Challenges of Deforestation in Nigeria and the Millennium Development Goals. Int. J. Environ. Bioenergy 2014, 9, 76–94. [Google Scholar]
- Hussaini, M. The Impact of Economic Activities on Deforestation in Bauchi State. J. Humanit. Soc. Sci. 2014, 19, 14–18. [Google Scholar] [CrossRef] [Scilit]
- Otum, U.C.; Frederick, I.J.; Martina, K. Tragedy of the Commons and Economics of Deforestation in Nigeria. J. Biodivers. Manag. For. 2017, 6, 1000175. [Google Scholar] [CrossRef]
- Asongu, S. Deforestation and Welfare: Evidence from Africa. SSRN Electron. J. 2011, 10, e2493186. [Google Scholar] [CrossRef] [Scilit]
- Chiu, Y.B. Deforestation and the environmental Kuznets curve in developing countries: A panel smooth transition regression approach. Can. J. Agric. Econ. 2012, 60, 177–194. [Google Scholar] [CrossRef] [Scilit]
- Rudel, T. The National Determinants of Deforestation in Sub-Saharan Africa. Philos. Trans. R. Soc. Lond. B Biol. Sci. 2013, 368, 20120405. [Google Scholar] [CrossRef] [Scilit] [PubMed]
- Yalew, A.W. The Perplex of Deforestation in Sub-Saharan Africa. J. Trop. For. Environ. 2015, 5, 19–30. [Google Scholar] [CrossRef] [Scilit]
- Ojo, B.; Alaye, S.; Buochuama, A.; Martins, A. Influence of Deforestation in Borgu Local Government Area of Niger State, Nigeria. World News Nat. Sci. 2018, 18, 62–71. [Google Scholar]
- Jaffé, R.; Nunes, S.; Santos, J.; Gastauer, M.; Giannini, T.C.; Nascimento, W.J.; Sales, M.; Souza, C.M., Jr.; Souza-Filho, P.; Fletcher, R. Forecasting deforestation in the Brazilian Amazon to prioritize conservation efforts. Environ. Res. Lett. 2021, 16, 084034. [Google Scholar] [CrossRef] [Scilit]
- Wu, Y.-H. Investigation of Deforestation in East Africa on Regional Scales. Master’s Thesis, Stockholm University, Stockholm, Sweden, 2011. [Google Scholar]
- Gizachew, B.; Duguma, L.A. Forest Carbon Monitoring and Reporting for REDD+: What Future for Africa? Environ. Manag. 2016, 58, 922–930. [Google Scholar] [CrossRef] [Scilit]
- Soliev, I.; Theesfeld, I.; Abert, E.; Schramm, W. Benefit sharing and conflict transformation: Insights for and from REDD+ forest governance in Sub-Saharan Africa. For. Policy Econ. 2021, 133, 102623. [Google Scholar] [CrossRef] [Scilit]
- Mwanga, M. A trade-off analysis of deforestation and economic growth in East Africa. Trees For. People 2025, 21, 100980. [Google Scholar] [CrossRef] [Scilit]
- Copernicus Global Land Service. Available online: https://land.copernicus.eu/global/ (accessed on 18 October 2022).
- Brancalion, P.; Broadbent, E.; de-Miguel, S.; Cardil, A.; Rosa, M.; Almeida, C.; Almeida, D.; Chakravarty, S.; Zhou, M.; Gamarra, J.; et al. Emerging threats linking tropical deforestation and the COVID-19 pandemic. Perspect. Ecol. Conserv. 2020, 18, 243–246. [Google Scholar] [CrossRef] [Scilit]
- IGAD Climate Prediction and Applications Centre. Available online: https://geoportal.icpac.net/ (accessed on 18 October 2022).
- Defries, R.; Rudel, T.; Uriarte, M.; Hansen, M. Deforestation Drive by Urban Population Growth and Agricultural Trade in the Twenty-First Century. Nat. Geosci. 2010, 3, 178–181. [Google Scholar] [CrossRef] [Scilit]
- Sola, P.; Cerutti, P.; Zhou, W.; Gautier, D.; Iiyama, M.; Schure, J.; Chenevoy, A.; Yila, J.; Dufe, V.; Nasi, R.; et al. The environmental, socioeconomic, and health impacts of woodfuel value chains in Sub-Saharan Africa: A systematic map. Environ. Evid. 2017, 6, 4. [Google Scholar] [CrossRef] [Scilit]
- Curtis, P.G.; Slay, C.M.; Harris, N.L.; Tyukavina, A.; Hansen, M.C. Classifying drivers of global forest loss. Science 2018, 361, 1108–1111. [Google Scholar] [CrossRef] [Scilit]
- Nepstad, D.; McGrath, D.; Stickler, C.; Alencar, A.; Azevedo, A.; Swette, B.; Bezerra, T.; DiGiano, M.; Shimada, J.; Seroa da Motta, R.; et al. Slowing Amazon deforestation through public policy and interventions in beef and soy supply chains. Science 2014, 344, 1118–1123. [Google Scholar] [CrossRef] [Scilit]
- Angelsen, A.; Martius, C.; De Sy, V.; Duchelle, A.E.; Larson, A.M.; Pham, T.T. Transforming REDD+: Lessons and New Directions; CIFOR: Bogor, Indonesia, 2018; Available online: https://www.cifor-icraf.org/publications/pdf_files/Books/BAngelsen1801.pdf (accessed on 15 December 2025).
- Sills, E.; Pfaff, A.; Andrade, L.; Kirkpatrick, J.; Dickson, R. Investing in local capacity to respond to a federal environmental mandate: Forest & economic impacts of the Green Municipality Program in the Brazilian Amazon. World Dev. 2020, 129, 104891. [Google Scholar] [CrossRef] [Scilit]
- Wooldridge, J.M. Econometric Analysis of Cross Section and Panel Data; MIT Press: Cambridge, MA, USA, 2010. [Google Scholar]
- Śleszyński, P.; Gibas, P.; Sudra, P. The problem of mismatch between the CORINE Land Cover data classification and the development of settlement in Poland. Remote Sens. 2020, 12, 2253. [Google Scholar] [CrossRef] [Scilit]
- Espíndola, R.P.; Picanço, M.M.; de Andrade, L.P.; Ebecken, N.F.F. Applications of Machine Learning Methods in Sustainable Forest Management. Climate 2025, 13, 159. [Google Scholar] [CrossRef] [Scilit]
- Thangamayan, S.; Ramu, M.; Sundaram, A. Deep Learning Enhanced Remote Sensing for Analysing Socio Economic Impacts of Climate Change: An Interdisciplinary Perspective. Remote Sens. Earth Syst. Sci. 2024, 7, 612–626. [Google Scholar] [CrossRef] [Scilit]
- Miyawaki, A. Restoration of living environment based on vegetation ecology: Theory and practice. Ecol. Res. 2004, 19, 83–90. [Google Scholar] [CrossRef] [Scilit]
- Cary, M.; Bekun, F.V. Democracy and deforestation: The role of spillover effects. For. Policy Econ. 2021, 125, 102398. [Google Scholar] [CrossRef] [Scilit]
- World Resource Institute. Available online: https://research.wri.org/gfr/forest-pulse (accessed on 15 December 2025).

Disclaimer/Publisher’s Note: The statements, opinions and data contained in all publications are solely those of the individual author(s) and contributor(s) and not of MDPI and/or the editor(s). MDPI and/or the editor(s) disclaim responsibility for any injury to people or property resulting from any ideas, methods, instructions or products referred to in the content. |
© 2026 by the authors. Licensee MDPI, Basel, Switzerland. This article is an open access article distributed under the terms and conditions of the Creative Commons Attribution (CC BY) license.