


Abstract
Urban agglomerations are concentrated production areas of new-quality productivity (NQP), and developing NQP is an inevitable requirement and obligation to promote the high-quality development of urban agglomerations. It is of great concern whether green finance (GF) can serve as a catalyst in promoting the formation and development of NQP in urban agglomerations. This study selects panel data from 41 cities in the Yangtze River Delta urban agglomeration spanning 2011–2023 to construct a comprehensive indicator system for NQP based on the composition, quality, and function of productive factors in the urban agglomeration, and explores the impact effects, mechanisms of action, spatial spillover effects, and heterogeneity of GF on the development of NQP using a two-way fixed-effects model, an intermediary effect model, and a spatial Durbin model (SDM). The empirical results indicate the following: (1) GF can significantly promote the development of NQP in the Yangtze River Delta urban agglomeration, and there is a significant positive spatial spillover effect. The above conclusions remain valid after a series of robustness tests and endogeneity treatments. (2) The mechanism tests find that industrial structure upgrading and environmental regulation play positive mediating roles in GF’s promotion of NQP development in urban agglomerations. (3) The impact of GF on NQP exhibits significant heterogeneity. In regions with higher levels of economic and financial development, as well as a higher degree of marketization, the promotional effect of GF on NQP is more pronounced. In terms of city size and geographical location, the empowering effect and spatial spillover effect of GF on NQP are more evident in prefecture-level cities and the northern plain area of the Yangtze River Delta. Therefore, it is recommended to implement differentiated GF policies to promote the development of NQP in the Yangtze River Delta urban agglomeration through regional cooperation, green technology innovation, industrial transformation and upgrading, and environmental regulation.
1. Introduction
At present, China’s economic development mode has shifted from high-speed growth to high-quality development. The transformation of the economic development mode requires the driving force of sustainable development, and new-quality productivity (NQP) is the intrinsic driving force and important support for promoting high-quality social and economic development [1]. Since the concept of NQP was born, the Chinese government put forward the requirement of “vigorously promoting the construction of a modern industrial system and accelerating the development of NQP” in March 2024, which fully reflects the importance and urgency of developing NQP. Green finance (GF), as an emerging financial form, plays a significant role in responding to environmental challenges, promoting economic green transformation, and advancing high-quality development [2,3,4,5]. Given the strong alignment in objectives between GF and NQP, the two have formed a mutually reinforcing relationship characterized by mutual influence and promotion. On the one hand, GF leverages innovative financial products and service models to channel social capital toward energy-saving, environmental protection, and low-carbon industries through investment, financing, project operations, and risk management, which effectively improves resource utilization efficiency and drives green technology innovation within industries, thereby fostering new economic growth models and promoting the development of NQP [6,7]. On the other hand, the development of NQP provides GF with greater market space, more advanced technologies, and higher-level institutional support, thereby driving the self-improvement and development of the GF system. In February 2024, China Financial News published an article titled “Vigorously Developing Green Finance to Cultivate New Productive Forces”, pointing out that GF can inject financial vitality into sustainable productivity and foster the growth of NQP. In June of the same year, the 12th International Symposium, themed “Green Finance Boosting New-Quality Productivity”, was held in Shanghai. It proposed leveraging GF as a key driver to direct financial resources towards new industries, new models, and new growth drivers, thereby injecting new vitality into technological innovation, industrial upgrading, and green sustainable development.
Urban agglomerations, with their modern functions and spatial organizational advantages, have become gathering places for advanced production factors and sources of various innovations, and are important carriers for the emergence of NQP [8]. The Yangtze River Delta urban agglomeration, as the largest urban agglomeration in China, is the forefront of reform and opening up and is an important engine for China’s high-quality economic development. In 2024, the GDP of the Yangtze River Delta urban agglomeration reached CNY 2.76 × 10⁴ billion, creating about 20% of the country’s total economic output with only 2.1% of the country’s land area. It plays a pivotal role in promoting national economic development and accelerating regional cooperation in science, technology, and finance. Its strong economic strength, abundant financial resources, a complete green finance system, and a convenient transportation network have made the connections between cities in the Yangtze River Delta urban agglomeration closer and spatial spillover effects more obvious. In particular, with technological advancements, NQP, characterized by the deep integration of new-quality factors, has become a significant force in promoting industrial structure upgrading and green economic transformation in the Yangtze River Delta urban agglomeration. Against this backdrop, how to leverage green financial instruments to expand green spaces and accelerate the development of NQP has become key to achieving green transformation and high-quality economic development in the Yangtze River Delta region. However, within China’s most vibrant Yangtze River Delta urban agglomeration, how GF influences NQP and what are its underlying mechanisms? Does GF’s promotion of urban NQP exhibit spatial spillover effects and heterogeneity? These issues have not yet been deeply explored and empirically verified.
This study examines the effects and mechanisms through which GF empowers NQP in the Yangtze River Delta urban agglomeration from 2011 to 2023, as well as its spatial spillover effects and heterogeneity. Compared to existing research, the main contributions are as follows. First, by constructing a comprehensive indicator system to measure the level of NQP based on the composition, quality, and functions of productive factors in urban agglomerations, this study explores the impact of GF on NQP. It deepens the understanding of the relationship between GF and NQP, thereby providing a new research perspective on NQP development in urban agglomerations. Second, by integrating industrial structure upgrading and environmental regulations into intermediary mechanisms, this study dissects the intrinsic mechanisms through which GF empowers the development of NQP in urban agglomerations, enriching and expanding the theoretical system of GF empowering NQP. Third, exploring the spatial spillover effects of GF on NQP in urban agglomerations provides practical reference for establishing strategic cooperation and collaborative development frameworks among cities. Fourth, this study examines the heterogeneity of GF’s impact on NQP across economic and financial development levels, urban scale, marketization degree, and geographic location, providing empirical evidence for formulating differentiated financial policies to develop NQP.
2. Literature Review and Research Hypothesis
2.1. Literature Review
At present, research on GF and NQP primarily focuses on their measurement, influencing factors [9,10,11,12], internal logic, impact effects, and path mechanisms of GF empowering NQP [13,14,15,16,17,18]. In terms of indicator measurement, Xie et al. [19] constructed an indicator system from a multi-dimensional perspective and employed the entropy method and the coupled coordination degree model to measure cities’ GF levels; Yu [20] measured the level of GF at a provincial scale from the perspectives of green credit, green securities, green insurance, and green investment. Regarding NQP, some scholars have constructed indicator systems based on the composition and connotation of NQP and used the entropy weight TOPSIS method to measure NQP levels [21,22]. In addition, some scholars have characterized the level of NQP from dimensions such as technological productivity, green productivity, digital productivity, and high-efficiency productivity based on its characteristics [23]. In terms of influencing factors, Zhu et al. [24] used econometric models to explore the influencing factors of GF based on 142 prefecture-level cities in China and believed that fiscal support, financial market construction, and policy tilt can effectively promote the rapid development of GF. Han et al. [25] explored the impact and operational mechanisms of economic growth, innovative talents, industrial agglomeration, and ESG development on NQP from the perspective of China’s reality. Luo [26] used dual machine learning to analyze the impact, pathway, and heterogeneity of data elements marketization on urban NQP in China. Wang et al. [27] explored the impact of innovative city pilot policies on NQP and found that the implementation of pilot policies can positively promote the formation of NQP. Additionally, some scholars have analyzed regional differences and spatiotemporal evolution characteristics of China’s provincial NQP using the Gini coefficient, global Moran index, and kernel density estimation [28,29,30]. They found that China’s NQP level is experiencing rapid growth, with eastern developed regions exhibiting higher levels than inland areas, accompanied by significant spatial spillover effects.
In terms of the research on the mechanisms through which GF empowers NQP, Du et al. [31] explored the demand-pulling mechanism, the policy- and fund-oriented mechanism, and the institutional innovation mechanism by building a three-dimensional framework comprising the “demand side, supply side, and environmental side”. Based on the goal consistency of GF and NQP, Wang [17] and Shi [32] analyzed the theoretical logic and innovative path through which GF enables NQP development. In terms of empirical research, Xie and Liu [33] utilized provincial panel data from China to investigate the impact of GF policies on NQP. Their findings indicate that while such policies promote NQP, their effects exhibit heterogeneity across regions with differing levels of economic development and financial sophistication. Mao and Wang [15] used provincial panel data from 2011 to 2022 in China to explore the impact of GF on NQP from the perspective of technological innovation and environmental concern, finding that GF has a promoting effect on the development of NQP in China, especially in eastern coastal areas with higher levels of economic development. Peng and Wang [34] examined the impact of GF on NQP based on data from Chinese A-share listed companies in the National Green Finance Reform and Innovation Pilot Zone from 2012 to 2022, and found that GF significantly promote the development of enterprise-level NQP by alleviating financing constraints and improving green innovation. Wu and Yin [35] analyzed the impact of financial technology and GF on NQP from a collaborative perspective, providing theoretical and empirical basis for promoting high-quality development and policy-making in the Yangtze River Delta region. Based on panel data from prefecture-level cities and above, Shen et al. [16] explored the mechanism of GF in promoting the development of NQP in the Beijing–Tianjin–Hebei region, indicating that GF can directly promote the development of NQP and has significant spatial spillover effects. Liu et al. [3], using panel data from 272 Chinese cities, found that GF can promote the development of urban NQP through green technological innovation and reduced financing constraints.
The above achievements provide a rich theoretical basis and practical reference for this study; however, there is still room for further deepening and expansion. (1) Previous studies have explored the relationship between GF and NQP from a theoretical perspective, while the literature on quantifying the impact and mechanisms of GF on NQP in urban agglomerations from an empirical perspective is relatively limited. Although a small amount of literature has explored the impact of GF/GF policies on NQP of enterprises/cities [16,34,35], the effects, underlying mechanisms, and heterogeneity of GF’s influence on NQP remain incompletely understood. (2) From the perspective of measuring NQP, existing research mostly use the following three elements: laborers, labor materials, and labor objects to characterize NQP. However, the emergence of urban agglomerations is altering both the composition of productivity factors and the connotations of various factors [8]. Therefore, if we still use laborers, labor materials, and labor objects to measure NQP in urban agglomerations, there will inevitably be certain limitations. (3) From a spatial perspective, existing literature predominantly examines the impact of GF on the development of NQP at the provincial/enterprise level [17,31,34]. As urbanization continues to advance, the connectivity between cities, economic interdependence, and industrial investment cooperation are steadily strengthening, and urban agglomerations are gradually emerging as the core regions for economic and financial activities. Research previously conducted at the provincial/enterprise level are increasingly inadequate to provide policy guidance for the development of NQP in urban agglomerations. Therefore, an in-depth exploration of the role of GF in enhancing urban NQP, along with its spatial spillover effects and heterogeneity, serves as a valuable supplement to the existing literature.
2.2. Research Hypotheses
2.2.1. Direct Mechanism of GF on NQP
GF is a financial development model that balances ecological environment improvement and socio-economic benefits and has a mutually reinforcing and supportive relationship with NQP. On the one hand, GF utilizes its ability to efficiently allocate financial resources and guide social capital towards green industries, emerging sectors, and future-oriented enterprises, which provides long-term financial support for industrial green transformation and upgrading, technological innovation, and the development of strategic emerging industries [36], thereby delivering strong impetus for the advancement of NQP. On the other hand, green financial instruments innovate GF products and reduce financial service costs through policy and market guidance, thereby improving the efficiency and accuracy of GF services. Moreover, GF leverages robust risk management tools and market-based pricing mechanisms to support enterprise-led industrial technological innovation, thereby enhancing NQP. However, existing literature predominantly examines the impact of GF on NQP from provincial or corporate perspectives, with limited research addressing whether GF can directly promote NQP within urban agglomerations. Based on this, the study proposes hypothesis H1: GF can directly empower the development of NQP in urban agglomerations.
2.2.2. Intermediary Mechanism of GF in Promoting NQP
In the process of developing NQP, Peng and Wang [34] found that GF can indirectly promote the advancement of NQP by alleviating financing constraints and enhancing the innovation level of enterprises. However, whether GF can elevate the level of NQP through industrial structure upgrading (ISU) and strengthened environmental regulation (ER) remains to be verified. In terms of industrial structure, industrial transformation and upgrading are key to achieving high-quality economic development [37]. GF, by empowering industrial transformation, may provide robust support for NQP development. First, GF can guide more capital towards energy-saving, environmental protection, and low-carbon industries by optimizing the allocation of financial resources and providing preferential interest rates for enterprises’ green technological innovation, thus driving industrial transformation and upgrading. Second, GF increases the financing costs of polluting enterprises through credit thresholds, directly promoting such enterprises to achieve green transformation or indirectly transforming and upgrading the industrial structure towards high-end, intelligent, and green directions by attracting capital, technology, and innovative talent [38,39]. Third, GF can improve corporate environmental social responsibility through the issuance of green credit and green bond, thereby promoting corporate environmental investment and driving green technological innovation [40,41,42]. Moreover, GF effectively mitigates investment risks through innovative financial products and services, stimulating the flow of financial capital toward green industries and ultimately promoting industrial transformation and upgrading [43,44,45,46]. The optimization of industrial structure not only facilitates the transfer and aggregation of production factors to high value-added enterprises, thereby improving total factor productivity, but also promotes the allocation of more resources to technology-intensive enterprises, thus accelerating industrial innovation output and providing technical impetus for the development of NQP [47,48,49]. Based on the above analysis, this study proposes the hypothesis H2: GF indirectly promotes the development of NQP in urban agglomerations by driving industrial structure upgrading.
In terms of ER, as a compound policy tool with both external constraints and internal incentives, ER may play an important role in the transmission process of GF’s impact on NQP. First, GF provides clear guidance for capital flows through ER, effectively improving the allocation efficiency of financial resources and the accuracy of financial support, while sharing and reducing green investment risks, thereby indirectly promoting the development of NQP. Second, by increasing governmental and public attention to ER, GF forces environmental protection departments to further improve green standards and policy incentive mechanisms (such as financial subsidies and tax incentives), promotes the concentration of resources in low-carbon and high-tech industries, and encourages enterprises to transform towards greener, more efficient, and more sustainable directions, thereby promoting the rapid development of NQP. Third, GF uses ER to increase pollution costs for enterprises through risk assessment and penalty mechanisms, forcing enterprises to optimize resource allocation and strengthen studies in environmental protection and green technologies, thereby promoting transformation of enterprises towards green, intelligent, and digital directions and improving corporate productivity and the advancement of NQP [50]. Accordingly, hypothesis H3 is proposed, which states that GF can promote the development of NQP by strengthening ER.
2.2.3. Spatial Spillover Mechanism of GF on NQP
Whether GF exerts a spatial spillover effect on the development of NQP has always been a concern among scholars. As an emerging financial format, GF exhibits significant spatial differences across regions. However, with the continuous enhancement of factor mobility, information sharing, and multi-stakeholder industrial cooperation, GF not only promotes local green technological innovation and total factor productivity but also facilitates cross-regional cooperation in green funds, technologies, and industries, thereby providing strong support for neighboring regions. Therefore, GF may exert spatial spillover effects on the development of NQP. In the Yangtze River Delta urban agglomeration, core cities with high-end radiating and leading roles, such as Shanghai, can provide funds, technology, and green financial products to surrounding cities through cross-regional capital flows, technological innovation transmission, and “demonstration effects” associated with GF development, thereby promoting the efficient circulation and reasonable allocation of green financial resources among cities and providing innovative support for development of NQP in adjacent cities. At the same time, in order to occupy the innovation highland and obtain policy support, surrounding small- and medium-sized cities will also make full use of green financial resources, technological experience, information, and talent spillovers from core cities to promote their own innovation drive and integration of the green industry chain, thereby assisting the development of the city’s NQP. In this regard, this study proposes hypothesis H4: the promotion of GF on the development of NQP has spatial spillover effects.
Based on the aforementioned analysis, the theoretical framework and research hypothesis for GF acting on the development of NQP are illustrated in Figure 1.
Figure 1.
Theoretical framework and research hypothesis of GF empowering NQP.
3. Research Design
3.1. Research Methodology
3.1.1. Entropy Weight Method
Based on the objective weighting approach, the entropy weight method is used to determine the weight of each indicator, and the development levels of NQP and GF are then measured through linear summation. The specific steps are as follows:
To eliminate the impact of different indicator units, the original data matrix is first processed without dimensionality. The calculation formulas for positive and negative indicators are as follows:
where represents the standardized value of the jth indicator for the ith city; represents the jth indicator value of the ith city; and and are the maximum and minimum values of the jth indicator, respectively. Based on this, use to calculate the proportion (Pij) of the jth indicator in the ith city, and then calculate the entropy value (ej) and weight (wj) of the jth indicator. The calculation formulas are as follows:
Hence, the values of NQP or GF of the ith city are obtained through linear weighted summation, where n and k represent the numbers of cities and indicators, respectively.
3.1.2. Spatial Autocorrelation Analysis
Moran’s index is a statistical tool for measuring spatial autocorrelation and is primarily used to assess whether spatial attributes exhibit overall spatial associations and local clustering characteristics across geographic units. To determine whether the development of NQP/GF in the Yangtze River Delta urban agglomeration has spatial correlation characteristics, this study employs the global Moran’s index and the local Moran’s index to examine overall spatial autocorrelation and local spatial aggregation characteristics. The formulas for calculating the global Moran’s I and local Moran’s I are as follows:
where IG and IL are the global Moran’s I index and local Moran’s I index, respectively, with values ranging from [−1, 1]. When IG > 0, it means that the overall spatial units are positively correlated; when IG < 0, it indicates that the overall spatial units are negatively correlated; and when IG = 0, it means that the overall spatial units are not correlated. For the local Moran’s index, when IL > 0, it means that the local spatial units have the characteristics of “high–high, low–low” aggregation, whereas IL < 0 means that the local spatial units have the characteristics of “high–low, low–high” aggregation. n is the number of spatial units; yi and yj are the attribute values of unit i and unit j, respectively, is the average value of all spatial units in the study area; and wij is the spatial weight. Considering that the development levels of NQP and GF are largely influenced by the economic development of itself and surrounding cities, this study selects economic distance weights to measure the degree of correlation between spatial unit attribute values. The formula for calculating the economic distance weight is as follows:
The wij is the element in row i and column j in the economic distance weight matrix, representing the spatial distance between city i and city j. It is expressed as the reciprocal of the absolute value of the difference in economic development levels between any two cities; and are the average per capita GDP of city i and city j from 2011 to 2023, respectively.
3.2. Model Building
3.2.1. Benchmark Model
Based on the theoretical analysis and research hypotheses mentioned above, in order to eliminate the interference caused by individual urban differences and temporal changes, this study establishes a benchmark regression model with bidirectional fixed effects to explore the impact of GF on the NQP of urban agglomerations. The bi-directionally fixed benchmark model is as follows:
where i and t represents the city and year, respectively; is the explained variable, representing the level of NQP; is the core explanatory variable, representing the level of GF; is a series of control variables; is a constant; and are the regression coefficients of GF and control variables, respectively; and , , and represent individual effects, time effects, and random disturbance terms, respectively. If the coefficient is , it means that GF can empower the NQP of urban agglomerations.
3.2.2. Mediating Effect Model
According to the previous analysis and theoretical assumptions, GF will indirectly promote the development of NQP in urban agglomerations by promoting industrial structure upgrading and improving ER. In order to explore the transmission mechanism through which GF promotes the development of NQP, this study builds a mediating effect model to test the above two mechanism paths. The specific models are as follows:
where is the mediating variable, including industrial structure upgrading and ER; β0 and θ0 are constant terms; and β1–β2 and θ1–θ3 are the regression coefficients of all the variables. The meanings of other variables and symbols are consistent with those in the baseline regression model.
3.2.3. Spatial Effect Model
Considering the coordinated development effect of the Yangtze River Delta urban agglomeration, GF not only affects the NQP in local cities but also promotes the development of NQP in adjacent cities. In other words, GF may have obvious spatial spillover effects. Based on the benchmark model, this study establishes a spatial Durbin model (SDM) to discuss the impact of GF development on NQP:
where ρ represents the spatial autoregressive coefficient; Wij represents the economic distance weight matrix; α1–α3 is the regression coefficient of each variable; and other variables and symbols have the same meanings as before.
3.3. Variable Selection and Data Sources
3.3.1. Explained Variables
The explained variable in this study is urban NQP. NQP is an advanced productivity quality characterized by the optimization and combination of modern new-quality laborers, new-quality labor materials, and new-quality labor objects, with technological innovation as the leading factor [51,52]. Among them, new-quality workers are the most active factor in NQP, jointly determining the level and direction of productivity with new-quality labor materials and new-quality labor objects, and currently showing a trend of green, intelligent, and digital development [33].
Due to revolutionary technological breakthroughs, innovative allocation of production factors, and deep transformation of industries, the holistic leap in laborers, labor materials, labor objects, and their optimized combination mainly occurs in urban agglomerations. Therefore, the NQP described above constitutes the primary form of urban productivity [8], forming a “macro–meso–micro” progressive characteristic alongside provincial-level and enterprise-level NQP. Among them, the NQP of enterprises represents the concrete manifestation of urban NQP at the micro level. Clearly, the formation and development of urban agglomerations are reshaping the composition and essence of productive factors. If we continue to characterize NQP solely from the perspectives of laborers, labor materials, and labor objects, certain limitations will inevitably arise. Based on the essence of NQP and the composition, quality state, and function of productive factors in urban agglomerations, this study categorizes the production factors—laborers, labor materials, and labor objects—into fundamental elements, attached elements, combined elements, supporting elements, and generative elements. Fourteen secondary indicators are selected to construct a comprehensive indicator system for the NQP of the Yangtze River Delta urban agglomeration (Table 1), and the entropy method is employed to determine indicator weight and measure the level of urban NQP. To verify whether deviations exist in determining the weights of indicators using the entropy method, this study recalculates the weights of each indicator using the principal component analysis (PCA) method. Table 1 shows that the weights of indicators determined by the entropy method are consistent with the results obtained by the PCA method, indicating that the application of the entropy method to measure urban NQP is reliable.
Table 1.
Indicator system for measuring the NQP in the Yangtze River Delta urban agglomeration.
3.3.2. Core Explanatory Variable
The core explanatory variable in this study is GF. Drawing upon existing research findings [15], an integrated indicator system for assessing GF development levels across the Yangtze River Delta urban agglomeration is constructed (Table 2). This system comprises eight secondary indicators selected from four dimensions: green investment, green insurance, green bonds, and green credit. Both the entropy method and PCA are employed to measure the weights of each indicator and calculate the GF development index, thereby validating the reliability of the entropy method for weight measurement.
Table 2.
Indicator system for measuring GF development in the Yangtze River Delta Urban Agglomeration.
3.3.3. Mediating Variables
This study selects industrial structure upgrading (ISU), which reflects the process of industrial structure transformation, and ER, which reflects the government’s emphasis on environmental protection, as intermediary variables to explore the impact mechanism of GF on NQP. ER is characterized by the proportion of each city’s environmental protection expenditure in total fiscal expenditure. The ISU is measured using the entropy method from two aspects: the advancement in the industrial structure (expressed as the ratio of the output value of the tertiary industry to that of the secondary industry) and the rationalization of the industrial structure. Among them, the rationalization level of industrial structure is calculated using the Theil index [37], and the calculation formula is as follows:
where i and t represent the city and year, respectively; represents the rationalization level of the industrial structure; k represents the industrial type (k = 1, 2, and 3, representing the primary, secondary, and tertiary industries, respectively); represents the proportion of the k-industry in the GDP; and represents the proportion of employees in the k-industry in the total city population.
3.3.4. Control Variables
To exclude the influence of other related variables on the development of NQP and ensure the authenticity and robustness of empirical results, this study selects economic development level (PGDP), scientific and technological level (STL), industrialization level (IL), urbanization level (UL), population size (PS), and foreign direct investment (FDI) as control variables. Among them, PGDP is expressed as the natural logarithm of per capita GDP; STL is represented by the ratio of scientific expenditure to total local fiscal expenditure; IL is measured by the ratio of industrial added value to GDP in each city; UL is expressed as the proportion of the city’s year-end population to the total population; PS is expressed as the logarithm of the urban population per square kilometer; and FDI is expressed as the ratio of actual foreign investment to GDP.
3.3.5. Data Sources and Descriptive Statistics
The data used in this study are panel data from 41 cities in the Yangtze River Delta urban agglomeration (including Jiangsu, Zhejiang, Anhui Provinces, and Shanghai) from 2011 to 2023. The original data mainly come from the “China Urban Statistical Yearbook”, “China Science and Technology Statistical Yearbook”, “China Financial Yearbook”, “National Patent Administration”, and the statistical yearbooks of various provinces and cities from 2012 to 2024. Some data come from the EPS Data Platform and the Mark Data Network. Data on green credit and green bonds come from the Choice database, while data on the number of artificial intelligence enterprises are from Tianyancha. Linear interpolation is used to complete individual missing data. The descriptive statistics of each variable are shown in Table 3. It can be seen from Table 3 that the maximum and minimum values of the NQP index of the Yangtze River Delta urban agglomeration are 0.814 and 0.006, respectively, with a mean of 0.093 and a standard deviation of 0.126, indicating significant differences in NQP levels among cities. The average value of the GF index is 0.048, with a maximum value of 0.991, a minimum value of 0.020, and a standard deviation of 0.111, indicating that GF levels in the Yangtze River Delta urban agglomeration are significantly unbalanced among cities. The statistical characteristics of other variables also have significant differences among different cities in the Yangtze River Delta urban agglomeration. For example, the mean and standard deviation of economic development are 7.976 and 0.965, respectively, and the maximum and minimum values are 10.710 and 5.920, respectively, indicating obvious regional differences in economic development in the Yangtze River Delta urban agglomeration.
Table 3.
Descriptive statistics of main variables in the Yangtze River Delta urban agglomeration.
4. Empirical Results and Analysis
4.1. Impact of GF on NQP of Urban Agglomerations Based on the Static Panel Model
4.1.1. Benchmark Regression Analysis
Table 4 shows the impact of GF and various control variables on the development of NQP in the Yangtze River Delta urban agglomeration from 2011 to 2023. Among them, column (1) represents the regression result without control variables and two-way fixed effects, and the regression coefficient of GF is 0.539; column (2) shows the regression result without adding control variables but considering fixed effects, with a regression coefficient of 0.451; column (3) shows the regression result with only control variables added, with the regression coefficient GF as 0.548; and in column (4), the regression result consider both control variables and fixed effects, the regression coefficient of GF is 0.468. From the benchmark regression results, it can be seen that regardless of whether control variables and fixed effects are considered, the regression coefficients of GF are positive and pass the significance test at the 1% level, indicating that GF can effectively promote the development of NQP in the Yangtze River Delta urban agglomeration, thus verifying that hypothesis H1 is true. This can also be confirmed by the significant linear positive correlation between NQP and GF (Figure 2), which once again shows that the development of GF has a significant promoting effect on NQP. The reason for this is that GF and NQP are highly compatible in essence. On the one hand, GF focuses on supporting the development of clean energy, low-carbon industries, energy conservation, and environmental protection through green investment, which not only reflects the intensity of financial entities in environmental governance and protection but also reflects a strategic upgrade of financial entities and capital markets in environmental protection from passive governance to active prevention and control. On the other hand, GF meets the financing needs of green projects by innovating financial products such as green bonds, green credit, green funds (such as ESG-themed funds), and green insurance, which creates a favorable environment for reducing corporate capital pressure, improving resource allocation efficiency, and reducing environmental risks. Meanwhile, based on green equity incentives, investors are encouraged to participate in green industries and sustainable projects, ultimately promoting the development of NQP in urban agglomerations. For the control variables, PGDP, STL, PS, and FDI exert significant promotional effects on NQP, with regression coefficients all being significantly positive at the 1% or 5% level. The reason may be that in the Yangtze River Delta urban agglomeration, most cities are innovative pilot cities, and their economic development provides more material capital and market demand for modern industries. Moreover, the higher the level of economic development, the more refined the organizational structures and institutional environments of these cities become, creating a more conducive environment for GF. Additionally, technological innovation and FDI are increasingly active, coupled with urban population expansion, which has accumulated more human resources for cities’ innovative development. These factors provide good conditions for the development of NQP and inject sufficient innovation momentum, thus significantly promoting the improvement in urban NQP. However, the levels of urbanization and industrialization significantly inhibit the development of urban NQP. This may be due to the increasing environmental pollution and ecological pressure caused by the accelerated process of industrialization and urbanization, which in turn restricts the development of NQP to a certain extent.
Table 4.
Benchmark regression results of bidirectional fixed-effects model.
Figure 2.
Correlation between GF and NQP in the Yangtze River Delta urban agglomeration.
4.1.2. Analysis of Intermediary Mechanism
According to the aforementioned theoretical assumptions and the mediating effect model, this study explores whether GF can promote the development of NQP in the Yangtze River Delta urban agglomeration through ISU and ER. The test results of the above two path mechanisms are shown in Table 5. From column (1) in Table 5, it can be seen that the regression coefficient of GF on ISU is 0.228 and is significant at the 1% level, indicating that GF helps to enhance ISU. Column (2) of Table 5 shows that the regression coefficients of GF and ISU on the development of NQP are both significantly positive, indicating that ISU is conducive to promoting the development of NQP. This means that GF can indirectly promote the improvement in NQP by promoting ISU, thus verifying hypothesis H2. Column (3) of Table 5 shows that the regression coefficient of GF on ER is 0.237 and passes the significance test at the 1% level, indicating that GF can improve the intensity and implementation of ER. Column (4) of Table 5 shows that the impact coefficient of ER on NQP is 0.749 and passes the significance test of 1%, indicating a direct and significant correlation between ER and NQP. In addition, after adding ER as a variable, the regression coefficient of GF on NQP remains significantly positive, indicating that ER plays a significant mediating effect in the process through which GF promotes the development of NQP. That is to say, GF can help the development of NQP by increasing the intensity of ER, thus verifying hypothesis H3.
Table 5.
Regression results of the mediation effect model.
4.2. Spatial Effects of GF on the NQP
4.2.1. Spatial Autocorrelation Test
To determine whether the spatial effects of NQP and GF need to be included in the regression model, we use the aforementioned Moran’s index to conduct spatial autocorrelation tests for the two variables. Table 6 shows that from 2011 to 2023, the global Moran’s I index of NQP in the Yangtze River Delta urban agglomeration is significantly positive at the 1% or 5% level, while the global Moran’s I index of GF is significantly positive at the 5% or 10%, and both show an overall upward trend over time. This indicates that the spatial dependences of NQP and GF development levels continues to increase, which means that it is necessary to consider their spatial spillover effects in the regression model. As for the global Moran’s I index of GF, the increasing trend in recent years may be related to the rapid development of GF in various cities in the urban agglomeration after the release of the “Guiding Opinions on Building a Green Finance System” in 2016.
Table 6.
Global Moran’s I index of NQP and GF in the Yangtze River Delta urban agglomeration from 2011 to 2023.
To further reveal the local spatial autocorrelation of NQP and GF in the Yangtze River Delta urban agglomeration, this study plots local Moran scatter charts of the development of NQP and GF in 2011 and 2023, respectively. Figure 3 shows that the Moran scatter-points of NQP and GF are concentrated in the first and third quadrants, which means that there are significant high–high or low–low aggregation characteristics for both NQP and GF. This indicates that the development of NQP and GF among adjacent cities has strong interactivity and obvious spatial club effects. In particular, it should be pointed out that whether it is NQP or GF, Shanghai, Suzhou, Hangzhou, Ningbo, and Wuxi all show significant high–high clusters in 2011 and 2023, while Nanjing, Hefei, and Fuyang show high–low clusters, which is basically consistent with the actual development situation. The above results further indicate that it is necessary to consider spatial spillover effects when using econometric models to explore the impact of GF on the NQP of urban agglomerations.
Figure 3.
Local Moran scatter plots of NQP and GF in the Yangtze River Delta urban agglomeration in 2011 and 2023.
4.2.2. Selection of Spatial Econometric Models
Since both NQP and GF exhibit spatial autocorrelation, using ordinary least squares (OLSs) regression to estimate the impact of GF on NQP may yield biased results. Therefore, it is necessary to choose an appropriate spatial econometric model. In this study, the LM test (which is the most commonly used tool for assessing the rationality of model specification; compared to the Wald test and LR test, this method only requires estimating the variance of the score function for the constrained model to accurately determine model specification validity) is used to judge whether the SDM should be adopted. The results in Table 7 show that Moran’s I, the LM test, and the Robust-LM test are all significant at the 1% level, indicating that the OLS regression results have spatial error effects and spatial lag effects. This demonstrates that it is correct to choose the SDM for empirical research. Based on this, the LR test and Wald test are performed to identify whether the selected SDM will degenerate into a spatial lag model (SLM) or a spatial error model (SEM). Table 7 shows that both the Wald and LR values pass the significance test at the 1% level, indicating that the SDM will not degenerate into either the SEM or the SLM. Therefore, it is appropriate to adopt the SDM that includes spatial lag terms and spatial error terms. In addition, the Hausman test further shows that selecting the SDM fixed in spatiotemporal bi-directions is optimal and helps alleviate the endogenous problems in the static SDM.
Table 7.
Diagnostic test for spatial econometric model selection.
4.2.3. Spatial Effect Analysis
Based on the screening results of the model, a bidirectional fixed-effects SDM is used to analyze the spatial effects of GF on NQP in the Yangtze River Delta urban agglomeration. From Table 8, it can be seen that the coefficient of determination (R2) of the SDM considering spatial effects is 0.846, which is significantly higher than that of the benchmark regression model (Table 4), further verifying that using the SDM is optimal. Column (1) in Table 8 shows the spatial effect of NQP under the economic distance matrix. It is found that the spatial lag coefficient of NQP is 0.210 and passes the significance test at the 1% confidence level, indicating that there is an obvious positive spatial spillover effect; that is, the improvement in NQP in local cities can, to some extent, drive the development of NQP in surrounding cities.
Table 8.
Spatial spillover effects of GF on NQP in the Yangtze River Delta urban agglomeration based on SDM.
For the core explanatory variable, the regression coefficient of GF is 0.417 and passes the significance test at the 1% level, indicating that for every 1% increase in GF, NQP will increase by 0.417. In addition, GF’s spatial lag coefficient is 0.382, which means that GF not only has a significant promotion effect on local NQP but also has a significant spatial spillover effect on NQP in cities with similar economic distances in the Yangtze River Delta urban agglomeration. This indirectly indicates that ignoring spatial effects may underestimate the promoting effect of GF on NQP and also confirms the rationality of considering spatial effects in econometric models. Furthermore, the partial differential coefficient separation method is used to decompose the impact of GF on NQP into two parts: the direct effect and the indirect effect. It is found that the direct effect (0.462), indirect effect (0.993), and total effect (1.455) of GF are all significantly positive at the 1% level (Table 8), indicating that GF not only directly improves the NQP level of local cities through its own role but also produces significant positive spatial spillover effects on surrounding cities within the Yangtze River Delta urban agglomeration through indirect pathways, thereby improving the NQP of adjacent cities, which verifies hypothesis H4. It is worth mentioning that the indirect effect of GF is much greater than the direct effect (Table 8), indicating that the spatial spillover effects of GF play a very important role in promoting the development of NQP in urban agglomerations. As for the mechanism through which GF promotes NQP in surrounding cities, it may stem from the close economic ties within urban agglomerations and the cross-border flow of funds, information, and experience provided by GF among cities. These create favorable conditions for the development of NQP in urban agglomerations and effectively promote the improvement in NQP through technology diffusion and exchange of human capital. This also means that accelerating the deep integration of GF and the mutual coordination of financial policies among cities will help the development of NQP, which in turn will promote the high-quality development of the Yangtze River Delta urban agglomeration.
From the perspective of the control variables, STL has a significant promoting effect on the development of NQP, with direct and indirect effects of 0.474 and 0.204, respectively, but the indirect effect does not pass the significance test. This shows that improvements in STL help unleash local innovation momentum and make regional production methods more energy-saving, efficient, and intelligent, thereby significantly promoting the development of NQP in the region. However, STL’s promotion of NQP in neighboring areas is limited, which may be related to geographical distance and differences in industrial type [49]. PGDP and FDI also play significant roles in promoting the development of NQP. Their spatial lag coefficients and regression coefficients both pass the significance test at the level of 1% or 5%. Except for the indirect effect of FDI, which does not pass the significance test, its direct effect, total effect, and the direct, indirect, and total effects of PGDP all pass the significance test of 1% (Table 8), indicating that PGDP and FDI not only enhance the NQP of local cities but also promote the NQP of adjacent cities to varying degrees. The reason may be that PGDP and FDI have accumulated more financial capital for the development of NQP, which not only injects new vitality into the development of innovative enterprises but also opens up broader space for the development of GF, thus creating favorable conditions for promoting the development of NQP [42]. The regression coefficient and direct effect of PS are both significantly positive at the 5% level, whereas its indirect effect is −0.149 and passes the significance test at the 5% level, indicating that expansion in PS can significantly promote the development of local NQP while inhibiting NQP in adjacent cities. The reason may be that the expansion of PS not only directly accumulates a large amount of human capital for local development but also creates more market demand for the development of modern industries in the region. Human capital is a key factor in the formation and development of NQP, thus improving local NQP levels. However, compared with the local region, when the economic development levels and infrastructure of adjacent areas are relatively backward, the population of these adjacent areas will migrate to the local area, which leads to a population decline in the adjacent areas and thereby inhibiting the development of NQP. Table 8 shows that the regression coefficients of IL and UL are significantly negative at the 5% level, indicating that they inhibit the development of NQP in the Yangtze River Delta urban agglomeration. The reason for this may be that environmental pollution and ecological damage caused by the advancement of urbanization and industrialization have hindered the development of NQP to a certain extent. In addition, further analysis found that IL and UL have negative direct and indirect effects on NQP in local and adjacent cities, indicating that promotion of urbanization and industrialization will inhibit the development of NQP.
4.3. Robustness, Endogeneity, and Heterogeneity Tests
4.3.1. Robustness Test
To ensure the reliability of the results obtained from the benchmark regression model, this study uses the following methods to conduct robustness test on the impact of GF on NQP. The first method is to replace the core explanatory variables, that is, to incorporate green credit indicators into the benchmark regression model instead of GF for regression analysis. The second approach is bilateral censoring. In order to eliminate the impact of extreme values in the data on the regression results, all data are subjected to bilateral censoring (i.e., data less than the 1% quantile and greater than the 99% quantile are replaced with missing values), and the censored data are then included in the benchmark regression model for robustness testing. The third is to eliminate special sample data. Due to Shanghai being a municipality directly under the central government, it is quite different from other cities in the Yangtze River Delta in terms of GF, economic development, UL, and environmental policies, which may have an impact on the empirical results to a certain extent. Therefore, this study excludes the data from Shanghai city and re-conducts regression testing on the remaining samples. The fourth method is to adjust the sample interval. In 2016, China issued the “Guiding Opinions on Building a Green Financial System”, which led to the rapid development of GF. To avoid interference with the results caused by insufficient development of GF before the release of the guidance, this study excluded the data from 2011 to 2015, and used the data from 2016 to 2023 to conduct the regression test again. Table 9 shows that regardless of the employed methods, the regression coefficient of the core explanatory variable (GF) in the Yangtze River Delta urban agglomeration is positive and passes the significance test at the 1% level, which is consistent with the results of the benchmark regression model. Furthermore, the regression results for the core explanatory variable in the benchmark model still exhibit strong robustness even after the incorporation of control variables. It also further substantiates that GF can significantly improve the level of NQP in the Yangtze River Delta urban agglomeration.
Table 9.
Robustness test of benchmark regression.
For the SDM, this study uses the method of replacing the spatial weight matrix to test the robustness of the regression results. That is, replacing the economic distance matrix with a geographical distance matrix and an economic–geographical nested matrix to explore the spatial effect of GF on the development of NQP. Table 10 shows that after replacing economic distance with geographic distance and nested economic–geographic distance, the coefficient size, sign, and significance of the core explanatory variable are basically consistent with the regression results under the weight of economic distance, confirming that the regression results of the SDM are robust. It is worth noting that the spatial effect is largest under the nested distance of economic geography, indicating that under the combined effects of geographical proximity and economic connections, GF has a more significant role in promoting NQP in local and neighboring areas, and the spatial spillover effect is more obvious.
Table 10.
Robustness test of SDM regression.
4.3.2. Endogeneity Tests
Endogenous problems often arise when using benchmark regression models for analysis. First, mutual causality between GF and NQP may lead to a certain reverse relationship. Second, there are many factors affecting NQP, and it is impossible to exhaust all of them when selecting control variables in this study. Consequently, omitted variables may introduce bias into the results. Third, measurement errors in variables may lead to biased results.
To test whether the benchmark model exhibits endogeneity arising from the aforementioned causes, this study first constructs two instrumental variables: one is the cubic difference between the GF index and its mean as an instrumental variable (IV1), and the other is the one-period lagged value of the GF index as an instrumental variable (IV2). Subsequently, a two-stage least squares (2SLSs) approach is used for endogeneity analysis. The results for columns (1) and (3) in Table 11 indicate that the regression coefficients of the instrumental variables IV1 and IV2 both pass the significance test at the 1% level. This indicates that the selected instrumental variables are valid and eliminates the issue of weak instrumentality. The results in columns (2) and (4) of Table 11 indicate that, under the premise that the instrumental variables pass the test, the regression coefficients of GF in the second stage are all significantly positive at the 1% level. This suggests that, after fully accounting for endogeneity issues, GF still exerts a significant enabling effect on the NQP of urban agglomerations, further validating the robustness of the preceding conclusions.
Table 11.
Endogeneity test of benchmark regression model.
4.3.3. Heterogeneity Tests
Given the significant disparities within urban agglomerations in terms of economic and financial development, city size, and marketization levels, this study explores the heterogeneity of GF’s impact on NQP from the perspectives of economic development, financial level, urban scale and marketization degrees. First, based on the per capita GDP of each city over the years, the top 20 cities with per capita GDP higher than the median of the entire urban agglomeration per capita GDP are classified as high-level economic development areas, while the bottom 21 cities are classified as low-level economic development areas. Then, regression analyses are conducted for the two groups of samples to examine the heterogeneity of the impact of GF on NQP under different levels of economic development. Columns (1) and (2) in Table 12 show that, compared with cities with low-level economic development, GF exerts a stronger role in promoting the development of NQP in cities with high-level economic development. The reason may be that regions with higher levels of economic development typically possess more comprehensive infrastructure and greater access to green financial resources, enabling green financial policies and products to be more readily implemented and promoted and to better support technological innovation, thereby accelerating the rapid development of NQP.
Table 12.
Heterogeneity test of GF’s impact on the development of NQP in urban agglomerations based on the benchmark model.
To test the heterogeneity of GF affecting NQP across different levels of financial development, this study referenced the “Yangtze River Delta Region Green Development Index City Ranking Report (2022)” and combines it with the GF index calculated in this study. We select the top 20 cities from all annual samples as high-level areas of financial development, while the bottom 21 cities are low-level areas of financial development, and then regression tests are conducted separately on both sample groups. The results of columns (3) and (4) in Table 12 indicate that in cities with higher financial levels, GF plays a more significant role in promoting NQP, whereas in ones with lower financial development levels, the promoting effect of GF is not pronounced. The reason may lie in the fact that cities with higher levels of financial development possess more robust green financial systems, which can provide more abundant financial products and services to meet urban green demands, thereby incentivizing enterprises to transition toward greener and smarter operations. This, in turn, drives the development of NQP. In contrast, cities with underdeveloped finance struggle to respond promptly and implement policies through their financial systems. This undermines the resource allocation efficiency of GF to some extent, reduces demand for green financial products, and consequently limits its effectiveness in promoting NQP.
Urban scale typically influences industrial production levels and innovation capabilities, thereby impacting the development of NQP. In our study, the samples are divided into two groups based on provincial cities and prefecture-level cities to analyze the impact of GF on NQP. Results in columns (5) and (6) of Table 12 indicate that, compared to provincial cities, GF plays a more pronounced role in empowering NQP in prefecture-level cities. The reason is that prefecture-level cities face stronger financing constraints, and GF can leverage its dual advantages of technological support and policy drive to provide necessary financial support through tools such as green credit and green bonds, thereby facilitating industrial technological innovation in prefecture-level cities and promoting the development of NQP. In contrast, provincial-level cities possess stronger technological R&D capabilities, abundant financial resources, and diverse financing channels, making them less reliant on GF [45]. Consequently, the impact of GF is less pronounced in these cities. Meanwhile, the degree of marketization affects the implementation of urban financial policies and the incentive effects of GF [53]. Consequently, the impact of GF on NQP may vary under different degrees of marketization. This study measures a city’s marketization level by the ratio of private enterprise employment to total urban employment. Following a descending order principle of marketization, the top 20 cities in each annual sample are classified as the high-marketization group, while the bottom 21 cities form the low-marketization group. Regression tests are conducted on two groups of samples, respectively. Columns (7) and (8) in Table 12 reveal that at the 1% significance level, GF exerts a significantly positive impact on NQP under high-marketization environments. This indicates that the higher the degree of marketization, the more effectively policy-driven GF allocates resources, thereby strengthening its role in promoting NQP. Conversely, in cities with lower-marketization levels, the regression coefficient of GF is not significant.
Furthermore, due to variations in geographical conditions and natural endowments across different regions within the urban agglomeration, the spatial spillover effects of GF on NQP may exhibit regional heterogeneity. This study divides the Yangtze River Delta urban agglomeration into the northern plain area and the southern hilly area based on the Taihu–Tianmu Mountain boundary, examining whether the spatial spillover effects of GF on NQP differs across distinct geographical locations. As shown in Table 13, in both the northern plain and southern hilly areas, the regression coefficients, spatial lag coefficients, and both direct and indirect effects of GF are all significantly positive. However, the spatial spillover effects and indirect effects of GF on urban NQP are more pronounced in the northern plains. The disparity may stem from the flat terrain in the northern plains of the Yangtze River Delta versus the rugged topography in the southern hill regions. Generally, flat terrain facilitates the concentration and diffusion of financial industries, digital information technology, and human capital, which in turn lowers the barriers to the adoption of financial instruments to some extent, thereby generating more pronounced spatial spillover effects on NQP.
Table 13.
Heterogeneity test of GF’s impact on NQP in urban agglomerations based on the SDM.
5. Discussion
This study constructs an indicator system to characterize NQP of urban agglomerations, while also confirming several established theories that previous research has not fully clarified.
Firstly, based on an understanding and theoretical analysis of the connotation of NQP, this study constructs a comprehensively sound evaluation indicator system for NQP according to the composition, quality, and function of urban agglomeration productivity elements, providing a scientific explanatory framework for the research of China’s urban NQP [8], while also overcoming the limitations of using laborers, labor materials, and labor objects to characterizing the NQP of urban agglomerations in the past. Second, the outcome that GF significantly enhances NQP has affirmed the general consensus that GF is a positive driver of NQP development in urban agglomerations. This result is consistent with the findings of Mao and Wang [15], who found that GF has a promoting effect on the development of provincial NQP in China, and Peng and Wang [34], who noted that GF plays a significantly positive role in promoting the development of enterprises NQP by alleviating financial constraints, improving investment structure, and promoting green innovation. Thirdly, a notable contribution of this study lies in its spatial analysis. Although Wu and Yin showed that GF could generate positive cross-regional impacts [35], they did not quantitatively provide direct and indirect effects of GF on NQP. The spatial effect analysis conducted using the SDM in this study further reveals the reality. That is to say, NQP in local cities directly benefits from green finance policies, while NQP in neighboring cities may indirectly benefit from spillover effects of GF, which are influenced by factors such as spatial distance, technological diffusion, and capital flows [52]. Fourthly, the effects of HG on urban NQP also underscore significant heterogeneity in the Yangtze River Delta urban agglomeration. GF exhibits more pronounced effects in cities with higher levels of economic and financial development and higher degrees of marketization. However, its influence and spatial spillover effects are relatively weaker in provincial-level cities and in the hilly areas in the southern Yangtze River Delta. These results align with the observations from Ren et al. [53], who think that the efficacy of GF in promoting urban NQP development is contingent on regional economic strength and quality of financial system. This finding also provides new evidence that a city’s potential economic structure and financial system are key determinants of its ability to utilize GF, a nuance largely overlooked in previous research [54]. Finally, the mediation effect analysis provides systematic empirical support for the theoretical mechanisms proposed by prior research, such as the role of GF in optimizing industrial structure [55] and the link between GF and innovation [56]. It is found that GF plays a role by reducing corporate financing costs, promoting the restructuring and upgrading of industrial structure, stimulating urban technological innovation, and strengthening environmental regulation [57]. In summary, this study provides a more comprehensive and detailed explanation on the impact of GF on NQP, which is conducive to the development of urban NQP [37].
6. Conclusions and Recommendations
6.1. Conclusions
Based on panel data from 41 cities in the Yangtze River Delta urban agglomeration from 2011 to 2023, this study comprehensively measures the development level of NQP from the perspectives of the composition, quality state, and functionality of productive factors in the urban agglomeration and empirically analyzes the impact of GF on the development of NQP. The main conclusions are as follows. (1) GF significantly promotes the development of NQP within urban agglomerations and facilitates NQP development through upgrading industrial structure and strengthening environmental regulations. (2) GF exerts significant spatial spillover effects on urban NQP. That is to say, GF not only plays a significant role in promoting NQP in local cities but also indirectly has a positive impact on NQP in neighboring cities. These spillover effects exhibit regional heterogeneity, with a stronger impact on the northern plain region of the Yangtze River Delta. The aforementioned conclusion remains valid after addressing endogeneity issues using instrumental variables and undergoing a series of robustness tests. (3) The promotional effect of GF on NQP exhibits heterogeneity. In regions with higher levels of economic and financial development and greater marketization, GF plays a more significant role in fostering NQP. However, in terms of urban scale, GF demonstrates less pronounced enabling effects on provincial-level cities compared to prefecture-level cities.
6.2. Policy Recommendations
Based on the above conclusion, in order to build the Yangtze River Delta urban agglomeration into a highland of NQP, the following suggestions are proposed.
First, it is necessary to strengthen policy support for GF to promote the coordinated development of green financial resource allocation across the Yangtze River Delta urban agglomeration. Governments should enhance the policy support system for GF by introducing tax incentives, R&D subsidies and innovation rewards, and encourage financial institutions to innovate green financial products, driving diversification and service innovation in green financial products. Simultaneously, it is also necessary to support energy conservation and emission reduction, as well as green environmental protection projects (such as renewable energy, green transportation, and green buildings) to optimize the allocation of green financial resources. Financial institutions should establish GF innovation platforms and leverage big data, artificial intelligence, and cloud computing to enhance risk assessment and precise control capabilities for green financial products. Policy-driven investment guidance and pilot demonstrations should be strengthened to form a replicable model for the coordinated development of GF and NQP.
Second, implement differentiated GF policies tailored to local conditions to foster the development of NQP. Considering the heterogeneity of GF’s impact on the development of NQP and the distinct functional positioning of cities within the Yangtze River Delta urban agglomeration, differentiated GF policies should be formulated to optimize the role of GF in promoting NQP. For cities with relatively underdeveloped economies and lower financial development levels, governments should guide capital flows toward green technological innovation through tax incentives, fee reductions, financial support, and other measures, driving the green transformation of industries and enhancing NQP. Conversely, for economically developed cities with advanced financial levels, the focus should be on strengthening the green development responsibilities of financial institutions and enterprises. Appropriately increasing the intensity of market-based environmental regulations, alongside policy tools such as carbon trading and green taxation, will encourage cities to proactively reduce environmental risks. Additionally, for provincial capitals and larger cities, while maximizing the synergistic development of GF and NQP, governments should enhance technology diffusion capabilities through digital service platforms. For prefecture-level cities, the focus should be on improving industrial structures and technological innovation systems, supporting green project investments and product innovation.
Thirdly, establish regional cooperation mechanisms to fully leverage GF’s radiating and leading role from central cities. Considering the spatial spillover effects of GF on NQP in the Yangtze River Delta urban agglomeration, the government should establish a regional cooperation mechanism to fully leverage Shanghai’s advantages as an international financial center and future global technology industry innovation center, enabling the sharing of green finance innovations with other cities in the region. By facilitating cross-city factor flows, the efficiency of financial resource allocation and technological innovation spillover capabilities can be enhanced. This approach will radiate and drive the development of GF in surrounding cities, thereby promoting the overall advancement of NQP across the urban agglomeration.
Fourthly, accelerate industrial transformation and upgrading. In the Yangtze River Delta urban agglomeration, government should leverage the advantages in capital, technology, and talent to guide financial capital towards technological innovation and emerging industries, and to develop strategic emerging industries such as new energy, new materials, and intelligent equipment, promoting the transformation of industries towards high-end, intelligent, and green development. Such efforts will provide strong support for the high-quality development of NQP in the Yangtze River Delta urban agglomeration.
6.3. Limitations
This study comprehensively and systematically examines the impact of GF on NQP of urban agglomerations and provides empirical support for the development of NQP; however, there are still some limitations. First, regarding data acquisition, this study utilizes urban panel data spanning from 2011 to 2023. Some relevant data proves challenging to obtain, and certain cities exhibit data gaps or inaccuracies. Second, the construction of the NQP indicator system lacks unified measurement standards. Consequently, the selected variable indicators struggle to comprehensively reflect the development level of NQP, potentially affecting the empirical results. Third, the dynamic relationships among variables have not been fully considered. Future research should incorporate the latest trends in NQP, include more indicators reflecting green technological innovation to comprehensively assess NQP level, and employ advanced dynamic panel models to enhance the interpretability of results. Furthermore, this study is limited to the Yangtze River Delta urban agglomeration, and whether its findings can provide insights for similar urban agglomerations require further validation.
Author Contributions
Conceptualization, J.L., G.F. and X.L.; methodology, J.L.; software, G.F.; validation, J.L. and X.L.; formal analysis, J.L. and G.F.; data curation, J.L. and G.F.; writing—original draft preparation, J.L.; writing—review and editing, X.L. and G.F.; funding acquisition, X.L. and G.F.; investigation, J.L. and G.F. All authors have read and agreed to the published version of the manuscript.
Funding
This study was supported by the National Social Science Foundation of China (No. 17BGL138) and the Talent Introduction Project of Guangxi Minzu University (22SKQD20).
Institutional Review Board Statement
Not applicable.
Informed Consent Statement
Not applicable.
Data Availability Statement
Data will be made available on request.
Conflicts of Interest
The authors declare no conflicts of interest.
References
- Xu, T.; Yang, G.; Chen, T.Q. The role of green finance and digital inclusive finance in promoting economic sustainable development: A perspective from new quality productivity. J. Environ. Manag. 2024, 370, 122892. [Google Scholar] [CrossRef] [Scilit]
- Amin, N.; Sharif, A.; Shabbir, M.S.; Pan, Y. Evaluating the impact of natural resource rents, R&D expenditures, green finance and energy efficiency on carbon emissions in BRICS economies: Greening the path to carbon neutrality in the post-COP 27 era. Technol. Soc. 2025, 81, 102826. [Google Scholar] [CrossRef] [Scilit]
- Liu, R.Y.; Wang, D.Q.; Zhang, L.; Zhang, L.H. Can green financial development promote regional ecological efficiency? A case study of China. Nat. Hazards 2019, 95, 325–341. [Google Scholar] [CrossRef] [Scilit]
- Wang, X.H.; Xu, B. Assessing the impact of carbon finance on the green economy: Using a spatial econometric model. J. Clean. Prod. 2025, 502, 145375. [Google Scholar] [CrossRef] [Scilit]
- Zhang, J.Q. Digital economy, green finance, and economic resilience. PLoS ONE 2025, 20, e0314028. [Google Scholar] [CrossRef] [Scilit]
- Li, X.T.; Zhuang, L. Research on innovation path and supervision of green finance enabling the development of new quality productivity. Nanjing Soc. Sci. 2024, 11, 37–46. [Google Scholar] [CrossRef]
- Zhou, C.Y.; Tian, F.; Zhou, T. Research on the impact of green finance on high quality economic development. J. Chongqing Univ. 2022, 28, 1–13. [Google Scholar] [CrossRef]
- Sheng, Y.; Peng, W.H. Composition, qualitative state, formation path and mechanism construction of new quality productive forces in urban agglomerations. Reform Econ. Syst. 2024, 5, 23–30. [Google Scholar]
- Li, X.P.; Yang, Y. Does green finance contribute to corporate technological innovation? The moderating role of corporate social responsibility. Sustainability 2022, 14, 5648. [Google Scholar] [CrossRef] [Scilit]
- Wen, S.Y.; Lin, Z.F.; Liu, X.L. Green finance and economic growth quality: Construction and empirical testing of a general equilibrium model with resource and environmental constraints. Chin. J. Manag. Sci. 2022, 30, 55–65. [Google Scholar] [CrossRef]
- Wang, Y.; Pan, D.Y.; Peng, Y.; Liang, X. China’s incentive policies for green loans: A DSGE approach. Financ. Res. 2019, 11, 1–18. [Google Scholar] [CrossRef] [Scilit]
- Zhao, S.X.; He, X.Y.; Faxritdinovna, K.U. Does industrial structure changes matter in renewable energy development? Mediating role of green finance development. Renew. Energy 2023, 214, 350–358. [Google Scholar] [CrossRef] [Scilit]
- Li, Z.; Wang, L.; Li, G.; Li, K. Has green finance reform and innovation pilot zone policy improved new quality productive forces? Quasi-natural experiment based on green finance reform and the innovation pilot zone. Sustainability 2025, 17, 3271. [Google Scholar] [CrossRef] [Scilit]
- Yu, D.S.; Li, X.P.; Yu, J.J.; Li, H. The impact of the spatial agglomeration of foreign direct investment on green total factor productivity of Chinese cities. J. Environ. Manag. 2021, 290, 112666. [Google Scholar] [CrossRef] [Scilit] [PubMed]
- Mao, X.M.; Wang, R.Z. Green finance and new quality productive forces: Promotion or inhibition? From the perspectives of technological innovation and environmental concern. J. Shanghai Univ. Financ. Econ. 2024, 26, 30–45. [Google Scholar] [CrossRef]
- Shen, J.; Fei, M.; Zhang, K.Y. Spatial impacts and role mechanisms of green finance on new quality productivity: The case of Beijing-Tianjin-Hebei Urban Agglomeration. J. Hebei Univ. Technol. 2024, 16, 22–35. [Google Scholar] [CrossRef]
- Wang, B. The internal logic and practical path of green finance empowering new quality productivity. Guizhou Soc. Sci. 2024, 416, 134–140. [Google Scholar] [CrossRef]
- Zhu, Z.W.; Hua, Q.; Xu, S.; Lin, W.W. The mechanism of green finance in promoting China’s new quality productive forces: Technological innovation and data factor. Res. Int. Bus. Financ. 2025, 79, 103038. [Google Scholar] [CrossRef] [Scilit]
- Xie, D.J.; Hu, S.H.; Bao, Y.X. Can green finance improve the green total factor productivity of Chinese cities: Evidence from 285 cities in China. J. Chin. Univ. Geosci. 2023, 23, 122–137. [Google Scholar] [CrossRef]
- Yu, B. Research on green financial institutional openness to enable high-quality development: Institutional mechanisms and innovative paths. Nanjing Soc. Sci. 2025, 6, 56–64. [Google Scholar] [CrossRef]
- Dong, Q.Q. Measurement, spatiotemporal evolution, and convergence research on the development level of China’s new quality productivity. Soft Sci. Chin. 2024, 8, 179–188. [Google Scholar]
- Sun, L.W.; Guo, J.H. Construction and empirical measurement of evaluation index system for new quality productivity. Stat. Decis. 2024, 9, 5–11. [Google Scholar] [CrossRef]
- Wang, N.; Liu, H.W.; Gong, Y.R. Measurement, dynamic evolution, and spatiotemporal convergence characteristics of the development level of new quality productivity. Stat. Decis. 2024, 18, 103–108. [Google Scholar] [CrossRef]
- Zhu, F.X.; Li, R.X.; Xu, X.L.; Sun, J.C. Construction and spatiotemporal evolution of China’s new quality productivity indicators. Ind. Technol. Econ. 2024, 43, 44–53. [Google Scholar] [CrossRef]
- Han, J.H.; Fu, H.J.; Jiang, B. The spatiotemporal pattern evolution and obstacle factors of new productive forces in the Yangtze River Delta Urban Agglomeration. World Surv. Res. 2024, 12, 44–59. [Google Scholar] [CrossRef]
- Luo, J.H. Research on the impact of marketization of data elements on new quality productivity. Soc. Sci. Front 2025, 6, 262–268. [Google Scholar]
- Wang, W.B.; Wang, X.Y.; Yang, H. Impact of pilot policies for innovative cities on the formation of new quality productivity. Soft Sci. 2025, 39, 23–30. [Google Scholar] [CrossRef]
- Miao, S.F.; Hu, Y.Y. Measurement of new quality productivity development level and factor identification of obstacle factors based on the analysis of provincial panel data in China. Sustainability 2025, 17, 1758. [Google Scholar] [CrossRef] [Scilit]
- Sun, Y.N.; Liu, Y.W.; Fu, N.H.; Zhu, L.Y. The growth patterns, regional disparity, and coordinated development of China’s new quality productive forces. J. Financ. Econ. 2024, 50, 4–18. [Google Scholar] [CrossRef]
- Wu, J.F.; Wan, X.Y. Measurement, regional difference and dynamic evolution of the development level of China’s new quality productive forces. J. Technol. Econ. 2024, 43, 1–14. [Google Scholar] [CrossRef]
- Du, L.; Sun, Q.F.; Sun, R.F. Green finance empowers new quality productivity: A three-dimensional analytical framework. Soc. Sci. Front 2024, 10, 88–98. [Google Scholar]
- Shi, X.T. The theoretical logic and implementation path of green finance empowering new quality productivity. Res. Financ. Accoun. 2024, 10, 63–74. [Google Scholar]
- Xie, M.; Liu, M.L. Research on the impact of green financial policies on the development of new quality productive forces. Res. Dev. 2024, 6, 140–150. [Google Scholar] [CrossRef]
- Peng, S.Y.; Wang, K. Research on the impact of green finance on the new quality productivity of enterprises: A quasi natural experiment based on the national green finance reform and innovation pilot zone. Financ. Theor. Prac. 2025, 1, 53–64. [Google Scholar]
- Wu, C.S.; Yin, W.X. The impact of fintech and green finance on new quality productive forces in Yangtze River Delta from the perspective of synergy. J. Soochow Univ. 2025, 1, 19–32. [Google Scholar] [CrossRef]
- Wang, L.P.; Xu, J.H.; Li, C. The mechanism and stage evolution of promoting enterprise innovation through green finance policies. Soft Sci. 2021, 35, 81–87. [Google Scholar] [CrossRef]
- Ding, P.; Jin, W.H.; Chen, N. Green finance development, industrial structure upgrading and sustainable economic growth. S. Financ. 2021, 2, 13–24. [Google Scholar]
- Pan, X.Y.; Gao, D.W.; Chen, Y.F.; Chen, J.; Guo, B. Research on the configuration path of innovative talents driving urban new quality productive forces. Innov. Sci. Technol. 2024, 24, 1–11. [Google Scholar] [CrossRef]
- Yao, D.J.; Zhang, Y.; Hu, J.Z.; Fan, K. Effect of coupling and coordinated development of green finance and fintech on corporate risk-taking: Evidence from China. Financ. Res. Lett. 2025, 85, 107912. [Google Scholar] [CrossRef] [Scilit]
- Chen, W.; Arn, G.; Song, H.; Xie, Y. The influences of digital finance on green technological innovation in China’s manufacturing sector: The threshold effects of ESG performance. J. Clean. Prod. 2024, 467, 142953. [Google Scholar] [CrossRef] [Scilit]
- Lyu, Y.W.; Xiao, X.; Zhang, J.N. Green finance policy and corporate carbon emissions: Advancing corporate sustainability. Humanit. Soc. Sci. Commun. 2025, 12, 1143. [Google Scholar] [CrossRef] [Scilit]
- Zhou, X.X.; Jia, M.Y.; Zhao, X. An empirical study and evolutionary game analysis of green finance promoting enterprise green technology innovation. Chin. Ind. Econ. 2023, 6, 43–61. [Google Scholar] [CrossRef]
- Guo, J.J.; Fang, Y. Green credit, financing structure and corporate environmental investment. World Econ. 2022, 8, 57–80. [Google Scholar] [CrossRef]
- He, L.Y.; Zhang, L.H.; Zhong, Z.Q.; Wang, D.Q.; Wang, F. Green credit, renewable energy investment and green economy development: Empirical analysis based on 150 listed companies of China. J. Clean. Prod. 2019, 208, 363–372. [Google Scholar] [CrossRef] [Scilit]
- Si, L.J.; Cao, H.Y. Does green credit policies improve corporate environmental social responsibility—The perspective of external constraints and internal concerns. Chin. Ind. Econ. 2022, 4, 137–155. [Google Scholar] [CrossRef]
- Taghizadeh-Hesary, F.; Yoshino, N. The way to induce private participation in green finance and investment. Financ. Res. Lett. 2019, 31, 98–103. [Google Scholar] [CrossRef] [Scilit]
- Li, H.Y. New quality productivity, industrial synergy agglomeration and urban economic resilience. Mod. Manag. 2024, 6, 35–43. [Google Scholar] [CrossRef]
- Solangi, Y.A.; Alyamani, R.; Asghar, M.; Ali, S.; Magazzino, C. The impact of social investment and green finance on sustainable development: Evidence from emerging market economies. Sustain. Dev. 2025, 33, 4366–4379. [Google Scholar] [CrossRef] [Scilit]
- Huang, J.Q.; Zheng, K.C.; Han, C.S. Green finance and enterprise green innovation: Incentive effect and synergy perspective. Environ. Dev. Sustain. 2024, 26, 28107–28129. [Google Scholar] [CrossRef] [Scilit]
- Lei, X.; Zhang, C.K. Green finance policy, new quality productivity, and corporate behavior. J. Ind. Technol. Econ. 2025, 44, 43–52. [Google Scholar] [CrossRef]
- Wang, J.; Wang, R.J. Quality productivity: Index construction and spatiotemporal evolution. J. Xi’an Univ. Financ. Econ. 2024, 37, 31–47. [Google Scholar] [CrossRef]
- Li, Z.C.; Song, Z.Y. Green finance reform and innovation pilot zones: A catalyst for green development efficiency in Chinese cities. J. Clean. Prod. 2025, 525, 146576. [Google Scholar] [CrossRef] [Scilit]
- Ren, Z.Y.; Bo, Y.; Lei, Y.Y. Green financial policy, environmental regulation, and energy use efficiency. Financ. Res. Lett. 2025, 74, 106711. [Google Scholar] [CrossRef] [Scilit]
- Zhong, S.; Zhou, Z.C.; Gao, W. Impact of regional finance reform and innovation policies on green innovation in pilot cities: A quasi-natural experiment. Econ. Anal. Policy 2025, 85, 888–911. [Google Scholar] [CrossRef] [Scilit]
- Zhao, S.F.; Liu, J.W.; Jiang, G.Z. The mechanisms of green finance reform and digital transformation on regional industrial innovation and entrepreneurship: Evidence from a quasi-natural experiment. Financ. Res. Lett. 2025, 85, 107933. [Google Scholar] [CrossRef] [Scilit]
- Lei, H.; Gao, R.Y.; Ning, C.T.; Sun, G.L. Green finance and corporate green innovation. Financ. Res. Lett. 2025, 72, 106577. [Google Scholar] [CrossRef] [Scilit]
- Zhang, H.B.; Chen, Y. The role of new quality productivity in driving China’s green economic growth. Int. Rev. Econ. Financ. 2025, 102, 104315. [Google Scholar] [CrossRef] [Scilit]
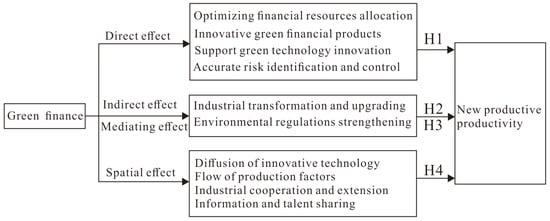
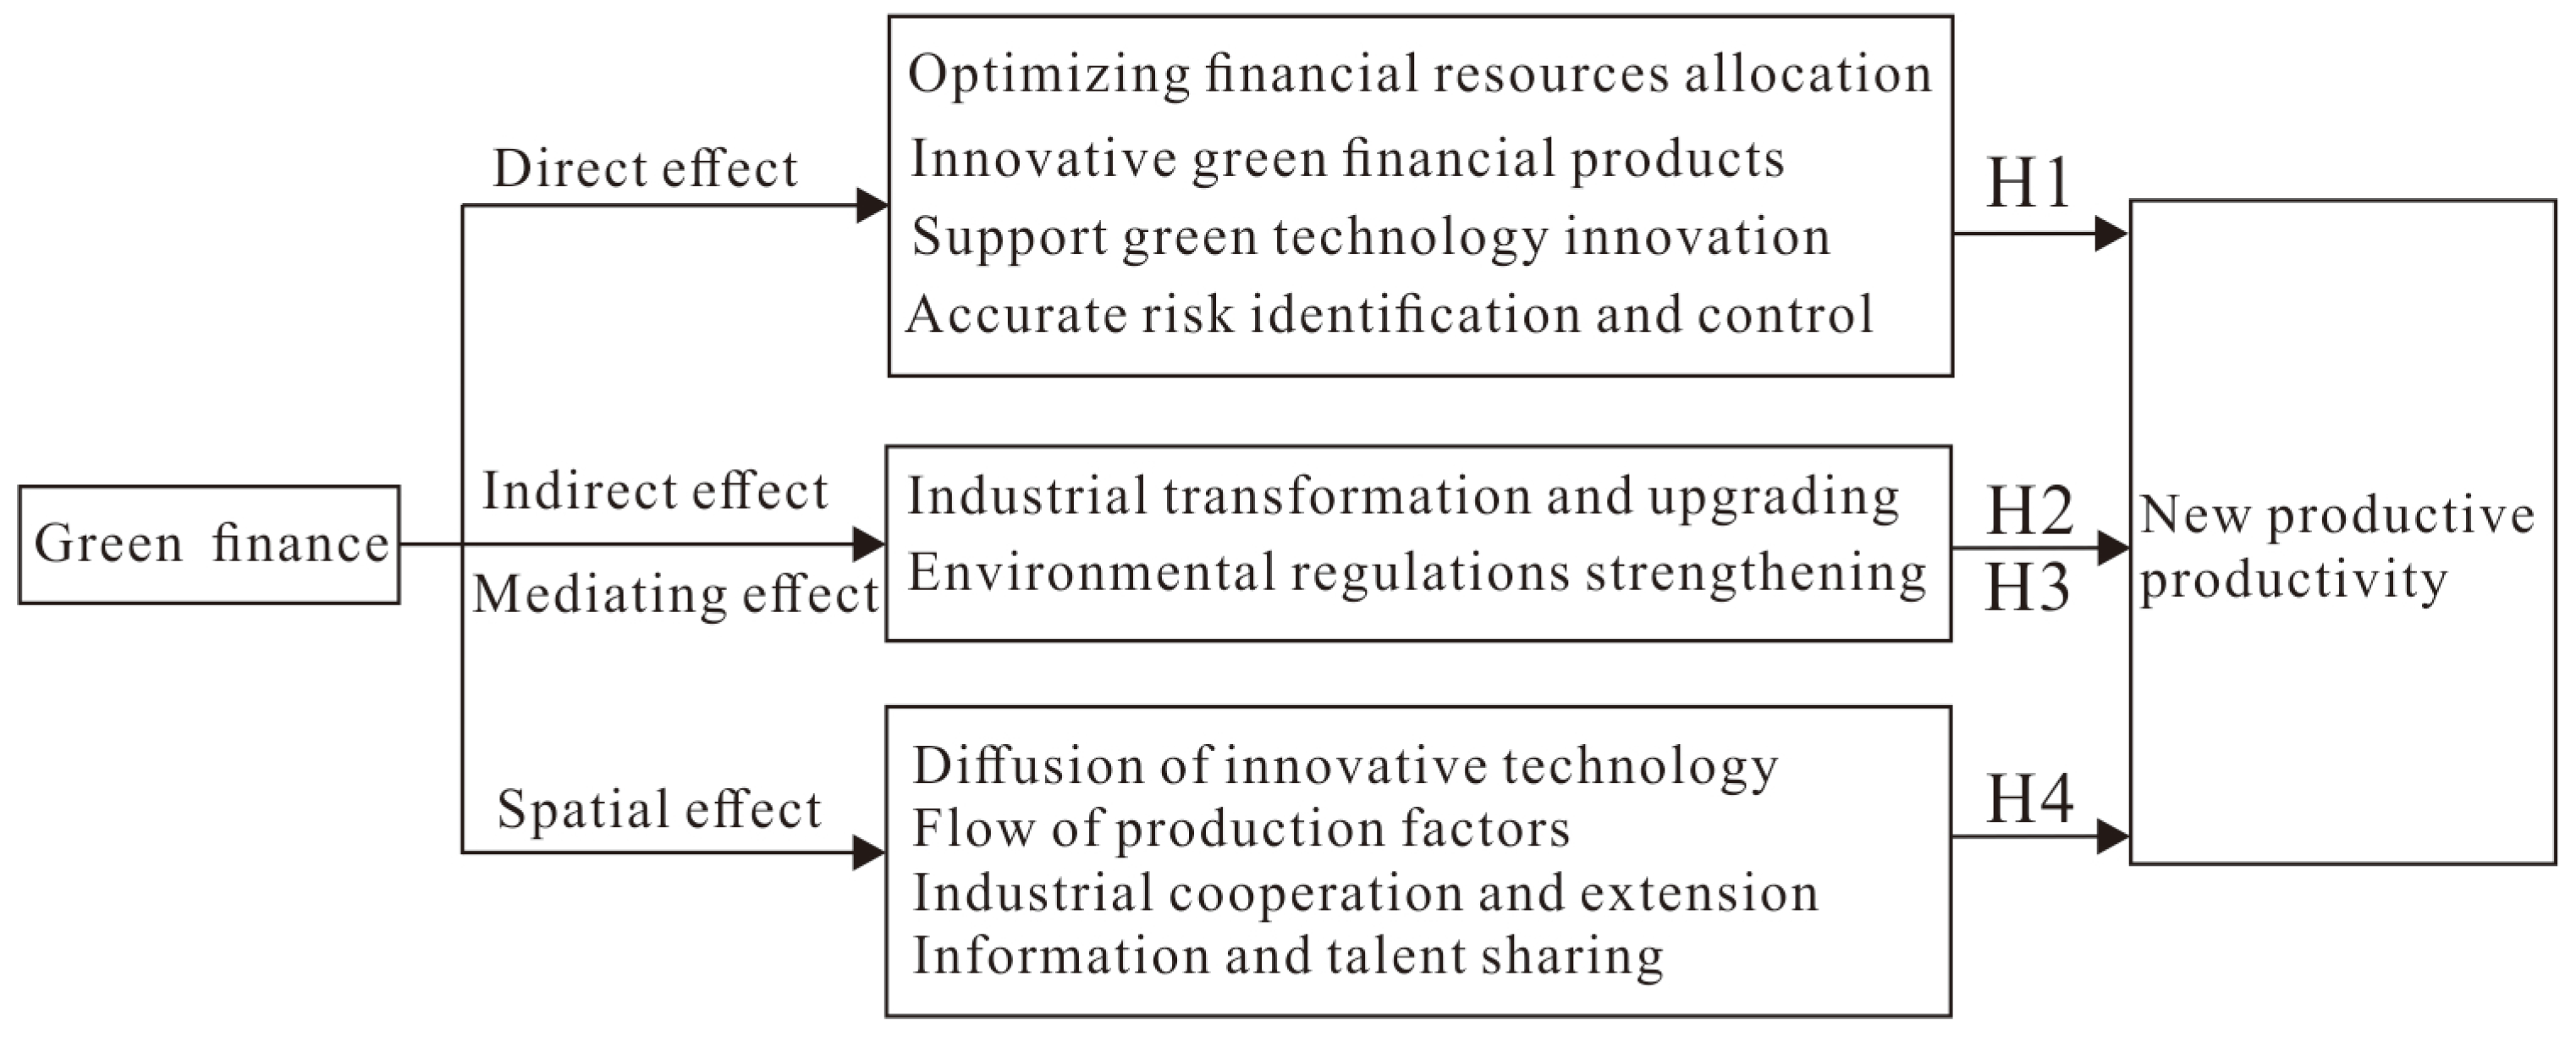
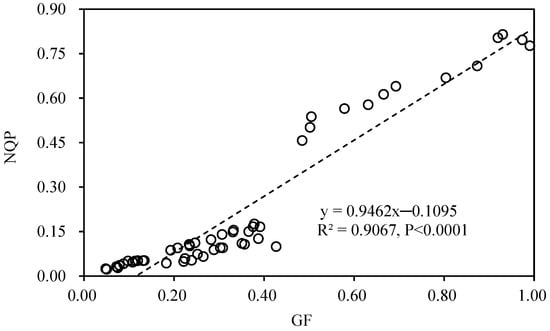
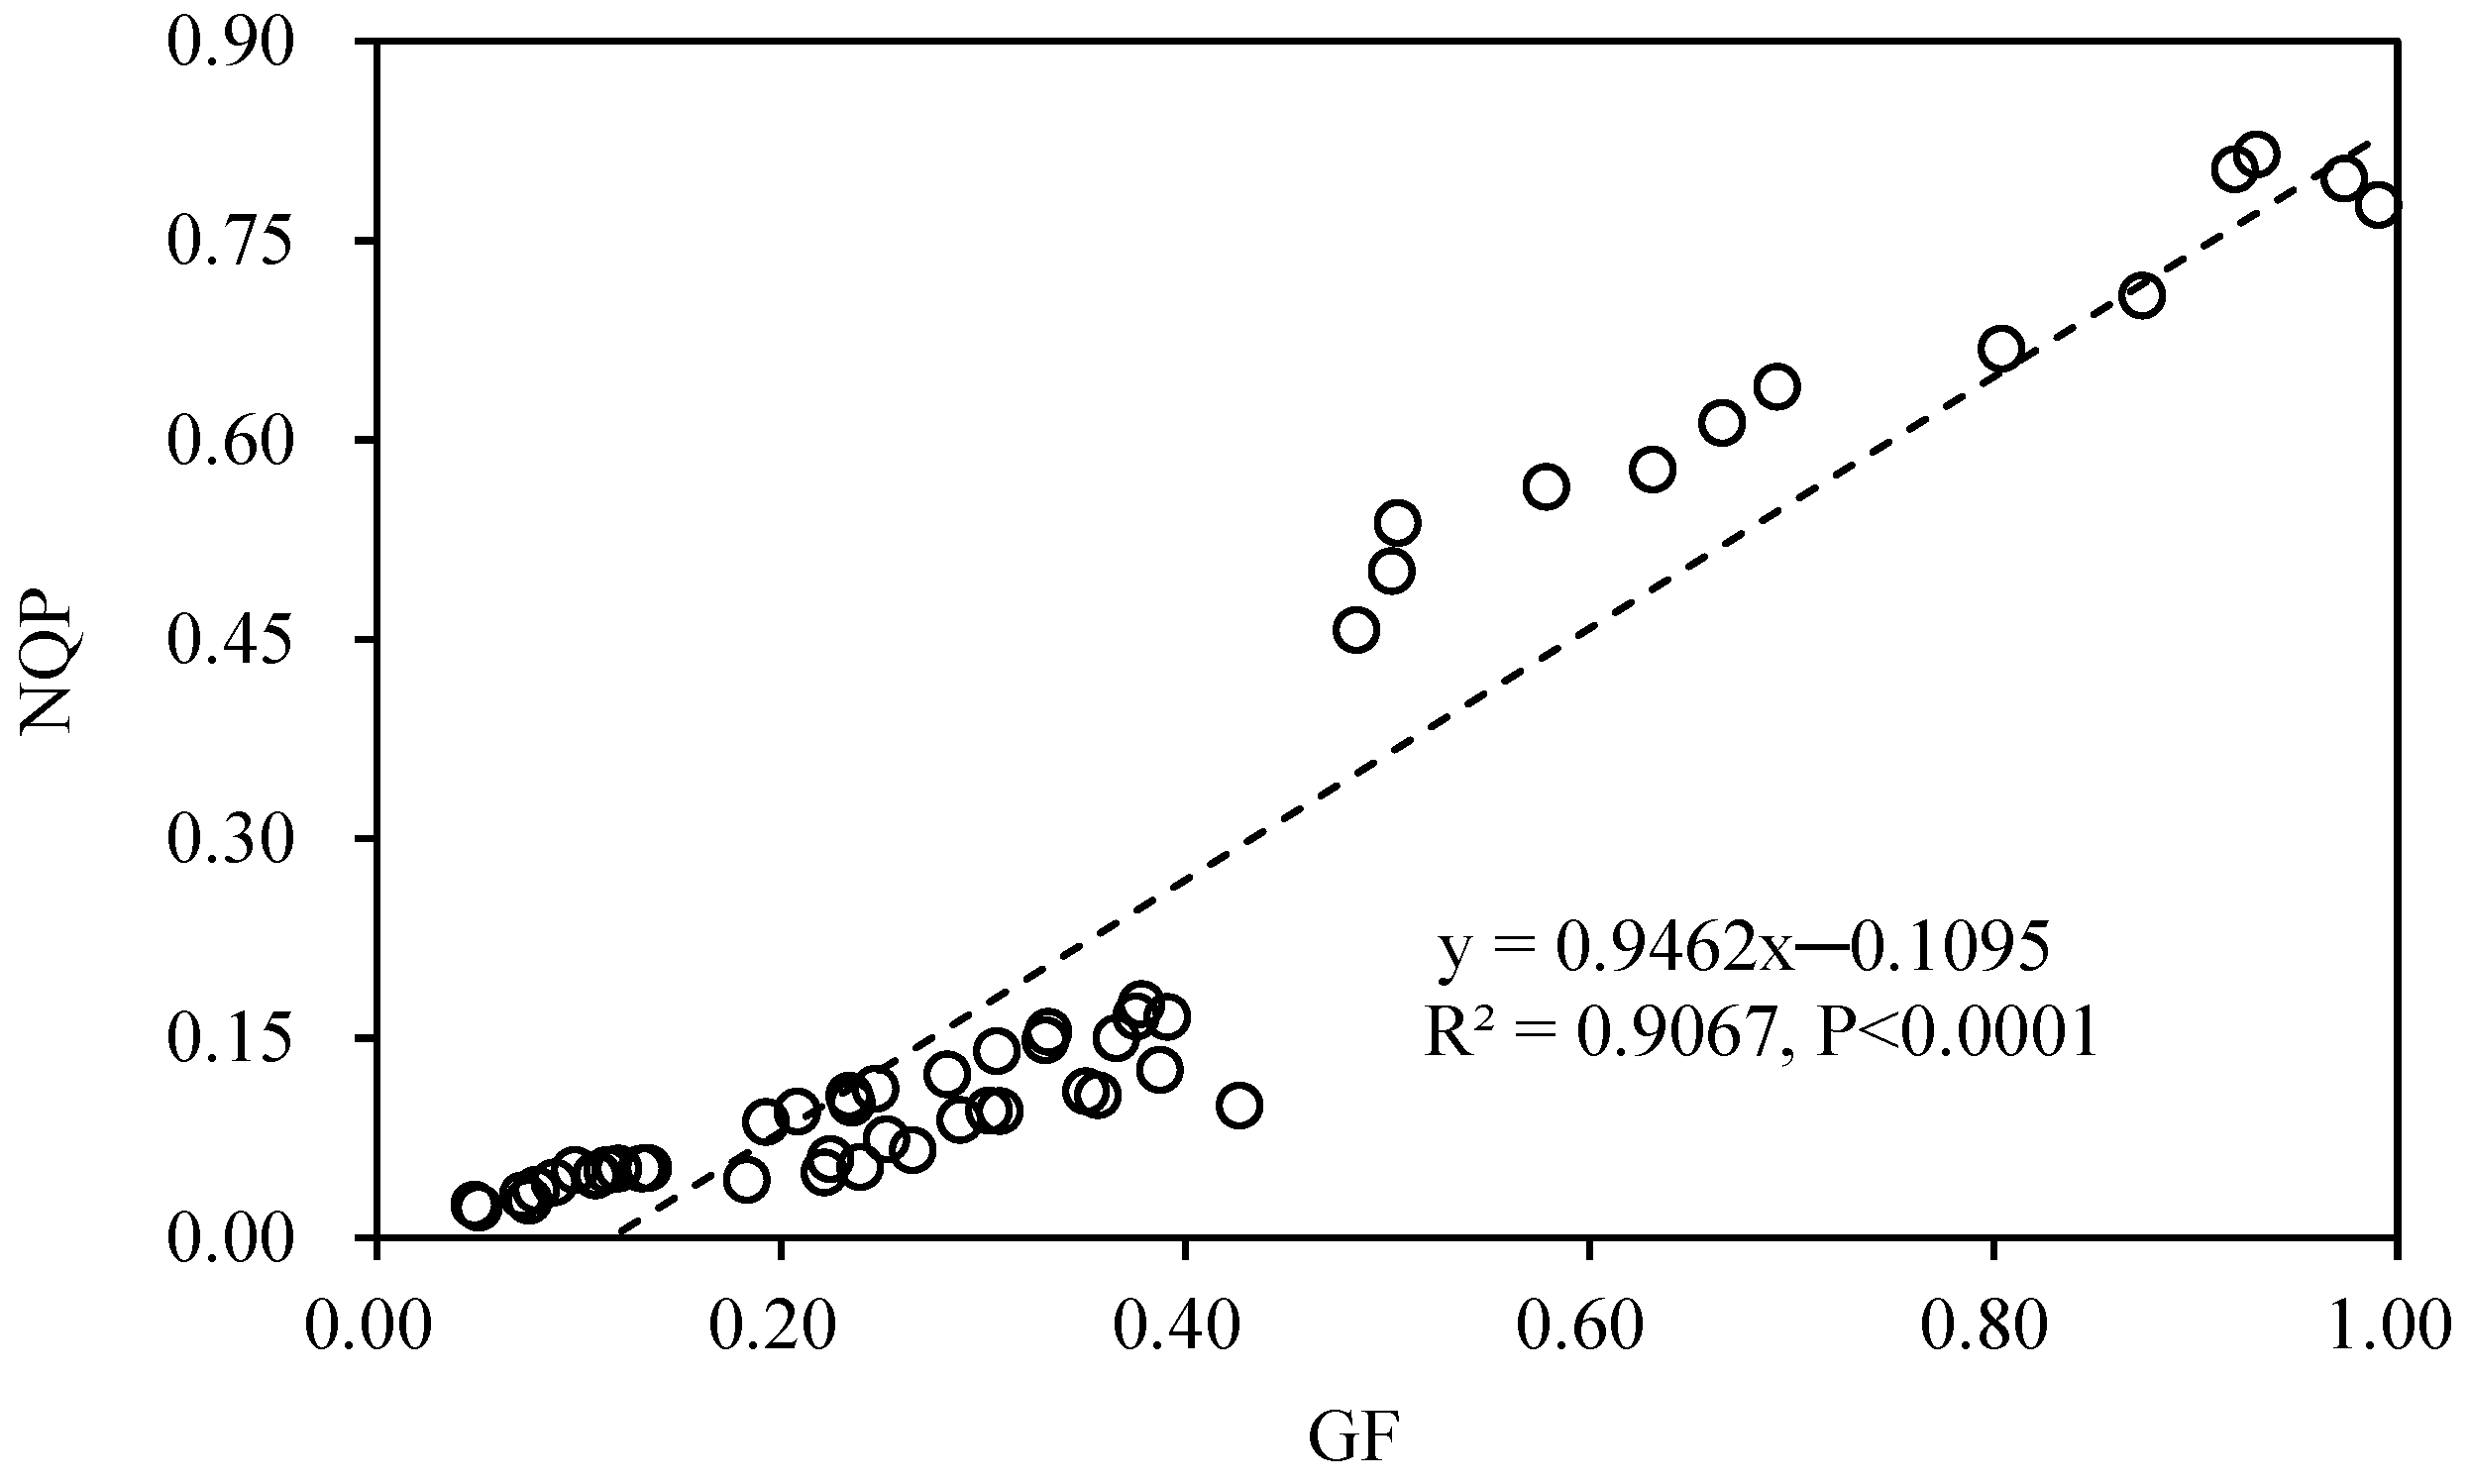
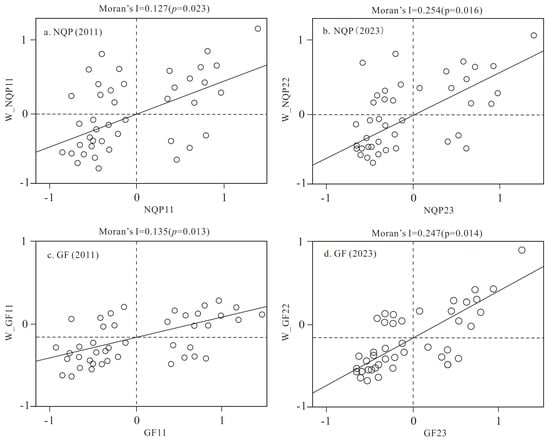

Disclaimer/Publisher’s Note: The statements, opinions and data contained in all publications are solely those of the individual author(s) and contributor(s) and not of MDPI and/or the editor(s). MDPI and/or the editor(s) disclaim responsibility for any injury to people or property resulting from any ideas, methods, instructions or products referred to in the content. |
© 2026 by the authors. Licensee MDPI, Basel, Switzerland. This article is an open access article distributed under the terms and conditions of the Creative Commons Attribution (CC BY) license.