


Abstract
The banking sector serves as a critical transmission belt for capital allocation toward renewable energy (RE) projects, yet traditional equity valuation models fail to capture banks’ exposure to energy transition risks. To bridge this gap, this paper develops a novel fundamental–environmental indicator—the “Green F-Score”—tested on 10 major commercial banks listed on the Warsaw Stock Exchange (WSE) between 2023 and 2025. By synthesizing classical financial efficiency criteria with EU Taxonomy disclosures (Green Asset Ratio), the portfolio sorting methodology reveals how capital markets price sustainable energy financing in Central and Eastern Europe. The empirical results indicate that portfolios with high environmental–fundamental readiness (“Green Leaders”) generate a higher mean annual return of 60.43% and a higher price-to-book (P/B) premium than laggards (15.41%), although inter-group ANOVA differences are not statistically significant (p = 0.215) given the small sample (N = 30). Correlation analysis indicates that the market premium is significantly associated with the ESG sub-score (r = 0.40, p = 0.028), rendering traditional financial metrics an operational hygiene factor. Consequently, the Green F-Score emerges as a promising exploratory tool for institutional investors assessing transition readiness in commercial banks.
1. Introduction
The global climate crisis and the need for deep decarbonisation of the economy have led to a fundamental redefinition of the role of capital markets and financial institutions [1,2]. For decades, the classical paradigm of asset valuation, rooted in Graham and Dodd’s [3] theory of fundamental analysis and the concept of value investing, focused almost exclusively on identifying undervalued companies through the analysis of historical financial ratios (e.g., P/E, P/B, ROA, ROE) and scoring models such as Piotroski’s F-Score [4]. Although these methods effectively helped investors distinguish fundamentally strong entities from companies at risk of falling into a so-called ‘value trap’, their traditional design completely ignored non-financial variables and long-term environmental risks [1,4]. In an era of mounting climate pressure and the drive towards carbon neutrality, this approach has become inadequate [2,5]. The contemporary paradigm of sustainable finance requires market participants to take into account, in their capital allocation processes, not only short-term operational profitability but also the transformative resilience of entities and their exposure to climate risk [1,6].
In this new market landscape, the commercial banking sector acts as a strategic conduit for capital, determining the pace and effectiveness of global and regional energy transition [2,5]. The transition from technologies based on high operating costs (OPEX), characteristic of fossil fuels, towards highly capital-intensive renewable energy projects (CAPEX) means that the availability and cost of capital (Cost of Capital—CoC) become key determinants of the profitability of green investments [5,6]. By shaping their lending policies and financing terms, banks directly influence the redistribution of funds from high-emission sectors towards low- and zero-emission projects [5]. This process is being intensified by growing regulatory pressure within the European Union, including, amongst other things, the EU Taxonomy rules [7], the guidelines of the European Banking Authority [8] and the requirements of the Corporate Sustainability Reporting Directive (CSRD) [9]. These regulations transform climate risk into transition risk, forcing banks to manage their exposure to stranded assets and the market valuation of compensation shortfalls [1,10] whilst building green portfolios [8].
However, a significant research problem emerges at the intersection of energy transition requirements and capital market expectations. On the one hand, institutional investors and regulators expect banks to rapidly scale back financing for coal-related entities and to actively support green energy projects; on the other hand, shareholders are reluctant to forgo high returns on capital (ROA, ROE) and stable interest margins [6,11]. The challenge therefore arises as to whether engagement in ‘green finance’ constitutes a burden for banks that reduces their current profitability (in line with the overinvestment hypothesis), or whether it generates a long-term market premium and mitigates credit risk (in line with stakeholder theory and the concept of good governance) [6,12]. Classical ratio analysis, due to the phenomenon of the ‘tragedy of the horizon’ described by Mark Carney [13], remains blind to these relationships, treating expenditure on ecological transition as an operating cost. To resolve this dilemma, it is necessary to build a bridge linking the principles of traditional value investing (as represented by Piotroski’s model [4]) with the requirements of environmental assessment—that is, to formulate a coherent concept of ‘green value investing’ [1,4].
A critical comparison of the relevant literature reveals two key research gaps in this area [6,12]. Firstly, while classical fundamental scoring models such as Piotroski’s F-Score [4] rely exclusively on historical accounting ratios and omit climate exposure, sustainable finance studies—such as the meta-analysis by Friede et al. [6], the corporate review by Gillan et al. [12], and the ESG-efficient frontier framework by Pedersen et al. [11]—evaluate aggregate ESG ratings separately from quantitative financial statement screens. Consequently, prior work has not tested hybrid investment strategies that combine binary EU Taxonomy criteria with fundamental quality filters [4,6]. Secondly, existing empirical studies on equilibrium green asset pricing (e.g., Pástor et al. [2]; Pedersen et al. [11]) and transition financing (Polzin and Sanders [5]) focus on the developed financial markets of Western Europe or the US, overlooking the emerging markets of Central and Eastern Europe (CEE) [1,5]. The economies of the CEE region, led by Poland, are characterised by a historically high dependence of the energy generation sector on fossil fuels, which exposes their banking systems to exceptionally high transition risk [1,8]. The banking sector listed on the Warsaw Stock Exchange (the WIG-Banki index) provides, in this context, an ideal research environment (proxy) for the entire CEE region. It is the lending policies of these institutions that will determine whether capital is reallocated towards large-scale renewable energy projects or remains tied up in phased-out, high-emission coal assets. An analysis of Polish banks within the strictly defined time frame of 2023–2025 allows us to capture a unique moment of cumulative regulatory pressure—it is during this period that financial institutions were, for the first time, obliged to publish rigorous Green Asset Ratio (GAR) [7].
Bearing in mind the identified gaps, the main objective of this article is to develop and empirically verify an original, 9-point fundamental–environmental indicator, the ‘Green F-Score’ (based on Piotroski’s scoring logic [4]), integrating mandatory EU Taxonomy Green Asset Ratio (GAR) disclosures with core banking efficiency metrics, and to assess the effectiveness of the Green Value Investing strategy in the banking sector in Poland as a CEE case study in the years 2023–2025.
In order to structure the research and address the research question, three main research hypotheses were formulated:
- H1 (Green Transition Premium): The portfolios of banks characterised by a high score on the integrated environmental and fundamental readiness assessment indicator (Green F-Score ≥ 7) are expected to generate a higher average return on shares compared to portfolios with low (Green F-Score ≤ 3) and medium scores.
- H2 (Impact of Market Valuation/P/B Ratio): Banks with a poor Green F-Score (‘laggards’) are hypothesised to exhibit a lower price-to-book (P/B) ratio compared with transformation leaders, reflecting a carbon risk discount priced in by stock market investors [1,6].
- H3 (Dominance of Environmental Factors over Financial Factors): In the context of climate transition in the emerging markets of Central and Eastern Europe (CEE), the environmental and regulatory components of the index (ESG Sub-Score) are expected to exhibit a stronger positive association with banks’ market valuation multiples (measured by the P/B ratio) than classic financial performance indicators (Value Sub-Score), which serve primarily as an operational standard (a hygiene factor).
The remainder of the article is structured as follows: Section 2 (Literature Review) presents a detailed review of the literature on sustainable finance, the role of banks in the energy transition, the evolution of scoring models in value investing, the relationship between ESG and banks’ financial performance (CFP), and the specific nature of transition risk in the CEE region. Section 3 (Materials and Methods) describes the research sample, data sources (including financial databases and manual extraction of EU Taxonomy disclosures from corporate reports), the construction of the Green F-Score indicator, and the portfolio valuation methodology employed. Section 4 (Results) presents descriptive statistics and the empirical results of testing the investment portfolios and market indices developed. Section 5 (Discussion) compares the results obtained with the existing body of research and interprets them from the perspective of investors and financial institutions. Section 6 (Conclusions) summarises the findings, discusses the limitations of the study and sets out directions for future research.
2. Literature Review
2.1. Sustainable Finance and the Role of the Banking Sector in the Energy Transition
The banking sector and financial markets constitute a key mechanism for the allocation of capital to renewable energy sources [14], determining the pace of decarbonisation. The new economic paradigm necessitates a systemic shift away from technologies characterised by high operating costs (OPEX), which are typical of the fossil fuel sector, towards solutions involving high capital expenditure (CAPEX), including renewable energy infrastructure. In this model, the cost of capital (CoC) and the development of green finance determine the pace of decarbonisation and the expansion of renewable energy sources [15,16]. Research indicates that the level of development of the banking sector is positively correlated with the volume of green energy generated. This relationship is particularly significant in the case of technologies other than hydropower (e.g., wind and solar power), which are characterised by higher information acquisition costs and a specific risk profile [17].
The current restructuring of banking portfolios stems from the EU regulatory framework and climate risks [18]. It is estimated that the investment gap in developing Asia alone will reach USD 26 trillion by 2030 [19]. This necessitates the reallocation of capital from high-carbon assets towards low-carbon investments. This process is driven by three main institutional mechanisms:
- Transparency and reporting (including the CSRD): requiring entities to rigorously disclose transition risks and non-financial indicators.
- Asset classification (EU Taxonomy): ensuring strict standardisation of the definition of ‘green’ credit exposures.
- Capital requirements (Basel III): integrating climate risk into capital adequacy assessments. This mechanism encourages banks to increase margins and limit lending to the fossil fuel sector [19,20,21].
The implementation of these regulations transforms climate risk into a tangible financial risk (known as ‘transition risk’). This leads to a drastic variation in the cost of capital (CoC) across European markets, ranging from around 3 per cent in Germany to double-digit figures in countries such as Greece and Hungary [15]. In this process, the division of roles within the financial system becomes crucial. State-owned development banks and public institutions act as investors of last resort, reducing risk (de-risking) and bridging the commercialisation gap for green technologies [22]. Meanwhile, banks in Central and Eastern Europe (CEE) dominate the issuance of green debt for renewable energy [23,24]. In the case of Central and Eastern European (CEE) countries, a region characterised by high and homogeneous carbon risk, active banking intermediation is a prerequisite for the success of the transition. The lack of alternative sources of long-term financing in these markets could effectively slow down the decarbonisation process.
Regulatory uncertainty and a lack of ESG data remain the main challenges [25]. High transaction costs and limitations in the range of green products on offer are hampering the sector’s development [17,26]. The lack of reliable information limits the accuracy of credit risk valuation, leading to the emergence of so-called ‘value traps’. From a fundamental perspective, the carbon risk discount represents a market penalty for exposure to emissions and stranded assets [27,28], providing the theoretical premise for testing whether laggard banks trade at depressed price-to-book (P/B) valuation multiples (Hypothesis H2). Consequently, the close integration of ESG indicators with rigorous fundamental analysis (e.g., through evaluation tools such as the Green F-Score) is evolving towards a new paradigm in modern banking analytics.
2.2. The Evolution of the ‘Value Investing’ Strategy and the Role of Scoring Models in Stock Selection
The ‘value investing’ strategy forms the foundation of classical fundamental analysis, tracing its origins to the work of Graham and Dodd [3]. The original paradigm was based on identifying assets whose intrinsic value significantly exceeded their market valuation [29]. As financial theory has evolved, this approach has transformed into the systematic exploitation of market anomalies, with particular emphasis on the book-to-market ratio (B/M, the inverse of the price-to-book [P/B] ratio used throughout the empirical section of this study). Empirical evidence of a risk premium for value companies over growth companies was explained, amongst other things, by behavioural factors, including investors’ asymmetric response to incoming information [30,31]. From the perspective of quantitative finance, a key milestone was the shift from the analysis of P/E and P/B ratios in banks [32]. and the stability of FSIs [33] to scoring models. This evolution was a response to the risk of a ‘value trap’, in which low valuations reflected a structural deterioration in fundamentals and vulnerability to cyclical shocks.
Quantitative scoring models emerged as a response to the limitations of simple multipliers, amongst which Piotroski’s F-Score model [4] proved to be of groundbreaking significance. This tool was designed to improve the efficiency of stock selection in the segment of companies with a high P/E ratio by dichotomously separating fundamentally strong entities from those at risk of a market discount. The model is based on the aggregation of binary variables describing profitability, liquidity and operational efficiency, correlated with financial stability [29,34,35]. In terms of profitability, the following are assessed: a positive ROA ratio, positive operating cash flow (CFO), the year-on-year change in ROA, and the quality of earnings measured by accounting accruals (the difference between ROA and CFO), which helps eliminate companies with artificially inflated accounting profits. The liquidity and leverage dimension rewards entities that optimise their financing structure, treating a year-on-year increase in long-term debt-to-assets leverage and the issuance of new common shares as negative factors, thereby protecting investors against the risk of capital dilution and insolvency. Conversely, the operational efficiency dimension assesses positive changes in the gross profit margin and the asset turnover ratio.
Despite theoretical assumptions linking a high scoring result (8–9 points) to above-average rates of return [35], empirical evidence suggests that this relationship is not clearly linear. An example is research on the Indonesian market (the JII70 index) from 2019–2021, where, during an economic downturn, none of the entities analysed achieved the maximum F-Score, and the majority were classified as low-performing with a score of ≤3 [35]. Similar anomalies were observed on the Polish market between 2012 and 2022, where companies with low scores historically generated higher rates of return than those with high fundamental ratings, which calls into question the universality of classical scoring systems without adapting them to the specific characteristics of the local capital market [29]. A comprehensive review of the literature [36,37] demonstrates that the F-Score strategy explains the P/B ratio and generates significant risk-adjusted returns in emerging markets, although the specific nature of the banking sector necessitates its exclusion from a universal sample. Scoring signals generate a market premium as a result of investors’ underreaction to financial reporting data [38,39], rather than as compensation for systematic risk. Crucially, Podgórski [36] and Gimeno et al. [40] highlight the evolution of Piotroski’s model towards overcoming the binary rigidity of signals through neural network algorithms and the hybridisation of hard finance with sustainability criteria.
A further limitation on the applicability of universal scoring models is evident in the financial institutions and banking sector. The specific nature of banks’ balance sheet structure, in which the loan portfolio constitutes the primary asset component, means that indicators such as gross margin or asset turnover lose their interpretative value. The use of the classic F-Score in banking faces barriers due to the specific nature of their balance sheets [41], which necessitates the use of dedicated tools [29,42]. From a quantitative analytics perspective, a fundamental shortcoming of models based on historical data (lagging indicators) remains their information lag and high sensitivity to exogenous shocks. In conditions of extreme market volatility—triggered, for example, by the COVID-19 pandemic or geopolitical conflicts—scoring models only register a deterioration in fundamentals after the event, lacking the ability to predict sudden liquidity crises [35].
An equally significant weakness of traditional ratios is their failure to account for non-financial variables, including ESG factors and climate risk. The absence of sustainability parameters in classical ratio analysis exacerbates so-called tail risk, which standard liquidity metrics (e.g., the current ratio) are unable to identify prior to the occurrence of discounting events, such as regulatory restrictions or the impairment of stranded assets. Although the F-Score model demonstrates the ability to generate excess returns under specific market conditions (e.g., 1.35 per cent on the Polish market according to Pilch’s [29] study), it does not constitute a standalone and universal valuation algorithm. Effective portfolio selection in a modern economic environment requires the synthetic integration of quantitative financial models with advanced analysis of non-financial factors, whilst taking local market microstructures into account—an argument that directly motivates Hypothesis H1 regarding the return premium of high Green F-Score portfolios.
2.3. Engagement in ‘Green Projects’ and the Profitability of Banking Institutions—A Review of Positions
The contemporary banking sector is undergoing a strategic transformation, driven by the reorientation of loan portfolios towards projects supporting sustainable development and stability [43]. An analysis of the relationship between ESG factors and financial performance (CFP) points to the growing role of integrating non-financial assessments into fundamental analysis to improve profitability and reduce risk [44]. In this context, a clear theoretical dualism has emerged in the literature, based on stakeholder theory and agency theory. On the one hand, stakeholder theory suggests that inclusive and responsible management creates long-term value for the organisation. On the other hand, the Overinvestment Hypothesis, rooted in agency theory, warns against the inefficient allocation of scarce capital resources to ventures that do not yield direct market rates of return. Empirical evidence points to the non-linear and multidimensional nature of the ESG–CFP relationship, where a moderate level of disclosure and corporate governance most strongly support efficiency [45].
Proponents of the positive impact of ESG on banks’ profitability and valuation put forward arguments based on the Good Management View [46,47,48]. Research on the Polish market [49] and in Europe [50] indicates that ESG engagement shows a positive correlation with rates of return, operational efficiency and the market valuation of banking institutions. These findings are consistent with those of Bussoli et al. [51], who emphasise that sustainable banking fosters the building of trust capital, which constitutes a strategic intangible asset. Empirical analyses in this line of research point to a positive impact of environmental disclosures on return on assets (ROA) and Tobin’s Q, as well as a statistically significant correlation between the environmental component and adjusted return on average assets (ROAA). With regard to the social pillar, Bussoli et al. [51], Gutiérrez-Ponce et al. [52] and Hidayat et al. [53] report an increase in profitability as measured by ROA and ROE, whilst Buallay [50] points to an inverse relationship due to the specific nature of the markets.
From the perspective of agency theory, expenditure on ESG and environmental innovation entails transition costs [54]. Di Tommaso and Thornton [55], in a study of European banks covering the period 2007–2018, demonstrated that high ESG ratings were associated with a decline in the market value of firms, which was attributed to the allocation of capital to projects that did not directly contribute to shareholders’ profits. This phenomenon reveals a significant paradox: commitment to ESG effectively reduces an institution’s risk profile (as reflected in narrower CDS spreads and an increase in the ‘Z-score’, indicating a greater distance from default); however, improved operational stability does not always translate into compensation for the decline in market value for shareholders. It is worth emphasising that the impact of ESG on a bank’s risk and performance is moderated by corporate governance—including the structure of governing bodies and committees [55,56,57].
An in-depth analysis of operational indicators allows for a clearer understanding of the mechanisms underpinning this relationship. Research indicates that ESG ratings associated with green instruments reduce the proportion of non-performing loans (NPLs) and increase profitability [55,58], thereby improving portfolio quality. At the same time, the net interest margin (NIM), which reflects the efficiency of core operations, shows a positive correlation with the profitability of banks that actively report on their social performance [51]. A summary of the key empirical findings is presented in Table 1.
Table 1.
The impact of ESG indicators on banks’ risk profile and market value—a synthesis of empirical evidence.
The impact of ‘green capital’ on the financial performance of banking institutions is therefore a result of the adopted risk and capital management strategy. Involvement in sustainable development projects serves, within the banking system, as an effective instrument for reducing credit and systemic risk, or functions as a costly mechanism for building reputation, the ultimate profitability of which is determined by the effectiveness of corporate governance structures (providing the conceptual foundation for Hypothesis H3 on the relative role of ESG versus traditional financial signals in shaping bank P/B multiples).
2.4. The Specific Nature of Transition Risk and Asset Valuation in High-Emissions Economies of the CEE Region
An analysis of the economies of Central and Eastern Europe (CEE), with particular emphasis on Poland and Hungary, clearly indicates that the energy transition constitutes a structural macroeconomic shock for this region, extending beyond the purely environmental dimension. Traditional risk estimation models used in Western Europe, which are based on retrospective time series, exhibit significant predictive limitations due to their failure to account for the forward-looking nature of carbon allowance price shocks [59]. The specific energy mix of CEE countries results in the economy’s extremely high exposure to transition risk. As indicated by data from Várgedő [59], the greenhouse gas emission intensity in NACE Section D (production and supply of electricity, gas, steam and hot water) stands at as much as 5789.3 g/EUR, whilst in NACE Section E (water supply, sewage and waste management) it reaches 3889.0 g/EUR. By comparison, these figures are several times higher than in other emission-intensive branches of the economy—such as agriculture, forestry and fishing (NACE Section A: 1508.9 g/EUR), transportation and storage (NACE Section H: 1111.7 g/EUR), manufacturing (NACE Section C: 641.2 g/EUR), and mining and quarrying (NACE Section B: 539.7 g/EUR)—and exceed low-emission service industries such as financial and insurance activities (NACE Section K, below 50 g/EUR) by two orders of magnitude [59]. This structure directly determines the mechanisms by which the carbon shock is transmitted to the financial sector.
This transmission occurs via the inter-industry flow matrix, where the initial impulse from the emitting sectors spreads to the remaining sectors of the economy via the Leontief inverse matrix [59]. Key empirical and modelling findings regarding risk transmission include:
- Identification of critical NACE sections: NACE Section D (electricity and gas), NACE Section E (water and waste management), NACE Section A (agriculture), and NACE Section B (mining and quarrying) are characterised by the highest sensitivity to transformational shocks.
- Increase in probability of default (PD): For NACE Sections D and E, the estimated total increase in the PD ratio ranges from 1.5 to 2.3 percentage points compared with the baseline scenario, which Várgedő [59] defines as a counterfactual reference state without an additional carbon price shock (i.e., assuming zero incremental carbon tax or EU ETS allowance price impulse and unchanged input–output production structures).
- Systemic heterogeneity: Credit losses for individual banking institutions may vary by as much as 17 per cent, reflecting divergences in the levels of individual exposure to high-emission sectors.
The valuation of assets exposed to climate risk in high-emission economies requires the extension of the classic capital asset pricing model (CAPM) to include a risk component for rare disasters. According to the theoretical framework proposed by Karydas and Xepapadeas [60], the stochastic probability of climate disasters and policy shocks generates a climate risk premium that accrues over time. This framework allows for an adequate reflection of market volatility even under the assumption of a low degree of risk aversion among investors. Under conditions of optimal equilibrium, defined by the effective internalisation of external costs via a Pigouvian tax, high-emission (‘brown’) assets are excluded from the optimal investment portfolio [60], leading to them becoming fully stranded assets. This stands in stark contrast to myopic investment decision-making, in which the failure to price in externalities results in a structurally misallocated capital.
A synthesis of existing research reveals a significant research gap consisting of a marked divergence between macroeconomic stress tests focused on credit risk [59] and the market valuation of the equity risk premium in the stock market [60]. There is a shortage in the literature of hybrid analytical models that integrate credit risk fundamentals with the market valuation of equities under the specific conditions of CEE markets. This challenge is exacerbated by the ‘tragedy of the horizon’, which means that standard indicators used in value investing do not fully reflect transformational risk due to the temporal mismatch between the horizon of financial analysis and the manifestation of the effects of climate change. The lack of an integrated analytical framework linking these areas prevents an objective assessment of the effectiveness of capital allocation in economies heavily dependent on fossil fuels.
2.5. Research Gap
A review of the relevant literature points to the dynamic development of research into the relationships between environmental, social and corporate governance (ESG) factors and the financial performance of financial institutions (Corporate Financial Performance—CFP). Despite the extensive body of work in this area, an analysis of existing studies reveals two key knowledge and methodological gaps, which this study aims to address.
Firstly, from a methodological perspective, the vast majority of existing studies analyse aggregated ESG ratings or isolated environmental indicators in isolation from a rigorous, quantitative analysis of financial statements. The literature is dominated by an approach that treats ESG variables as independent determinants of a bank’s profitability or risk profile [6,50,55]. However, there is a lack of studies verifying the effectiveness of hybrid investment strategies that combine binary environmental criteria—reflecting a genuine commitment to climate transition (e.g., static levels and dynamic growth of EU Taxonomy-aligned Green Asset Ratios across turnover and CAPEX)—with multi-criteria filters for fundamental quality, such as Piotroski’s classic scoring model [4]. Traditional value investing indicators remain blind to long-term and transformational risks due to the ‘tragedy of the horizon’ phenomenon [13]. Furthermore, the integration of environmental requirements with hard operational indicators has not yet been incorporated into a coherent and rigorous concept of ‘Green Value Investing’.
Secondly, from a contextual and geographical perspective, the vast majority of research on asset valuation that takes climate risk into account focuses on the mature capital markets of Western Europe and the US [2,5,11]. This overlooks the specific characteristics of the emerging economies of Central and Eastern Europe (CEE), including Poland, which are characterised by a historically high dependence of the power generation sector on fossil fuels and bear disproportionately high costs of adapting to EU climate policy (the EU Taxonomy, the CSRD, EBA guidelines) [7,8,9,59]. The banking sector listed on the Warsaw Stock Exchange (WIG-Banki index) acts in this context as the main conduit for capital for decarbonisation. However, the literature lacks empirical tests examining whether stock market investors in the CEE region apply a carbon risk discount to ‘dirty’ banks and whether combining environmental screening with fundamental analysis protects investors from so-called value traps.
The response to these gaps is the development of a proprietary, 9-point ‘Green F-Score’ indicator, which combines criteria for sound financial management with an assessment of commitment to the energy transition. This framework serves to empirically verify market relationships on several levels:
- Green transition premium (Hypothesis H1): This enables us to assess whether the portfolios of banks with the highest levels of integrated environmental and fundamental readiness (Green F-Score ≥ 7) generate a higher average stock return compared to those achieving low (Green F-Score ≤ 3) and average scores.
- Market valuation and carbon risk (Hypothesis H2): This allows an assessment of whether institutions with a low Green F-Score are subject to a market discount due to carbon risk, reflected in lower price-to-book (P/B) ratios.
- The significance of environmental components (Hypothesis H3): This examines whether environmental and regulatory criteria (ESG Sub-Score) exhibit a stronger positive association with banks’ P/B valuation multiples than traditional financial and operational performance indicators (e.g., an improvement in the C/I ratio or a positive ROA, aggregated in the Value Sub-Score).
3. Materials and Methods
The study covered the ten largest commercial banks in Poland, ranked by asset value as at 31 December 2025. The total value of the assets of the banks analysed accounted for 64.18 per cent of the total assets of the banking sector in Poland at the end of 2025, comprising commercial banks, cooperative banks and branches of credit institutions. All the entities analysed are public companies listed on the Warsaw Stock Exchange (WSE). The study utilised data from the banks’ consolidated financial statements, non-financial reports and official stock exchange quotations. The composition of the research sample is presented in Table 2.
Table 2.
Commercial banks included in the research sample, ranked by total assets as at 31 December 2025.
The study period covers the years 2023–2025. The choice of a three-year time horizon stems from objective limitations in the availability and comparability of standardised indicators relating to green assets. Prior to the 2023 reporting year, there were no universally applicable, standardised disclosure indicators for green assets in the European Union’s banking sector. It was only with the full entry into force of the reporting requirements arising from the EU Taxonomy [7] and Commission Delegated Act (EU) 2021/2178 to Article 8 of the Taxonomy that imposed a legal obligation on large credit institutions to publish standardised Green Asset Ratio (GAR) figures and volumes of green assets annually, starting with reports for the year 2023. Since January 2024, around 150 of the largest banks in the European Union have published this ratio as part of their Pillar 3 disclosures, whilst from 2025 the disclosure requirement has been extended to all financial institutions, covering around 2000 smaller banks. Including earlier periods in the analysis would not be justified from a scientific rigour perspective, due to the lack of a uniform measurement methodology and the limited and often incomplete availability of comparable data for all the banks under review.
To determine the subsequent rates of return (t + 1) on the investment portfolios under test, a convention of cyclical rebalancing as at 30 April was adopted. Specifically, the panel of N = 30 bank-year observations spans three annual reporting waves (2023, 2024, and 2025) matched with three subsequent market return windows: (i) for the 2023 reporting wave, a 12-month cycle from 30 April 2024 to 30 April 2025 (365 days); (ii) for the 2024 reporting wave, a 12-month cycle from 30 April 2025 to 30 April 2026 (365 days); and (iii) for the 2025 reporting wave (published by April 2026), the realized holding-period return from 30 April 2026 to 2 October 2026 (155 days, corresponding to the final market data cut-off prior to manuscript submission). For the 2025 wave, unannualized realized returns over the 155-day window were used to avoid artificial extrapolation of partial-year performance, while price-to-book (P/B) ratios were consistently recorded at each 30 April rebalancing date. The date of 30 April was deliberately chosen as the statutory deadline for the publication of annual financial statements and non-financial reports by listed companies in Poland. This approach allows for the full disclosure of EU Taxonomy indicators (including GAR) and fundamental data, which fully safeguards the study against the risk of using information not available at the time of investment decisions (look-ahead bias). Annual returns on shares (t + 1) were measured as the change in closing prices, adjusted for dividends, rights issues and share splits, between successive portfolio rebalancing dates. Returns for each portfolio group in a given year were calculated on the basis of equally weighted portfolios, which prevents the aggregate results from being dominated by entities with the largest market capitalisation. The portfolios were constructed as equally weighted. The value-weighted approach was not used due to the high concentration of market capitalisation in the two largest banks, which could distort the interpretation of the Green F-Score.
As V. Brühl [61] notes, new key performance indicators (KPIs) enable financial institutions to assess the share of sustainable business activities in relation to their total economic activity [61]. One of the key indicators used to assess the extent of banks’ involvement in financing activities compliant with the EU taxonomy is the Green Asset Ratio (GAR). It determines the proportion of assets financing activities that meet the criteria of the EU taxonomy within the value of assets included in the calculation of this ratio. The GAR thus makes it possible to determine what proportion of a bank’s assets is linked to the financing of activities that meet specific environmental criteria.
The calculation of the ratio takes into account specific types of exposure, in particular, loans and advances, debt securities and equity instruments held in the banking book. The calculation of the GAR takes into account exposures to specific categories of entities. These primarily include financial and non-financial enterprises meeting the criteria set out in the regulations on non-financial disclosures, as well as households in respect of loans relating to residential property, building renovation and motor vehicle financing. The calculation also includes exposures to local government bodies, relating, amongst other things, to the financing of social housing and other forms of specialised financing. Exposures arising from repossessed residential and commercial property may also be taken into account.
The denominator of the GAR essentially comprises assets to be included in the calculation, excluding exposures to central government, central banks and supranational issuers, as well as exposures classified in the trading book. This structure of the ratio allows the value of assets compliant with the EU taxonomy to be related to the bank’s appropriately defined pool of assets.
The GAR is calculated on the basis of the prudential scope of consolidation, determined in accordance with the provisions of Regulation (EU) No 575/2013 of the European Parliament and of the Council of 26 June 2013 on prudential requirements for credit institutions. The adoption of a uniform scope of consolidation and specific rules for the classification of exposures is intended to ensure the comparability of the reported GAR figures across different institutions.
It is worth noting that, when calculating the GAR for exposures to non-financial corporations, banks weight their exposures using their counterparties’ KPIs, which results in the derivation of a turnover-based GAR (Turnover-based GAR), which measures the current level of sustainability of financed revenues, and a GAR based on capital expenditure (CapEx-based GAR), reflecting the extent to which the bank supports its clients’ investments aimed at environmental transformation. At the same time, reporting standards require the disclosure of GARs in two time dimensions: from a stock perspective, which presents a static picture of the proportion of sustainable assets in the balance sheet portfolio as at a specific reporting date, and from a flow (flow perspective), which measures the change in balance sheet positions over a given reporting period (e.g., the gross value of new loans granted over the past year), enabling investors and supervisory authorities to assess the dynamics of new capital allocation and the actual direction of the bank’s portfolio transformation over time [61].
In order to provide a comprehensive assessment of the overall pace of the green transition of the commercial banks analysed, as well as their fundamental health, individual binary signals were aggregated into a single proprietary scoring indicator, the Green F-Score. Drawing inspiration from Joseph Piotroski’s [4] pioneering methodology—in which the summation of dichotomous financial indicators allows for the elimination of information noise and the mitigation of the impact of outliers—a hybrid measure was developed. This aggregation enables the transformation of a multidimensional set of reporting data and EU Taxonomy disclosures into a coherent, dichotomous scoring scale, which serves to identify entities capable of generating a premium in their stock market valuation.
The total value of the indicator for a given bank i (i = 1,…,10) in reporting year t (t ∈ {2023,2024,2025}) is the simple sum of the nine binary signals obtained and takes discrete values ranging from 0 to 9:
where i indexes the individual commercial bank, t denotes the reporting year, and Fk,i,t ∈ {0,1} represents the k-th binary signal (k = 1,…,9). To distinguish the thematic modules while maintaining notational consistency with Equation (1), the first six signals form the environmental module (), subdivided into three turnover-based signals (F1 ≡ G1, F2 ≡ G2, F3 ≡ G3) and three CAPEX-based signals (F4 ≡ E1, F5 ≡ E2, F6 ≡ E3), whereas the final three signals form the financial efficiency module (, where F7 ≡ FM1, F8 ≡ FM2, F9 ≡ FM3).
The construction of the Green F-Score took into account selected environmental metrics, reflecting the level of banks’ involvement in financing activities that comply with environmental criteria, as well as selected economic metrics belonging to the group of performance indicators. The environmental metrics have been divided into two groups: those based on turnover and those based on capital expenditure (CAPEX). The methodology for calculating the Green F-Score is set out below.
Environmental indicators (6 points)
A. Turnover-based metrics:
- GAR Turnover (%)
B. CAPEX-based metrics:
- GAR CAPEX (%)
The selection of just three hard financial indicators from Piotroski’s original model [4] was dictated by the need to rigorously adapt the methodology to the specific nature of the banking sector’s balance sheet. Classical measures, such as gross profit margin or asset turnover ratio, lose their interpretative value in the case of credit institutions. For this reason, the traditional component includes only those measures that universally reflect the quality of the portfolio, liquidity and cost discipline of the bank, comprising the following financial ratios (3 points):
- ROA (%)—Return on Assets
To facilitate comparison across all specifications and clarify the relationship between the index Fk,i,t in Equation (1) and the module notations, Equations (2)–(10) are summarised in Table 3.
Table 3.
Summary of the Green F-Score binary specifications and scoring rules across reporting periods.
Given that 2023 was the first year of mandatory and standardised disclosures on sustainable assets under Article 8 of the EU Taxonomy, 2023 was adopted as the baseline year in the study. However, when estimating ratios based on year-on-year (y/y) changes, a limitation was encountered due to the lack of standardised data for the previous year (2022). To avoid excluding the first full reporting year from the study sample and to prevent data truncation, a differentiated point estimation mechanism was implemented for the five indicators based on growth rates:
- F2,i,t (G2: GAR Turnover %—year-on-year growth).
- F3,i,t (G3: Total Sustainable Assets Turnover—year-on-year volume growth).
- F5,i,t (E2: GAR CAPEX %—year-on-year growth).
- F6,i,t (E3: Total Sustainable Assets CAPEX—year-on-year growth in volume).
- F9,i,t (FM3: C/I Ratio %—year-on-year improvement).
For the 2023 reporting year, a relative method was applied, involving a comparison of the bank’s individual result with the arithmetic mean for the entire sector in the year under review. One point was awarded where the absolute value of the metric (e.g., the volume of green assets or the GAR) for a given bank exceeded the sector average in 2023, whilst 0 points were awarded where the result was below or equal to that average. This approach rewarded entities which, even at the initial stage of ESG reporting, demonstrated the highest level of environmental commitment and operational efficiency compared with their competitors.
In subsequent years of the study (2024–2025), subject to the availability of data from previous years, for indicators G2, G3, E2, E3 and FM3 (F9), the analysis reverted to measuring standard, historical periodic changes within a given entity (t relative to t − 1), in accordance with the model’s basic assumptions. This differentiation made it possible to retain the full panel of 30 observations without compromising the rigour of the quantitative analysis of rates of return. Importantly, to verify the robustness of the mechanism constructed in 2023 with regard to the final results of the portfolio classification, an additional sensitivity analysis was carried out. Excluding the base year 2023 from the model and calculating rates of return solely for the strictly homogeneous years 2024–2025 (N = 20, where all dynamic signals are computed purely year-on-year) generated consistent allocation vectors and preserved the monotonic hierarchy of returns and valuations: ‘Green Leaders’ (n = 11, mean F-Score = 7.82) recorded a mean return of 56.76% and a mean P/B ratio of 1.69, outperforming both the ‘Neutral Portfolio’ (n = 7, mean F-Score = 5.43, mean return = 27.42%, mean P/B = 1.36) and ‘Green Laggards’ (n = 2, mean F-Score = 1.50, mean return = 20.18%, mean P/B = 0.71). However, because this restricted two-year subsample comprises only N = 20 observations in total and contains just n = 2 observations in the ‘Green Laggards’ category, it is strictly descriptive in nature and cannot support standalone inferential claims, serving solely as a qualitative consistency check that the 2023 cross-sectional benchmarking rule does not artificially drive the portfolio hierarchy.
4. Results
Section four presents the results of the empirical verification of the effectiveness of the Green Value Investing strategy. The assessment of the market effects of implementing climate transition was carried out on the basis of the proprietary Green F-Score model. The analysis is based on a panel of 30 observations (data for 10 selected commercial banks from the WIG-Banki index for the period 2023–2025). The results are presented in three areas: an assessment of the market premium for leaders (H1), an analysis of the carbon risk discount on the valuation ratio (H2), and the distribution of the explanatory power of individual ESG and financial components (H3).
4.1. Descriptive Statistics and Results of the Baseline Scenario (Portfolio Sorting)
In the first stage of the study, based on the classical portfolio analysis methodology, the sample was divided into three distinct groups according to the total value of the Green F-Score obtained. The aggregation results and market measures for individual portfolios are summarised in Table 4.
Table 4.
Classification of market portfolios by Green F-Score—baseline variant.
The results of the baseline scenario (division into three groups) clearly suggest a strong relationship between the integrated transformational capability index and earnings per share. The largest group was the ‘Green Leaders’ (n = 14, mean F-Score = 7.93), who generated an exceptionally high average rate of return of 60.43% (t + 1) during the period analysed. The “Neutral Portfolio” (n = 9) achieved average returns of 26.66%, whilst the “Green Laggards” (n = 7, average F-Score = 2.14) were characterised by the lowest rate of return at 15.41%. This variation is clearly visible in Figure 1.
Figure 1.
Average rate of return by portfolio—baseline scenario.
An analysis of variance (ANOVA) revealed that, given the limited sample size typical for this sectoral index (N = 30), the differences in mean rates of return between groups did not reach statistical significance at the conventional level (F2,27 = 1.630, p = 0.215). A formal post-hoc power analysis (N = 30, k = 3, α = 0.05) confirms that the grouped ANOVA design is statistically underpowered: at a conventional medium effect size (Cohen’s f = 0.25), statistical power is only 19.5%, while at the empirically observed return effect size (η2 = 0.108, corresponding to Cohen’s f = 0.347), post-hoc power reaches 34.5% (i.e., within the 30–40% range, well below the standard 80% threshold). Nevertheless, the monotonically directional pattern of the results, supported by η2 = 0.108 (meaning 10.8% of the variance in stock returns is explained by Green F-Score portfolio membership), indicates an economically meaningful spread that provides directional, exploratory support for Hypothesis H1. To verify that this monotonic hierarchy (Leaders > Neutral > Laggards) is not driven by extreme return observations (such as PKO BP’s >200% returns), two outlier-robustness checks were performed (Table 4): first, winsorizing returns at the 5th and 95th percentiles (−4.69% and 203.47%, or k = 1 tail observation at −9.50% and 206.06%) preserves the strict monotonic ordering of mean returns at 58.72% (59.09% for k = 1 tail winsorization) for ‘Green Leaders’, 26.66% for the ‘Neutral Portfolio’, and 19.68% (18.31%) for ‘Green Laggards’ (and even under more stringent 10%/90% winsorization capping all three PKO BP observations, the hierarchy holds at 33.59% > 26.66% > 21.82%); second, non-parametric portfolio medians confirm the exact same ordering for both returns (22.10% > 21.79% > 17.02%) and P/B multiples (1.72 > 1.21 > 1.11). This phenomenon is further corroborated by an analysis of market valuation multiples (P/B), where the ANOVA test shows marginal statistical significance at the 10% level (F2,27 = 2.527, p = 0.099, η2 = 0.158, with post-hoc statistical power of 50.6% at Cohen’s f = 0.433), which provides weak/marginal directional support for Hypothesis H2.
Furthermore, to verify that the ‘Green Leaders’ portfolio consists of genuine absolute drivers of the sector’s green transition—rather than financially efficient laggards qualifying merely due to high percentage growth rates from a tiny initial green portfolio (the ‘low-base effect’)—Table 5 reports descriptive statistics of the underlying environmental disclosures across the three portfolios. First, since the Value Sub-Score cannot exceed 3 points, qualifying as a ‘Green Leader’ (F-Score ≥ 7) strictly requires scoring at least 4 out of 6 points in the ESG Sub-Score. Empirically, the mean Value Sub-Score is nearly identical across groups (2.07 for Leaders, 2.22 for Neutral, and 2.00 for Laggards), whereas the mean ESG Sub-Score rises sharply from 0.14 (Laggards) to 5.86 (Leaders). Second, 13 of the 14 observations in the ‘Green Leaders’ group scored points on both static level indicators (G1 = 1 and E1 = 1, exceeding the sectoral median in both GAR Turnover and GAR CAPEX; the sole relative-threshold exception, BNP Paribas PL in 2025, and the sole absolute-volume exception, BOŚ Bank in 2025, are detailed in the note to Table 5 and Table 7). ‘Green Leaders’ hold an average sustainable asset volume of 3726.62 PLN million (turnover) and 4146.86 PLN million (CAPEX)—over 25 times and 17 times larger, respectively, than ‘Green Laggards’ (147.73 PLN million and 233.69 PLN million). One-way ANOVA confirms that inter-portfolio differences in both relative GAR shares (p = 0.0021 for Turnover; p = 0.0010 for CAPEX) and absolute sustainable asset volumes (p = 0.0057 for Turnover; p = 0.0190 for CAPEX) are highly statistically significant (p < 0.02).
Table 5.
Descriptive statistics of static GAR shares, absolute green asset volumes, and balance sheet size across Green F-Score portfolios (N = 30).
4.2. Results of the Additional Variant—Using the Median
In order to check the robustness of the results against the effects of a small sample size and asymmetric distributions of the characteristic in the 3-portfolio model, the study was supplemented with an additional variant—a dichotomous one (divided according to the median of the index, which in the sample under study was exactly 6.0 points). The results of the median variant are presented in Table 6.
Table 6.
Classification of market portfolios by Green F-Score—additional variant.
The median approach confirms the conclusions drawn from the baseline scenario. Banks classified in the group above the market median (n = 19) generated returns of 52.02% with a P/B ratio of 1.53. In the group below the median (n = 11), rates of return fell by more than half (to 18.67%), whilst the market valuation was noticeably lower (P/B = 1.24). This variation is clearly visible in Figure 2.
Figure 2.
Average rate of return by portfolio—additional variant.
Although Student’s t-test for independent samples again does not reach conventional statistical significance due to the small sample size (t(28) = 1.465, p = 0.153 for rates of return; and t(28) = 1.356, p = 0.185 for the P/B ratio), the consistent directional asymmetry of the observed group means aligns with the baseline three-portfolio sorting, providing supplementary exploratory evidence of an economic spread. To ensure full research transparency and enable an in-depth verification of the structure of the results, Table 7 presents the complete, disaggregated raw dataset for all commercial banks under study across the full 2023–2025 period. This table shows the precise distribution of sub-module scores (ESG Sub-Score and Value Sub-Score) together with their associated annual rates of return and P/B valuation multiples.
Table 7.
Summary of raw results from the Green F-Score model and market parameters for individual commercial banks (2023–2025).
4.3. Equivalence of the Decision-Making Power of the Model’s Components
The analytical process culminated in the decomposition of the Green F-Score and an examination of the isolated impact of its dimensions (ESG variables relative to traditional value variables). To this end, a Pearson’s r correlation analysis was carried out. The test results further support the validity of the methodology employed.
The correlation between bank market valuation multiples (measured by the P/B ratio) and the results obtained exclusively from the 6-point ‘ESG Sub-Score’ module was r = 0.40, which is statistically significant at the 5% level (t = 2.311, p = 0.0284; Spearman’s rank correlation ρ = 0.42, p = 0.0216). By contrast, the correlation between the P/B ratio and the isolated ‘Value Sub-Score’ component (classic operational efficiency parameters, including ROA, CFO, and the C/I cost ratio) was a mere r = 0.07 and proved to be statistically insignificant (t = 0.392, p = 0.6978). Fully integrating both vectors into the overall Green F-Score yields the strongest correlation with the P/B valuation multiple at a level of r = 0.42 (0.416, t = 2.418, p = 0.0223) and also yields a statistically significant positive correlation with subsequent stock returns t + 1 (r = 0.38, t = 2.178, p = 0.0380). This demonstrates that while discretizing the small sample (N = 30) into portfolio buckets reduces the statistical power of grouped ANOVA, preserving the continuous 0–9 scale of the Green F-Score reveals statistically significant positive associations (p < 0.05) with both stock returns and P/B multiples. Furthermore, in an auxiliary ordinary least squares (OLS) regression of the P/B ratio controlling simultaneously for bank size (ln(Total Assets)), return on assets (ROA), and cost efficiency (C/I), the coefficient on the ESG Sub-Score remains positive and statistically significant (β = 0.085, t = 2.269, p = 0.032, model R2 = 0.551, adjusted R2 = 0.479, F4,25 = 7.661, p = 0.0004). Standard regression diagnostics confirm the statistical validity of this auxiliary OLS specification: variance inflation factors indicate the absence of multicollinearity across all predictors (mean VIF = 2.28, with VIF = 1.41 for ESG Sub-Score, 3.39 for ln(Total Assets), 1.20 for ROA, and 3.11 for C/I, all well below the threshold of 5.0), the Shapiro–Wilk test confirms the normality of residuals (W = 0.9873, p = 0.9702), and the Breusch–Pagan test indicates homoskedastic error variance (LM = 4.2877, p = 0.3685; F4,25 = 1.0422, p = 0.4053).
The results obtained suggest an important market-related conclusion: classical binary fundamental signals in the banking sector are no longer strongly associated with valuation premiums in isolation from the green transition. The contemporary capital market on the Warsaw Stock Exchange appears to treat traditional binary indicators of operational efficiency and profitability (Value Sub-Score) primarily as a baseline operational standard (hygiene factor), which does not independently differentiate valuation multiples in its own right. By contrast, higher stock market valuation multiples (measured by the P/B ratio) are significantly associated with leadership in the green transition and commitment to sustainable finance (ESG Sub-Score), supporting Hypothesis H3. This phenomenon indicates that the CEE emerging markets are undergoing a structural evolution in which climate transition readiness is increasingly reflected in the equity valuation of financial companies.
4.4. Cross-Sectional Analysis and Portfolio Transition Dynamics
Extending the analysis of rates of return to include a cross-sectional perspective and an analysis of the migration of individual entities between portfolios over time provides additional, significant insights into the pace at which the Polish banking sector is adapting to the requirements of sustainable finance.
The detailed structure of portfolios in individual years (Figure 3) reveals a clear, unidirectional trend towards an improvement in environmental and financial fundamentals. In the base year of the study (2023), when the reporting requirements for the Green Asset Ratio (GAR) were first implemented, as many as half of the samples (5 banks) were classified as ‘Green Laggards’ (F-Score ≤ 3), whilst only three institutions qualified for the ‘Leaders’ group (F-Score ≥ 7). In subsequent years, however, a rapid migration of companies to higher score brackets was observed, resulting from the banks’ adaptation of their strategies to the stringent requirements of the EU Taxonomy. As a result, by the end of 2025, the portfolio structure had undergone a complete reversal—the ‘Leaders’ group had doubled in size (6 banks), 4 entities were placed in the ‘Neutral Portfolio’, and none of the banks analysed were classified as ‘Laggards’ any longer. This demonstrates the Polish banking sector’s highly restrictive approach to climate risk management and its rapid closure of the so-called ‘transition gap’.
Figure 3.
Structure of Green F-Score portfolios on an annual basis (2023–2025).
A distinct phenomenon, and one of key importance to investors, is the frequency with which individual financial institutions appear in the top-performing portfolio. The frequency analysis (Table 8) reveals a high degree of concentration amongst the leaders of the transformation.
Table 8.
Frequency of occurrence of commercial banks in the extreme Green F-Score portfolios for the years 2023–2025.
ING Bank Śląski (ING BSK) and PKO BP emerged as the undisputed market leaders, qualifying for the portfolio with the highest Green F-Score in all three years under review (3 occurrences). They are among the entities implementing comprehensive ESG strategies and optimising operating margins most rapidly. The group of banks characterised by high consistency (2 occurrences as leaders) also included mBank and BNP Paribas Bank Polska.
On the other hand, statistical analysis revealed the institutions most frequently subject to a market carbon risk discount. The bank most frequently classified as a ‘Green Laggard’ (2 occurrences) was BOŚ Bank, which may constitute a market paradox given its business profile (BOŚ Bank); however, from the perspective of the rigorous methodology of the Green F-Score, this entity was burdened by poorer traditional financial performance indicators (Value Sub-Score) during the analysed period. In the early stages of the study, Citi Handlowy, Alior Bank and Bank Millennium, amongst others, recorded isolated instances in the weakest portfolio; however—as demonstrated by the year-on-year trends—these entities successfully restructured their operating models, thereby escaping the risk of falling into the value trap.
5. Discussion
The empirical results obtained for the Polish banking sector for the years 2023–2025 shed new light on the relationship between fundamental analysis, financial sustainability and the market valuation of assets in the emerging economies of Central and Eastern Europe (CEE). The substantial return spread observed in the study for banks characterised by a high Green F-Score—expressed as an average return on shares of 60.43 per cent for ‘Green Leaders’ (F-Score ≥ 7) compared with 15.41 per cent for ‘Green Laggards’ (F-Score ≤ 3)—provides directional empirical support for Hypothesis H1 (and statistically significant support in continuous correlation analysis, r = 0.38, p = 0.0380, although grouped ANOVA differences remain statistically non-significant at p = 0.215 due to sample size constraints). This relationship, also confirmed in a dichotomous test relative to the market median (52.02% for entities above the median versus 18.67% for the group below the median), is consistent with contemporary models of asset pricing equilibrium integrated with environmental factors. The results obtained are in close alignment with the theoretical model of sustainable investing proposed by Pástor, Stambaugh and Taylor [2], who demonstrated that, in a context of growing environmental awareness amongst investors, sustainable assets generate positive rates of return under the influence of positive demand shocks relating to ESG factors. Furthermore, the higher average market valuation of Leaders relative to book value (P/B = 1.65) compared to Laggards (P/B = 1.15) provides empirical support for the concept of the ESG-efficient frontier developed by Pedersen, Fitzgibbons and Pomorski [11]. In light of this theory, sustainability-oriented investors accept a shift along the efficient frontier, assigning higher market valuations to entities that effectively mitigate transition risk, which provides weak/marginal directional support for Hypothesis H2 (statistically significant at the 10% level in grouped ANOVA, p = 0.099, and at the 5% level in continuous correlation, p = 0.0223).
Importantly, the observed equity premium for Green Leaders is not merely an anomaly in the financial market. It reflects the market’s belief that banks with higher green asset ratios and stronger sustainable asset growth driven by CAPEX are better prepared to invest indirect capital in renewable energy projects rather than in high-emission activities. In the context of Central and Eastern Europe, a region characterised by high carbon emissions, this ability to reallocate capital directly influences the cost of capital available for investment in wind, solar and energy efficiency, thereby accelerating the regional energy transition.
It should be clearly emphasised here that, although classical variance tests (ANOVA) did not exceed the threshold of α = 0.05 in every scenario—which is a natural limitation resulting from the size of the sample (N = 30), determined by the lack of standardised GAR disclosures prior to 2023—the observed spread in rates of return is of great economic significance, supported by a high effect size (eta-squared, η2). Market discrimination against banks with low environmental scores demonstrates that the market has begun to effectively differentiate the cost of equity (CoE). The higher index-based valuation of transformation leaders provides them with a financial buffer, facilitating the raising of cheaper wholesale capital through the issuance of green bonds, which directly translates into the ability to rapidly increase the volume of loans for large-scale renewable energy installations and zero-emission projects. This phenomenon confirms that investors on the Warsaw Stock Exchange actively price in the carbon risk discount and penalise, in terms of capital, institutions with high exposure to stranded assets in the extractive sector [1,6]. The relationship observed in the study runs counter to the Overinvestment Hypothesis, put forward in some of the classical financial literature [12,62], according to which expenditure on environmental objectives constitutes agency costs that undermine shareholders’ current profitability. The findings of the study on the Polish market, however, support Stakeholder Theory [63] and the Good Management View, in line with the conclusions drawn by Bussoli et al. [51] and Buallay [50] for European banks. These studies demonstrated that integrating the environmental pillar into the business model strengthens the market position of financial institutions, reduces the risk of insolvency and builds lasting trust capital.
The culmination of the empirical analysis and the most groundbreaking finding is the decomposition of the explanatory power of the individual modules of the Green F-Score model, which forms the basis for testing Hypothesis H3. The correlation analysis revealed that the isolated environmental and regulatory module (ESG Sub-Score) exhibits a moderate and statistically significant positive correlation with the market valuation P/B ratio (r = 0.40; p = 0.0284). In contrast, the isolated traditional fundamental analysis module (Value Sub-Score, comprising ROA, CFO, and C/I binary signals) showed a statistically insignificant correlation close to zero (r = 0.07; p = 0.6978). Combining both dimensions into the comprehensive Green F-Score yields a correlation of r = 0.42 (p = 0.0223). This result suggests a shift in the analytical paradigm: binary measures of basic operational profitability are no longer an independent source of a valuation premium in the banking sector. In the context of the CEE emerging economy, investors appear to regard the traditional Value Sub-Score primarily as a baseline operational standard (a ‘hygiene factor’)—a necessary but insufficient condition for commanding higher valuation multiples. Readiness for the green transition (ESG Sub-Score) shows a much stronger positive association with market valuation (P/B), supporting Hypothesis H3. However, these findings must be interpreted cautiously as statistical associations rather than definitive causal relationships. In a small sample (N = 30), bivariate correlations and portfolio sorts cannot fully eliminate potential endogeneity (such as reverse causality, whereby larger, higher-valued banks possess superior resources to finance renewable energy projects and implement advanced EU Taxonomy reporting) or omitted variables, including bank scale, continuous profitability, business model profiles, and macroeconomic interest rate cycles. While our auxiliary OLS regression—validated by low multicollinearity (VIF ≤ 3.39), normal residuals (Shapiro–Wilk p = 0.9702), and homoskedastic errors (Breusch–Pagan p = 0.3685)—confirms that the positive association between the ESG Sub-Score and P/B holds when controlling for log total assets, continuous ROA, and the C/I ratio (p = 0.032), establishing strict causality will require panel econometric designs with instrumental variables as longer time series become available.
The results obtained are in line with the international trend in research into the evolution of scoring models and respond to calls from researchers for their adaptation. In an international review of the literature on Piotroski’s [4] F-Score, Podgórski [36] emphasised that classical fundamental analysis based solely on historical financial statements loses its explanatory power in sectors undergoing profound structural transformation. Furthermore, empirical evidence for the Polish market indicates that the traditional F-Score provides an option-like payoff profile and outstanding economic utility on the Warsaw Stock Exchange [39]. The researcher pointed out that the contemporary evolution of scoring models is moving towards their hybridisation—linking binary reporting signals with non-financial (ESG) criteria. Previous adaptations of scoring models in the banking sector, such as the BSCORE model by Mohanram, Saiy and Vyas [42], focused exclusively on prudential indicators, ignoring the environmental dimension. In contrast, earlier studies on the effectiveness of the F-Score on the Polish capital market [29,64] demonstrated that, whilst Piotroski’s traditional model did generate a small positive market premium (1.35 per cent per annum according to Pilch [29]), attempts to modify it based on deviations of financial ratios from the sectoral median ended in failure. This study demonstrates that overcoming this barrier in the banking market required the incorporation of robust, verified indicators from the EU Taxonomy (the proprietary Green Asset Ratio—GAR Turnover and CAPEX metrics).
From the perspective of energy systems, the rapid transition of banks from the ‘laggards’ category to the ‘leaders’ category between 2023 and 2025 indicates that regulatory pressure arising from the EU Taxonomy is already transforming loan portfolios. Higher GARs indicate not only an improvement in the quality of disclosed information, but also a measurable shift towards financing new projects that comply with the Taxonomy’s requirements. This finding is of particular significance for policymakers and regulators in the energy sector across Central and Eastern Europe, where the banking sector remains the primary source of long-term financing for renewable energy infrastructure projects.
The observed phenomenon of investors applying a carbon risk discount to banks with low environmental scores confirms theoretical and empirical concepts regarding the valuation of stranded assets in the banking sector. These findings are consistent with the conclusions of climate stress tests conducted for the banking sector in the CEE region by Várgedő [59] and Ritter [65], using Hungarian banks as a case study. Várgedő [59] demonstrated that a sharp rise in CO2 emission allowance prices triggers an asymmetric increase in the probability of default (PD) in high-emission portfolios. In turn, Ritter [65] and Stefani [66] demonstrated that financial institutions in CEE countries are more exposed to transition risk due to the high carbon intensity of local economies. These observations are underpinned by the concepts of the ‘Climate Minsky Moment’ and the ‘tragedy of the horizon’ raised by Carney [13] and Bolton et al. [1]. In contrast to the findings of Di Tommaso and Thornton [55], who, in their study of European banks between 2007 and 2018, indicated that high ESG ratings reduced banks’ market valuations (Tobin’s Q), the present study demonstrates a different pattern on the Polish market. Against the backdrop of the implementation of the CSRD and the EU Taxonomy [7,9], investors on the Warsaw Stock Exchange (GPW) view green assets (GAR) as a robust buffer protecting banks against regulatory and credit risk, which is consistent with the analyses by Aras and Hacıoğlu Kazak [67], Bressan [68] and Bua et al. [69].
Furthermore, an in-depth cross-sectional analysis of portfolio structures between 2023 and 2025 revealed a rapid process of closing the transition gap by the Polish banking sector. The shift from the situation in 2023, when ‘Green Laggards’ accounted for 50 per cent of the sample, to the situation at the end of 2025, when the group of Leaders had doubled in size (e.g., ING BSK, PKO BP), whilst the ‘Laggards’ group had completely disappeared, demonstrates the banks’ highly flexible adaptation to the EBA [8] guidelines and ESRS standards. This confirms the observations of Buallay [70] and Zhelyazkova [71] that structured non-financial reporting is ceasing to be merely a passive disclosure obligation and is becoming an active instrument for managing the business model and shareholder value.
Finally, it is essential to discuss the methodological properties of the Green F-Score related to its additive binary construction and potential sensitivity to the ‘low-base effect’. Because the environmental module assigns two points to static sectoral median comparisons (G1, E1) and four points to dynamic growth indicators (G2, G3, E2, E3), a bank with a minimal initial share of green assets could theoretically earn growth points from marginal absolute additions, whereas a mature green bank might find it difficult to sustain high percentage expansion. In the specific institutional context of the Polish banking sector between 2023 and 2025, however, incorporating dynamic transformation signals alongside static thresholds is both theoretically and empirically justified. Because Poland’s economy is undergoing a structural energy transition from a high-emission coal baseline—and mandatory EU Taxonomy reporting only began in 2023—the entire banking sector started from a low initial GAR base (sectoral mean GAR Turnover of 0.72% in 2023). Consequently, capital market participants in CEE evaluate banks not merely on their initial static stock of green assets, but critically on the pace and direction of credit reallocation toward transition-aligned CAPEX. Empirically, as demonstrated in Table 5, the requirement to achieve at least 7 out of 9 points effectively prevented low-base distortion: 13 of the 14 ‘Green Leader’ observations exceeded the sectoral median in static GAR levels (G1 = 1, E1 = 1), and the Leaders portfolio held over 25 times the absolute volume of green turnover assets compared with Laggards. Specifically, the only Leader observation that did not score points on the two static relative GAR median criteria was a large universal bank—BNP Paribas PL in 2025 (F-Score = 7, with GAR Turnover of 2.58% and GAR CAPEX of 3.55% falling just 0.005 percentage points below the 2025 sectoral medians of 2.585% and 3.555%, while holding 1471.87 PLN million and 2023.35 PLN million in green assets and scoring 4/4 on dynamic ESG signals and 3/3 on financial efficiency). Conversely, only a single observation—BOŚ Bank in 2025 (F-Score = 8, with total assets of 25.72 PLN billion and green CAPEX assets of 142.36 PLN million, below the sectoral volume medians)—illustrates the sensitivity of binary scoring to a smaller absolute balance-sheet base, as it qualified by exceeding the sectoral medians in relative GAR shares (2.59% Turnover and 5.20% CAPEX, earning G1 = 1, E1 = 1) alongside all four dynamic growth indicators (G2 = G3 = E2 = E3 = 1).
6. Conclusions
The aim of this study was to develop and empirically verify an innovative, hybrid Green Value Investing strategy based on the proprietary 9-point ‘Green F-Score’ indicator. The market effectiveness of this tool was tested on the 10 largest commercial banks listed on the Warsaw Stock Exchange (WSE) between 2023 and 2025, serving as a representative research environment (proxy) for the financial systems of the emerging markets of Central and Eastern Europe (CEE). By integrating hard indicators of fundamental analysis with regulatory ESG disclosures (in particular the Green Asset Ratio, GAR), the study assessed investors’ sensitivity to climate risk management in the banking sector.
Based on the empirical results obtained, the phenomenon of the Polish capital market rewarding sustainability allows the following main conclusions to be drawn:
- C1: The portfolio of banks characterised by the highest level of integrated environmental and fundamental readiness (‘Green Leaders’, Green F-Score ≥ 7) generated a higher average return on shares (60.43 per cent) than the neutral portfolio (26.66 per cent) and the ‘Green Laggards’ (15.41 per cent). While the continuous Green F-Score is positively and statistically significantly correlated with stock returns (r = 0.38, p = 0.0380), inter-group differences in ANOVA (p = 0.215) and t-tests (p = 0.153) do not reach conventional statistical significance due to the small sample size (N = 30), providing directional, exploratory support for Hypothesis H1, consistent with theoretical models of sustainable investment equilibrium [2,11].
- C2: Financial institutions classified as transformation leaders traded at a higher average price-to-book ratio (P/B = 1.65) than entities with the lowest environmental scores (P/B = 1.15), which—supported by marginal significance in grouped ANOVA (p = 0.099, η2 = 0.158) and statistical significance in continuous correlation (r = 0.42, p = 0.0223)—provides weak/marginal directional support for Hypothesis H2 regarding the market pricing of stranded-asset risks [1,59].
- C3: An analysis of the Pearson correlation coefficient revealed that the P/B valuation multiple is positively and statistically significantly associated with the environmental module (r = 0.40; p = 0.0284), whilst the traditional binary fundamental module (Value Sub-Score) shows a near-zero, statistically insignificant correlation (r = 0.07; p = 0.6978), which supports Hypothesis H3 while requiring cautious, non-causal interpretation.
- C4: The cross-sectional analysis revealed a rapid process of adaptation within the Polish banking sector and the closing of the so-called ‘transition gap’. The transition from the base year 2023, in which 50 per cent of entities in the sector were classified as ‘Laggards’, to the end of 2025, when the number of ‘Leaders’ doubled (including ING BSK, PKO BP), whilst the proportion of entities at high carbon risk fell to zero, demonstrates the highly effective implementation of the EU Taxonomy framework [8,71].
Although classical analysis of variance (ANOVA) and Student’s t-tests did not reach the conventional significance threshold of α = 0.05 across the grouped portfolio variants due to the small sectoral sample size (N = 30), the observed spreads exhibit notable effect sizes (η2 = 0.108 and η2 = 0.158) and reach statistical significance in continuous correlation analysis (p < 0.05). This directional consistency suggests that the Green F-Score model serves as a promising exploratory allocation tool for capturing transition-related valuation differences, in line with calls for the hybridisation of classical indicator-based models [36,39]. These results indicate that, on the Warsaw Stock Exchange, basic binary operational metrics act primarily as an indispensable operational standard (hygiene factor), whilst cross-sectional valuation differences are increasingly associated with the implementation of ESG strategies [50,51].
These findings have significant theoretical and practical implications. The theoretical dimension of the article demonstrates that the traditional value investing model (based, for example, on Piotroski’s model [4]) must be redefined by integrating the component of sustainable development. From a practical perspective, the results provide key guidance for portfolio managers and the management boards of financial institutions in the CEE region, suggesting that ignoring EU non-financial reporting may entail a tangible economic penalty on the stock market in the form of a sustained market undervaluation.
It should be emphasised, however, that the present study is subject to important statistical, methodological, and regulatory limitations.
Firstly, the short time horizon (2023–2025, with the final return window spanning 155 days from April to October 2026) is an inherent consequence of the recent introduction of the CSRDs and the EU Taxonomy, restricting the sample to N = 30 observations across 10 major commercial banks. This small sample renders grouped parametric tests statistically underpowered—with post-hoc power for three-group ANOVA at α = 0.05 reaching only 19.5% at a conventional medium effect size (f = 0.25), 34.5% (within the 30–40% range) for observed stock returns (η2 = 0.108, p = 0.215), and 50.6% for P/B multiples (η2 = 0.158, p = 0.099), alongside non-significant two-group t-tests (p = 0.153 and 0.185)—meaning that our portfolio sorting findings should be viewed as exploratory and directional rather than definitive proof.
Secondly, the empirical framework relies primarily on portfolio sorts and bivariate correlations, which do not fully control for endogeneity, reverse causality, or omitted variables—such as bank size, continuous profitability, interest rate sensitivity, or foreign-currency mortgage provisions—that may jointly influence ESG disclosures and market valuations.
Thirdly, the additive binary construction of the Green F-Score requires a cross-sectional benchmarking rule for the initial 2023 reporting year—and while the homogeneous 2024–2025 subsample (N = 20) preserves the same portfolio hierarchy, it contains only n = 2 Laggard observations and thus remains strictly descriptive and incapable of supporting inferential claims—and weights static GAR levels equally with dynamic growth rates. Although descriptive statistics confirm that our ‘Green Leaders’ portfolio comprises banks with the largest absolute green asset volumes (Table 5), binary growth signals remain mathematically sensitive to the ‘low-base effect’, whereby smaller banks can achieve high percentage growth from modest initial green portfolios.
Fourthly, the implementation of sustainability reporting has given rise to regulatory uncertainty, comprising a lack of full methodological consistency in calculating the GAR (particularly in light of the introduction of the Omnibus I package in 2025), gaps in the collection of granular data from non-financial SMEs, and the phenomenon of regulatory overload [72]. Specifically, the European Commission’s 2025 Omnibus I sustainability simplification package proposes raising mandatory CSRD reporting thresholds (exempting approximately 80% of previously covered smaller corporate counterparties) and introducing materiality filters and simplified templates for EU Taxonomy disclosures; because the GAR numerator only captures taxonomy-aligned exposures to corporate borrowers subject to CSRD reporting while the denominator remains broad, shrinking the pool of CSRD-reporting counterparties alters eligible asset coverage over time and directly impairs the cross-temporal and cross-institutional comparability of reported GAR figures.
To address these limitations, it is recommended that future research expand the sample to include markets in other CEE countries (e.g., Romania, Hungary, the Czech Republic), alongside the availability of historical data from subsequent years of the EU Taxonomy’s implementation. Furthermore, it would be justified to verify the Green F-Score strategy whilst applying the concept of a long-short portfolio, incorporating additional market momentum filters, in order to analyse the resilience of this valuation method to sharp cyclical fluctuations.
Author Contributions
Conceptualisation, M.M. and K.P.; methodology, M.M. and K.P.; software, M.M. and K.P.; validation, M.M. and K.P.; formal analysis, M.M. and K.P.; investigation, M.M. and K.P.; resources, M.M. and K.P.; data curation, M.M. and K.P.; writing—original draft preparation, M.M. and K.P.; writing—review and editing, M.M. and K.P.; visualisation, M.M. and K.P.; supervision, M.M. and K.P.; project administration, M.M. and K.P. All authors have read and agreed to the published version of the manuscript.
Funding
This research was co-funded by the Ministry of Science under the Regional Excellence Initiative programme.
Institutional Review Board Statement
Not applicable.
Informed Consent Statement
Not applicable.
Data Availability Statement
Publicly available datasets were analysed in this study. Financial and market data (including bank quotations, market indices and fundamental variables) can be found in the Stooq historical database “https://stooq.pl (accessed on 10 September 2026)”. Non-financial data relating to the EU Taxonomy (GAR and CAPEX) were collected manually from the annual ESG reports and non-financial statements published by the individual banks on their official corporate websites.
Conflicts of Interest
The authors declare no conflicts of interest. The funders had no role in the design of the study; in the collection, analysis or interpretation of data; in the writing of the manuscript; or in the decision to publish the results.
References
- Bolton, P.; Despres, M.; Pereira Da Silva, L.A.; Samama, F.; Svartzman, R. The Green Swan: Central Banking and Financial Stability in the Age of Climate Change; Bank for International Settlements (BIS): Basel, Switzerland, 2020; pp. 1–115. Available online: https://www.bis.org/publ/othp31.pdf (accessed on 2 October 2026).
- Pástor, Ľ.; Stambaugh, R.F.; Taylor, L.A. Sustainable investing in equilibrium. J. Finance Econ. 2021, 142, 550–571. [Google Scholar] [CrossRef] [Scilit]
- Graham, B.; Dodd, D.L. Security Analysis: Principles and Technique; McGraw-Hill: New York, NY, USA, 1940; Available online: https://books.google.pl/books/about/Security_Analysis.html?hl=pl&id=eAZDAAAAIAAJ&redir_esc=y (accessed on 20 September 2026).
- Piotroski, J.D. Value investing: The use of historical financial statement information to separate winners from losers. J. Account. Res. 2000, 38, 1–41. [Google Scholar] [CrossRef] [Scilit] [PubMed]
- Polzin, F.; Sanders, M. How to finance the transition to low-carbon energy in Europe? Energy Policy 2020, 147, 111863. [Google Scholar] [CrossRef] [Scilit]
- Friede, G.; Busch, T.; Bassen, A. ESG and financial performance: Aggregated evidence from more than 2000 empirical studies. J. Sustain. Finance Invest. 2015, 5, 210–233. [Google Scholar] [CrossRef] [Scilit]
- European Parliament; Council of the European Union. Regulation (EU) 2020/852 of the European Parliament and of the Council of 18 June 2020 on the establishment of a framework to facilitate sustainable investment, and amending Regulation (EU) 2019/2088. Off. J. Eur. Union 2020, L 198, 13–43. [Google Scholar]
- European Banking Authority (EBA). EBA Report on Management and Supervision of ESG Risks for Credit Institutions and Investment Firms; EBA/REP/2021/18; EBA: Paris, France, 2021; pp. 1–158. [Google Scholar]
- European Parliament; Council of the European Union. Directive (EU) 2022/2464 of the European Parliament and of the Council of 14 December 2022 amending Regulation (EU) No 537/2014, Directive 2004/109/EC, Directive 2006/43/EC and Directive 2013/34/EU, as regards corporate sustainability reporting. Off. J. Eur. Union 2022, L 322, 15–89. [Google Scholar]
- Sen, S.; von Schickfus, M.-T. Climate policy, stranded assets, and investors’ expectations. J. Environ. Econ. Manag. 2020, 100, 102277. [Google Scholar] [CrossRef] [Scilit]
- Pedersen, L.H.; Fitzgibbons, S.; Pomorski, L. Responsible investing: The ESG-efficient frontier. J. Finance Econ. 2021, 142, 572–597. [Google Scholar] [CrossRef] [Scilit]
- Gillan, S.L.; Koch, A.; Starks, L.T. Firms and social responsibility: A review of ESG and CSR research in corporate finance. J. Corp. Finance 2021, 66, 101889. [Google Scholar] [CrossRef] [Scilit]
- Bank for International Settlements. Available online: https://www.bis.org/speeches/20151009-breaking-tragedy-horizon-climate-change-and-financial-stability (accessed on 2 October 2026).
- Zioło, M.; Bąk, I.; Spoz, A. The Role of Financial Markets in Energy Transitions. Energies 2024, 17, 6315. [Google Scholar] [CrossRef] [Scilit]
- Egli, F.; Polzin, F.; Sanders, M.; Schmidt, T.; Serebriakova, A.; Steffen, B. Financing the energy transition: Four insights and avenues for future research. Environ. Res. Lett. 2022, 17, 051003. [Google Scholar] [CrossRef] [Scilit]
- Mavlutova, I.; Spilbergs, A.; Verdenhofs, A.; Kuzmina, J.; Arefjevs, I.; Natrins, A. The role of green finance in fostering the sustainability of the economy and renewable energy supply: Recent issues and challenges. Energies 2023, 16, 7712. [Google Scholar] [CrossRef] [Scilit]
- Brunnschweiler, C.N. Finance for renewable energy: An empirical analysis of developing and transition economies. Environ. Dev. Econ. 2010, 15, 241–274. [Google Scholar] [CrossRef] [Scilit]
- Monasterolo, I. Climate change and the financial system. Annu. Rev. Resour. Econ. 2020, 12, 299–320. [Google Scholar] [CrossRef] [Scilit]
- Taghizadeh-Hesary, F.; Yoshino, N. Sustainable solutions for green financing and investment in renewable energy projects. Energies 2020, 13, 788. [Google Scholar] [CrossRef] [Scilit]
- Delis, M.D.; de Greiff, K.; Iosifidi, M.; Ongena, S. Being stranded with fossil fuel reserves? Climate policy risk and the pricing of bank loans. Financ. Mark. Inst. Instrum. 2024, 33, 239–265. [Google Scholar] [CrossRef] [Scilit]
- Park, H.; Kim, J.D. Transition towards green banking: Role of financial regulators and financial institutions. Asian J. Sustain. Soc. Responsib. 2020, 5, 5. [Google Scholar] [CrossRef] [Scilit]
- Yanosek, K. Policies for financing the energy transition. Daedalus 2012, 141, 94–104. [Google Scholar] [CrossRef] [Scilit]
- Fatica, S.; Panzica, R.; Rancan, M. The pricing of green bonds: Are financial institutions special? J. Finance Stab. 2021, 54, 100873. [Google Scholar] [CrossRef] [Scilit]
- Puszer, B.; Czech, M.; Rozmus, D.; Muszyński, M. Structure of sustainable bond issuances in the Visegrad Group countries in years 2020–2024. Sci. Pap. Silesian Univ. Technol. Organ. Manag. Ser. 2026, 242, 437–463. [Google Scholar] [CrossRef] [Scilit]
- Dupir, M.C. The banking industry in the climate transition: Risks, regulatory developments and transformation pathways. Ann. Const. Brâncuşi Univ. Târgu-Jiu Econ. Ser. 2026, 1, 416–420. Available online: https://www.utgjiu.ro/revista/ec/pdf/2026-01/47_Dupir.pdf (accessed on 20 September 2026). [CrossRef] [Scilit]
- Ringel, M.; Mjekic, S. Analyzing the role of banks in providing green finance for retail customers: The case of Germany. Sustainability 2023, 15, 8745. [Google Scholar] [CrossRef] [Scilit]
- Bolton, P.; Kacperczyk, M. Global Pricing of Carbon-Transition Risk. J. Finance 2023, 78, 3677–3754. [Google Scholar] [CrossRef] [Scilit]
- van der Ploeg, F.; Rezai, A. Stranded assets in the transition to a carbon-free economy. Annu. Rev. Resour. Econ. 2020, 12, 281–298. [Google Scholar] [CrossRef] [Scilit]
- Pilch, B. Building of F-Score-Like Models on the Example of the Polish Stock Market. Ann. Univ. Mariae Curie-Skłodowska Sect. H–Oecon. 2023, 57, 155–180. [Google Scholar] [CrossRef] [Scilit]
- Fama, E.F.; French, K.R. The Cross-Section of Expected Stock Returns. J. Finance 1992, 47, 427–465. [Google Scholar] [CrossRef]
- Lakonishok, J.; Shleifer, A.; Vishny, R.W. Contrarian Investment, Extrapolation, and Risk. J. Finance 1994, 49, 1541–1578. [Google Scholar] [CrossRef]
- Ozarslan Saydar, O.; Bedir, C. Value Investing Analysis of Banking Sector on BIST-100. J. Econ. Finance Account. 2021, 8, 90–101. [Google Scholar] [CrossRef] [Scilit]
- Alkababji, M.; Mushtaha, S. The Impact of Financial Soundness Indicators (FSIs) on the Market Value of Palestinian Public Shareholding Banks. J. Finance Account. Res. 2023, 5, 72–100. [Google Scholar] [CrossRef] [Scilit]
- Abdioğlu, N.; Aytekin, S. On the Financial Determinants of the Piotroski F-Score: An Analysis of Borsa İstanbul Firms. J. Mehmet Akif Ersoy Univ. Econ. Adm. Sci. Fac. 2024, 11, 1457–1476. [Google Scholar] [CrossRef] [Scilit]
- Sandiffu’ad, A.; Putra, S.G. Analisis Piotroski F-Score pada Saham Jakarta Islamic Index 70 Periode Tahun 2019–2021. J. Perbank. Syariah 2022, 1, 54–69. [Google Scholar] [CrossRef] [Scilit]
- Podgórski, K. The effectiveness of the Piotroski F-score strategy across international markets: A literature review. Sci. Pap. Silesian Univ. Technol. Organ. Manag. Ser. 2026, 245, 427–445. [Google Scholar] [CrossRef] [Scilit]
- Tripathy, T.; Pani, B. Effect of F Score on stock performance: Evidence from Indian equity market. Int. J. Econ. Finance 2017, 9, 89–101. [Google Scholar] [CrossRef] [Scilit]
- Turtle, H.J.; Wang, K. The Value in Fundamental Accounting Information. J. Finance Res. 2017, 40, 113–140. [Google Scholar] [CrossRef] [Scilit]
- Podgórski, K. Value investing in emerging markets: The effectiveness of the Piotroski F-score strategy in Poland as a Central and Eastern European case study. Int. Entrep. Rev. 2026, 12, 71–85. [Google Scholar] [CrossRef] [Scilit]
- Gimeno, R.; Lobán, L.; Vicente, L. A neural approach to the value investing tool F-Score. Finance Res. Lett. 2020, 37, 101367. [Google Scholar] [CrossRef] [Scilit]
- Rangapriya, S.; Meenakumari, J. Using Piotroski F-Score for Assessing Financial Health: Evidence from Leading Indian Private Banks. Shanlax Int. J. Manag. 2021, 8, 117–132. [Google Scholar] [CrossRef] [Scilit]
- Mohanram, P.; Saiy, S.; Vyas, D. Fundamental analysis of banks: The use of financial statement information to screen winners from losers. Rev. Account. Stud. 2018, 23, 200–233. [Google Scholar] [CrossRef] [Scilit]
- Pyka, I.; Karkowska, R.; Nocoń, A. ESG activities and their influence on commercial banks’ profitability and financial stability. J. Entrep. Manag. Innov. 2025, 21, 54–75. [Google Scholar] [CrossRef] [Scilit]
- Kim, S.; Li, Z.F. Understanding the impact of ESG practices in corporate finance. Sustainability 2021, 13, 3746. [Google Scholar] [CrossRef] [Scilit]
- Xie, J.; Nozawa, W.; Yagi, M.; Fujii, H.; Managi, S. Do environmental, social, and governance activities improve corporate financial performance? Bus. Strategy Environ. 2019, 28, 286–300. [Google Scholar] [CrossRef] [Scilit]
- Abbas, Z.; Mahmood, S.; Ali, M.; Shah, S.K.A. Green Finance, Corporate Governance, and Financial Performance: Examining Their Impact on Company Value and Profitability in Banks Listed on the Pakistan Stock Exchange. J. Bus. Insight Innov. 2026, 5, 56–65. [Google Scholar] [CrossRef] [Scilit]
- Laguir, I.; Stekelorum, R.; Laguir, L.; Elbaz, J. Is it good to be a green multinational bank? Manag. Int. 2020, 24, 54–63. [Google Scholar] [CrossRef] [Scilit]
- Shakil, M.H.; Mahmood, N.; Tasnia, M.; Munim, Z.H. Do environmental, social and governance performance affect the financial performance of banks? A cross-country study of emerging market banks. Manag. Environ. Qual. An. Int. J. 2019, 30, 1331–1344. [Google Scholar] [CrossRef] [Scilit]
- Muszyński, M.; Podgórski, K. Analysis of the rates of return on investments in socially responsible companies with the example of the WIG-ESG index. Folia Oecon. Stetin. 2025, 25, 218–239. [Google Scholar] [CrossRef] [Scilit]
- Buallay, A. Is sustainability reporting (ESG) associated with performance? Evidence from the European banking sector. Manag. Environ. Qual. 2019, 30, 98–115. [Google Scholar] [CrossRef] [Scilit]
- Bussoli, C.; Conte, D.; Letorri, G.; Barone, M. Does it pay to be sustainable? Evidence from European banks. Int. J. Bus. Manag. 2019, 14, 128–139. [Google Scholar] [CrossRef] [Scilit]
- Gutiérrez-Ponce, H.; Wibowo, S.A. Do sustainability activities affect the financial performance of banks? The case of Indonesian banks. Sustainability 2023, 15, 6892. [Google Scholar] [CrossRef] [Scilit]
- Hidayat, G.; Dewi, K.H.; Utama, A.N.B.; Zikriani, H. Green Finance: Evaluating the Impact of Sustainable Investments on Corporate Performance of Islamic Bank in Indonesia. Int. J. Bus. Law Educ. 2024, 5, 1966–1977. [Google Scholar] [CrossRef] [Scilit]
- Kapetanakis, K.M.; Floros, C. Exploring the trade-offs between environmentally oriented policies and financial performance in U.S. banks: Non-linear and heterogeneous effects. Oper. Res. 2026, 26, 67. [Google Scholar] [CrossRef] [Scilit]
- Di Tommaso, C.; Thornton, J. Do ESG scores effect bank risk taking and value? Evidence from European banks. Corp. Soc. Responsib. Environ. Manag. 2020, 27, 2286–2298. [Google Scholar] [CrossRef] [Scilit]
- Birindelli, G.; Dell’Atti, S.; Iannuzzi, A.P.; Savioli, M. Composition and activity of the board of directors: Impact on ESG performance in the banking system. Sustainability 2018, 10, 4699. [Google Scholar] [CrossRef] [Scilit]
- Shah, S.H.A.; Shah, A.; Khan, M.K.; Ullah, H. The Risk and Return Relations: New Evidence from Pakistani Stock Market. J. Account. Finance Emerg. Econ. 2021, 7, 195–204. [Google Scholar] [CrossRef] [Scilit]
- Palmieri, E.; Polato, M.; Floreani, J. Green Bond Issuance and Environmental, Social and Governance Scores: Do They Impact Bank Performance? Corp. Soc. Responsib. Environ. Manag. 2025, 32, 8577–8597. [Google Scholar] [CrossRef] [Scilit]
- Várgedő, B. Climate stress test: The impact of carbon price shock on the probability of default in the Hungarian banking system. Financ. Econ. Rev. 2022, 21, 57–82. [Google Scholar] [CrossRef] [Scilit]
- Karydas, C.; Xepapadeas, A. Pricing Climate Change Risks: CAPM with Rare Disasters and Stochastic Probabilities; CER-ETH Working Paper Series Working Paper 19/311; Center of Economic Research at ETH Zurich: Zurich, Switzerland, 2019. [Google Scholar] [CrossRef] [Scilit]
- Brühl, V. The Green Asset Ratio (GAR): A new key performance indicator for credit institutions. Eurasian Econ. Rev. 2023, 13, 57–83. [Google Scholar] [CrossRef] [Scilit]
- La Torre, M.; Leo, S.; Panetta, I.C. Banks and environmental, social and governance drivers: Follow the market or the authorities? Corp. Soc. Responsib. Environ. Manag. 2021, 28, 1620–1634. [Google Scholar] [CrossRef] [Scilit]
- Freeman, R.E. Strategic Management: A Stakeholder Approach; Pitman: Boston, MA, USA, 1984. [Google Scholar]
- Kusowska, M. Assessment of Efficiency of Piotroski F-Score Strategy in the Warsaw Stock Exchange. Przedsiębiorstwo WE Współczesnej Gospod.–Teor. I Prakt. 2021, 32, 47–59. [Google Scholar] [CrossRef]
- Ritter, R. Banking sector exposures to climate risks—Overview of transition risks in the Hungarian corporate loan portfolio. Financ. Econ. Rev. 2022, 21, 32–55. [Google Scholar] [CrossRef] [Scilit]
- Stefani, E. Climate risk and capital flows in Eastern European emerging markets: How physical and transition risks reshape foreign direct investment portfolios. Eur. J. Account. Audit. Finance Res. 2026, 14, 73–85. [Google Scholar] [CrossRef] [Scilit]
- Aras, G.; Hacıoglu Kazak, E. Enhancing firm value through the lens of ESG materiality: Evidence from the banking sector in OECD countries. Sustainability 2022, 14, 15302. [Google Scholar] [CrossRef] [Scilit]
- Bressan, S. Does the environmental impact of banks affect their financial performance? J. Bank. Regul. 2025, 26, 261–278. [Google Scholar] [CrossRef] [Scilit]
- Bua, G.; Kapp, D.; Ramella, F.; Rognone, L. Transition versus physical climate risk pricing in European financial markets: A text-based approach. Eur. J. Finance 2024, 30, 2076–2110. [Google Scholar] [CrossRef] [Scilit]
- Buallay, A.; Al Marri, M.; Nasrallah, N.; Hamdan, A.; Barone, E.; Zureigat, Q. Sustainability reporting in banking and financial services sector: A regional analysis. J. Sustain. Finance Invest. 2021, 13, 776–801. [Google Scholar] [CrossRef] [Scilit]
- Zhelyazkova, V. Beyond disclosure: Embedding climate transition risk in financial supervision and banking strategy. Armen. Econ. Rev. 2025, 1, 48–59. [Google Scholar] [CrossRef] [Scilit]
- Garcia-Torea, N.; Luque-Vílchez, M.; Rodríguez-Gutiérrez, P. The EU Taxonomy, sustainability reporting and financial institutions: Understanding the elements driving regulatory uncertainty. Account. Forum 2024, 48, 427–454. [Google Scholar] [CrossRef] [Scilit]
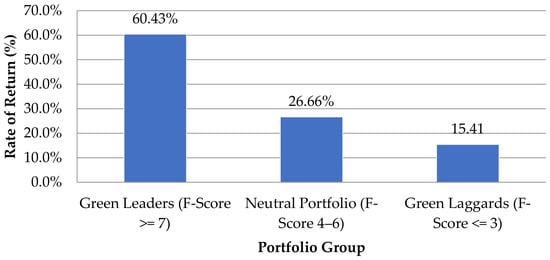
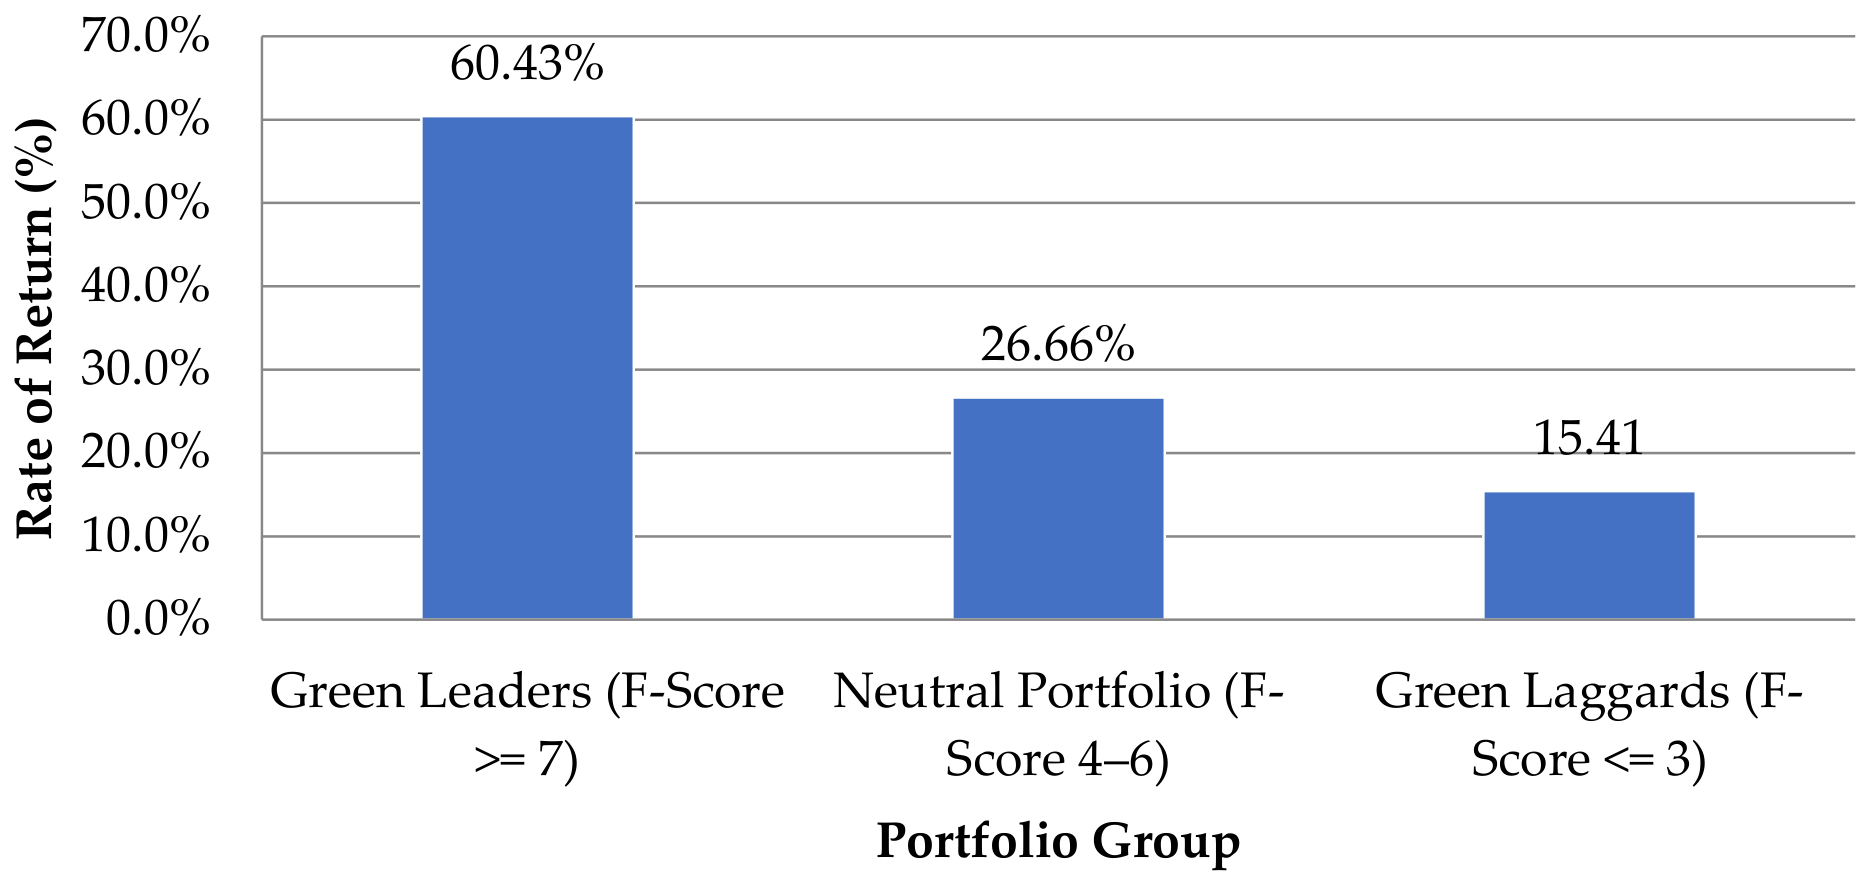
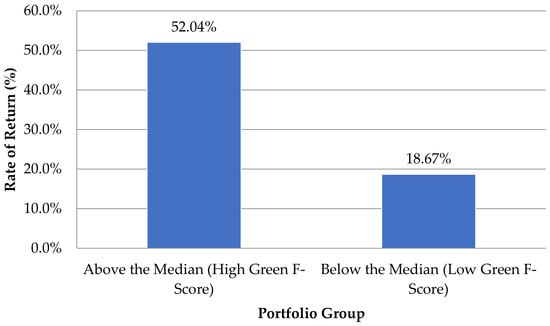
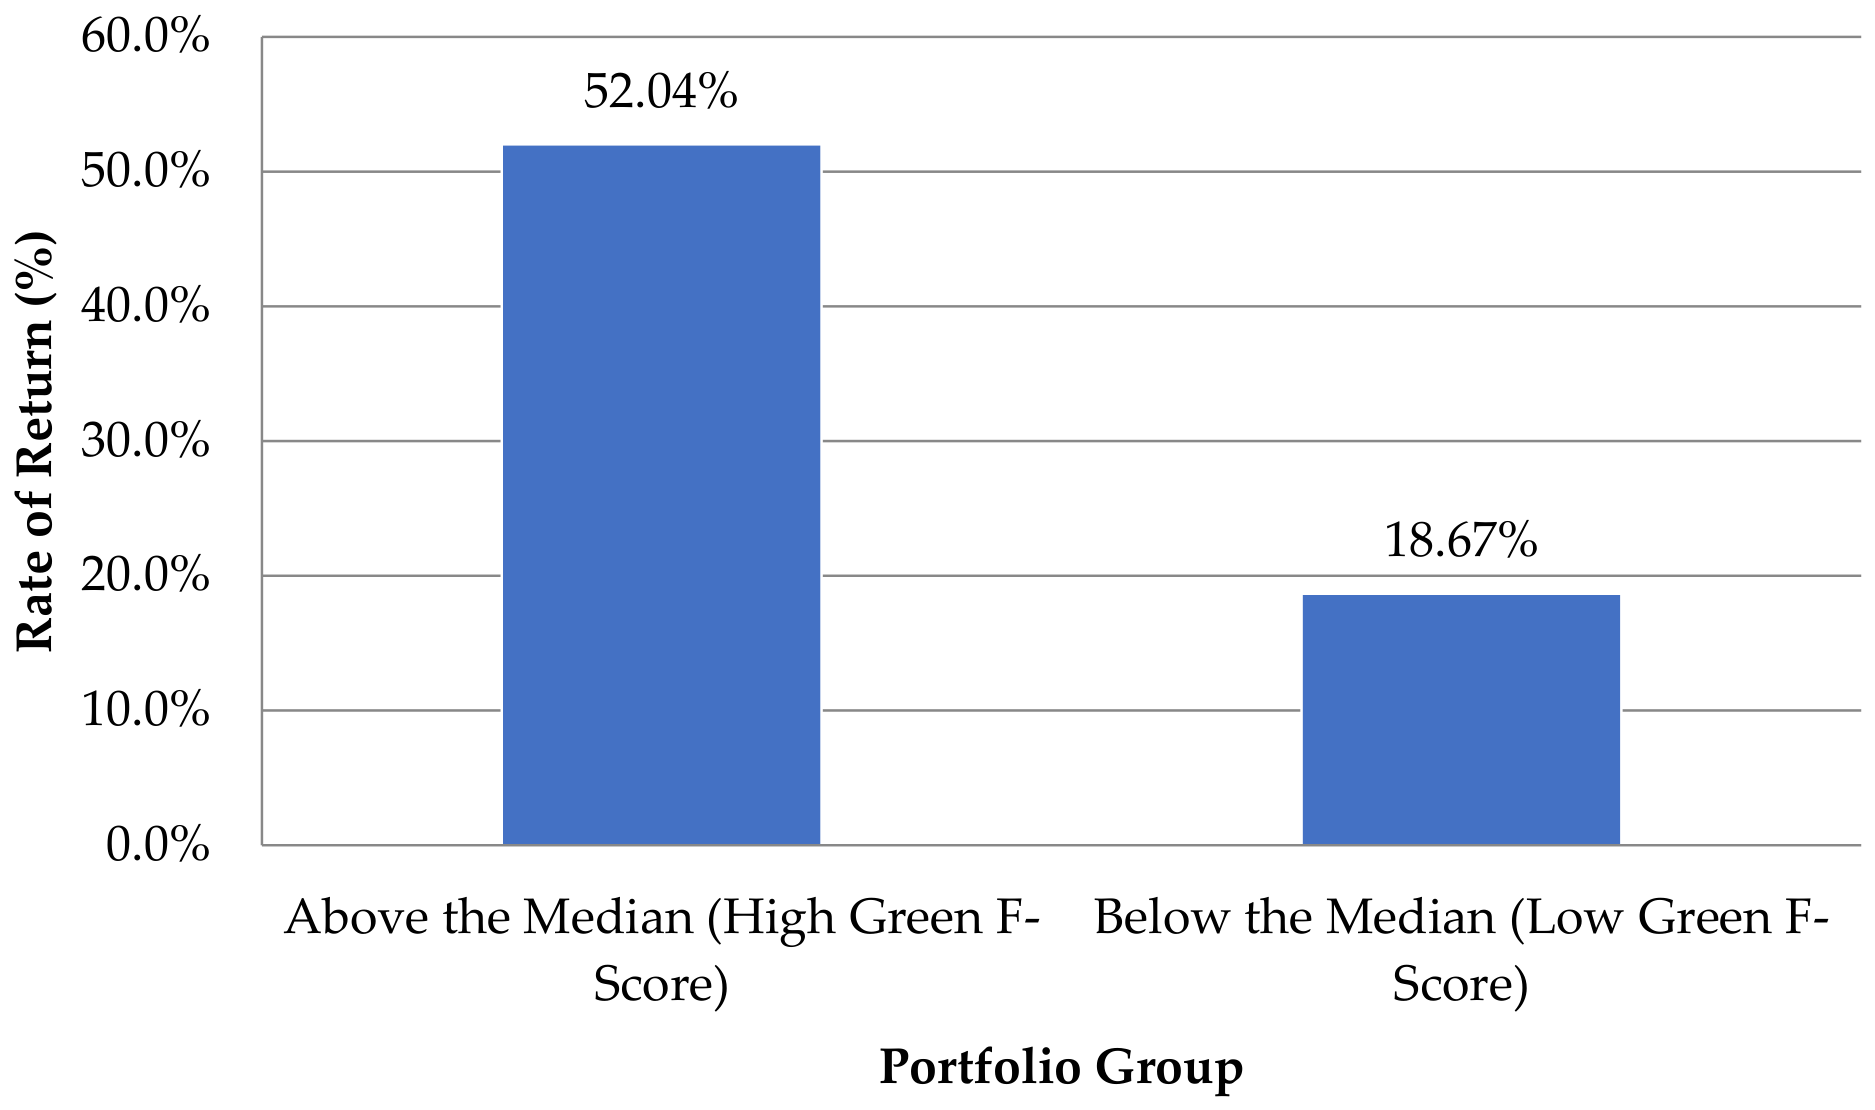
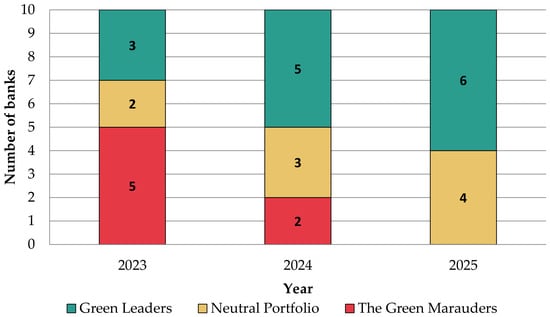

Disclaimer/Publisher’s Note: The statements, opinions and data contained in all publications are solely those of the individual author(s) and contributor(s) and not of MDPI and/or the editor(s). MDPI and/or the editor(s) disclaim responsibility for any injury to people or property resulting from any ideas, methods, instructions or products referred to in the content. |
© 2026 by the authors. Licensee MDPI, Basel, Switzerland. This article is an open access article distributed under the terms and conditions of the Creative Commons Attribution (CC BY) license.