


Abstract
Digital transformation has become a central strategic agenda for firms worldwide, yet whether it durably improves profitability remains contested. This study asks where, and under what external conditions, the returns to digital transformation materialize. Using 24,734 firm-year observations of 3364 Chinese A-share listed firms over 2013–2023, we decompose return on equity into its DuPont components and focus on net profit margin—the component through which revenue is converted into profit—to examine the nonlinear effect of digital transformation and the moderating role of the external environment. Fixed-effects estimates and inverted U-shape tests reveal a significant inverted U-shaped relationship between digital transformation and net profit margin: early deployment raises profitability through synergy gains, but beyond a threshold, rising coordination costs erode it, so that the gains are not self-sustaining. This inverted U-shape is flatter under higher industry munificence and environmental dynamism—conditions under which digital returns persist—whereas industry complexity does not significantly moderate it. The findings indicate that digital transformation yields economically sustainable profitability only when digital activity is converted into retained profit within a favorable external environment, guiding managers to monitor net profit margin and calibrate the pace of deployment rather than the scale of adoption.
1. Introduction
In the era of the digital economy, the deep integration of digital technology with the real economy is systematically reshaping how firms create value. As a new factor of production, data and digital technologies have fundamentally changed the logic through which firms acquire, allocate, and transform resources. The Chinese government has elevated the development of the digital economy to a national strategy, and the 15th Five-Year Plan further prioritizes industrial digital transformation. Against this backdrop, digital transformation has evolved from an early exploration into a widespread strategic action for Chinese firms, with capital expenditure, talent investment, and technology-related mergers and acquisitions continuing to rise. The underlying motive of this strategic action is to strengthen firms’ capabilities in resource orchestration, operational coordination, and innovation, so that their development can be sustained over the long term. Digital transformation broadly refers to the organizational process through which firms embed digital technologies into their business models, products, processes, and value-creation logic. It has attracted sustained scholarly attention across strategic management, information systems, and innovation research [1,2,3,4].
This sustained attention reflects the fact that digital transformation advances sustainable development across a broad range of domains. Environmentally, digital technologies enable real-time monitoring, precision production, and green innovation that reduce firms’ carbon emissions [5]; socially, they upgrade the quality and skill composition of the workforce [6]; and in governance, they strengthen information transparency and disclosure quality [7], together raising firms’ overall ESG performance [8]. These gains are nonetheless inseparable from the economic sustainability of the firm, since only a firm that has translated digital investment into durable profit can sustain continuous spending on environmental protection, employee welfare, and governance improvement; financial sustainability, the persistent conversion of revenue into retained profit, is precisely the foundation on which environmental and social responsibilities depend and the concern that firms value most directly. Nevertheless, the actual effect of digital transformation on profitability is not monotonically increasing, as might be expected [9,10]. Digital transformation, as a resource orchestration process that evolves dynamically as investment deepens [11,12], releases synergy dividends in its early stages through the integration of information, capital, and business flows, reducing transaction costs and improving operating efficiency, thereby raising profitability; yet once the degree of digital transformation crosses a threshold, rising coordination costs gradually exceed the synergy gains, and additional investment erodes profitability, yielding an inverted U-shaped pattern of first rising and then falling [13]. Beyond this threshold, further digitalization misallocates capital, talent, and managerial attention that could otherwise be put to productive use, so that additional investment destroys rather than creates value [14]. Whether digital transformation can therefore become a durable source of profitability, rather than a transient efficiency gain, bears directly on firms’ sustainable development, which encompasses both the persistent improvement in firm performance and the responsible use of resources.
Although this body of research has thoroughly established the efficiency gains of digital transformation and has begun to recognize that its performance effects may not be linear, the existing literature still leaves three gaps. First, it lacks a unified theoretical framework to reconcile the conflicting linear findings, and few studies reveal the formation mechanism of the nonlinear relationship from the dynamic process of resource orchestration. Second, by treating performance as a monolithic outcome, most studies fail to decompose it into the DuPont components—net profit margin, total asset turnover, and the equity multiplier—and therefore cannot locate the channel through which digital transformation’s nonlinear effect operates. Third, the examination of contingency factors has focused mostly on internal capabilities such as absorptive capacity and dynamic capabilities [15,16,17], without systematically integrating the external environment dimensions of munificence, dynamism, and complexity [18] into a unified analytical framework. Against this background, this study seeks to address these gaps through three marginal contributions. First, it introduces resource orchestration theory to characterize the inverted U-shaped effect of digital transformation and its formation mechanism. Second, through DuPont decomposition, it precisely locates the nonlinear effect in the channel through which revenue is converted into profit. Third, it introduces three external environment dimensions to reveal how the external environment moderates the inverted U-shaped relationship.
The remainder of this paper proceeds as follows. Section 2 reviews the related literature and develops the research hypotheses. Section 3 describes the sample, the variables and their measurement, and the empirical models. Section 4 reports the descriptive statistics, the baseline and DuPont results, the robustness and endogeneity tests, and the moderating and heterogeneity analyses. Section 5 discusses the findings in relation to prior research, and Section 6 concludes with implications and directions for future work.
2. Literature Review and Hypotheses
2.1. Literature Review
The performance effects of digital transformation have been a sustained concern in strategic management, corporate finance, and information systems research, with related work proceeding roughly along two strands. The first strand focuses on the direct efficiency effects of digital transformation, emphasizing how it improves performance through information improvement, process optimization, and cost reduction. Wu et al. [19] construct a digital transformation indicator from annual-report text and find that it improves capital-market performance by reducing information asymmetry and enhancing operating efficiency; Zhao et al. [20] confirm that digital transformation promotes total factor productivity; Zhai et al. [21] likewise document a positive digital transformation–performance link among Chinese firms. Building on these studies, a large body of work documents positive effects of digital transformation on total factor productivity and firm performance, identifying multiple channels including information intermediation, innovation investment, division of labor, and management reform [22,23,24,25,26,27,28,29,30,31,32,33]. Among them, Davies et al. [34] further reveal a moderated-mediation path through which digital capabilities act on financial performance via service capabilities. This strand establishes the empirical basis for the “efficiency view” of digital transformation, yet its implicit assumption is a monotonic linear relationship between digital transformation and performance output.
The second strand revises the linear efficiency view, arguing that the performance effect of digital transformation is not monotonically increasing. The theoretical starting point of this revision is diminishing marginal returns: the benefits of digital transformation are constrained by absorptive capacity and organizational fit, so that once investment exceeds the firm’s integration and transformation capacity, the marginal benefit of additional investment narrows. Teng et al. [15] find that the effect of digital transformation on SME performance is constrained by absorptive capacity; Truong and Ngo [35] show that some firms are even harmed by transformation, suggesting that the linear assumption that digital transformation inevitably improves performance is untenable. The meta-analysis of Pu and Liu [16], the dynamic-capability mediation findings of Valdez-Juárez et al. [17], and the transformational-leadership antecedents studied by Gun et al. [36] all indicate that the realization of digital transformation’s performance effect depends heavily on firms’ internal capabilities. Pierce and Aguinis’s [10] “too-much-of-a-good-thing” effect reveals that any beneficial factor may produce negative consequences at excessive levels; Ben Mim et al. [37] confirm the existence of a nonlinear “tipping point” effect in the ESG domain; and Shang et al. [9] document an inverted U-shaped relationship between digital transformation disparity and firm performance. These studies collectively suggest that an inverted U-shaped relationship may exist between digital transformation and performance, with its shape contingent on internal capabilities and external conditions. Underlying this inverted-U is not merely diminishing returns but the misallocation of resources that excessive digital investment entails: beyond some point, additional investment diverts capital, talent, and managerial attention from more productive uses and erodes the value it is meant to create.
A final body of evidence highlights the context-dependence of the digital transformation–performance relationship, reinforcing the need to incorporate environmental contingencies. Studies conducted across different institutional settings—developed and emerging economies, manufacturing and service sectors, and large and small firms—frequently reach divergent conclusions about whether and how much digital transformation improves performance [15,35,36]. This divergence suggests that the returns to digital transformation are not universal but are shaped by the competitive and resource conditions that firms face. Such context-dependence aligns with the external environment framework of Dess and Beard [18]: munificence, dynamism, and complexity capture exactly the contextual dimensions most likely to condition the value of digital transformation. Systematically incorporating these dimensions therefore responds to a recurrent but underexplored theme in the empirical literature.
2.2. Theoretical Analysis and Research Hypotheses
2.2.1. Digital Transformation and Profitability Under Resource Orchestration Theory
Resource orchestration theory, proposed by Sirmon et al. [11,12], holds that value creation depends not on the static possession of resource endowments but on managers’ dynamic processes of structuring, bundling, and leveraging resource portfolios. Its core proposition is that the value of resources is not endogenously given but is activated by managers’ orchestration behaviors; accordingly, the same resource may contribute systematically different performance under different orchestration capabilities and depths. In terms of theoretical lineage, resource orchestration theory extends and integrates the resource-based view (Barney [38]) and dynamic capabilities theory (Teece et al. [39]), shifting the analytical focus from resource stocks to the dynamic process of resource configuration and offering a more powerful perspective for understanding the performance effects of strategic investments such as digital transformation.
Digital transformation, as a deliberate digital business strategy [40,41], is a systematic resource orchestration activity: firms reconfigure their resource portfolios by introducing digital technologies, integrate digital capabilities with business processes, organizational routines, and human capital, and convert them into performance outcomes such as cost reduction, efficiency gains, and market expansion. In the early stages, the integration of information, capital, and business flows releases synergy dividends—lower transaction costs, less production waste, and better operating efficiency—so that synergy gains exceed coordination costs and profitability rises. Once digital transformation crosses a threshold, however, diminishing marginal returns and the coordination costs arising from rising organizational complexity gradually exceed the synergy gains, and excessive digital transformation erodes profitability [13], so that the gains to net profit margin are not self-sustaining once the threshold is crossed. The durability of profitability is the firm’s economic sustainability, which in turn underpins its capacity to meet environmental and social responsibilities. This accords with absorptive capacity theory, under which the marginal value of resources is capped by the firm’s capacity for integration and transformation [42]. Among the three DuPont components, this study focuses on net profit margin—the share of sales retained as net income—because it is the channel through which the operating costs of digital transformation most directly compress profit from a given revenue stream [43,44] and through which the diminishing returns on new commercial scenarios converge. Total asset turnover and the equity multiplier capture asset efficiency and financial leverage, respectively, which are mechanisms distinct from the cost-and-margin channel emphasized here [45,46]. This study therefore concentrates its analysis on net profit margin while acknowledging that digital transformation may also influence the other two components.
Hypothesis H1.
There is a significant inverted U-shaped relationship between digital transformation and profitability, and this nonlinear effect operates primarily through net profit margin—the channel through which revenue is converted into profit.
2.2.2. External Environment Framework and Moderating Hypotheses
Given that the nonlinear effect of digital transformation is most salient in the revenue-to-profit channel, the core question from a resource orchestration perspective is which element of the external environment can mitigate the profit decline in the later stage of digital transformation. The decline in net profit margin as digital transformation deepens is essentially a process in which marginal net returns turn from positive to negative, and marginal net returns depend on two opposing forces: diminishing marginal returns on the benefit side—the higher the degree of digital transformation, the more limited the new commercial scenarios that digital capabilities can serve, so that the revenue and profit increments from additional investment narrow; and increasing marginal costs—the deeper the transformation, the greater the difficulty of integrating and correcting systems, departments, and old and new businesses, so coordination costs accumulate faster. Accordingly, any external condition that alleviates diminishing marginal returns or restrains increasing marginal costs can flatten the inverted U-shaped relationship for net profit margin. Building on early work on environmental uncertainty (Duncan [47]), Dess and Beard [18] partition the external environment into munificence, dynamism, and complexity, providing an apt framework for systematically examining these conditions. Following Haans et al. [48], we simultaneously examine the effects of moderators on both the slope and the curvature of the relationship so as to identify whether the external environment flattens or steepens the curve.
2.2.3. Moderating Effect of Industry Munificence
Munificence characterizes the resource abundance and growth opportunities that the environment provides, usually measured by industry revenue growth [18,49]. In high-munificence industries, demand keeps expanding and provides a continuous stream of commercial application scenarios for the release of digital capabilities. On the revenue side, in high-growth industries, the product and service capabilities enhanced by digital transformation can continuously serve new market demand, allowing revenue to keep growing in the later stage of digital transformation, thereby diluting the squeeze of rising costs on net profit margin, sustaining the improvement in net profit margin, and alleviating diminishing marginal returns. At the same time, a munificent resource environment provides a buffer for organizational integration, technological experimentation, and continuous learning, slowing the accumulation of coordination costs as digital transformation deepens [50]. By contrast, in low-munificence industries, market demand tends toward saturation; once digital capabilities exceed the ceiling of a firm’s absorptive capacity [16], new application scenarios become hard to find, marginal returns fall quickly, and the right tail of the inverted U-shaped curve declines more steeply. Accordingly, we propose Hypothesis H2.
Hypothesis H2.
Industry munificence significantly weakens the inverted U-shaped relationship between digital transformation and net profit margin, flattening the curve.
2.2.4. Moderating Effect of Environmental Dynamism
Dynamism characterizes the speed and unpredictability of environmental change, usually measured by the uncertainty of firm sales revenue [18,47,51]. The moderating effect of a highly dynamic environment on digital transformation operates mainly through two channels. First, in a highly uncertain environment, firms face stronger survival pressure and shorter decision cycles and tend to maintain organizational flexibility and a prudent investment pace, avoiding blind and excessive digital expansion, thereby restraining the cost-increasing effect of excessive digital transformation. Second, high environmental volatility makes it difficult for firms to lock into a fixed digital transformation path, reducing path-dependence and rigid-lock-in risk, so that digital transformation can be adjusted more flexibly as the environment changes, thereby alleviating diminishing marginal returns and sustaining the returns to digital transformation in its later stage. This direction is consistent with Shang et al. [9] finding that policy uncertainty flattens the inverted U-shaped curve, namely that an uncertain environment induces firms to adopt more prudent and flexible strategic investment. Accordingly, we propose Hypothesis H3.
Hypothesis H3.
Environmental dynamism significantly weakens the inverted U-shaped relationship between digital transformation and net profit margin, flattening the curve.
2.2.5. Moderating Effect of Industry Complexity
Complexity characterizes the heterogeneity of environmental elements and the intensity of competition, usually measured by industry concentration (the Herfindahl index) [18,49]. In a highly complex environment, firms confront a dense and unpredictable configuration of rivals and competitive moves and face strong pressure to keep pace with one another’s digital investments. This pressure tends to trigger an arms race in digital investment: to maintain competitive position, firms are induced to blindly expand digital transformation, which amplifies the risk of excessive digital transformation [13] and accelerates the accumulation of coordination costs in the later stage, thereby steepening the inverted U-shaped curve. Although competitive pressure could in principle also discipline firms into prudent investment—paralleling the inverted-U relationship between competition and innovation documented by Aghion et al. [52]—the difficulty of anticipating rivals’ actions and the threat of falling behind make over-investment the more likely outcome in a complex environment. Accordingly, we propose Hypothesis H4.
Hypothesis H4.
Industry complexity significantly strengthens the inverted U-shaped relationship between digital transformation and net profit margin, steepening the curve.
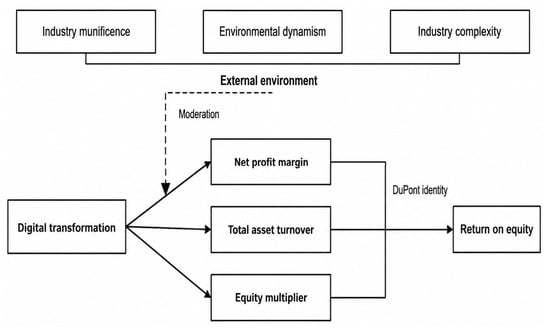
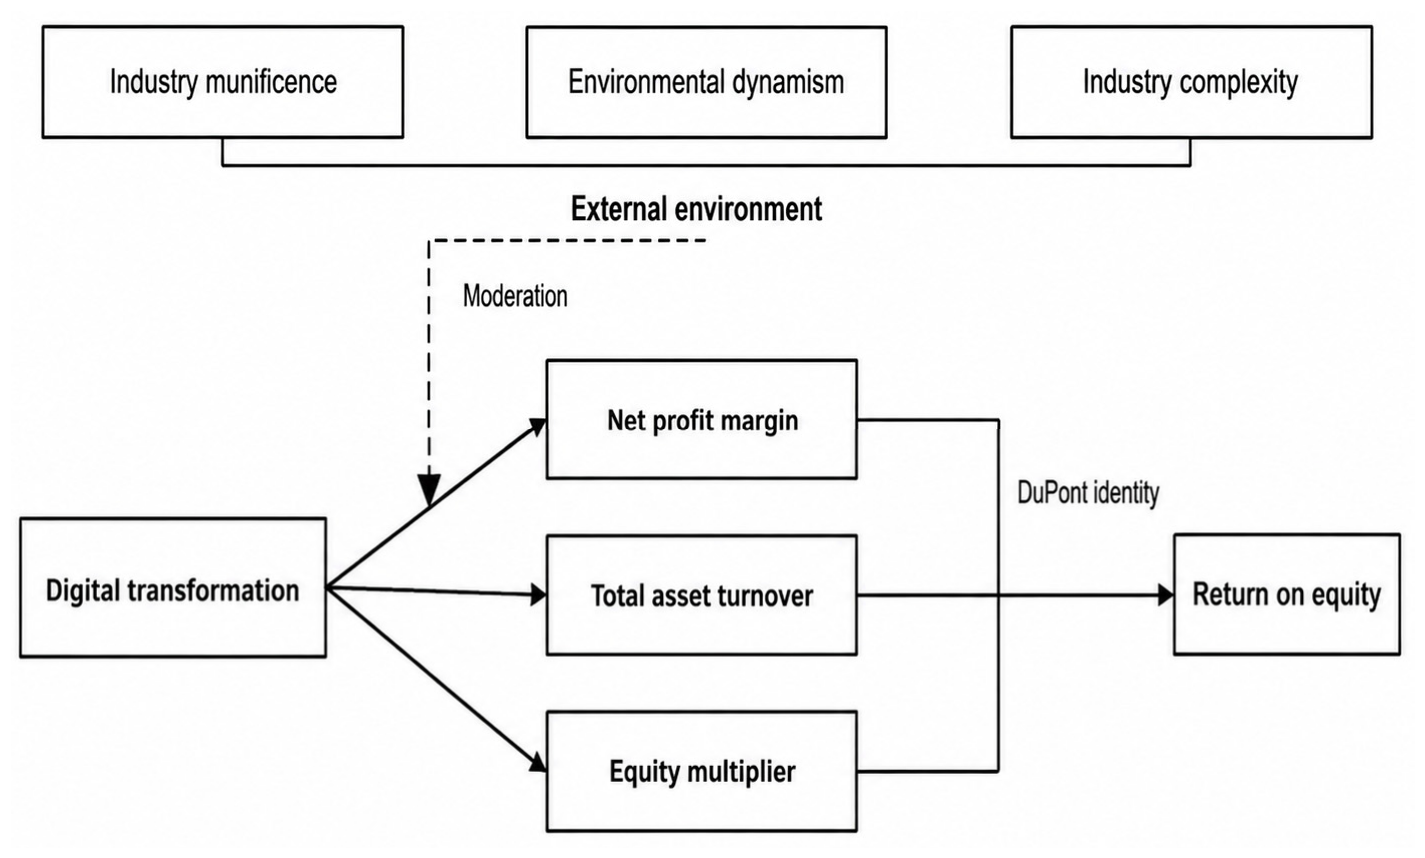
Figure 1 summarizes the proposed theoretical framework.
Figure 1.
Theoretical framework. The dashed line denotes hypothesized moderation of the digital transformation–net profit margin relationship; the right-hand grouping represents the DuPont identity.
3. Materials and Methods
3.1. Sample and Data
Because the key independent variable, the dependent variable, and all moderating and control variables in this study are sourced from the CSMAR database, at the stage when this study was conducted, the firm-level financial and digital transformation data for later years had not yet been fully collected, verified, and officially released in the database, and their completeness and reliability could not meet the requirements of empirical analysis. This study therefore selects Chinese A-share listed firms from 2013 to 2023 as the initial sample. This interval covers the critical stage of China’s digital economy from its inception to rapid expansion, and digital information in annual reports has become more standardized since 2013, providing a data foundation for word-frequency-based digital transformation measurement. We exclude financial and insurance firms and firms under special treatment (ST) or delisting-risk warning, drop observations with missing key variables, and winsorize continuous variables at the 1st and 99th percentiles to mitigate the influence of outliers. Digital transformation data are obtained from annual-report word-frequency statistics, and financial and governance data are obtained from the China Stock Market and Accounting Research (CSMAR) database. After these procedures, the final sample comprises 24,734 firm-year observations covering 3364 firms.
The sample spans multiple industries and both state-owned and non-state-owned firms, providing substantial cross-sectional variation in the degree of digital transformation and in the external environment. The long panel structure—covering more than a decade—allows us to exploit within-firm variation in digital transformation over time while controlling for time-invariant firm heterogeneity through firm fixed effects. Year fixed effects further absorb common macroeconomic and policy shocks, so that the estimated relationship reflects the firm-specific association between changes in digital transformation and changes in profitability rather than cross-sectional level differences.
3.2. Variable Definitions
We use return on equity (ROE), computed as net income divided by shareholders’ equity, to represent overall profitability. To trace the source of any profitability effect, we follow the DuPont decomposition and examine three components of ROE: net profit margin (NPM), computed as net income divided by operating revenue; total asset turnover (ATO), computed as operating revenue divided by total assets; and the equity multiplier (EM), computed as total assets divided by shareholders’ equity [45,46,53]. These components respectively capture profit quality, asset operating efficiency, and financial leverage. The component regressions indicate where the digital transformation–profitability association is most evident; net profit margin, which reflects the conversion of revenue into net income, is the dependent variable for the moderation, robustness, and heterogeneity analyses. The core explanatory variable is the degree of digital transformation. Among the available measures of digital transformation—annual-report word-frequency counts, information-technology investment, and questionnaire-based maturity scales—we adopt the word-frequency approach because it is standardized, replicable, and well suited to large panels of Chinese listed firms [19,20]. Following Wu et al. [19] and Zhao et al. [20], we construct a composite digital transformation index as ln(1 + word frequency) from annual-report disclosures concerning artificial intelligence, big data, cloud computing, blockchain, and digital technology applications. This word-frequency measure is a disclosure-based proxy for digital transformation. Annual reports are the authoritative, regulated channel through which managers systematically describe firm strategy and operations; because digital transformation is a major strategic commitment, firms that substantively pursue it disclose their transformation initiatives, progress, and spending in concrete terms, with higher keyword frequency and deeper discussion, whereas firms with little real implementation have little substance to disclose. Keyword frequency therefore captures the disclosed strategic emphasis and, by extension, the resource commitment to digital transformation. The complete keyword dictionary is provided in Appendix C.
The moderating variables are the three external environment dimensions. First, industry munificence (IndGrowth) is measured by industry revenue growth, reflecting the resource abundance and growth opportunities of the industry in which the firm operates [18,49]. Second, environmental dynamism (EU) is measured, following Ghosh and Olsen [51], by the coefficient of variation of firm sales revenue adjusted for industry effects, reflecting the speed and unpredictability of environmental change. Third, industry complexity (HHI) is measured by the industry Herfindahl index, capturing the intensity of competition and concentration [18]. All three moderators are winsorized at the 1st and 99th percentiles and mean-centered before regression.
Control variables include firm age (FirmAge), board size (Board), the proportion of independent directors (Indep), CEO duality (Dual), the cash-flow ratio (Cashflow), ownership nature (SOE), the shareholding of the largest shareholder (Top1), and firm size (Size). Firm age is the natural logarithm of the number of years since the firm’s establishment; board size is the natural logarithm of the number of directors; the proportion of independent directors is the ratio of independent directors to the total number of directors (in percent); CEO duality is an indicator equal to one if the chairman and the chief executive officer are the same person and zero otherwise; the cash-flow ratio is operating cash flow divided by total assets; ownership nature is an indicator equal to one for state-owned enterprises and zero otherwise; the shareholding of the largest shareholder is the proportion of shares held by the largest shareholder; and firm size is the natural logarithm of total assets. These variables capture life-cycle stage, resource endowment, governance characteristics, financial condition, ownership concentration, and the systematic differences between state-owned and non-state-owned firms, and their construction follows standard practice in the corporate finance and corporate governance literature.
3.3. Model Specification
To test the inverted U-shaped effect of digital transformation on profitability, we estimate the following two-way fixed-effects model:
where is the profitability of firm i in year t; is the degree of digital transformation; is a vector of control variables; and are firm and year fixed effects that absorb time-invariant firm characteristics and macroeconomic shocks, respectively; and is the error term. A significantly positive together with a significantly negative indicates an inverted U-shaped relationship. We further apply the Lind–Mehlum test [54] to rigorously assess the overall significance of the inverted U-shape, which requires the slope to be significantly positive at the lower bound and significantly negative at the upper bound of the data range, with the turning point located inside the data interval.
To test the moderating effects of the three external environment dimensions, we augment model (1) with the moderator and its interactions with the linear and quadratic terms:
where is the moderator and the dependent variable is net profit margin to examine the sales-based profitability component highlighted by the DuPont analysis. Following Haans et al. [48], the interaction coefficient captures the effect of the moderator on the curvature of the inverted U-shaped relationship: a significantly positive indicates that the moderator flattens the curve, whereas a significantly negative indicates a steeper curve.
In terms of estimation, we use a two-way fixed-effects model with firm fixed effects to absorb time-invariant individual heterogeneity and year fixed effects to control for common shocks from the macroeconomic cycle and the policy environment. Because observations of the same firm across years may be correlated, standard errors are clustered at the firm level to obtain inference robust to serial correlation and heteroskedasticity. In addition, to avoid multicollinearity between the linear and quadratic terms, we mean-center digital transformation before constructing the quadratic term; because the curvature (β2) is invariant to centering, this does not affect the economic interpretation of the core results but makes the linear coefficient reflect the marginal effect at the sample mean, which is easier to interpret. All statistical analyses were performed using Stata 18.0 (StataCorp LLC, College Station, TX, USA).
4. Results
4.1. Descriptive Statistics
Table 1 reports the descriptive statistics of the main variables. Net profit margin has a mean of 0.066 and a median of 0.058, ranging from −0.471 to 0.529, indicating substantial cross-firm variation in profitability. Digital transformation has a mean of 1.636 and a median of 1.386, ranging from 0.000 to 5.069, with a mean clearly above the median and a right-skewed distribution, indicating that a minority of firms have already reached a high level of digital transformation, which provides sample support for observing both ends of the inverted U-shaped relationship. Regarding the moderators, industry munificence (IndGrowth) has a mean of 0.122 and a median of 0.113, environmental dynamism (EU) has a mean of 1.290 and a median of 1.000, and industry complexity (HHI) has a mean of 0.089 and a median of 0.063; all three external environment dimensions exhibit sufficient cross-sectional variation. The distributions of the remaining control variables are within reasonable ranges.
Table 1.
Descriptive statistics.
Two features of the descriptive statistics are particularly relevant to the analysis that follows. First, the substantial dispersion of net profit margin—with a standard deviation of 0.139 relative to a mean of 0.066—indicates that profitability differs markedly across firms and over time, which provides the variation needed to identify the effect of digital transformation. Second, the right-skewed distribution of digital transformation, together with its wide range from zero to above five, ensures that the sample contains both firms with little digital involvement and firms that have already become digitally intensive, which is essential for observing both the rising and the falling segments of an inverted U-shaped relationship.
4.2. Baseline Results: Digital Transformation, Profitability, and DuPont Components
Table 2 reports the baseline regression and the DuPont decomposition. In column (1), with return on equity as the dependent variable, the linear coefficient of digital transformation is 0.046, significantly positive at the 1% level, and the quadratic coefficient is −0.216, significantly negative at the 1% level. In column (2), with net profit margin as the dependent variable, the linear coefficient is 0.041, significantly positive at the 1% level, and the quadratic coefficient is −0.252, significantly negative at the 1% level. The combination of a significantly positive linear term and a significantly negative quadratic term provides preliminary evidence of an inverted U-shaped relationship between digital transformation and profitability, supporting Hypothesis H1.
Table 2.
Baseline results: digital transformation, profitability, and DuPont components.
Columns (3) and (4) examine the other DuPont components. In column (3), with total asset turnover as the dependent variable, the linear coefficient is 0.110, significantly positive at the 1% level, and the quadratic coefficient is −0.139 but insignificant (t = −0.76), providing no evidence of a quadratic association with asset operating efficiency. In column (4), with the equity multiplier as the dependent variable, the linear coefficient is −0.533, significantly negative at the 1% level, and the quadratic coefficient is −0.008 but insignificant (t = −0.01), indicating a negative linear association with the equity multiplier but no evidence of an inverted U-shaped association. These results are consistent with the theoretical expectation: the strongest evidence of nonlinearity among the components appears in net profit margin, while neither total asset turnover nor the equity multiplier exhibits a significant inverted U-shape, consistent with the proposed profit-conversion interpretation. Linear estimates for the other two DuPont components are reported in Appendix A.
To further rigorously test the overall significance of the inverted U-shaped relationship, we apply the Lind–Mehlum test [54], reported in Table 3. The results show that for both return on equity and net profit margin, the slope is significantly positive at the lower bound and significantly negative at the upper bound, and the turning point lies within the observed sample range, satisfying the strict criteria for an inverted U-shape; the overall tests are significant at the 5% and 1% levels, respectively. About 30% of the observations have passed the turning point and lie to the right of the estimated turning point, where the fitted association with profitability is negative.
Table 3.
Lind–Mehlum test for the inverted U-shaped relationship.
In terms of economic significance, the fitted net profit margin relationship rises and then falls. From a digital transformation level of zero to the estimated turning point, the fitted net profit margin increases by about 1.5 percentage points before declining at higher levels. Relative to the standard deviation of net profit margin (about 0.14), this change is economically meaningful. The result motivates a closer examination of how digital transformation is associated with the conversion of sales into profit and how the external environment shapes that association.
4.3. Robustness Checks and Endogeneity
We conduct robustness checks along three dimensions—alternative variable measurement, sample adjustment, and alternative clustering—reported in Table 4. Column (1) is the baseline; column (2) replaces the word-frequency measure with Zhao’s digital transformation index (Dig2), and the quadratic coefficient is −14.888, significantly negative at the 1% level, so the inverted U-shaped relationship is robust; column (3) excludes municipalities, and the quadratic coefficient is −0.262, significantly negative at the 1% level; column (4) excludes the years 2015 and 2020 to rule out the influence of major exogenous shocks such as the stock market crash and the COVID-19 pandemic, and the quadratic coefficient is −0.301, significantly negative at the 1% level; and column (5) clusters standard errors at the city level to allow cross-sectional correlation of the error terms of firms within the same city, and the quadratic coefficient is −0.252, significantly negative at the 1% level. The quadratic coefficient is significantly negative in every column, indicating that the core finding that excessive digital transformation erodes profitability is highly robust to the choice of measurement, sample, and clustering.
Table 4.
Robustness checks.
Zhao’s digital transformation index (Dig2) is a multidimensional alternative to the baseline measure that combines a text-based sub-index with expert scoring, providing a conceptually distinct robustness check.
Beyond these robustness checks, the relationship between digital transformation and profitability may still suffer from endogeneity arising from reverse causality and omitted variables: more profitable firms may have more resources to invest in digital transformation, and some unobservable factors may simultaneously affect digital transformation decisions and profitability. We mitigate this concern using two-stage least squares (2SLS), reported in Table 5. Because the inverted U-shaped model includes both the linear and quadratic terms of digital transformation, we treat both as endogenous: in the first stage, the instruments and their squares are used to predict each endogenous variable separately, and in the second stage, the first-stage fitted values are substituted into the main equation, identifying the linear and curvature terms jointly and avoiding the inconsistency induced by the “forbidden regression” on the quadratic endogenous variable.
Table 5.
Endogeneity: instrumental variable estimation (2SLS).
We use the leave-one-out industry-year mean of peer firms’ digital transformation and its square as instruments for the linear and quadratic digital transformation terms. Regarding relevance, demonstration, imitation, and information-spillover effects among industry peers imply that a firm’s own digital transformation decision responds to the digitalization of its peers, so the peer measure is correlated with the focal firm’s digital transformation. Regarding exogeneity, the leave-one-out construction excludes the focal firm’s own digital transformation from the peer measure, which mechanically removes the reflection problem and the direct mechanical link between the instrument and the focal firm’s own profitability. In addition, because the peer measure aggregates the digitalization of other firms in the industry and is driven primarily by industry-level technological trends and peer characteristics rather than by any single firm’s idiosyncratic profitability shocks, it has no direct channel to an individual firm’s profitability other than through that firm’s own digital transformation, conditional on firm and year fixed effects. The first-stage diagnostics reported below provide formal confirmation of instrument relevance.
The first-stage results show that the Kleibergen–Paap rk LM statistic is 94.063, significantly rejecting under-identification at the 1% level. In the weak-instrument tests, the Cragg–Donald Wald F statistic is 162.988 and the Kleibergen–Paap rk Wald F statistic is 51.257, both far exceeding the Stock–Yogo 10% maximal size critical value of 7.03, providing evidence of instrument relevance in this specification. In the first-stage regressions, the leave-one-out peer digital transformation index and its square are both individually significant predictors of the endogenous regressors: peer digital transformation predicts the linear term positively (coefficient 0.512, t = 6.80), and its square predicts the squared term positively (coefficient 0.629, t = 15.02), confirming that the instruments are relevant for each endogenous variable. In the second stage, the linear coefficient of digital transformation is 0.275, significantly positive at the 5% level, and the quadratic coefficient is −2.215, significantly negative at the 1% level; in the instrumental variable specification, the pattern of a positive linear term and a negative quadratic term persists, remaining consistent with the inverted U-shaped relationship.
4.4. Further Analysis
The baseline and robustness results establish a robust inverted U-shaped relationship between digital transformation and profitability, most pronounced in the net profit margin component. To further reveal the contingency boundaries of this relationship, this section proceeds along two dimensions—external environment moderation and firm-characteristic heterogeneity: we first test the moderating effects of the three external environment dimensions and then examine heterogeneity at the firm-characteristic level.
4.4.1. Moderating Effects
Table 6 reports the moderating effects of the three external environment dimensions, with net profit margin as the dependent variable throughout. Column (1) introduces industry munificence, and the interaction between the quadratic term and munificence is 1.281, significantly positive at the 1% level; column (2) introduces environmental dynamism, and the interaction between the quadratic term and dynamism is 0.117, significantly positive at the 5% level. Following Haans et al. [48], a significantly positive interaction indicates that the moderator weakens the curvature of the inverted U-shaped relationship; industry munificence and environmental dynamism therefore both significantly flatten the inverted U-shaped relationship, supporting Hypotheses H2 and H3. Column (3) measures industry complexity by the Herfindahl index, and the interaction between the quadratic term and complexity is 0.500 (t = 0.78), insignificant; Hypothesis H4 is not supported, so the data do not provide evidence for moderation by this measure of industry complexity. This null result is plausible for several reasons. First, industry complexity, as captured by the HHI, combines two opposing forces [52] identified in our theoretical analysis—a competition-intensifying “arms race” effect that would steepen the curve and a competition-driven prudence effect that would flatten it—and these forces may largely offset one another, yielding no net moderating effect. Second, the HHI reflects market concentration at the industry level, which may be only weakly related to the firm-specific coordination costs and competitive pressures that shape the digital transformation–profitability relationship; a broad industry-level concentration measure may simply lack the granularity to detect moderation [18,47]. Third, in a sample dominated by relatively large, listed firms, the competitive discipline hypothesized to operate through industry complexity may already be internalized in firms’ investment decisions, leaving little incremental variation for the interaction to explain [49]. These considerations suggest that the null result reflects both a genuine theoretical indeterminacy and the limitations of the HHI as a proxy for the specific mechanisms at work.
Table 6.
Moderating effects of the three external environment dimensions.
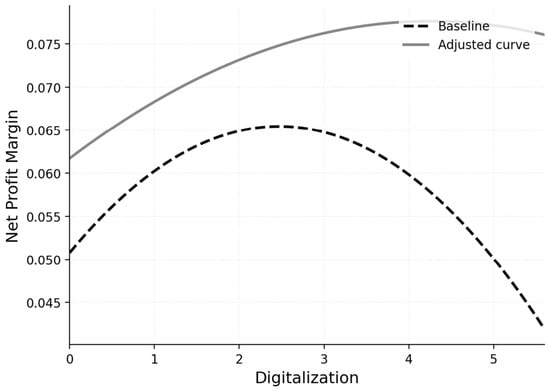
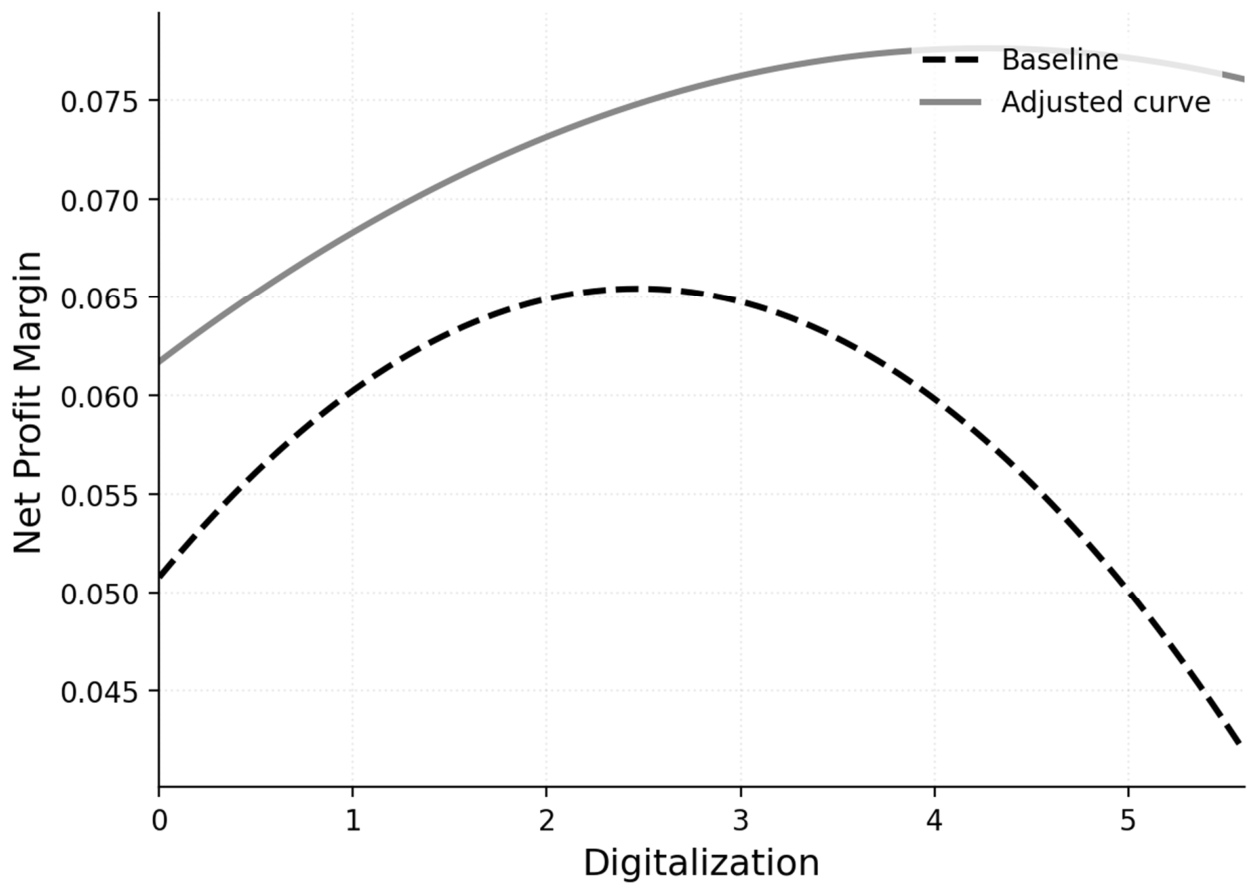
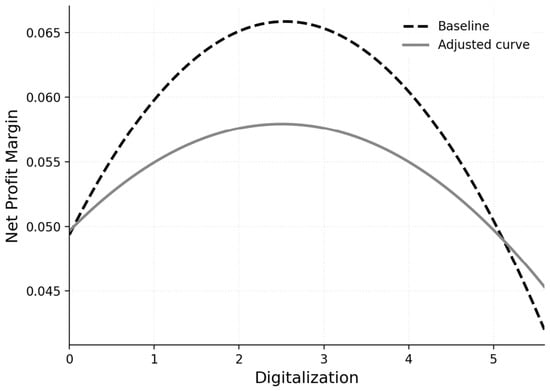
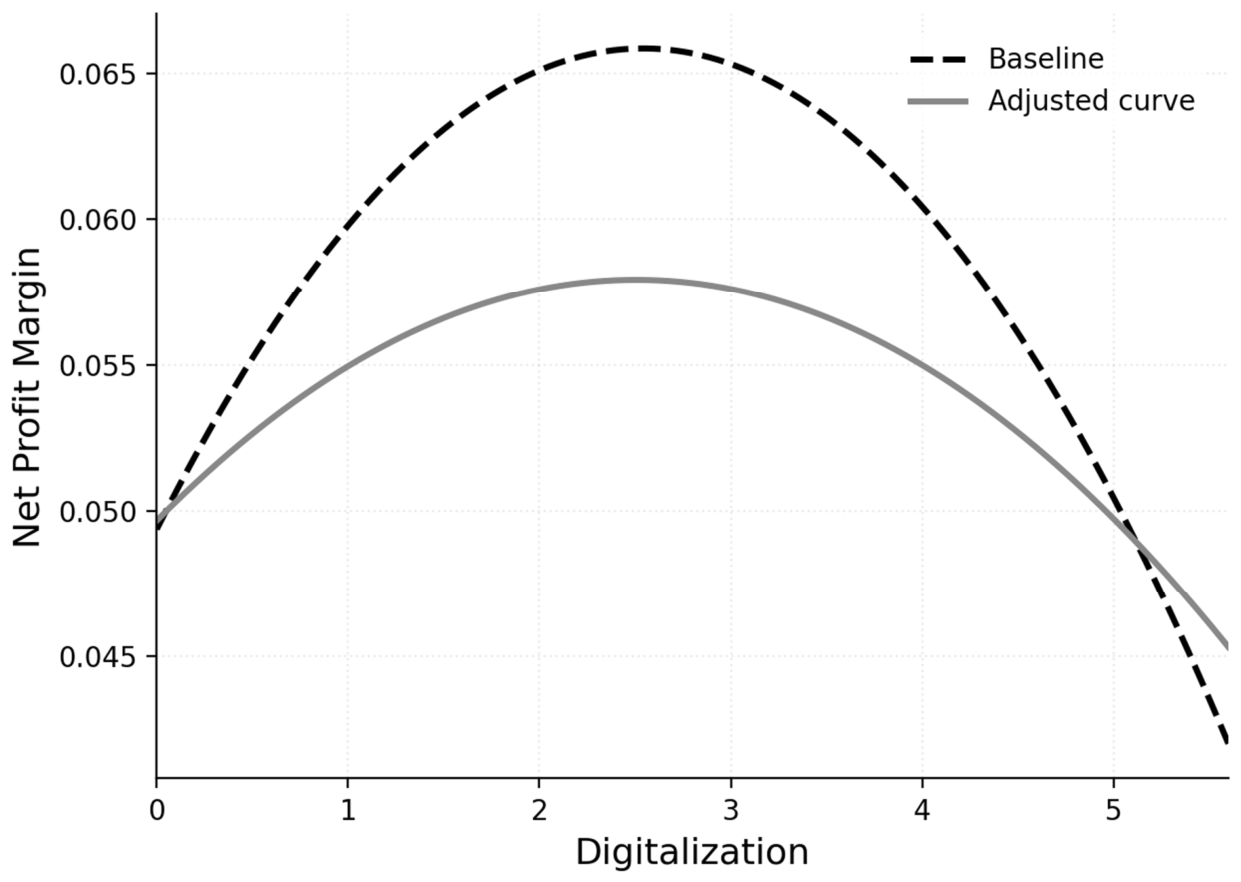
The moderation results admit two related economic interpretations. In growing industries, expanding demand may support the commercial application of digital capabilities and help firms retain more profit from additional sales. In dynamic environments, timely information and adaptation may strengthen the fit between digital initiatives and changing market conditions. Consistent with these arguments, the positive quadratic interactions imply less pronounced curvature in the fitted digital transformation–net profit margin relationship. Figure 2 and Figure 3 illustrate these differences in curve shape across levels of industry munificence and environmental dynamism.
Figure 2.
Moderating effect of industry munificence on the inverted U-shaped relationship.
Figure 3.
Moderating effect of environmental dynamism on the inverted U-shaped relationship.
Figure 2 displays the fitted digital transformation–net profit margin relationship at different levels of industry munificence. The curve associated with greater munificence is flatter.
Figure 3 displays the fitted relationship at different levels of environmental dynamism. The curve associated with greater dynamism is flatter.
4.4.2. Heterogeneity Analysis
We further examine the structural differences in the effect of digital transformation. Unlike the interaction specification above, this section uses subsample regressions and reports the between-group coefficient differences: the continuous grouping variables are split by whether they exceed the full-sample median, the tested coefficient is the quadratic term (inverted-U curvature), and the significance of the between-group difference is assessed by Fisher’s permutation test (randomly permuting group labels at the firm level), reported in Table 7. Appendix B reports between-group differences in the fitted curvature.
Table 7.
Heterogeneity analysis: subsample regressions.
From the perspective of Tobin’s Q, the quadratic coefficient in the high-Tobin’s-Q group is −0.367, significantly negative at the 1% level, whereas that in the low-Tobin’s-Q group is −0.014 and insignificant. From the perspective of R&D intensity, the quadratic coefficient in the high-R&D group is −0.380, significantly negative at the 1% level, whereas that in the low-R&D group is −0.084 and insignificant. Fisher’s permutation test shows that the between-group difference in curvature is significant at the 1% level for the Tobin’s-Q split (p = 0.008) and at the 5% level for the R&D split (p = 0.026).
The two heterogeneity results show a consistent pattern: the inverted U-shaped relationship is significant for high-Tobin’s-Q and high-R&D firms, whereas the quadratic coefficients of low-Tobin’s-Q and low-R&D firms are insignificant, indicating that the inverted U-shaped value-creation effect of digital transformation is concentrated in high-growth and high-R&D firms. This pattern is consistent with the expectation of resource orchestration theory: the value creation of digital transformation has a clear boundary, and its concrete manifestation is the match between a firm’s resource orchestration capability and the depth of its digital transformation.
5. Discussion
This study brings a DuPont perspective to the digital transformation–profitability literature. The aggregate ROE result is examined alongside its three accounting components, with the clearest nonlinear evidence emerging in net profit margin. This comparison motivates a focused test of how external conditions moderate the relationship between digital transformation and profit retained from sales while retaining asset utilization and financing structure in the broader interpretation of ROE.
The findings are consistent with research emphasizing both the operating benefits and the adjustment costs of digital transformation. The positive slope over the lower range echoes studies documenting efficiency gains from digital transformation in China [19,20,21], while the declining segment is consistent with the “too-much-of-a-good-thing” effect of Pierce and Aguinis [10], the absorptive capacity constraints emphasized by Teng et al. [15], and the uneven gains documented by Truong and Ngo [35]. Most directly, the inverted U-shape parallels the nonlinear evidence of Shang et al. [9] and the digitalization paradox highlighted by Gebauer et al. [14], in which digital transformation does not translate into commensurate revenue or profit growth, and the inverted U-shaped effect on total factor productivity documented by Wang and Han [55], whose finding of a marginal-decreasing benefit beyond a critical degree of digitalization mirrors our own. The threshold pattern reported by Wang et al. [56]—significant performance gains only at medium and high levels of digitalization—further indicates that the returns to digitalization are not uniform across its intensity. Our study differs from these prior works by locating the nonlinear effect specifically in the net profit margin component of the DuPont identity, a distinction that none of the earlier studies draws.
The mechanism-level evidence reinforces our DuPont interpretation. Du and Jiang [24] show that digital transformation raises firm productivity through innovation, human capital, operating capability, and investment efficiency—channels that map onto the cost and efficiency dimensions we isolate through net profit margin—and Wang et al. [56] similarly identify improved operating efficiency and reduced production costs as the two mediating paths. The contingency of these returns is also evident across institutional settings: Valdez-Juárez et al. [17] find that the performance effect of digital transformation in Mexican small and medium-sized enterprises depends on innovation and dynamic capabilities, and Gun et al. [36] report that environmental uncertainty strengthens the digital transformation–performance relationship among Turkish firms. These international patterns are consistent with our finding that external conditions—industry munificence and environmental dynamism—systematically shape the net profit margin relationship. Because the erosion of profitability is concentrated in net profit margin, the returns to digital transformation are durable only when firms convert additional digital activity into retained profit rather than into sales or asset growth alone.
Endpoint-slope tests, alternative specifications, and the instrumental variable estimates provide convergent evidence for the inverted U-shaped association. The fixed-effects and moderation results are interpreted as conditional associations, with causal interpretation of the 2SLS estimates depending on the instrument assumptions.
Future research can extend this framework by combining annual-report disclosures with measures of actual digital implementation and organizational adjustment. Broader firm samples and richer industry indicators would allow comparisons across institutional and competitive settings. Longitudinal process evidence could further clarify how firms align digital transformation, organizational capabilities, and external opportunities as transformation progresses.
6. Conclusions
Using Chinese listed firms from 2013 to 2023, this study identifies inverted U-shaped associations of digital transformation with ROE and net profit margin. Among the DuPont components, the nonlinear evidence is strongest for net profit margin. Industry munificence and environmental dynamism are associated with flatter net profit margin curves, while the HHI-based complexity measure shows no statistically significant moderating association. These findings show how the profitability associated with digital transformation varies across both accounting components and external operating conditions: digital transformation yields durable value only when it converts additional digital activity into retained net income.
In conclusion, digital transformation is associated with stronger sales-based profitability up to a point, after which further digital transformation is associated with a weaker net profit margin. Asset utilization and profit retention need not move together. Consistent with our findings that higher industry munificence and environmental dynamism flatten the inverted U-shape, the durability of these returns depends on how effectively firms convert additional digital activity into net income within a favorable operating environment. For managers, the practical implication is to monitor net profit margin—rather than sales or asset turnover alone—as the leading indicator of whether digital initiatives are still creating value and to slow or redirect digital transformation once the marginal conversion of sales into profit turns negative. For policymakers, the findings caution against treating the breadth of digital adoption as synonymous with value creation and suggest that incentives promoting sustainable digital transformation should be tied to measures of profitability rather than to the scale of digital activity. In short, the durable value of digital transformation rests on the conversion of digital activity into retained profit within a favorable operating environment, and this conversion—rather than the scale of adoption—is what firms and policymakers should monitor and reward. Guarding against such value-destroying over-investment—ensuring that digital resources are deployed within their productive limits—is therefore essential if digital transformation is to create value over the long run rather than consume it.
Author Contributions
Conceptualization, J.P. and G.S.; methodology, J.P. and G.S.; software, G.S.; validation, J.P. and G.S.; formal analysis, G.S.; investigation, J.P. and G.S.; data curation, G.S.; writing—original draft preparation, G.S.; writing—review and editing, J.P.; supervision, J.P.; project administration, J.P.; funding acquisition, J.P. All authors have read and agreed to the published version of the manuscript.
Funding
This research received no external funding.
Institutional Review Board Statement
Not applicable.
Informed Consent Statement
Not applicable.
Data Availability Statement
The raw data for this study are from the CSMAR Database. Due to the commercial license agreement, the data cannot be publicly shared and can only be accessed through the official CSMAR platform with valid authorization.
Conflicts of Interest
The authors declare no conflicts of interest.
Appendix A
Appendix A reports linear estimates for the DuPont components. Appendix B presents between-group differences in the fitted curvature.
Linear Relationship of the DuPont Components
To test the linear relationship between the other two DuPont components and digital transformation, we re-estimate the model after removing the quadratic term, reported in Table A1. The linear coefficient of total asset turnover is 0.111, significantly positive at the 1% level, and the linear coefficient of the equity multiplier is −0.532, significantly negative at the 1% level. Neither exhibits an inverted U-shaped nonlinearity, which is consistent with the baseline finding that significant quadratic terms are detected for net profit margin but not these two components.
Table A1.
Linear relationship of the DuPont components.
Appendix B. Between-Group Differences in the Inverted-U Curvature
Table A2 reports the between-group differences in the inverted-U curvature (Dig2) and the empirical p-values from Fisher’s permutation test. The results show that the between-group curvature differences for the Tobin’s-Q and R&D-intensity splits are −0.353 and −0.296, with empirical p-values of 0.008 and 0.026, significant at the 1% and 5% levels, respectively, indicating that the inverted-U curvature of high-growth and high-R&D firms is significantly stronger than that of the low groups, so the heterogeneity differences are statistically established.
Table A2.
Between-group differences in the inverted-U curvature.
Appendix C. Digital Transformation Keyword Dictionary
The digital transformation index (Dig) is constructed from the frequency of digital-related keywords in firms’ annual reports, following Wu et al. [19]. The keywords are grouped into five categories: artificial intelligence technology, blockchain technology, cloud computing technology, big data technology, and digital technology application. Table A3 lists the 76 keywords in each category.
Table A3.
Digital transformation keyword dictionary.
References
- Vial, G. Understanding digital transformation: A review and a research agenda. J. Strateg. Inf. Syst. 2019, 28, 118–144. [Google Scholar] [CrossRef] [Scilit]
- Verhoef, P.C.; Broekhuizen, T.; Bart, Y.; Bhattacharya, A.; Dong, J.Q.; Fabian, N.; Haenlein, M. Digital transformation: A multidisciplinary reflection and research agenda. J. Bus. Res. 2021, 122, 889–901. [Google Scholar] [CrossRef] [Scilit]
- Hanelt, A.; Bohnsack, R.; Marz, D.; Antunes Marante, C. A systematic review of the literature on digital transformation: Insights and implications for strategy and organizational change. J. Manag. Stud. 2021, 58, 1159–1197. [Google Scholar] [CrossRef] [Scilit]
- Nambisan, S.; Wright, M.; Feldman, M. The digital transformation of innovation and entrepreneurship: Progress, challenges and key themes. Res. Policy 2019, 48, 103773. [Google Scholar] [CrossRef] [Scilit]
- Guo, Z.; Yuan, X.; Zhou, K.; Fu, L.; Song, Y. How Does the Digital Transformation Affect the Carbon Emissions of Manufacturing Enterprises in China? The Perspective of Green Technology Innovation. Sustainability 2024, 16, 3184. [Google Scholar] [CrossRef] [Scilit]
- He, X.; Chen, W. Digital Transformation and Environmental, Social, and Governance Performance from a Human Capital Perspective. Sustainability 2024, 16, 4737. [Google Scholar] [CrossRef] [Scilit]
- Gao, B.; Qin, M.; Xie, J. Does Corporate Digital Transformation Improve Capital Market Transparency? Evidence from China. N. Am. J. Econ. Finance 2025, 76, 102363. [Google Scholar] [CrossRef] [Scilit]
- Ding, X.; Vuković, D.B.; Sokolov, B.I.; Vukovic, N.; Liu, Y. Enhancing ESG Performance through Digital Transformation: Insights from China’s Manufacturing Sector. Technol. Soc. 2024, 79, 102753. [Google Scholar] [CrossRef] [Scilit]
- Shang, H.; Liu, J.; Wang, Z.; Yang, C. The Impact of Digital Transformation Disparity on Firm Performance. Chin. J. Manag. 2024, 21, 193–201. [Google Scholar]
- Pierce, J.R.; Aguinis, H. The too-much-of-a-good-thing effect in management. J. Manag. 2013, 39, 313–338. [Google Scholar] [CrossRef] [Scilit]
- Sirmon, D.G.; Hitt, M.A.; Ireland, R.D. Managing firm resources in dynamic environments to create value: Looking inside the black box. Acad. Manag. Rev. 2007, 32, 273–292. [Google Scholar] [CrossRef] [Scilit]
- Sirmon, D.G.; Hitt, M.A.; Ireland, R.D.; Gilbert, B.A. Resource orchestration to create competitive advantage: Breadth, depth, and life cycle effects. J. Manag. 2011, 37, 1390–1412. [Google Scholar]
- Zhang, Y.; He, A.; Li, P. The Marginal Trap of Digital Transformation: Nonlinear Effects of Firm Performance from the Perspective of Resource Orchestration. J. Yunnan Univ. Finance Econ. 2026, 42, 33–53. [Google Scholar]
- Gebauer, H.; Fleisch, E.; Lamprecht, C.; Wortmann, F. Growth paths for overcoming the digitalization paradox. Bus. Horiz. 2020, 63, 313–323. [Google Scholar] [CrossRef] [Scilit]
- Teng, X.; Wu, Z.; Yang, F. Research on the Relationship between Digital Transformation and Performance of SMEs. Sustainability 2022, 14, 6012. [Google Scholar] [CrossRef] [Scilit]
- Pu, K.; Liu, W.; Ali, M. Is absorptive capacity the “panacea” for organizational development? A META analysis of absorptive capacity and firm performance from the perspective of constructivism. PLoS ONE 2023, 18, e0282321. [Google Scholar] [CrossRef] [Scilit]
- Valdez-Juárez, L.E.; Ramos-Escobar, E.A.; Hernández-Ponce, O.E.; Ruiz-Zamora, J.A. Digital transformation and innovation, dynamic capabilities to strengthen the financial performance of Mexican SMEs: A sustainable approach. Cogent Bus. Manag. 2024, 11, 2318635. [Google Scholar] [CrossRef] [Scilit]
- Dess, G.G.; Beard, D.W. Dimensions of organizational task environments. Adm. Sci. Q. 1984, 29, 52–73. [Google Scholar] [CrossRef] [Scilit]
- Wu, F.; Hu, H.; Lin, H.; Ren, X. Corporate Digital Transformation and Capital Market Performance: Evidence from Stock Liquidity. Manag. World 2021, 37, 130–144. [Google Scholar]
- Zhao, C.; Wang, W.; Li, X. How Does Digital Transformation Affect Firms’ Total Factor Productivity? Finance Trade Econ. 2021, 42, 114–129. [Google Scholar]
- Zhai, H.; Yang, M.; Chan, K.C. Does digital transformation enhance a firm’s performance? Evidence from China. Technol. Soc. 2022, 68, 101841. [Google Scholar] [CrossRef] [Scilit]
- Huang, Q.; Yu, Y.; Zhang, S. Internet Development and Manufacturing Productivity Improvement: Internal Mechanisms and Chinese Experience. China Ind. Econ. 2019, 8, 5–23. [Google Scholar]
- He, F.; Liu, H. Evaluating the Performance-Enhancing Effect of Digital Transformation of Physical Enterprises from the Perspective of the Digital Economy. Reform 2019, 4, 137–148. [Google Scholar]
- Du, X.; Jiang, K. Promoting enterprise productivity: The role of digital transformation. Borsa Istanb. Rev. 2022, 22, 1165–1181. [Google Scholar] [CrossRef] [Scilit]
- Li, S.; Tian, Y. How Does Digital Transformation Affect Total Factor Productivity: Firm-Level Evidence from China. Sustainability 2023, 15, 9575. [Google Scholar] [CrossRef] [Scilit]
- Xia, G.; Yu, Z.; Peng, X. How Does Enterprise Digital Transformation Affect Total Factor Productivity? Based on the Information Intermediary Role of Analysts’ Attention. Sustainability 2023, 15, 8601. [Google Scholar] [CrossRef] [Scilit]
- Yu, J.; Xu, Y.; Zhou, J.; Chen, W. Digital transformation, total factor productivity, and firm innovation investment. J. Innov. Knowl. 2024, 9, 100487. [Google Scholar] [CrossRef] [Scilit]
- Li, N.; Wang, X.; Wang, Z.; Luan, X. The impact of digital transformation on corporate total factor productivity. Front. Psychol. 2022, 13, 1071986. [Google Scholar] [CrossRef] [Scilit]
- Yuan, C.; Xiao, T.; Geng, C.; Sheng, Y. Digital Transformation and Firm Division of Labor: Specialization or Vertical Integration. China Ind. Econ. 2021, 9, 137–155. [Google Scholar] [CrossRef]
- Qi, Y.; Xiao, X. Enterprise Management Reform in the Digital Economy Era. Manag. World 2020, 36, 135–152. [Google Scholar]
- Liu, S.; Yan, J.; Zhang, S.; Lin, H. Can Digital Management Improve Firms’ Input-Output Efficiency? Manag. World 2021, 37, 170–190. [Google Scholar]
- Guo, L.; Xu, L. The Effects of Digital Transformation on Firm Performance: Evidence from China’s Manufacturing Sector. Sustainability 2021, 13, 12844. [Google Scholar] [CrossRef] [Scilit]
- Wang, H.; Cao, W.; Wang, F. Digital Transformation and Manufacturing Firm Performance: Evidence from China. Sustainability 2022, 14, 10212. [Google Scholar] [CrossRef] [Scilit]
- Davies, P.; Bustinza, O.F.; Parry, G.; Jovanovic, M. Unpacking the relationship between digital capabilities, services capabilities, and firm financial performance: A moderated mediation model. Ind. Mark. Manag. 2023, 115, 1–10. [Google Scholar] [CrossRef] [Scilit]
- Truong, T.; Ngo, T. Unequal Gains from Digital Transformation? Evidence on Firm Performance Heterogeneity and Endogeneity in Vietnamese Enterprises. Sustainability 2025, 17, 7309. [Google Scholar] [CrossRef] [Scilit]
- Gun, L.; Imamoglu, S.Z.; Turkcan, H.; Ince, H. Effect of Digital Transformation on Firm Performance in the Uncertain Environment: Transformational Leadership and Employee Self-Efficacy as Antecedents of Digital Transformation. Sustainability 2024, 16, 1200. [Google Scholar] [CrossRef] [Scilit]
- Ben Mim, S.; Jellib, N.; Mabrouk, F. The ESG Tipping Point: Nonlinear Effects and Thresholds in ESG Scores and Financial Performance of Selected African Firms. Sustainability 2026, 18, 1741. [Google Scholar] [CrossRef] [Scilit]
- Barney, J. Firm resources and sustained competitive advantage. J. Manag. 1991, 17, 99–120. [Google Scholar] [CrossRef] [Scilit]
- Teece, D.J.; Pisano, G.; Shuen, A. Dynamic capabilities and strategic management. Strateg. Manag. J. 1997, 18, 509–533. [Google Scholar] [CrossRef] [Scilit]
- Bharadwaj, A.; El Sawy, O.A.; Pavlou, P.A.; Venkatraman, N. Digital business strategy: Toward a next generation of insights. MIS Q. 2013, 37, 471–482. [Google Scholar] [CrossRef] [Scilit]
- Matt, C.; Hess, T.; Benlian, A. Digital transformation strategies. Bus. Inf. Syst. Eng. 2015, 57, 339–343. [Google Scholar] [CrossRef] [Scilit]
- Cohen, W.M.; Levinthal, D.A. Absorptive capacity: A new perspective on learning and innovation. Adm. Sci. Q. 1990, 35, 128–152. [Google Scholar] [CrossRef] [Scilit]
- Pan, Y.; Zhang, J. Using DuPont Analysis Method to Solve the “Black Box” of Digital Transformation: An Empirical Study on the Financial Statements of A-share Listed Manufacturing Enterprises. Sci. Technol. Manag. Res. 2023, 13, 201–210. [Google Scholar] [CrossRef]
- Zheng, Y.; Shi, D. An Empirical Study on the Mechanism of Enterprise Digital Transformation Affecting Performance: Based on the Mediating Effect Test of Transaction Cost and Investment Benefit. J. Cent. Univ. Finance Econ. 2025, 4, 144–160. [Google Scholar] [CrossRef]
- Nissim, D.; Penman, S.H. Ratio analysis and equity valuation: From research to practice. Rev. Account. Stud. 2001, 6, 109–154. [Google Scholar] [CrossRef] [Scilit]
- Fairfield, P.M.; Yohn, T.L. Using Asset Turnover and Profit Margin to Forecast Changes in Profitability. Rev. Account. Stud. 2001, 6, 371–385. [Google Scholar] [CrossRef] [Scilit]
- Duncan, R.B. Characteristics of organizational environments and perceived environmental uncertainty. Adm. Sci. Q. 1972, 17, 313–327. [Google Scholar] [CrossRef] [Scilit]
- Haans, R.F.J.; Pieters, C.; He, Z.-L. Thinking about U: Theorizing and testing with U-shaped and inverted U-shaped relationships in strategy research. Strateg. Manag. J. 2016, 37, 1177–1195. [Google Scholar] [CrossRef] [Scilit]
- Keats, B.W.; Hitt, M.A. A causal model of linkages among environmental dimensions, macro organizational characteristics, and performance. Acad. Manag. J. 1988, 31, 570–598. [Google Scholar] [CrossRef] [Scilit]
- Yu, B.; Gong, T.; Duan, H.; Li, X. Digital-Intelligent Technology Application, Knowledge Boundary Expansion, and Servitization Transformation of Manufacturing Enterprises: The Moderating Role of Organizational Slack. Sci. Technol. Prog. Policy 2026, 43, 126–138. [Google Scholar]
- Ghosh, D.; Olsen, L. Environmental uncertainty and managers’ use of discretionary accruals. Account. Organ. Soc. 2009, 34, 188–205. [Google Scholar] [CrossRef] [Scilit]
- Aghion, P.; Bloom, N.; Blundell, R.; Griffith, R.; Howitt, P. Competition and Innovation: An Inverted-U Relationship. Q. J. Econ. 2005, 120, 701–728. [Google Scholar] [CrossRef] [Scilit]
- Soliman, M.T. The use of DuPont analysis by market participants. Account. Rev. 2008, 83, 823–853. [Google Scholar] [CrossRef] [Scilit]
- Lind, J.T.; Mehlum, H. With or without U? The appropriate test for a U-shaped relationship. Oxf. Bull. Econ. Stat. 2010, 72, 109–118. [Google Scholar] [CrossRef] [Scilit]
- Wang, Y.; Han, P. Digital Transformation, Service-Oriented Manufacturing, and Total Factor Productivity: Evidence from A-Share Listed Companies in China. Sustainability 2023, 15, 9974. [Google Scholar] [CrossRef] [Scilit]
- Wang, D.; Shao, X.; Song, Y.; Shao, H.; Wang, L. The Effect of Digital Transformation on Manufacturing Enterprise Performance. Amfiteatru Econ. 2023, 25, 593–608. [Google Scholar] [CrossRef] [Scilit]

Disclaimer/Publisher’s Note: The statements, opinions and data contained in all publications are solely those of the individual author(s) and contributor(s) and not of MDPI and/or the editor(s). MDPI and/or the editor(s) disclaim responsibility for any injury to people or property resulting from any ideas, methods, instructions or products referred to in the content. |
© 2026 by the authors. Licensee MDPI, Basel, Switzerland. This article is an open access article distributed under the terms and conditions of the Creative Commons Attribution (CC BY) license.