


Abstract
Construction and demolition waste (C&DW) management in metropolitan regions requires coordination among jurisdictions with different waste generation levels, treatment capacities, and demand for recovered materials. This study examined C&DW policy development and evaluated the coverage of management and coordination provisions in 11 selected policy instruments across the Guangdong–Hong Kong–Macao Greater Bay Area (GBA). The content analysis of 90 publicly available policy-text units and a historical analysis of 166 distinct policies issued between 1980 and 2026 provided broader policy context. The Policy Modeling Consistency (PMC) index framework incorporates life-cycle management, resource recovery and recycling support, and regional coordination. The scores of the 11 instruments ranged from 3.75 to 8.25, with a mean of 6.38. Life-cycle management received a relatively high mean score of 0.82, compared with 0.57 for recycling support, while regional coordination had the lowest score of 0.30. The broader content analysis showed that regulation and enforcement appeared in 93.3% of the 90 policy-text units, compared with 40.0% for regional coordination. The findings identify less extensive coverage of source reduction, recycled-product application and cross-jurisdictional cooperation. Policy improvements should strengthen these provisions while considering differences in legal frameworks and administrative responsibilities. The framework may also inform comparative policy analysis in other metropolitan regions through adaptation to local institutional contexts.
1. Introduction
The rapid growth of construction and urban renewal activities has generated large quantities of C&DW, placing increasing pressure on waste management systems in highly urbanized and land-constrained metropolitan regions. The challenge is related not only to the volume of waste generated but also to the spatial mismatch between waste generation and the land and facilities available for waste sorting, temporary storage, recycling, and final disposal [1]. This mismatch is particularly relevant in the GBA, where intensive urban development and ecological protection requirements create strong competition for developable land. A regional land-suitability assessment classified 70.5% of the GBA as ecological buffer space, while only 9.2% was identified as available land stock space for future urban development [2]. These spatial constraints provide a reason to examine how C&DW management responsibilities are connected across administrative boundaries.
At the same time, C&DW also represents an important source of secondary materials. Concrete, masonry, metals, timber, and excavated materials can substitute for virgin resources when they are properly separated, processed, and reused in construction. In the GBA, C&DW generation was estimated at 128.49 million tons in 2018, and recycling the major waste fractions could have avoided approximately 92.26 million tons of CO2e emissions associated with virgin-material production [3]. However, these environmental benefits depend on the combined development of recycling infrastructure, regulatory systems, market incentives, quality standards, and downstream applications for recycled products [4,5]. Previous studies have identified that inadequate policy support, limited recycling capacity, unstable demand for recycled products, and weak economic incentives remain major barriers to C&DW recycling [6,7]. Therefore, effective C&DW management requires coordination across waste generation, sorting, transportation, treatment, recycling, and material reuse. In response to this transition, China issued national guidance to strengthen C&DW management throughout the management process and set a target for the average resource-utilization rate in cities at or above the prefecture level to reach at least 50% by 2027 [8].
The imbalance between C&DW generation and treatment capacity becomes increasingly significant at the metropolitan scale. In the GBA, Yu et al. [9] identified substantial differences in C&DW management capacity among the 11 GBA jurisdictions, with highly developed cities such as Hong Kong and Shenzhen showing relatively limited self-sufficiency in accommodating locally generated waste. Cross-boundary waste transfer has therefore become an important component of regional C&DW management. For example, Hong Kong transported approximately 156 million tons of surplus public fill to designated reclamation projects in Mainland China between July 2007 and December 2025. Despite this large-scale reuse, approximately 25.3 million tons remained stored in two temporary fill banks at the end of 2025, indicating continued pressure on local storage capacity [10]. Such cross-boundary transfers can alleviate local capacity constraints, but they also require coordination among jurisdictions with different waste classification systems, technical standards, charging mechanisms, regulatory responsibilities, and market conditions [11]. Effective regional C&DW collaboration depends not only on physical infrastructure connectivity but also on institutional arrangements for information exchange, responsibility allocation, and policy alignment [12,13]. Existing cooperation has mainly been driven by local disposal pressures, while mechanisms for sustained regional coordination remain insufficiently developed [14]. Moreover, the redistribution of waste flows across jurisdictions may influence how environmental burdens, resource benefits, and management responsibilities are allocated among regions, raising broader concerns regarding equitable regional governance [15].
Previous studies have estimated C&DW generation and its spatial characteristics [16], evaluated differences in city-level management performance [17], and examined institutional and economic factors affecting cross-regional cooperation [13,14]. Using fieldwork in the GBA, Lu et al. [18] identified irregular material supply and demand, limited standardization and the absence of a formal trading market as barriers to cross-jurisdictional material exchange. These findings highlight the economic and institutional considerations involved in regional waste exchange. A simulation of construction waste trading in the GBA showed that greater public pressure could reduce inequalities in waste distribution while also reducing trading payments to less-developed cities [19]. Meanwhile, policy-oriented studies have examined the evolution of C&DW policies and the instruments promoting recycling development [20,21]. An analysis of 52 Chinese cities found significant associations between recycling-industry development and green product labels, charges or taxes, and technical standards [20]. Subsequent research found that policy measures alone were neither necessary nor sufficient for the establishment of a city’s first C&DW recycling plant [21]. A comparison of China and seven other countries identified gaps in recycling guidance, market incentives and stakeholder responsibilities [22]. Although these studies have examined waste generation, management performance, regional exchange, and policy interventions, comparative evidence remains limited on how the core C&DW policy instruments across the eleven GBA jurisdictions specify local management responsibilities alongside cross-jurisdictional cooperation. In particular, it remains unclear which provisions for waste transfer, information sharing and treatment-capacity coordination accompany requirements for waste prevention, treatment and recycled-product use.
Policy design theory emphasizes the relationship between policy objectives and the instruments used to achieve them [23]. This perspective is relevant to C&DW management because broad objectives such as waste reduction and resource recovery need to be supported by specific provisions concerning construction participants, treatment operators, recycling enterprises and users of recovered materials. Institutional collective action theory provides a complementary perspective on cooperation among public authorities when policy decisions and management activities extend beyond individual administrative boundaries [24]. In the context of C&DW management, this involves the allocation of responsibilities between waste-generating and receiving jurisdictions, information exchange, cross-boundary waste transfer and coordination of treatment capacity. These perspectives inform the selection of indicators for policy objectives, management responsibilities and policy instruments, together with provisions for cooperation between jurisdictions.
The PMC index provides a structured method for comparing policy content across a common set of variables [25]. Recent applications have further combined PMC with text-mining to identify policy concerns and compare the provisions contained in individual documents [26]. The method has also been applied to waste electrical and electronic equipment policies, demonstrating its applicability for comparing provisions involving multiple stakeholders and stages of resource circulation [27]. C&DW management consists of interconnected processes covering waste generation, transportation, recycling, and reuse, while material flows in metropolitan regions may extend across administrative jurisdictions. Building on these applications, this study adapts the PMC framework to incorporate life-cycle management, resource recovery and recycling support, and regional coordination.
To address these gaps, this study combines policy content analysis with an adapted PMC index to describe and compare C&DW policy texts across the 11 GBA jurisdictions. Specifically, this study aims to (1) examine the evolution of selected C&DW policies and identify their major concerns; (2) compare the multidimensional coverage of the 11 selected policy instruments, particularly their provisions for life-cycle management and resource recovery; and (3) examine the extent to which regional coordination is incorporated into local C&DW policies, focusing on cross-jurisdictional transfer, information sharing and treatment-capacity coordination. The findings inform revisions to C&DW management provisions and the coordination of existing rules across jurisdictions.
2. Materials and Methods
This study combines policy content analysis with an adapted PMC index model to examine the coverage of C&DW management and coordination provisions relevant to the 11 GBA jurisdictions. In this study, three analytical sets are distinguished. First, policy documents issued between 1980 and 2026 were collected and screened. A historical record of 166 distinct policies was established according to their first formal issuance, while 90 selected policy units were retained for content analysis. Following text preprocessing, the temporal and jurisdictional distributions, high-frequency concepts, keyword co-occurrence, and life-cycle coverage of the policies were analyzed to identify the major policy concerns and support the development of the PMC indicator system. Second, 11 selected policy instruments or regulatory frameworks, one for each GBA jurisdiction, were selected for PMC evaluation using ten main variables and 32 sub-variables. PMC scores, consistency levels, descriptive statistics, and PMC surfaces were then used to compare coverage and variation across the selected instruments. Finally, the PMC results were interpreted together with the full-corpus content analysis and relevant policy evidence to identify differences in policy coverage and derive policy implications.
2.1. Policy Sample Selection and Data Collection
2.1.1. Policy Collection and Screening
C&DW-related policy documents were collected from the official government portals of the central government, Guangdong Province, the nine mainland GBA cities, and the Hong Kong and Macao Special Administrative Regions. The sources included authorities responsible for housing and urban-rural development, urban management, ecological and environmental protection, public works, and other C&DW-related functions. The search covered policy documents issued between 1 January 1980 and 30 October 2026. Search terms included construction waste, construction and demolition waste, demolition waste, engineering waste, public fill, recycling, reuse, resource utilization, and disposal, together with their simplified Chinese, traditional Chinese, and English equivalents. Local terminology was also considered during the search process, particularly for Hong Kong and Macao, where legal terminology and administrative arrangements differ from those used in mainland cities. For each document, the dates of issuance, commencement, repeal, and specified planning periods were recorded separately.
The retrieved documents were screened according to issuing authority, substantive relevance, validity status, and text availability. The retained texts contained substantive provisions related to one or more stages of C&DW management, including source reduction, sorting and collection, transportation, temporary storage, treatment and disposal, resource utilization, or recycled-product application. Broader policies concerning zero-waste cities, green-building, or environmental-infrastructure were included only when they contained specific C&DW provisions. Duplicate records, stand-alone news reports, website summaries, purely technical standards, and repeal notices without substantive provisions were excluded. Supporting instruments addressing related aspects of the same regulatory arrangement were considered together only within the document boundaries recorded in Table S1.
The historical policy record and the content analysis corpus followed different counting rules. The historical record counted each distinct policy lineage once according to its first formal issuance, while subsequent amendments, extensions and republications were retained in the version history but were not counted as new policies. Following screening, 90 publicly available policy-text units at the national, Guangdong provincial, municipal, and special administrative region levels were retained for text mining and content analysis. The status and source information of the selected texts are listed in Supplementary Table S1.
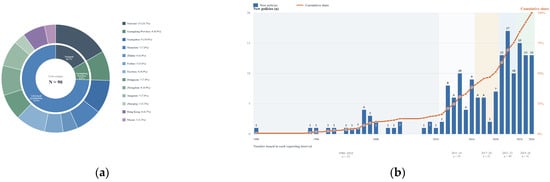
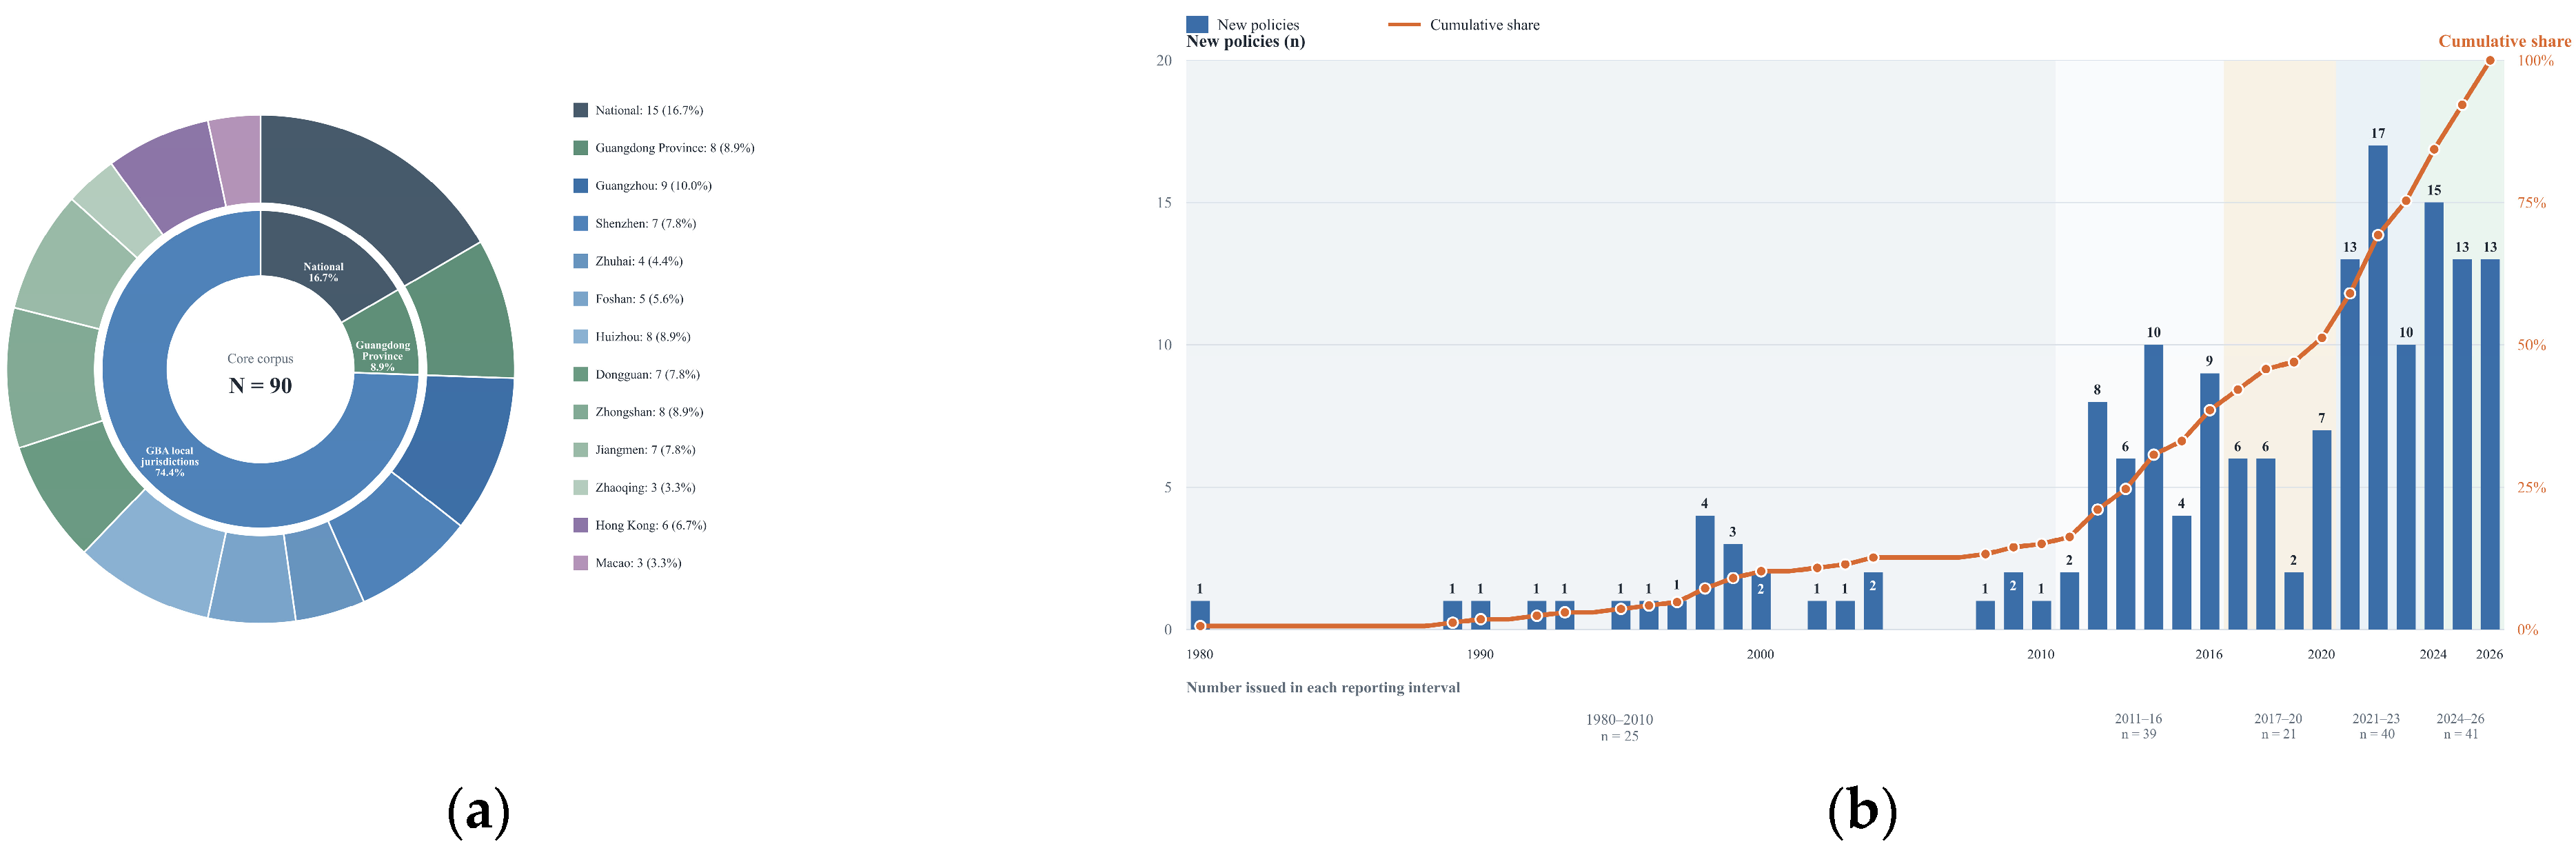
The jurisdictional distributions of 90 selected texts are presented in Figure 1a & Table S1, comprising 15 national, eight Guangdong provincial, and 67 local or special-administrative-region policy units. Figure 1b shows the annual distribution of the 166 distinct policies according to their first formal issuance. The historical record contains 25, 39, 21, 40 and 41 first issuances in 1980–2010, 2011–2016, 2017–2020, 2021–2023, and 2024–2026. The 81 policies first issued from 2021 onward account for 48.8% of the 166 policies in historical record, as reported in Table S2. Policies issued in the later stages included more explicit provisions on sorting, transfer manifests, enterprise responsibility, recycled-product support, zero-waste-city programs, circular utilization, and cross-regional coordination, as reported in Table S2.
Figure 1.
Distribution and temporal evolution of C&DW policy instruments in the GBA. (a) Jurisdictional distribution. (b) Temporal evolution, 1980–2026.
2.1.2. Policy Content Analysis
The 90 selected policy units were analyzed using qualitative content analysis supported by text mining to identify recurring policy concerns and management provisions related to C&DW in the GBA. Document numbers, website navigation, page markers, duplicate headers and other non-substantive formatting were removed from the collected texts. The same 55-concept dictionary was applied to simplified Chinese, traditional Chinese, and English texts. Equivalent terms and expressions were standardized according to their policy context before analysis, as reported in Table S4.
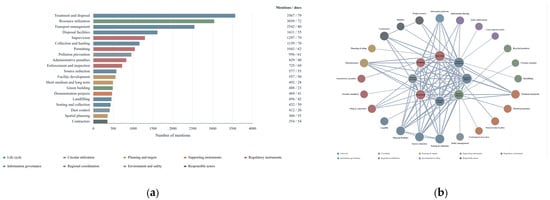
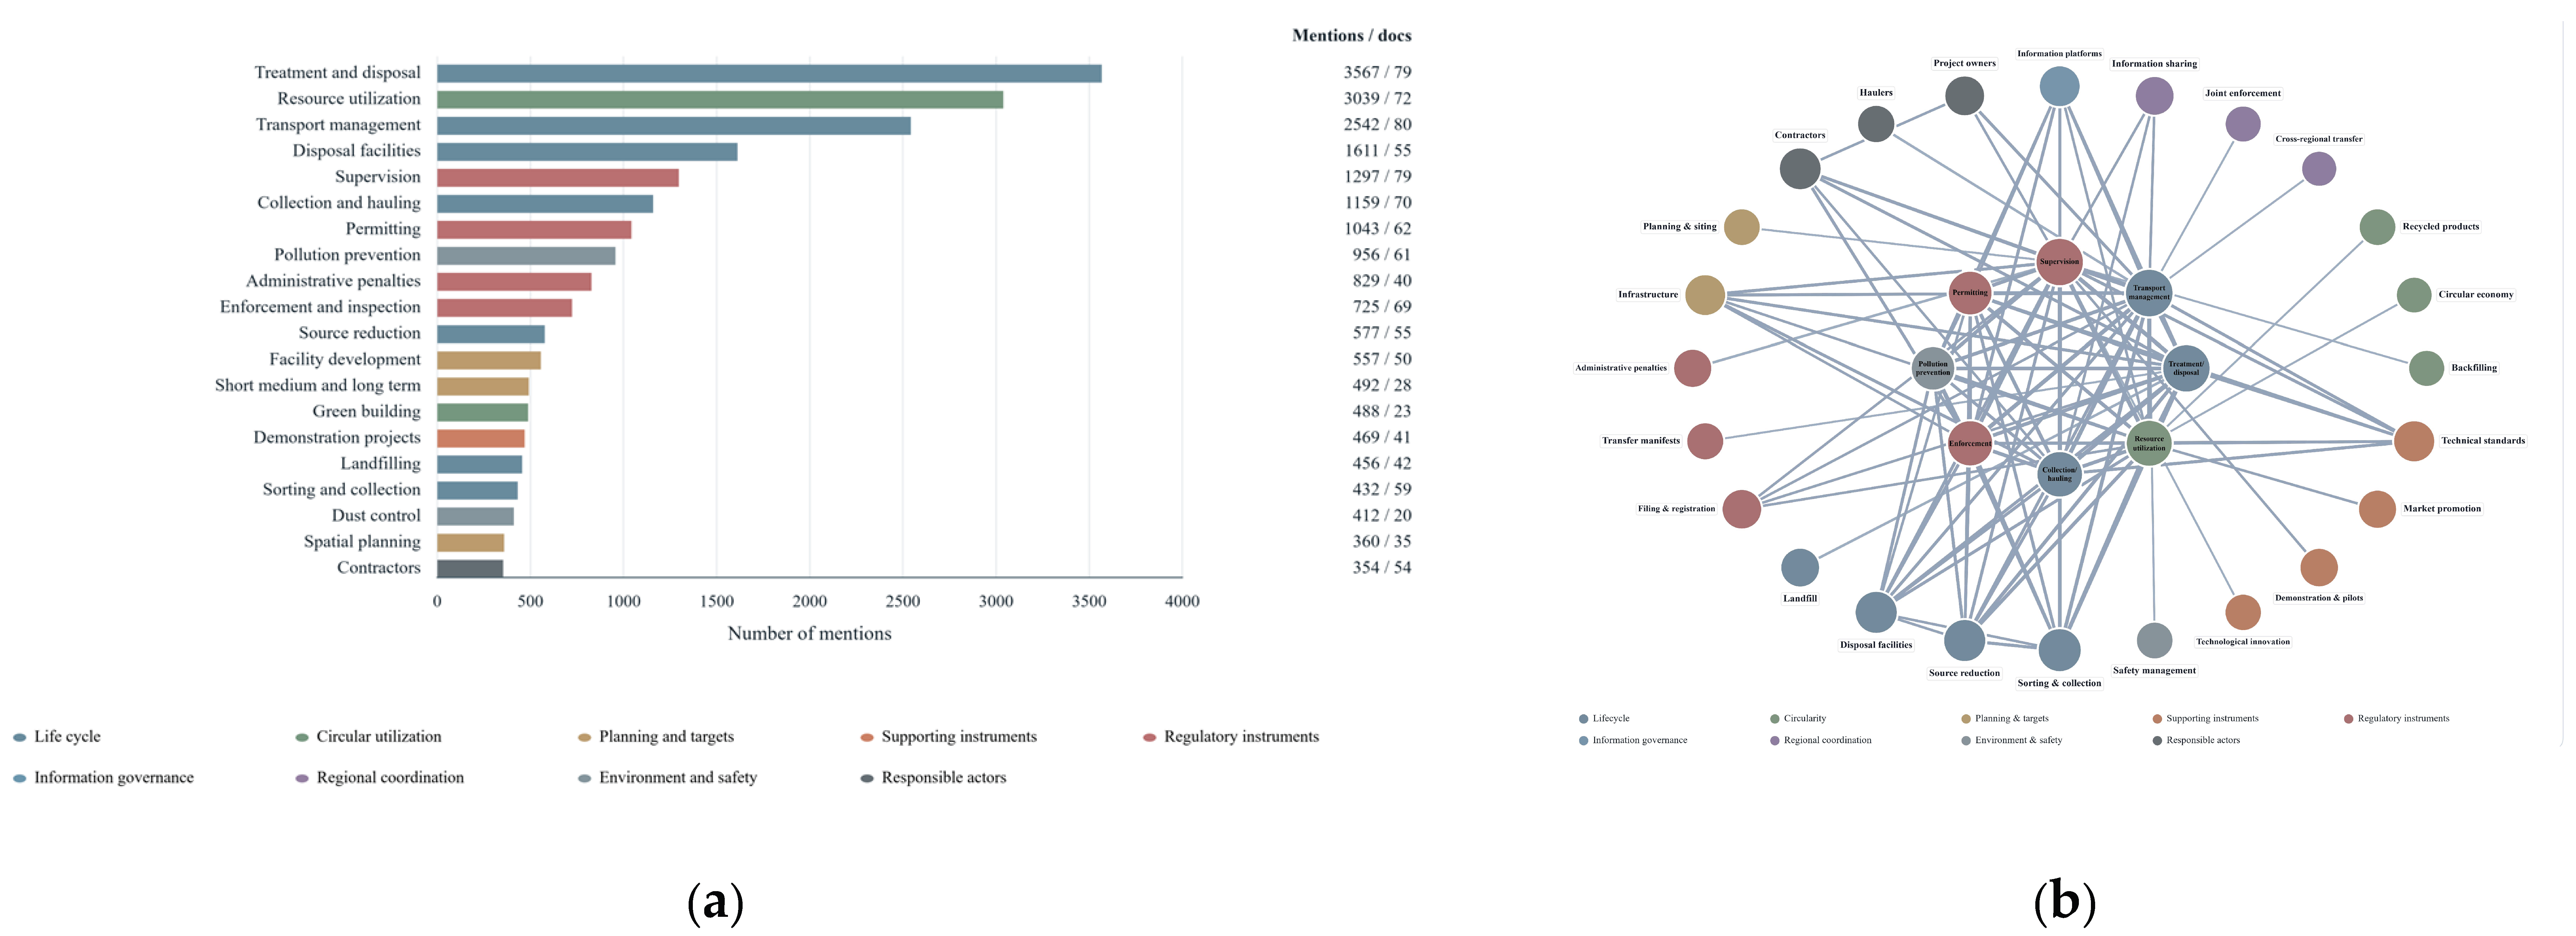
Text processing and concept matching were conducted using Python 3.12. Domain-specific terms and compound expressions were retained, while administrative expressions with limited relevance to C&DW policy provisions were removed following established policy text-mining procedures [27]. For each of the 55 standardized concepts, the total number of dictionary matches and the number of policy units containing at least one match were calculated separately. The 20 concepts with the highest frequencies are presented in Figure 2a, and the results for 55 concepts are provided in Supplementary Table S5. Keyword co-occurrence was calculated based on the number of policy units in which two concepts appeared together, and the resulting matrix was used to construct the network in Figure 2b. The criteria for classifying policy provisions are presented in Table S3.
Figure 2.
Keyword frequency and co-occurrence network of C&DW policies in the GBA. (a) Top 20 policy concepts by keyword frequency. (b) Policy-level keyword co-occurrence network.
For the co-occurrence network, links occurring in fewer than five policy units were excluded to improve readability. The network included 32 concepts with the highest weighted degree and 105 links selected according to their co-occurrence frequency, while retaining at least one eligible connection for each concept. Node size represents the number of policy units containing each concept, node color represents the functional category, and edge width represents the frequency of co-occurrence across policy units.
2.1.3. Selection of Representative Policies
The 90 policy-text units were used for text mining and content analysis, while one policy instrument or regulatory reference from each GBA jurisdiction was selected for PMC evaluation. The selection criteria focused on the relevance of the instrument to C&DW management, administrative scope, the role in regulating local management activities, and the availability of an official public text. Priority was given to the instrument that established management responsibilities, regulatory requirements and procedures covering multiple stages of C&DW management. Where several instruments met these criteria, their administrative authority, jurisdictional coverage and substantive provisions were considered in the selection. In jurisdictions without a dedicated municipal policy in force, the applicable higher-level policy or regulatory framework governing local C&DW management was adopted. For example, the Guangdong Provincial Regulation on Construction Waste Management was selected as P11 because the former Zhaoqing urban-area C&DW management measures had been repealed on 7 May 2024, leaving the provincial regulation as the applicable higher-level regulatory reference for the case. Accordingly, 11 assessment objects were obtained for PMC evaluation and their basic information, including issuing authority, publication years and policy types, is presented in Table 1.
Table 1.
Representative C&DW policies selected for PMC evaluation in the 11 GBA jurisdictions.
2.2. Development of the PMC Indicator System
2.2.1. Framework Development and Indicator Selection
The adapted PMC indicator system was developed based on the PMC framework proposed by Ruiz Estrada [25], with reference to the content analysis of the 90 GBA C&DW policy-text units and the relevant literature. In this study, the indicators were selected to cover recurring policy provisions on waste reduction, transportation regulation, disposal management, recycling, resource utilization, administrative supervision, and stakeholder responsibilities, as compared in Table S8 [28]. Accordingly, three dimensions were reorganized for the C&DW management throughout its life cycle and across jurisdictions. Life-cycle management (X6) covered requirements for source reduction, sorting and collection, transportation, and disposal. Support for recycling facilities, technology development, and the use of recovered materials was included under resource recovery and recycling support (X7), together with arrangements linking recovery to subsequent utilization. The policy corpus also contained provisions for cross-regional transfer, information sharing, and treatment-capacity coordination, which were incorporated under regional coordination (X9).
The final framework consists of ten main variables, including policy orientation (X1), policy formulation quality (X2), policy horizon (X3), governance structure (X4), stakeholder involvement (X5), life-cycle management (X6), resource recovery and recycling support (X7), policy instruments (X8), regional coordination (X9), and policy disclosure (X10). The final indicator system and the corresponding coding criteria are presented in Table 2.
Table 2.
The adapted PMC indicator system for C&DW management policy evaluation.
2.2.2. Policy Coding and PMC-Index Calculation
The 11 selected instruments were coded according to the binary criteria presented in Table 2. A value of 1 was assigned when the policy text contained a provision meeting the corresponding coding criterion, and 0 otherwise [37]. The coding examined regulatory requirements, implementation measures, institutional arrangements, technical provisions, economic incentives, and information-management mechanisms. Each coding decision was based on the substantive provisions within the defined boundaries of the selected text, with examples provided in Table S9.
The initial independent PMC coding yielded 97.80% agreement across 363 coding decisions, with Cohen’s κ = 0.9514, as detailed in Supplementary Table S12a. The eight disagreements were resolved through discussion and re-examination of the relevant policy provisions to reach a consensus, as detailed in Supplementary Table S12b. Subsequent coding changes were based on further review of the policy texts, and the updated matrix was used to calculate the PMC scores. The agreement statistics apply only to the initial independent coding of the 11 PMC instruments, not to the revised PMC matrix or the provision classifications for the 90 policy-text units.
The binary coding results for X1 to X9 were organized into a multi-input-output matrix, with 32 sub-variables as rows and 11 selected instruments as columns, as shown in Table S10. X10 was coded directly and included in the overall PMC score. The score of each main variable Xi from X1 to X9 was calculated as the arithmetic mean of its sub-variables, as shown in Equation (1):
where Xi represents the score of the i-th main variable, xij represents the coding value of the j-th sub-variable under variable i, and ni is the number of sub-variables included in that main variable. Each main-variable score therefore ranges from 0 to 1.
Following the PMC aggregation approach, the ten main variables received equal weights in the overall score [25,38]. The contribution of each sub-variable within a dimension was therefore determined by the number of sub-variables in that dimension. The overall PMC score was then calculated using Equation (2):
The PMC score ranges from 0 to 10 and represents the coverage of the selected C&DW policy attributes under the specified weighting scheme. Here, the consistency denotes weighted coverage, not legal coherence, compatibility between jurisdictions, implementation performance or policy effectiveness. For the purpose of descriptive comparison, PMC scores were classified into four categories specific to this study [38]. Scores were classified as low consistency (LC: 0 ≤ PMC < 5), acceptable consistency (AC: 5 ≤ PMC < 7), good consistency (GC: 7 ≤ PMC < 8), and perfect consistency (PC: 8 ≤ PMC ≤ 10). These cut-offs are descriptive conventions rather than validated criteria of policy quality or implementation performance.
To visualize the distribution of policy dimensions, the scores of X1 to X9 were further arranged in a 3 × 3 matrix to construct the PMC surface, as specified in Equation (3):
Policy disclosure (X10) was retained in the overall PMC score but excluded from the PMC surface analysis, and the sensitivity analyses are presented in Table S11. The PMC surfaces were used to compare the scores of the nine remaining dimensions across jurisdictions alongside the aggregate PMC scores [39].
3. Results
3.1. PMC Evaluation of C&DW Policies in the GBA
3.1.1. Overall PMC Scores and Consistency Levels
The PMC framework was applied to the 11 selected C&DW policy units listed in Table 1. As shown in Table 3, the PMC scores ranged from 3.75 to 8.25, with an average value of 6.38, indicating substantial variation in the coverage of the selected policy units. Overall, the results indicate differences in the coverage of C&DW management provisions among the selected policy units.
Table 3.
The PMC-Index scores and consistency levels of representative C&DW policies across the 11 GBA jurisdictions.
3.1.2. Differences Across Policy Dimensions
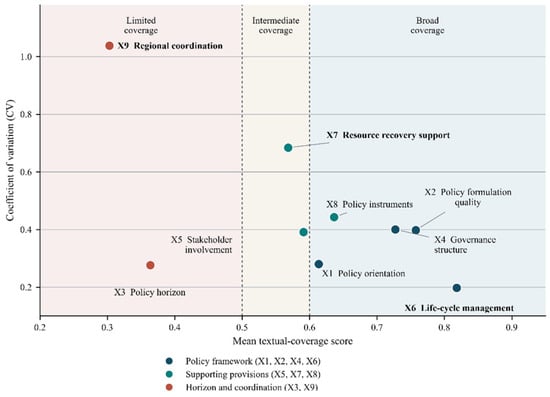
The ten main variables were examined using the binary coding of the 11 selected policy texts. The corresponding mean scores and coefficients of variation for X1–X9 across the 11 selected instruments are shown in Figure 3, and all statistics were based on the coding matrix in Table S10.
Figure 3.
The coverage and inter-city variation in PMC dimensions.
- High-scoring variables.
Policy disclosure (X10) is constant at 1.00 because all selected policy texts were officially accessible. Among the remaining dimensions, life-cycle management (X6) has the highest mean score of 0.82, followed by policy formulation quality (X2, 0.76), governance structure (X4, 0.73), and policy instrument (X8, 0.64). Within life-cycle management (X6), requirements for sorting and collection (X6.2) were identified in all 11 policy texts, while transportation control (X6.3) and disposal management (X6.4) were each identified in ten. Explicit operational source-reduction measures (X6.1) appeared in five selected policy texts, including Shenzhen, Zhuhai, Zhongshan, Jiangmen and the Guangdong provincial reference. The relatively high X6 score and low CV value for X6 reflected the consistent inclusion of sorting, transportation, and disposal requirements, whereas explicit provisions for reducing waste generation at source were less common.
Governance structure (X4) achieved a mean score of 0.73, accompanied by an SD of 0.29 and a CV of 0.40. The relatively broad mean coverage of X4 stemmed largely from the comprehensive specification of administrative authority (X4.1), which was clarified in 10 of the 11 selected policy texts. While nine policy texts involved explicit arrangements for interdepartmental coordination (X4.2), only five policy texts contained enforceable institutional provisions for enforcement mechanisms (X4.3). The mean therefore reflected widespread assignment of administrative responsibility, with less consistent coverage of the other arrangements.
Policy formulation quality (X2) had a mean score of 0.76. This dimension showed considerable numerical fluctuation, with a score range (0.33–1.00), an SD of 0.30 and a CV of 0.40. The scope of application (X2.2) was clearly stated in all selected 11 policy texts, indicating broad coverage of this attribute. The other formulation attributes were less consistently specified. Only seven specified detailed implementation requirements (X2.3), and seven provided jurisdiction-specific definitions (X2.1). Most policies therefore defined their applicable scope, but fewer provided locally specific definitions and implementation requirements.
- 2.
- Mid-scoring variables.
Policy instruments (X8), policy orientation (X1), resource recovery and recycling support (X7), and stakeholder involvement (X5) had mean scores of 0.64, 0.61, 0.57, and 0.59, respectively. Despite their similar mean scores, their SD and CV values indicate different degrees of variation across the selected policy units.
Policy orientation (X1) obtained a mean of 0.61, lower than that of governance structure. With a score range of 0.25–0.75, an SD of 0.17 and a CV of 0.28, this dimension presented relatively stable evaluation results. Problem identification (X1.1) was included in all 11 policy texts. Both sustainable development orientation (X1.3) and circular economy orientation (X1.4) are well-reflected in most policy texts, covering nine and seven policy texts respectively. In contrast, the X1 coding results revealed that most selected policy texts addressed sustainable development or the circular economy, whereas none specified quantified targets for C&DW reduction or recycling.
Within X7, recycling facility development (X7.1) and circular utilization mechanisms (X7.4) are each identified in eight policy texts, while reuse and utilization of recovered materials (X7.3) appears in seven. Recycling technology support (X7.2) occurs in the selected Shenzhen and Zhuhai instruments. Resource recovery is therefore addressed in most of the selected mainland GBA policy frameworks, but support for recycling technology is less frequently specified than provisions for facilities and recovered-material use.
For policy instrument (X8), regulatory instruments (X8.1) occur in ten objects and information instruments (X8.3) in nine. In comparison, market-oriented instruments (X8.4) occur in five, while economic instruments (X8.2) occur in the selected policy texts for Hong Kong, Macao, Shenzhen and Zhongshan. For example, Article 37 Shenzhen (P4) specifies subsidies, rent reductions and preferential tax, credit and funding support. Regulatory and information provisions are thus more widely represented than economic and market-oriented provisions.
For stakeholder involvement (X5), the responsibilities for transport and disposal operators (X5.2) occur in all 11 objects, and construction participants (X5.1) in ten. Provisions meeting the recycling enterprise criterion (X5.3) occur in Shenzhen and Zhongshan. Public participation and supervision (X5.4) appeared only in the selected policy texts of Guangzhou, Shenzhen and Zhongshan. Stakeholder coverage remains concentrated on participants directly involved in waste generation, transportation, and disposal.
- 3.
- Low-scoring variables.
Policy horizon (X3) and regional coordination (X9) had the lowest means, 0.36 and 0.30. The two variables differed markedly in their variation across policy units. As for policy horizon (X3), the immediate or short-term implementation actions (X3.1) were covered by all 11 selected policy texts, but medium-term planning (X3.2) appeared only in Dongguan, and none of the evaluated policy texts contained a long-term strategy under X3.3. The low mean score and limited variation in X3 reflected the consistent inclusion of immediate management requirements and the infrequent coverage of medium- and longer-term planning.
More importantly, regional coordination (X9) had an SD of 0.31 and a CV of 1.04, indicating high relative variation around its low mean. Cross-regional transfer coordination (X9.1) was identified in six policy units, regional information sharing (X9.2) in three, and regional treatment capacity coordination (X9.3) only in one. Especially for Huizhou, its capacity provision concerned adjacent counties or districts within the municipality. The cross-regional C&DW transfer arrangements were therefore more common than provisions for information sharing and treatment-capacity coordination.
3.1.3. PMC Surface Analysis and Policy Structure Comparison
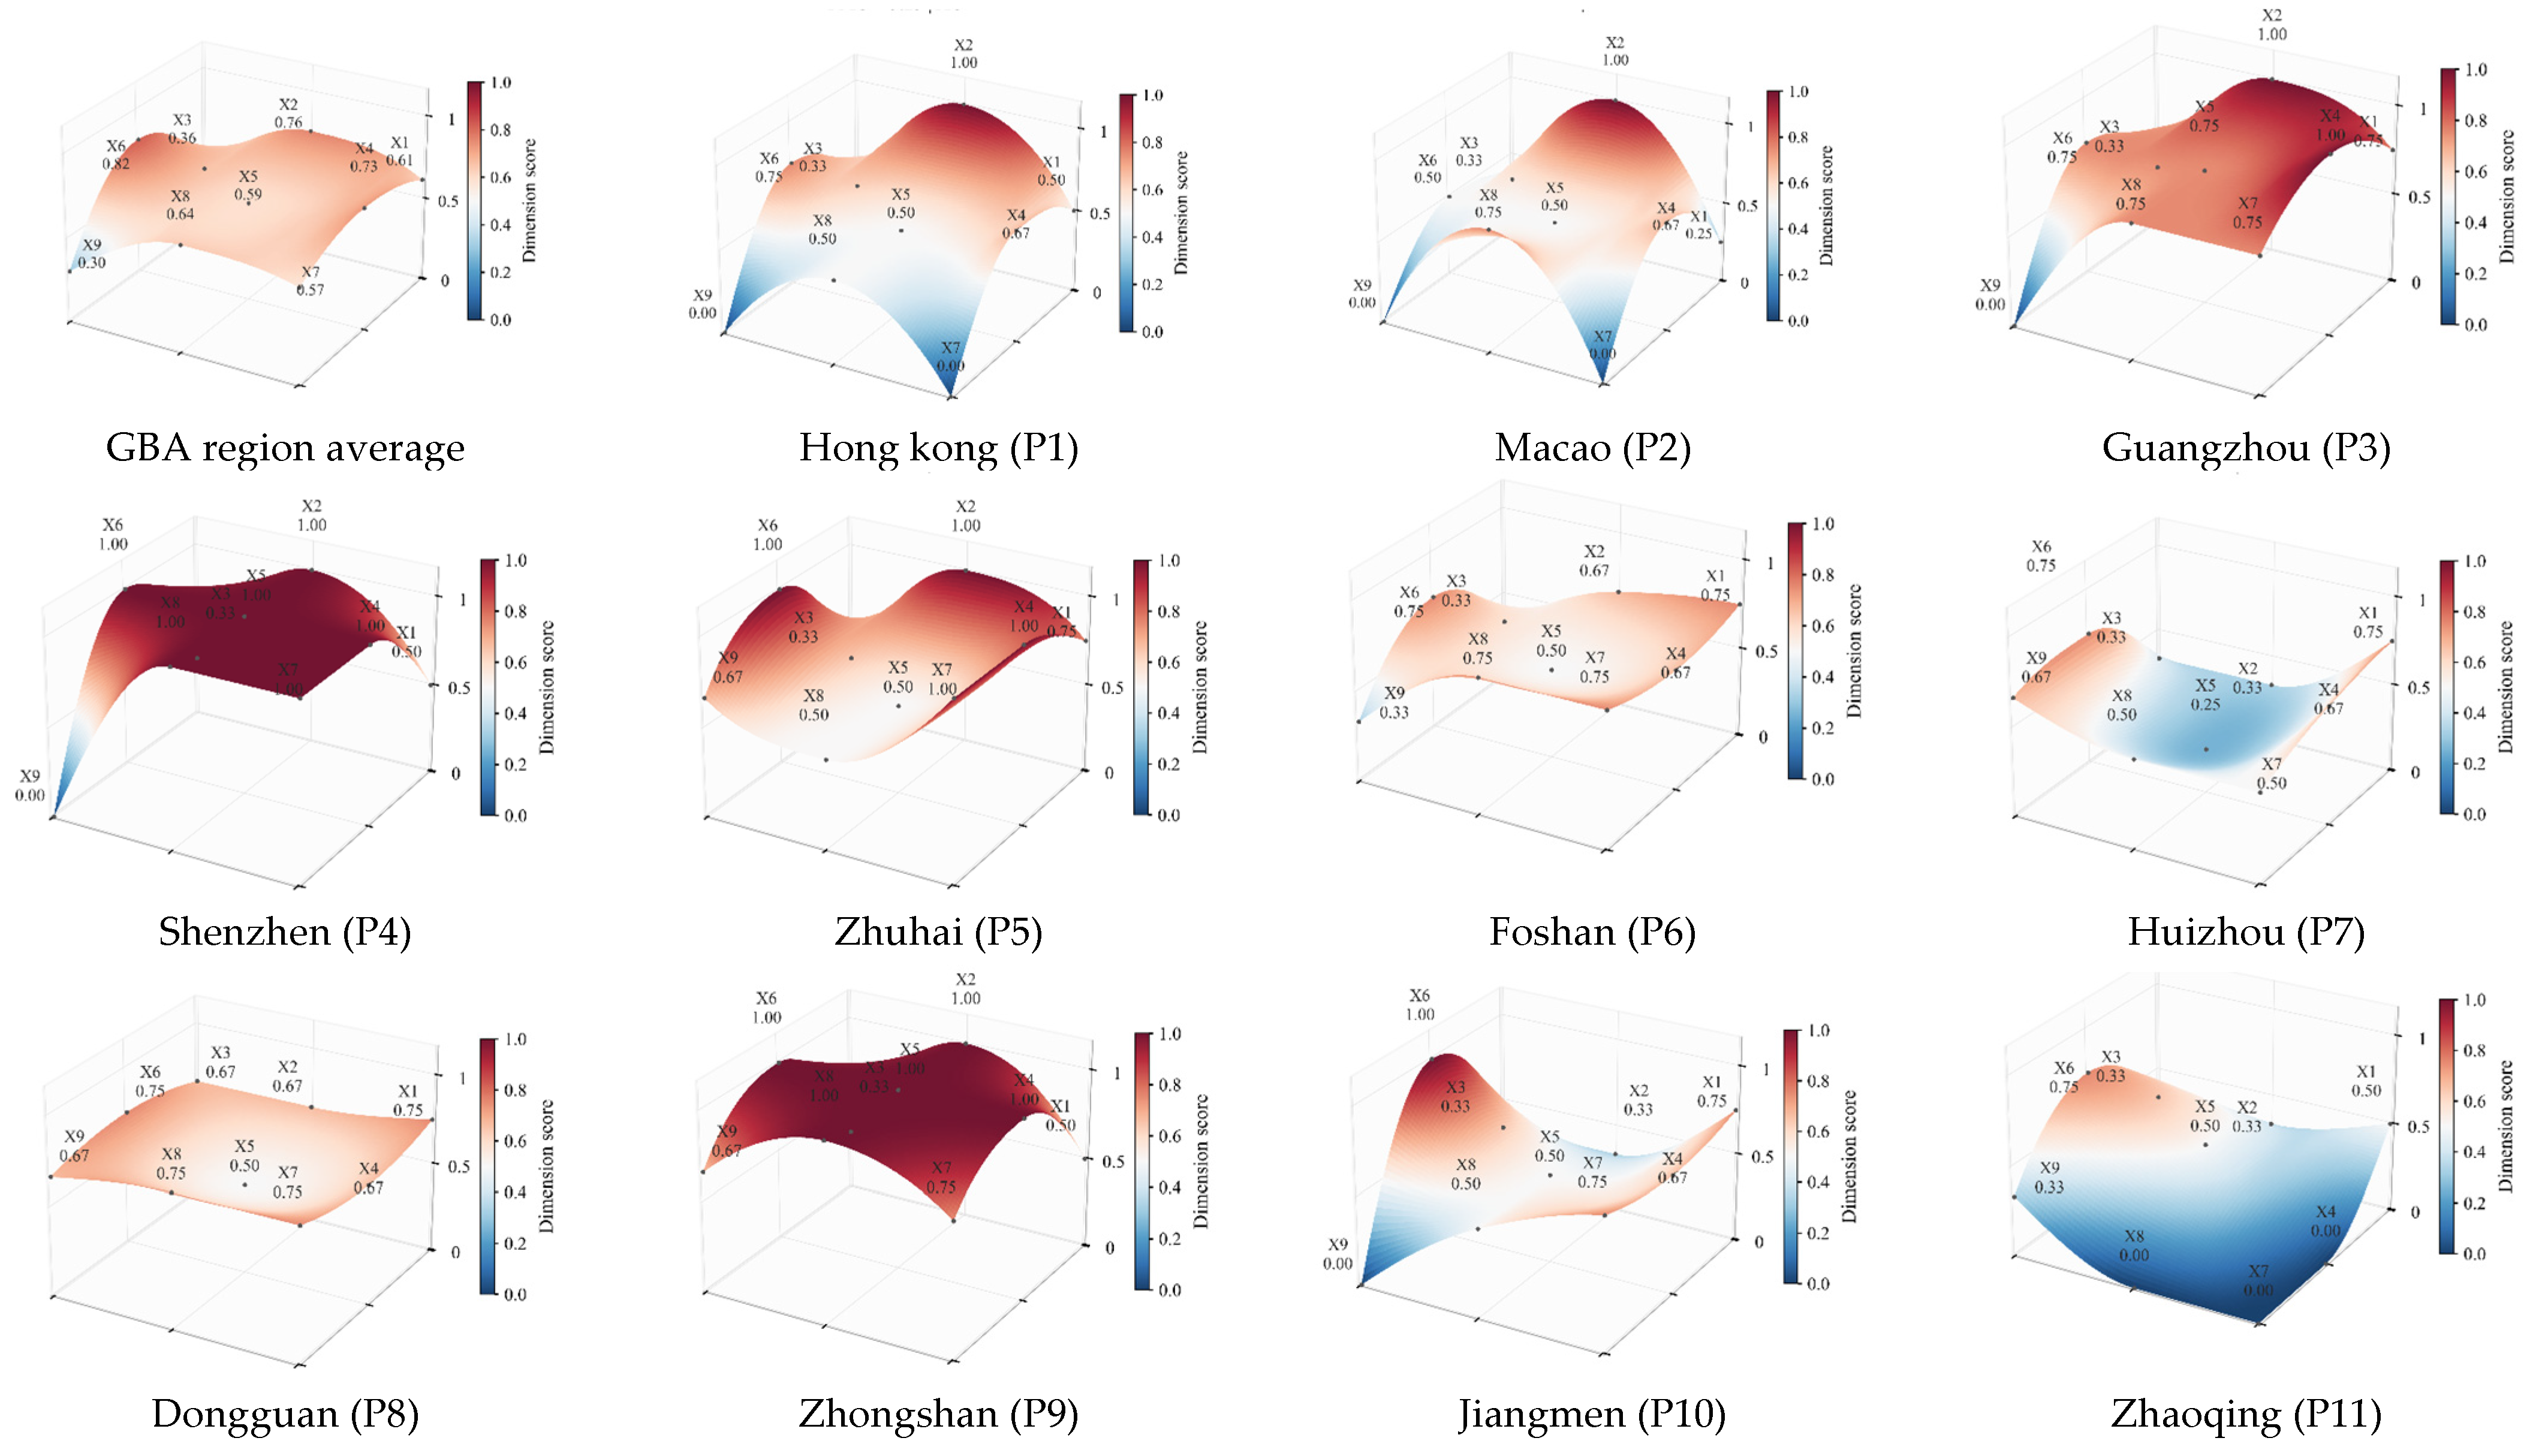
The PMC surfaces were constructed using X1–X9 to further compare the coverage of individual policy dimensions across the 11 evaluated C&DW policy texts in the GBA. Policy disclosure (X10) was excluded because it is constant at 1.00 for all selected texts. As shown in Figure 4, the sample-average surface is relatively elevated in life-cycle management (X6 = 0.82), governance structure (X4 = 0.73), and policy formulation quality (X2 = 0.76), whereas the lowest points corresponded to policy horizon (X3 = 0.36) and regional coordination (X9 = 0.30).
Figure 4.
PMC surface comparison of C&DW policy structures across the 11 GBA jurisdictions.
Among the selected enacted municipal instruments, Shenzhen (P4, 7.83) and Zhuhai (P5, 7.75) differ in their coverage of individual dimensions despite their relatively high overall PMC scores. Shenzhen achieved full scores for policy formulation quality (X2), governance structure (X4), stakeholder involvement (X5), life-cycle management (X6), resource recovery and recycling support (X7), and policy instruments (X8), but scored zero for regional coordination (X9). The Zhuhai regulation also scored 1.00 for X2, X4, X6 and X7, while regional coordination reached 0.67. By comparison, the lowest point on the Shenzhen surface therefore occurred at X9, whereas that on the Zhuhai surface occurred at policy horizon (X3 = 0.33). The higher overall PMC score for Shenzhen was thus accompanied by a larger difference between regional coordination and the six dimensions receiving full scores.
The selected Guangzhou (P3) and Dongguan (P8) instruments both fell within the GC group. Guangzhou received a full score for governance structure (X4 = 1.00) but scored zero for regional coordination, while Dongguan (P8) recorded the highest policy-horizon score among the selected policy units (X3 = 0.67). The Foshan (P6) surface was higher in governance structure (X4 = 0.67), resource recovery and recycling support (X7 = 0.75), and policy instruments (X8 = 0.75) than in regional coordination (X9 = 0.33).
The Zhongshan draft (P9) recorded the highest overall score of 8.25 and fell within the PC group. The draft and selected Jiangmen measures (P10) both scored 1.00 for life-cycle management and 0.75 for resource recovery and recycling support. Zhongshan scored higher in governance structure at 1.00 compared with 0.67 in Jiangmen. Their surfaces therefore shared broad life-cycle coverage but differ in administrative and coordination provision. Huizhou (P7) combined a relatively high regional coordination score (X9 = 0.67) with lower scores for stakeholder involvement (X5 = 0.25) and policy formulation quality (X2 = 0.33).
The charging and disposal instruments selected for Hong Kong (P1) and Macao (P2) both received full scores for policy formulation quality (X2 = 1.00), but scored zero for resource recovery and recycling support (X7 = 0.00) and regional coordination (X9 = 0.00). The Guangdong provincial regulation selected for the Zhaoqing case (P11) recorded the lowest PMC score of 3.75. It scored zero for governance structure (X4), resource recovery and recycling support (X7), and policy instruments (X8).
Based on the overall PMC scores, the surface comparisons showed broad life-cycle coverage in the selected mainland instruments, with differences in planning, recycling support and regional coordination.
3.2. Regional Patterns in the Selected Policy Texts
3.2.1. Difference in Instrument Profiles
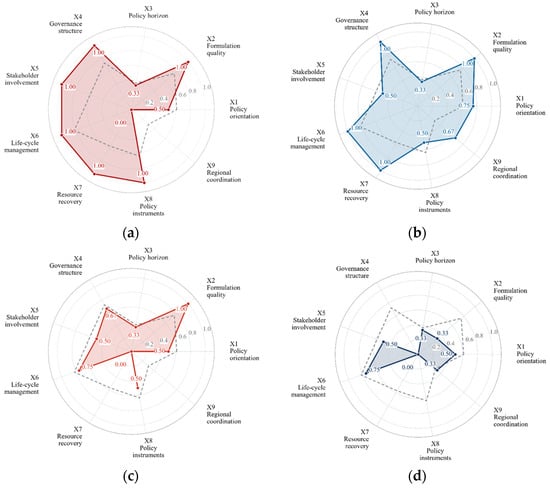
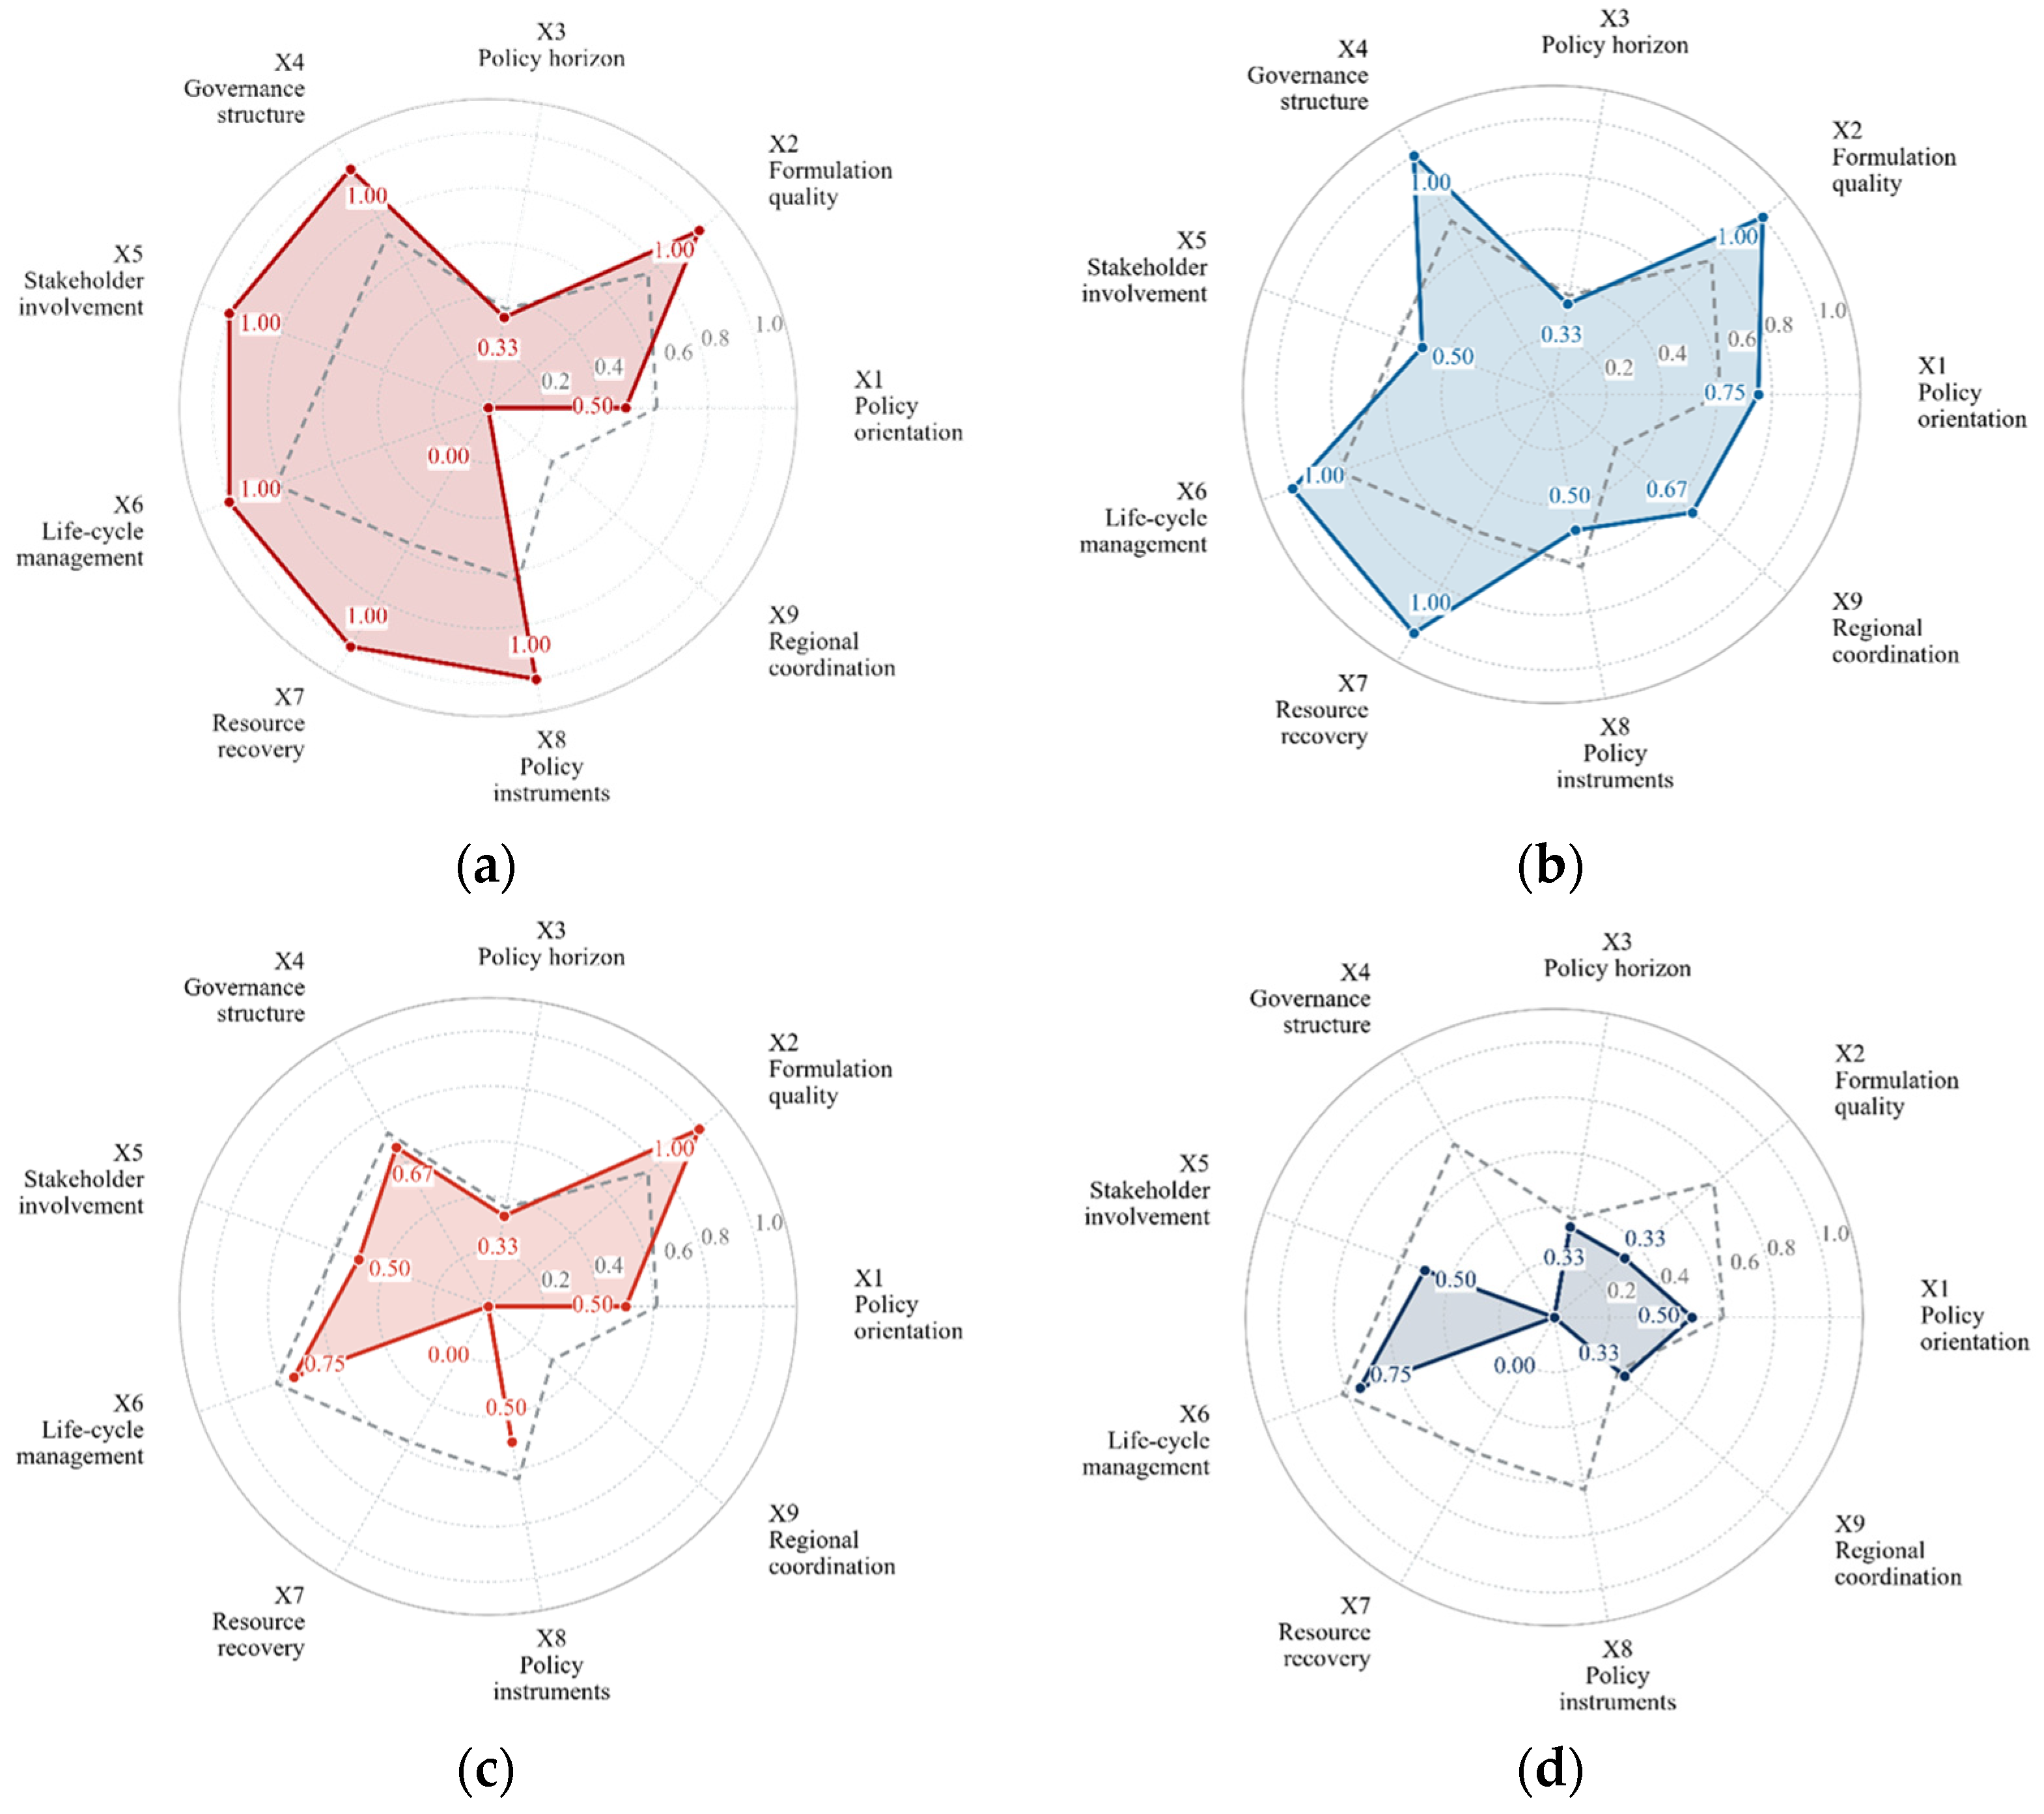
The scores for the policies selected for Shenzhen, Zhuhai, Hong Kong, and Zhaoqing (the provincial reference) are compared with the corresponding means for all 11 selected objects across X1 to X9 in Figure 5. The mean profile shows a clear differentiation across the nine substantive policy dimensions. Life-cycle management (X6) records the highest mean score (0.82), followed by policy formulation quality (X2, 0.76) and governance structure (X4, 0.73), while policy horizon (X3, 0.36) and regional coordination (X9, 0.30) record the lowest regional means. This pattern is not reproduced uniformly across individual cities, but appears through different combinations of regulatory, recycling-related, and coordination dimensions.
Figure 5.
Radar profiles of representative C&DW policies in the GBA: (a) Shenzhen P4, (b) Zhuhai P5, (c) Hong Kong P1, and (d) Zhaoqing P11. Notes: Solid lines represent individual policy scores, while dashed lines indicate the mean scores of the 11 selected instruments.
Compared with the relatively consistent coverage of X6, the wider variation in X7 is associated with differences in the policy support provided for recycling facilities, recovered-material utilization, and recycling technologies. Broad coverage of both dimensions was identified in the policies selected for Shenzhen and Zhuhai (Figure 5a,b), whereas X7 received a score of zero in those for the Hong Kong charging scheme and the Guangdong provincial reference (Figure 5c,d). Other mainland municipal texts included requirements for sorting, transportation, and disposal but varied in their provisions for recycling technology, recovered-material use, and other resource-recovery measures.
Differences were also observed in policy horizon (X3), stakeholder involvement (X5), and policy instruments (X8). Short-term management measures are widely represented in all selected objects under X3.1, whereas medium- and long-term planning is limited. Stakeholder provisions mainly specified responsibilities for construction participants, transport and disposal operators, while recycling enterprises and public participation were addressed in fewer policy units. Regulatory and information instruments are also more widely incorporated than economic and market-oriented instruments. Overall, the selected texts more consistently specified requirements for sorting, transportation, and disposal than measures for longer-term planning, recycling support, public participation, and secondary-material use.
3.2.2. Differences in Cross-Regional Coordination
Regional coordination (X9) records the lowest substantive mean among the evaluated dimensions (0.30), with a range of 0 to 0.67 and an SD of 0.31. Shenzhen, Guangzhou, Hong Kong, Macao, and Jiangmen scored 0 for X9 in the selected texts. The supplementary comparison of the Shenzhen instruments in force at the end of 2018 and 2025 also yielded an X9 score of 0 for both documents. Their overall PMC score was 7.83 in both years, although their profiles differed in policy orientation (X1) and life-cycle management (X6) (Supplementary Table S13). Among the six policy units containing regional coordination provisions, all addressed cross-regional transfer coordination (X9.1), but only three included regional information sharing (X9.2) and one includes regional treatment capacity coordination (X9.3).
The profiles in Figure 5 further distinguish regional coordination from overall municipal policy coverage. Shenzhen scores 7.83 but 0 for X9 within the adopted coding boundary. Zhuhai scores a relatively high PMC score of 7.75 with an X9 score of 0.67. Huizhou reaches the same X9 score of 0.67 despite a lower overall PMC value of 5.75. The main cross-city difference therefore lies not simply in whether regional coordination is addressed, but in whether policy provisions extend beyond cross-regional transfer to include information sharing and treatment-capacity coordination.
Differences were also evident in the specific forms of coordination specified in the policies. The selected texts for Zhuhai, Dongguan and Zhongshan combine cross-regional transfer coordination with regional information sharing, whereas the Huizhou text combines transfer coordination with treatment-capacity coordination between adjacent counties or districts. By comparison, transfer-related coordination is the only X9 component coded in Foshan and Zhaoqing. Regional coordination provisions therefore primarily addressed cross-regional C&DW transfers, whereas arrangements for information sharing or treatment-capacity coordination were specified in fewer policy units.
3.3. Policy Coverage Across the Full-Corpus
The results of PMC analysis identified several consistent structural characteristics, including a relatively broad coverage of life-cycle management, variation in recycling-related support, a limited long-term target coverage, and low scores for regional coordination. To complement the evaluation of the 11 selected policy instruments, we further examined the coverage of related policy provisions across the 90 policy units. These provisions included life-cycle stages, regulation and enforcement, regional coordination, and policy targets, as shown in Table S6.
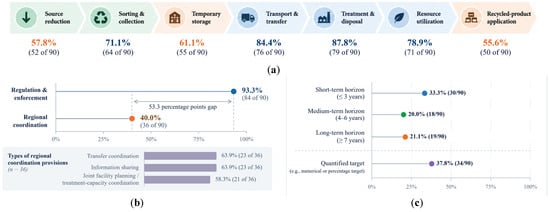
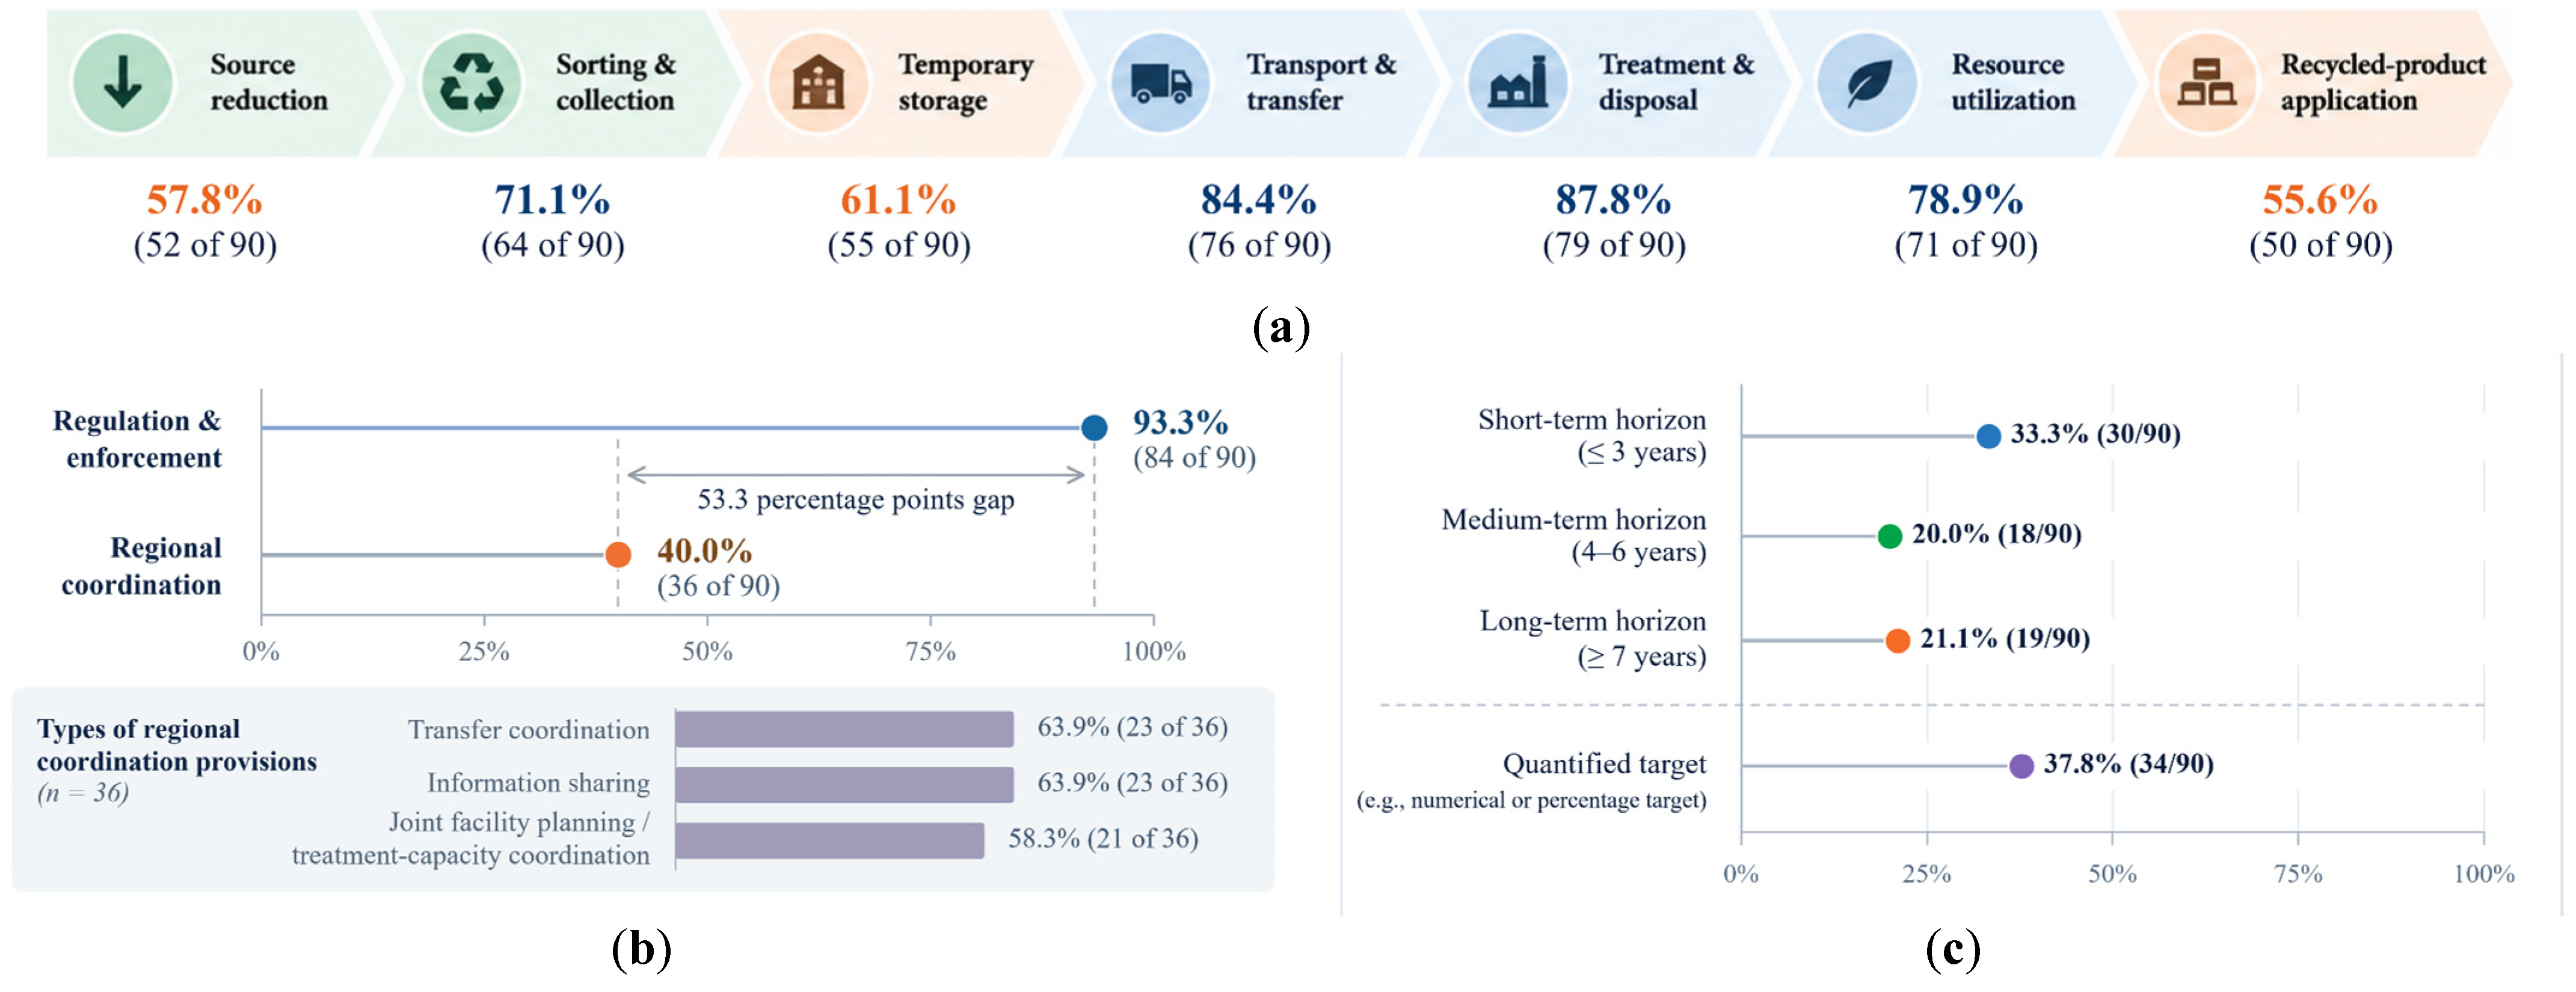
As shown in Figure 6a, provisions for transport and transfer, treatment and disposal, and resource utilization received broader coverage than source reduction and recycled-product application. Treatment and disposal were identified in 79 (87.8%) policy units, but 27 of these contained no explicit source-reduction provision. Similarly, 21 of the 71 units addressing resource utilization did not cover recycled-product application, as shown in Table S7. These combinations show that provisions for handling generated waste and recovering materials did not consistently extend to prevention and subsequent recycled-product application.
Figure 6.
Full-corpus policy coverage across the 90 C&DW policy-text units in the GBA: (a) life-cycle coverage; (b) regulation and enforcement gap; (c) policy targets. Notes: In (a,c), coloured symbols distinguish the policy categories, with labels indicating the corresponding counts and percentages. In (b), the connecting line indicates the 53.3 percentage-point gap, and the bars show the distribution of the three regional coordination provisions among the 36 relevant policy-text units.
Regulation and enforcement appeared in 84 policy units, compared with 36 for regional coordination (Figure 6b). Among the 84 units containing regulatory provisions, 49 did not address regional coordination. Broad regulatory coverage was therefore not consistently accompanied by provisions for cooperation across administrative boundaries. Within the 36 units addressing coordination, transfer arrangements and information sharing each appeared in 23 units, while facility or treatment-capacity coordination appeared in 21. Only 13 units covered all three functions. The coverage gap concerned both the inclusion of regional coordination and the range of coordination functions addressed together.
Short-, medium-, and long-term targets appeared in 30, 18, and 19 policy units, respectively, while quantified targets appeared in 34 units (Figure 6c). Quantified targets and at least one target with a specified completion year co-occurred in 32 units, and 55 units contained neither feature. All 19 units containing long-term targets also included quantified targets. Quantified and dated targets were therefore concentrated in a subset of the corpus and commonly occurred within the same policy units.
4. Discussion
4.1. Policy Coverage and the Transition Towards Circular Governance
The PMC results reveal a clear difference in the coverage of conventional C&DW management requirements and provisions supporting resource recovery and recycling across the GBA. The relatively low variation across selected instruments in X6 scores may partly reflect the use of established administrative procedures for regulating C&DW management. Sorting, transportation, and disposal involve identifiable activities, regulated operators, and defined administrative responsibilities, and can be addressed through established instruments such as permits, manifests, vehicle controls, facility supervision, and inspections. These requirements are widely included in the selected policies, although the specific regulatory arrangements differ across jurisdictions. Previous studies of C&DW management in China have similarly reported broad regulatory coverage of collection, transportation, and disposal, alongside less extensive provisions for source reduction, recycling markets, and recycled-product utilization [34]. Source reduction remains less consistently addressed in the representative-policy assessment and is covered by 57.8% of the full corpus. Unlike the regulation of waste handling, source reduction requires earlier intervention in project design and construction planning. Insufficient consideration of waste minimization during design has also been identified as a constraint on C&DW management in China [40]. More explicit reduction requirements at these stages would complement existing controls on generated waste and address avoidable material losses before collection, transportation, and disposal become necessary.
By contrast, the wider variation in X7 reflects differences in support for recycling facilities, technologies, and recovered-material use. Effective recycling depends on regulatory requirements, treatment facilities, recycling technologies, participation by recycling enterprises, technical and product standards, market demand for recycled materials, and appropriate economic incentives. Recycling enterprises also face high recycling costs, insufficient incentives, limited demand for recycled products, and inadequate technical standards, which complicate their continued operation [22,34,40]. In the GBA, recycling facility development and general resource-utilization provisions are already covered in many selected mainland texts, but support for recycling technology, enterprise participation, economic incentives, and longer-term planning remains less consistent. The full-corpus analysis shows a similar pattern. Resource utilization is addressed in 78.9% of the policy units, compared with 55.6% for recycled-product application and 37.8% for quantified targets. Resource utilization provisions are therefore more widely specified than provisions for recycled-product application. Moreover, the PMC profiles provide a separate comparison of support for recycling facilities and enterprises. The policy priorities extend beyond additional processing capacity to product acceptance, enterprise operating costs, and measurable reduction and recycling objectives. Future policy revisions should therefore combine standards and certification for recycled products with land and financial support for recycling enterprises, according to the provisions already established in each jurisdiction.
4.2. Cross-Regional Coordination Characteristics and Institutional Linkages
C&DW generation, treatment capacity, and demand for recycled materials are unevenly distributed across the GBA, but regulatory responsibilities remain largely organized within individual jurisdictions. Cross-regional management therefore requires cooperation between authorities responsible for waste generation, transportation, reception, and treatment. The predominance of transfer-related provisions may partly reflect the specific administrative tasks involved in approving and supervising waste movements. Registration and destination verification can be applied to individual projects and receiving facilities. Regular information sharing and shared facility management require further agreements on reporting duties, inspections, and expenditure. Negotiating these agreements, monitoring compliance, and resolving disputes require continuing administrative resources, which may help explain the less consistent inclusion of these arrangements in the selected policies [41].
Recent regulatory practices in the GBA provide concrete examples of this transfer-oriented approach. Longhua district in Shenzhen has introduced cross-regional registration requirements involving information on generating projects, receiving facilities, receiving jurisdictions, and relevant administrative authorities [42]. Nansha district in Guangzhou and Shunde district in Foshan conducted joint inspections of cross-city waste movements in June 2024 and proposed further improvements to information sharing and procedures for referring suspected violations [43]. These practices illustrate the cooperation needed to verify waste destinations and supervise transport activities on both sides of an administrative boundary. Managing individual cross-city transfers, however, differs from coordinating treatment capacity and material use over time. Construction waste supplies and demand for recovered materials occur at different locations and stages of project development. Material exchange consequently depends on matching available supplies with receiving requirements across jurisdictions [18]. Regular information exchange needs to cover material quantities, receiving requirements, and available disposal and recycling capacity, supported by compatible records and clearly assigned reporting responsibilities. Financial arrangements are also important. Cross-border exchanges of aggregates and C&DW between Italy and Switzerland illustrate the need to coordinate transport arrangements and incentives among regional authorities [44]. For cross-regional disposal, landfill charges must be considered alongside available capacity because their combined effects influence disposal decisions [12]. Higher ecological compensation may encourage receiving governments to support C&DW recycling, but the additional financial burden can reduce the willingness of waste-generating governments to pay [45]. Cooperation agreements should therefore consider both the treatment costs borne by receiving jurisdictions and the financial capacity of the governments providing compensation.
Where the wider policy portfolio confirms gaps, future policy development should therefore extend existing transfer-registration and destination-verification procedures through regular information exchange and agreements on facility use. Reporting responsibilities, record-updating requirements, and procedures for confirming waste receipt should be assigned to the relevant authorities and operators. Joint facility planning should also specify the capacity available to participating jurisdictions, applicable treatment charges, and responsibilities for financing and operation. These arrangements would extend cooperation from the supervision of individual transfers to the planning, use, and funding of shared disposal and recycling capacity.
4.3. Optimization Path and Policy Implications
For the Zhaoqing case, policy formulation should focus on implementing at the local level the provincial requirements regarding planning, source reduction, and facility construction. Provincial inspection feedback delivered on 7 January 2025 reported that Zhaoqing City had not yet formulated pollution prevention and control plans for C&DW at the municipal and county levels, had not established a source reduction mechanism, and lacked sufficient treatment capacity for renovation and demolition waste [46]. These findings highlight specific priorities for planning efforts, namely, compliance with Article 5 of P11 and the implementation of Article 6’s requirement to incorporate waste reduction responsibilities into tender documents, construction contracts and construction organization plans. Subsequent progress should be assessed through published plans, rectification reports, records of facility construction, and written documentation of the implementation of waste reduction measures.
The assessment of the enacted municipal policies selected for Guangzhou, Foshan, Dongguan, Huizhou, and Jiangmen already identifies support for recycling technologies, technical and product standards, and participation by recycling enterprises as areas for further policy review. Economic and market instruments promoting recycled-product use would complement these measures by supporting demand for the resulting materials [47]. Recommendations for regional cooperation should consider these management instruments together with relevant plans and supporting regulations. For Foshan, the review should examine how transfer procedures are linked to information exchange and shared facility use. Dongguan could build on its transfer and information-sharing provisions through agreements on facility use. For Guangzhou and Jiangmen, relevant plans and supporting regulations should be examined before additional coordination provisions are proposed for the selected management measures. In Huizhou, information-sharing requirements would complement the specified facility cooperation between neighboring counties or districts, while cooperation with other GBA cities should be considered separately. The Zhongshan consultation draft could further specify facility-use arrangements alongside its proposed transfer and information-sharing provisions.
Hong Kong and Macao are treated separately because the representative policies examined in this study operate within different legal and administrative arrangements. Their pathway therefore emphasizes cross-system coordination rather than replication of mainland policy provisions. Existing charging, licensing, and disposal-control arrangements provide the starting point for short-term policy development. Greater compatibility in these areas could allow authorities in the originating and receiving jurisdictions to compare material quantities and verify destinations. Transfer documents should therefore identify material types, quantities, and receiving facilities, with confirmation of receipt provided by the receiving authority or operator. Regular exchange of these records would support transfer supervision and help match waste supplies with receiving requirements across jurisdictions [18].
Shenzhen and Zhuhai have relatively broad policy coverage in their selected enacted instruments, but their priorities for policy review differ. In Shenzhen, the selected texts specified broad life-cycle and recycling provisions, while the supporting requirements contain transfer, information-sharing, and treatment-capacity arrangement. The improvements should therefore focus on the connections between core measures, supporting notices, information systems and receiving jurisdictions. Zhuhai could build on its existing source-reduction, transfer and information-sharing requirements when developing arrangements for regional facility planning and shared treatment capacity. In both cases, recycled-product certification and technological support should be assessed alongside existing provisions and the operating conditions of recycling enterprises [48].
Local policy revisions and regional cooperation should proceed in parallel. Definitions, responsibilities, and reporting requirements can be clarified through policy updates, while recycling investment and shared-facility development require longer-term financing and operating arrangements. Compatible electronic records should connect information on material quantities and properties with receiving-facility details and confirmation of receipt. C&DW passports could offer a format for recording material types, properties, recovery potential, and treatment history for cross-jurisdictional trading. Responsibilities for updating these records and verifying the reported information should be specified alongside agreements on facility use and treatment charges. With technical interoperability, legal authority and verification responsibilities in place, these measures would support both the supervision of cross-regional transfers and the coordinated use of disposal and recycling capacity.
5. Conclusions
5.1. Key Findings
This study evaluated the evolution and coverage of C&DW policies across the 11 GBA jurisdictions through historical policy analysis, content analysis of 90 selected policy-text units, and an assessment of 11 selected policy instruments using an adapted PMC-index framework. The adapted framework incorporated life-cycle management, resource recovery and recycling support, and regional coordination to compare local management requirements and cross-regional provisions in the selected policies. The main findings are as follows.
The selected policy texts addressed a broad range of C&DW management activities, although policy coverage remains uneven across different stages of the management chain. The historical record contained 166 distinct policies, with 81 first issued from 2021 onward, accounting for 48.8% of the total. The content analysis showed that transportation, treatment and disposal, regulation and enforcement, and resource utilization received substantial policy attention. By comparison, temporary storage, recycled-product application, quantified and long-term targets, and regional coordination were less frequently addressed. These findings indicate that the selected texts more frequently addressed the control and treatment of generated C&DW than waste prevention and subsequent use of recycled products.
Life-cycle management received more consistent coverage than resource recovery and recycling support in the selected policy instruments. The mean score for X6 is 0.82, compared with 0.57 for X7. Although most selected instruments contain requirements for sorting and transportation, specific measures for source-reduction were less consistently incorporated. Similarly, provisions for recycling facilities and resource recovery are more common than those supporting recycling technologies. The full-corpus results further identify a difference between resource utilization and recycled-product application, which appear in 78.9% and 55.6% of the policy units. Policy development therefore needs to extend beyond the collection and processing of construction waste to address the quality, market acceptance and actual use of recycled materials.
The selected instruments provided less extensive coverage of regional coordination provisions than of regulations of waste management within individual jurisdictions. X9 has the lowest mean score among the nine substantive dimensions (0.30), reflecting limited coverage of cross-regional transfer, information sharing and treatment-capacity coordination. In the full corpus, regional coordination appears in 40.0% of policy units, compared with 93.3% for regulation and enforcement. The difference indicates that administrative controls within individual jurisdictions are more extensively specified than arrangements for cooperation across jurisdictional boundaries. Improving regional coordination therefore requires more than provisions allowing waste transfer. It also requires regular information exchange, clear allocation of responsibilities between sending and receiving jurisdictions, and arrangements for sharing and coordinating treatment capacity.
The PMC assessment reveals substantial differences in the coverage and functional scope of the 11 selected instruments. Overall scores range from 3.75 to 8.25, with a mean of 6.38. The Zhongshan consultation draft has the highest score, while Shenzhen and Zhuhai have the highest scores among the selected enacted municipal instruments. The remaining instruments display different combinations of regulatory, administrative, recycling and coordination provisions. The selected instruments for Hong Kong and Macao reflect their specific charging and disposal-management functions, while the Guangdong provincial regulation provides the applicable higher-level reference for the Zhaoqing case following the repeal of its former municipal measures. These results show that a higher overall score does not necessarily indicate more comprehensive coverage of every management function. Policy revision should therefore consider the provisions in the selected instrument together with those in relevant plans and supporting regulations, taking account of its legal status, administrative responsibilities and management scope, rather than simply seeking to increase its aggregate PMC score.
Overall, further C&DW policy development in the GBA should strengthen source reduction during project design and construction, support recycling technologies and recycled-product use, and establish quantified reduction and recycling targets with specified completion dates. Recycled-product standards, procurement requirements, and financial support for recycling enterprises should be considered with existing facility development measures. Regional coordination should build on established transfer registration and destination verification procedures through regular information exchange and agreements on facility use. The agreements should specify accepted material types, available treatment capacity, applicable charges and responsibilities for financing, operating and reporting.
5.2. Limitations and Future Research
Several limitations should be acknowledged. First, the analysis relies on the availability of official policy documents, as well as the scope and the version history of the documents used in this study. When interpreting provisions across different jurisdictions, relevant supplementary regulations, technical standards and administrative documents should be taken into consideration. Although the content analysis covers 90 policy-text units, it does not establish whether selecting different documents for the same jurisdictions would produce the same PMC rankings. Second, the binary coding records whether a provision meets the specified criteria, but does not assess how detailed its requirements are, whether they are compatible with requirements in other jurisdictions, or whether they are implemented. Third, the differences in legal functions, administrative levels, and adoption status also influence comparison among the selected texts.
Future research should integrate longitudinal policy analysis with inter-city C&DW flow data, GIS-based material-flow mapping, facility-capacity information, recycling performance, and cross-jurisdictional enforcement records. By comparing policy provisions across multiple time points with management outcomes, it is possible to clarify how policy changes relate to C&DW flows, resource-recovery outcomes, and the distribution of treatment responsibilities across cities. The document-selection and comparative coding approach developed here could be applied in other metropolitan regions, with the coding criteria adapted to local legal systems, waste definitions and administrative responsibilities.
Supplementary Materials
The following supporting information can be downloaded at: https://www.mdpi.com/article/10.3390/su182211715/s1, Table S1: Inventory of 90 selected policy texts. Table S2: Time distributions of historical first issuances and selected text versions. Table S3: Criteria for classifying policy provisions. Table S4: Keywords and corresponding expressions. Table S5: Keyword frequencies and policy coverage. Table S6: Content coding of 90 selected policy texts. Table S7: Joint coverage of policy provisions. Table S8: Comparison with an earlier PMC framework. Table S9: Illustrative examples of PMC coding decisions. Table S10: Binary PMC coding and scores for 11 selected instruments. Table S11: Sensitivity to weighting and policy disclosure. Table S12: Initial inter-coder agreement and coding disagreements. Table S13: Item codes and dimension scores for the Shenzhen instruments applicable in 2018 and 2025.
Author Contributions
Conceptualization, J.B. and Q.H.; methodology, J.B. and Z.L.; software, Q.D.; validation, J.B., Z.L. and Q.D.; formal analysis, J.B. and Q.D.; investigation, Q.H., Y.Z. and J.C.; resources, Q.H. and Z.L.; data curation, Q.D. and Y.Z.; writing—original draft preparation, J.B.; writing—review and editing, J.B., Z.L., Q.H. and J.C.; visualization, Q.D. and Y.Z.; supervision, Z.L. and Q.H.; project administration, J.B. and Q.H.; funding acquisition, Z.L. and Q.H. All authors have read and agreed to the published version of the manuscript.
Funding
This research was funded by the National Key Research and Development Program of China (Grant No. 2023YFC3806601), the National Natural Science Foundations of China (Grant No. 52478505), the General Program Sponsored by Shenzhen Natural Science Foundation in Basic Research Fund (Grant No. JCYJ20250604145728038), the Guangdong Provincial Key Laboratory of Intelligent and Resilient Structures for Civil Engineering (Grant No. 2023B1212010004), and the Shenzhen Key Lab of Urban & Civil Engineering Disaster Prevention & Reduction (Grant No. SYSPG20241211173608001).
Institutional Review Board Statement
Not applicable.
Informed Consent Statement
Not applicable.
Data Availability Statement
The data presented in this study are available in the article and its Supplementary Materials.
Conflicts of Interest
The authors declare no conflicts of interest.
Abbreviations
The following abbreviations are used in this manuscript:
| PMC | Policy Modeling Consistency |
| C&DW | Construction and demolition waste |
| GBA | Guangdong–Hong Kong–Macao Greater Bay Area |
| CV | Coefficient of variation |
| SD | Standard deviation |
| GIS | Geographic information system |
References
- Lyu, Y.; Xiong, N.N.; Liang, Y.Y.; Lin, S.Q.; Wang, J. Estimation of construction and demolition waste and assessment of disposal facility location: An integrated Material Flow Analysis and Geographic Information System approach. Resour. Conserv. Recycl. 2025, 218, 108226. [Google Scholar] [CrossRef] [Scilit]
- Pan, T.T.; Yan, F.Q.; Su, F.Z.; Xu, L. The Assessment of Land Suitability for Urban Expansion and Renewal for Coastal Urban Agglomerations: A Pilot Study of the Guangdong-Hong Kong-Macao Greater Bay Area. Land 2024, 13, 1729. [Google Scholar] [CrossRef] [Scilit]
- Peng, Z.; Lu, W.; Webster, C.J. Quantifying the embodied carbon saving potential of recycling construction and demolition waste in the Greater Bay Area, China: Status quo and future scenarios. Sci. Total Environ. 2021, 792, 148427. [Google Scholar] [CrossRef] [Scilit]
- Ruiz, L.A.L.; Ramón, X.R.; Domingo, S.G. The circular economy in the construction and demolition waste sector—A review and an integrative model approach. J. Clean. Prod. 2020, 248, 119238. [Google Scholar] [CrossRef] [Scilit]
- Ding, Z.K.; Wang, X.R.; Zou, P.X.W. Barriers and countermeasures of construction and demolition waste recycling enterprises under circular economy. J. Clean. Prod. 2023, 420, 138235. [Google Scholar] [CrossRef] [Scilit]
- Liu, J.K.; Wu, P.; Jiang, Y.H.; Wang, X.T. Explore potential barriers of applying circular economy in construction and demolition waste recycling. J. Clean. Prod. 2021, 326, 129400. [Google Scholar] [CrossRef] [Scilit]
- Ferriz-Papi, J.A.; Lee, A.; Alhawamdeh, M. Examining the Challenges for Circular Economy Implementation in Construction and Demolition Waste Management: A Comprehensive Review Using Systematic Methods. Buildings 2024, 14, 1237. [Google Scholar] [CrossRef] [Scilit]
- Ministry of Housing and Urban-Rural Development. Opinions on Further Strengthening the Management of Urban Construction Waste. 2025. Available online: https://www.mohurd.gov.cn/gongkai/fdzdgknr/zgzygwywj/art/2025/art_ddb92f6def7444b8bcb68654ec7a393b.html (accessed on 10 October 2026).
- Yu, B.; Wang, J.; Wu, H.; Wong, A.B.; Liao, Y.; Zuo, J. Self-fulfillment degree of construction and demolition waste management capability based on the Triple-balance theory: A case study of Guangdong-Hong Kong-Macao Greater Bay Area. Waste Manag. 2021, 133, 99–109. [Google Scholar] [CrossRef] [Scilit]
- Civil Engineering and Development Department, The Government of the Hong Kong Special Administrative Region. Environment and Sustainability Services. 2026. Available online: https://www.cedd.gov.hk/eng/about-us/core-business/environment/index.html (accessed on 10 October 2026).
- Wu, H.; Zuo, J.; Yuan, H.; Zillante, G.; Wang, J. Investigation of the social and economic impacts of cross-regional mobility of construction and demolition waste in Australia. Resour. Conserv. Recycl. 2023, 190, 106814. [Google Scholar] [CrossRef] [Scilit]
- He, L.L.; Yuan, H.P.; Wu, H.Y. Collaborative mechanism for promoting the cross-regional management of construction and demolition waste. J. Clean. Prod. 2022, 372, 133706. [Google Scholar] [CrossRef] [Scilit]
- Li, M.; Han, C.; Shao, Z.; Meng, L. Exploring the evolutionary mechanism of the cross-regional cooperation of construction waste recycling enterprises: A perspective of complex network evolutionary game. J. Clean. Prod. 2024, 434, 139972. [Google Scholar] [CrossRef] [Scilit]
- Weng, X.Y.; Wu, H.Y.; Zhong, M.Y.; Oteng, D. Driving mechanisms and evolutionary simulation of cross-regional collaborative management for construction and demolition waste: Evidence from the Guangdong-Hong Kong-Macao greater bay area. Resour. Conserv. Recycl. 2026, 232, 108964. [Google Scholar] [CrossRef] [Scilit]
- Ho, P. The Costs and Environmental Justice Concerns of NIMBY in Solid Waste Disposal. J. Assoc. Environ. Resour. Econ. 2023, 10, 607–654. [Google Scholar] [CrossRef] [Scilit]
- Lu, W.; Lou, J.; Webster, C.; Xue, F.; Bao, Z.; Chi, B. Estimating construction waste generation in the Greater Bay Area, China using machine learning. Waste Manag. 2021, 134, 78–88. [Google Scholar] [CrossRef] [Scilit]
- Wu, H.; Chen, R.; Yuan, H.; Yong, Q.; Weng, X.; Zuo, J.; Zillante, G. An evaluation model for city-scale construction and demolition waste management effectiveness: A case study in China. Waste Manag. 2024, 182, 284–298. [Google Scholar] [CrossRef] [Scilit]
- Lu, W.S.; Lee, W.M.W.; Bao, Z.K.; Chi, B.; Webster, C. Cross-jurisdictional construction waste material trading: Learning from the smart grid. J. Clean. Prod. 2020, 277, 123352. [Google Scholar] [CrossRef] [Scilit]
- Peng, Z.Y.; Lu, W.S.; Webster, C. Identifying the impacts of trading construction waste across jurisdictions: A simulation of the Greater Bay Area, China, using non-linear optimization. Environ. Sci. Pollut. Res. 2023, 30, 46884–46899. [Google Scholar] [CrossRef] [Scilit]
- Li, J.R.; Yao, Y.; Zuo, J.; Li, J.G. Key policies to the development of construction and demolition waste recycling industry in China. Waste Manag. 2020, 108, 137–143. [Google Scholar] [CrossRef] [Scilit]
- Li, J.; Ji, J.; Zuo, J.; Tan, Y. Is Policy the Necessary or Sufficient Driving Force of Construction and Demolition Waste Recycling Industry Development? Experience from China. Int. J. Environ. Res. Public Health 2023, 20, 4936. [Google Scholar] [CrossRef] [Scilit]
- Ma, M.X.; Tam, V.W.; Le, K.N.; Butera, A.; Li, W.G.; Wang, X.Y. Comparative Analysis on International Construction and Demolition Waste Management Policies and Laws for Policy Makers in China. J. Civ. Eng. Manag. 2023, 29, 107–130. [Google Scholar] [CrossRef] [Scilit]
- Howlett, M. Governance modes, policy regimes and operational plans: A multi-level nested model of policy instrument choice and policy design. Policy Sci. 2009, 42, 73–89. [Google Scholar] [CrossRef] [Scilit]
- Feiock, R.C. The Institutional Collective Action Framework. Policy Stud. J. 2013, 41, 397–425. [Google Scholar] [CrossRef] [Scilit]
- Ruiz Estrada, M.A. Policy modeling: Definition, classification and evaluation. J. Policy Model. 2011, 33, 523–536. [Google Scholar] [CrossRef] [Scilit]
- Liu, Q.; Jia, M.T.; Xia, D. Dynamic evaluation of new energy vehicle policy based on text mining of PMC knowledge framework. J. Clean. Prod. 2023, 392, 136237. [Google Scholar] [CrossRef] [Scilit]
- Wang, L.; Cai, K.; Song, Q.; Zeng, X.; Yuan, W.; Li, J. How effective are WEEE policies in China? A strategy evaluation through a PMC-index model with content analysis. Environ. Impact Assess. Rev. 2025, 110, 107672. [Google Scholar] [CrossRef] [Scilit]
- Liu, F.; Liu, Z. Quantitative Evaluation of Waste Separation Management Policies in the Yangtze River Delta Based on the PMC Index Model. Int. J. Environ. Res. Public Health 2022, 19, 3815. [Google Scholar] [CrossRef] [Scilit]
- Zhang, S.M.; Zhang, T.; Wang, X. Structural consistency in AI governance: A PMC index assessment with evidence from China’s central-level policies. PLoS ONE 2026, 21, e0337024. [Google Scholar] [CrossRef] [Scilit]
- Kuang, B.; Han, J.; Lu, X.H.; Zhang, X.P.; Fan, X.Y. Quantitative evaluation of China’s cultivated land protection policies based on the PMC-Index model. Land Use Policy 2020, 99, 105062. [Google Scholar] [CrossRef] [Scilit]
- Ding, Z.K.; Huang, X.Y.; Wang, X.R.; Chen, Q.H.; Zhang, J.S.; Wu, Z.Z. Investigating the Determinants of Construction Stakeholders’ Intention to Use Construction and Demolition Waste Recycling Products Based on the S-O-R Model in China. Sustainability 2024, 16, 2262. [Google Scholar] [CrossRef] [Scilit]
- Li, J.R.; Zuo, J.; Wang, G.; He, G.H.; Tam, V.W.Y. Stakeholders’ willingness to pay for the new construction and demolition waste landfill charge scheme in Shenzhen: A contingent valuation approach. Sustain. Cities Soc. 2020, 52, 101663. [Google Scholar] [CrossRef] [Scilit]
- Wang, L.X.; Zhu, Z.D.; Xie, X.H.; Wu, J.Y. Research trends in the treatment and recycling of construction and demolition waste based on literature data-driven visualization. J. Environ. Manag. 2024, 371, 12301810. [Google Scholar] [CrossRef] [Scilit]
- Ma, M.X.; Tam, V.W.Y.; Le, K.N.; Li, W.G. Challenges in current construction and demolition waste recycling: A China study. Waste Manag. 2020, 118, 610–625. [Google Scholar] [CrossRef] [Scilit]
- Li, J.R.; Zuo, J.; Jiang, W.P.; Zhong, X.Z.; Li, J.G.; Pan, Y.L. Policy instrument choice for construction and demolition waste management: The case study of Shenzhen, China. Eng. Constr. Archit. Manag. 2020, 27, 1283–1297. [Google Scholar] [CrossRef] [Scilit]
- Wu, H.Y.; Zuo, J.; Yuan, H.P.; Zillante, G.; Wang, J.Y. Cross-regional mobility of construction and demolition waste in Australia: An exploratory study. Resour. Conserv. Recycl. 2020, 156, 104710. [Google Scholar] [CrossRef] [Scilit]
- Wang, Z.Y.; Xiong, Y.C.; Zhang, C.L. Quantitative Evaluation of Eco-Environmental Protection Policy in the Yangtze River Economic Belt: A PMC-Index Model Approach. Sustainability 2024, 16, 805. [Google Scholar] [CrossRef] [Scilit]
- Xu, J.T.; Zhang, Z.S.; Xu, Y.Q.; Liu, L.; Pei, T. Quantitative evaluation of waste sorting management policies in China’s major cities based on the PMC index model. Front. Environ. Sci. 2023, 11, 1065900. [Google Scholar] [CrossRef] [Scilit]
- Ma, X.F.; Ruan, Y.F. How to Evaluate Green Development Policy Based on the PMC Index Model: Evidence from China. Int. J. Environ. Res. Public Health 2023, 20, 4249. [Google Scholar] [CrossRef] [Scilit]
- Ma, W.T.; Li Hao, J. Enhancing a circular economy for construction and demolition waste management in China: A stakeholder engagement and key strategy approach. J. Clean. Prod. 2024, 450, 141763. [Google Scholar] [CrossRef] [Scilit]
- Paavola, J. Multi-Level Environmental Governance: Exploring the economic explanations. Environ. Policy Gov. 2016, 26, 143–154. [Google Scholar] [CrossRef] [Scilit]
- Shenzhen Municipality on Regulating the Balanced Disposal of Construction Waste Across Regions by Land. 2022. Available online: https://www.szlhq.gov.cn/lhzfhjsj/gkmlpt/content/9/9582/post_9582316.html (accessed on 10 October 2026).
- Guangzhou Municipal Urban Management and Law Enforcement Bureau. Guangzhou and Foshan Join Forces! Launch a Special Cross-Regional Joint Law Enforcement Operation. 2024. Available online: https://cg.gz.gov.cn/zhzx/sjyw/content/post_9711619.html (accessed on 10 October 2026).
- Borbon-Galvez, Y.; Curi, S.; Dallari, F.; Ghiringhelli, G. International industrial symbiosis: Cross-border management of aggregates and construction and demolition waste between Italy and Switzerland. Sustain. Prod. Consum. 2021, 25, 312–324. [Google Scholar] [CrossRef] [Scilit]
- Chen, W.; Yin, W.; Yi, B.; Xu, S.; Zhang, H.; Li, X. Evolutionary Mechanism of Government Green Development Behavior in Construction and Demolition Waste Recycling Projects: A Perspective of Ecological Compensation. Buildings 2023, 13, 1762. [Google Scholar] [CrossRef] [Scilit]
- Fourth Guangdong Provincial Ecological and Environmental Protection Inspection Group. Inspection Feedback to Zhaoqing (Fourth Batch). Guangdong Provincial Department of Ecology and Environment. 7 January 2025. Available online: https://gdee.gd.gov.cn/ztzl_13387/delsthjbhdc/dcgl/content/post_4646950.html (accessed on 10 October 2026). (In Chinese)
- Ma, W.T.; Liu, T.; Li Hao, J.; Wu, W.W.; Gu, X.R. Towards a circular economy for construction and demolition waste management in China: Critical success factors. Sustain. Chem. Pharm. 2023, 35, 101226. [Google Scholar] [CrossRef] [Scilit]
- Bao, Z.; Lu, W. Developing efficient circularity for construction and demolition waste management in fast emerging economies: Lessons learned from Shenzhen, China. Sci. Total Environ. 2020, 724, 138264. [Google Scholar] [CrossRef] [Scilit]

Disclaimer/Publisher’s Note: The statements, opinions and data contained in all publications are solely those of the individual author(s) and contributor(s) and not of MDPI and/or the editor(s). MDPI and/or the editor(s) disclaim responsibility for any injury to people or property resulting from any ideas, methods, instructions or products referred to in the content. |
© 2026 by the authors. Licensee MDPI, Basel, Switzerland. This article is an open access article distributed under the terms and conditions of the Creative Commons Attribution (CC BY) license.