


Abstract
Identifying non-linear evolutionary patterns within the water–society–economy–ecology (WSEE) system is fundamental for sustainable development research in arid regions. Taking the Ji-shaped bend of the Yellow River as a case study, this research integrated the Cloud Model (CM) to analyze the evolutionary characteristics of the WSEE comprehensive development level (CDL) from 2011 to 2023. Results demonstrated obvious non-linear evolutionary patterns and resource-environmental constraint mechanisms in the WSEE composite system evolution. Although the overall regional CDL rose from 0.50 to 0.62, the growth trajectories of the social and ecological subsystems have notably decelerated in recent years. Core cities’ social subsystems generally declined post-2019, while the ecological CDL’s average annual growth rate narrowed to 0.001–0.02, entering a prolonged plateau phase that may imply a transition where early scale-driven improvements encounter structural limitations. Urban development trajectories exhibited spatial differentiation, forming a differentiated dual-core pattern centered on Xi’an and Ordos. While cities with persistently lower CDLs (stagnating between 0.45 and 0.55) appear constrained by path dependencies, mitigating resource dependence through technological adaptation and intensive ecological management represents a plausible pathway to overcome these systemic plateaus. These findings provide a scientific basis for formulating dynamic, adaptive management and differentiated regulation strategies based on system fluctuation-sensitive reference parameters.
1. Introduction
Against the backdrop of intensifying global climate change, socio-economic and ecological governance is shifting from single-element control to the comprehensive management of complex systems [1]. Achieving the Sustainable Development Goals (SDGs) has become a focal issue in international environmental management, which necessitates balancing clean water (SDG 6), sustainable cities (SDG 11), economic growth (SDG 8), and terrestrial ecosystem protection (SDG 15) [2]. Water resources are critical for sustaining life, supporting economic development, and preserving ecological balance; they serve as the crucial link that binds social, economic, and ecological domains into an intricate, integrated system [3]. However, in global arid and semi-arid regions, this composite system faces unprecedented pressure. Characterized by high ecological vulnerability, limited resource and environmental carrying capacities, and poor systemic resilience, these regions are highly susceptible to systemic crises triggered by external perturbations [4,5,6]. Traditional single-element management approaches, such as relying solely on water conservancy projects or establishing isolated ecological protection areas, are no longer adequate to address current systemic challenges [7]. Therefore, accurately quantifying the nonlinear coupling relationships within the water–society–economy–ecology (WSEE) nexus is a practical necessity. Furthermore, scientifically evaluating its developmental level and identifying limiting factors are essential for guiding high-quality sustainable development in ecologically vulnerable areas.
To analyze the complexity of coupled socio-ecological systems, researchers have developed frameworks like DPSIR and PSR, which have significantly advanced sustainability assessments at the watershed scale [8,9]. While these conceptual frameworks clarify the logical connections among elements, traditional deterministic models often overlook the inherent ambiguity and randomness involved in sustainability transitions [10]. Furthermore, such models struggle to diagnose fluctuation risks within these integrated systems during quantitative evaluations [10,11]. The WSEE is a highly complex system characterized by multidimensional interactions. However, existing studies frequently focus on individual sectors, lacking comprehensive indicators that encompass water endowment, social equity, economic efficiency, and ecological health [12,13]. Consequently, evaluation results may fail to reflect the holistic state of the system. The selection of weighting methods also methodological challenges. Relying solely on subjective weighting often introduces expert bias and compromises objectivity [14]. Conversely, purely objective methods depend primarily on data variance, potentially overlooking the practical significance of indicators in environmental management [15]. Therefore, it is essential to establish a comprehensive indicator system and adopt a combined weighting approach. Integrating expert knowledge with data-driven insights can effectively mitigate evaluation bias and enhance the scientific rigor of the findings.
In quantifying composite systems, the greatest challenge often lies in addressing inherent system uncertainty [11]. Ecological evaluation indicators possess dual attributes, bridging the gap between qualitative concepts and quantitative measurements [10]. First, the boundaries of evaluation grades are inherently fuzzy. For instance, there is no absolute demarcation between “water shortage” and “adequate water resources,” but rather a gradual transition zone. Furthermore, monitoring data exhibit random fluctuations due to spatiotemporal variations and measurement errors [16]. Traditional methods, such as fuzzy comprehensive evaluation or grey relational analysis, partially address this fuzziness. However, they rigidly divide evaluation grades into deterministic intervals, failing to account for random fluctuations near critical points [6,17]. This results in the loss of information regarding system volatility during calculation. To address these methodological limitations, the CM achieves bidirectional mapping between qualitative concepts and quantitative values using expectation (Ex), entropy (En), and hyper-entropy (He) [18,19]. This theory simultaneously captures conceptual fuzziness and the randomness of membership degrees, thereby providing a more realistic representation of complex environmental systems. While the CM has been increasingly adopted in WSEE composite system evaluations, existing applications predominantly focus on deriving static integrated scores or final evaluation grades. The analytical potential of its internal parameters to diagnose systemic shifts remains largely underexploited. It is currently unclear whether the core features (Ex, En, and He) can serve as effective indicators for environmental management to reflect baseline trends, spatial imbalances, and the vulnerability of the system to external disturbances [18,20]. This study extends the traditional application of cloud models by tracking the spatiotemporal trajectories of these parameters, enabling them to capture nonlinear inflection points and threshold behaviors in watershed scale composite systems; This expansion is particularly important for decision support in ecologically fragile areas.
The Ji-shaped bend region of the Yellow River spans five provinces: Gansu, Ningxia, Inner Mongolia, Shaanxi, and Shanxi. It serves as the core hinterland for ecological protection and high-quality development in the Yellow River Basin [21,22]. Furthermore, it represents a typical resource-based urban agglomeration in global arid and semi-arid regions [22]. This region hosts large-scale coal, chemical, and energy industrial bases, playing an irreplaceable role in supporting national economic growth. However, situated in the transitional zone between desertified lands and the Loess Plateau, it is constrained by scarce precipitation and intense evaporation; consequently, its water resources are severely limited, and its ecology is highly fragile [23,24,25]. A complex trilemma is deeply intertwined here: intensive energy industry agglomeration, rigid water resource constraints, and high ecological vulnerability. This makes the region an ideal case study for examining strained human-environment interactions and the evolution of environmental management conflicts [26]. Therefore, accurately diagnosing the deficiencies of the WSEE nexus in these city clusters and formulating differentiated regulation strategies are crucial for regional governance. Furthermore, this research provides highly valuable empirical evidence for the sustainable management of watersheds in global arid regions.
Based on this background, this study constructs a Cloud Model-based evaluation framework to promote adaptive management in ecologically vulnerable areas. The research framework proceeds through three main steps: (1) formulating a multidimensional WSEE evaluation system by selecting key indicators across water, social, economic, and ecological dimensions; (2) applying a combined weighting method to reconcile subjective and objective differences, thereby ensuring the robustness of the indicator weights; and (3) employing the Cloud Model to delineate development levels and quantify evolutionary volatility and systemic uncertainties using cloud parameters. Building upon this framework, the study evaluates the macro-level systemic states and evolutionary trajectories hindering sustainable development in the Ji-shaped bend of the Yellow River urban agglomeration, revealing nonlinear trajectory shifts and systemic constraint mechanisms within the system’s evolution. These findings provide macroscopic empirical references for formulating differentiated strategies for regional development and ecological protection policies, ultimately supporting a transition toward more resilient and adaptive systemic governance.
2. Study Area and Data Sources
2.1. Overview of the Study Area
This study delineated the research area by integrating the Ji-shaped bend urban agglomeration planning with natural basin connectivity and administrative boundaries [23]. Consequently, the study area comprises 26 prefecture-level cities along the Yellow River main stem, including Lanzhou, Yinchuan, Hohhot, Taiyuan, and Xi’an (Figure 1). The regional geomorphology exhibits significant spatial heterogeneity, transitioning sequentially from west to east across alluvial plains (Hetao), aeolian landscapes (Ordos), loess gullies (Loess Plateau), and erosional gorges (Shanxi-Shaanxi). The superimposition of intense human activities onto this complex terrain creates a highly sensitive ecological zone, characterized by the most acute human-environment conflicts within the basin [24]. Climatically, the region exhibits a significant east–west gradient, driven by the coupling of zonal circulation and non-zonal topographic factors [24,25]. It transitions westward from an eastern temperate monsoon climate in the east (350–450 mm annual precipitation) into semi-arid and arid zones. In the extreme northwestern arid zones, annual precipitation falls below 200 mm, while potential evaporation exceeds 2000 mm [23]. This profound moisture deficit severely restricts regional water recharge capabilities. Furthermore, archetypal fragile ecological units, such as the Hobq Desert and Mu Us Sandy Land, are widely distributed across the region. The region is also the primary source of coarse sediment for the middle reaches of the Yellow River [26]. This fragile ecological baseline exhibits high sensitivity and low resilience to human disturbances, leaving ecosystem services in a critical state. Such extreme spatial heterogeneity and evolutionary volatility pose severe challenges to traditional deterministic environmental evaluation methods.
Figure 1.
Overview of the geographical location and climatic environment of the study area.
As a national base for energy and heavy chemical industries, the Ji-shaped bend of the Yellow River exhibits highly unbalanced economic development [27]. By 2023, the study area’s gross domestic product (GDP) reached 5.52 trillion CNY, with a per capita GDP of 91,600 CNY. However, the region exhibits significant internal polarization and spatial differentiation. Resource-based cities such as Ordos and Yulin, driven by coal and oil-gas exploitation, achieve a per capita GDP as high as 263,400 CNY. Conversely, western ecological functional zones like Guyuan and Bayannur, constrained by harsh natural conditions and geographic location, face a development dilemma characterized by the conflict between ecological conservation and economic growth. Resource-based water scarcity has become a strict constraint on the region’s sustainable development. In 2023, the total regional water resources amounted to merely 29.905 billion m3, resulting in acute supply-demand imbalances. Regarding the water use structure, the proportion of agricultural water use in regions such as Ningxia and Inner Mongolia is disproportionately high [28]. Although industrial water constitutes only 12.2% of total usage, inelastic industrial water demand continues to climb due to the capacity expansion of the energy base and the extension of industrial chains. Furthermore, with the advancement of ecological projects such as desertification control, ecological water demand is experiencing continuous growth, which further exacerbates the intense competition among productive, domestic, and ecological water allocations [21].
2.2. Data Sources
The study spans from 2011 to 2023, a period that encompasses the deepening of the “Belt and Road” Initiative and the core implementation phases of the Yellow River Basin ecological protection strategy. This timeframe represents a critical window for the Ji-shaped bend region’s transition from traditional extensive growth to green, high-quality development, allowing the study to capture both the formation of regional strategic consensus and the dynamic impacts of dense policy implementation on the evolution of the WSEE composite system. By integrating statistical bulletins and yearbooks from various government levels, this research constructed a multi-source spatiotemporal panel database covering 26 prefecture-level cities over 13 years. Specifically: (1) Water resource data were sourced from municipal and provincial Water Resources Bulletins, including total water resources, consumption structures, and water-use indicators; (2) Socio-economic data were compiled from the China City Statistical Yearbook, China Statistical Yearbook, and provincial/municipal yearbooks; (3) Ecological and environmental data were primarily obtained from Environmental Status Bulletins, National Economic and Social Development Statistical Bulletins, and government work reports. To ensure the continuity and completeness of the multi-source panel database, a small number of missing data points were systematically imputed using linear interpolation. In addition, min-max normalization was employed to eliminate dimensional differences and facilitate subsequent calculations; positive indicators and negative indicators were normalized separately to a dimensionless scale ranging from 0 to 1.
3. Methods
3.1. Construction of Composite System Indicator System
To select the core indicators for evaluating the coordinated development of the Ji-shaped bend of the Yellow River, Grey Relational Analysis (GRA) was employed [29]. By comparing the geometric similarity between each indicator sequence and the system’s ideal reference sequence, the grey relational grade (D) between the indicators and the system’s evolutionary trends was quantified. This facilitated the preliminary elimination of low-impact variables that demonstrated low correlation with the system’s evolutionary patterns, thereby ensuring the representativeness of the indicator system. Subsequently, Factor Analysis (FA) was applied to categorize the retained highly correlated indicators into distinct multi-dimensional groups [30]. Based on the results of the rotated factor loading matrix, and adhering to the principles of functional orientation and regional heterogeneity, key indicators with the greatest industrial practical representativeness and managerial significance were selected. Ultimately, this rigorous screening process established the evaluation indicator framework for the WSEE nexus.
3.2. Weight Calculation of Coupled FAHP-CRITIC
In the comprehensive evaluation of complex systems, a uniform global weighting scheme often fails to capture internal spatial heterogeneity and implicitly assumes homogenous developmental priorities across the entire study area. The Ji-shaped bend of the Yellow River spans five provinces and autonomous regions, and the unbalanced characteristics of its natural endowments, industrial structures, and strategic positioning mean that different cities exhibit varying evolutionary trajectories and core challenges within the WSEE nexus. Adopting a single global subjective weight would mathematically obscure the fundamental policy trade-offs between, for instance, agricultural water conservation and industrial economic output. Therefore, adhering to the principles of dominant function, developmental constraints and spatial organization, this study developed a classification-based weight calculation framework tailored to functional positioning, categorizing the 26 prefecture-level cities into three distinct functional typologies. The first category comprises Urban Development-type cities (UDT), where the evaluation logic focuses on comprehensive carrying capacity and polarization effects. The second category consists of Energy Development-type cities (EDT), emphasizing energy utilization efficiency and industrial advancement. The third category includes Agricultural Development-type cities (ADT), prioritizing agricultural productivity and ecological conservation effectiveness. On this basis, the Fuzzy Analytic Hierarchy Process (FAHP) was employed to construct differentiated fuzzy judgment matrices for the respective functional units, utilizing triangular fuzzy numbers to quantify cognitive uncertainty [31]. Specifically, these differentiated matrices are systematically derived from the sustainable development priorities explicitly articulated in prior literature and national policies. This classification-based weighting mode enables the subjective weights to accurately reflect the heterogeneous sustainable development priorities of cities under different functional positionings.
Concurrently, to eliminate systemic biases potentially introduced by subjective judgment and to enhance the objectivity of the evaluation, the CRITIC method was adopted to quantify the objective contributions of the indicators based on the data’s internal structure [32]. By integrating the contrast intensity and conflict of the indicators, this method determines objective weights derived entirely from the statistical properties of the sample data, allowing it to sensitively capture the actual differentiation patterns among evaluation units. Ultimately, for the three distinct functional typologies, the typology-specific FAHP subjective weights and the CRITIC objective weights were integrated to construct a hybrid weighting model. This hybrid weighting approach ensures that the evaluation framework provides more targeted insights for spatially differentiated development policies and environmental management decisions.
3.3. Comprehensive Development Level Measurement Based on CM
To address the complexity and uncertainty inherent in the evolution of the WSEE composite system within the Ji-shaped bend of the Yellow River, conventional deterministic evaluation methods often result in the loss of boundary information due to hard threshold partitioning. To overcome this limitation, this study introduces cloud model theory to construct a comprehensive evaluation framework encompassing qualitative concept parameterization, stochastic simulation, and continuous mapping [18,19]. Within this framework, evaluation indicators are treated as stochastic realizations under qualitative concepts (evaluation grades). By utilizing a forward cloud generator to resolve fuzzy membership relationships between adjacent grades, this approach not only preserves the structural uncertainty of the evaluation process but also provides a precise reflection of microscopic variations in system evolution [20]. The specific implementation path is as follows:
(1) First, the threshold intervals for the five levels of all indicators are determined. Table 1 provides a detailed list of the original threshold ranges for each indicator. For the open boundaries at both ends of the threshold interval, historical extremum was used to determine the boundary parameters to ensure that all actual observations fell within the computable range. Based on the “atomization” characteristic of the CM, these qualitative grades were transformed into quantitative descriptions composed of the Ex, En, and He. Specifically, Ex represents the central value of the evaluation grade, En reflects the measurable range and inherent uncertainty of the data, and He denotes the dispersion of the entropy (i.e., the thickness of the cloud). Because the Cloud Model maps raw observational data directly to dimensional membership degrees based on these thresholds, conventional min-max normalization of input observations is omitted, avoiding potential distortion of the original data distribution. The calculation formulas are:
where Cmax and Cmin denote the maximum and minimum values of the grade thresholds, respectively.
Table 1.
Indicator system of water resource-society-economy-ecology composite system.
(2) To obtain the precise degree of certainty for the observational data across various evaluation grades, a forward cloud generator was utilized to execute stochastic simulations. Considering the randomness of a single calculation, 1000 iterations of simulation were conducted, after which the variance of the simulated membership degree stabilized. In each simulation round, a normally distributed random entropy (Eni) with expectation Ex and variance He2 was generated, which was subsequently used to calculate the membership degree (μ) of the indicator observation x concerning a specific grade m:
where Eni is the normally distributed random number generated in the i-th iteration; x is the actual observational value of the indicator; and μ represents the membership degree of x to grade m. The μ used for subsequent integration is the arithmetic mean of these 1000 stochastic runs, ensuring absolute reproducibility.
(3) Based on the FAHP-CRITIC coupled weighting model developed previously, the weights of various indicators (wi) were obtained. The mean μ of each indicator was then linearly weighted with its corresponding wi to generate a comprehensive membership degree (Cmi), which reflects the probability distribution of the evaluated object across the five developmental grades:
where μmi is the converged mean membership degree of indicator i corresponding to evaluation grade m.
(4) Although the traditional maximum membership principle can ascertain the dominant grade to which the system belongs, this method inherently acts as a form of dimensionality reduction, which is highly prone to obscuring the evolutionary rank differences among distinct samples within the same grade (i.e., the resolution deficiency issue). Therefore, this study formulated the comprehensive development level (CDL), establishing a mapping mechanism that transitions from discrete grade probabilities to continuous numerical values. Through the normalization of comprehensive membership degrees and the calculation of weighted moments, this mechanism translates the system state into continuous real numbers within the five grade intervals. Its superiority lies in its ability not only to identify the macro-stage of the system but also to acutely capture micro-evolutionary trends, such as “steady improvement” or “degradation risks”, through numerical fluctuations. The specific calculations are as follows:
where ci represents the normalized proportion of comprehensive membership when the evaluation grade is m; CDL is the comprehensive development level of the system; and k represents the evaluation grade characteristic value (assigned 1, 0.8, 0.6, 0.4, and 0.2 for grades I-V, respectively). A higher CDL indicates a superior overall development level of the WSEE composite system.
4. Results
4.1. Construction of the WSEE Composite System Indicator System
Given the pronounced characteristics of water scarcity, centralized energy exploitation, and ecological vulnerability in the Ji-shaped bend of the Yellow River, the coordinated development objectives of the WSEE composite system manifest primarily as the enhancement of human well-being, high-quality economic transition, and the construction of ecological security barriers. Prior to implementing the GRA, per capita domestic water consumption, urbanization rate, per capita GDP, and park green coverage area were designated as the ideal reference sequences for the water resources, society, economy, and ecology subsystems, respectively. The specific selection of these four variables is guided by the core macro-development targets of arid resource-based regions: (1) in water-scarce areas, per capita domestic water consumption represents a primary baseline for human survival and livelihood security; (2) urbanization rate is a widely used proxy reflecting population dynamics and the modernization of social structures during the transition of resource-based cities; (3) per capita GDP broadly captures the overall macroeconomic wealth accumulation and productivity; (4) park green coverage area serves as a relevant indicator of the “oasis effect” and human settlement livability in ecologically fragile desertification zones. Utilizing these ultimate target-oriented variables as anchors provides a reasonable rationale to align the screened indicators closely with the regional developmental context. Subsequently, the D between each candidate indicator and the reference sequence was quantitatively evaluated. Results indicated that 33 of the 60 initially selected indicators had a correlation degree exceeding 0.65, reflecting strong synergistic co-evolutionary characteristics. Among the 27 indicators with correlation degrees below 0.65, those exhibiting high redundancy and weak synergy were eliminated. However, a few regional indicators were retained, such as the proportion of agricultural water use, industrial wastewater discharge, and surface water supply, due to their practical managerial relevance in capturing specific regional water-use structures and pollution pressures. Furthermore, the sensitivity analysis comparing all 60 candidate indicators under alternative reference sequences demonstrates that this indicator selection is robust under the tested assumptions, providing a defensible basis for this specific evaluation framework.
Prior to FA, the dataset was assessed for suitability. The KMO value (>0.7) and Bartlett’s test of sphericity (p < 0.001) supported its suitability for factor extraction. Subsequently, principal components with eigenvalues greater than 1 were extracted, and the initial factor loading matrix was processed using Varimax orthogonal rotation. FA results showed that the cumulative variance contribution rates of common factors (each containing four factors) in the water resources, society, economy, and ecology subsystems reached 81.47%, 80.52%, 79.87%, and 76.94%, respectively. This was considered sufficient to capture the core information of the original indicators. Subsystem boundaries and indicator classifications were defined based on the rotated loading matrix distribution and correlation calculation results (Figure 2). At the societal subsystem level, urbanization rate and total grain yield emerged as heavily weighted variables, exhibiting high correlations and loadings. Although total grain production is typically classified as an agro-economic indicator, within the ecologically fragile Yellow River Basin, grain production transcends pure economic value; it fundamentally dictates regional food security and serves as a critical social safeguard for rural livelihoods. Methodologically, placing grain yield within the social rather than the economic subsystem may mathematically amplify the social subsystem’s sensitivity to agricultural and climatic fluctuations (e.g., droughts reducing yields). Simultaneously, this categorization scientifically optimizes the economic subsystem, rendering its index scores more purely reflective of the region’s actual economic growth drivers—namely, secondary and tertiary industrial momentum—rather than primary agricultural fluctuations. Therefore, this conceptual categorization aims to reflect the statistical associations between regional food supply stability and demographic characteristics.
Figure 2.
Correlation degree (D) and load value distribution of composite system-related indicators.
The economic subsystem indicators showed agglomeration characteristics, with high loadings and correlations for both per capita and total GDP. Water conservancy construction investment was defined as a foundational driving factor. Its loading (0.705) objectively reflected the heavy dependence of regional economic expansion on water conservancy investments. By integrating the proportions of the primary and tertiary industries, an economic driving chain covering total scale, power support, and industrial structure was constructed. Ecological subsystem identification focused on feedback regulation. Loadings for landscaping coverage and urban drainage network length both exceeded 0.85, reflecting the reshaping of the ecological environment through human intervention. Specifically, in arid urban environments, drainage pipe length serves as an indicator of wastewater collection capacity, contributing to groundwater pollution prevention and reclaimed water reuse, and thus constitutes an important ecological safeguard. Based on regional drought and Loess Plateau governance needs, unconventional water supply and cumulative soil erosion control area were selected. These represent the depth of resource recycling and the effectiveness of ecological restoration, respectively. In summary, based on the reasonably stable selection process, a WSEE evaluation system comprising 4 subsystems and 27 key indicators was established (Table 1).
4.2. Comprehensive Weight Calculation Result
Based on regional spatial heterogeneity and differences in functional positioning, this study adopted a hierarchical identification framework based on national planning orientations and quantitative economic structures to construct an urban functional classification system (Table 2). Specifically, the 26 cities were classified into three categories: (1) Urban agglomeration enhancement types (UDT), defined as provincial capitals or core nodes within national-level urban agglomerations (e.g., Guanzhong Plain, Hubao-E-Yu, and Lan-Xi agglomerations) characterized by high population density and advanced tertiary industries; (2) Energy-oriented development types (EDT), categorized as resource-based cities where the secondary industry accounts for a relatively high share (typically >40%) and where energy extraction or heavy chemical industries form a major part of the local economy (e.g., Ordos, Yulin); and (3) Agricultural development types (ADT), encompassing the remaining cities characterized by a higher proportion of primary industry and designated as national or regional main agricultural production zones (e.g., Bayannur, Guyuan).
Table 2.
Classification of city types in the Ji-shaped bend of the Yellow River.
Tailored to the distinct resource endowments and developmental heterogeneities of the three city categories, differentiated subjective weighting results were derived, combining expert experience with functional characteristics (Figure 3) [31]. Subsequently, utilizing standard deviations and correlation coefficient matrices to quantify the informational content of the indicators, the CRITIC method was applied to the complete pooled panel data (spanning 26 cities over 13 years) to capture the overarching objective variance. Following normalization, the objective weights for each indicator were calculated (Figure 3). Rather than arbitrarily assigning the combination coefficient (α), a systematic sensitivity analysis was expanded across the full spectrum of weight combinations (α ∈ [0, 1] at intervals of 0.1) to rigorously evaluate the statistical robustness and determine the optimal coupling coefficient. The quantitative comparison revealed that relying solely on the CRITIC method (α = 0.0), or excessively weighting it (α ≤ 0.4), tends to obscure regional heterogeneity and generate disproportionate extreme values driven by data dispersion. For instance, pure CRITIC assigned disproportionately high weights to the “proportion of primary industry” (0.2570) and the “length of urban drainage pipes” (0.2951). Even under the 0.2/0.8 and 0.4/0.6 schemes, the weight of drainage pipe length remained inflated at 0.2634–0.2701 and 0.2317–0.2451, resulting in persistent statistical outliers under these specific testing conditions. Conversely, although pure FAHP reflected regional distinctiveness, such as assigning a higher weight to the “gross industrial output value” in EDT cities (0.1738) compared to ADT cities (0.1167), it lacked objective data support when subjective bias dominated (α ≥ 0.6). Consequently, the selection of α = 0.5 is not merely a default baseline, but rather the optimal equilibrium identified through the expanded sensitivity testing. The 0.5 combined weighting achieves a critical balance: it not only buffered the extreme CRITIC value for drainage pipe length down to a rational range (0.2159–0.2326), but also effectively preserved the functional differentiation captured by the FAHP. For example, in the comprehensive weights, the “proportion of primary industry” remained logically highest in ADT cities (0.2119) compared to EDT (0.1821) and UDT cities (0.1857), while retaining a statistically significant functional divergence margin (0.0298). Furthermore, the sensitivity analysis indicates that while slight adjustments around this optimal equilibrium (e.g., 0.45 or 0.55) cause minor fluctuations in individual weights, the 0.5 coefficient remains the most statistically robust choice for bridging subjective policy priorities with objective data structures.
Figure 3.
Comprehensive weight calculation result of coupled FAHP-CRITIC.
Within the water resources subsystem, the hybrid weights highlighted an association between water resource utilization patterns and urban functional typologies (Figure 3). In ADT cities, indicators A3, A6, and A9 exhibited notably higher hybrid weights, indicating that these municipalities potentially face constraints stemming from groundwater overexploitation and intensive agricultural water consumption; for EDT cities, the prominent weights of A5 and A3 distinctly reflected the typical water consumption characteristics associated with energy and heavy chemical bases; meanwhile, in UDT cities, the elevated weights of A1 and A7 suggested that in densely populated areas, indicators related to domestic water supplies and water-use efficiency received higher statistical emphasis. The heterogeneity in weight rankings across the social, economic, and ecological subsystems further aligned with the varying developmental profiles of the three functional typologies (Figure 3). For ADT cities, the substantial weights assigned to B4, B2, and C4 highlighted the relative emphasis on food security and agricultural economic stability; concurrently, the elevated weights of D2 and D6 pointed to the relevance of soil and water conservation within the ecologically fragile zones of the Loess Plateau. For EDT cities, the high weights of B1 and C3 reflected the dual pressures of balancing industrial output with urban development; furthermore, the prominent weight of D5 indicated that the prevention and control of industrial point-source pollution emerged as heavily weighted factors in environmental management. For UDT cities, indicators B1, C1, and C5 yielded the highest hybrid weights, suggesting that population density and tertiary sector indicators were heavily weighted features in the evaluation of these cities; additionally, the relatively high weights of D1 and D4 highlighted an urgent need to enhance living environments and environmental carrying capacity.
4.3. Spatiotemporal Evolution Characteristics of Subsystem CDL
4.3.1. Calculation Results of Cloud Model Parameters
To execute the stochastic simulations, the qualitative five-grade threshold intervals were transformed into quantitative parameter matrices (Table 3). Table 3 presented the applied Cloud Model parameters (Ex, En, and He) for all 27 indicators across the five developmental grades. In this framework, Ex is designated as the central numerical value of a specific grade, preserving the original dimensional scale of the input data (e.g., the Ex for C1 in Grade I was 187,500). En is used to represent the fuzzy span and acceptable range of the observational data around the expectation, intended to account for the structural uncertainty between adjacent evaluation grades. To balance the preservation of fuzzy boundary characteristics with the requirement for numerical stability during stochastic iterations, the He, which controls the dispersion of cloud droplets, was set to a uniform constant of 0.01 for all indicators across all grades under the testing conditions. This complete parameter matrix serves as the algorithmic foundation for the subsequent forward cloud generator, enabling the transition from deterministic hard thresholds to probability-based continuous mapping without the need for prior data normalization.
Table 3.
Calculate the results of Ex and En based on indicator thresholds and assign values to He.
4.3.2. Scale of the Entire Region and Functional Zones
Between 2011 and 2023, the subsystems within the WSEE composite system of the Ji-shaped bend of the Yellow River exhibited significant non-linear evolutionary characteristics and path differentiation. While the Cloud Model directly outputs these trajectory shifts, we interpret them as reflections of the combined influence of policy interventions, resource endowments, and developmental stages (Figure 4). The water resources and economic subsystems showed a clear trend of synergistic improvement and convergent optimization. Likely benefiting from the implementation of strict water resource management systems and regional water network engineering, the water resources subsystem overcame its early dependence on high water consumption and followed a trajectory of continuous improvement. EDT cities, potentially leveraging rigorous industrial water-saving and reclaimed water reuse measures, demonstrated a significant catch-up effect. By 2023, their average CDL rose to 0.662, substantially narrowing the development gap with UDT cities (0.686). Meanwhile, the improvement observed in ADT cities aligned with the modernization of irrigation districts, and their water-use efficiency improved significantly, with the average CDL increasing from 0.554 in 2011 to 0.637 in 2023. Simultaneously, the economic subsystem maintained steady growth, though our contextual analysis suggests growth patterns underwent a transformation (Figure 4). Concomitant with regional industrial restructuring toward higher-efficiency sectors, UDT cities appear to have leveraged industrial agglomeration effects to establish a leading advantage, reaching an average annual CDL growth rate of 0.013. EDT cities, after navigating fluctuations in industrial cycles, gradually transitioned toward high-quality development.
Figure 4.
Temporal evolution characteristics of the CDL of four subsystems at the whole region and functional zone scales from 2011 to 2023.
In contrast, the social and ecological subsystems presented phased differentiation characteristics under evident resource and environmental constraints (Figure 4). The social subsystem exhibited a unique “inverted U-shaped” evolutionary pattern: it rose rapidly in the early stage, which coincided with the promotion of new-type urbanization, but later declined, a trend that may be associated with pressures from population outflow and aging. In particular, ADT and EDT cities faced challenges arising from the imbalance between rapid demographic shifts and population carrying capacity, which coincided with a fallback in development levels. The ecological subsystem displayed logarithmic growth characteristics-initially rapid and then decelerating (Figure 4). Although the initial implementation phase of large-scale ecological projects corresponded to a rapid climb in CDL, subsequent ecological improvement entered an empirical plateau phase. This plateau is interpreted as potentially reflecting a transition in governance focus shifting from scale expansion to structural optimization, compounded by rigid water resource constraints in arid regions. As the overall ecological improvement encountered internal structural constraints and entered a visible plateau phase, the momentum for ecological restoration in EDT cities and green expansion in UDT cities weakened, which was associated with the average annual CDL growth rate narrowing to 0.001–0.02 between 2018 and 2023. Overall, the evolution of the subsystems in the study area shifted from an early phase dominated by scale expansion to a stage of structural optimization and adaptation to these environmental constraints, while cities in different functional zones showed distinct adaptive differences when responding to resource and environmental constraints.
To verify whether the functional-type weighting strategy introduced structural biases into these observed cross-zone patterns, a robustness check was conducted by recalculating all CDL values under a uniform common-weight benchmark. A direct comparison demonstrates that the spatial hierarchy and functional-zone trajectories remain highly consistent. Spearman’s rank correlation coefficients between the two schemes exceed 0.90 across all years, with distribution extremes remaining structurally preserved (e.g., Ordos and Xi’an consistently anchor the upper tier, while traditional agricultural cities like Weinan anchor the lower tier). Furthermore, the group-level disparities are broadly maintained: 13-year average CDL values follow the identical order of UDT > EDT > ADT under both specifications, although the common-weight scheme marginally amplifies industrial outputs in EDT cities while slightly penalizing ADT scores. These results confirm that the observed typological heterogeneities and spatial dynamics reflect objective developmental realities rather than artifacts of the weighting strategy.
4.3.3. Heterogeneity at the Urban Scale
At the urban scale, the evolutionary trajectories of the WSEE composite subsystems exhibited marked spatial heterogeneity and path differentiation. The water resources and economic subsystems displayed a clear center-periphery gradient and functional zone disparities (Figure 5). Regional hub cities, represented by Xi’an, Taiyuan, and Lanzhou, maintained high-level stability in both dimensions, a result potentially supported by their advanced water infrastructure and high-end industrial clusters. Their CDL values for water and economy consistently remained within the high-value range of 0.70–0.85 throughout the study period, demonstrating robust system resilience and anti-interference capabilities. Conversely, EDT cities like Ordos and Yulin exhibited typical fast-tracking catch-up alongside periodic fluctuations. Likely driven by the promotion of industrial water conservation and reclaimed water reuse technologies, their water subsystem CDL surged from a low base (approx. 0.50) in 2010 to around 0.68 in 2020, making them contributors to regional improvement. Although their economies were massive in scale, they suffered from volatility, which correlates with the dual impact of energy price cycles and industrial de-capacity policies. For instance, their economic CDL saw a notable retreat between 2014 and 2016 (Figure 5). Meanwhile, ADT cities faced strong systemic constraints, stagnating at a low CDL for many years, which can be attributed conceptually to high agricultural water demand and lagging industrial hierarchies.
Figure 5.
Temporal changes in the CDL of the four subsystems across various cities from 2011 to 2023.
The social and ecological subsystems revealed complex developmental tensions between urban development stages and resource constraints (Figure 5). The social subsystem showed a unique “high-value decline” in core cities. For example, Xi’an’s social CDL once climbed above 0.75 in the early stage but retreated to approximately 0.50 by 2023. This trend is interpreted as a manifestation of urban carrying capacity constraints, reflecting the crowding effect on basic urban living spaces and the non-linear increase in urban governance complexity caused by intensive population concentration. EDT cities, on the other hand, exhibited lower stability and larger inter-annual volatility in social development, likely linked to economic fluctuations during their industrial transition periods. The ecological subsystem exhibited characteristics closely aligned with directed policy interventions. EDT cities like Ordos and Yulin achieved growth in ecological CDL, which coincided with periods of intensive mine restoration, green mine construction, and the implementation of ecological compensation policies. In contrast, several center cities hit a plateau, with their ecological CDL fluctuating within the 0.55–0.60 range. This observed stagnation, which showed no trend-based breakthrough over the final five years of the study period, suggested that urban expansion had encountered the rigid constraint mechanisms of environmental carrying capacity, restricting further upward movement in the evaluation index without fundamental structural shifts.
4.3.4. Evolution of Spatial Distribution Pattern
The calculated CDL values were discretized into seven intervals (Grades I-VII), with Grade I representing the highest level of development. During the study period, the water resources subsystem exhibited a trajectory transitioning from contiguous low-value clusters toward a distinct core-periphery architecture (Figure 6). Initially, constrained by the overarching natural water endowments, low-value zones were widely distributed across the entire region. In 2011, 20 cities were classified in Grades V to VII. Following the stringent implementation of water management regimes, UDT cities, potentially leveraging comprehensive infrastructure and adaptive management practices, coalesced into high-value cores. Concurrently, EDT cities achieved localized surges, which temporally aligned with the promotion of industrial water conservation and unconventional water utilization. This dynamic propelled the gradual convergence of intra-regional disparities, culminating in a gradient diffusion pattern emanating from central cities. By 2023, high-value cities (Grades I-III) increased to 16, while Grades VI-VII essentially disappeared. The society subsystem manifested characteristics of intensified polarization coupled with episodic downturns (Figure 6). Spatially, a gradient divergence emerged, characterized by elevated values in UDT and EDT cities, juxtaposed against depressed values in peripheral ADT cities (13 cities reached Grades I-III by 2019). Early-stage infrastructure construction coincided with an overall enhancement in regional CDL. However, in the mid-to-late phases, encountering urban carrying capacity constraints tied to demographic mobility and strains on public services, UDT cities experienced episodic declines. By 2023, Grade I-II cities plummeted to just 1, while Grade V-VII cities rebounded to 16. Simultaneously, peripheral regions suffered exacerbated low-value lock-in effects amidst these structural constraints, resulting in a fluctuating yet widening regional developmental chasm.
Figure 6.
Spatial distribution characteristics of the CDL of four subsystems in various cities from 2011 to 2023.
The economic subsystem presented a quintessential paradigm of monocentric leadership, multipolar support, and peripheral collapse (Figure 6). Xi’an exhibited profound monocentric agglomeration characteristics, maintaining an absolute lead in regional development alongside its advanced industrial structure, thereby exacerbating the degree of spatial polarization between the core and the periphery. In 2023, only 3 cities reached Grades I-II, while 18 remained in Grades IV-V. EDT cities such as Ordos, despite possessing substantial aggregate advantages, appeared to be encumbered by the structural rigidities often associated with resource-intensive sectors, manifesting as sub-tier growth poles fraught with high-level volatility. Conversely, the vast expanse of agricultural and mountainous counties (ADT cities), plagued by deficient endogenous momentum, languished chronically in low-level lag zones, confronting palpable spatial lock-in effects. The ecology subsystem elucidated a trajectory of spatially concentrated high-value breakthroughs, characterized by higher values in the north and lower values in the south (Figure 6). This spatial distribution decisively fractured the traditional logic of economic gradients, engendering a high-value enclave centered around Ordos. Coinciding with key national ecological engineering initiatives and the subsequent ecological remediation phases in resource-based economies, the northern desertified regions achieved a leapfrog enhancement in their CDL. In contrast, the southern traditional agrarian zones and antiquated industrial bases, likely constrained by historical environmental burdens and infrastructural deficits, languished persistently in mid-to-low value echelons. By 2023, 19 cities in these areas were in Grades IV-V, which underscored the highly uneven spatial distribution of ecological evaluation scores across different functional zones.
4.4. Evolutionary Characteristics of CDL in WSEE Composite System
At the regional scale, the WSEE nexus exhibited patterns of fluctuating growth alongside widening disparities (Figure 7). Between 2011 and 2023, the median CDL of the region rose from 0.50 to 0.62, indicating that the evolution of the nexus was gradually breaking away from its early path dependency on excessive resource consumption and transitioning toward a more intensive and efficient utilization paradigm. However, the increasing dispersion observed in the box plots over time revealed an intensification of internal developmental imbalances. Zonal analysis uncovered divergent evolutionary trajectories among the distinct functional typologies (Figure 7). ADT cities, likely constrained by the dual pressures of ensuring food security and implementing ecological restoration initiatives, demonstrated a low starting point and modest growth. By 2023, their CDL increments ranged only between 0.058 and 0.182, remaining in a prolonged low-level equilibrium associated with these systemic constraints. EDT cities exhibited fluctuating growth. Although they experienced initial setbacks likely associated with water-intensive industries and environmental pollution, they later achieved significant improvements in their index scores, a trend that developed concurrently with regional reports of green transitions and water-saving technological upgrades. UDT cities presented a strong spatial divergence pattern, with a mean CDL of 0.64 between 2019 and 2023, surpassing those of EDT cities (0.60) and ADT cities (0.58) during the same period. However, the pronounced spatial differences between the core growth poles and surrounding areas highlighted a core-periphery developmental gradient, making internal statistical disparities increasingly prominent.
Figure 7.
Spatiotemporal evolution characteristics of the CDL of composite systems in various cities from 2011 to 2023.
At the individual city scale, the evolution of the nexus was characterized by a dual-core spatial pattern anchored by Xi’an and Ordos (Figure 7). Xi’an consistently maintained its top-tier status, supported by its high-scoring economic subsystem (with an economic CDL exceeding 0.70). Typical resource-based cities such as Ordos and Yulin emerged as major contributors to the overall composite system improvement, as their ecological CDL values rose from 0.69 and 0.44 in 2011 to 0.92 and 0.60 in 2023, respectively. In contrast, although provincial capitals like Yinchuan and Lanzhou attained higher levels of economic development, their system evolution entered an empirical plateau phase, which is driven by lower scores in the water subsystem (with water subsystem CDL hovering around 0.60). Resource-depleted or traditional agricultural cities, such as Baiyin and Weinan, remained confined to the lower-value spectrum for a prolonged period, potentially related to structural economic characteristics and lower growth rates in the selected indicators. Regarding spatial configurations, the region as a whole underwent a structural shift from low-level homogenization to overall improvement and core-led growth (Figure 7). In the initial stage of the study period, the regional CDL remained within a low range of 0.44–0.70 (averaging 0.53), a condition largely reflective of the dual challenges posed by extensive economic growth models and fragile ecological baselines. Over time, spatial differentiation became increasingly pronounced, evolving into a distribution pattern characterized by an “east-high, west-low” gradient and a “north-fast, south-slow” growth rhythm. The northern “Energy Golden Triangle” region formed a prominent high-value cluster, a spatial formation that coincided with industrial complementarity and collaborative environmental governance. In comparison, although the Guanzhong Plain urban agglomeration (centered on Xi’an) exhibited strong polarization characteristics, its spatial extension of high-value scores to surrounding agricultural zones remained limited, leaving persistent spatial disparities in regional coordinated development.
5. Discussion
5.1. Nonlinear Evolution and Constraint Mechanisms of WSEE System in Ecologically Fragile Areas
Through an integrated multidimensional assessment based on the Cloud Model and CDL framework, a long-term evaluation of the WSEE composite system in the Ji-shaped bend of the Yellow River from 2011 to 2023 was conducted, to quantify its composite development status. Relying on the evaluation indices, it was found that the evolutionary trajectories of the subsystems did not follow a simple linear growth logic, but instead exhibited distinct non-linear characteristics and phased differentiation (Figure 8). In particular, the numerical decline of the social subsystem’s CDL during the later stage of the study, coupled with the collective deceleration in the ecological subsystem’s improvement rate, exhibits a statistical pattern that aligns with the concept of environmental carrying capacity constraints in specific arid and semi-arid geographical units [33]. These trajectory shifts suggest a potential theoretical transition: as indices representing the socio-economic scale or the intensity of artificial ecological interventions approached hypothesized regional environmental thresholds, the system’s positive developmental statistical synergies gradually weakened [34,35]. This statistical divergence indicates that these factors began to show the trade-offs rather than mutual gains, which coincided with a marked decrease in the system’s overall index score.
Figure 8.
Nonlinear evolution mechanism and constraint mechanisms of the WSEE system in the Ji-shaped bend of the Yellow River. The abbreviations E and R represent economy and resources, respectively, while D and NC stand for demand and natural ceiling, respectively.
Traditional urban economics theory posits that population agglomeration can improve urban functional efficiency through scale effects [20,36]. However, the results of this study showed that megacities represented by Xi’an, Hohhot, and Taiyuan, as well as several resource-based center cities, all exhibited a notable downward trend after their social subsystem development index scores reached a peak between 2017 and 2019. This observed statistical divergence from the linear perception of “scale equals efficiency” lends observational support to the theoretical perspective that water scarcity acts as a rigid environmental constraint that the optimal scale capacity of urban systems in arid regions [37,38]. As the urbanization rate reaches the observed empirical inflection point of 60–70%, the water demand generated by population surges is theorized to increasingly conflict with the limited total volume of water resources [39]. When per capita water resources approach the water scarcity warning line, the marginal costs of maintaining normal urban operations (such as inter-basin water transfers and emergency water supplies) are expected to rise exponentially [37,38,39,40]. It is important to acknowledge that the indicators for the social subsystem in this study primarily capture fundamental demographic and urbanization dynamics (e.g., urbanization rate, natural population growth, and per capita park area). Therefore, the observed decline in the social CDL primarily reflects demographic pressures, spatial crowding, and the structural imbalance between urbanization speed and basic environmental infrastructure, rather than proving a comprehensive deterioration of deeper social welfare. Statistically, this indicates that the urbanization model of purely pursuing incremental expansion in arid, water-deficient areas might be approaching its operational limits, further suggesting that subsequent social development needs to shift toward improving the quality of existing stocks to avoid potential declines in measurable social functions.
The evolutionary trajectory of the ecological subsystem similarly highlighted the complexity of governance effectiveness. Distinct from the empirical peak and subsequent decline observed in the social subsystem, the ecological subsystem exhibited a typical non-linear decelerating trend characterized by diminishing marginal returns in index growth. Specifically, the evaluation indices of ecological engineering entered a noticeable plateau phase where the growth rate of ecological improvement markedly decelerated [34,35,41]. Between 2011 and 2018, coinciding with the implementation of national key projects such as the large-scale Returning Farmland to Forest and Grass program, the CDL of the regional ecological subsystem achieved rapid growth [42]. However, after 2019, the upward momentum of this ecological improvement slowed down noticeably [43]. From an eco-hydrological perspective, a theoretical mechanism explaining this statistical deceleration is closely linked to the complex interplay between artificial vegetation construction and soil moisture in arid regions [42]. Although vegetation construction with excessively high densities or unsuitable species improved the greenness index in the short term, in the long run, it excessively consumed deep soil water. Previous empirical studies indicate that this can lead to deep soil desiccation, which subsequently inhibited further vegetation growth and even triggered degradation [44]. The entry of the ecological subsystem into a statistical plateau phase suggested that ecological restoration in the Ji-shaped bend of the Yellow River might be approaching the saturation boundaries that regional hydrology can securely support. Furthermore, interpreted through our index trajectories, the high-input, engineering-based governance models long relied upon by cities like Ordos and Yulin faced severe challenges to their sustainability. The inherent difficulty of further ecological improvement escalated as these cities approached the hypothesized limits of natural carrying capacity, and this was compounded by the increasing maintenance burdens of their artificial ecological assets.
A comprehensive comparison of the parallel evolutionary trajectories among the four major subsystems reveals diverging index trends that conceptually correspond to the risk of a potential coupling trap associated with these combined non-linear effects [45,46]. On the one hand, the economic subsystem preliminarily achieved a relative statistical decoupling from water resource consumption through industrial upgrading, which was reflected in the improvement of water use efficiency indicators (e.g., a decline in water consumption per 10,000 RMB of GDP). On the other hand, however, the rigid growth in demand for ecological and social domestic water highlighted the restrictive effect of total water resources as increasingly prominent. This internal tension implied that the primary constraint of the system is potentially shifting from an early shortage of economic capital to a composite shortage of natural capital.
5.2. Path Differentiation of Development in Resource-Based Cities
Based on the spatial heterogeneity analysis of CDL at the urban scale, the study highlighted divergent trajectories in the index scores among EDT cities. Growing EDT cities represented by Ordos and Yulin emerged as higher-performing cases in the regional evaluation, whereas depleted EDT cities such as Baiyin and Shizuishan consistently exhibited lower composite scores. This divergence in index trajectories suggests that natural resource endowment is not the sole factor associated with positive regional evaluation outcomes; extant literature highlights that the key lies in how to effectively convert resource revenues into renewable capital [39,40]. The transformation practices of Ordos and Yulin offer a context suggesting that parallel advancements in technological innovation and ecological management may help maintain the stability of socio-economic indicators and achieve higher subsystem evaluations [47]. In response to water resources, which are widely considered a primary constraint in arid regions, growing EDT cities showed index improvements that conceptually align with an enhanced capacity for resource substitution. External macro-statistical trends indicate that these cities concurrently advanced large-scale measures such as reclaimed water reuse and the advanced treatment of gray water, which coincided with the substitution of natural water sources with unconventional water resources as the primary supply for industry [48]. This transition toward technological adaptation is conceptually believed to be associated with substantially reduced disturbances to original aquatic habitats while ensuring the continuous growth of industrial output value. At the same time, policy reports indicate that concurrent with large-scale systematic projects such as the Kubuqi Desert governance and mine reclamation, positive ecological restoration of fragile ecosystems under human intervention was observed, which provides an empirical context for the elevated ecological index scores in our assessment [49]. Therefore, the high CDL values of growing EDT cities can be interpreted as a possible reflection of a structural shift toward high-efficiency water treatment and intensive ecological management. These shifts are proposed as critical underlying correlates that are temporally aligned with a statistical decoupling of economic growth from environmental loads.
In contrast, the persistently low CDL scores of cities such as Baiyin, Shuozhou, and Yan’an suggest they potentially faced developmental constraints and structural lock-in. With the gradual depletion of mineral resources and the lag in industrial technology development, the observed stagnation in their economic and ecological indices closely correlated with persistent challenges in large-scale ecological governance. It is theoretically plausible that because they may not have achieved key technological transitions during their resource-abundant periods, these cities found it difficult to improve resource utilization efficiency through technological innovation. Constrained by the status quo, they often maintained traditional heavy industrial paths characterized by high energy and water consumption [50]. While our macro-level evaluation framework cannot directly test these micro-industrial behaviors, this theoretical lock-in effect offers a explanation for the potential negative cycle: low-end industrial layouts are typically associated with intensified environmental pollution, while the continuous deterioration of the ecological environment can further constrain regional development potential and industrial diversification [51]. This statistical polarization in index performance suggests that a critical developmental window may have existed for the transformation of resource-based cities. Once the optimal time for structural transition is missed, the system theoretically faces heightened structural constraints and extremely high path-dependency costs. Based on the above spatial variations in index performance, the emergence of the Xi’an-Ordos dual-core leading pattern within our CDL evaluation possessed profound economic geographical rationality and aligned with the center-periphery spatial division model [52]. Within the composite system, a universal, single evolutionary path does not exist; instead, evolution is closely associated with the differentiated synergy of major functional zones. Xi’an exhibited index patterns consistent with intensive development, largely characterized by elevated economic efficiency and industrial sophistication. While Ordos, potentially relying on its dual advantages in energy production and ecological engineering, emerged as a supporting hinterland for regional material supply and ecological barriers. This dual-core driven model suggests that sustainable management strategies may benefit from transitioning away from the traditional mindset of isomorphic industrial competition. Instead, it highlights the potential value of enhancing resource complementarity and collaborative governance between core and peripheral cities to construct a functionally complementary network for regional coordinated development. However, it is important to acknowledge that these spatially differentiated patterns are derived from macro-statistical indicator evaluations. Future research employing spatial econometric models and micro-level data is necessary to causally identify the specific structural mechanisms between these core and peripheral nodes.
5.3. Adaptive Management Strategy Based on the WSEE Nexus
The long-term evolutionary trajectory of the WSEE nexus in the Ji-shaped bend of the Yellow River suggests that regional development may currently be in a critical window of transition from a traditional factor-driven model to structural optimization. Faced with the dual severe constraints of water scarcity and ecological fragility, alongside the highly non-linear and stochastic fluctuation characteristics exhibited within the nexus, traditional static, single-factor planning and management models appear increasingly inadequate. Transitioning toward a systemic governance paradigm requires a two-tiered adaptive management strategy (Figure 9): one grounded in the diagnostic patterns of our empirical findings, and another oriented toward future-proofing regional resilience [53].
Figure 9.
Sustainable and adaptive management strategies for ecologically fragile areas based on the nexus of water resources, society, economy, and ecology.
Rooted in the observed spatio-temporal patterns, the first tier of management focuses on optimizing existing structural linkages. The results indicate that industrial and ecological sectors often operate in isolation, exacerbating regional resource pressure. Therefore, a practical management shift involves reshaped material and energy flow pathways at the regional scale. By constructing an industrial symbiosis network, integrating industrial, agricultural, and urban domains, resource chains can be extended, facilitating the cascading utilization of water and energy. Furthermore, the cloud model’s output parameters (En and He) offer a diagnostic tool for identifying system instability. Management departments can utilize these parameters as indicators to pinpoint areas with pronounced state fluctuations. Consistent with our spatial analysis, differentiated and collaborative management is essential to address the identified developmental fault lines. By tailoring functions based on local resource endowments and carrying capacities, socio-economic activities can be prioritized in node cities with higher water-use efficiency, while environmentally sensitive areas are preserved as ecological security barriers.
Beyond the immediate optimization of systemic states, the complex nature of the WSEE nexus warrants an exploratory framework to address potential future disturbances. While the current dataset provides a robust evaluation of historical states, managing for future extreme conditions necessitates broader proactive strategies. From the perspective of long-term sustainable management, water rights allocation and ecological redline demarcation could benefit from moving beyond static multi-year averages toward a safe operating space that accounts for the probability of extreme events [54]. Establishing a resilient buffer zone through strategic resource redundancies, coupled with high-frequency monitoring systems, would enable macro-policies to undergo adaptive corrections as system states deviate from stable thresholds.
Despite the comprehensive insights provided by this study, certain limitations remain. The empirical turning points and carrying capacity boundaries identified herein are specific to the study area. However, the theoretical framework constructed, linking systemic volatility to the risk of coupling traps, offers a conceptual template for managing WSEE systems in other arid and semi-arid regions. Future research should prioritize integrating these diagnostic findings with spatial econometric models or rigorous threshold regression techniques to further disentangle the causal feedback loops and statistically verify the presence of definitive thresholds and return elasticities within the WSEE nexus.
6. Conclusions
This study conducted an in-depth analysis of the comprehensive development level and spatio-temporal evolution characteristics of the WSEE composite system in the Ji-shaped bend of the Yellow River from 2011 to 2023, and drew the following main conclusions:
(1) The cloud model results visually demonstrate non-linear evolutionary trajectories. Although the water resource and economic subsystems initially achieved synergistic optimization, the index trajectories of the social and ecological subsystems exhibited notable decelerations in recent years. Model outputs show that the social subsystem generally declined after peaking between 2017 and 2019. This empirical trend can be interpreted as a possible reflection of the increasing constraints on further urban expansion. Similarly, the index for ecological development also entered a plateau phase, with the average annual growth rate of the CDL narrowing to 0.001–0.02 in the later period. This may mean that regional development has already crossed the stage of large-scale expansion, shifting from an early emphasis on economic accumulation to structural bottlenecks caused by complex natural resource constraints in arid regions.
(2) The spatial heterogeneity of urban development trajectories was pronounced, evolving into a center-periphery differentiation pattern led by the dual cores of Xi’an and Ordos. Xi’an maintained an intensive lead, a trend we associate with elevated economic efficiency and industrial sophistication, as the mean CDL of its economic subsystem was greater than 0.70 in the later period. Growing EDT cities, such as Ordos, achieved notable ecological index improvements (the CDL of the ecological subsystem increased from 0.44 to 0.92). In contrast, ADT cities and depleted EDT cities lingered in a state of prolonged low-level equilibrium, with their CDLs stagnating between 0.45 and 0.55 for a long time. This persistent statistical stagnation suggests that these cities are potentially deeply trapped in structural lock-in and rigid path dependencies.
(3) The development level of the WSEE composite system showed a fluctuating upward trend, with the median CDL increasing from 0.50 to 0.62, but path differentiation within the region intensified. By 2023, three distinctly different evolutionary trajectories had clearly emerged: the polarized leadership of UDT cities (mean CDL of 0.64), the oscillatory catching-up of EDT cities (mean CDL of 0.60), and the low-level lingering of ADT cities (mean CDL of 0.58). This profound spatial differentiation in index performance implies that traditional static and uniform management models may no longer be sufficient. It is urgently necessary to transition away from traditional isomorphic industrial competition and implement resilient, adaptive, and collaborative management based on fluctuation-sensitive reference parameters of the cloud model and major functional ecological niches.
Author Contributions
Conceptualization, D.Y. and K.H.; methodology, D.Y., K.H. and M.L.; validation, K.H., M.L. and X.F.; formal analysis, M.L., X.F. and Y.Z.; data curation, X.F. and Y.Z.; writing—original draft preparation, D.Y. and K.H.; writing—review and editing, D.Y. and K.H. All authors have read and agreed to the published version of the manuscript.
Funding
This research was funded by the National Natural Science Foundation of China, grant numbers 52609254 and 42402243; the National Key R&D Program of China, grant number 2022YFC3202400; the China Postdoctoral Science Foundation, grant number 2025M772500; the Science and Technology Research Project of Henan Province, grant number 262102321120; the project of Key Laboratory of Water Grid Project and Regulation of Ministry of Water Resources, grant number QTKS0034W26116.
Institutional Review Board Statement
Not applicable.
Informed Consent Statement
Not applicable.
Data Availability Statement
The raw data used in this study were obtained from publicly available sources, including official bulletins, statistical yearbooks, and work reports. These sources have been appropriately cited in the manuscript. The authors confirm that they have the necessary rights to use these publicly available data for original analyses. The datasets processed during the current study are available from the corresponding author on reasonable request.
Conflicts of Interest
Authors Dengming Yan, Kai Hou, Mingjun Liu, and Xinying Fan are employed by Yellow River Engineering Consulting Co., Ltd. Yellow River Engineering Consulting Co., Ltd. was involved in the establishment of the research framework, data collection, theoretical research, data analysis and interpretation, and the publication of the manuscript. The authors declare no other conflicts of interest.
References
- Gruner, R.L.; Power, D. Mimicking Natural Ecosystems to Develop Sustainable Supply Chains: A Theory of Socio-Ecological Intergradation. J. Clean. Prod. 2017, 149, 251–264. [Google Scholar] [CrossRef] [Scilit]
- Subramaniam, N.; Akbar, S.; Situ, H.; Ji, S.; Parikh, N. Sustainable Development Goal Reporting: Contrasting Effects of Institutional and Organisational Factors. J. Clean. Prod. 2023, 411, 137339. [Google Scholar] [CrossRef] [Scilit]
- Zheng, J.; Sun, C. The Influence of Industrial Pulling Effect on the Coordinated Development of China’s Water Resources and Economic System. Water Resour. Manag. 2023, 37, 5307–5323. [Google Scholar] [CrossRef] [Scilit]
- Wang, J.; Zhang, F.; Jim, C.Y.; Chan, N.W.; Johnson, V.C.; Liu, C.; Duan, P.; Bahtebay, J. Spatio-Temporal Variations and Drivers of Ecological Carrying Capacity in a Typical Mountain-Oasis-Desert Area, Xinjiang, China. Ecol. Eng. 2022, 180, 106672. [Google Scholar] [CrossRef] [Scilit]
- Xiao, J.; Song, C.; Yan, C.; Jin, Z.; Duo, J. Screening of Suitable Species Combinations for Vegetation Restoration in Ecologically Damaged Areas of Representative Coal Mines on the South Slope of Tianshan Mountain. Sustainability 2024, 16, 11288. [Google Scholar] [CrossRef] [Scilit]
- Liu, F.; Yue, C.; Ma, J.; Guo, S.; Li, L. Water Resources Evaluation and Driving Factor Analysis in Nine Provinces of Western China Based on Water Footprint Theory. Ecol. Indic. 2025, 174, 113457. [Google Scholar] [CrossRef] [Scilit]
- Wang, C.; Li, B.; Li, J.; Bai, J.; Zhang, Y. Adaptive Management of Mountain Ecosystems Based on Carbon Sequestration: Based on the “State-Flow-Utility” Framework. Ecol. Indic. 2024, 168, 112703. [Google Scholar] [CrossRef] [Scilit]
- Iordache, V.; Neagoe, A. Conceptual Methodological Framework for the Resilience of Biogeochemical Services to Heavy Metals Stress. J. Environ. Manag. 2023, 325, 116401. [Google Scholar] [CrossRef] [Scilit] [PubMed]
- Hong, W.; Yang, S.; Guo, R.; Li, Y.; Jiang, L.; Li, X. Suitable Scale Structures for Urban Multi-Functions: An Integrative Approach Grounded in Socio-Ecological System Analysis. Ecol. Processes 2025, 14, 19. [Google Scholar] [CrossRef] [Scilit]
- Yuan, W.; Liu, M.; Wan, F. Calculation of Critical Rainfall for Small-Watershed Flash Floods Based on the HEC-HMS Hydrological Model. Water Resour. Manag. 2019, 33, 2555–2575. [Google Scholar] [CrossRef] [Scilit]
- Zhang, X.; Kong, Y.; Ding, X. How High-quality Urbanization Affects Utilization Efficiency of Agricultural Water Resources in the Yellow River Basin under Double Control Action? Sustainability 2020, 12, 2869. [Google Scholar] [CrossRef] [Scilit]
- Lv, H.; Zhao, X.; Yan, D.; Shang, W.; Zheng, X. Resilience Assessment of Water Supply and Demand in the Yellow River Basin Based on Integrated Optimisation Weighting-Improved Grey-Target Model. Mar. Freshw. Res. 2025, 76, MF24188. [Google Scholar] [CrossRef] [Scilit]
- Tao, M.; Zhao, Y.; Jiang, Q.; Wang, Z.; Li, B. Study on the Coupled Coordination of Water Resources Consumption and Economic Development in Heilongjiang Province under Different Scenarios Based on SD Model. Agric. Water Manag. 2025, 315, 109560. [Google Scholar] [CrossRef] [Scilit]
- Zhao, L.; Ma, R.; Yang, Z.; Ning, K.; Chen, P.; Wu, J. Ecosystem Health Risk Assessment of Lakes in the Inner Mongolian Plateau Based on the Coupled AHP-SOM-CGT Model. Ecol. Indic. 2023, 156, 111168. [Google Scholar] [CrossRef] [Scilit]
- Li, Z.; Cao, L.; Wang, S.; Liu, Z.; Ma, M. Spatiotemporal Evolution and Coupling Coordination of Multi-Objective and Multi-Dimensional Water Resources Carrying Capacity. Ecol. Indic. 2025, 178, 113965. [Google Scholar] [CrossRef] [Scilit]
- Hino, M.; Benami, E.; Brooks, N. Machine Learning for Environmental Monitoring. Nat. Sustain. 2018, 1, 583–588. [Google Scholar] [CrossRef] [Scilit]
- Zhang, Y.; Song, X.; Wang, X.; Jin, Z.; Chen, F. Multi-Level Fuzzy Comprehensive Evaluation for Water Resources Carrying Capacity in Xuzhou City, China. Sustainability 2023, 15, 11369. [Google Scholar] [CrossRef] [Scilit]
- Wang, X.; Yang, W.; Xu, Z.; Hu, J.; Xue, Y.; Lin, P. A Normal Cloud Model-based Method for Water Quality Assessment of Springs and Its Application in Jinan. Sustainability 2019, 11, 2248. [Google Scholar] [CrossRef] [Scilit]
- Tong, P.; Cui, X.; Li, J.; Dang, X.; Yu, Q. Evaluation of Spatial and Temporal Distribution of Carbon Emissions in Power Grid Based on Cloud Theory. Sustainability 2024, 16, 9767. [Google Scholar] [CrossRef] [Scilit]
- Zhang, S.; Xiang, M.; Xu, Z.; Wang, L.; Zhang, C. Evaluation of Water Cycle Health Status Based on a Cloud Model. J. Clean. Prod. 2020, 245, 118850. [Google Scholar] [CrossRef] [Scilit]
- Zhang, F.; Xuan, X.; He, Q. A Water-Energy Nexus Analysis to a Sustainable Transition Path for Ji-Shaped Bend of the Yellow River, China. Ecol. Inform. 2022, 68, 101578. [Google Scholar] [CrossRef] [Scilit]
- Xu, C.; Wang, X.; Liu, K.; Xin, P.; Wang, D.; Lian, B.; Xue, C.; Wang, H.; Gu, C. Study on the Development Characteristics and Mechanisms of Typical Loess Disaster Chains in Coal Resource Bases of the Yellow River “Ji-Shaped Bend” Region, China. Eng. Geol. 2025, 360, 108461. [Google Scholar] [CrossRef] [Scilit]
- Tong, L.; Luo, M. Spatiotemporal Evolution Characteristics and Driving Factors of Water-Energy-Food-Carbon System Vulnerability: A Case Study of the Yellow River Basin, China. Sustainability 2024, 16, 1002. [Google Scholar] [CrossRef] [Scilit]
- Wu, J.; Chen, X.; Yuan, X.; Yao, H.; Zhao, Y.; AghaKouchak, A. The Interactions Between Hydrological Drought Evolution and Precipitation-Streamflow Relationship. J. Hydrol. 2021, 597, 126210. [Google Scholar] [CrossRef] [Scilit]
- Lu, J.; Qin, T.; Yan, D.; Zhang, X.; Jiang, S.; Yuan, Z.; Xu, S.; Gao, H.; Liu, H. Drought and Wetness Events Encounter and Cascade Effect in the Yangtze River and Yellow River Basin. J. Hydrol. 2024, 639, 131608. [Google Scholar] [CrossRef] [Scilit]
- Guo, S.; Huang, J.; Xie, X.; Guo, X.; Wang, Y.; Li, L. The Coupling Coordination Relationship Between Urbanization and Ecosystem Health in the Yellow River Basin: A Spatial Heterogeneity Perspective. Land 2025, 14, 801. [Google Scholar] [CrossRef] [Scilit]
- Wang, Z.; Jiang, S.; Xu, S.; Zhang, J.; Mumtaz, F.; Zhang, M. Spatial Patterns and Its Influencing Factors on Villages Around the Ji-Shape Bend of the Yellow River. Front. Environ. Sci. 2024, 12, 1477693. [Google Scholar] [CrossRef] [Scilit]
- Zhang, L.; Ji, X.; Su, Y.; Lu, Z. Spatial-temporal Evolution and Coupling and Coordination of “Production-Life-Ecological” in Energy-Rich Area: A Perspective on Structure and Function. Land 2025, 14, 520. [Google Scholar] [CrossRef] [Scilit]
- Zhang, W.; Yu, Y.; Zhou, X.; Yang, S.; Li, C. Evaluating Water Consumption Based on Water Hierarchy Structure for Sustainable Development Using Grey Relational Analysis: Case Study in Chongqing, China. Sustainability 2018, 10, 1538. [Google Scholar] [CrossRef] [Scilit]
- Wang, R.; Zhao, X.; Qiu, H.; Cheng, X.; Liu, X. Uncovering Urban Water Consumption Patterns Through Time Series Clustering and Entropy Analysis. Water Res. 2024, 262, 122085. [Google Scholar] [CrossRef] [Scilit] [PubMed]
- Minatour, Y.; Bonakdari, H.; Aliakbarkhani, Z.S. Extension of Fuzzy Delphi AHP Based on Interval-Valued Fuzzy Sets and Its Application in Water Resource Rating Problems. Water Resour. Manag. 2016, 30, 3123–3141. [Google Scholar] [CrossRef] [Scilit]
- Xu, D.; Liu, J.; Liu, D.; Fu, Q.; Li, M.; Faiz, M.A.; Ali, S.; Li, T.; Liu, S.; Yan, G. Measurement and Analysis of the Resilience Characteristics for A Regional Agricultural Soil-Water Resource Composite System. J. Environ. Manag. 2022, 318, 115622. [Google Scholar] [CrossRef] [Scilit] [PubMed]
- Ge, L.; Mei, X.; Ping, J.; Liu, E.; Xie, J.; Feng, J. Identification of Suitable Vegetation Restoration Areas and Carrying Capacity Thresholds on the Loess Plateau. J. Environ. Manag. 2025, 373, 123660. [Google Scholar] [CrossRef] [Scilit] [PubMed]
- Huang, L. Advances and Perspectives on Soil Water Research in China’s Loess Plateau. Earth-Sci. Rev. 2019, 199, 102962. [Google Scholar] [CrossRef] [Scilit]
- Liu, X.; Wang, Q.; Zhu, X.; Zhang, Y. Nonlinear Response and Driving Mechanisms of Ecological Restoration Project Effectiveness to Drought. Ecol. Indic. 2025, 170, 113055. [Google Scholar] [CrossRef] [Scilit]
- Liu, W.; Hao, D.; Xu, R. Will New-Type Urbanization Enhance Sustainable Potential of Rural Water Resources in China?- Based on An Improved Water Poverty Framework. Agric. Water Manag. 2025, 307, 109256. [Google Scholar] [CrossRef] [Scilit]
- Xu, Q.; Zheng, X.; Zhang, C. Quantitative Analysis of the Determinants Influencing Urban Expansion: A Case Study in Beijing, China. Sustainability 2018, 10, 1630. [Google Scholar] [CrossRef] [Scilit]
- Zhong, J.; Hao, L.; Sajinkumar, K.S.; Yan, D. Changes of Ecological Vulnerability in Areas with Different Urban Expansion Patterns: A Case Study in the Yanhe River Basin, China. J. Environ. Manag. 2024, 370, 122607. [Google Scholar] [CrossRef] [Scilit] [PubMed]
- Zhang, F.; Wu, Z.; Di, D.; Wang, H. Water Resources Allocation Based on Water Resources Supply-Demand Forecast and Comprehensive Values of Water Resources. J. Hydrol. Reg. Stud. 2023, 47, 101421. [Google Scholar] [CrossRef] [Scilit]
- Yan, H.; Liu, Z. A New Perspective on the Evaluation of Urbanization Sustainability: Urban Health Examination. Sustainability 2023, 15, 9338. [Google Scholar] [CrossRef] [Scilit]
- Wang, S.; Cao, Y.; Li, S.; Liu, X.; He, J.; Guan, Y.; Bai, Z. Zonal Gaming and Overall Enhancement of Ecosystem Services: A Case From the Compound Area of Mine-City and Agriculture-Forestry-Grass in Loess Region, China. Ecol. Eng. 2025, 212, 107513. [Google Scholar] [CrossRef] [Scilit]
- Sun, J.; Li, G.; Zhang, Y.; Qin, W.; Wang, M. Identification of Priority Areas for Afforestation in the Loess Plateau Region of China. Ecol. Indic. 2022, 140, 108998. [Google Scholar] [CrossRef] [Scilit]
- Liang, W.; Fu, B.; Wang, S.; Zhang, W.; Jin, Z.; Feng, X.; Yan, J.; Liu, Y.; Zhou, S. Quantification of the Ecosystem Carrying Capacity on China’s Loess Plateau. Ecol. Indic. 2019, 101, 192–202. [Google Scholar] [CrossRef] [Scilit]
- Wang, X.; Zhang, K.; Li, J.; Li, Q.; Na, W.; Gao, Y.; Gao, Z. Response of Soil Water in Deep Dry Soil Layers to Monthly Precipitation, Plant Species, and Surface Mulch in A Semi-arid Hilly Loess Region of China. Agric. Water Manag. 2024, 291, 108612. [Google Scholar] [CrossRef] [Scilit]
- O’Connell, E. Towards Adaptation of Water Resource Systems to Climatic and Socio-economic Change. Water Resour. Manag. 2017, 31, 2965–2984. [Google Scholar] [CrossRef] [Scilit]
- Zhang, X.; Xu, D.; Wang, Z.; Zhang, Y. Balance of Water Supply and Consumption During Ecological Restoration in Arid Regions of Inner Mongolia, China. J. Arid Environ. 2021, 186, 104406. [Google Scholar] [CrossRef] [Scilit]
- Zhang, Y.; Wu, X.; Xue, Z.; Wang, X. Spatiotemporal Characteristics and Interactive Effect Between Ecology and Economy in Forest Ecological Protection Area: Conflict or Coordination? Ecol. Indic. 2025, 177, 113822. [Google Scholar] [CrossRef] [Scilit]
- Li, J.; Song, S.; Ayantobo, O.O.; Wang, H.; Jiaping, L.; Zhang, B. Coordinated Allocation of Conventional and Unconventional Water Resources Considering Uncertainty and Different Stakeholders. J. Hydrol. 2022, 605, 127293. [Google Scholar] [CrossRef] [Scilit]
- Zhai, Y.; Wang, Y.; Hao, L.; Qi, W. Medium-and Long-term Independent Contributions of Climate Change, Management Measures and Land Conversion to Vegetation Dynamics and Inspiration for Ecological Restoration in Inner Mongolia, China. Ecol. Eng. 2025, 212, 107504. [Google Scholar] [CrossRef] [Scilit]
- Liu, H.; Li, D.Y.; Ma, R.; Ma, M. Assessing the Ecological Risks Based on the Three-Dimensional Ecological Footprint Model in Gansu Province. Sustainability 2022, 14, 16995. [Google Scholar] [CrossRef] [Scilit]
- Xu, Q.; Wang, C.; Guo, S.; Yin, Y.; Liu, H.; Zhai, L. Water Resource Management Measures by Co-Regulating Water Quality and Water Quantity for Plateau Watersheds in Southwestern China. J. Clean. Prod. 2025, 486, 144519. [Google Scholar] [CrossRef] [Scilit]
- Hu, B.; Yuan, K.; Niu, T.; Zhang, L.; Guan, Y. Study on the Spatial and Temporal Evolution Patterns of Green Innovation Efficiency and Driving Factors in Three Major Urban Agglomerations in China-Based on the Perspective of Economic Geography. Sustainability 2022, 14, 9239. [Google Scholar] [CrossRef] [Scilit]
- Almulhim, A.I.; Al Kafy, A.; Ferdous, M.N.; Fattah, A.; Morshed, S.R. Harnessing Urban Analytics and Machine Learning for Sustainable Urban Development: A Multidimensional Framework for Modeling Environmental Impacts of Urbanization in Saudi Arabia. J. Environ. Manag. 2024, 357, 120705. [Google Scholar] [CrossRef] [Scilit] [PubMed]
- Cologna, V.; Meiler, S.; Kropf, C.M.; Lüthi, S.; Mede, N.G.; Bresch, D.N.; Lecuona, O.; Berger, S.; Besley, J.; Brick, C.; et al. Extreme Weather Event Attribution Predicts Climate Policy Support Across the World. Nat. Clim. Change 2025, 15, 725–735. [Google Scholar] [CrossRef] [Scilit] [PubMed]
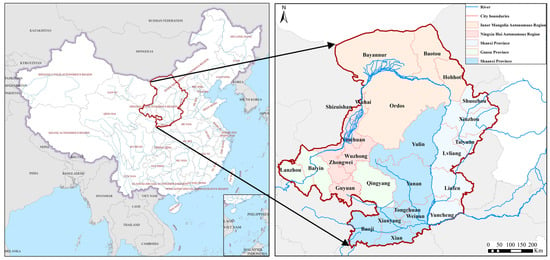
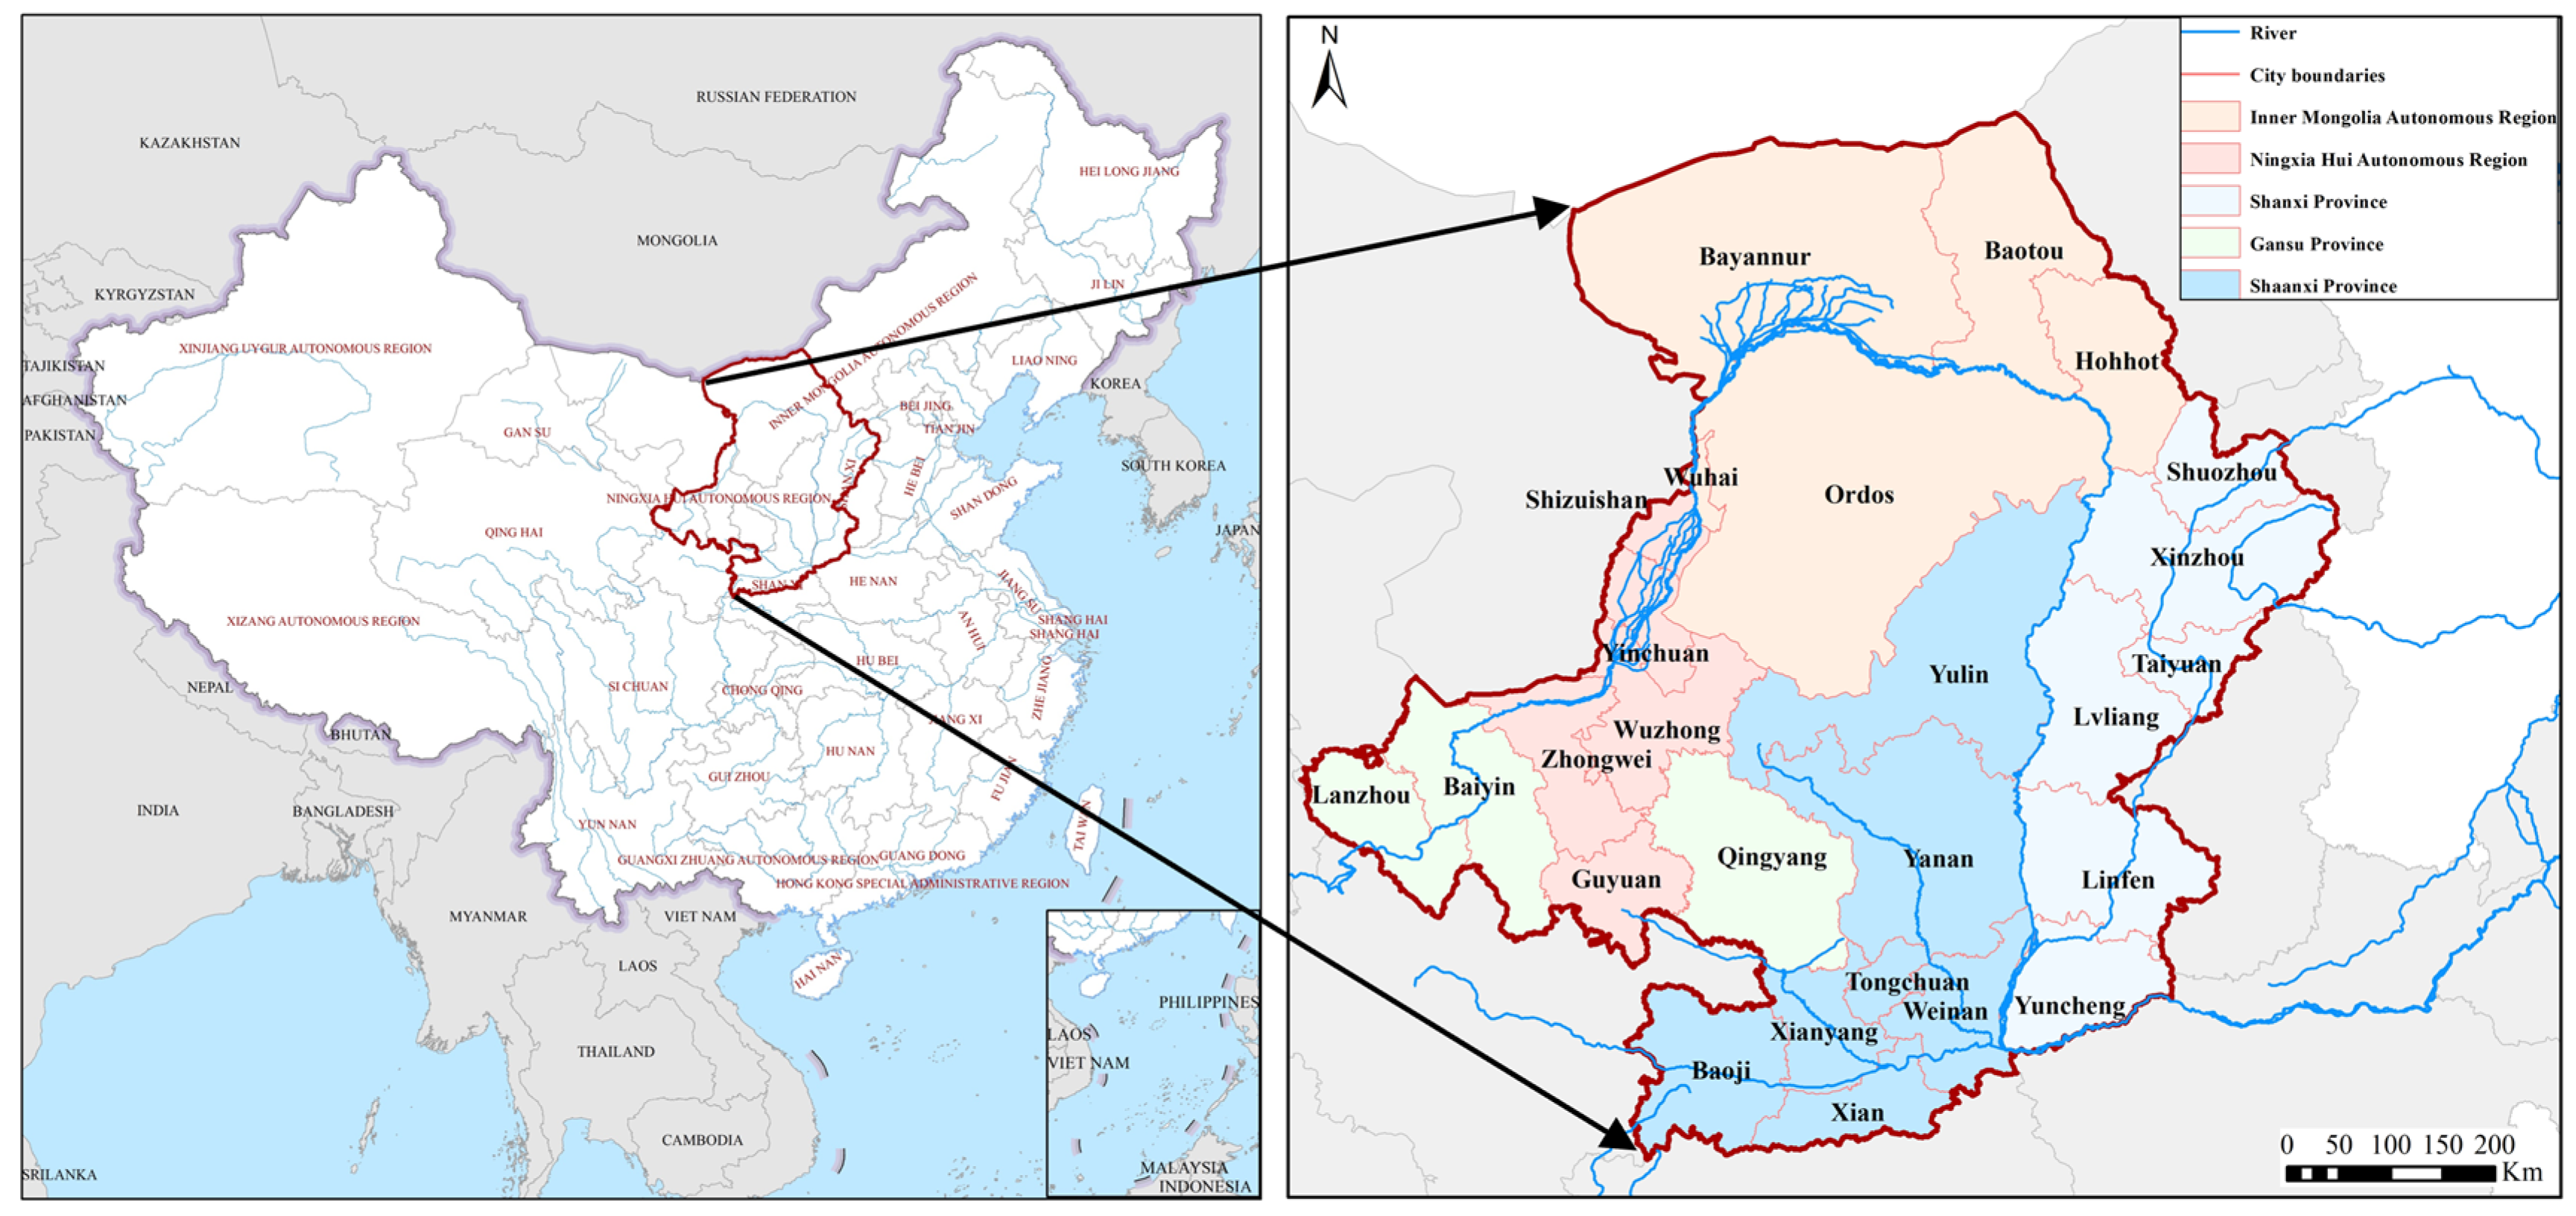
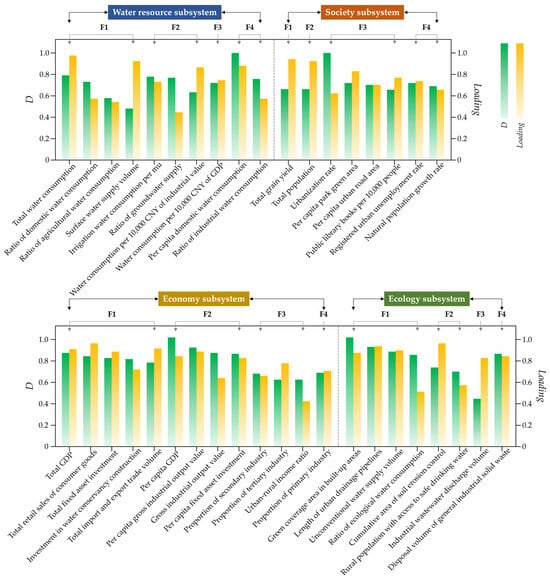
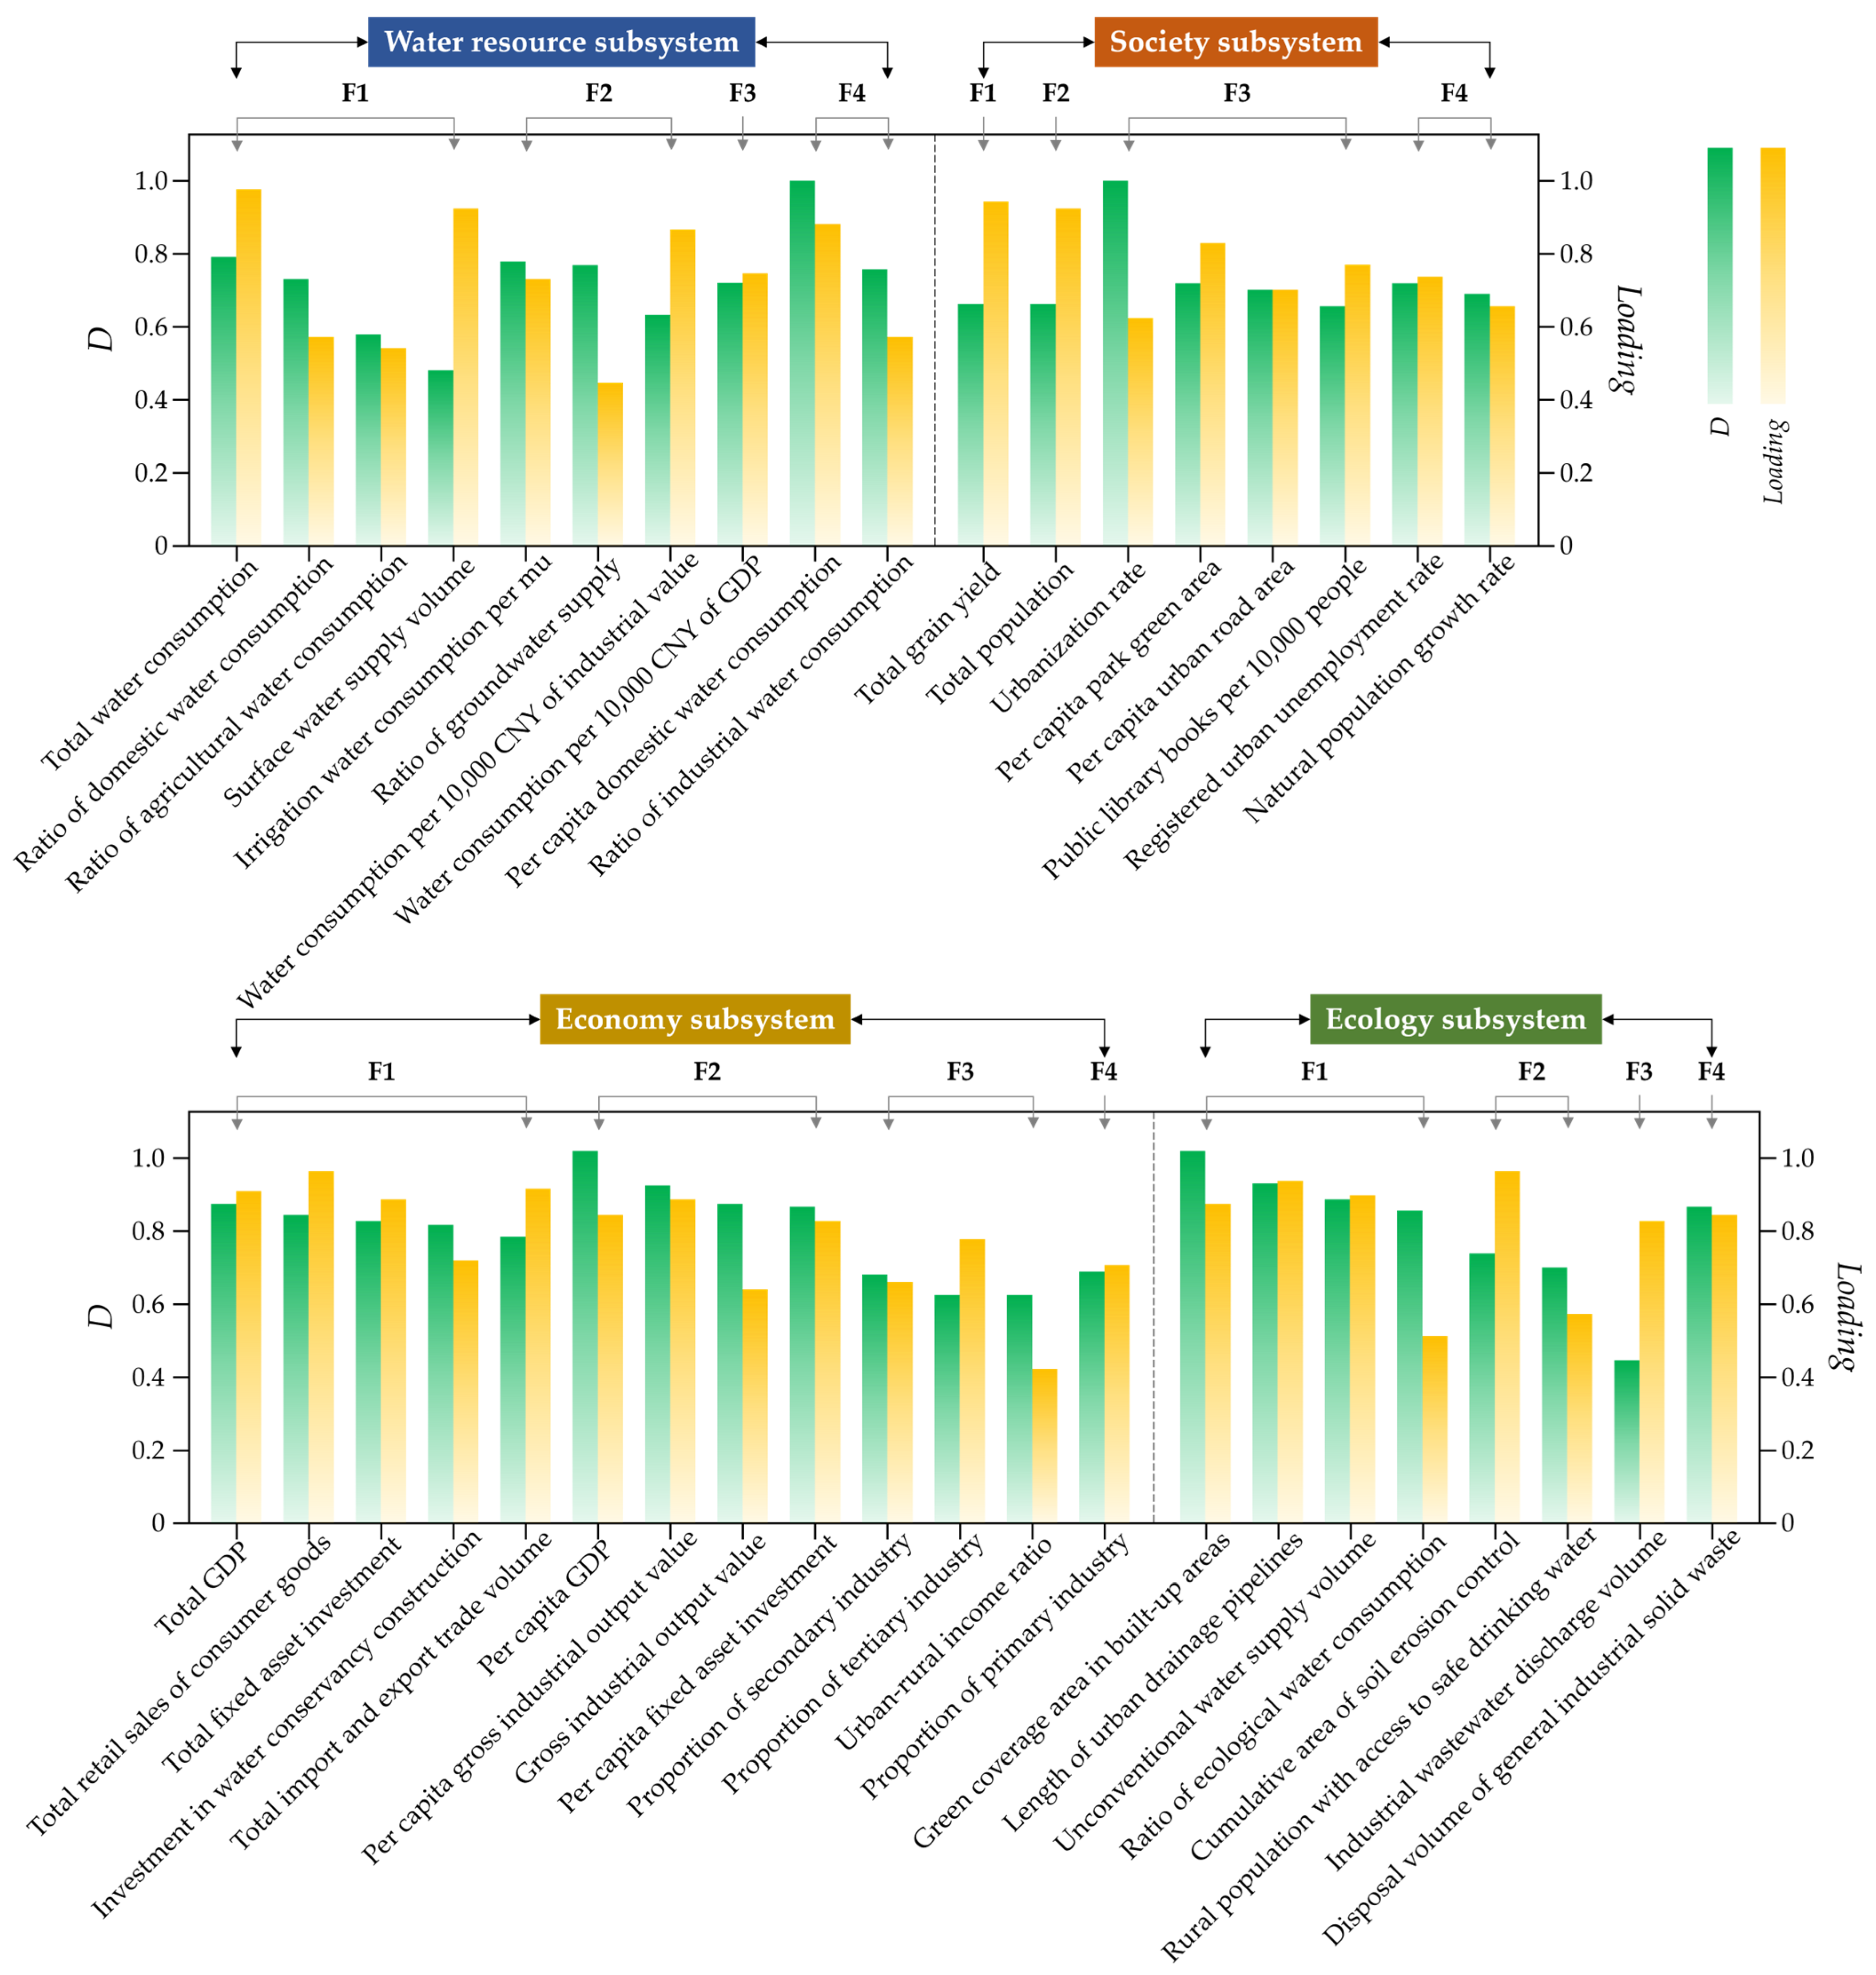
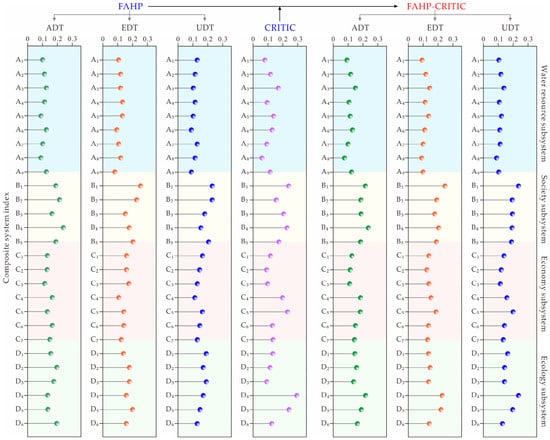
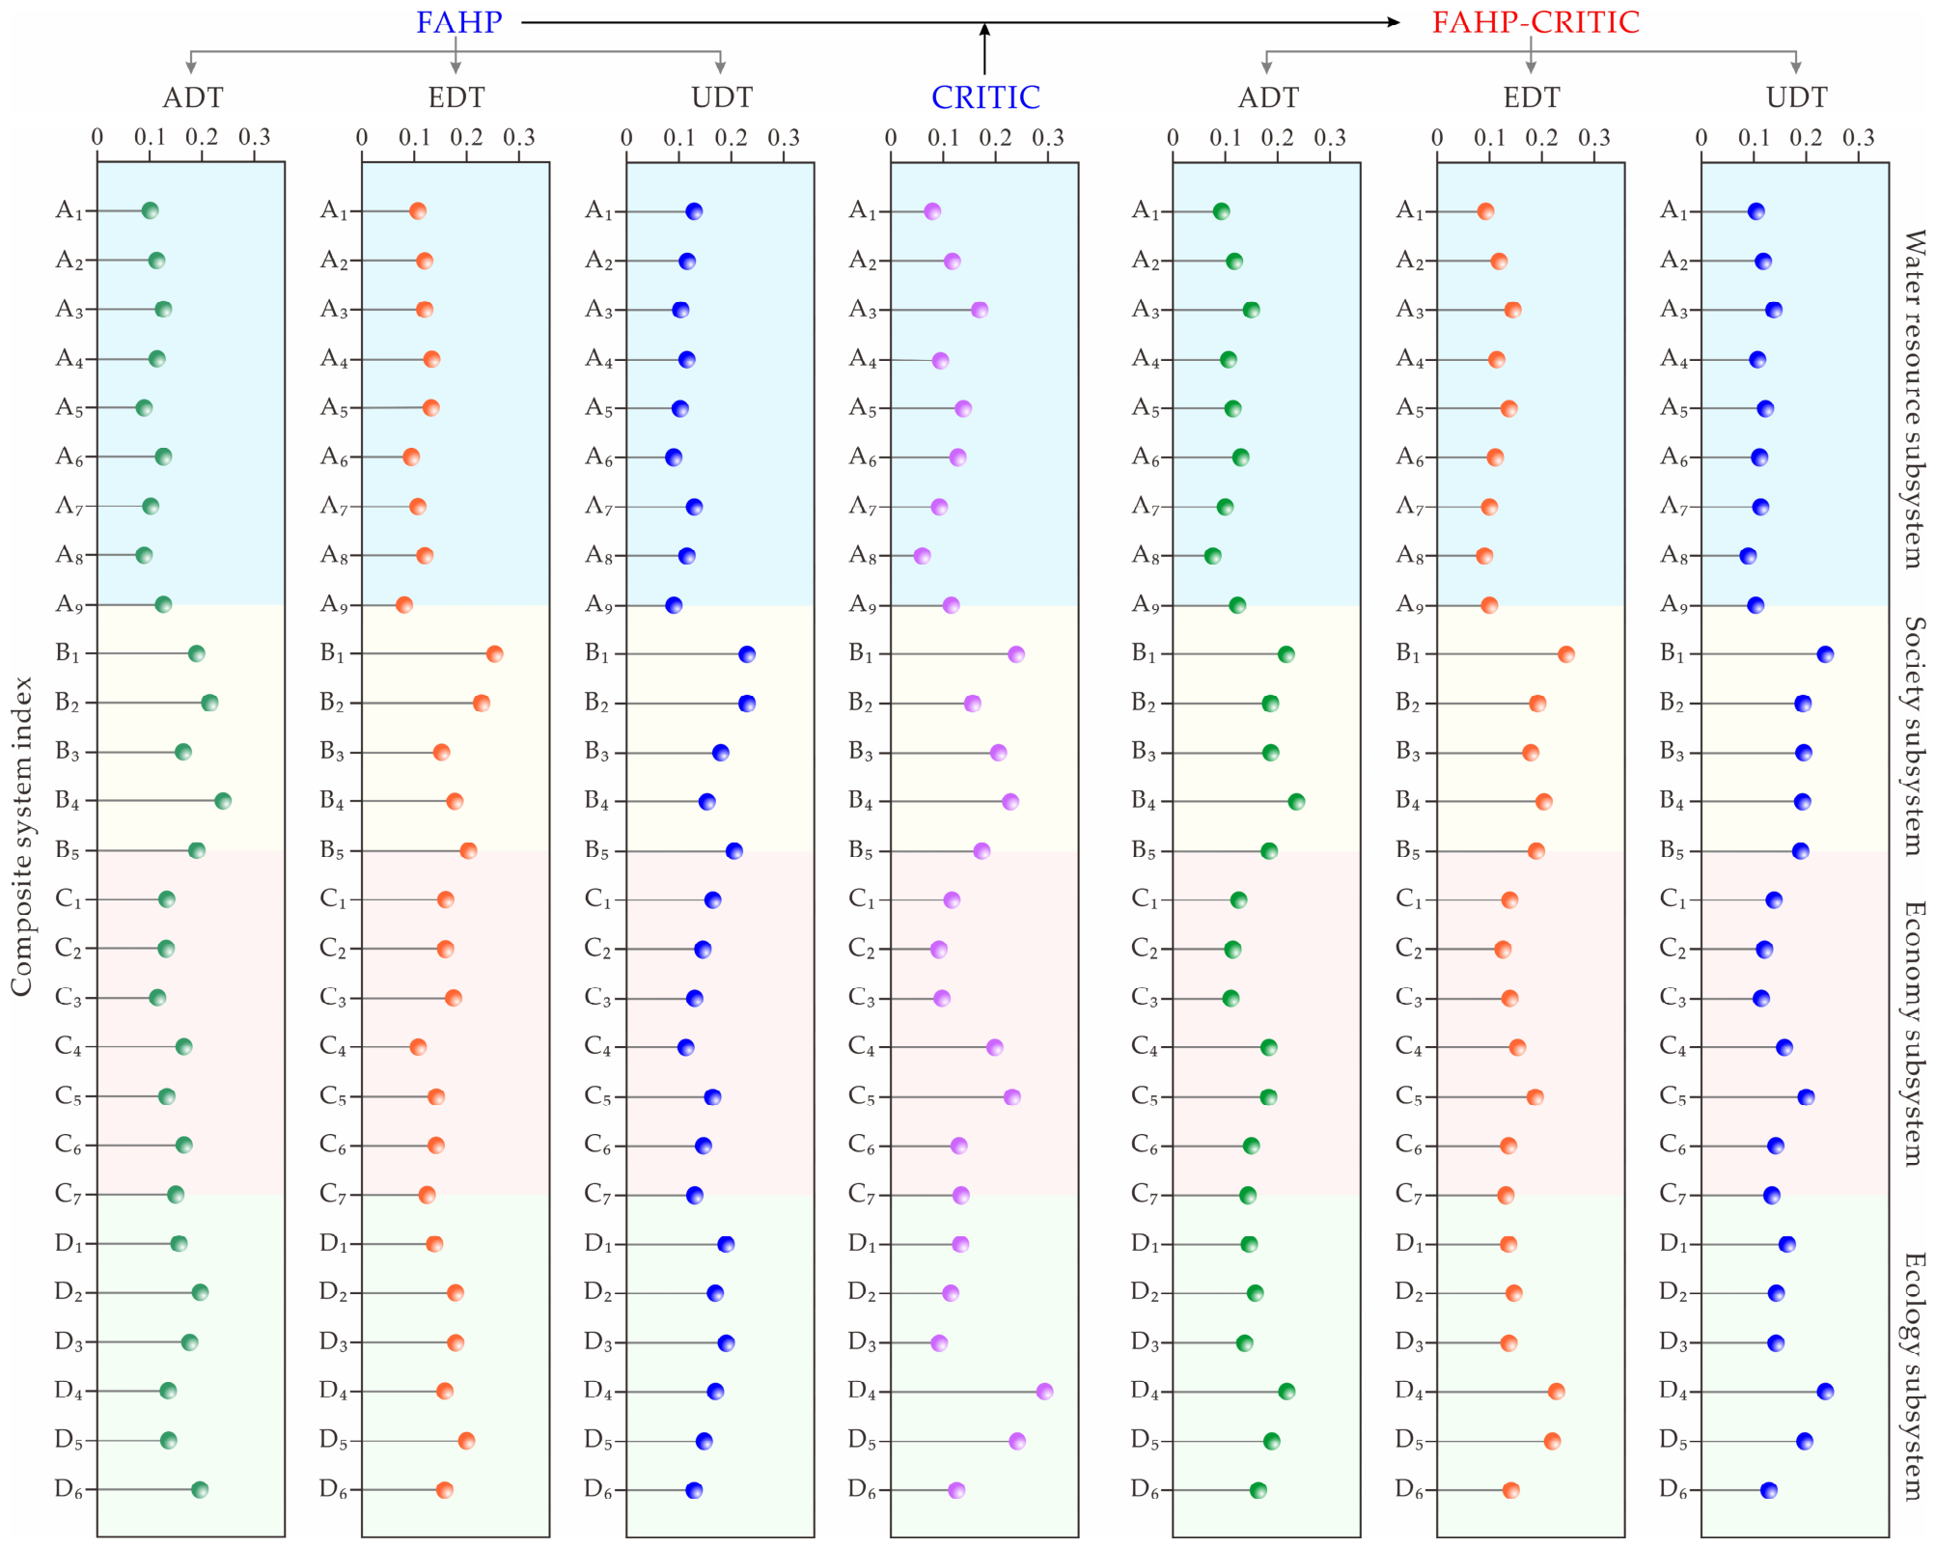
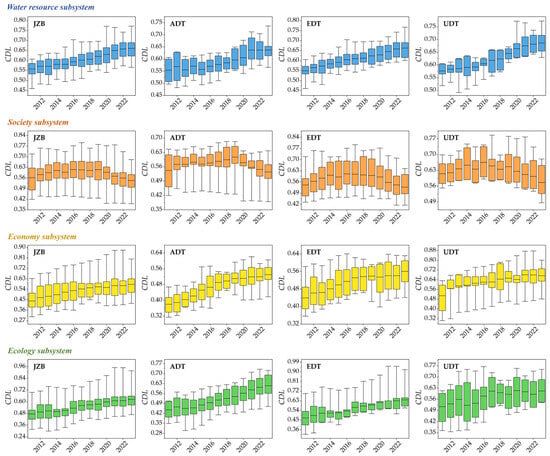
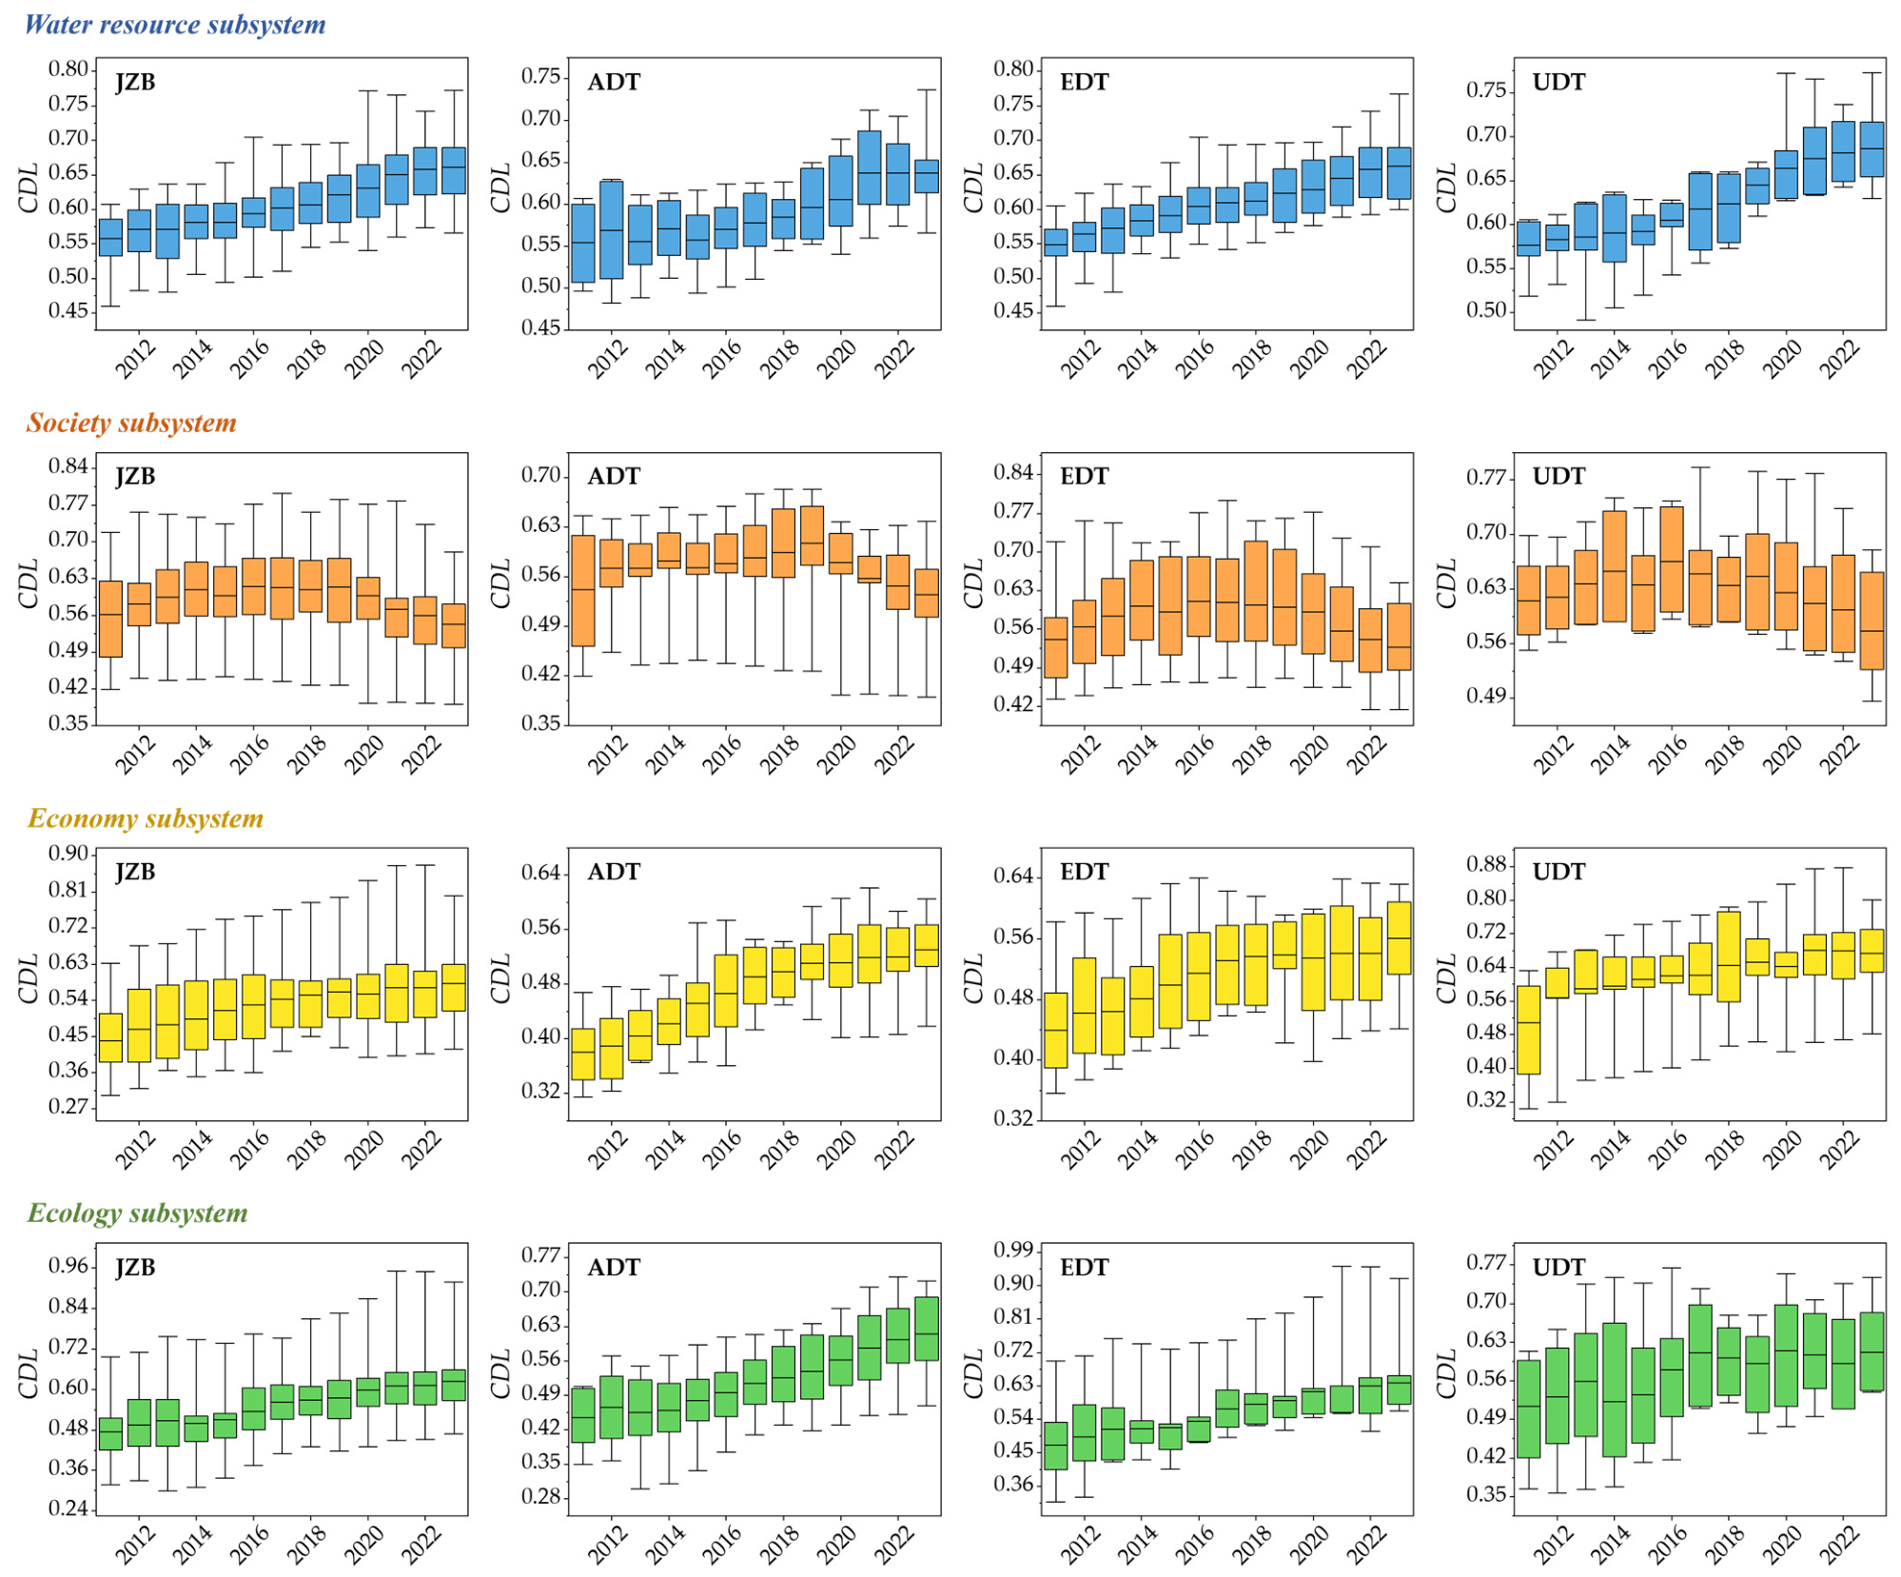
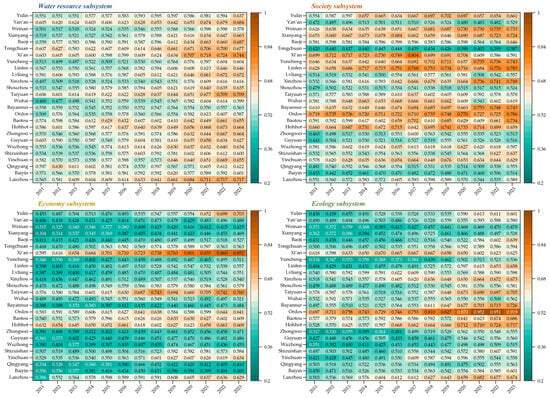
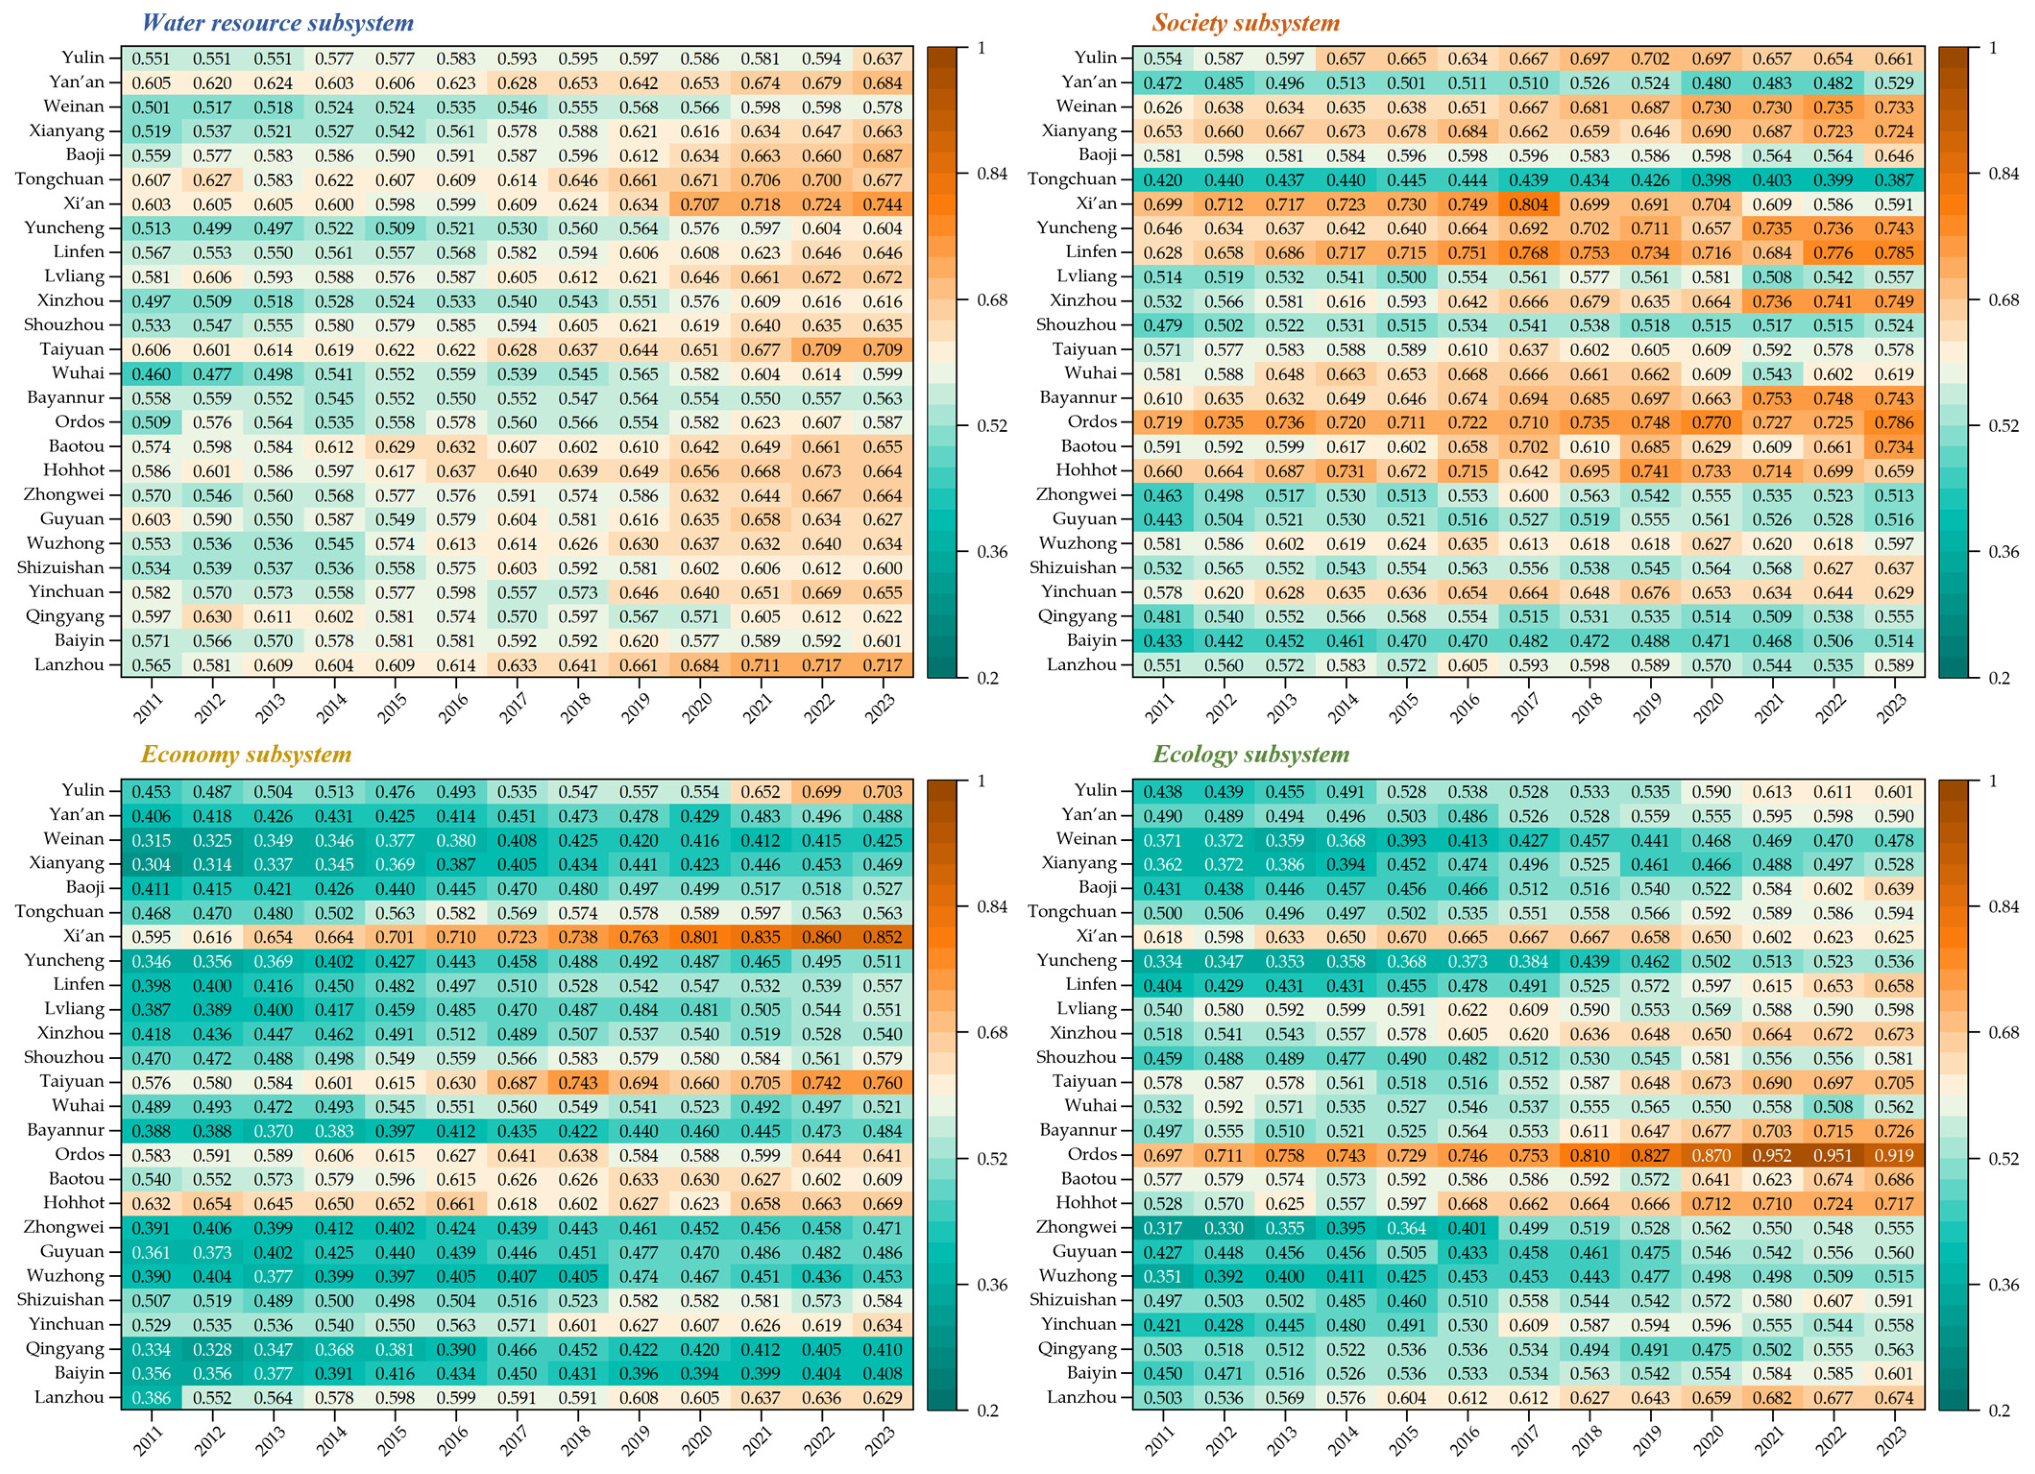
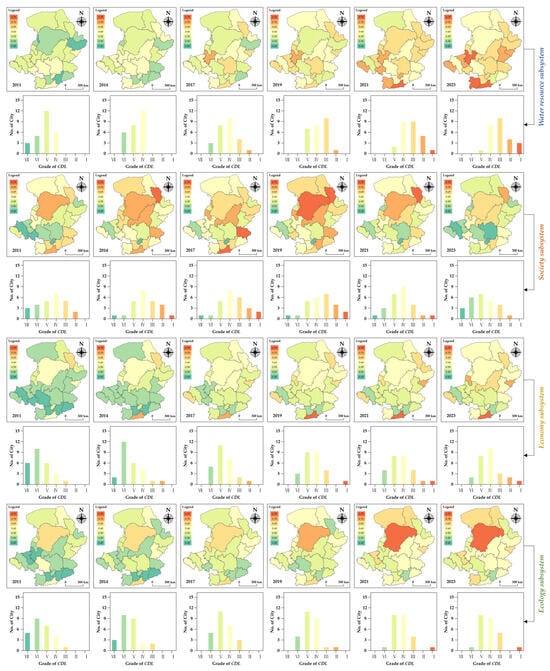
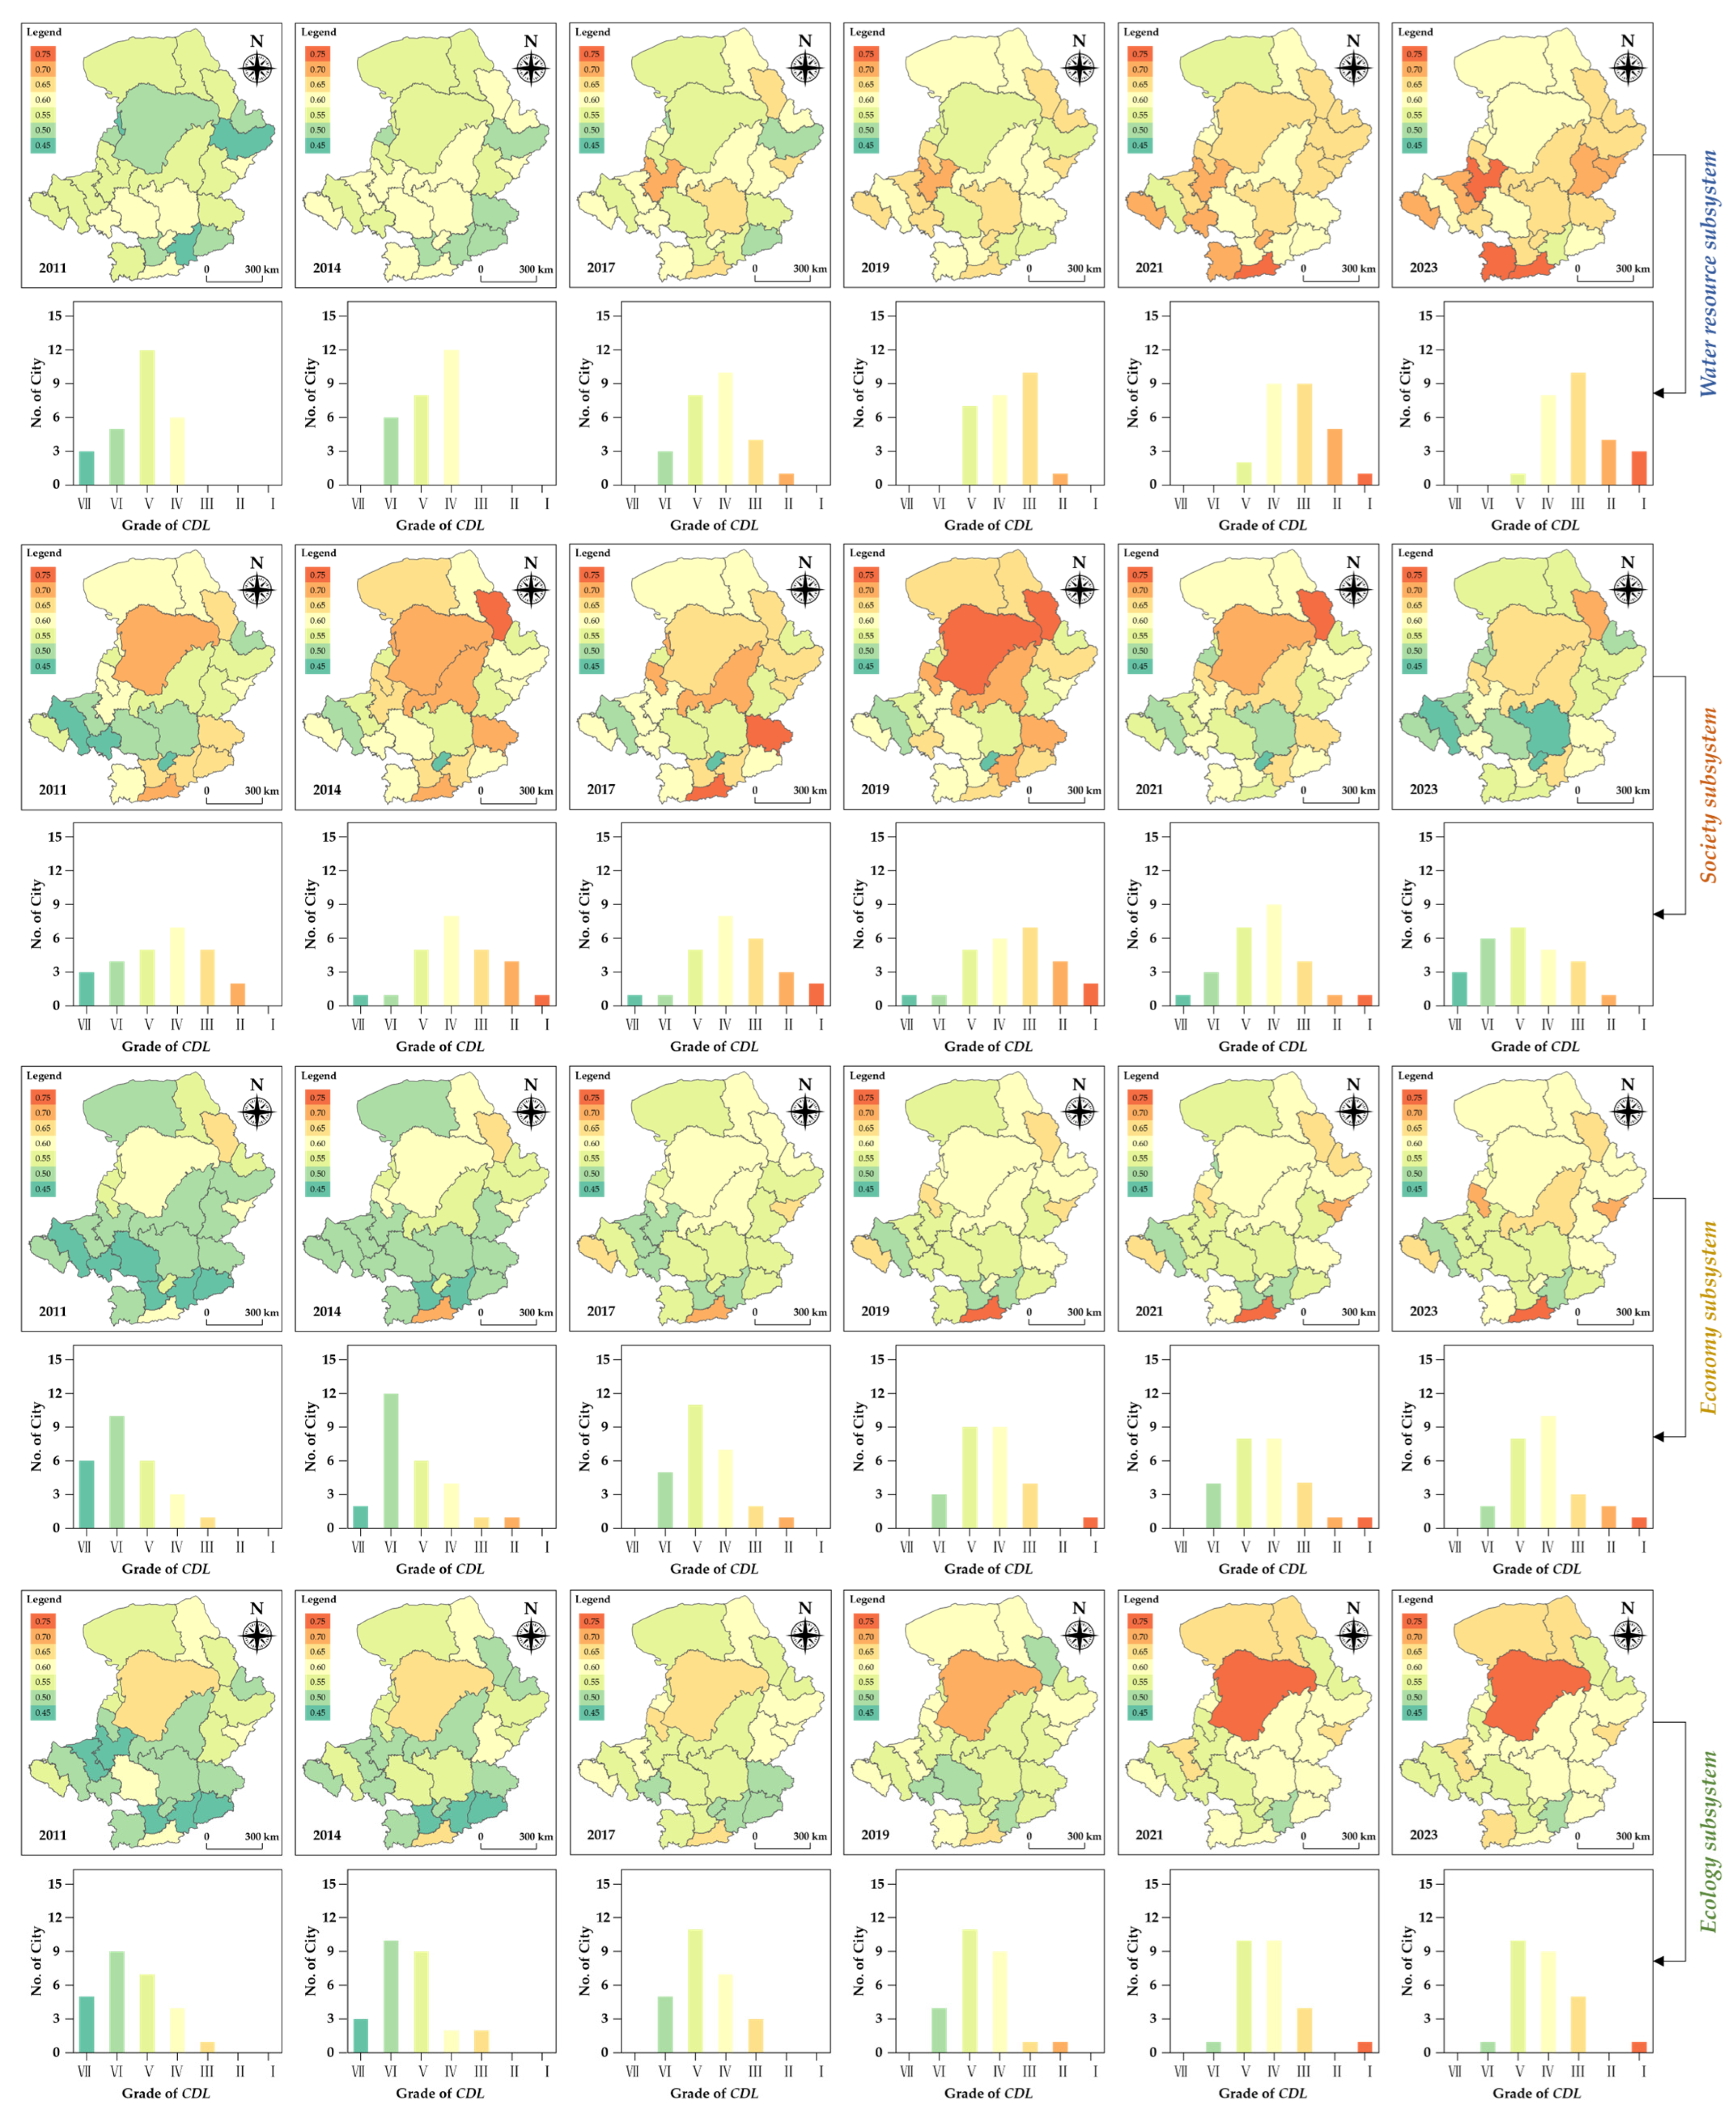
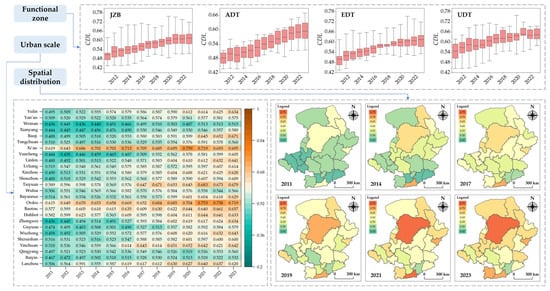
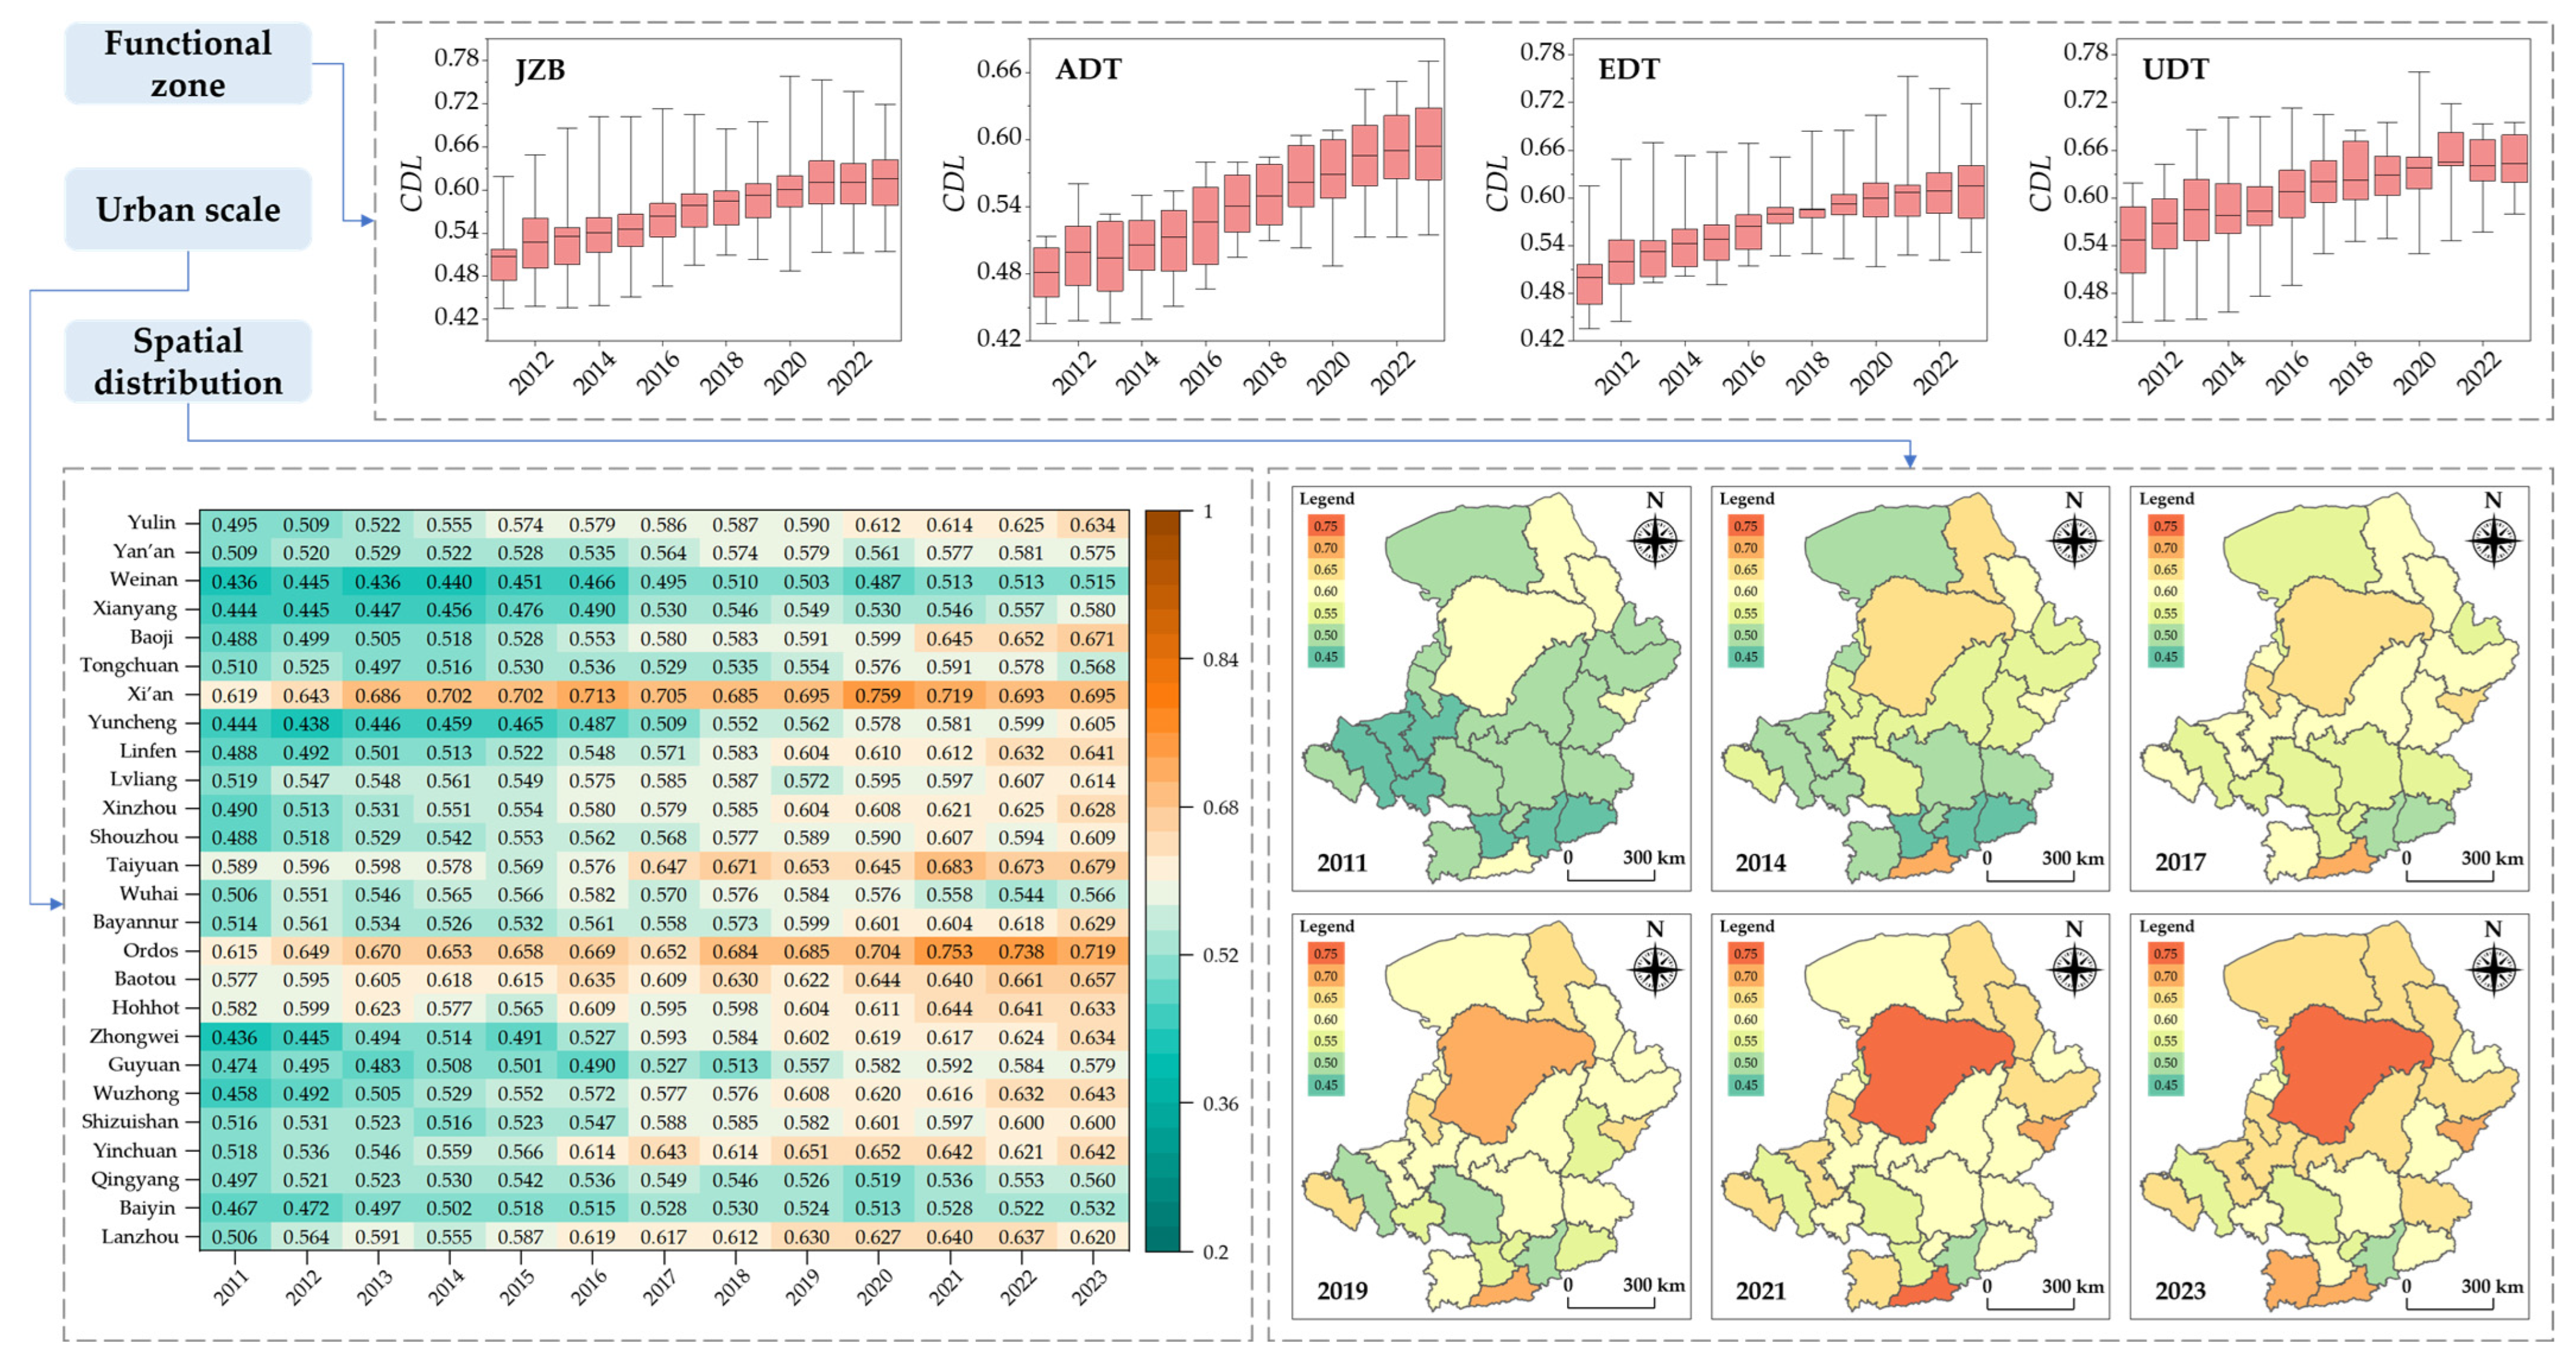
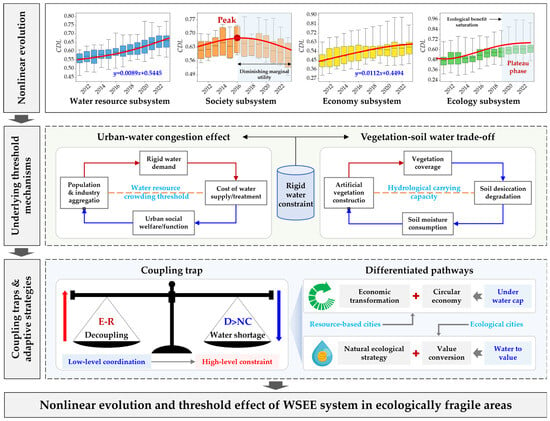
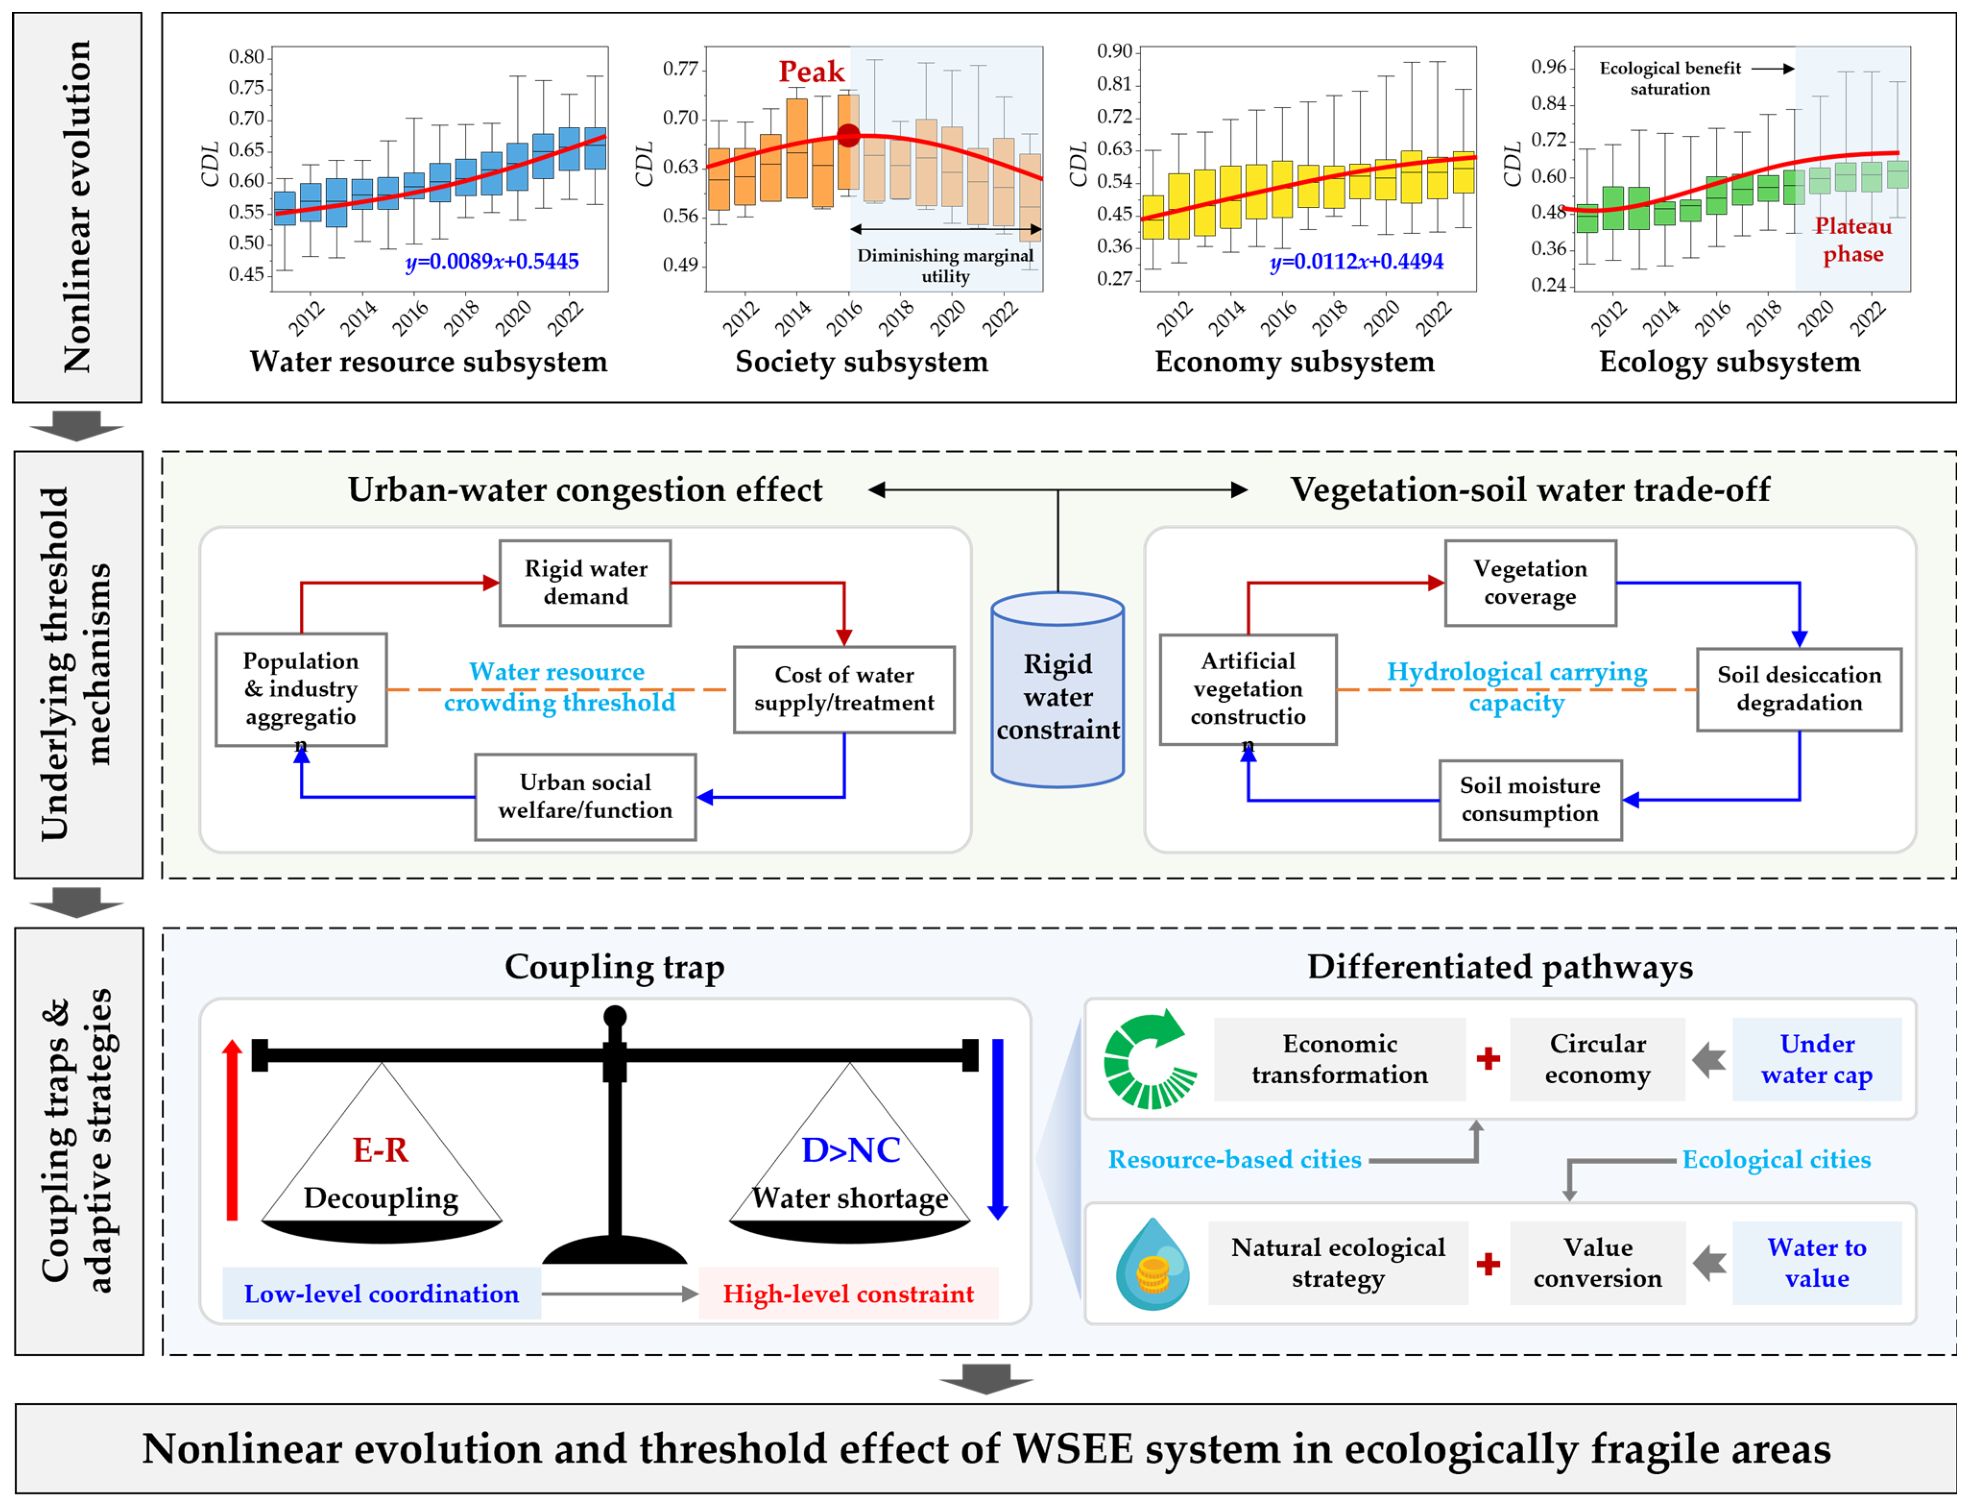
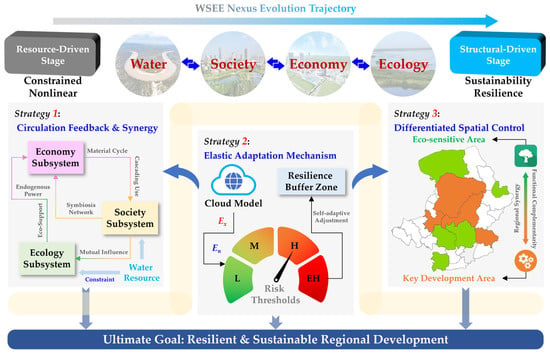
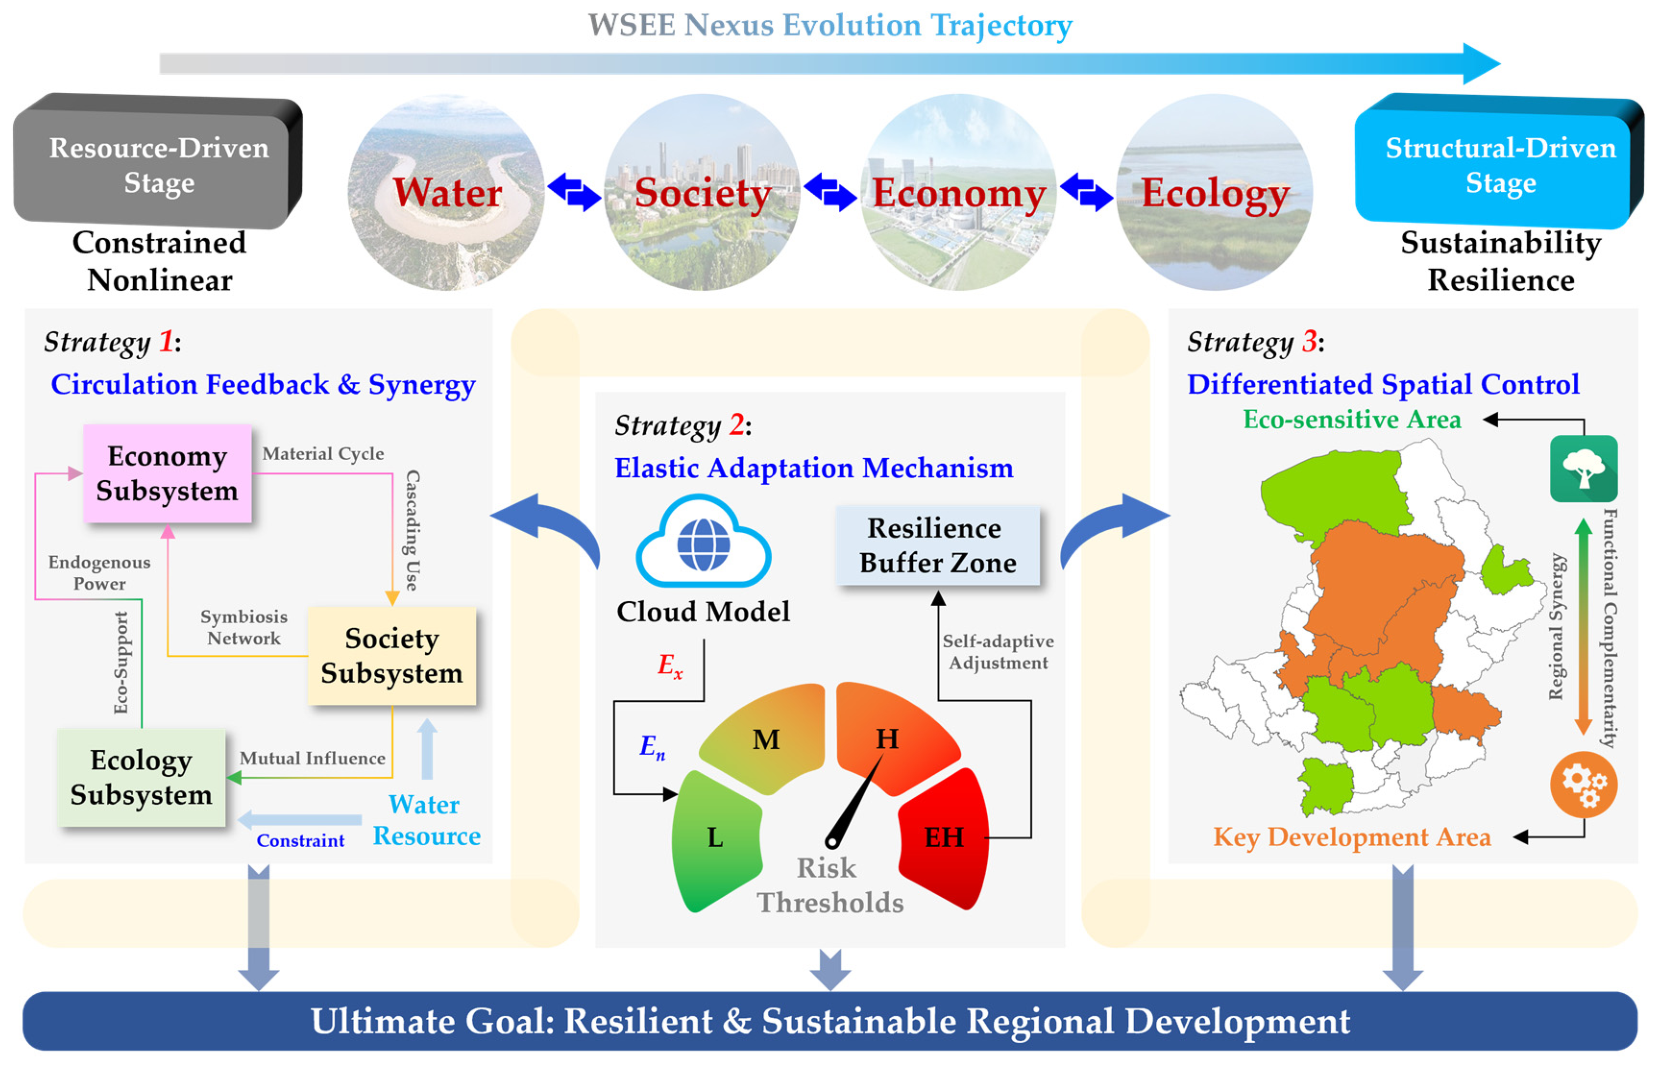

Disclaimer/Publisher’s Note: The statements, opinions and data contained in all publications are solely those of the individual author(s) and contributor(s) and not of MDPI and/or the editor(s). MDPI and/or the editor(s) disclaim responsibility for any injury to people or property resulting from any ideas, methods, instructions or products referred to in the content. |
© 2026 by the authors. Licensee MDPI, Basel, Switzerland. This article is an open access article distributed under the terms and conditions of the Creative Commons Attribution (CC BY) license.