


Abstract
Technological advances and the growing emphasis on sustainability and the human factor have driven the emergence of Industry 5.0 and Quality 5.0 as new organisational paradigms. The present paper examines how Industry 5.0 influences the adoption of Quality 5.0 practices and, together, contributes to the performance of Small and Medium-sized Enterprises (SMEs) in Portugal. To this end, a conceptual model was developed based on the literature and empirically tested using Structural Equation Modelling (SEM). The empirical study was based on a survey applied to Portuguese SMEs from different industrial sectors, yielding 439 valid responses. The results show that the adoption of Industry 5.0 and Quality 5.0 is associated not so much with the use of emerging technologies as with their integration into organisational practices that are human-centred and sustainability-oriented. Furthermore, both paradigms were positively associated with the overall performance of SMEs: Industry 5.0 adoption was associated with operational, financial, social, and environmental performance, whereas Quality 5.0 adoption was associated mainly with social and environmental performance. This study contributes to the literature by providing an integrated view of how Industry 5.0 and Quality 5.0 can be operationalised in SMEs, highlighting the factors associated with their adoption and their relationship with organisational performance, while also offering guidelines for organisations seeking to implement these approaches in a sustainable and human-centred manner.
1. Introduction
In recent decades, the business landscape has been shaped by constant change and profound transformations driven by rapid technological advancement and innovation in production processes, requiring organisations to adapt quickly in order to remain competitive [1]. Industry 4.0, associated with the Fourth Industrial Revolution, has emerged as one of the most promising concepts to foster industrialisation and strengthen competitiveness, particularly in European Union countries [2]. However, the growing need for mass customisation, sustainability, and the valorisation of the human factor has led to the emergence of a new industrial paradigm, Industry 5.0, which promotes a more human-centric, resilient, and sustainable approach to production [3,4]. This shift reflects a broader recognition that industrial competitiveness must be reconciled with the environmental and social dimensions of sustainable development, placing industry at the service of the green and digital transitions pursued by the European Union and with the 2030 Agenda for Sustainable Development [3,5].
Within this context, Quality 5.0 arises as a response to the need to align quality management systems with the values of Industry 5.0, promoting the integration of advanced technologies such as artificial intelligence, machine learning, and the Internet of Things (IoT) with practices centred on human well-being and sustainability [6,7]. This new approach to quality enables a more proactive role in the detection of failures and inefficiencies, significantly improving processes and organisational outcomes [7]. By embedding sustainability and human well-being into quality management, Quality 5.0 extends the traditional focus on conformity and efficiency towards the creation of economic, social, and environmental value [6].
Despite the significant opportunities associated with the adoption of Industry 5.0 and Quality 5.0, such as cost reduction, defect minimisation, and increased operational efficiency [8,9,10], the transition to this paradigm presents significant challenges, especially for small and medium-sized enterprises (SMEs). In the European context, SMEs play a decisive role, representing 99% of the business fabric and constituting the backbone of the European economy [11,12,13]. In Portugal, this weight is even more significant. In 2023, SMEs represented 99.9% (1,508,724) of active companies and were responsible for the majority of national turnover [14]. Despite their economic and social relevance, these organisations face significant limitations in adopting emerging technological paradigms, including financial constraints, lack of technical expertise, and resistance to organisational change [15,16]. Given their weight in the economic fabric, the ability of SMEs to adopt more sustainable and human-centric production models is decisive for the sustainability transition of both the European and the Portuguese economies [13].
Although the academic literature on Industry 4.0 and Quality 4.0 is already extensive, studies addressing Industry 5.0 and Quality 5.0, particularly in the SME context, remain incipient [6,7]. In particular, there is a gap in empirical research exploring how these paradigms can be operationalised in SMEs and what their impacts on organisational performance may be [15,17]. Moreover, empirical evidence on whether these paradigms translate into social and environmental outcomes, and not only into operational and financial gains, remains scarce.
Accordingly, this study addresses the following research question: how does Industry 5.0 influence the adoption of Quality 5.0 practices, and how do both contribute to the operational, financial, social, and environmental performance of Portuguese SMEs? By measuring performance across these four dimensions, the study adopts a triple-bottom-line perspective of sustainability [5]. Its main contribution to the sustainability literature is to provide empirical evidence, from Portugal industrial SMEs, on the extent to which human-centric and sustainability-oriented practices, rather than technology alone, are associated with the transition of SMEs to Industry 5.0 and Quality 5.0.
The remainder of this paper is structured as follows. Section 2 reviews the literature on Industry 5.0, Quality 5.0, and their adoption in SMEs. Section 3 presents the conceptual model, the research hypotheses, and the methods. Section 4 reports the results, Section 5 discusses them, and Section 6 presents the conclusions, limitations, and avenues for future research.
2. Literature Review
2.1. Industry 5.0
Industry 4.0 marked a profound transformation of production methods and business models [18] by integrating technologies such as cyber–physical systems (CPSs), the Internet of Things (IoT), and Artificial Intelligence (AI) to create smarter and more adaptable factories [19,20,21,22]. Hines et al. [23] highlight that Industry 4.0 should be understood not merely as a technological advancement, but also as an organisational phenomenon linked to continuous improvement practices such as Lean.
In contrast with Industry 4.0, which focused mainly on digitalisation and automation, Industry 5.0 has emerged as a complementary response that reshapes the interaction between humans and technology [16]. Formally consolidated by the European Commission in 2021 as a paradigm promoting more sustainable, resilient, and human-centric production [3,16], its places human–machine collaboration at the centre of operations, increasing productive efficiency without disregarding the creativity and cognitive role of workers [3,24,25,26]. This collaboration is expected to support customised, high-quality products, reduce waste and workplace accidents, and foster a safer and more socially responsible production environment [3,16,25,27]. Several authors have since deepened the concept (see, for example, [28,29,30]).
According to the literature, Industry 5.0 is founded on three fundamental principles: human-centricity, which places human needs and interests at the centre of the production process, prioritising the use of technology for the benefit of employees; sustainability, which encourages practices of reuse, energy efficiency, and reduction in environmental impacts; and resilience, which ensures greater flexibility and adaptability in contexts of uncertainty or crisis [3,16,31,32].
Industry 5.0 does not reject the technologies of Industry 4.0, such as AI, big data, and IoT, but deepens their integration through human–machine collaboration and emerging solutions such as Edge Computing, Digital Twins, the Internet of Everything, Big Data Analytics, Cobots, 6G networks, and Blockchain, enabling greater customisation and innovation oriented towards human needs [26,29]. Although still at an early stage, Industry 5.0 thus seeks to transform the relationship between humans and technology, ensuring a more balanced future between innovation and social well-being [24,25].
2.2. Quality 5.0
Quality 5.0 emerges as an evolution of Quality 4.0, extending its principles towards a more humanised and sustainable model, aligned with the values of Industry 5.0 [6,33]. Although quality management was extensively explored during Industry 4.0, its application in the context of Industry 5.0 is still at an early stage, reflecting both the challenges and opportunities associated with this new approach [7].
The integration of technologies such as artificial intelligence, big data analytics, and cloud computing has enhanced quality management through data-driven decision-making, more advanced quality control, and greater horizontal and vertical integration of organisational systems [34,35,36,37]. By analysing data from sensors, cameras, and other connected devices, Quality 5.0 enables potential defects to be identified before they occur, shifting quality control from a reactive to a proactive approach and leading to more efficient production, higher-quality products, and greater customer satisfaction [7].
Quality 5.0 complements and expands the advances of Quality 4.0 [7,33], aiming to create positive relationships between people (social) and technology (technical) [33]. Quality 4.0 is grounded in a strong integration of socio-technical factors [38,39,40], which remain relevant in the context of Industry 5.0 [6]. Accordingly, Quality 5.0 builds on socio-technical practices inherited from Total Quality Management (TQM), comprising social components such as management commitment, customer focus, and employee training [6,39], and technical components such as process management, quality information and data analytics, and advanced manufacturing technologies [39].
Quality professionals play a crucial role in adapting quality management practices to digital and disruptive technologies, while addressing both increasing consumer demands and growing employee disengagement [37]. This requires empowering employees with the knowledge and tools to identify and solve quality problems, supported by human–machine collaboration, automation, and robotics [7,37]. Quality 5.0 is also intrinsically linked to sustainability, sustainable digital innovation, digital culture, and social innovation, aiming not only at operational efficiency but also at social well-being [6,35]. Accordingly, quality management models must balance economic growth, social responsibility, and environmental preservation [37,41].
2.3. Industry 5.0 and Quality 5.0 in SMEs
The transition to Industry 5.0 and Quality 5.0 poses significant challenges for SMEs when shifting from traditional processes to more collaborative and sustainable solutions [7,16,42]. These barriers are economic, financial, cultural, technical, legal, and implementation-related [43], with the shortage of digital skills, high investment costs, resistance to change, fragile technological infrastructures, and the absence of a standard implementation model being the most recurrent [30,44,45].
These barriers do not only hinder adoption; they may also impede the translation of Industry 5.0 and Quality 5.0 into performance. Resource constraints limit the scale and depth of implementation, skill shortages restrict the effective use of the data generated, and organisational inertia may prevent technological resources from being converted into capabilities [46]. The empirical literature reflects these mechanisms in two research streams. Mediation studies show that the effects of digital technologies on performance are often transmitted through organisational practices or capabilities, such as green supply chain management practices [47], supply chain integration [48], business competitiveness [49], reduced enterprise risk [50] or dynamic capabilities [46]. Moderation studies show that these effects depend on contextual conditions, such as organisational inertia, information disclosure quality, industry or type of ownership [46,50].
Conversely, the literature associates these paradigms with reduced operational costs, waste minimisation, improved process efficiency, and enhanced product and service quality [7,8,10,51], as well as with product personalisation, organisational flexibility, environmental sustainability, and safer and more collaborative working environments [3,4,37,52,53].
These outcomes span the economic, social, and environmental dimensions of the triple bottom line [54]. Accordingly, this study assesses SME performance in four dimensions: operational and financial performance, which capture the economic pillar, and social and environmental performance, which capture the remaining two pillars of sustainability. This multidimensional view allows the contribution of Industry 5.0 and Quality 5.0 to be assessed beyond efficiency gains, in line with the human-centric and sustainable orientation of both paradigms [3,6].
Recent empirical studies provide partial evidence on these relationships, although with heterogeneous samples, measures and outcomes. In the field of Quality 4.0, a survey of 147 senior managers from large firms and SMEs identified top management commitment, leadership and organisational culture as the most important readiness factors [55]. Among SMEs, Industry 5.0 readiness was not directly associated with sustainable growth in 73 Thai food processing firms, its effect being transmitted through business competitiveness [49]; the adoption of sustainable technologies was positively associated with economic and social outcomes in 297 Malaysian SMEs [56]; and the adoption of Internet of Things technologies under Industry 5.0 was only partially associated with the sustainable performance of 420 Egyptian manufacturing SMEs, through supply chain integration and with effects differing across the economic, environmental and social dimensions [48]. In samples dominated by larger or listed firms, the effects of Industry 4.0 technologies, blockchain and digital technology adoption on performance were likewise partly transmitted through green practices, reduced risk or dynamic capabilities [46,47,50]. However, these studies were mostly conducted in Asian or other emerging economies, measured the adoption of specific technologies or readiness rather than the adoption of the Industry 5.0 and Quality 5.0 paradigms, and rarely examined the relationship between both paradigms. The present study addresses these gaps by examining, in Portuguese industrial SMEs, how the use of Industry 5.0 technologies relates to the adoption of Industry 5.0 and Quality 5.0 through social and technical quality practices, and how both paradigms relate to multidimensional performance.
3. Materials and Methods
3.1. Conceptual Model and Research Hypotheses
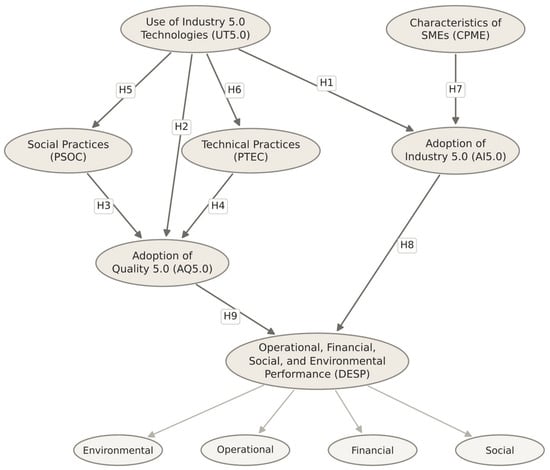
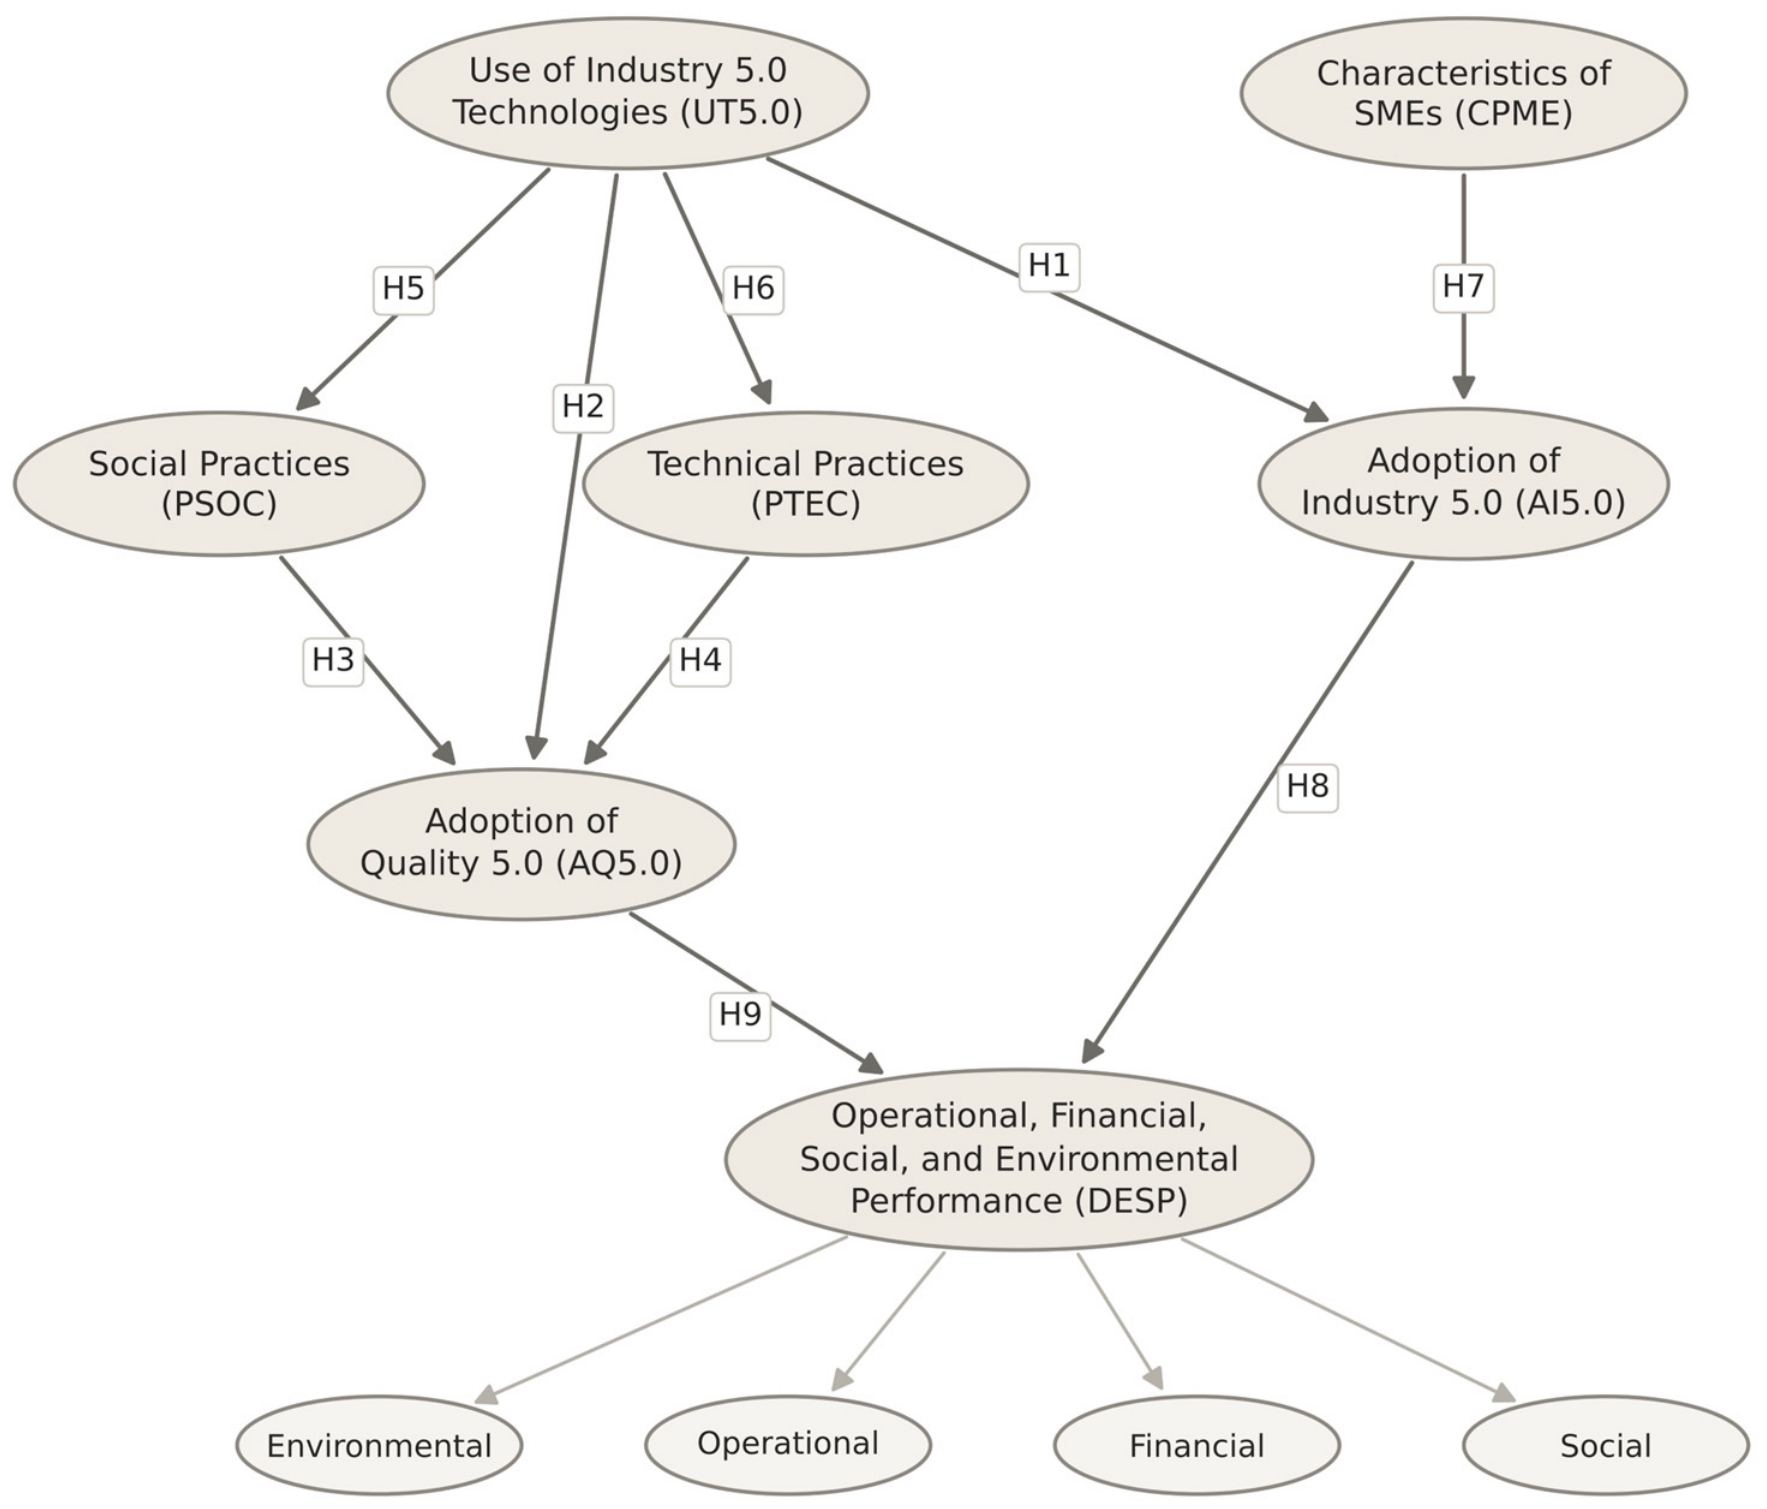
The conceptual model translates the research question into constructs suitable for systematic data collection and analysis [57]. It examines how Industry 5.0 influences the adoption of Quality 5.0 practices and how both contribute to the performance of Portuguese SMEs, and comprises seven constructs (Figure 1): Use of Industry 5.0 Technologies (UT5.0), Adoption of Industry 5.0 (AI5.0), Adoption of Quality 5.0 (AQ5.0), Social Practices (PSOC), Technical Practices (PTEC), Characteristics of SMEs (CPME), and Operational, Financial, Social, and Environmental Performance (DESP).
Figure 1.
Conceptual model.
In the present model, the characteristics of SMEs and the use of Industry 5.0 technologies are considered exogenous constructs, exerting influence on other constructs without being directly explained [58]. The remaining five constructs are endogenous: AI5.0, AQ5.0, PSOC, and PTEC act simultaneously as outcomes and predictors (mediating constructs), whereas DESP is the final outcome of the model [59].
Based on the theoretical foundations discussed in Section 2, the relationships represented in the conceptual model are translated into nine research hypotheses, described below.
Advanced technologies are regarded as enablers of the human-centric, sustainable, and resilient production envisioned by Industry 5.0 [26,29] and of proactive, data-driven quality management [7,34,35,36,37]. The use of Industry 5.0 technologies, as an exogenous factor, is expected to exert a direct effect on the adoption of both Industry 5.0 and Quality 5.0:
H1:
The use of Industry 5.0 technologies has a positive impact on the adoption of Industry 5.0.
H2:
The use of Industry 5.0 technologies has a positive impact on the adoption of Quality 5.0.
Quality 5.0 builds on socio-technical practices inherited from TQM, combining social components, such as leadership commitment and employee training, with technical components, such as process management and data analytics [6,39,55]. The adoption of Quality 5.0, in turn, is explained by the implementation of social and technical practices of quality management:
H3:
The adoption of social practices has a positive impact on the adoption of Quality 5.0.
H4:
The adoption of technical practices has a positive impact on the adoption of Quality 5.0.
Technologies such as AI, IoT, and big data analytics provide real-time information and human–machine collaboration that support both employee empowerment and process control [7,37,46,47]. In addition, the use of Industry 5.0 technologies is expected to support the implementation of both social and technical quality management practices:
H5:
The use of Industry 5.0 technologies has a positive impact on the adoption of social quality practices.
H6:
The use of Industry 5.0 technologies has a positive impact on the adoption of technical quality practices.
SMEs face specific constraints, including limited financial resources, a shortage of digital skills, resistance to change, and fragile technological infrastructures, which hinder the adoption of new industrial paradigms [15,30,43,44,45,55]. The model further assumes that the characteristics of SMEs negatively influence their propensity to adopt Industry 5.0 principles:
H7:
SME characteristics have a negative impact on the adoption of Industry 5.0.
Both paradigms are associated with cost reduction, quality improvement, and process efficiency, as well as with safer working environments and environmental sustainability, which correspond to the economic, social, and environmental pillars of sustainability [3,7,48,51,52,53,54,56]. Finally, both Industry 5.0 adoption and Quality 5.0 adoption are expected to be positively associated with organisational performance across operational, financial, social, and environmental dimensions:
H8:
The adoption of Industry 5.0 has a positive impact on Operational, Financial, Social, and Environmental performance.
H9:
The adoption of Quality 5.0 has a positive impact on Operational, Financial, Social, and Environmental performance.
3.2. Survey Design and Validation
To empirically test the hypotheses formulated in the research, a survey was designed and distributed, using Microsoft Forms as the tool for data collection. The survey was subjected to a pre-test in order to identify potential ambiguities or misinterpretations [60]. The validation process involved the review of four subject-matter experts and formal approval by the Data Protection Office (DPO) of P.PORTO, ensuring compliance with the General Data Protection Regulation (GDPR).
The questionnaire was developed based on previously validated scales from the literature and was organised into thematic sections. The measurement items are listed in Appendix B (Table A4).
The first two sections focused on respondent and organisational background information. Respondent information included academic qualifications, position held, and organisational tenure, ensuring that the answers were provided by individuals with sufficient knowledge of company practices [61]. Organisational data covered aspects such as industry sector, geographical location (NUTS II regions), firm age, and firm size according to EU criteria [62]. Only micro, small, and medium-sized enterprises (1–249 employees) were considered in this study.
The remaining four sections of the questionnaire addressed the constructs of the conceptual model. The construct Industry 5.0 was measured through indicators of familiarity and implementation of its core principles (human-centricity, resilience, and sustainability) and of the emerging technologies associated with this paradigm, drawing on the works of [3,16,31,32,63,64]. The construct Quality 5.0 was operationalised using items adapted from [6,7,37]. These indicators captured the extent to which organisations incorporate both social practices (e.g., leadership commitment, customer focus, continuous employee training and involvement) and technical practices (e.g., process management, quality information and data analytics, integration of advanced manufacturing technologies) associated with this paradigm. The construct Characteristics of SMEs was defined based on critical factors influencing the adoption of Industry 5.0 identified in the literature, such as structural barriers, availability of human and technological resources, leadership support, and organisational culture [15,16]. These items were worded positively (e.g., availability of qualified employees or adequate technological infrastructures) and were subsequently reverse-scored for the statistical analysis, so that higher values indicate stronger constraints on the adoption of Industry 5.0. Finally, Organisational Performance was measured across four dimensions—environmental (DESP_1 to DESP_5), operational (DESP_6 to DESP_12), financial (DESP_13 to DESP_16) and social (DESP_17 to DESP_19)—using metrics adapted from [65,66]. These dimensions were assessed in terms of changes over the preceding year, with respondents indicating whether specific performance dimensions had improved or declined during this period.
All constructs were measured using multiple items adapted from the literature, assessed on a five-point scale [67,68].
3.3. Population, Sample, and Data Collection
The target population of this research comprised Portuguese SMEs operating in the industrial sector. The database used as the sampling frame was SABI, which contained information on 77,835 Portuguese SMEs. However, only 35,691 of these organisations had available institutional email addresses, which were used for the distribution of the survey. Geographically, these organisations were distributed as follows: Norte (50.6%), Centro (18.8%), Grande Lisboa (11.2%), Oeste e Vale do Tejo (8.0%), Península de Setúbal (3.8%), Alentejo (3.4%), Algarve (1.9%), Região Autónoma da Madeira (1.2%) and Região Autónoma dos Açores (1.1%). In terms of sector of activity, the most represented were the metallurgical industry and metal products (19.9%), the food industry (11.2%) and the clothing industry (9.1%), while the least represented were motor vehicle and components manufacturing (1.2%), pulp, paper, cardboard and related products manufacturing (1.0%) and the leather and leather products industry (0.5%).
The data collection was carried out between 21 July and 25 August 2025, resulting in 468 responses (a response rate of approximately 1.3%). From these, 439 were validated, while 29 were excluded because they showed straight-lining response patterns (identical answers across all items of the measurement scales).
Nonresponse bias was assessed by comparing early and late respondents [69], defined as the first and last quartiles of responses according to the order in which they were received. Independent-sample t-tests revealed no significant differences between the two groups in any of the constructs (p-values ranging from 0.126 to 0.931), suggesting that nonresponse bias is not a major concern in this study.
Data were analysed using IBM SPSS Statistics (version 30) and R (version 4.3.3).
4. Results
4.1. Sample Characterisation and Data Screening
The sample (Table 1) is concentrated in the North (48%) and Centre (24%) of Portugal and dominated by metallurgy and metal products (20%), furniture manufacturing (11%), and food (10%). A chi-square goodness-of-fit test showed that the regional distribution of the sample does not differ significantly from that of the population (χ2(8) = 12.63, p = 0.125). The sectoral distribution, however, differs significantly (χ2(18) = 76.27, p < 0.001), with furniture manufacturing, machinery and equipment manufacturing and pulp and paper over-represented, and clothing, wood and cork, and non-metallic mineral products under-represented; nevertheless, the two largest sectors, metallurgy and metal products (20% vs. 19.9%) and food industry (10% vs. 11.2%), are represented in proportions very close to those of the population.
Table 1.
Sample Characterisation.
Most enterprises are over 20 years old (52%) and micro-enterprises (65%), followed by small (27%) and medium-sized (8%) enterprises.
Respondents mainly hold top (62%) or middle (26%) management positions, and almost half have more than 10 years of tenure, supporting informed responses.
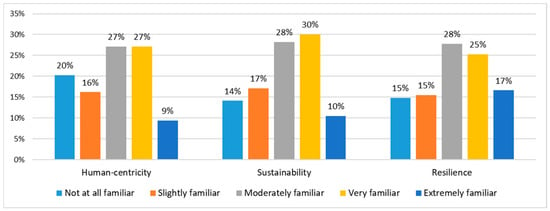
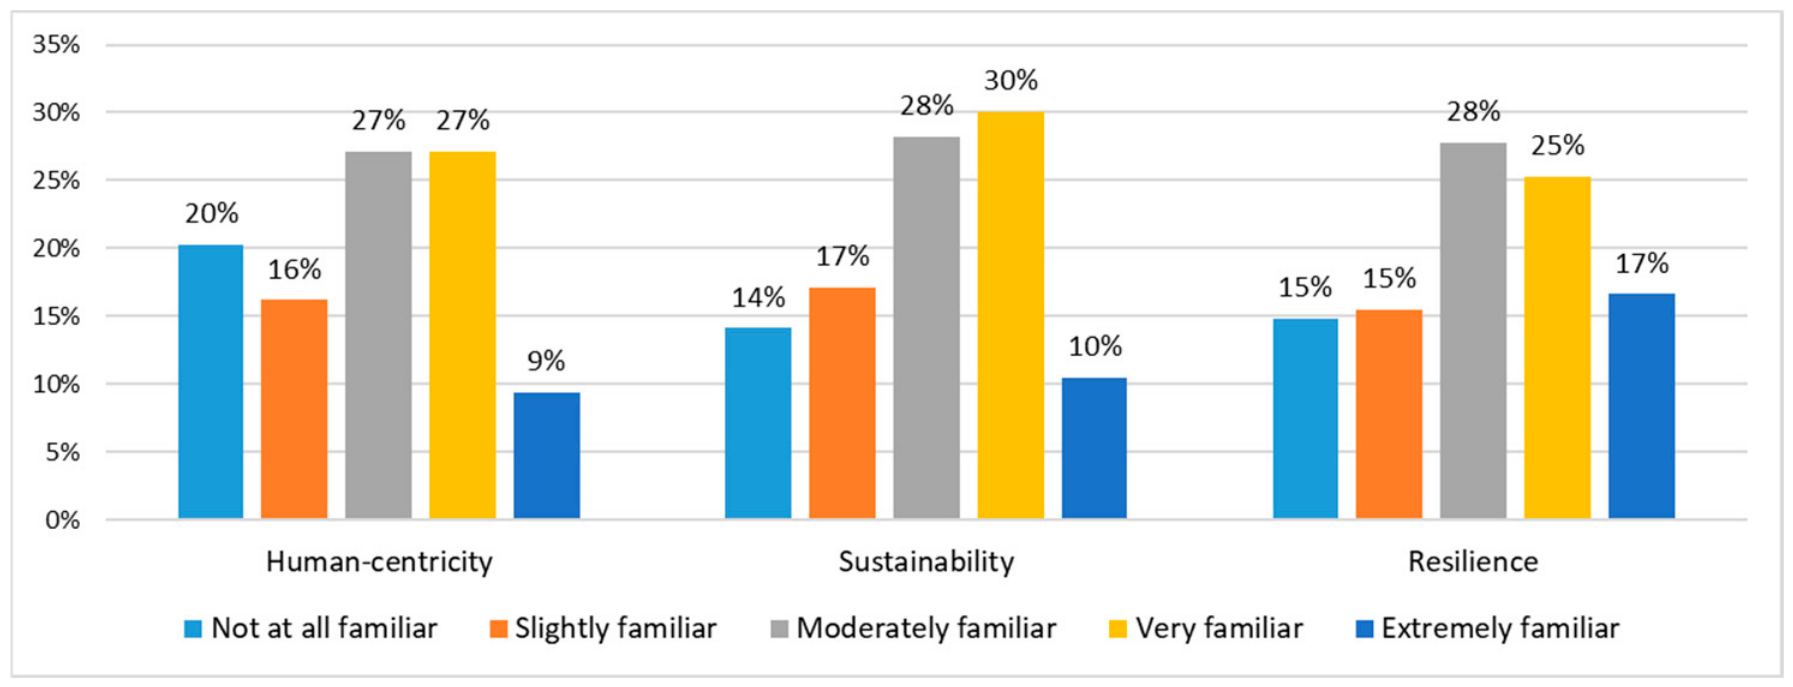
Familiarity with Industry 5.0 principles (Figure 2) is similar for all three principles—human-centricity, sustainability and resilience.
Figure 2.
Familiarity with Industry 5.0 principles.
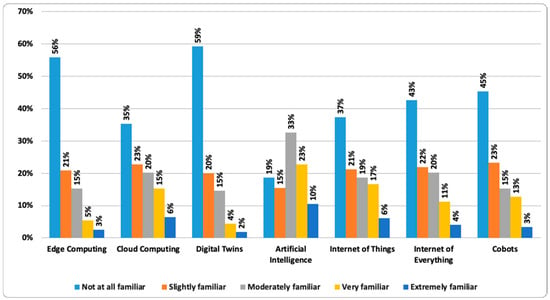
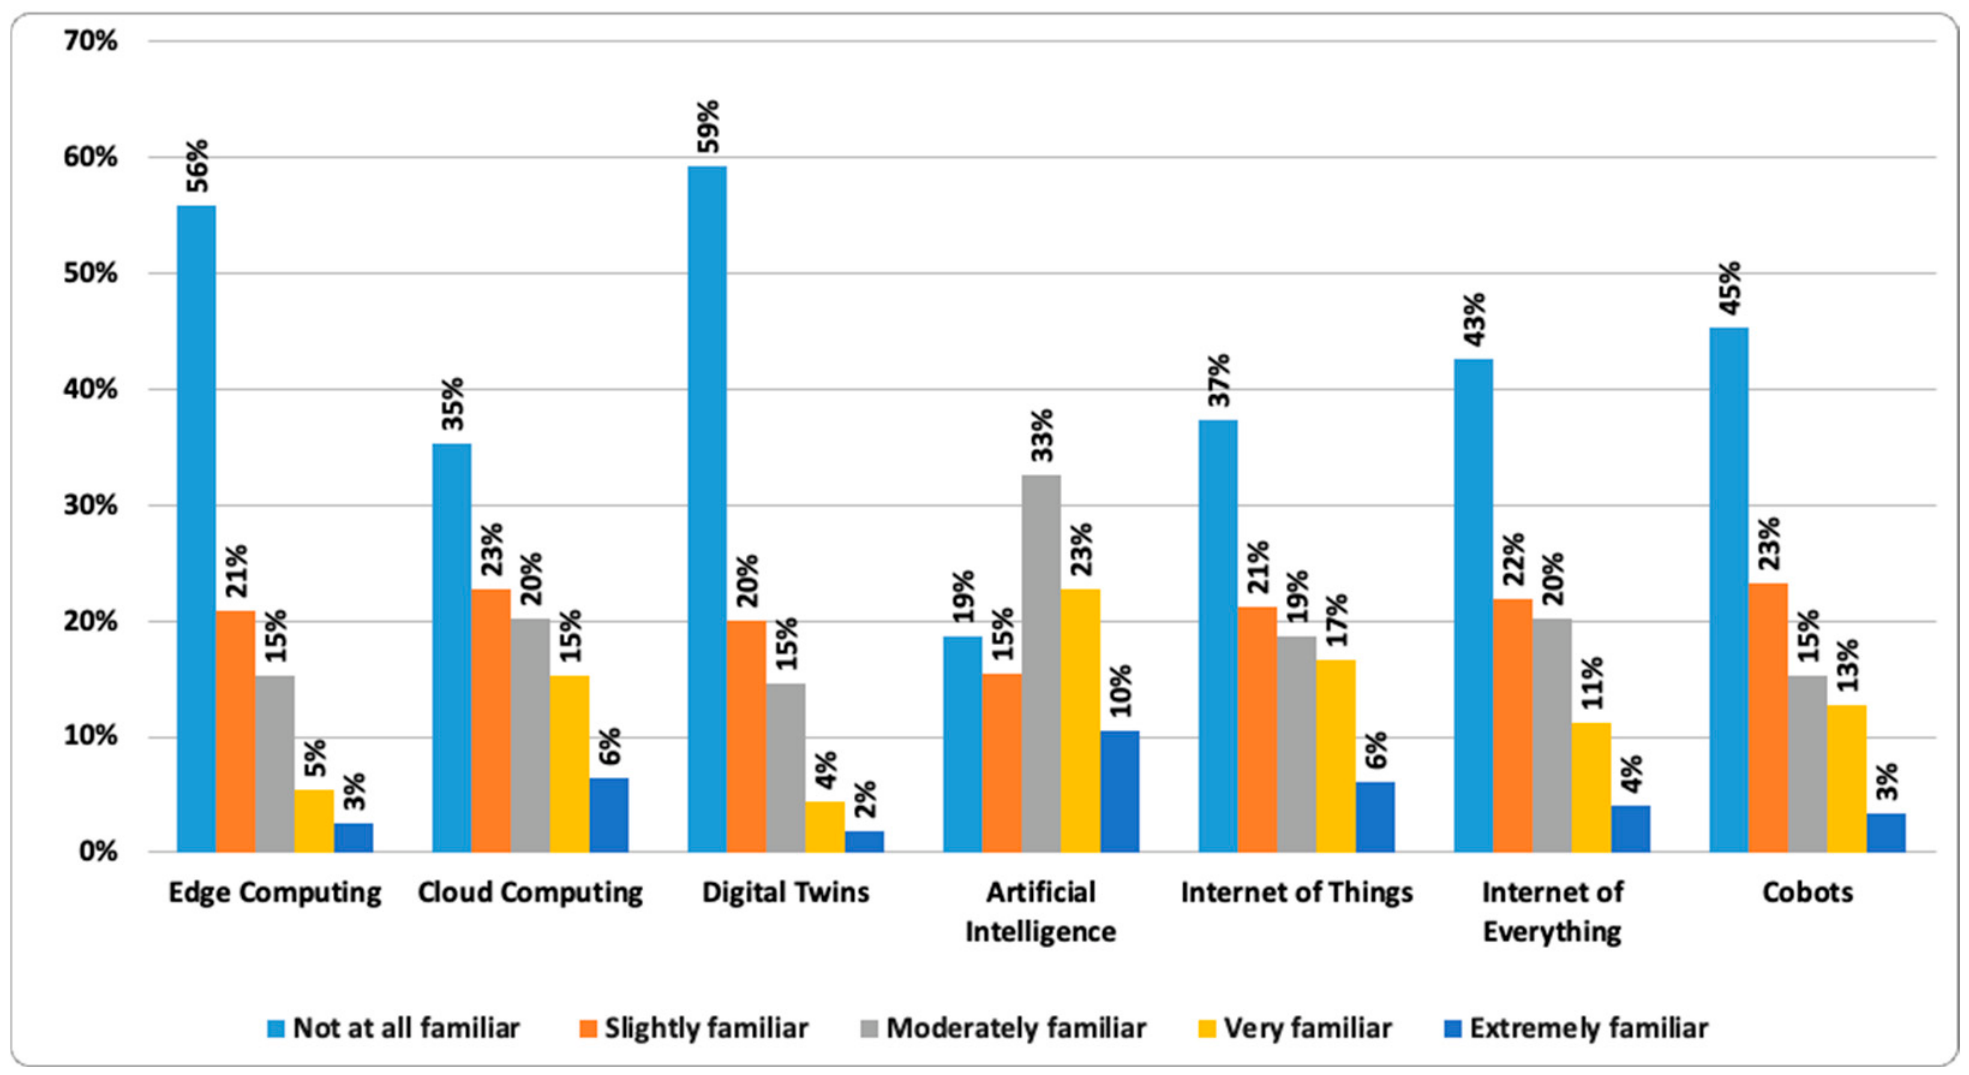
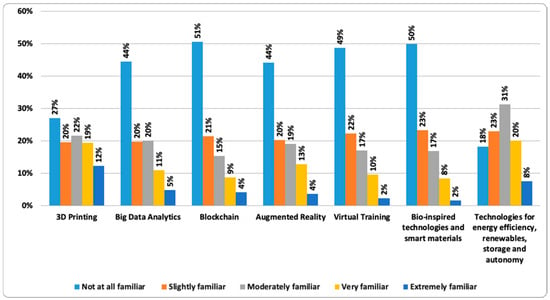
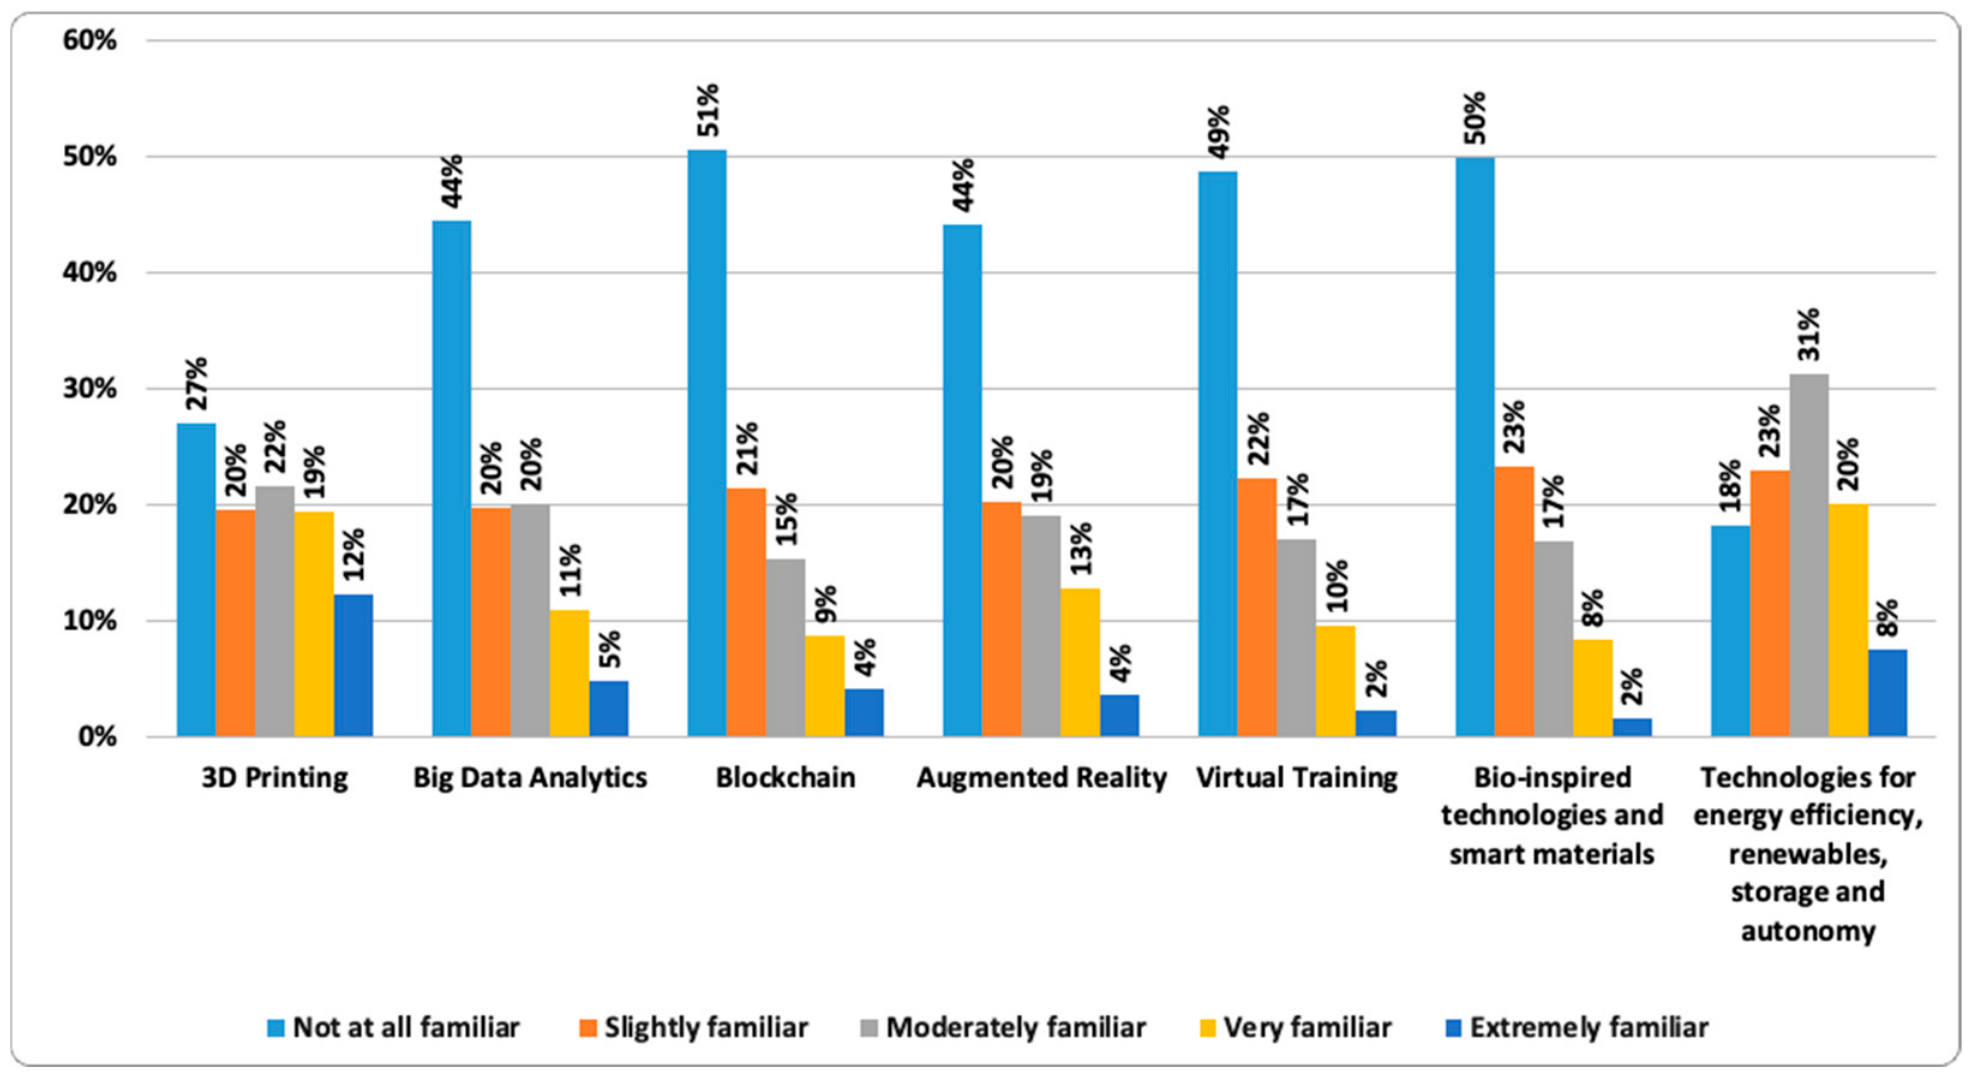
Among Industry 5.0 technologies (Figure 3 and Figure 4), AI, 3D printing, and energy efficiency technologies are the most familiar, whereas Digital Twins, Blockchain, and bio-inspired technologies remain largely unknown.
Figure 3.
Familiarity with Industry 5.0 technologies (part 1).
Figure 4.
Familiarity with Industry 5.0 technologies (part 2).
Missing values comprised 4.7% of item responses and occurred in the items of CPME, DESP, PTEC, PSOC and AQ5.0_6 (maximum of 16.0% for a single item). Missing values were imputed by linear regression without relevant changes in item means or standard deviations, and the observation with the highest Mahalanobis distance was removed [70]. Models were estimated by Maximum Likelihood (ML), as all variables met the normality criteria |Sk| < 3 and |Ku| < 7 [70,71].
4.2. Exploratory Factor Analysis
Construct dimensionality was assessed by EFA using principal axis factoring (PAF), with promax rotation whenever more than one factor was retained [59]. Sampling adequacy required KMO > 0.70 [72,73,74] and a significant Bartlett’s test (p < 0.05) [59]; reliability required Cronbach’s alpha ≥ 0.70 [75,76,77] and corrected item–total correlations ≥ 0.30 [59,78]. The number of factors was determined by the Kaiser criterion (eigenvalue > 1), in light of the theoretical structure of each construct.
All constructs met these criteria (Table 2; item-level results in Appendix A, Table A1): KMO ranged from 0.706 (social performance) to 0.966 (CPME), above Kaiser’s minimum [79]; Bartlett’s test was significant (p < 0.001); Cronbach’s alpha ranged from 0.854 to 0.974; and all corrected item–total correlations exceeded 0.50.
Table 2.
Reliability analysis and EFA (PAF) results by construct.
A single factor was retained for AI5.0, UT5.0, PSOC, PTEC, CPME and each of the four performance dimensions. For AQ5.0, two factors emerged: one comprising the items on the human-centred and sustainable orientation of quality (AQ5.0_1 to AQ5.0_4) and another comprising the two items on the digital integration of quality management (AQ5.0_5 and AQ5.0_6).
In addition, because social and technical practices are conceptually close, an EFA was conducted on their pooled items. Two factors emerged, corresponding to social and technical practices, except for PSOC_9 (agile and Lean organisational structures), which loaded primarily on the technical practices factor (0.62 vs. 0.27). Based on these results, AQ5.0_5, AQ5.0_6 and PSOC_9 were excluded from the CFA.
4.3. Measurement Model
The measurement model was estimated by maximum likelihood. Global fit was assessed with χ2/df, CFI, TLI, RMSEA (with 90% confidence interval) and SRMR [58,80,81,82], following the combined criteria proposed by Hu and Bentler (CFI and TLI ≥ 0.90, RMSEA ≤ 0.06 and SRMR ≤ 0.08) [83]. Local fit was assessed through convergent validity (SRW ≥ 0.50; CR ≥ 0.70; AVE ≥ 0.50) [59,70,84] and discriminant validity, using both the Fornell–Larcker criterion [85] and the heterotrait–monotrait ratio (HTMT < 0.85) [86].
In line with the theoretical framework and the EFA results, the measurement model specified performance as a second-order construct comprising four first-order dimensions (environmental, operational, financial and social). A one-factor model, in which all items loaded on a single latent factor, showed a very poor fit (χ2/df = 6.450; CFI = 0.487; RMSEA = 0.112), also suggesting that common method variance is not a dominant concern [87]. The second-order specification of performance fitted significantly better than a first-order unidimensional performance construct (Δχ2 = 1620.8, Δdf = 4, p < 0.001), and the second-order loadings were high (0.761 to 0.984), supporting the aggregation of the four dimensions into an overall performance construct. Inspection of the modification indices led to freeing nine error covariances, all between adjacent items of the same construct that share a common facet (Appendix A, Table A3) [58]. The final measurement model showed χ2/df = 2.270; CFI = 0.882; TLI = 0.877; RMSEA = 0.054 [0.052; 0.056]; SRMR = 0.061. Although CFI and TLI remain below 0.90, RMSEA and SRMR meet the combined criteria of [83].
In addition, an unmeasured latent method factor, on which all items loaded with equal loadings, was added to the final measurement model [87]. The method factor accounted, on average, for only 3.0% of the variance of the items, well below the 25% threshold [88], the standardised item loadings changed by no more than 0.058, and model fit remained virtually unchanged (CFI = 0.882 in both models). Together with the one-factor test, these results suggest that common method bias is unlikely to substantially affect the results.
To assess the stability of the measurement model, the sample was randomly split into two halves. EFA on the first half reproduced the factor structure (a single factor for AI5.0, UT5.0, AQ5.0, PSOC, PTEC and CPME, and each performance dimension), and CFA of the final model yielded similar fit in both halves (half A: χ2/df = 1.846; CFI = 0.850; RMSEA = 0.062; SRMR = 0.065; half B: χ2/df = 1.919; CFI = 0.838; RMSEA = 0.065; SRMR = 0.072), with CR ≥ 0.82 and AVE ≥ 0.54 for all constructs in both halves.
In the final model (Table 3; item-level results in Appendix A, Table A2), all item SRW exceeded 0.50 (0.547 to 0.944), CR ranged from 0.860 to 0.975, and AVE ranged from 0.539 to 0.771, supporting convergent validity.
Table 3.
Convergent validity by construct—final measurement model.
Discriminant validity was supported (Table 4): the square root of each construct’s AVE exceeded its correlations with the other constructs, and all HTMT ratios were below 0.85 (maximum = 0.772). The correlations of CPME with the other constructs are negative because, as described in Section 3.2, its items were reverse-scored so that higher values indicate stronger constraints.
Table 4.
Discriminant validity—final measurement model.
4.4. Structural Model
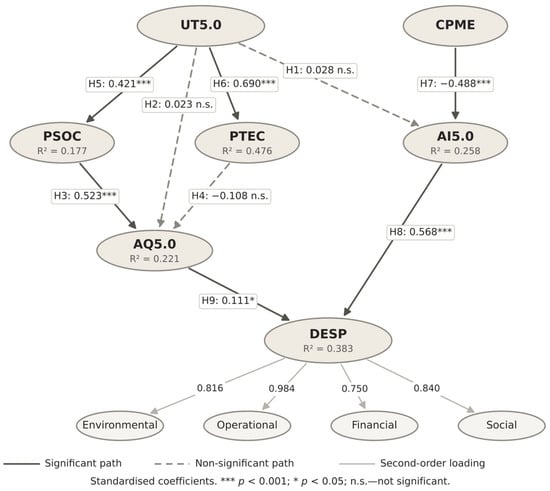
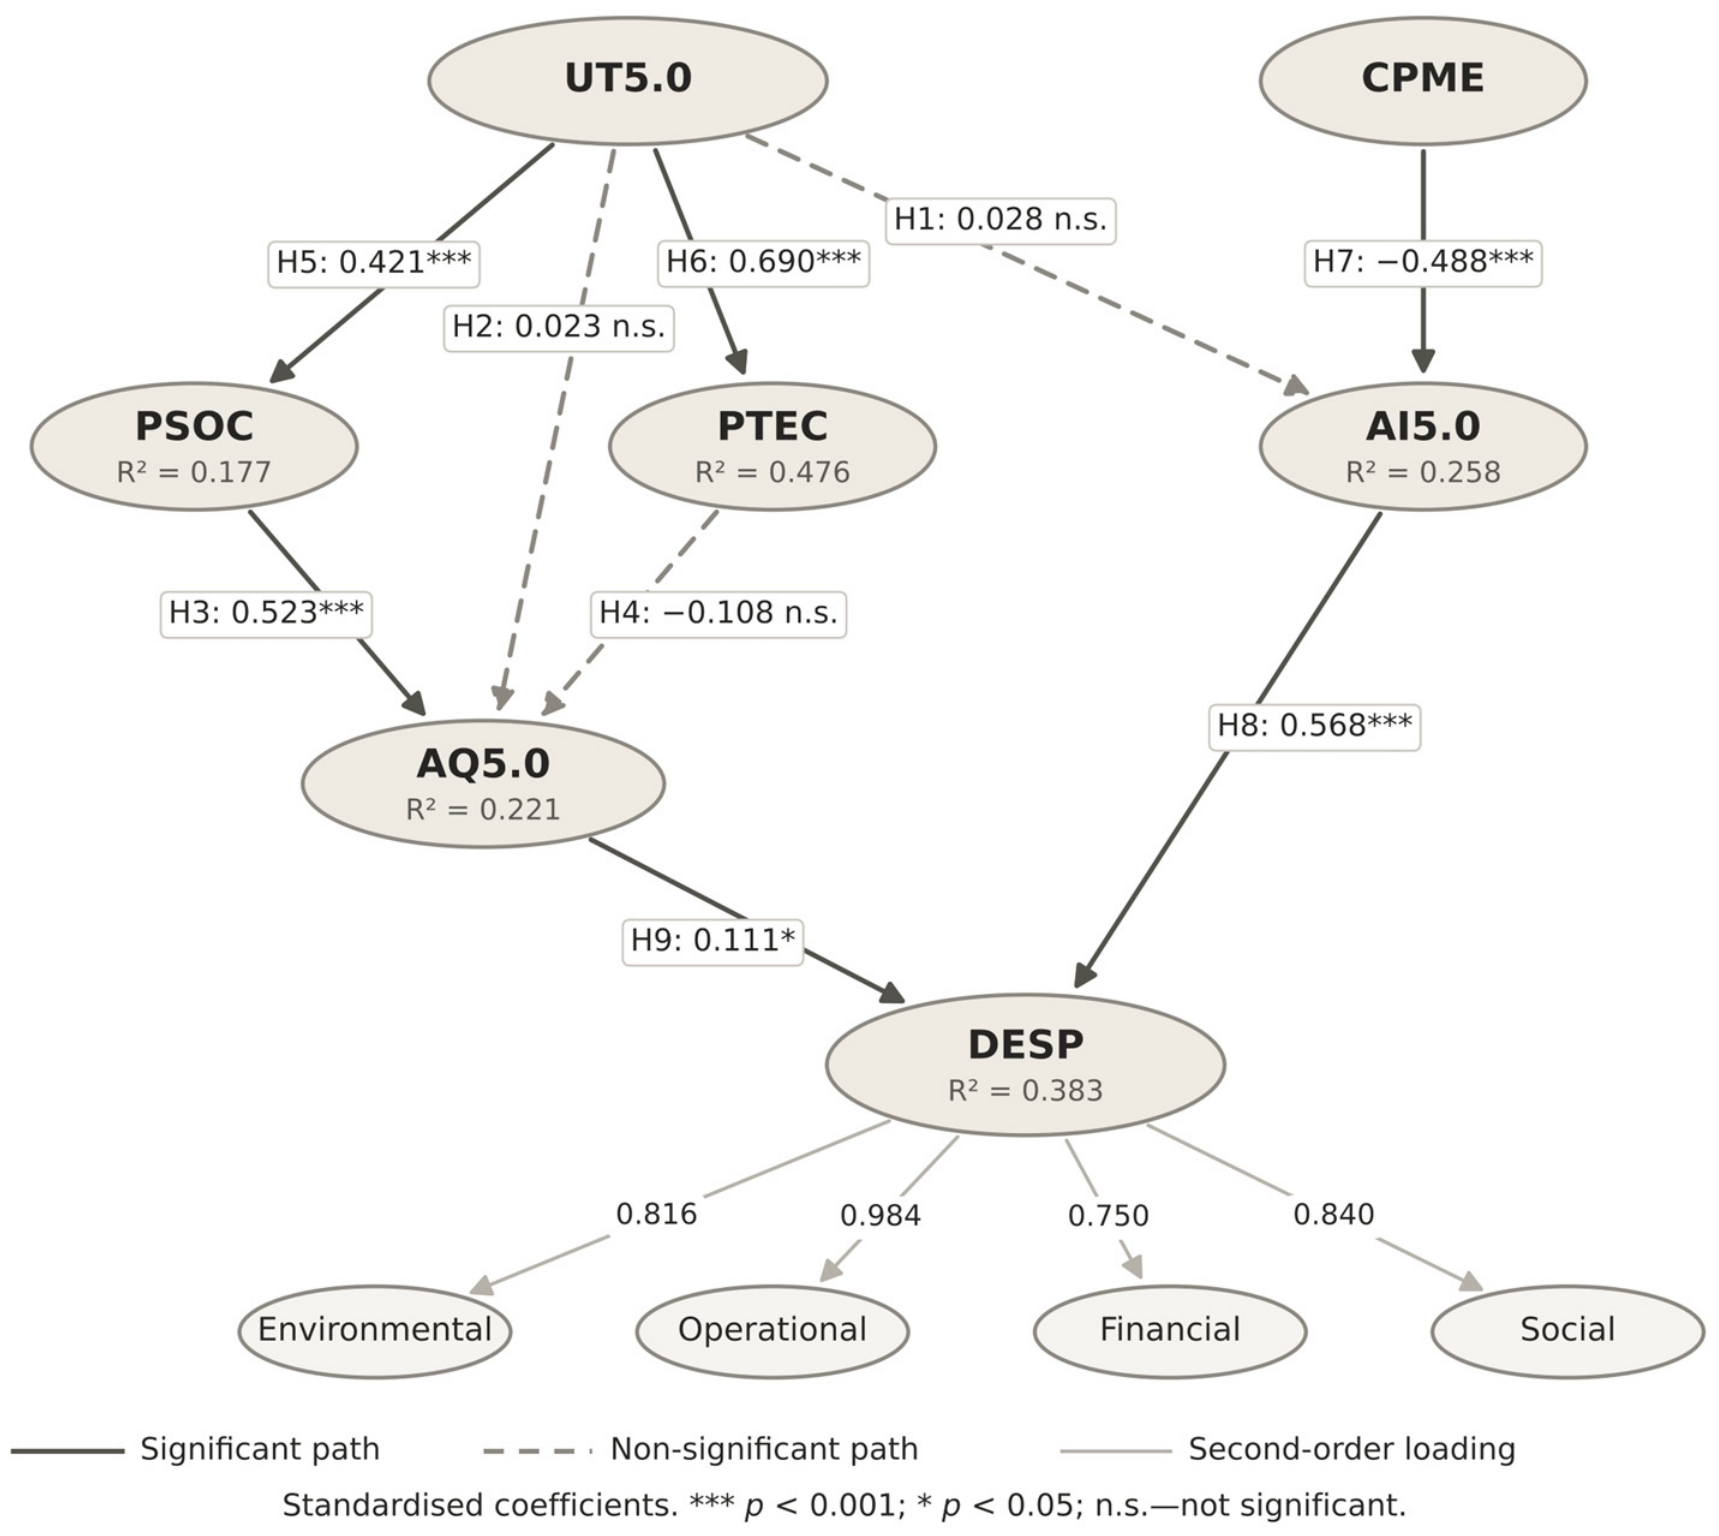
The structural model (Figure 5) was estimated with performance specified as a second-order construct. Its fit was lower than that of the measurement model (χ2/df = 2.390; CFI = 0.870; TLI = 0.866; RMSEA = 0.056 [0.055; 0.058]; SRMR = 0.142). While χ2/df and RMSEA are within commonly used thresholds, CFI and TLI fall below 0.90 and SRMR exceeds 0.08 [83], indicating that some associations among the constructs are not captured by the hypothesised model. The estimated relationships should therefore be interpreted with caution. Path estimates are reported in Table 5.
Figure 5.
Structural model.
Table 5.
Results of the hypothesis testing.
Six of the nine hypotheses were supported (Table 5). Based on standardised coefficients (β), the strongest associations were those of the use of Industry 5.0 technologies with technical practices (H6: β = 0.690), of Industry 5.0 adoption with performance (H8: β = 0.568) and of social practices with the adoption of Quality 5.0 (H3: β = 0.523), followed by the negative association of SME constraints with Industry 5.0 adoption (H7: β = −0.488) and the association of technology use with social practices (H5: β = 0.421). The association of Quality 5.0 adoption with performance was positive but weaker (H9: β = 0.111, p = 0.022). The direct associations of technology use with the adoption of Industry 5.0 (H1) and Quality 5.0 (H2), and of technical practices with the adoption of Quality 5.0 (H4: β = −0.108, p = 0.173), were not significant.
These results were robust to the treatment of missing data. When the structural model was re-estimated treating the imputed values as missing, using full information maximum likelihood, and with complete cases only, the results were unchanged.
Indirect effects were estimated with 95% Monte Carlo confidence intervals based on 20,000 replications [89] (Table 6). The use of Industry 5.0 technologies was indirectly associated with the adoption of Quality 5.0 through social practices, but not through technical practices. Since the corresponding direct association was not significant (H2), this pattern is consistent with an indirect-only (full) mediation through social practices. Social practices were also indirectly associated with performance through the adoption of Quality 5.0, and SME constraints were negatively and indirectly associated with performance through Industry 5.0 adoption. The serial indirect path from technology use to performance through social practices and Quality 5.0 adoption was small but significant, whereas the total indirect association of technology use with performance was not. Given the cross-sectional design, these indirect effects represent statistical associations consistent with the proposed framework rather than evidence of causal mechanisms.
Table 6.
Indirect effects.
As a complementary analysis, the model was re-estimated with the four performance dimensions as separate outcomes (χ2/df = 2.379; CFI = 0.872; TLI = 0.867; RMSEA = 0.056; SRMR = 0.142). Industry 5.0 adoption was positively associated with all four dimensions (β = 0.418 to 0.553), whereas Quality 5.0 adoption was significantly associated only with social (β = 0.205, p < 0.001) and environmental performance (β = 0.105, p = 0.037), and not with operational (p = 0.074) or financial performance (p = 0.502) (Table 7).
Table 7.
Associations of Industry 5.0 and Quality 5.0 adoption with each performance dimension.
5. Discussion
The results show that the adoption of Industry 5.0 and Quality 5.0 by Portuguese SMEs is associated not so much with the use of emerging technologies as with their integration into organisational practices that are human-centred and sustainability-oriented.
The direct effects of the use of Industry 5.0 technologies on the adoption of Industry 5.0 (H1: β = 0.028, p = 0.656) and Quality 5.0 (H2: β = 0.023, p = 0.732) were not significant. The mere availability or use of advanced technologies therefore does not appear to ensure the adoption of these paradigms, as fragmented implementation and low digital maturity limit their transformative potential [30], which is consistent with the limited familiarity with emerging technologies observed in the sample. Quality 5.0, in particular, depends more on organisational practices and human-centric approaches than on technological aspects [6,7,90]. Conversely, technology use was positively associated with social (H5: β = 0.421, p < 0.001) and technical quality practices (H6: β = 0.690, p < 0.001), suggesting that technologies supporting real-time monitoring, traceability, and predictive analytics [33,91] act as enablers of quality practices rather than as direct drivers of paradigm adoption [3,31]. The mediation analysis supports this interpretation: technology use was indirectly associated with Quality 5.0 adoption through social practices (β = 0.220, 95% CI [0.156; 0.292]), but not through technical practices (β = −0.075, 95% CI [−0.182; 0.034]), a pattern consistent with an indirect-only mediation. These results highlight the distinction between the availability or use of technology and the organisational processes required to translate technological capabilities into effective implementation. This is consistent with evidence that the benefits of digital technologies depend on the organisational channels through which they operate [46,50].
Social practices showed the strongest association with the adoption of Quality 5.0 (H3: β = 0.523, p < 0.001), confirming the centrality of management commitment, customer focus, employee training, and ethics [39,41] to the human-centric paradigm of Quality 5.0 [55,92]. In contrast, the association between technical practices and Quality 5.0 adoption was not significant (H4: β = −0.108, p = 0.173). Diagnostic analysis suggests that this result reflects the shared variance between technical and social practices rather than a negative role of technical practices. Once social practices are accounted for, the unique contribution of technical practices is therefore negligible. Alternatively, this result may reflect the limited digital integration of many Portuguese SMEs, which constrains the effectiveness of practices such as predictive analysis, real-time data management, and process automation [17,28]. These explanations remain tentative, and the finding should be interpreted as specific to the sample studied rather than generalised to SMEs in other contexts. The transition to Quality 5.0 thus appears to rely primarily on social and human-oriented dimensions.
SME characteristics (constraints) showed a strong negative association with the adoption of Industry 5.0 (H7: β = −0.488, p < 0.001). SME characteristics (constraints) were also negatively and indirectly associated with performance through Industry 5.0 adoption (β = −0.277, 95% CI [−0.356; −0.205]). Consistent with the literature, limited resources, lack of digital skills, and cultural resistance remain critical obstacles [17,28], confirming that the structural constraints of SMEs are decisive in explaining adoption difficulties. Overcoming them requires leadership vision, cultural alignment, and supportive public policies [29,30,93,94].
Both Industry 5.0 adoption (H8: β = 0.568, p < 0.001) and Quality 5.0 adoption (H9: β = 0.111, p = 0.022) were positively associated with overall performance, modelled as a second-order construct comprising operational, financial, social, and environmental dimensions, in line with studies linking Industry 5.0 to sustainability, resilience, and competitiveness [7,16,32] and Quality 5.0 to organisational excellence [6,95]. The analysis of the individual dimensions, however, reveals different patterns. Industry 5.0 adoption was positively associated with all four dimensions (β = 0.418 to 0.553), supporting the view of Industry 5.0 as a pathway for reconciling industrial competitiveness with sustainable development across the economic, social, and environmental pillars of the triple bottom line [3,5,54]. In contrast, Quality 5.0 adoption was significantly associated only with social (β = 0.205, p < 0.001) and environmental performance (β = 0.105, p = 0.037), and not with operational (p = 0.074) or financial performance (p = 0.502). This pattern is consistent with the human-centred and sustainability-oriented content of Quality 5.0 adoption, as measured in this study, and suggests that its contribution to economic outcomes is still emerging, in line with the early stage of its adoption in SMEs. Nevertheless, the association with environmental performance should be interpreted with caution, as it is based on self-reported perceptions and the environmental effects of digital technologies are not automatically positive, depending on firms’ capabilities and context [46].
Overall, the findings provide an integrated view of how Industry 5.0 and Quality 5.0 can be operationalised in SMEs. They highlight three critical factors for adoption, namely the human-centred social practices of quality management, the enabling role of technology when embedded in these practices, and the structural constraints of SMEs. They also show that both paradigms are positively associated with overall performance, although Quality 5.0 adoption is associated mainly with its social and environmental dimensions. By providing empirical evidence from the SME context, a field still little explored, this study underlines the decisive role of human and sustainability-oriented dimensions in this transition.
6. Conclusions
This study examined how Industry 5.0 influences the adoption of Quality 5.0 practices and how both contribute to the performance of Portuguese SMEs, using SEM on survey data from 439 industrial SMEs. The results show that the adoption of these paradigms does not depend on technology alone: the use of Industry 5.0 technologies was not directly associated with adoption but was positively associated with social and technical quality practices, and its association with Quality 5.0 adoption occurred only indirectly, through social practices. Social practices were the main factor associated with Quality 5.0 adoption, whereas SME constraints were negatively associated with the adoption of Industry 5.0 Both paradigms were positively associated with overall performance: Industry 5.0 adoption with all four dimensions, and Quality 5.0 adoption mainly with social and environmental performance.
Theoretically, the study advances the still incipient literature on Industry 5.0 and Quality 5.0 in SMEs by proposing and empirically testing an integrated model that jointly considers technology use, social and technical quality practices, SME constraints, and multidimensional performance. Its main theoretical contribution is to show that technology acts as an enabler whose association with Quality 5.0 adoption is channelled through human-centred quality practices rather than operating directly, and that the two paradigms relate differently to the dimensions of sustainable performance. Empirically, it provides evidence from Portuguese industrial SMEs, a context still little explored.
In practical terms, given that technology use was associated with Quality 5.0 adoption only through social practices, managers should combine investments in Industry 5.0 technologies with social quality practices, namely leadership commitment, customer focus, and employee training and involvement, and integrate technical tools progressively into existing quality management systems. Given the strong negative association between SME constraints and Industry 5.0 adoption, policymakers should provide targeted support, including funding, digital skills training, and technical assistance, to mitigate the structural constraints of SMEs and foster a competitive and sustainable industrial transition.
This study has limitations that open avenues for future research. First, the low response rate (approximately 1.3%) and the non-random sample limit representativeness: despite no evidence of nonresponse bias and a regional distribution similar to that of the population, the sample differs by sector and may over-represent more digitally mature firms. Second, all constructs were reported by a single respondent in a cross-sectional survey. Although statistical tests suggest that common method bias is unlikely to substantially affect the results, the design does not allow causal inferences or rule out reverse causality. Third, performance was assessed through respondents’ perceptions of change over the previous year rather than through objective indicators. Fourth, some incremental fit indices fall below commonly recommended values, particularly in the structural model, suggesting that some relationships are not captured by the hypothesised model. Future studies should therefore adopt longitudinal and multi-source designs, use objective performance indicators, examine additional relationships, and replicate the model in other countries and sectors.
Author Contributions
Conceptualization, C.M., J.C.d.S. and V.L.; methodology, C.M., J.C.d.S. and V.L.; formal analysis, C.M.; investigation, C.M.; data curation, C.M. and V.L.; writing—original draft preparation, C.M.; writing—review and editing, J.C.d.S. and V.L.; supervision, J.C.d.S. and V.L. All authors have read and agreed to the published version of the manuscript.
Funding
This work was supported by Fundação para a Ciência e a Tecnologia—projects UIDB/04728/2025 (DOI: https://doi.org/10.54499/UID/04728/2025) and UIDB/50022/2025 (DOI: https://doi.org/10.54499/UID/50022/2025).
Institutional Review Board Statement
The questionnaire was reviewed and approved by the Data Protection Office of the Polytechnic of Porto (P.PORTO) to ensure compliance with the General Data Protection Regulation (GDPR).
Informed Consent Statement
Informed consent was obtained from all subjects involved in the study.
Data Availability Statement
The data are not publicly available due to confidentiality commitments made to the participating organisations.
Acknowledgments
During the preparation of this manuscript, the authors used a generative AI tool (Claude–Opus 5.5.) for the purposes of producing figures (Figure 1 and Figure 5) and data interpretation. The authors have reviewed and edited the output and take full responsibility for the content of this publication.
Conflicts of Interest
The authors declare no conflicts of interest.
Abbreviations
The following abbreviations are used in this manuscript:
| AVE | Average Variance Extracted |
| CFA | Confirmatory Factor Analysis |
| CFI | Comparative Fit Index |
| CPSs | Cyber–Physical Systems |
| CR | Composite Reliability |
| DPO | Data Protection Office |
| EFA | Exploratory Factor Analysis |
| GDPR | General Data Protection Regulation |
| GFI | Goodness of Fit Index |
| IoT | Internet of Things |
| KMO | Kaiser–Meyer–Olkin |
| ML | Maximum Likelihood |
| NFI | Normed Fit Index |
| PCA | Principal Components Analysis |
| PCFI | Parsimony-adjusted Comparative Fit Index |
| PGFI | Parsimony-adjusted Goodness of Fit Index |
| RMSEA | Root Mean Squared Error of Approximation |
| SEM | Structural Equation Modelling |
| SME | Small and Medium-sized Enterprise |
| SRW | Standardised Regression Weight |
| TLI | Tucker–Lewis Index |
| TQM | Total Quality Management |
Appendix A
This appendix reports the item-level results of the exploratory factor analysis (Table A1) and of the re-specified measurement model (Table A2), summarised by construct in Table 2 and Table 3, respectively.
Table A1.
Item-level statistics and EFA (PAF) results.
Table A2.
Reliability of manifest variables—final measurement model (item level).
Table A3.
Error covariances in the final measurement model.
Appendix B
Table A4.
Measurement items by construct.
References
- Ingaldi, M.; Ulewicz, R. Problems with the Implementation of Industry 4.0 in Enterprises from the SME Sector. Sustainability 2020, 12, 217. [Google Scholar] [CrossRef] [Scilit]
- Prause, G.; Atari, S. On Sustainable Production Networks for Industry 4.0. Entrep. Sustain. Issues 2017, 4, 421–431. [Google Scholar] [CrossRef] [Scilit] [PubMed]
- Breque, M.; De Nul, L.; Petridis, A. Industry 5.0: Towards a Sustainable, Human-Centric and Resilient European Industry; European Commission, Directorate-General for Research and Innovation: Luxembourg, 2021. [Google Scholar] [CrossRef] [PubMed]
- Masoomi, B.; Sahebi, I.G.; Ghobakhloo, M.; Mosayebi, A. Do Industry 5.0 Advantages Address the Sustainable Development Challenges of the Renewable Energy Supply Chain? Sustain. Prod. Consum. 2023, 43, 94–112. [Google Scholar] [CrossRef] [Scilit]
- United Nations. Transforming Our World: The 2030 Agenda for Sustainable Development; Resolution A/RES/70/1; United Nations General Assembly: New York, NY, USA, 2015. [Google Scholar]
- Ali, K.; Johl, S.K. Driving Sustainability in Industry 5.0 through Sociotechnical Approach of Quality Management. Total Qual. Manag. Bus. Excell. 2024, 35, 1567–1592. [Google Scholar] [CrossRef] [Scilit]
- Frick, J.; Grudowski, P. Quality 5.0: A Paradigm Shift Towards Proactive Quality Control in Industry 5.0. Int. J. Bus. Adm. 2023, 14, 51. [Google Scholar] [CrossRef] [Scilit]
- Ben-Daya, M.; Hassini, E.; Bahroun, Z. Internet of Things and Supply Chain Management: A Literature Review. Int. J. Prod. Res. 2017, 57, 4719–4742. [Google Scholar] [CrossRef] [Scilit]
- Skare, M.; de las Mercedes de Obesso, M.; Ribeiro-Navarrete, S. Digital Transformation and European Small and Medium Enterprises (SMEs): A Comparative Study Using Digital Economy and Society Index Data. Int. J. Inf. Manag. 2023, 68, 102594. [Google Scholar] [CrossRef] [Scilit]
- Wan, P.K.; Leirmo, T.L. Human-Centric Zero-Defect Manufacturing: State-of-the-Art Review, Perspectives, and Challenges. Comput. Ind. 2023, 144, 103792. [Google Scholar] [CrossRef] [Scilit]
- Dannreuther, C. A Zeal for a Zeal? SME Policy and the Political Economy of the EU. Comp. Eur. Polit. 2007, 5, 377–399. [Google Scholar] [CrossRef] [Scilit]
- European Union. Pequenas e Médias Empresas [Small and Medium-Sized Enterprises]. Available online: https://eur-lex.europa.eu/PT/legal-content/glossary/small-and-medium-sized-enterprises.html (accessed on 11 December 2024).
- Kumar, R.; Singh, R.K.; Dwivedi, Y.K. Application of Industry 4.0 Technologies in SMEs for Ethical and Sustainable Operations: Analysis of Challenges. J. Clean. Prod. 2020, 275, 124063. [Google Scholar] [CrossRef] [Scilit] [PubMed]
- PORDATA. Caracterização e Demografia: Empresas por Dimensão [Characterisation and Demography: Enterprises by Size]. Available online: https://www.pordata.pt/pt/estatisticas/empresas/caracterizacao-e-demografia/empresas-por-dimensao (accessed on 11 December 2024).
- Mittal, S.; Khan, M.A.; Romero, D.; Wuest, T. A Critical Review of Smart Manufacturing & Industry 4.0 Maturity Models: Implications for Small and Medium-Sized Enterprises (SMEs). J. Manuf. Syst. 2018, 49, 194–214. [Google Scholar] [CrossRef] [Scilit]
- Xu, X.; Lu, Y.; Vogel-Heuser, B.; Wang, L. Industry 4.0 and Industry 5.0—Inception, Conception and Perception. J. Manuf. Syst. 2021, 61, 530–535. [Google Scholar] [CrossRef] [Scilit]
- Moeuf, A.; Pellerin, R.; Lamouri, S.; Tamayo-Giraldo, S.; Barbaray, R. The Industrial Management of SMEs in the Era of Industry 4.0. Int. J. Prod. Res. 2018, 56, 1118–1136. [Google Scholar] [CrossRef] [Scilit]
- Masood, T.; Sonntag, P. Industry 4.0: Adoption Challenges and Benefits for SMEs. Comput. Ind. 2020, 121, 103261. [Google Scholar] [CrossRef] [Scilit]
- Anh, T.D.; Binh, T.D.; Long, N.D.B.; Ai, T.V.; Tan, K.S.; Van, N.T.L. Strategic Vision for the Implementation of the Industrial Revolution 4.0 in the Vietnamese Context. Int. J. Technol. 2022, 13, 958–968. [Google Scholar] [CrossRef] [Scilit]
- Kagermann, H.; Wahlster, W.; Helbig, J. Recommendations for Implementing the Strategic Initiative INDUSTRIE 4.0: Final Report of the Industrie 4.0 Working Group; acatech—National Academy of Science and Engineering: Frankfurt am Main, Germany, 2013. [Google Scholar]
- Zahrin, S.N.A.; Sawai, R.P.; Sawai, J.P.; Harun, C.S.C. Muslim Psychologists in Facing Challenges of the 4.0 Industrial Revolution. Islamiyyat 2022, 44, 145–156. [Google Scholar] [CrossRef] [Scilit]
- Zhong, R.Y.; Xu, X.; Klotz, E.; Newman, S.T. Intelligent Manufacturing in the Context of Industry 4.0: A Review. Engineering 2017, 3, 616–630. [Google Scholar] [CrossRef] [Scilit]
- Hines, P.; Tortorella, G.L.; Antony, J.; Romero, D.; Walsh, A.; Taylor, D.; Alves, A.C.; Bertolini, M.; Caiado, R.; Demeter, K.; et al. A Global Industrial Perspective on Lean Industry 4.0: A Qualitative Wide-Angle Lens Approach. Prod. Plan. Control 2025, 37, 1–22. [Google Scholar] [CrossRef] [Scilit]
- Mulongo, N.Y. Industry 5.0 a Novel Technological Concept. In Proceedings of the 2024 International Conference on Smart Applications, Communications and Networking (SmartNets), Harrisonburg, VA, USA, 28–30 May 2024; pp. 1–6. [Google Scholar] [CrossRef] [Scilit]
- Nahavandi, S. Industry 5.0—A Human-Centric Solution. Sustainability 2019, 11, 4371. [Google Scholar] [CrossRef] [Scilit]
- van der Poll, J.A. Problematizing the Adoption of Formal Methods in the 4IR–5IR Transition. Appl. Syst. Innov. 2022, 5, 127. [Google Scholar] [CrossRef] [Scilit]
- Saniuk, S.; Grabowska, S.; Thibbotuwawa, A. Challenges of Industrial Systems in Terms of the Crucial Role of Humans in the Industry 5.0 Environment. Prod. Eng. Arch. 2024, 30, 94–104. [Google Scholar] [CrossRef] [Scilit]
- Adel, A. Future of Industry 5.0 in Society: Human-Centric Solutions, Challenges and Prospective Research Areas. J. Cloud Comput. 2022, 11, 40. [Google Scholar] [CrossRef] [Scilit] [PubMed]
- Maddikunta, P.K.R.; Pham, Q.-V.; Prabadevi, B.; Deepa, N.; Dev, K.; Gadekallu, T.R.; Ruby, R.; Liyanage, M. Industry 5.0: A Survey on Enabling Technologies and Potential Applications. J. Ind. Inf. Integr. 2022, 26, 100257. [Google Scholar] [CrossRef] [Scilit]
- Mukherjee, A.A.; Raj, A.; Aggarwal, S. Identification of Barriers and Their Mitigation Strategies for Industry 5.0 Implementation in Emerging Economies. Int. J. Prod. Econ. 2023, 257, 108770. [Google Scholar] [CrossRef] [Scilit]
- Jahromi, G.S.; Ghazinoory, S. Clothing Industry in Transition from Industry 4.0 to Industry 5.0. J. Text. Inst. 2024, 116, 365–379. [Google Scholar] [CrossRef] [Scilit]
- Zizic, M.C.; Mladineo, M.; Gjeldum, N.; Celent, L. From Industry 4.0 towards Industry 5.0: A Review and Analysis of Paradigm Shift for the People, Organization and Technology. Energies 2022, 15, 5221. [Google Scholar] [CrossRef] [Scilit]
- Bajic, B.; Suzic, N.; Moraca, S.; Stefanović, M.; Jovicic, M.; Rikalovic, A. Edge Computing Data Optimization for Smart Quality Management: Industry 5.0 Perspective. Sustainability 2023, 15, 6032. [Google Scholar] [CrossRef] [Scilit]
- Asif, M. Are QM Models Aligned with Industry 4.0? A Perspective on Current Practices. J. Clean. Prod. 2020, 258, 120820. [Google Scholar] [CrossRef] [Scilit]
- Maljugić, B.; Ćoćkalo, D.; Bakator, M.; Stanisavljev, S. The Role of the Quality Management Process within Society 5.0. Societies 2024, 14, 111. [Google Scholar] [CrossRef] [Scilit]
- Sader, S.; Husti, I.; Daroczi, M. A Review of Quality 4.0: Definitions, Features, Technologies, Applications, and Challenges. Total Qual. Manag. Bus. Excell. 2022, 33, 1164–1182. [Google Scholar] [CrossRef] [Scilit]
- Stefanovic, M.; Wawak, S.; Popkova, E.; Eric, M.; Mitrovic, S.; Djordjevic, A.; Zahar Djordjevic, M. From Quality 4.0 to Quality 5.0—The Transition Roadmap. Int. J. Qual. Res. 2024, 18, 1199–1210. [Google Scholar] [CrossRef] [Scilit]
- Ali, K.; Johl, S.K.; Muneer, A.; Alwadain, A.; Ali, R.F. Soft and Hard Total Quality Management Practices Promote Industry 4.0 Readiness: A SEM-Neural Network Approach. Sustainability 2022, 14, 11917. [Google Scholar] [CrossRef] [Scilit]
- Ali, K.; Waheed, A. Synergistic Role of TQM 4.0 toward Industry 4.0 Readiness: A Sociotechnical Perspective of Selected Industries. TQM J. 2024, 37, 853–876. [Google Scholar] [CrossRef] [Scilit]
- Sony, M.; Antony, J.; Douglas, J.A. Essential Ingredients for the Implementation of Quality 4.0: A Narrative Review of Literature and Future Directions for Research. TQM J. 2020, 32, 779–793. [Google Scholar] [CrossRef] [Scilit]
- Fundin, A.; Lilja, J.; Lagrosen, Y.; Bergquist, B. Quality 2030: Quality Management for the Future. Total Qual. Manag. Bus. Excell. 2020, 36, 264–280. [Google Scholar] [CrossRef] [Scilit]
- Huang, S.; Wang, B.; Li, X.; Zheng, P.; Mourtzis, D.; Wang, L. Industry 5.0 and Society 5.0—Comparison, Complementation and Co-Evolution. J. Manuf. Syst. 2022, 64, 424–428. [Google Scholar] [CrossRef] [Scilit]
- Orzes, G.; Rauch, E.; Bednar, S.; Poklemba, R. Industry 4.0 Implementation Barriers in Small and Medium Sized Enterprises: A Focus Group Study. In Proceedings of the 2018 IEEE International Conference on Industrial Engineering and Engineering Management (IEEM), Bangkok, Thailand, 16–19 December 2018; pp. 1348–1352. [Google Scholar] [CrossRef] [Scilit]
- Madhavan, M.; Sharafuddin, M.A.; Wangtueai, S. Measuring the Industry 5.0-Readiness Level of SMEs Using Industry 1.0–5.0 Practices: The Case of the Seafood Processing Industry. Sustainability 2024, 16, 2205. [Google Scholar] [CrossRef] [Scilit]
- Rauch, E.; Dallasega, P.; Unterhofer, M. Requirements and Barriers for Introducing Smart Manufacturing in Small and Medium-Sized Enterprises. IEEE Eng. Manag. Rev. 2019, 47, 87–94. [Google Scholar] [CrossRef] [Scilit]
- Lin, W.; Wang, Y.; Zhang, Q.; Peron, M.; Lu, J. Emerging opportunities or paradoxes: Assessing the effect of digital technology adoption on corporate carbon performance. J. Environ. Manag. 2025, 391, 126399. [Google Scholar] [CrossRef] [Scilit] [PubMed]
- Khan, M.T.; Idrees, M.D.; Haider, Y. Industry 4.0 impacts on operational and green innovation performances with the mediation of green practices. Int. J. Product. Perform. Manag. 2024, 73, 1405–1426. [Google Scholar] [CrossRef] [Scilit]
- Abd Elghany, M.; Elessawi, N. The role of Industry 5.0 Internet of Things adoption on sustainable performance of manufacturing SMEs through the integration of supply chain. Discov. Comput. 2026, 29, 28. [Google Scholar] [CrossRef] [Scilit]
- Madhavan, M.; Sharafuddin, M.A.; Wangtueai, S. Impact of Industry 5.0 readiness on sustainable business growth of marine food processing SMEs in Thailand. Adm. Sci. 2024, 14, 110. [Google Scholar] [CrossRef] [Scilit]
- Zhen, Y.; Qiao, W.; Wang, R.; Wang, W. Blockchain Technology, Enterprise Risk and Enterprise Performance. Sustainability 2024, 16, 70. [Google Scholar] [CrossRef] [Scilit]
- Pedersen, M.R.; Nalpantidis, L.; Andersen, R.S.; Schou, C.; Bøgh, S.; Krüger, V.; Madsen, O. Robot Skills for Manufacturing: From Concept to Industrial Deployment. Robot. Comput.-Integr. Manuf. 2016, 37, 282–291. [Google Scholar] [CrossRef] [Scilit]
- Paschek, D.; Luminosu, C.-T.; Ocakci, E. Industry 5.0 Challenges and Perspectives for Manufacturing Systems in the Society 5.0. In Sustainability and Innovation in Manufacturing Enterprises: Indicators, Models and Assessment for Industry 5.0; Draghici, A., Ivascu, L., Eds.; Springer: Singapore, 2022; pp. 17–63. [Google Scholar] [CrossRef] [Scilit]
- Sá, J.C.; Oliveira, A.; Hines, P.; Mourão, F.; McDermott, O.; Marques, P.A.; Zouari, A.; Pathania, A.; Ulewicz, R. The Effects of Lean and People’s Behaviours on Occupational Safety. Prod. Eng. Arch. 2025, 31, 1–14. [Google Scholar] [CrossRef] [Scilit]
- Elkington, J. Cannibals with Forks: The Triple Bottom Line of 21st Century Business; Capstone: Oxford, UK, 1997. [Google Scholar]
- Antony, J.; Sony, M.; McDermott, O.; Jayaraman, R.; Flynn, D. An Exploration of Organizational Readiness Factors for Quality 4.0: An Intercontinental Study and Future Research Directions. Int. J. Qual. Reliab. Manag. 2023, 40, 582–606. [Google Scholar] [CrossRef] [Scilit]
- Talukder, M.; Bakar, F.A.; Saleh, M.A.; Quazi, A. Sustainable technologies and organizational performance in an emerging country SMEs. J. Open Innov. Technol. Mark. Complex. 2025, 11, 100441. [Google Scholar] [CrossRef] [Scilit]
- Quivy, R.; Van Campenhoudt, L. Manual de Investigação em Ciências Sociais, 2nd ed.; Gradiva: Lisbon, Portugal, 1998. [Google Scholar]
- Marôco, J. Análise de Equações Estruturais: Fundamentos Teóricos, Software & Aplicações, 3rd ed.; ReportNumber: Pêro Pinheiro, Portugal, 2021. [Google Scholar]
- Hair, J.F.; Black, W.C.; Babin, B.J.; Anderson, R.E. Multivariate Data Analysis, 8th ed.; Cengage Learning EMEA: Andover, UK, 2018. [Google Scholar]
- Krosnick, J.A. Survey Research. Annu. Rev. Psychol. 1999, 50, 537–567. [Google Scholar] [CrossRef] [Scilit] [PubMed]
- Ponto, J. Understanding and Evaluating Survey Research. J. Adv. Pract. Oncol. 2015, 6, 168–171. [Google Scholar] [CrossRef] [Scilit]
- European Commission. Commission Recommendation of 6 May 2003 Concerning the Definition of Micro, Small and Medium-Sized Enterprises (2003/361/EC). Off. J. Eur. Union 2003, L124, 36–41. [Google Scholar]
- Rios, A.J.; Nogal, M.; Plevris, V.; Ramirez, R.; Petrou, M.L. Towards Enhanced Built Cultural Heritage Conservation Practices: Perceptions on Industry 5.0 Principles and Enabling Technologies. Hist. Environ. Policy Pract. 2024, 15, 466–492. [Google Scholar] [CrossRef] [Scilit]
- Ruso, J.; Milosevic, I.; Stojanovic, A.; Glogovac, M.; Rakic, A.; Arsic, S. Regional Variations in Digital Transformation: The Impact of Industry 5.0 on Business Quality Performance. Total Qual. Manag. Bus. Excell. 2024, 35, 1879–1899. [Google Scholar] [CrossRef] [Scilit]
- Lee, R. The Effect of Supply Chain Management Strategy on Operational and Financial Performance. Sustainability 2021, 13, 5138. [Google Scholar] [CrossRef] [Scilit]
- Teixeira, P.; Coelho, A.; Fontoura, P.; Sá, J.C.; Silva, F.J.G.; Santos, G.; Ferreira, L.P. Combining Lean and Green Practices to Achieve a Superior Performance: The Contribution for a Sustainable Development and Competitiveness—An Empirical Study on the Portuguese Context. Corp. Soc. Responsib. Environ. Manag. 2022, 29, 887–903. [Google Scholar] [CrossRef] [Scilit]
- Chyung, S.Y.Y.; Roberts, K.; Swanson, I.; Hankinson, A. Evidence-Based Survey Design: The Use of a Midpoint on the Likert Scale. Perform. Improv. 2017, 56, 15–23. [Google Scholar] [CrossRef] [Scilit]
- Taherdoost, H. What Is the Best Response Scale for Survey and Questionnaire Design; Review of Different Lengths of Rating Scale/Attitude Scale/Likert Scale. Int. J. Acad. Res. Manag. 2019, 8, 1–10. [Google Scholar]
- Armstrong, J.S.; Overton, T.S. Estimating Nonresponse Bias in Mail Surveys. J. Mark. Res. 1977, 14, 396–402. [Google Scholar] [CrossRef] [Scilit]
- Marôco, J. Análise de Equações Estruturais: Fundamentos Teóricos, Software & Aplicações; ReportNumber: Pêro Pinheiro, Portugal, 2010. [Google Scholar]
- Kline, R.B. Data Preparation and Psychometrics Review. In Principles and Practice of Structural Equation Modeling, 4th ed.; The Guilford Press: New York, NY, USA, 2016; pp. 64–96. [Google Scholar]
- Howard, M.C. A Review of Exploratory Factor Analysis Decisions and Overview of Current Practices: What We Are Doing and How Can We Improve? Int. J. Hum.-Comput. Interact. 2016, 32, 51–62. [Google Scholar] [CrossRef] [Scilit]
- Naseer, M.; Ashfaq, M.; Hassan, S.; Abbas, A.; Razzaq, A.; Mehdi, M.; Ariyawardana, A.; Anwar, M. Critical Issues at the Upstream Level in Sustainable Supply Chain Management of Agri-Food Industries: Evidence from Pakistan’s Citrus Industry. Sustainability 2019, 11, 1326. [Google Scholar] [CrossRef] [Scilit]
- Field, A. Discovering Statistics Using IBM SPSS Statistics, 4th ed.; SAGE Publications: London, UK, 2013. [Google Scholar]
- Cronbach, L.J. Coefficient Alpha and the Internal Structure of Tests. Psychometrika 1951, 16, 297–334. [Google Scholar] [CrossRef] [Scilit]
- Nunnally, J.C. Psychometric Theory, 2nd ed.; McGraw-Hill: New York, NY, USA, 1978. [Google Scholar]
- Robinson, J.P.; Shaver, P.R.; Wrightsman, L.S. Criteria for Scale Selection and Evaluation. In Measures of Personality and Social Psychological Attitudes; Robinson, J.P., Shaver, P.R., Wrightsman, L.S., Eds.; Academic Press: San Diego, CA, USA, 1991; pp. 1–15. [Google Scholar] [CrossRef] [Scilit]
- Marôco, J. Análise Estatística com o SPSS Statistics, 8th ed.; ReportNumber: Pêro Pinheiro, Portugal, 2021. [Google Scholar]
- Kaiser, H.F. An Index of Factorial Simplicity. Psychometrika 1974, 39, 31–36. [Google Scholar] [CrossRef] [Scilit]
- Jackson, D.L.; Gillaspy, J.A.; Purc-Stephenson, R. Reporting Practices in Confirmatory Factor Analysis: An Overview and Some Recommendations. Psychol. Methods 2009, 14, 6–23. [Google Scholar] [CrossRef] [Scilit] [PubMed]
- Schreiber, J.B. Core Reporting Practices in Structural Equation Modeling. Res. Soc. Adm. Pharm. 2008, 4, 83–97. [Google Scholar] [CrossRef] [Scilit] [PubMed]
- Xia, Y.; Yang, Y. RMSEA, CFI, and TLI in Structural Equation Modeling with Ordered Categorical Data: The Story They Tell Depends on the Estimation Methods. Behav. Res. Methods 2019, 51, 409–428. [Google Scholar] [CrossRef] [Scilit] [PubMed]
- Hu, L.; Bentler, P.M. Cutoff criteria for fit indexes in covariance structure analysis. Struct. Equ. Model. 1999, 6, 1–55. [Google Scholar] [CrossRef] [Scilit]
- Farrell, A.M.; Rudd, J.M. Factor Analysis and Discriminant Validity: A Brief Review of Some Practical Issues. In Proceedings of the Australian and New Zealand Marketing Academy Conference (ANZMAC 2009), Melbourne, Australia, 30 November–2 December 2009; Tojib, D., Ed.; ANZMAC: Melbourne, Australia, 2009. [Google Scholar]
- Fornell, C.; Larcker, D.F. Evaluating Structural Equation Models with Unobservable Variables and Measurement Error. J. Mark. Res. 1981, 18, 39–50. [Google Scholar] [CrossRef] [Scilit]
- Henseler, J.; Ringle, C.M.; Sarstedt, M. A new criterion for assessing discriminant validity in variance-based structural equation modeling. J. Acad. Mark. Sci. 2015, 43, 115–135. [Google Scholar] [CrossRef] [Scilit]
- Podsakoff, P.M.; MacKenzie, S.B.; Lee, J.-Y.; Podsakoff, N.P. Common method biases in behavioral research: A critical review of the literature and recommended remedies. J. Appl. Psychol. 2003, 88, 879–903. [Google Scholar] [CrossRef] [Scilit] [PubMed]
- Williams, L.J.; Cote, J.A.; Buckley, M.R. Lack of method variance in self-reported affect and perceptions at work: Reality or artifact? J. Appl. Psychol. 1989, 74, 462–468. [Google Scholar] [CrossRef]
- Preacher, K.J.; Selig, J.P. Advantages of Monte Carlo confidence intervals for indirect effects. Commun. Methods Meas. 2012, 6, 77–98. [Google Scholar] [CrossRef] [Scilit]
- Dias, A.M.; Carvalho, A.M.; Sampaio, P. Quality 4.0: Literature Review Analysis, Definition and Impacts of the Digital Transformation Process on Quality. Int. J. Qual. Reliab. Manag. 2022, 39, 1312–1335. [Google Scholar] [CrossRef] [Scilit]
- Grieves, M. Digital Twin Certified: Employing Virtual Testing of Digital Twins in Manufacturing to Ensure Quality Products. Machines 2023, 11, 808. [Google Scholar] [CrossRef] [Scilit]
- Sony, M.; Antony, J.; Douglas, J.A.; McDermott, O. Motivations, Barriers and Readiness Factors for Quality 4.0 Implementation: An Exploratory Study. TQM J. 2021, 33, 1502–1515. [Google Scholar] [CrossRef] [Scilit]
- Cagno, E.; Accordini, D.; Neri, A.; Negri, E.; Macchi, M. Digital Solutions for Workplace Safety: An Empirical Study on Their Adoption in Italian Metalworking SMEs. Saf. Sci. 2024, 177, 106598. [Google Scholar] [CrossRef] [Scilit]
- Dwivedi, A.; Agrawal, D.; Jha, A.; Mathiyazhagan, K. Studying the Interactions among Industry 5.0 and Circular Supply Chain: Towards Attaining Sustainable Development. Comput. Ind. Eng. 2023, 176, 108927. [Google Scholar] [CrossRef] [Scilit]
- Khoshsepehr, Z.; Alinejad, S.; Salari, L. Enhancing Organizational Quality Management in Industry 5.0 through Smart Technologies and Decomposed Fuzzy Methods. Int. J. Qual. Reliab. Manag. 2025, 42, 2815–2841. [Google Scholar] [CrossRef] [Scilit]

Disclaimer/Publisher’s Note: The statements, opinions and data contained in all publications are solely those of the individual author(s) and contributor(s) and not of MDPI and/or the editor(s). MDPI and/or the editor(s) disclaim responsibility for any injury to people or property resulting from any ideas, methods, instructions or products referred to in the content. |
© 2026 by the authors. Licensee MDPI, Basel, Switzerland. This article is an open access article distributed under the terms and conditions of the Creative Commons Attribution (CC BY) license.