


Abstract
Soil microorganisms play an important role in regulating carbon and nutrient cycling in mountain grasslands. However, whether microbial nutrient limitation and carbon use efficiency (CUE) follow similar elevation patterns across plant communities remains unclear. To this end, we measured soil physicochemical properties, microbial biomass and extracellular enzyme activities in Sophora alopecuroides-dominated (SC) and grass-dominated (GC) communities in the Tuhulasu grassland, Xinjiang, each sampled at three elevation bands, and calculated CUE using a stoichiometric model. Results showed that soil organic carbon increased along both sequences, while microbial biomass and enzyme activities showed element-specific patterns. Mean vector length peaked at 1500 m in both communities, whereas mean vector angle peaked at 1300 m in SC and 1800 m in GC, indicating the highest relative P-acquisition signal within each sampled elevation sequence. Total-pool CUE declined across both sequences; extract-based CUE declined in SC but varied little among GC means. Soil properties were associated with these indicators in the overall RDA. This study revealed that relative C- and P-acquisition signals peaked at different elevations, while modelled CUE patterns varied between the sampled elevation sequences and resource inputs. Vegetation context and resource-pool definition should therefore be considered when interpreting nutrient-acquisition indicators and modelled CUE for soil monitoring that informs sustainable grassland management.
1. Introduction
Soil heterotrophic microorganisms rely on organic carbon (C), whereas plants obtain most of their C by fixing atmospheric CO2 [1]. Extracellular enzymes help microorganisms acquire C, nitrogen (N) and phosphorus (P) from organic substrates, and their relative activities provide indicators of organic nutrient acquisition [2,3]. Interpretation of these C:N:P-based enzyme indicators should also consider inorganic nutrient supply and the potential influence of other nutrients. For example, soil P availability is also influenced by orthophosphate sorption and desorption [4], and sulfur (S) limitation can affect microbial biomass and enzyme activity [5]. Nutrient acquisition is linked to microbial C allocation, and carbon use efficiency (CUE) describes the fraction of assimilated C allocated to growth [1]. Nutrient supply can alter microbial C metabolism and soil C release [6], but longer-term C storage also depends on mineral association and physical protection of organic matter [7]. Chemical and biochemical reactions can also transform organic residues and their decomposition products into new organic compounds, including humic substances [8]. Alongside enzyme activities and modelled CUE, microbial biomass C, N and P provide complementary information about the size and elemental composition of microbial pools [9,10]. Understanding microbial contributions to grassland C and nutrient cycling therefore requires examining how resource pools, nutrient acquisition and carbon use vary together across environmental and vegetation contexts. Such comparisons can inform the interpretation of soil indicators used in monitoring for sustainable mountain-grassland management. However, it remains unclear whether soil organic C concentration, potential nutrient-acquiring enzyme activities and modelled CUE provide concordant information across elevation and vegetation contexts.
Elevation integrates variation in soil moisture, temperature, vegetation and resources across mountain landscapes [11], but microbial responses differ among ecosystems. On the eastern Qinghai–Tibetan Plateau, the highest elevation combined the lowest phospholipid-fatty-acid-based biomass with the highest nutrient-acquiring enzyme activities [12]. Enzyme-based indices indicated increasing N limitation in the Qinling Mountains [13], whereas P limitation predominated in the Bayinbuluk grasslands of Xinjiang [14]. Relative P limitation in Yulong Snow Mountain increased with elevation in wet seasons but followed a unimodal pattern in dry seasons [15]. In the Helan Mountains, CUE was highest at high elevation on sunny slopes [16]. These studies show that an elevation gradient alone does not specify a common microbial response. Comparisons within plant communities, together with comparisons between communities at a shared elevation, can clarify whether microbial biomass, nutrient acquisition and CUE follow corresponding spatial patterns.
Interpreting these comparisons also requires distinguishing the amount of microbial activity from its relative allocation and modelled consequences. Plant communities at the same elevation can differ in soil resources and microbial elemental composition, and variation in microbial C:N:P among soils is well established [10]. Proportional increases in C-, N- and P-acquiring enzyme activities leave their ratios unchanged, so greater absolute activity need not indicate a different relative nutrient-acquisition profile. Stoichiometric CUE models further combine enzyme, microbial-biomass and resource ratios [17]. They describe resource-use constraints rather than directly measured physiological carbon allocation [18]. Bulk and extractable nutrient pools represent different parts of the resource environment, and neither fully captures substrates accessible to microbes [19]. A paired comparison of these inputs can therefore establish whether an apparent elevation or community pattern in modelled CUE depends on how the resource pool is defined.
The Tuhulasu grassland in the western Tianshan Mountains contains Sophora alopecuroides-dominated communities (SC) and grass-dominated communities (GC) along partly overlapping elevation sequences; the dominant legume in SC is native to Xinjiang [20]. A regional study examined soil nutrients and labile C in relation to Sophora dominance and elevation [21], providing a basis for extending the comparison to microbial nutrient acquisition and modelled CUE. We analysed 60 plot-level composite samples from six elevation–community combinations, with three elevation bands per community and a shared comparison at 1500 m. We asked: (1) How do microbial biomass, absolute enzyme activities and relative nutrient acquisition vary across elevations within each community, and which differences occur between communities at 1500 m? (2) Do modelled CUE patterns correspond to these microbial patterns, and does their interpretation change between total-pool and hybrid extract-based resource inputs? (3) Which soil properties are most strongly associated with the combined nutrient-limitation and CUE indicators across the sampled elevation–community combinations? These comparisons link the observed elevation and community patterns to resource stoichiometry while explicitly evaluating the sensitivity of CUE interpretation to resource definition.
2. Materials and Methods
2.1. Study Area and Sample Collection
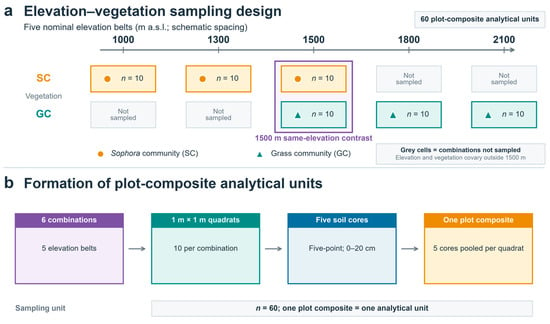
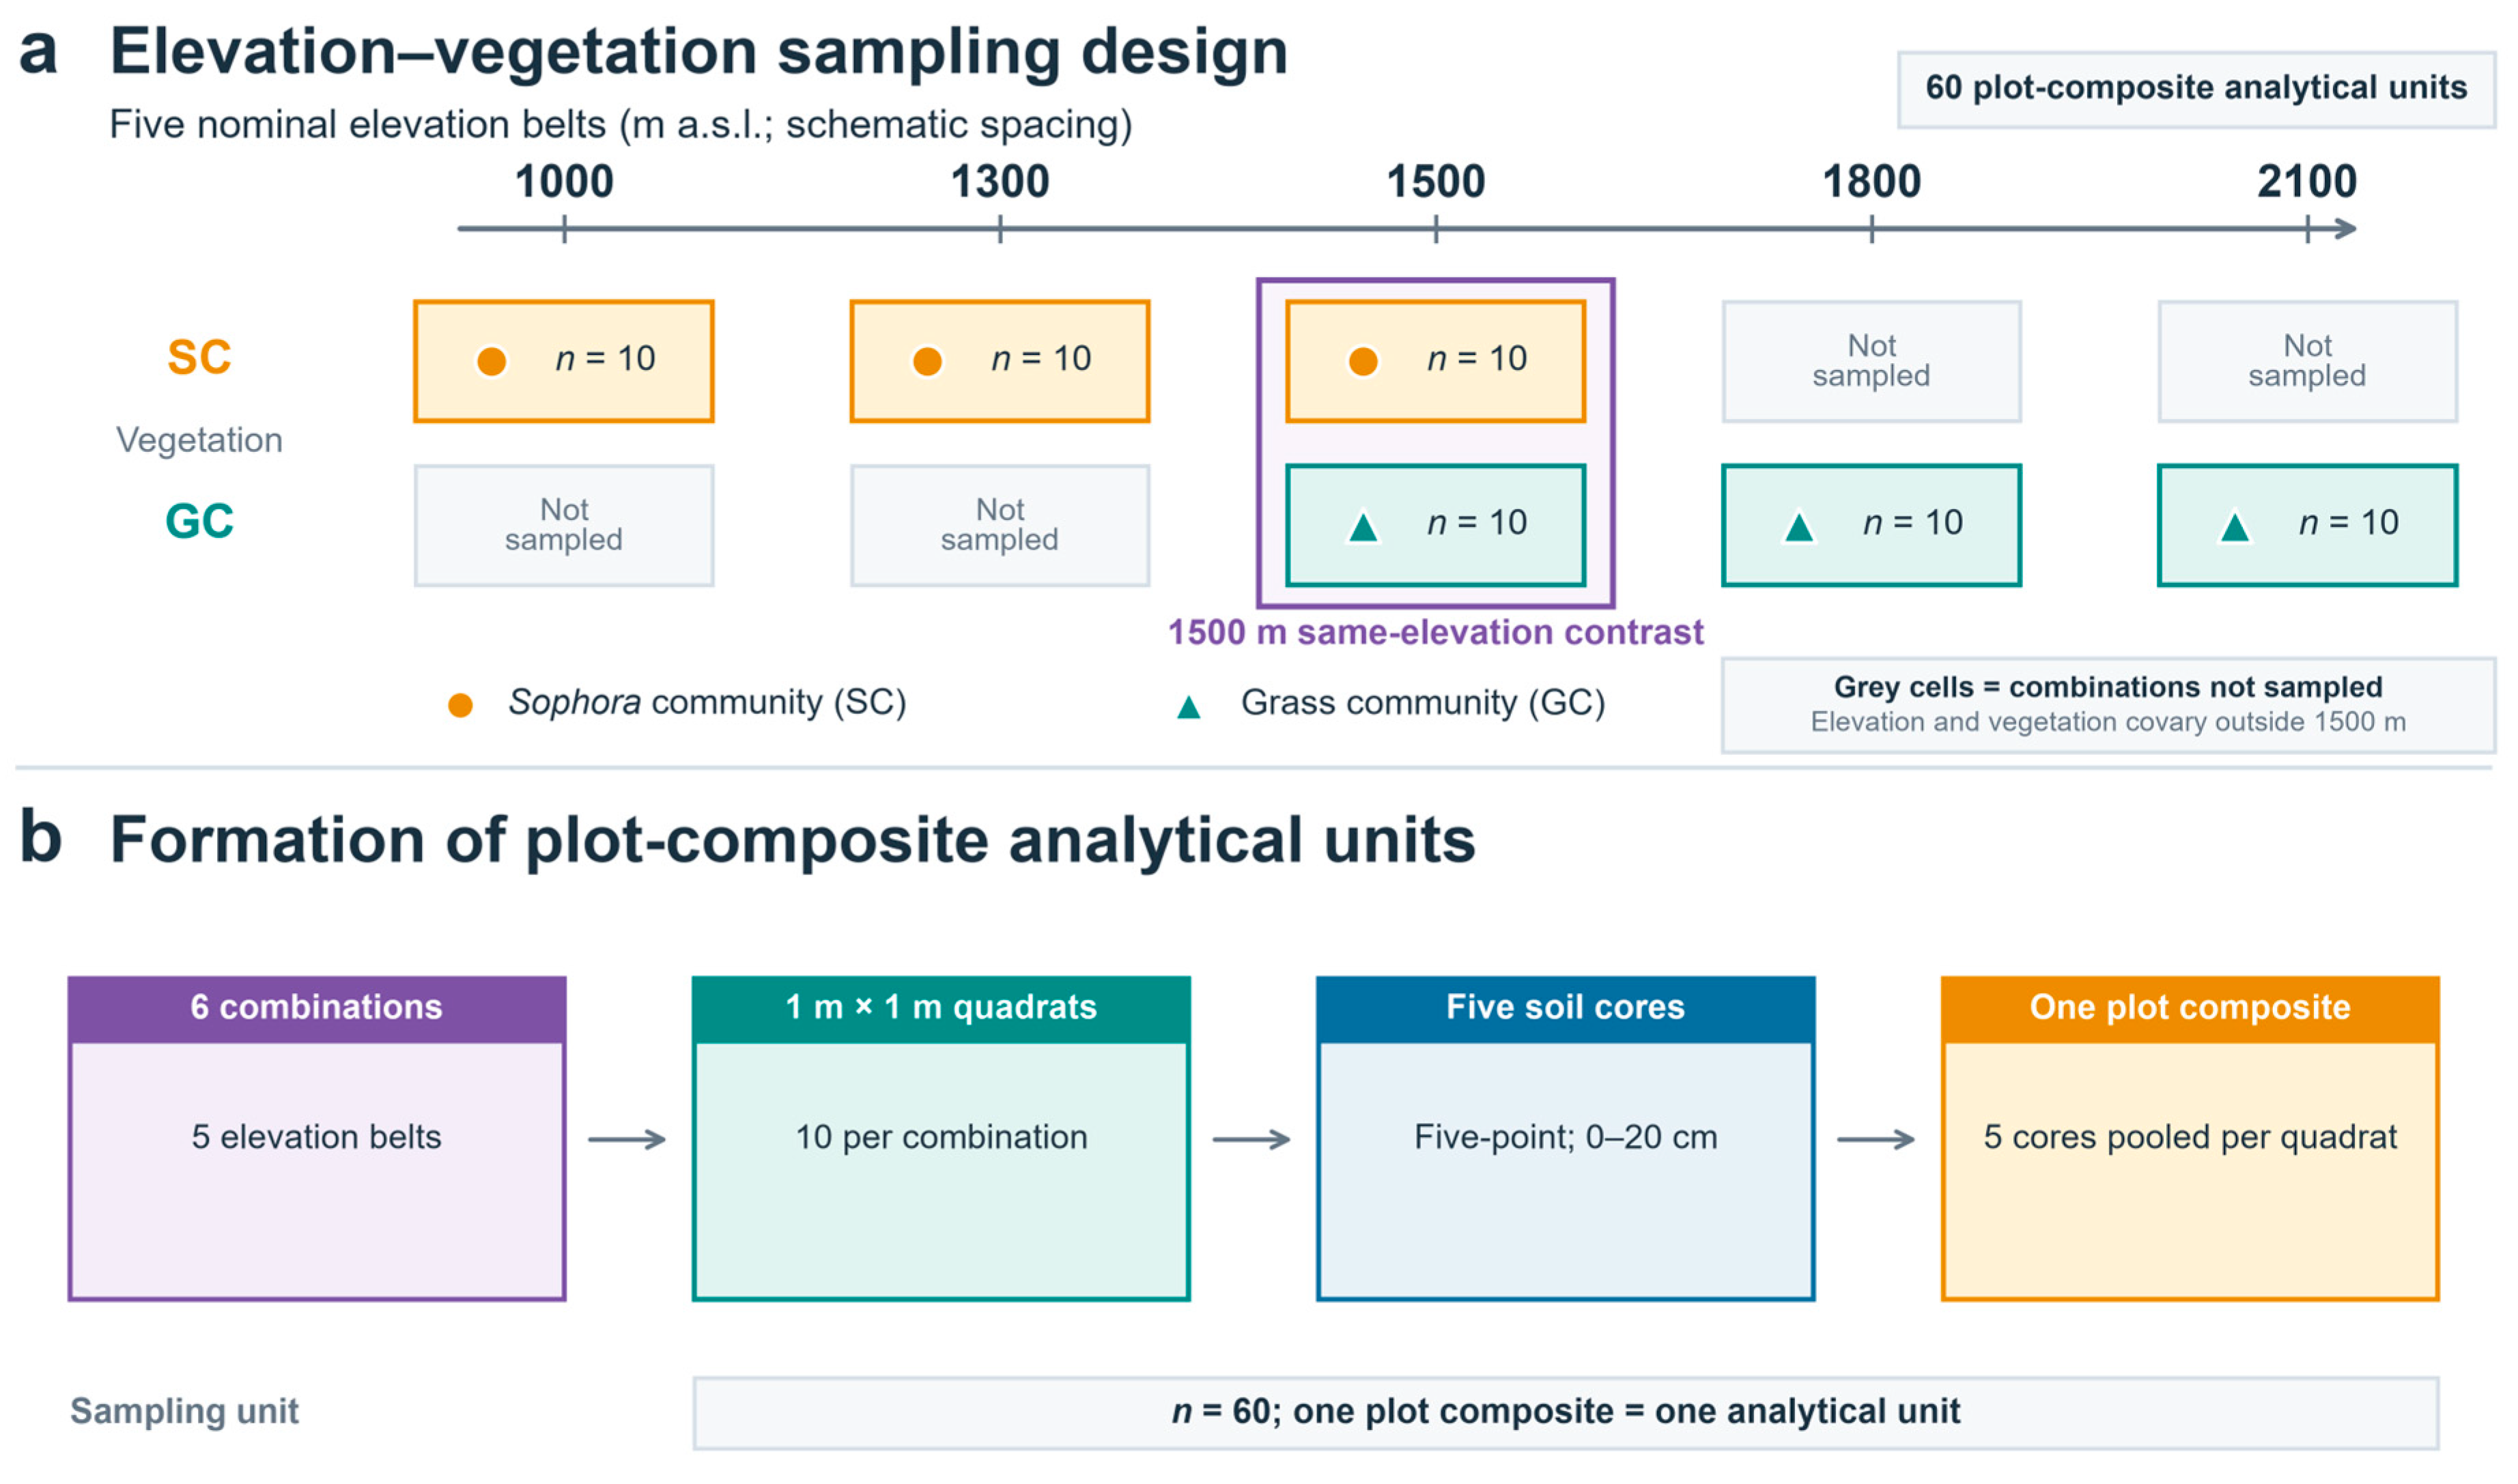
The study was conducted in the Tuhulasu grassland (44°12′26″ N, 81°52′29″ E), Ili Kazakh Autonomous Prefecture, Xinjiang, China, approximately 40 km from Yining City. The region has a mean annual temperature of approximately 9 °C, annual precipitation of 340 mm and annual potential evaporation of 1621 mm [21]. Sampling elevations were selected according to the distribution of the dominant community types in the study area. Sophora alopecuroides-dominated communities (SC) were sampled at 1000, 1300 and 1500 m, and grass-dominated communities (GC) at 1500, 1800 and 2100 m, giving six elevation–community combinations (Figure 1). SC and GC were classified according to the dominant vegetation observed at each sampling site.
Figure 1.
Sampling design. (a) Elevation–community combinations. Orange and teal indicate SC and GC, respectively; grey cells indicate unsampled combinations, and the purple outline highlights the comparison between SC and GC at 1500 m. (b) Formation of a plot-level composite sample.
In August 2024, ten 1 m × 1 m quadrats were sampled within each sampling group along the same elevation belt. Quadrat coordinates and horizontal distances between consecutive points ordered by longitude (18.65–161.47 m) are provided in Table S4. Five soil cores were collected from the 0–20 cm layer in each quadrat using a five-point pattern and pooled into one composite sample, yielding 60 composite samples in total. Samples were transported to the laboratory in insulated boxes with ice packs and stored at 4 °C until analysis. Visible roots and gravel were removed, and all samples were passed through a 2 mm sieve. One fresh subsample was used for microbial biomass and extracellular enzyme assays, and another was air-dried for soil physicochemical measurements [22]. Fresh-soil measurements were expressed on an oven-dry soil-mass basis using concurrently measured soil moisture.
2.2. Measurements of Soil Physicochemical Properties
Soil moisture content (SMC, %) was determined by drying at 105 °C to constant mass. Soil pH and electrical conductivity (EC, μS cm−1) were measured in 1:2.5 and 1:5 soil:water suspensions using a calibrated pH meter (FE28, Mettler Toledo, Shanghai, China) [23] and conductivity meter (DDSJ-307F, INESA, Shanghai, China) [24], respectively. Both suspensions used deionised water and were shaken for 30 min.
SOC was determined by potassium dichromate oxidation [25], TN by the Kjeldahl method using a nitrogen analyser (KDY-9820, Tongrunyuan, Beijing, China) [26], and TP by acid digestion followed by molybdenum–antimony colourimetry [22]. SOC, TN and TP were expressed in g kg−1. NH4+-N and NO3−-N were extracted from air-dried soil with 2 mol L−1 KCl at 1:5 (w:v), shaken for 60 min, filtered and measured by continuous-flow analysis [27]. Concentrations were expressed on an oven-dry-soil basis. Extraction-defined C, N and P fractions used in the CUE comparison were obtained alongside microbial biomass measurements (Section 2.3).
2.3. Microbial Biomass and Extracellular Enzyme Assays
Microbial biomass C (MBC), N (MBN) and P (MBP) were measured by chloroform fumigation–extraction [28,29,30]. For MBC and MBN, fresh soil equivalent to 25 g dry soil was fumigated with ethanol-free chloroform for 24 h at 25 °C in darkness. Fumigated and matched non-fumigated samples were extracted with 100 mL of 0.5 mol L−1 K2SO4 for 30 min and filtered. Extract C and N were quantified with a total organic carbon–total nitrogen analyser (multi N/C 3100, Analytik Jena, Jena, Germany). MBC = (Cf − Cnf)/kEC and MBN = (Nf − Nnf)/kEN, where kEC = 0.45 and kEN = 0.54 [31,32]; f and nf denote fumigated and non-fumigated extracts. Organic C and total N in the non-fumigated extracts were defined as extractable organic C (EOC) and extractable total N (ETN), respectively [23].
MBP was determined under the same fumigation conditions using fresh soil equivalent to 5 g dry soil. Fumigated and matched non-fumigated samples were extracted with 100 mL of 0.5 mol L−1 NaHCO3 (pH 8.5) for 30 min and filtered; inorganic P was determined colourimetrically [28]. A non-fumigated subsample spiked with 25 mg P kg−1 as KH2PO4 estimated the recovery fraction RP (0–1); MBP = [(Pf − Pnf)/RP]/kEP, with kEP = 0.40. Inorganic P in the non-fumigated NaHCO3 extract was defined as EP [23]. EP was measured in fresh soil with a protocol distinct from Olsen P and is retained under its own operational definition.
Potential activities of CBH, BG, NAG, LAP and alkaline phosphatase (ALP) were measured fluorometrically. MUB-labelled substrates were used for CBH, BG, NAG and ALP following Han et al. [33], whereas an AMC-labelled substrate was used for LAP [34].
For the CBH, BG, NAG, LAP and ALP assays, fresh soil (1.25 g) was mixed with 125 mL of 50 mmol L−1 Tris buffer (pH 8.30) and shaken at 25 °C for 20 min. Samples were incubated with the corresponding substrates in black 96-well microplates at 25 °C in the dark for 3 h. Negative controls, reference standards, blank controls and quenching controls were included. Reactions were terminated by adding 20 μL NaOH, and fluorescence was measured using a microplate reader (Infinite M200 PRO, Tecan, Männedorf, Switzerland) at excitation and emission wavelengths of 365 and 450 nm, respectively. BX was assayed fluorometrically using a MUB-labelled substrate [34]. Hydrolytic enzyme activities were calculated from MUB or AMC calibration curves and expressed as nmol g−1 h−1.
PPO and POD were measured colourimetrically in transparent 96-well microplates using L-DOPA. Activities were normalised by incubation time and dry soil mass and expressed as nmol g−1 h−1. All reported activities represent potential enzyme activities under the specified laboratory conditions rather than in situ reaction rates.
2.4. Assessment of Microbial Nutrient Limitation and Carbon Use Efficiency
C-, N- and P-acquiring activities were grouped as EEC = CBH + BG, EEN = NAG + LAP and EEP = ALP, respectively. EEP represents the potential alkaline phosphatase activity measured at pH 8.30. Activities in common units were used without transformation in the stoichiometric calculations, avoiding the unit dependence of ratios of log-transformed activities [35]. BX, POD and PPO were retained as auxiliary activities and excluded from the enzyme ratios, vector metrics and CUE calculations. Vector length (VL) and angle (VA) were calculated from raw activity proportions using Equations (1) and (2) [36]. They summarise relative C-acquiring activity and the balance of N- and P-acquiring activities. The 45° VA boundary is traditionally used to distinguish microbial N and P limitation [36]. Cui et al. suggested that this boundary may overestimate microbial P limitation and proposed 55° as an alternative threshold [37]. We therefore compared both criteria to assess the sensitivity of classifications to threshold choice. The VL value of 0.61 was additionally evaluated as a C-limitation reference threshold [37].
CUE was calculated with the stoichiometric model in Equations (3)–(5), following Sinsabaugh and Follstad Shah [38] and Sinsabaugh et al. [1,17]. Overall CUE was expressed as the geometric mean of the C:N- and C:P-based estimates [39]:
For X ∈ {N, P}, SC:X denotes the stoichiometric constraint factor, EEAC:N = EEC/EEN, EEAC:P = EEC/EEP, BC:N = MBC/MBN and BC:P = MBC/MBP; LC:X denotes the corresponding nutrient-pool C:X ratio. Total-, extractable- and microbial-biomass C:N:P ratios were calculated for each sample after converting concentrations to molar units, whereas enzyme ratios used activities in common units. Baseline calculations used CUEmax = 0.6 and KX = 0.5 [17,38].
Two nutrient-pool input scenarios were calculated for each sample, following the total- and extractable-pool comparison of D. Sun et al. [40]. CUET used SOC, TN and TP; CUEE used K2SO4-extractable EOC and ETN together with NaHCO3-extractable EP, as defined in Section 2.3. The hybrid inputs provide an extraction-defined resource representation, and neither scenario directly measures microbial growth efficiency [18]. A bounded 3 × 3 grid combined CUEmax values of 0.4, 0.5 and 0.6 with KX values of 0.25, 0.5 and 1.0.
Adapted threshold elemental-ratio (TER) contrasts were calculated for both resource definitions using Equations (6)–(10). This implementation combines the sample-specific TER estimator of Sinsabaugh et al. [17] with the baseline intermediate and contrast structure described by Cui et al. [39]. Amax is the maximum N- or P-assimilation efficiency and was set to 0.9; CUEmax was 0.6. The same parameter values were used for N and P.
TEREEA and TERL denote the enzyme-allocation-linked and resource-adjusted continuous contrasts, respectively; subscripts T and E identify total-pool and hybrid extract-based inputs. To compare sample labels, each contrast was coded as positive or negative relative to an author-specified zero boundary. These signs describe the sides of the corresponding equality and have no independent physiological calibration. None of the samples lay exactly on either TER zero boundary or the 45° and 55° VA boundaries.
The two TER contrasts share algebraic terms: TEREEA = TERC:N/BC:N − TERC:P/BC:P, and TERL = TEREEA + LC:P/BC:P − LC:N/BC:N. The common Amax/CUEmax term cancels from TEREEA. In all 60 samples, both EEC/EEN and EEC/EEP were between zero and one. Under these observed constraints, matching TER signs imply the corresponding VA label at 45°, so three-rule agreement equals TER-pair agreement. Agreement therefore describes the evaluated rules jointly, rather than independent corroboration of a physiological diagnosis.
2.5. Data Analysis
Differences among elevation–community combinations were assessed using Welch ANOVA and Games–Howell comparisons. Communities at 1500 m were compared using Welch t-tests with Holm correction. PCA summarised variation in soil and biological properties; overall RDA examined their associations with nutrient-limitation and CUE indicators, and single-predictor RDA ranked soil factors. Indicator agreement was evaluated using Cohen’s κ [41], with bootstrap resampling for sensitivity analysis. Analyses were performed in R (versions 4.5.0 and 4.6.1), using stats for PCA and vegan (version 2.7-5) for RDA. Significance was set at p < 0.05. Spatial autocorrelation was assessed using Moran’s I with coordinate-based symmetric two-nearest-neighbour weights. Permutation p values were adjusted using the Benjamini–Hochberg procedure across all 41 indicators, separately for each individual sampling group, the pooled analysis and each weighting scheme.
OpenAI Codex (using GPT-6 Astra and GPT-6.1 Sol; OpenAI) was used for language editing, manuscript revision, and reference and analysis checks. The conceptual illustration was prepared with the GPT Image tool in Codex (runtime version 0.158.0-alpha.2). The authors reviewed and edited the outputs and take full responsibility for the content.
3. Results
3.1. Soil Physicochemical Properties
Soil physicochemical properties and nutrient pools differed among the six elevation–community combinations (p < 0.001; Table 1). Within each community, soil moisture peaked at the intermediate belt (1300 m in SC and 1800 m in GC), whereas pH decreased across the three sampled belts. SOC increased across both sequences, while TN increased across SC but did not differ between the two upper GC belts at 1800 and 2100 m (p > 0.05). Mean TP was highest in the 1500 m SC, whereas EOC and EP had their highest means in the 2100 m GC. At the shared 1500 m belt, GC had lower moisture, SOC, TN, TP and EOC but higher pH and NH4+–N than SC (p < 0.05). EC, NO3−–N, ETN and EP did not differ significantly between the two communities at this belt (Supplementary Materials: Table S1).
Table 1.
Soil physicochemical properties and auxiliary enzyme activities.
3.2. Soil Microbial Biomass and Extracellular Enzyme Activities
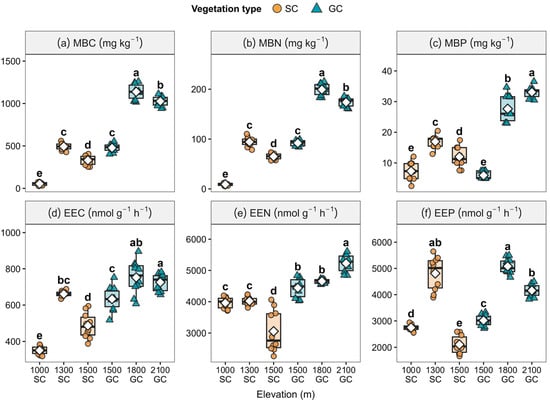
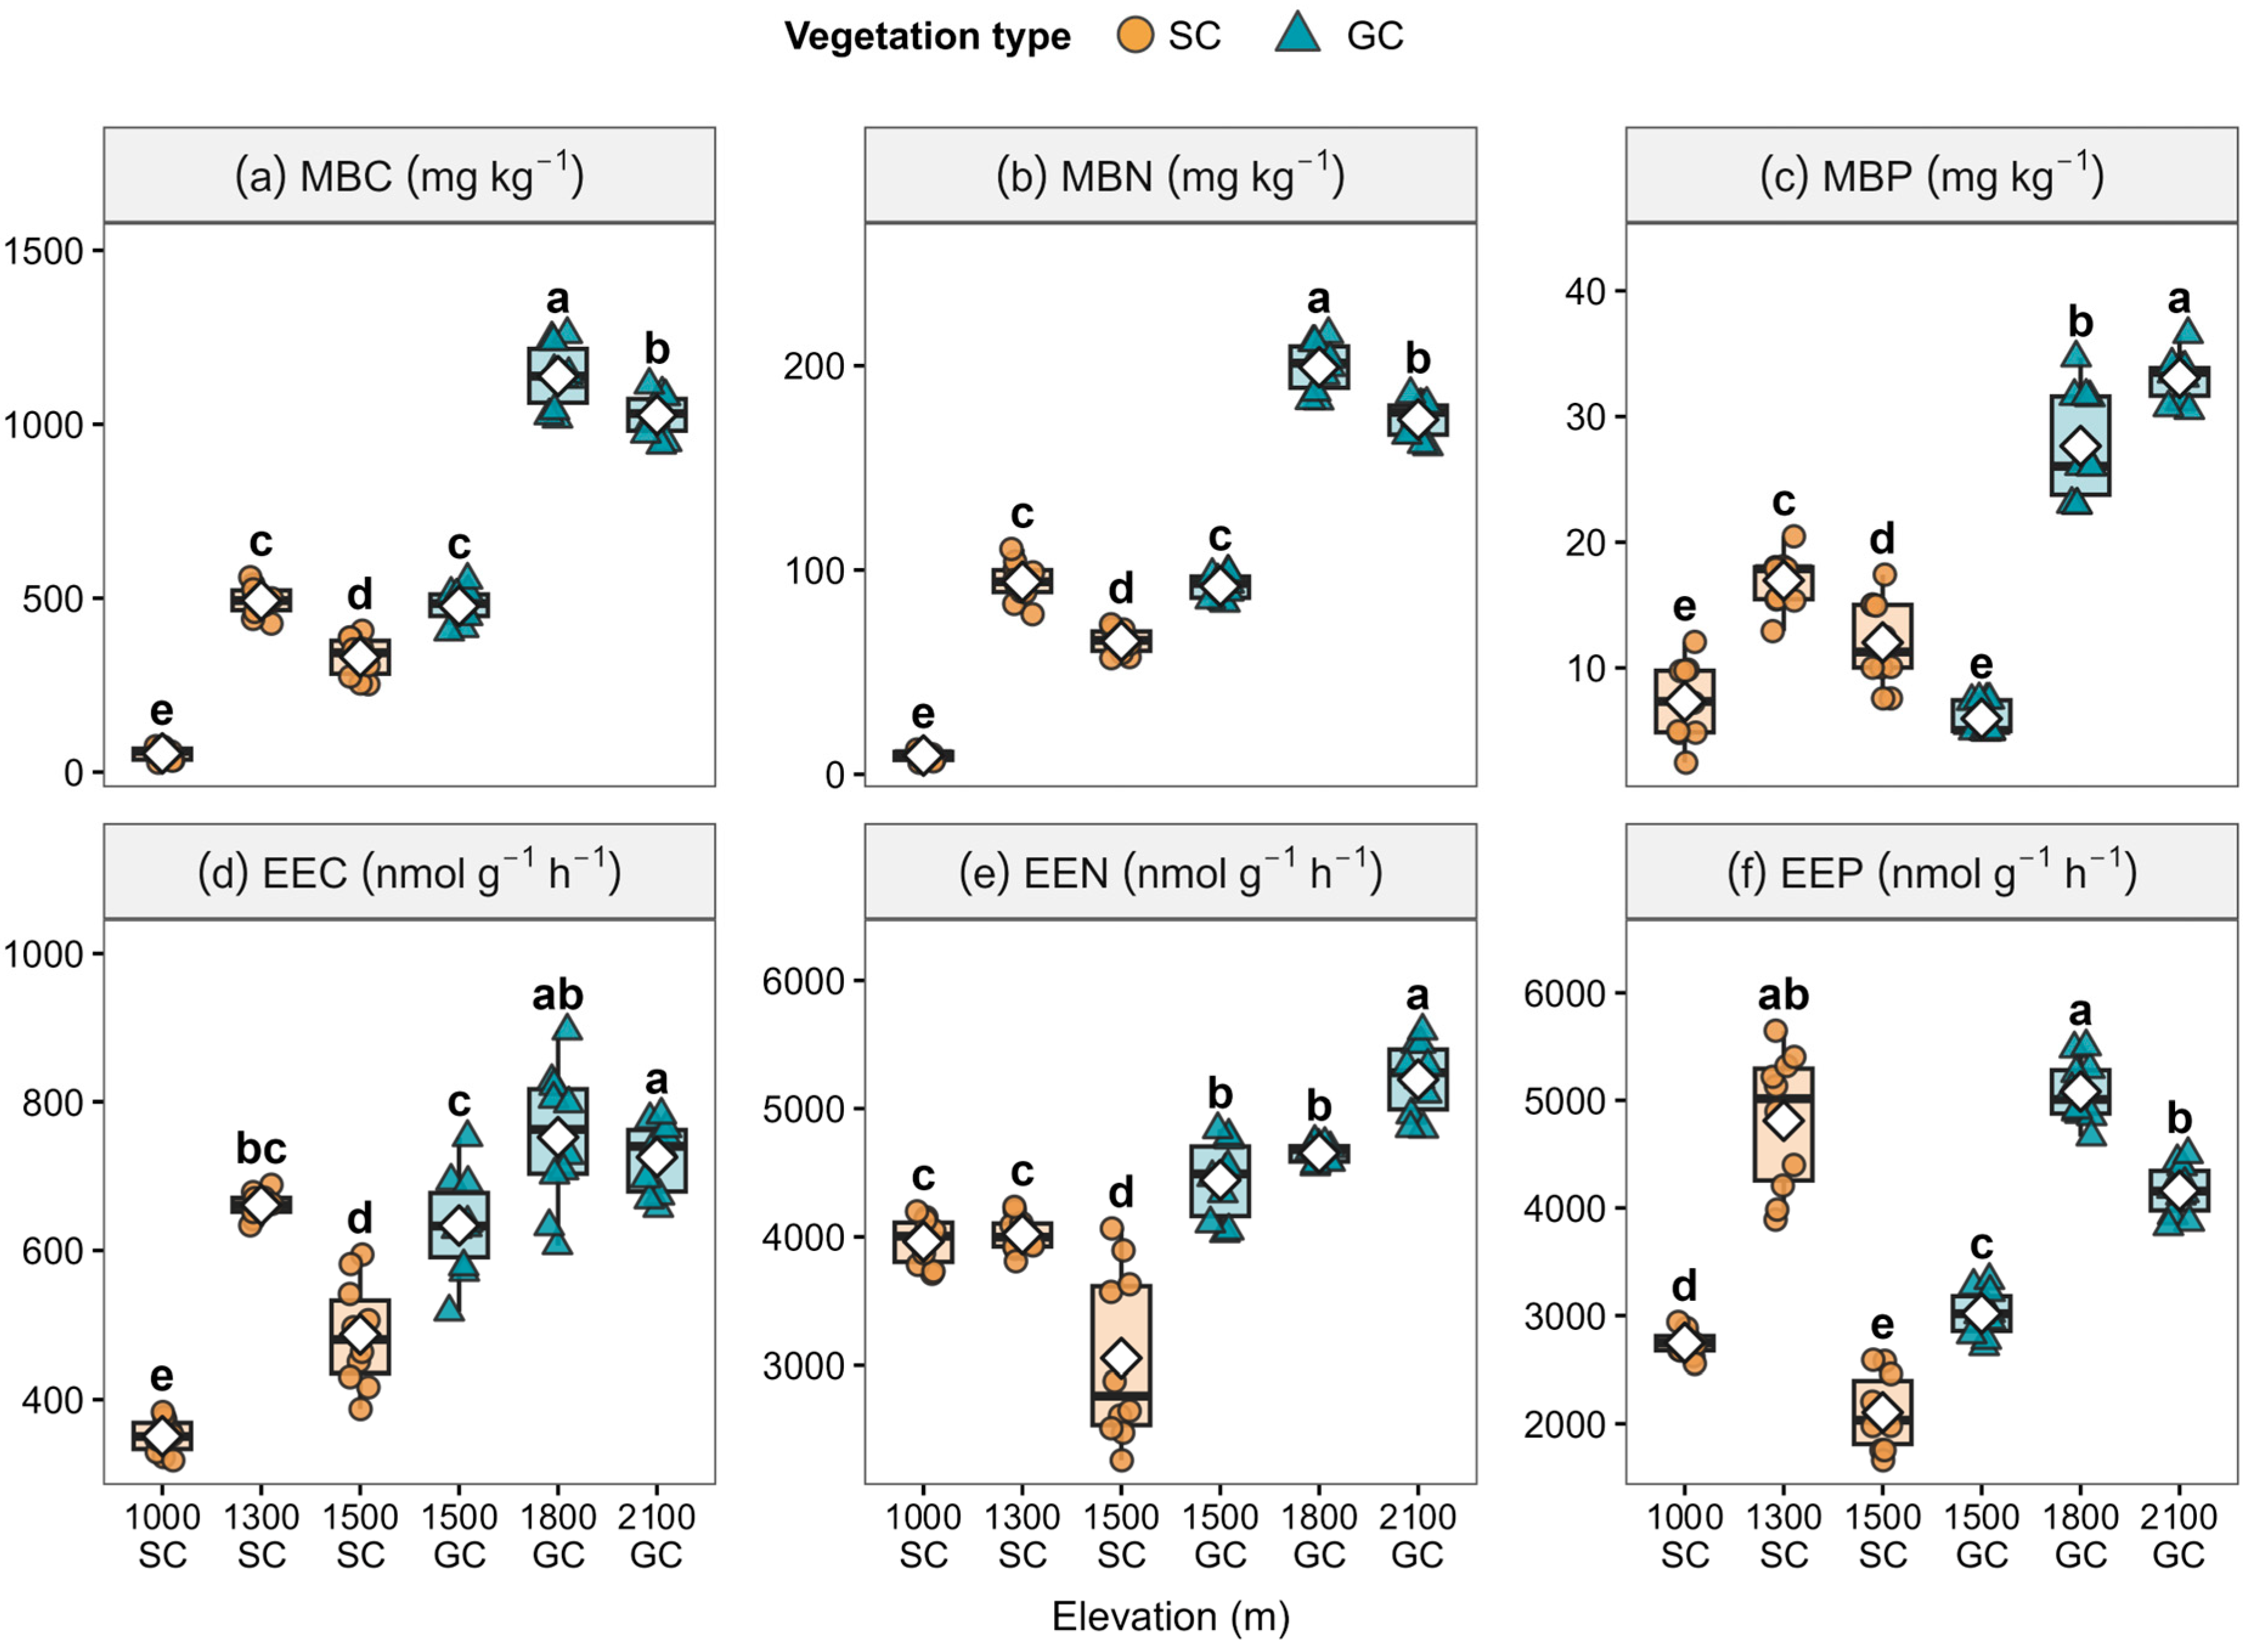
Microbial biomass C, N and P differed among the six combinations (p < 0.001; Figure 2a–c). Across all six combinations, mean MBC and MBN were highest at 1800 m in GC, whereas mean MBP was highest at 2100 m in GC. Within SC, all three biomass pools peaked at 1300 m. Within GC, MBC and MBN decreased from 1800 to 2100 m, while MBP increased across the three sampled belts. At the shared 1500 m belt, GC had 44.3% higher MBC and 41.3% higher MBN, but 50.4% lower MBP than SC (p < 0.005; Supplementary Materials: Table S1).
Figure 2.
Soil microbial biomass (a–c) and extracellular enzyme activities (d–f). Boxes indicate medians and interquartile ranges; whiskers extend to observations within 1.5× the interquartile range. Points represent samples (n = 10); white diamonds indicate means. Lowercase letters (a–e) above the boxes in the figure indicate the results of Games–Howell multiple comparisons. Within each panel, groups with no shared letters differ significantly (p < 0.05). Abbreviations are defined in the Abbreviations section following Section 5.
C-, N- and P-acquiring enzyme activities also differed among the six combinations (p < 0.001; Figure 2d–f). Mean EEC and EEP were highest at 1300 m within SC and at 1800 m within GC, whereas mean EEN was highest at 2100 m in GC across all six combinations. At 1500 m, GC had higher EEC, EEN and EEP than SC by 30.1%, 45.4% and 43.4%, respectively (p < 0.005; Supplementary Materials: Table S1).
3.3. Soil, Microbial Biomass and Ecoenzymatic Stoichiometry
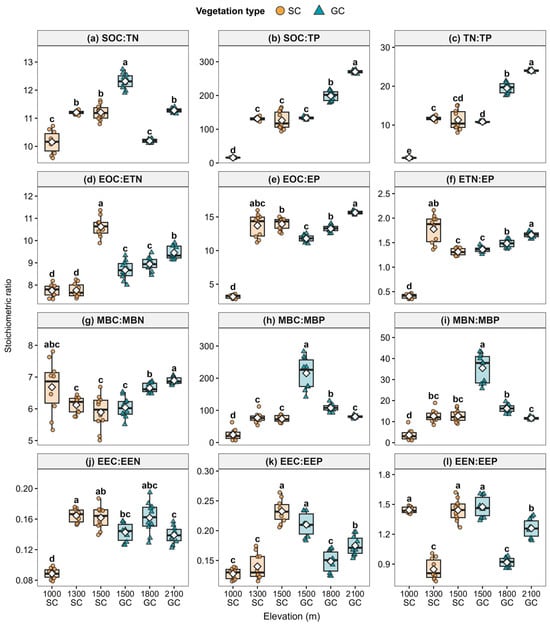
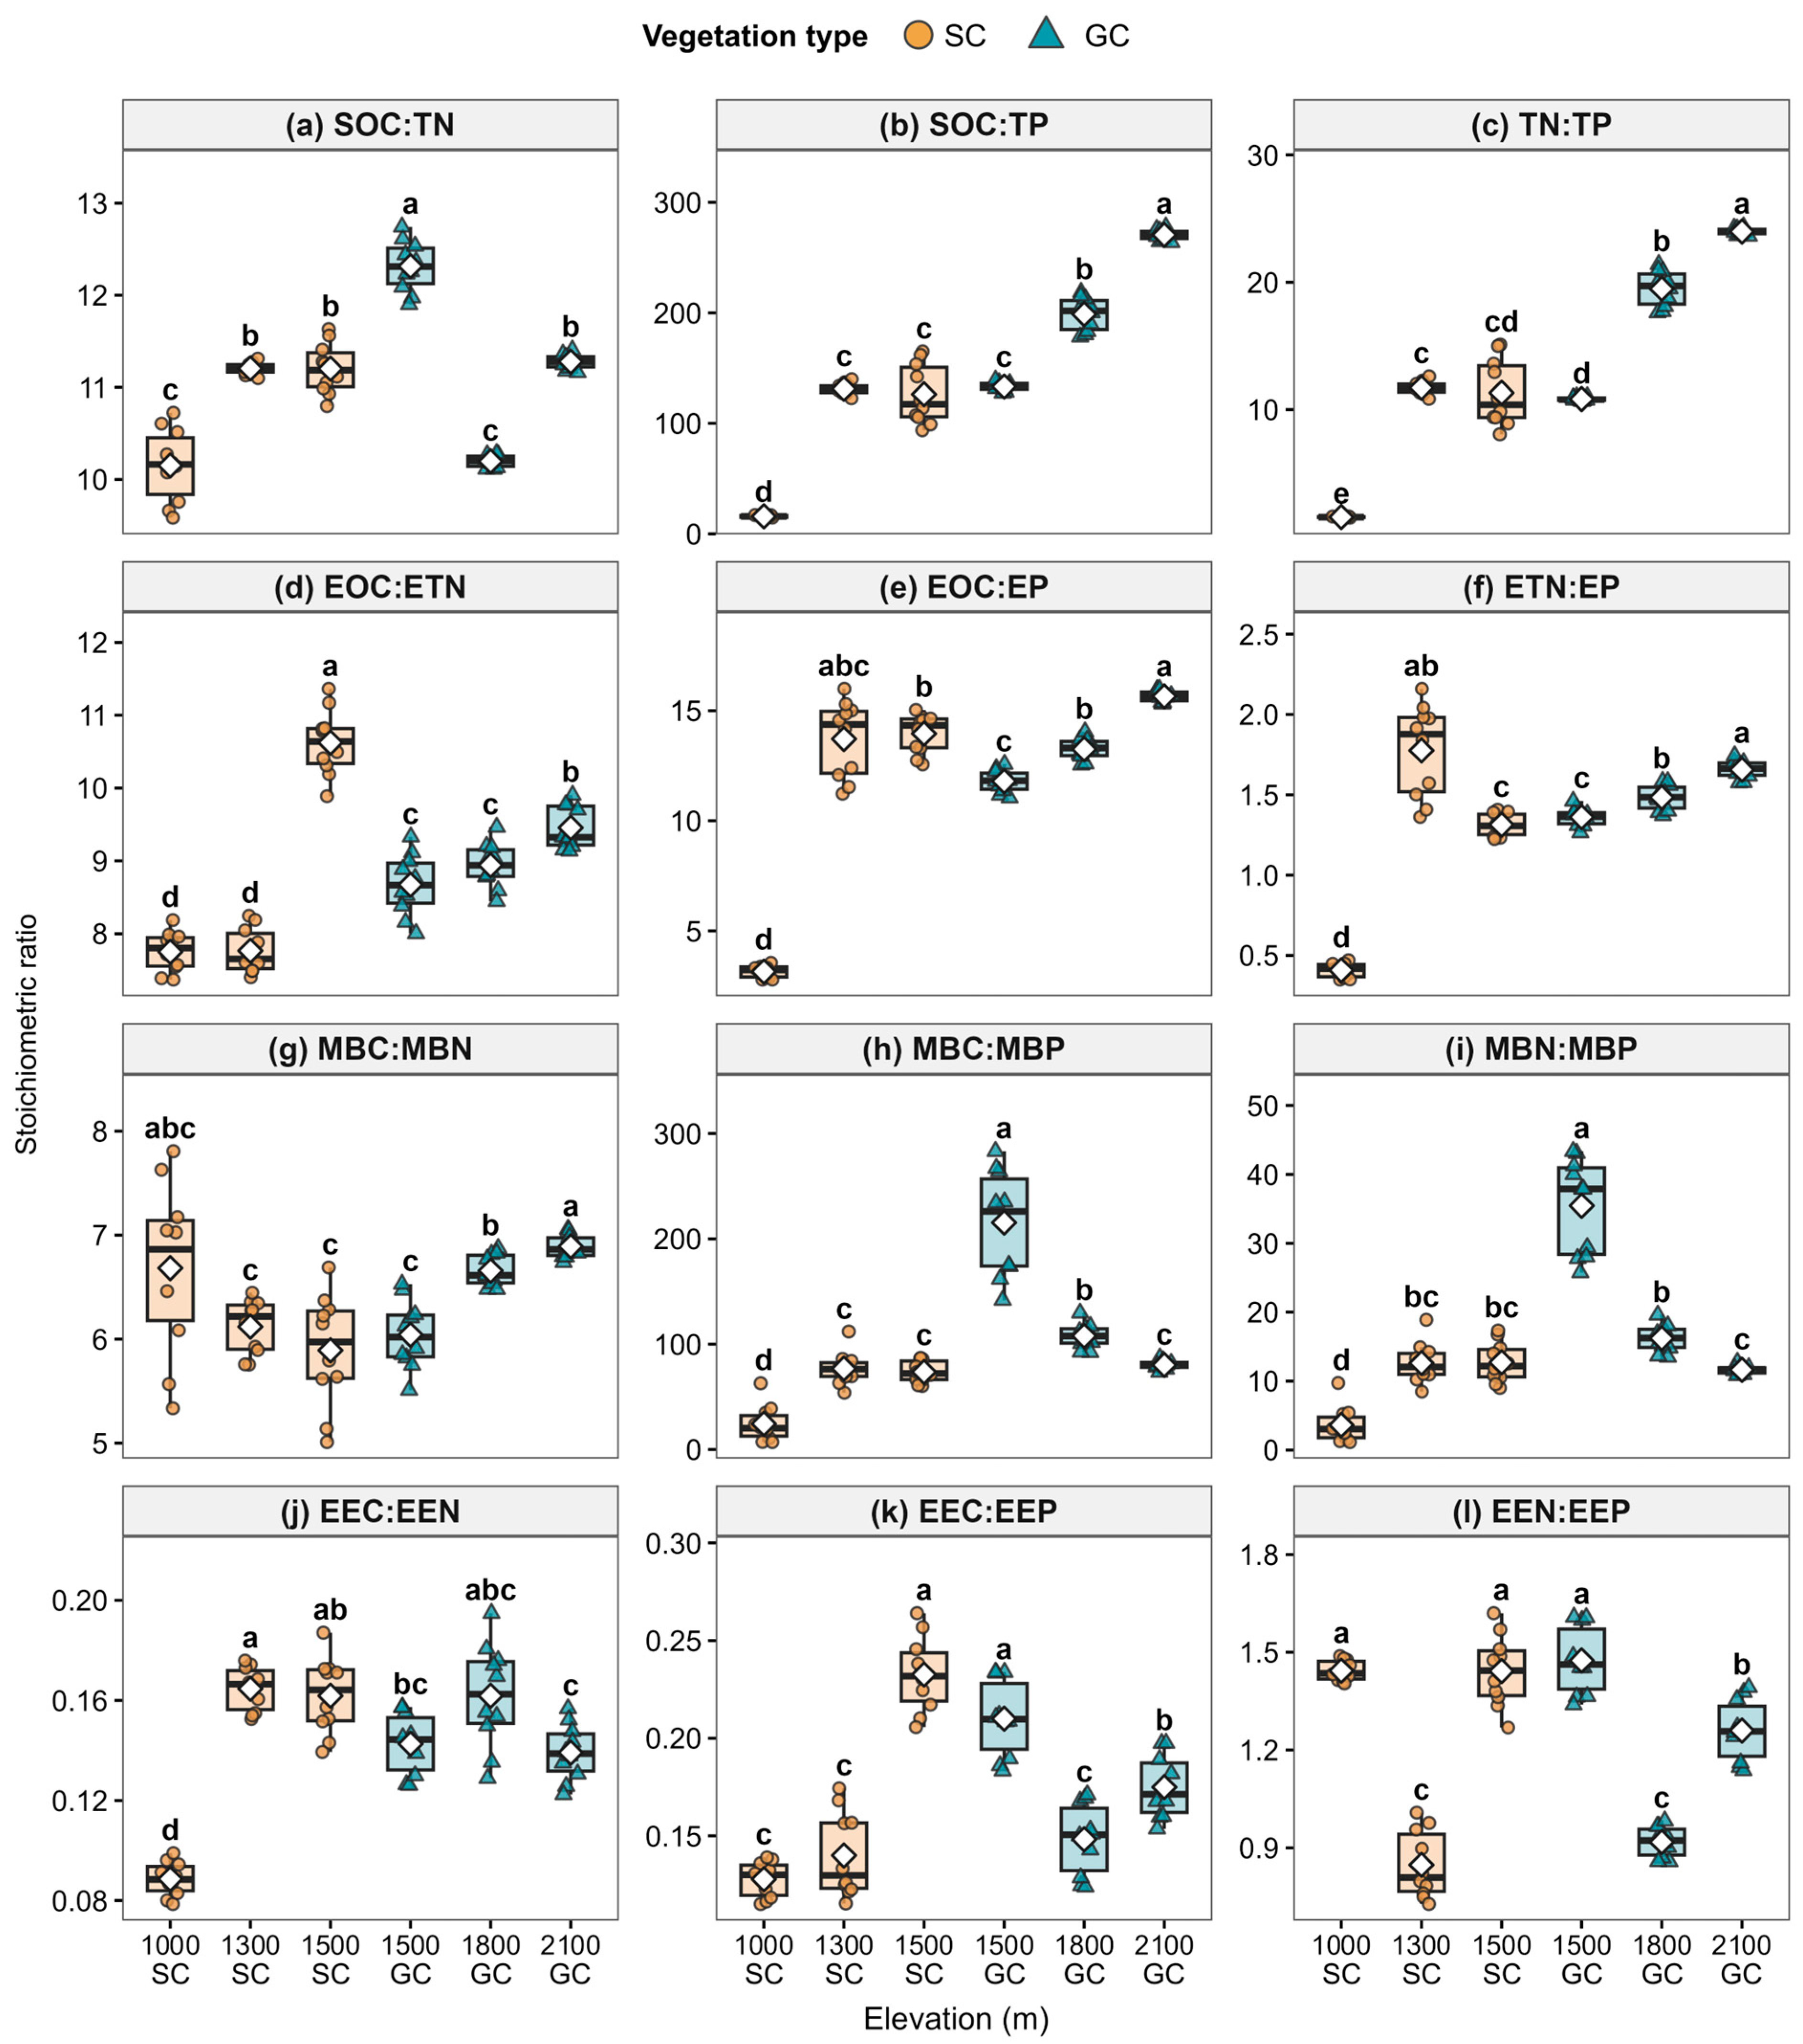
All twelve soil nutrient, microbial biomass and enzyme-activity ratios differed among the six elevation–community combinations (p < 0.001; Figure 3). Among the soil nutrient ratios, mean SOC:TP, TN:TP and EOC:EP were highest in the 2100 m GC (Figure 3b,c,e). At the shared 1500 m belt, GC had higher SOC:TN but lower EOC:ETN and EOC:EP than SC (p < 0.001; Supplementary Materials: Table S1).
Figure 3.
Stoichiometric ratios of total soil nutrients (a–c), extractable nutrients (d–f), microbial biomass (g–i) and enzyme activities (j–l). Ratios in (a–i) are molar. Boxplot symbols and letter comparisons follow Figure 2. Abbreviations are defined in the Abbreviations section following Section 5.
Microbial biomass C:P and N:P decreased across the three GC belts, whereas microbial biomass C:N increased (p < 0.05; Figure 3g–i). In SC, microbial C:P and N:P were higher at 1300 and 1500 m than at 1000 m (p < 0.05), with no significant difference between the two upper belts; microbial C:N did not differ significantly between any pair of SC belts. At the shared 1500 m belt, GC had 192.7% higher microbial C:P and 178.6% higher microbial N:P than SC (p < 0.001), whereas microbial C:N did not differ significantly (Supplementary Materials: Table S1).
For enzyme-activity ratios, EEC:EEN was lower at 1000 m than at 1300 and 1500 m in SC (p < 0.05), whereas no pair of GC belts differed significantly (Figure 3j). In both communities, EEC:EEP was highest at 1500 m, while EEN:EEP was lowest at the intermediate belt (p < 0.05; Figure 3k–l). Despite these within-community patterns, none of the three enzyme-activity ratios differed significantly between SC and GC at the shared 1500 m belt after Holm correction (Supplementary Materials: Table S1).
3.4. Soil Microbial Nutrient Limitation
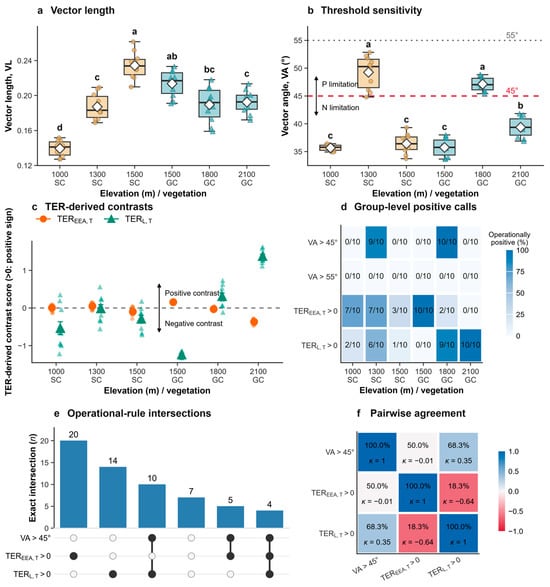
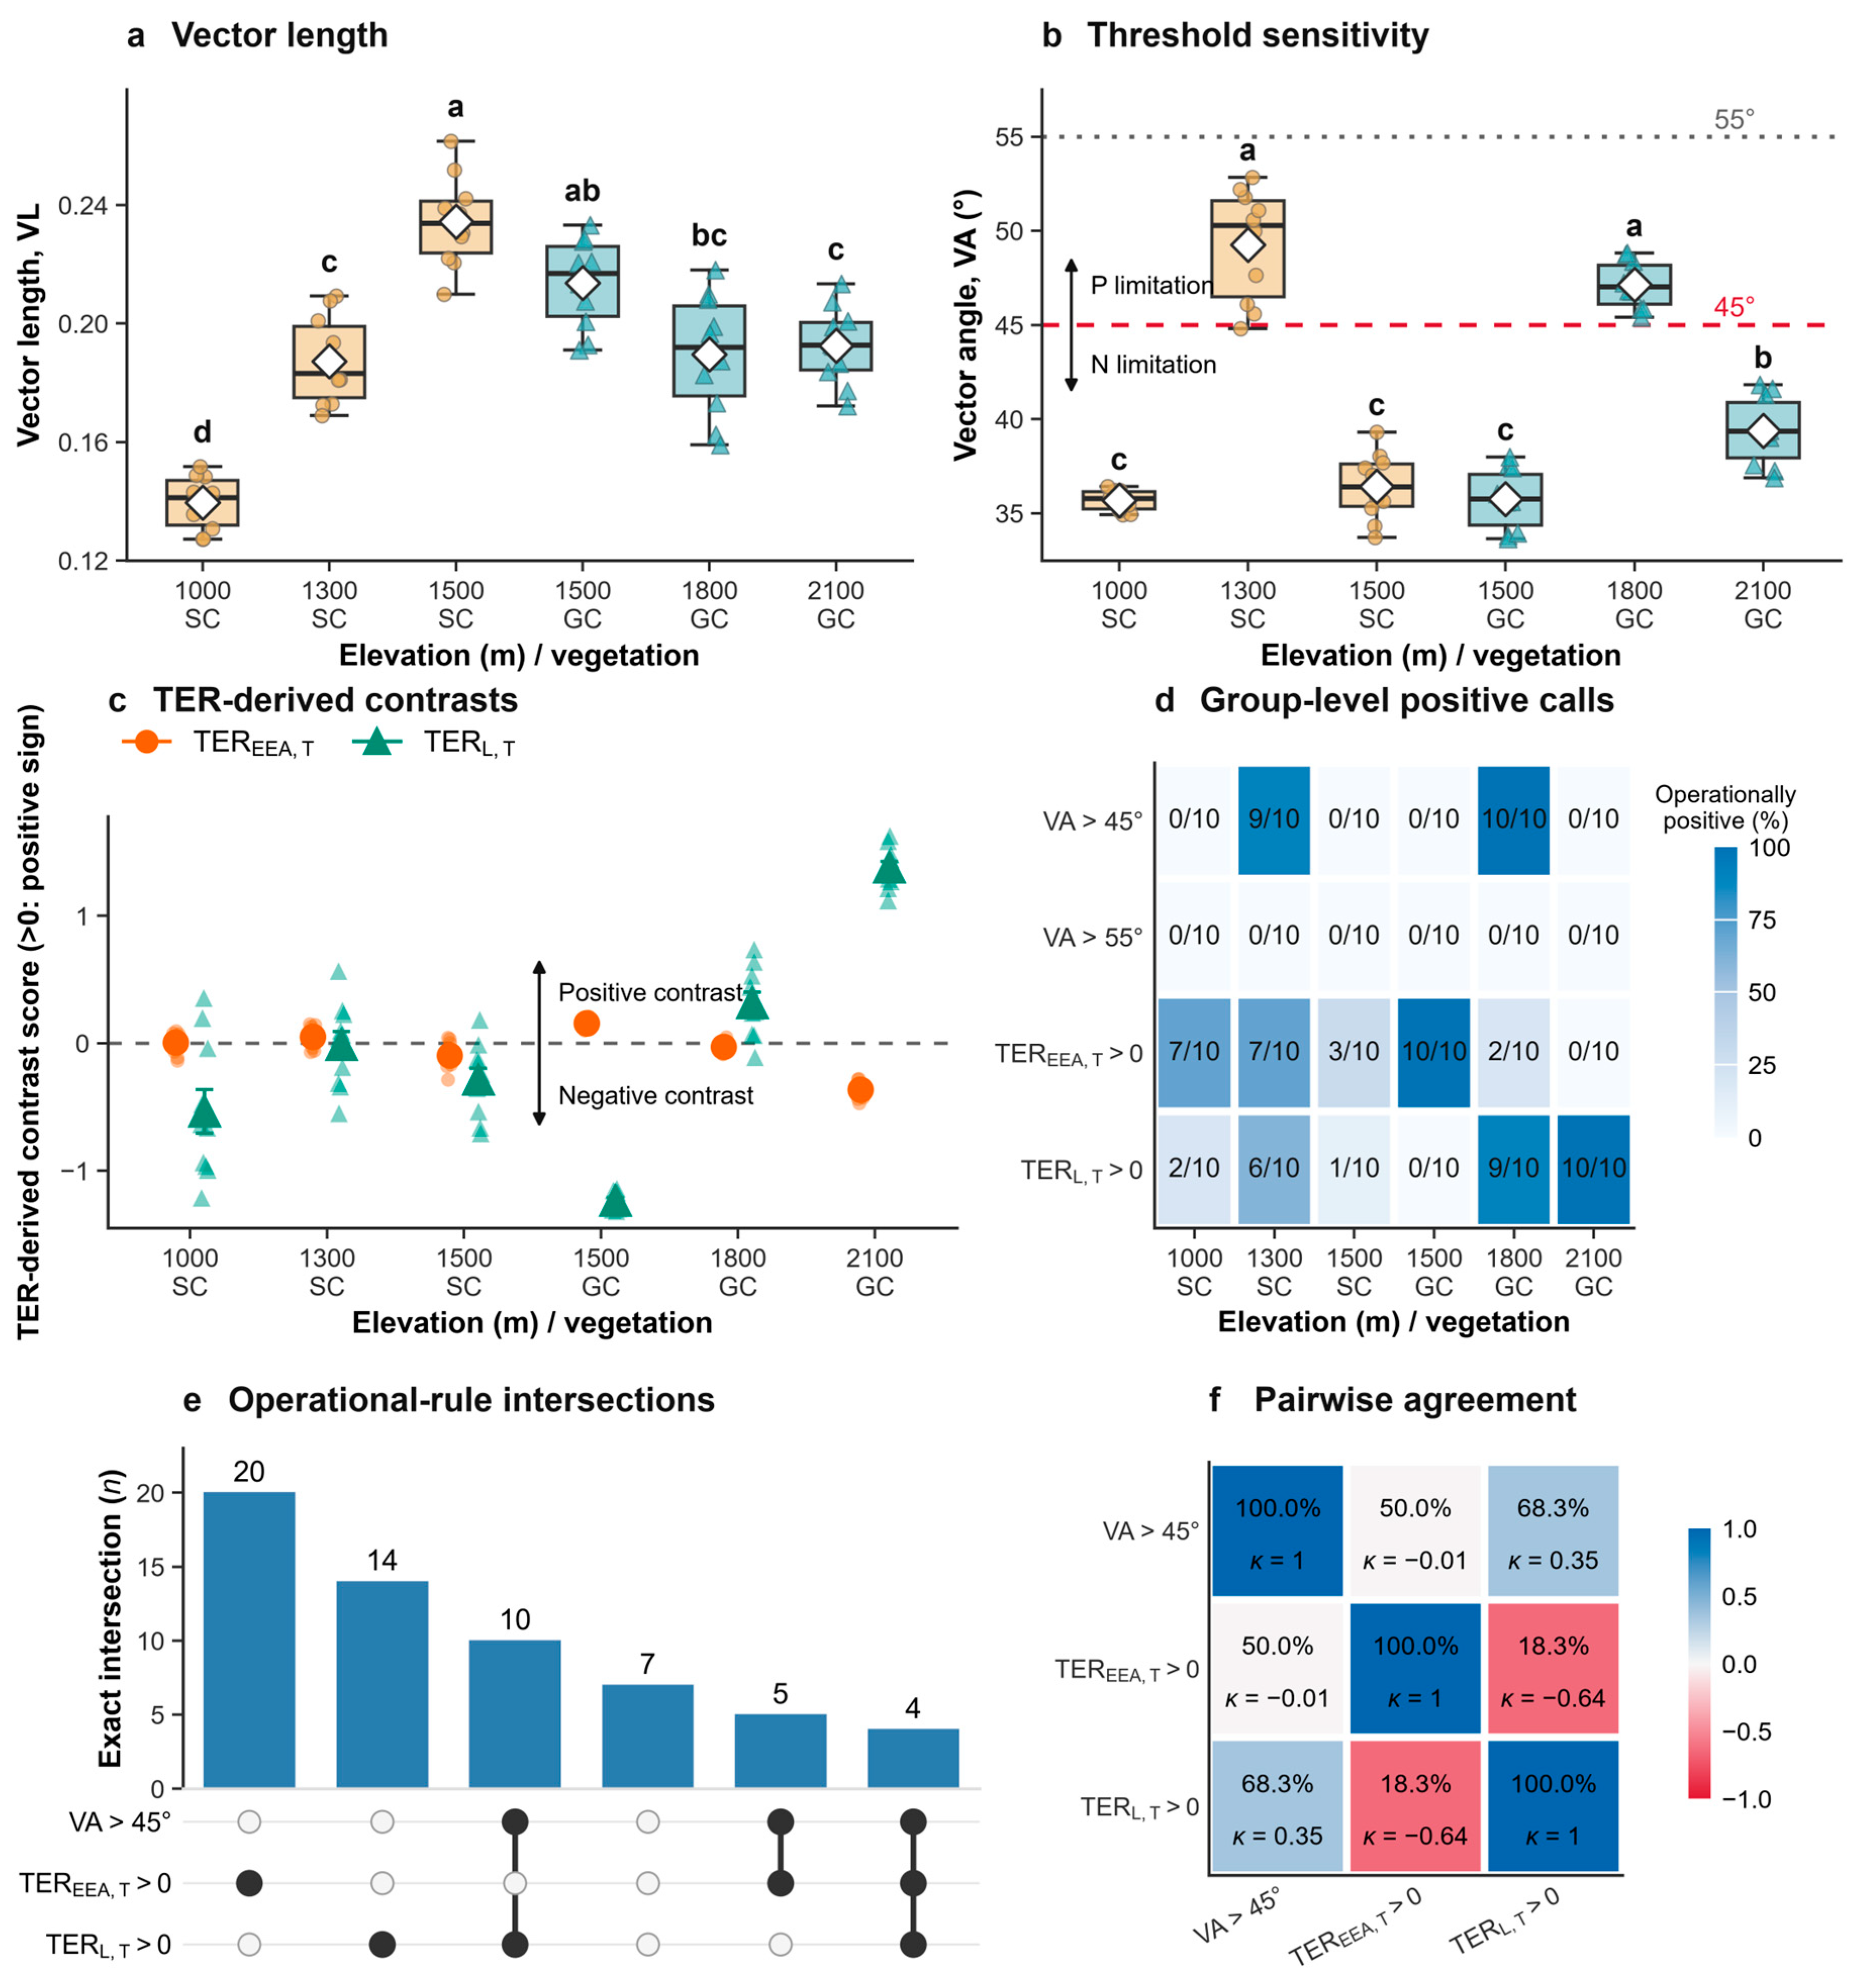
VL and VA differed among the six elevation–community combinations (p < 0.001; Figure 4a,b). Mean VL was highest at 1500 m within each community, reaching 0.234 in SC and 0.214 in GC. Within GC, VL did not differ significantly between 1500 and 1800 m (p = 0.074; Figure 4a). Individual VL values ranged from 0.127 to 0.262, all below 0.61. VA was highest at 1300 m in SC and 1800 m in GC. The 19 samples exceeding 45° comprised nine in the 1300 m SC and ten in the 1800 m GC; none exceeded 55° (Figure 4b,d). At 1500 m, neither VL nor VA differed significantly between SC and GC after Holm correction (Supplementary Materials: Table S1).
Figure 4.
Microbial nutrient-limitation indicators. (a,b) VL and VA boxplots: higher values indicate stronger relative C- and P-acquisition signals, respectively. Orange and teal indicate SC and GC, respectively; boxplot symbols follow Figure 2. In (b), the red dashed line marks the traditional 45° threshold for distinguishing microbial N and P limitation, and the grey dashed line marks the proposed alternative threshold of 55°. (c) Total-pool TER contrast scatterplot: the black dashed line at zero marks the operational boundary separating positive and negative TER contrasts; large symbols and error bars show means ± SE. (d) Heatmap of samples meeting each rule: labels show counts out of 10; colours show percentages. (e) UpSet plot [42]: filled/open dots indicate rules met/not met; bars show sample counts for exact combinations. (f) Pairwise agreement heatmap: labels show percentage agreement and Cohen’s κ (chance-adjusted agreement); colours show κ. Panels (e,f) use VA > 45° and two TER > 0 rules. In (a,b), groups with no shared lowercase letters differ significantly (Games–Howell test, p < 0.05).
The total-pool TEREEA,T and TERL,T contrasts were positive in 29 and 28 samples, respectively (Figure 4c,d). Positive TEREEA,T occurred in all ten 1500 m GC samples, whereas positive TERL,T occurred in nine 1800 m GC samples and all ten 2100 m GC samples. Across the VA > 45° rule and the two TER signs, four samples were jointly positive and seven jointly negative, giving 18.3% three-rule agreement (Figure 4e). Pairwise agreement was 50.0% for VA–TEREEA,T (κ = −0.01), 68.3% for VA–TERL,T (κ = 0.35) and 18.3% for TEREEA,T–TERL,T (κ = −0.64; Figure 4f; Supplementary Materials: Table S2).
Raising the VA boundary from 45° to 55° reduced the proportion of samples classified as positive by 31.7 percentage points (95% within-combination resampling interval, 28.3–33.3 percentage points). With hybrid resource inputs, TEREEA,E was positive in all 60 samples and TERL,E in none; at least one TER sign changed in 35 samples relative to total-pool inputs (Supplementary Materials: Table S2).
3.5. Modelled Carbon Use Efficiency Under Alternative Resource Definitions
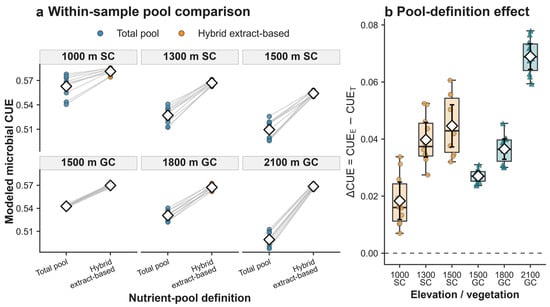
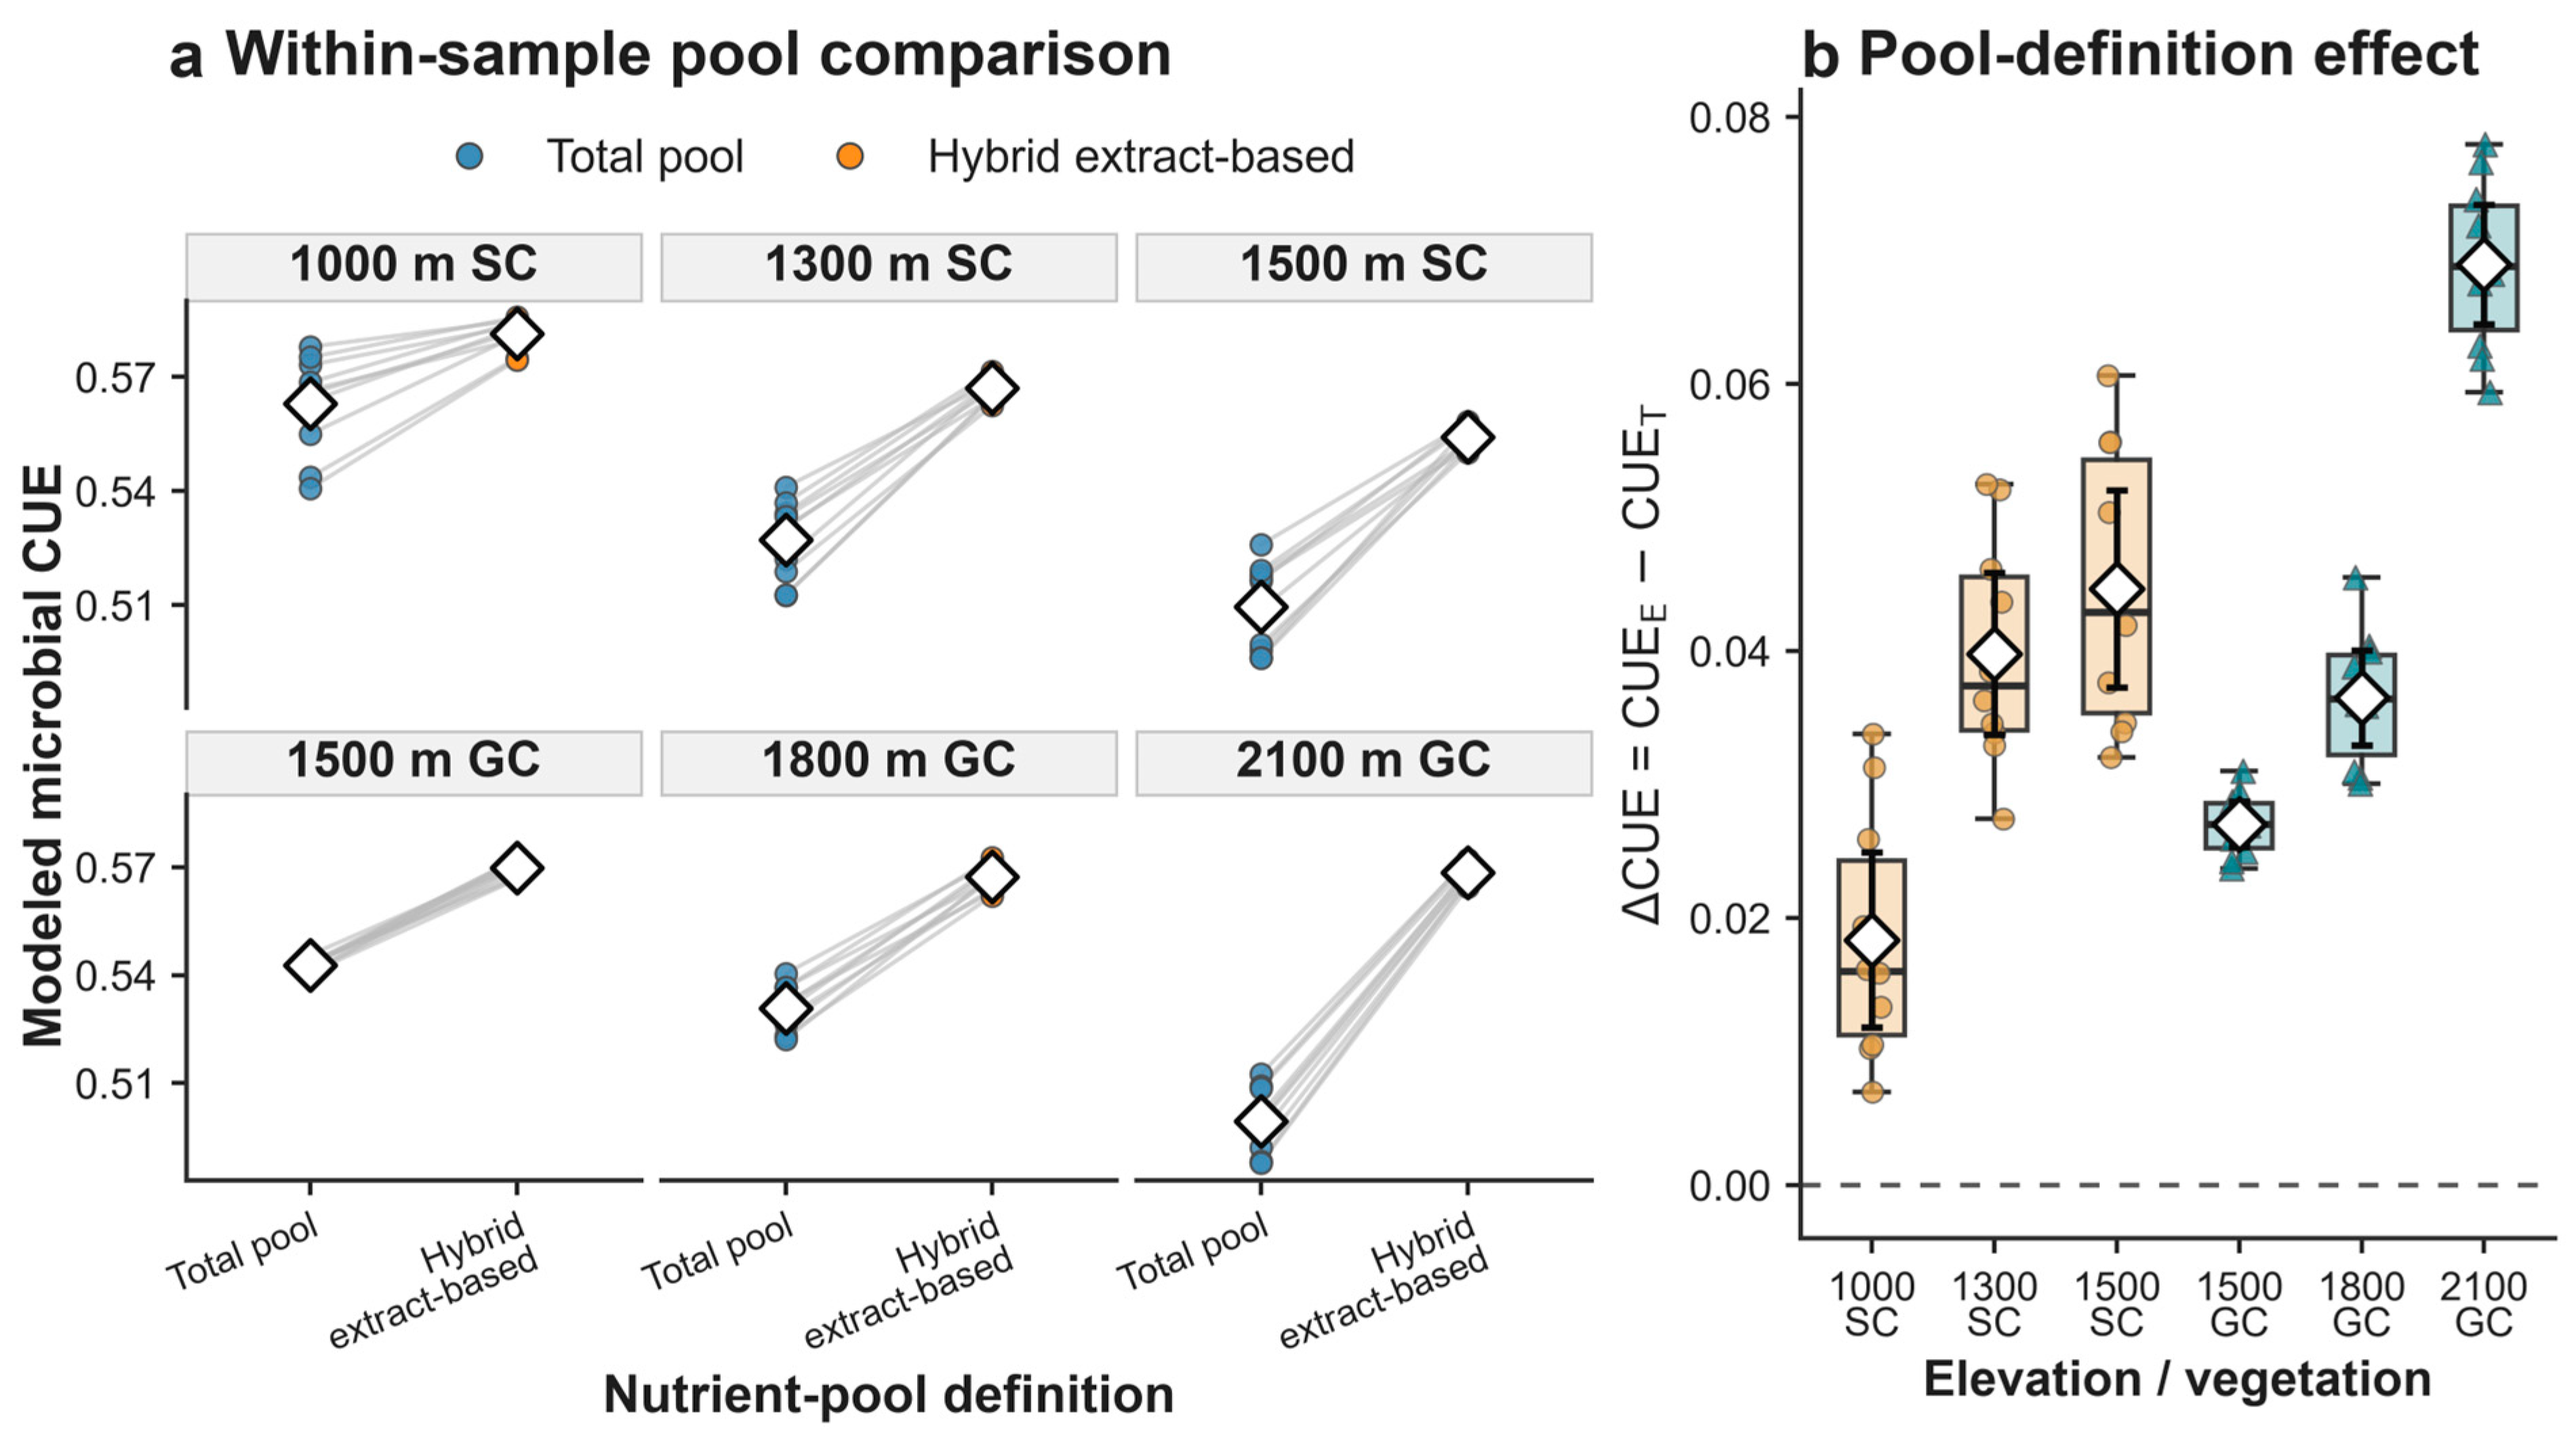
Mean total-pool CUET decreased across the three sampled belts in both communities (Figure 5a). Both its C:N- and C:P-based components decreased across SC; in GC, the C:P-based component decreased from 0.562 to 0.463 while the C:N-based component increased from 0.524 to 0.539. Hybrid-input CUEE also decreased across SC, whereas GC group means ranged narrowly from 0.567 to 0.570. At the shared 1500 m belt, GC had higher CUET and CUEE than SC by 0.0332 and 0.0156, respectively (p < 0.001; Supplementary Materials: Table S1). With hybrid inputs, GC group means ranged from 0.541 to 0.548 for the C:N-based component and from 0.590 to 0.596 for the C:P-based component. In SC, the C:N-based component decreased from 0.570 to 0.523, whereas the C:P-based component remained within 0.587–0.593.
Figure 5.
Modelled CUE under total-pool and hybrid extract-based inputs. (a) Paired estimates: blue and orange points indicate total-pool and hybrid extract-based estimates, respectively; grey lines connect estimates for the same sample. (b) ΔCUE (hybrid minus total-pool estimate): orange and teal indicate SC and GC, respectively; the grey dashed line at zero indicates no difference between the two estimates. White diamonds indicate means; black error bars show 95% t confidence intervals for group means. Boxplot conventions follow Figure 2.
At the baseline parameterisation, mean CUET and CUEE were 0.529 and 0.568, respectively, and CUEE exceeded CUET in all 60 paired samples. The paired difference, ΔCUE, ranged from 0.0070 to 0.0779 and averaged 0.0392 (95% within-combination resampling interval, 0.037–0.041; Supplementary Materials: Table S2). Mean ΔCUE differed among combinations (p < 0.001; Figure 5b), with the highest mean in the 2100 m GC (0.0689) and the lowest in the 1000 m SC (0.0183).
Across the nine parameter combinations, mean CUET, CUEE and ΔCUE ranged from 0.316 to 0.562, 0.360 to 0.583 and 0.0144 to 0.0660, respectively. CUEE exceeded CUET in every sample, and the six-group mean ordering within each resource definition was unchanged across the tested grid (Supplementary Materials: Table S3).
3.6. Soil and Biological Factors Associated with Microbial Nutrient Limitation and CUE
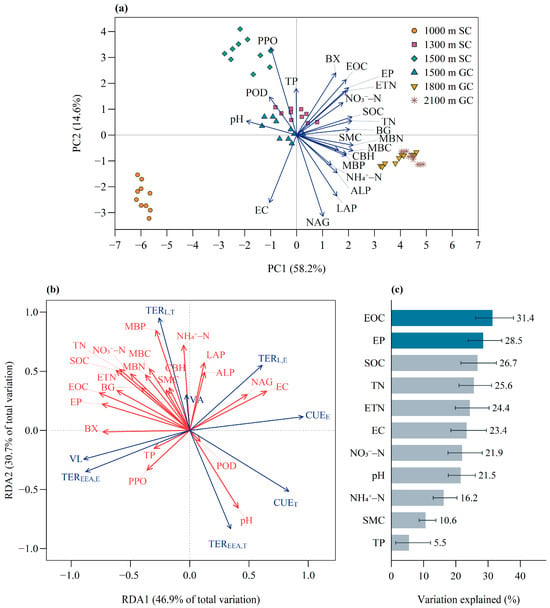
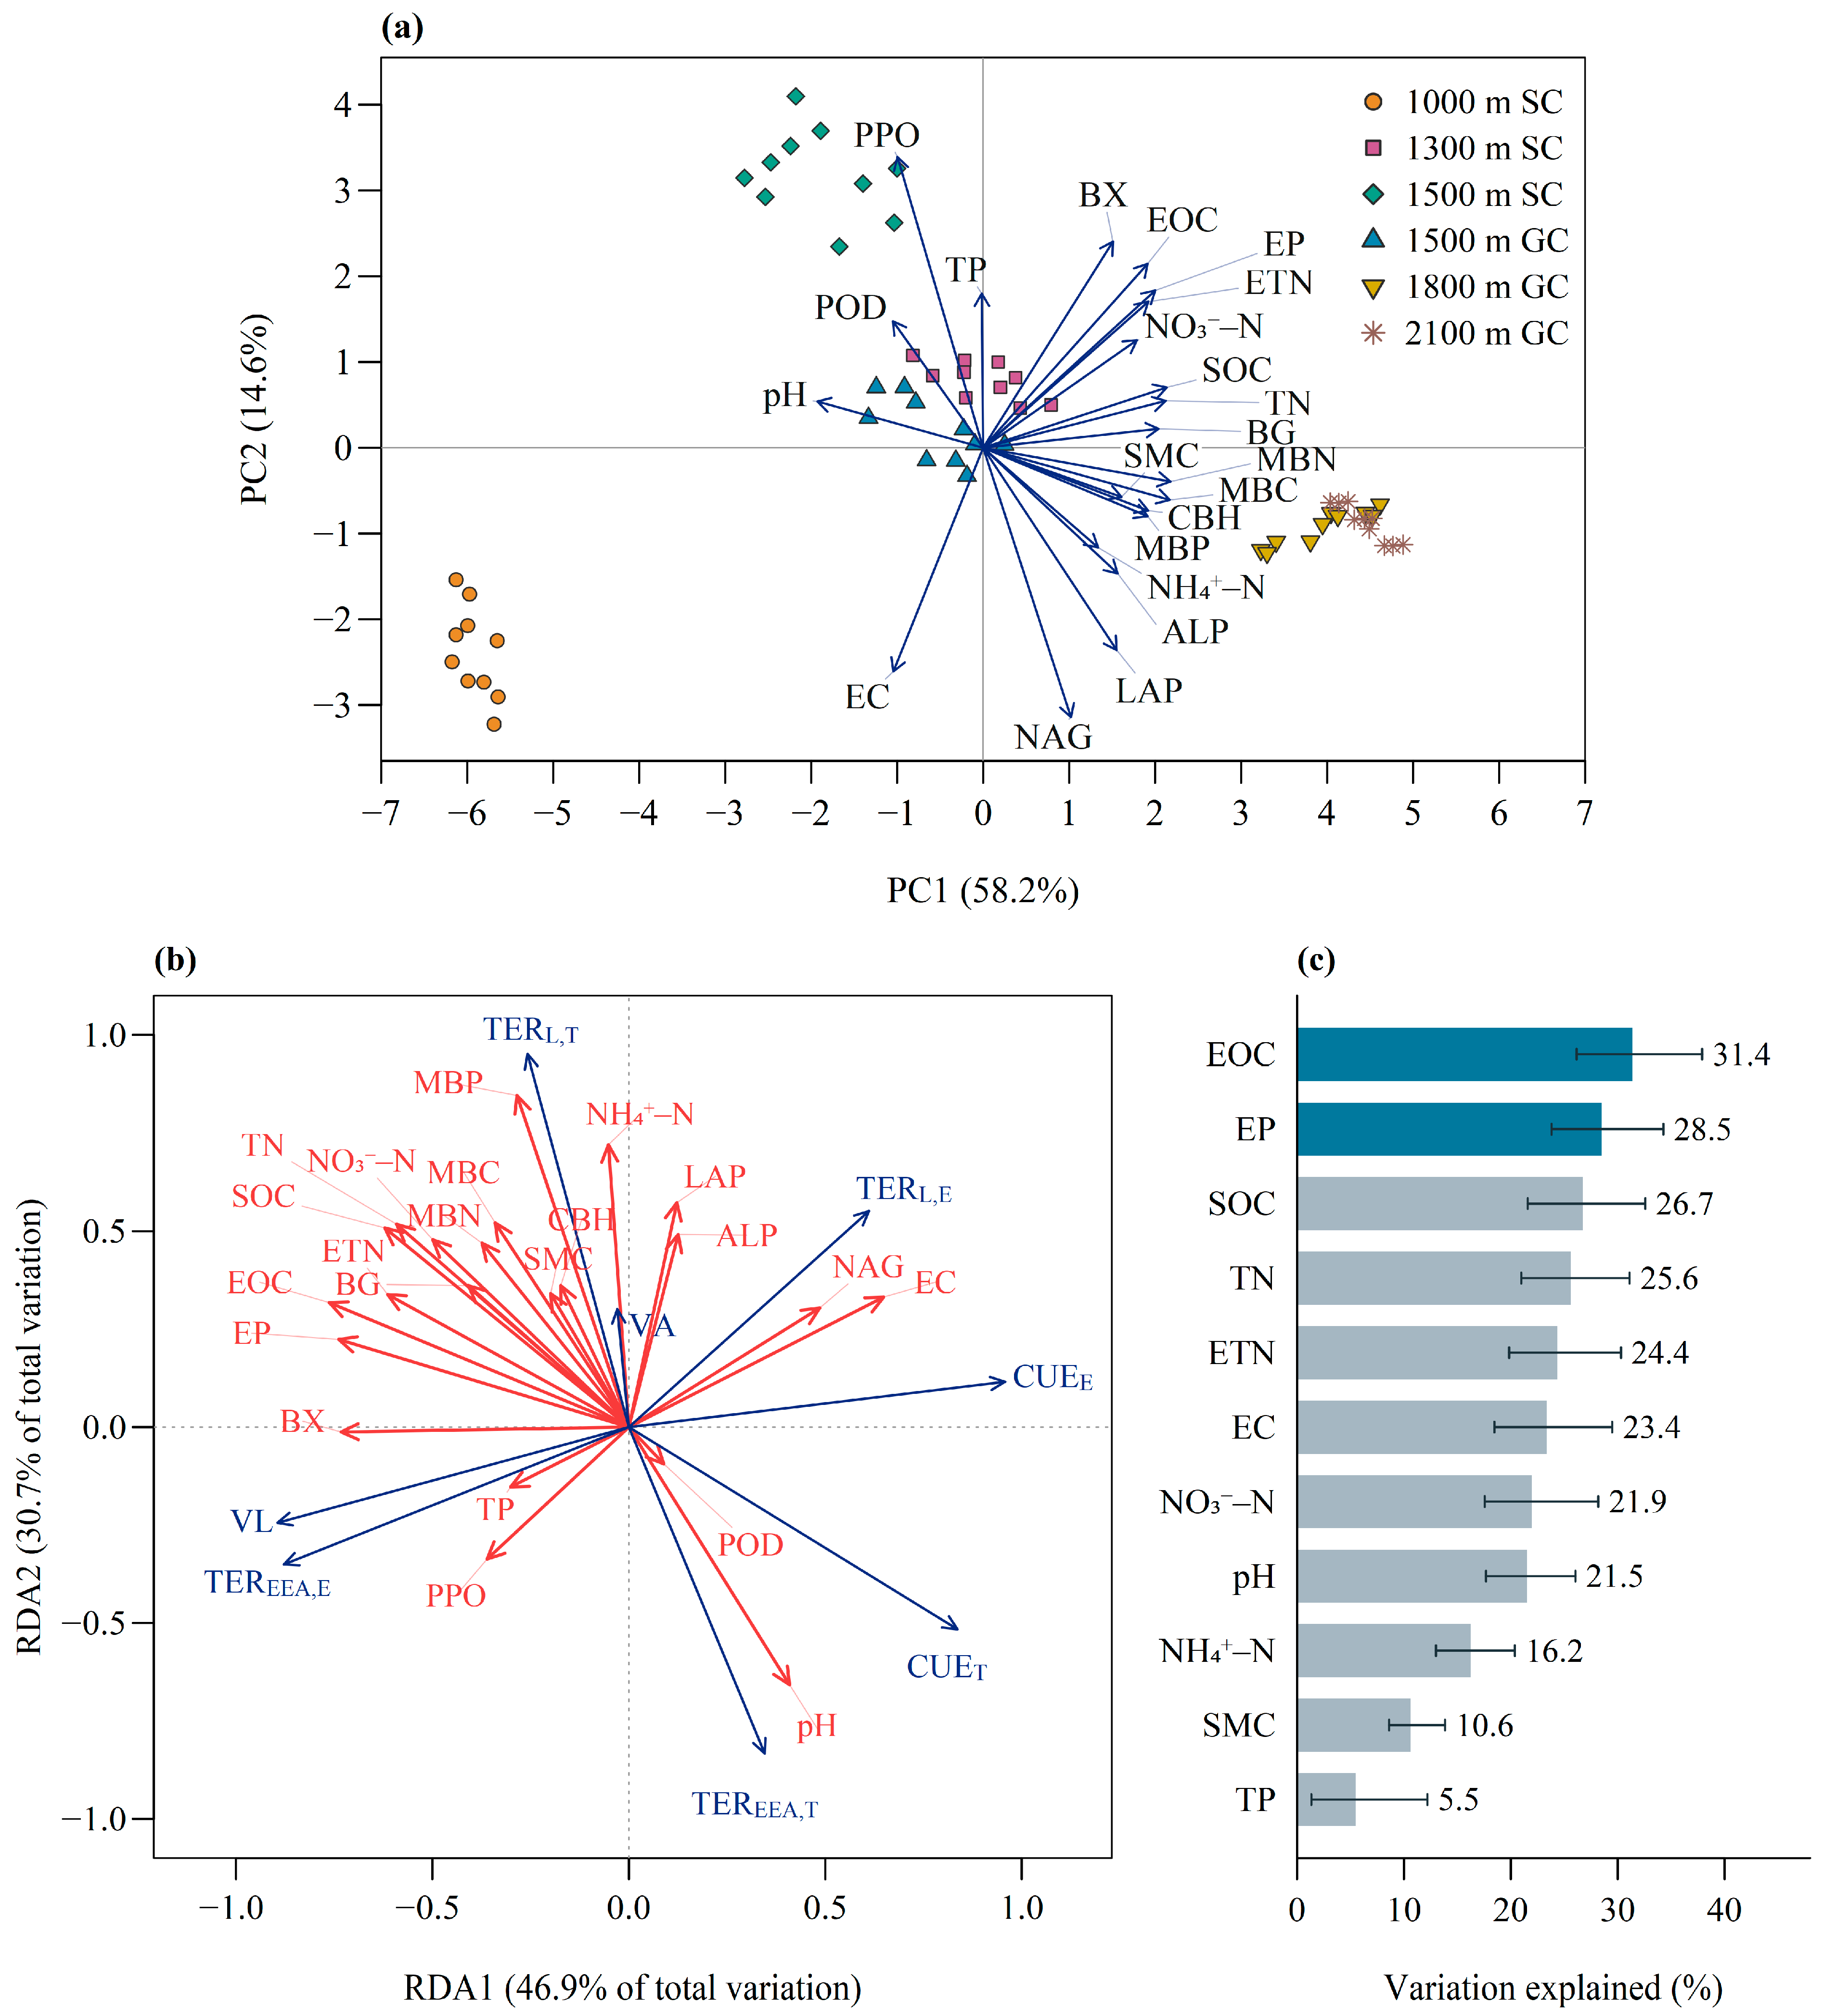
The first two principal components explained 58.2% and 14.6% of variation in the 22 standardised soil, microbial-biomass and enzyme variables, respectively (Figure 6a). SOC, TN, EOC, ETN, EP and microbial biomass had positive loadings on PC1, whereas pH and EC had negative loadings. PPO and NAG had the largest positive and negative loadings on PC2, respectively. The ordination differentiated the sampled soil environments while showing covariation among nutrient pools, microbial biomass and enzyme activities.
Figure 6.
Associations among soil and biological indicators. (a) PCA biplot. (b) RDA ordination plot. (c) Bar chart of variance explained by single-predictor RDA. Point colours and shapes in (a) identify the elevation–community combinations shown in the legend. Blue arrows in (a) show loadings scaled eightfold; red and blue arrows in (b) denote predictors and responses, respectively. The grey solid lines in (a) and grey dashed lines in (b) mark zero on the ordination axes. In (c), dark blue bars highlight EOC and EP, whereas grey bars represent the other soil factors. Error bars in (c) show 95% stratified-bootstrap intervals.
The expanded RDA explained 99.1% of variation in the eight standardised microbial indicators (adjusted R2 = 0.986); the first two axes represented 46.9% and 30.7% of total response variation (Figure 6b). In this two-axis projection, VL and TEREEA,E pointed broadly towards BX and away from EC and NAG. VA was oriented towards ALP, NH4+–N and SMC, while TERL,T aligned with MBP and NH4+–N. TEREEA,T and CUET pointed towards pH, whereas TERL,E and CUEE were oriented towards EC. In the separate soil-only single-predictor models, EOC retained the largest explanatory fraction (31.4%), followed by EP (28.5%), SOC (26.7%) and TN (25.6%; Figure 6c). These soil-factor rankings refer to the combined response set; fractions include shared variation and are not additive. Arrow orientations describe projected associations rather than independent effects.
After BH adjustment across all 41 indicators, no indicator reached an adjusted p < 0.05 within any individual sampling group under either weighting scheme. In the pooled within-group standardised analysis, soil moisture and pH showed significant positive spatial autocorrelation under both weighting schemes (Table S4).
4. Discussion
4.1. Microbial Biomass Quantity and Elemental Composition Across Elevations and Communities
A central pattern in this grassland was that increasing SOC was not accompanied by monotonic increases in microbial C and N pools or total-pool modelled CUE. MBC and MBN instead peaked at 1300 m in SC and 1800 m in GC, coinciding with the wettest sampled belts (Table 1; Figure 2). This differs from the high-elevation biomass maxima reported by He et al. [16]. Moisture can improve contact among microbial cells, extracellular enzymes and substrates [2]. Microbial transformation is one of several processes influencing SOM formation and persistence. Mineral association and physical protection also contribute to SOC persistence by restricting decomposer access to plant-derived material and microbial products [7,43]. Chemical and biochemical reactions can additionally generate new organic compounds, including humic substances [8]. The coincidence of wetter soils and larger microbial pools therefore suggests that access to resources may help explain the biomass pattern. Elevation integrates several environmental changes [11]; resource access is a candidate explanation, rather than a process directly measured by the SOC and moisture observations.
The shared-elevation comparison adds a community contrast to these within-community patterns. At 1500 m, GC had higher MBC and MBN but lower MBP than SC despite lower soil SOC, TN and TP; microbial C:P and N:P were consequently higher in GC, while C:N did not differ significantly (Table 1; Figure 2 and Figure 3; Supplementary Materials: Table S1). At 1500 m, GC also had lower soil moisture than SC. Variation in microbial elemental composition is documented across soils [9,10], and differences in composition and in element incorporation and release offer possible explanations for these nonproportional changes [44]. The Tuhulasu comparison identifies a community-associated difference in the elements held in microbial biomass that cannot be inferred from soil nutrient concentrations alone. Differences in plant traits and plant inputs, together with the potential for nitrogen fixation by Sophora alopecuroides [45], may also contribute to the observed SC–GC contrasts.
Within GC, the largest MBP pool occurred at 2100 m, where MBC and MBN were lower than at 1800 m. The accompanying minima in microbial C:P and N:P indicate more P-rich biomass rather than a proportional increase in all three microbial pools (Figure 2 and Figure 3). This microbial pattern opposed the highest bulk-soil SOC:TP and TN:TP ratios at 2100 m. In SC, microbial C:P and N:P were instead higher at the two upper belts than at 1000 m. Differences in microbial community composition or in element incorporation and release could contribute to these patterns [44], but were not measured here. This divergence between soil and microbial elemental ratios provides a basis for interpreting modelled CUE, rather than expecting it to track SOC concentration alone.
4.2. Absolute Enzyme Activities and Relative Nutrient Acquisition
Enzyme activities provide a link between these resource–biomass contrasts and nutrient acquisition: C- and P-acquiring activities peaked alongside moisture, MBC and MBN at 1300 m in SC and 1800 m in GC. N-acquiring activity instead reached its highest mean at 2100 m in GC (Table 1; Figure 2). He et al. [16] reported increasing enzyme activity toward middle or high elevations, whereas Liu et al. [12] found maximum activity where phospholipid-fatty-acid-based biomass was lowest. Microbial pool size, enzyme allocation and enzyme persistence can all contribute to potential activity [2,43]. The Tuhulasu patterns are consistent with larger microbial pools and wetter conditions accompanying greater C- and P-acquiring activities, while differences in relative allocation may contribute to the distinct N-acquiring pattern. Substrate supply and acquisition costs can influence enzyme production [46], and P-addition studies show that nutrient supply can alter the balance among acquisition functions [47].
At the shared 1500 m elevation, all three nutrient-acquiring activities were higher in GC, by amounts comparable to the increase in MBC, whereas their ratios showed no significant community differences after Holm correction (Figure 2 and Figure 3; Supplementary Materials: Table S1). This supports distinguishing the magnitude of potential enzyme activity from its relative nutrient-acquisition profile. It is consistent with a larger enzyme pool accompanying greater microbial biomass [43], although the nonsignificant ratio comparisons do not establish equivalence between communities. Higher alkaline phosphatase activity also coexisted with lower MBP in GC. Tracer incubations elsewhere have shown that microbes can use C from phosphorylated compounds while releasing P that is not fully incorporated into biomass [48]. Such a pathway could contribute to this contrast, but phosphatase activity alone does not identify P demand, incorporation or turnover. The community comparison therefore separates potential nutrient-mobilising activity from the elements retained in microbial biomass.
4.3. Elevational Patterns of Nutrient Acquisition and Resource-Dependent CUE Estimates
Different balances between resource supply and microbial demand may explain why VL and VA peaked at different elevations. Mean VL was highest at 1500 m in both communities, where EEC:EEP was also highest, although the GC difference in VL between 1500 and 1800 m was not statistically resolved (Figure 3 and Figure 4). Relative to the intermediate belt, EEP decreased proportionally more than EEC at 1500 m, shifting the enzyme profile towards relative C acquisition. This shift is consistent with changes in accessible substrates relative to microbial demand affecting the benefits of producing C- and P-acquiring enzymes [2,46].
VA peaked at 1300 m in SC and 1800 m in GC, coinciding with the highest moisture, microbial C and N pools, and EEP within each community (Table 1; Figure 2 and Figure 4). These co-occurring maxima support a demand–supply interpretation: wetter conditions may improve enzyme–substrate contact and support microbial activity, while P demand during biomass production may increase [2,44]. If P supply does not keep pace, the relative P-acquisition signal could strengthen. Plant roots and microorganisms can compete for N and P from shared soil pools, potentially altering microbial nutrient supply [49,50]. Their principal C sources differ: plants primarily fix atmospheric CO2, whereas soil heterotrophic microorganisms use organic substrates [1]. Phosphatase can also release C from organic substrates [48], linking this pathway to the acquisition of both elements.
Total-pool CUE declined with elevation despite increasing SOC because the model depends on resource–biomass elemental balance weighted by enzyme ratios [17,18]. Both C:N- and C:P-based components declined in SC. In GC, increasing soil SOC:TP and decreasing microbial C:P reduced the biomass-to-resource C:P ratio; the declining C:P-based component outweighed the increasing C:N-based component (Section 3.5). With extract-based inputs, SC retained its decline, whereas GC means varied little because the C:P-based component approached the model maximum and the C:N-based component changed little (Figure 5). Resource–biomass elemental balance therefore connects the resource environment and enzyme-acquisition profile to the modelled CUE response; its magnitude and pattern also depend on the resource definition [18].
All VL values were below 0.61, and no VA exceeded the alternative 55° threshold [37]. All diagnostic results are relative and depend on the models used. Changing resource inputs also altered TER classifications (Table S2). Evidence for vector-based diagnoses differs between methodological critiques and nutrient-addition experiments [51,52]; shared calculation inputs further limit independent validation. Thus, the patterns support testable explanations of resource demand and supply, rather than confirmed physiological limitations.
4.4. Soil Associations and Implications for Mountain Grassland Carbon and Nutrient Cycling
The ordination links the contrasting acquisition patterns to different enzyme and resource properties. VL was positively associated with BX activity, whereas VA was positively associated with ALP activity, ammonium and soil moisture (Figure 6b). These associations are consistent with the proposed roles of enzyme acquisition and moisture-related nutrient demand. TER associations differed among formulations and resource inputs, so a single nutrient factor cannot summarise all limitation indicators. Among soil variables examined separately, EOC explained the largest fraction of variation in the combined indicators, followed by EP (Figure 6c), highlighting extraction-defined resource pools as candidates for further investigation. The context dependence agrees with contrasting soil associations between slope aspects [16] and the broader covariation of enzyme activities with pH and organic matter [53].
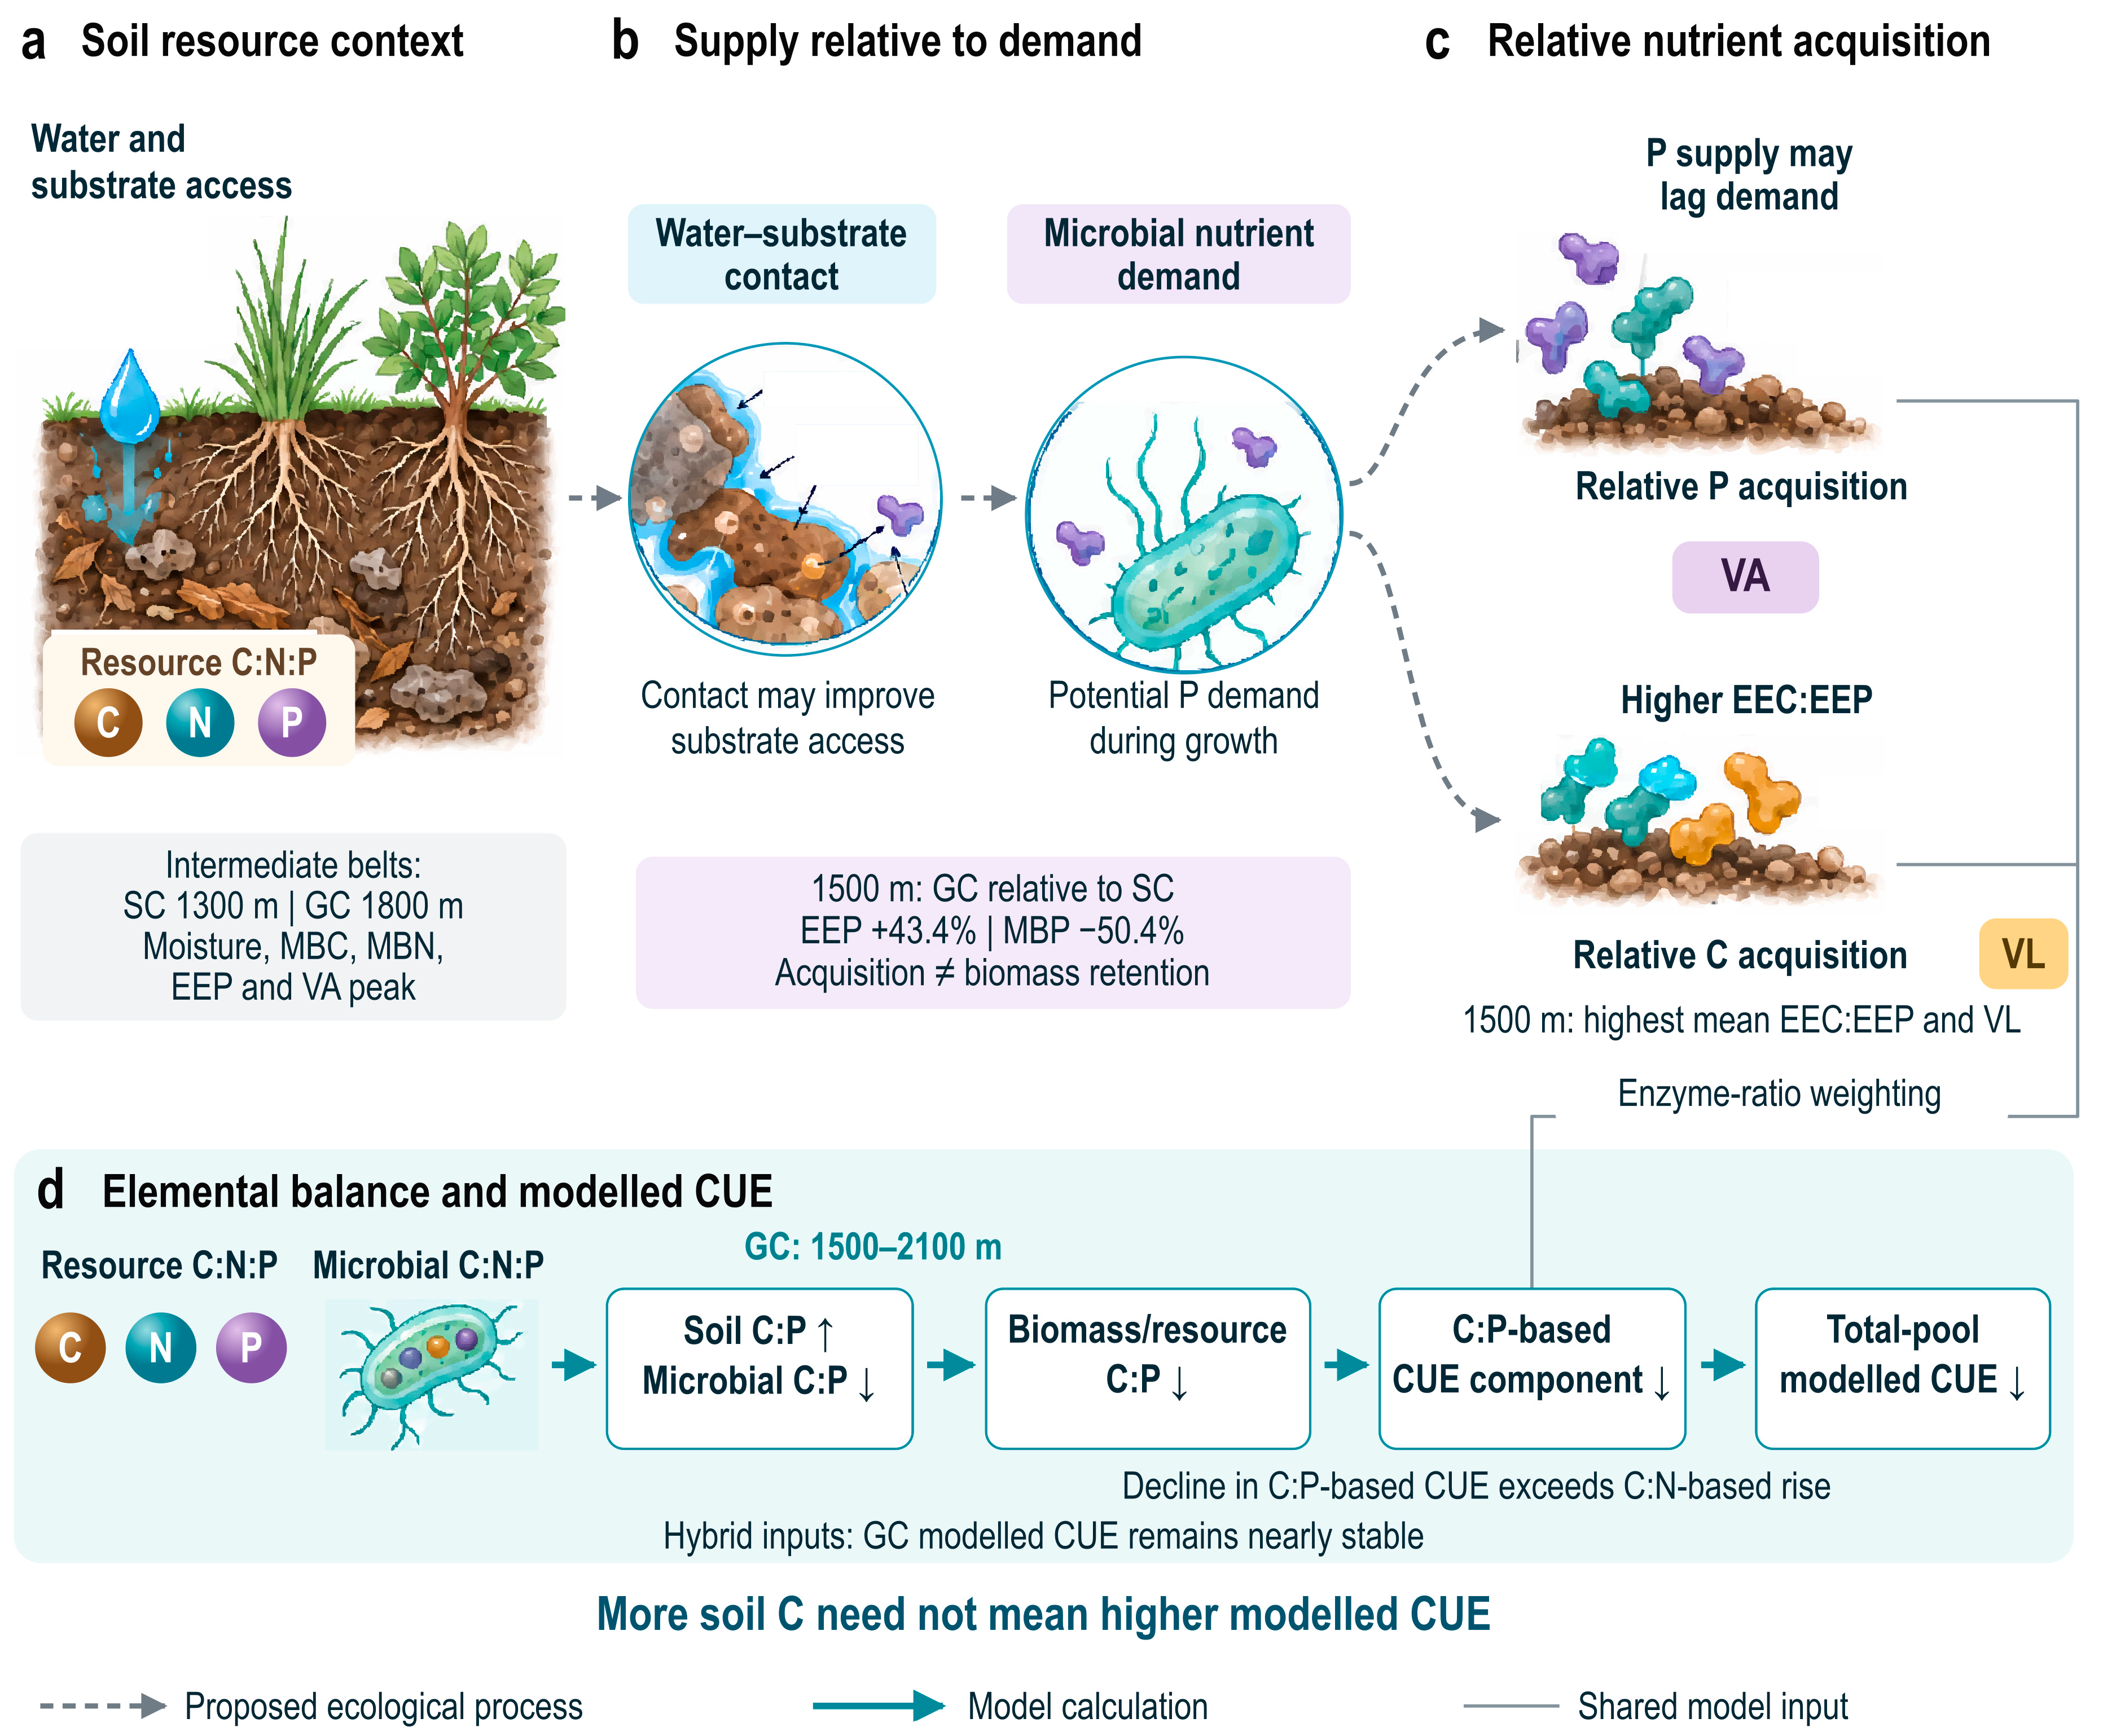
The proposed ecological mechanism links resource access, microbial nutrient demand, enzyme-mediated acquisition and resource–biomass elemental balance (Figure 7). At the wetter intermediate belts, improved substrate contacts and greater P demand during biomass production could favour relative P acquisition, providing a plausible explanation for the VA maxima. At 1500 m, the higher EEC:EEP ratio instead accompanies the VL maxima, indicating a shift towards relative C acquisition. The higher EEP but lower MBP in GC than in SC at this shared elevation further separates nutrient-mobilising capacity from nutrient retention in microbial biomass. These acquisition and biomass patterns connect to CUE through the stoichiometric model: increasing soil C:P and decreasing microbial C:P reduce the biomass-to-resource C:P ratio in GC, lowering the C:P-based component enough to outweigh the increase in the C:N-based component. Thus, more soil C need not coincide with greater nutrient retention or higher modelled CUE. The ecological links describe a potential demand–supply mechanism, while the final CUE response follows the model calculations.
Figure 7.
Potential ecological mechanisms linking soil resources, microbial nutrient acquisition and modelled CUE. (a) Soil resource context. (b) Resource supply and microbial demand. (c) Relative nutrient acquisition. (d) Resource–biomass elemental balance and modelled CUE. Dashed arrows indicate proposed ecological processes; teal arrows indicate model calculations; thin grey lines indicate shared model inputs. Small black arrows in (b) highlight water–substrate contact sites at soil particle surfaces. In (d), upward and downward arrows indicate increases and decreases, respectively.
The practical implication is that grassland soil assessment should consider resource pools, microbial biomass and enzyme profiles together. SOC concentration alone would miss the intermediate-elevation biomass maxima, differences in relative acquisition, and resource-dependent modelled CUE. A recent comparison of Qilian Mountains grassland types similarly used enzyme stoichiometry to infer microbial nutrient constraints [54]. The present six elevation–community combinations provide a one-season reference for future Tuhulasu monitoring. Repeated sampling should compare the same elevation–community strata and record moisture, nutrient pools, microbial biomass and enzyme activities together, while specifying resource inputs for modelled CUE. These are candidate indicators for monitoring soil ecological change; their ability to track degradation, recovery or long-term C retention requires direct validation.
These findings apply to one landscape and season, with only one elevation shared by the plant communities. The design therefore supports comparisons within each sampled elevation sequence and the local contrast at 1500 m, but cannot independently separate elevation effects, plant-community effects or their interaction. The comparison at 1500 m may also be influenced by potential differences in slope, aspect, parent material and grazing conditions. Plant biomass, root traits, litter inputs and nitrogen fixation were not quantified. The observed SC–GC differences are therefore interpreted as observational contrasts between the sampled vegetation types and do not establish an independent plant-community effect. Because nitrogen fixation was not measured, its occurrence and contribution to the observed differences cannot be determined. The ordination also combines observational relationships with shared calculation inputs: CBH, BG, NAG, LAP and ALP enter the vector indices, while enzymes, biomass and nutrient pools enter TER and CUE. BX is not a direct input, but its association is not causal evidence. Collinearity and shared group variation limit unique soil-factor attribution; bootstrapping does not resolve spatial dependence. Microbial biomass is a standing pool rather than a growth measurement, and phosphatase activity does not directly measure P uptake. Bulk and extraction-defined pools incompletely represent resource availability [19], and EP does not directly measure microbial P supply. Seasonal replication across shared elevations would test pattern persistence; microbial composition and P-turnover measurements would distinguish biomass and supply processes. Nutrient-addition growth responses would test the proposed demand–supply imbalance [55,56], and direct growth and respiration measurements would test modelled CUE [18], before extending the findings to C storage or management outcomes.
5. Conclusions
This study analysed elevation-related patterns of microbial nutrient limitation and modelled CUE in two plant communities in the Tuhulasu grassland. The results showed that mean VL was highest at 1500 m in both communities, indicating the strongest relative C-acquisition signal among the sampled elevations. Mean VA was highest at 1300 m in SC and 1800 m in GC, indicating the highest relative P-acquisition signal within each sampled elevation sequence. Modelled CUE based on total nutrient pools declined with elevation in both communities; with extract-based inputs, it declined in SC but varied little among GC means. In the overall ordination, VL was positively associated with BX activity, whereas VA was positively associated with ALP activity, ammonium and soil moisture. TER associations differed among formulations and resource inputs. Among the soil variables examined separately, EOC and EP explained the largest fractions of variation in the combined microbial indicators. These findings show that the relative C- and P-acquisition signals and modelled CUE do not follow a single elevation pattern. The proposed ecological explanation links resource access and microbial demand to relative enzyme-mediated acquisition, with resource–biomass elemental balance shaping modelled CUE. The study provides a regional reference for designing grassland soil monitoring that measures nutrient pools, microbial biomass and enzyme activity together. Future work should combine seasonal sampling across shared elevations with nutrient-addition experiments and direct measurements of microbial growth and respiration to test the inferred nutrient limitations and modelled CUE patterns.
Supplementary Materials
The following supporting information can be downloaded at: https://www.mdpi.com/article/10.3390/su182111421/s1, Table S1: Community comparisons at 1500 m; Table S2: Indicator sensitivity, agreement and paired CUE differences; Table S3: Sensitivity of CUE to model parameters; Table S4: Quadrat coordinates, adjacent horizontal distances and Moran’s I diagnostics. These tables are provided in the accompanying Supplementary Materials file.
Author Contributions
Conceptualisation, X.L.; methodology, S.Z. and S.L.; software, S.Z.; validation, Z.L., Y.W. and F.H.; investigation, Z.L., Y.W. and F.H.; resources, X.L.; data curation, S.Z.; writing—original draft, S.Z.; writing—review and editing, X.L. and S.L.; visualisation, S.Z.; supervision, X.L.; project administration, X.L.; funding acquisition, X.L. All authors have read and agreed to the published version of the manuscript.
Funding
This research was funded by the Department of Human Resources and Social Security of Xinjiang Uygur Autonomous Region through the Tianchi Innovation Leading Talent Fund (2025CXLJ005) and the High-Level Talent Project of Yili Normal University (2023RCYJ07). The funders had no role in study design, data collection, data analysis or interpretation, manuscript preparation, or the decision to submit the work for publication.
Institutional Review Board Statement
Not applicable.
Informed Consent Statement
Not applicable.
Data Availability Statement
The data supporting the findings of this study are available from the corresponding author upon reasonable request.
Acknowledgments
We thank Yijing Lü and colleagues for assistance with field sampling and laboratory measurements in Tuhulasu. During manuscript preparation, OpenAI Codex (using GPT-6 Astra and GPT-6.1 Sol; OpenAI) was used for language editing, manuscript revision, and reference and analysis checks. Figure 7 was prepared with the GPT Image tool in Codex (runtime version 0.158.0-alpha.2). The authors reviewed and edited the output and take full responsibility for the content.
Conflicts of Interest
The authors declare that they have no known competing financial interests or personal relationships that could have appeared to influence the work reported in this paper.
Abbreviations
| Full name | Abbrev. | Full name | Abbrev. |
| Sophora alopecuroides-dominated community | SC | grass-dominated community | GC |
| soil moisture content | SMC | electrical conductivity | EC |
| soil organic carbon | SOC | total nitrogen | TN |
| total phosphorus | TP | extractable organic carbon | EOC |
| extractable total nitrogen | ETN | inorganic phosphorus in the non-fumigated NaHCO3 extract | EP |
| microbial biomass carbon | MBC | microbial biomass nitrogen | MBN |
| microbial biomass phosphorus | MBP | extracellular enzyme activity | EEA |
| β-1,4-glucosidase | BG | β-D-cellobiohydrolase | CBH |
| β-1,4-N-acetylglucosaminidase | NAG | L-leucine aminopeptidase | LAP |
| alkaline phosphatase | ALP | β-xylosidase | BX |
| peroxidase | POD | polyphenol oxidase | PPO |
| carbon-acquiring enzyme activity | EEC | nitrogen-acquiring enzyme activity | EEN |
| phosphorus-acquiring enzyme activity | EEP | vector length | VL |
| vector angle | VA | threshold elemental ratio | TER |
| enzyme-allocation-linked TER contrast | TEREEA | resource-adjusted TER contrast | TERL |
| carbon use efficiency | CUE | CUE based on total-pool inputs | CUET |
| CUE based on hybrid extract-based inputs | CUEE | analysis of variance | ANOVA |
| principal component analysis | PCA | redundancy analysis | RDA |
| variance inflation factor | VIF | confidence interval | CI |
| standard deviation | SD | standard error | SE |
References
- Sinsabaugh, R.L.; Manzoni, S.; Moorhead, D.L.; Richter, A. Carbon use efficiency of microbial communities: Stoichiometry, methodology and modelling. Ecol. Lett. 2013, 16, 930–939. [Google Scholar] [CrossRef] [Scilit] [PubMed]
- Burns, R.G.; DeForest, J.L.; Marxsen, J.; Sinsabaugh, R.L.; Stromberger, M.E.; Wallenstein, M.D.; Weintraub, M.N.; Zoppini, A. Soil enzymes in a changing environment: Current knowledge and future directions. Soil Biol. Biochem. 2013, 58, 216–234. [Google Scholar] [CrossRef] [Scilit]
- Sinsabaugh, R.L.; Hill, B.H.; Follstad Shah, J.J. Ecoenzymatic stoichiometry of microbial organic nutrient acquisition in soil and sediment. Nature 2009, 462, 795–798. [Google Scholar] [CrossRef] [Scilit] [PubMed]
- Gerke, J. Improving Phosphate Acquisition from Soil via Higher Plants While Approaching Peak Phosphorus Worldwide: A Critical Review of Current Concepts and Misconceptions. Plants 2024, 13, 3478. [Google Scholar] [CrossRef] [Scilit] [PubMed]
- Sims, G.K.; Wander, M.M. Proteolytic activity under nitrogen or sulfur limitation. Appl. Soil Ecol. 2002, 19, 217–221. [Google Scholar] [CrossRef] [Scilit]
- Cui, Y.; Moorhead, D.L.; Wang, X.; Xu, M.; Wang, X.; Wei, X.; Zhu, Z.; Ge, T.; Peng, S.; Zhu, B.; et al. Decreasing microbial phosphorus limitation increases soil carbon release. Geoderma 2022, 419, 115868. [Google Scholar] [CrossRef] [Scilit]
- He, X.; Abs, E.; Allison, S.D.; Tao, F.; Huang, Y.; Manzoni, S.; Abramoff, R.; Bruni, E.; Bowring, S.P.K.; Chakrawal, A.; et al. Emerging multiscale insights on microbial carbon use efficiency in the land carbon cycle. Nat. Commun. 2024, 15, 8010. [Google Scholar] [CrossRef] [Scilit] [PubMed]
- De Nobili, M.; Bravo, C.; Chen, Y. The spontaneous secondary synthesis of soil organic matter components: A critical examination of the soil continuum model theory. Appl. Soil Ecol. 2020, 154, 103655. [Google Scholar] [CrossRef] [Scilit]
- Cleveland, C.C.; Liptzin, D. C:N:P stoichiometry in soil: Is there a ‘Redfield ratio’ for the microbial biomass? Biogeochemistry 2007, 85, 235–252. [Google Scholar] [CrossRef] [Scilit]
- Xu, X.; Thornton, P.E.; Post, W.M. A global analysis of soil microbial biomass carbon, nitrogen and phosphorus in terrestrial ecosystems. Glob. Ecol. Biogeogr. 2013, 22, 737–749. [Google Scholar] [CrossRef] [Scilit]
- Körner, C. The use of ‘altitude’ in ecological research. Trends Ecol. Evol. 2007, 22, 569–574. [Google Scholar] [CrossRef] [Scilit] [PubMed]
- Liu, S.; Xu, G.; Chen, H.; Zhang, M.; Cao, X.; Chen, M.; Chen, J.; Feng, Q.; Shi, Z. Contrasting responses of soil microbial biomass and extracellular enzyme activity along an elevation gradient on the eastern Qinghai-Tibetan Plateau. Front. Microbiol. 2023, 14, 974316. [Google Scholar] [CrossRef] [Scilit] [PubMed]
- Zhang, S.; Pan, Y.; Zhou, Z.; Deng, J.; Zhao, F.; Guo, Y.; Han, X.; Yang, G.; Feng, Y.; Ren, G.; et al. Resource limitation and modeled microbial metabolism along an elevation gradient. Catena 2022, 209, 105807. [Google Scholar] [CrossRef] [Scilit]
- Cao, W.; Chen, Y.; Jiang, L.; Wu, Q.; Zhu, M.; Wang, Y.; Li, W.; Lv, G. Ecoenzymatic stoichiometry reveals that increasing altitude exacerbates soil microbial phosphorus limitation in alpine grassland ecosystems in Xinjiang. Environ. Res. 2025, 275, 121320. [Google Scholar] [CrossRef] [Scilit] [PubMed]
- Zhang, D.; Wu, B.; Li, J.; Cheng, X. Soil microbial relative resource limitation exhibited contrasting seasonal patterns along an elevational gradient in Yulong Snow Mountain. Funct. Ecol. 2023, 37, 1328–1338. [Google Scholar] [CrossRef] [Scilit]
- He, X.; Zheng, J.; Gao, J.; Wu, Y.; Yan, P.; Cao, W.; Ni, X.; Li, C. Soil microbial nutrient limitation and carbon use efficiency in relation to altitude and slope aspect in arid and semi-arid mountainous ecosystems. Ecol. Indic. 2025, 177, 113785. [Google Scholar] [CrossRef] [Scilit]
- Sinsabaugh, R.L.; Turner, B.L.; Talbot, J.M.; Waring, B.G.; Powers, J.S.; Kuske, C.R.; Moorhead, D.L.; Follstad Shah, J.J. Stoichiometry of microbial carbon use efficiency in soils. Ecol. Monogr. 2016, 86, 172–189. [Google Scholar] [CrossRef] [Scilit]
- Schimel, J.; Weintraub, M.N.; Moorhead, D. Estimating microbial carbon use efficiency in soil: Isotope-based and enzyme-based methods measure fundamentally different aspects of microbial resource use. Soil Biol. Biochem. 2022, 169, 108677. [Google Scholar] [CrossRef] [Scilit]
- Sun, L.; Chen, J.; Qiao, Y.; Moorhead, D.L.; Wanek, W.; Ochoa-Hueso, R.; Lin, Y. Revisiting ecoenzymatic stoichiometry models for improved understanding of microbial resource limitations. Soil Biol. Biochem. 2026, 222, 110280. [Google Scholar] [CrossRef] [Scilit]
- POWO. Plants of the World Online. Facilitated by the Royal Botanic Gardens, Kew. Sophora alopecuroides L. 2026. Available online: https://powo.science.kew.org/taxon/urn:lsid:ipni.org:names:518788-1 (accessed on 22 September 2026).
- Wang, X.L.; Cui, D.; Yang, H.J.; Yan, J.J.; Cao, W.Q.; Liu, H.J.; Zhang, J.; Sha, W.L. Effects of Sophora alopecuroides invasion on soil nutrients and active organic carbon components at different altitudes in Yili valley steppe. Environ. Chem. 2021, 40, 1232–1242. (In Chinese) [Google Scholar] [CrossRef]
- Lu, R.K. (Ed.) Methods of Soil Agricultural Chemical Analysis; China Agricultural Science and Technology Press: Beijing, China, 2000. (In Chinese) [Google Scholar]
- Chen, H.; Zhao, X.; Chen, X.; Lin, Q.; Li, G. Seasonal changes of soil microbial C, N, P and associated nutrient dynamics in a semiarid grassland of north China. Appl. Soil Ecol. 2018, 128, 89–97. [Google Scholar] [CrossRef] [Scilit]
- He, Y.; DeSutter, T.; Prunty, L.; Hopkins, D.; Jia, X.; Wysocki, D.A. Evaluation of 1:5 soil to water extract electrical conductivity methods. Geoderma 2012, 185–186, 12–17. [Google Scholar] [CrossRef] [Scilit]
- Nelson, D.W.; Sommers, L.E. Total Carbon, Organic Carbon, and Organic Matter. In Methods of Soil Analysis, Part 3: Chemical Methods; Sparks, D.L., Ed.; SSSA Book Series; Soil Science Society of America and American Society of Agronomy: Madison, WI, USA, 1996; Volume 5, pp. 961–1010. [Google Scholar] [CrossRef] [Scilit]
- Bremner, J.M. Nitrogen–Total. In Methods of Soil Analysis, Part 3: Chemical Methods; Sparks, D.L., Ed.; SSSA Book Series; Soil Science Society of America and American Society of Agronomy: Madison, WI, USA, 1996; Volume 5, pp. 1085–1121. [Google Scholar] [CrossRef] [Scilit]
- Mulvaney, R.L. Nitrogen—Inorganic Forms. In Methods of Soil Analysis, Part 3: Chemical Methods; Sparks, D.L., Ed.; SSSA Book Series; Soil Science Society of America and American Society of Agronomy: Madison, WI, USA, 1996; Volume 5, pp. 1123–1184. [Google Scholar] [CrossRef] [Scilit]
- Brookes, P.C.; Powlson, D.S.; Jenkinson, D.S. Measurement of microbial biomass phosphorus in soil. Soil Biol. Biochem. 1982, 14, 319–329. [Google Scholar] [CrossRef] [Scilit]
- Brookes, P.C.; Landman, A.; Pruden, G.; Jenkinson, D.S. Chloroform fumigation and the release of soil nitrogen: A rapid direct extraction method to measure microbial biomass nitrogen in soil. Soil Biol. Biochem. 1985, 17, 837–842. [Google Scholar] [CrossRef] [Scilit]
- Vance, E.D.; Brookes, P.C.; Jenkinson, D.S. An extraction method for measuring soil microbial biomass C. Soil Biol. Biochem. 1987, 19, 703–707. [Google Scholar] [CrossRef] [Scilit]
- Joergensen, R.G. The fumigation-extraction method to estimate soil microbial biomass: Calibration of the kEC value. Soil Biol. Biochem. 1996, 28, 25–31. [Google Scholar] [CrossRef] [Scilit]
- Joergensen, R.G.; Mueller, T. The fumigation-extraction method to estimate soil microbial biomass: Calibration of the kEN value. Soil Biol. Biochem. 1996, 28, 33–37. [Google Scholar] [CrossRef] [Scilit]
- Han, C.; Zhou, W.; Gu, Y.; Wang, J.; Zhou, Y.; Xue, Y.; Shi, Z.; Siddique, K.H.M. Effects of tillage regime on soil aggregate-associated carbon, enzyme activity, and microbial community structure in a semiarid agroecosystem. Plant Soil 2024, 498, 543–559. [Google Scholar] [CrossRef] [Scilit]
- Bell, C.W.; Fricks, B.E.; Rocca, J.D.; Steinweg, J.M.; McMahon, S.K.; Wallenstein, M.D. High-throughput fluorometric measurement of potential soil extracellular enzyme activities. J. Vis. Exp. 2013, 81, e50961. [Google Scholar] [CrossRef] [Scilit] [PubMed]
- Puissant, J. Does the C:N:P 1:1:1 ratio hold? Examining log-transformation bias in enzyme stoichiometry. Glob. Change Biol. 2025, 31, e70228. [Google Scholar] [CrossRef] [Scilit] [PubMed]
- Moorhead, D.L.; Sinsabaugh, R.L.; Hill, B.H.; Weintraub, M.N. Vector analysis of ecoenzyme activities reveal constraints on coupled C, N and P dynamics. Soil Biol. Biochem. 2016, 93, 1–7. [Google Scholar] [CrossRef] [Scilit]
- Cui, Y.; Moorhead, D.L.; Peng, S.; Sinsabaugh, R.L.; Peñuelas, J. Predicting microbial nutrient limitations from a stoichiometry-based threshold framework. Innov. Geosci. 2024, 2, 100048. [Google Scholar] [CrossRef] [Scilit]
- Sinsabaugh, R.L.; Follstad Shah, J.J. Ecoenzymatic stoichiometry and ecological theory. Annu. Rev. Ecol. Evol. Syst. 2012, 43, 313–343. [Google Scholar] [CrossRef] [Scilit]
- Cui, Y.; Moorhead, D.L.; Guo, X.; Peng, S.; Wang, Y.; Zhang, X.; Fang, L. Stoichiometric models of microbial metabolic limitation in soil systems. Glob. Ecol. Biogeogr. 2021, 30, 2297–2311. [Google Scholar] [CrossRef] [Scilit]
- Sun, D.; Fan, J.; Fang, S.; Ye, C.; Li, S.; Li, X. Nutrient limitation and ecological chemicalometry reveal the impacts of long-term continuous cropping on lavender rhizosphere soil. Sustainability 2026, 18, 4809. [Google Scholar] [CrossRef] [Scilit]
- Cohen, J. A coefficient of agreement for nominal scales. Educ. Psychol. Meas. 1960, 20, 37–46. [Google Scholar] [CrossRef] [Scilit]
- Lex, A.; Gehlenborg, N.; Strobelt, H.; Vuillemot, R.; Pfister, H. UpSet: Visualization of intersecting sets. IEEE Trans. Vis. Comput. Graph. 2014, 20, 1983–1992. [Google Scholar] [CrossRef] [Scilit] [PubMed]
- Kunito, T.; Moro, H.; Mise, K.; Sawada, K.; Otsuka, S.; Nagaoka, K.; Fujita, K. Ecoenzymatic stoichiometry as a temporally integrated indicator of nutrient availability in soils. Soil Sci. Plant Nutr. 2024, 70, 246–269. [Google Scholar] [CrossRef] [Scilit]
- Mooshammer, M.; Wanek, W.; Zechmeister-Boltenstern, S.; Richter, A. Stoichiometric imbalances between terrestrial decomposer communities and their resources: Mechanisms and implications of microbial adaptations to their resources. Front. Microbiol. 2014, 5, 22. [Google Scholar] [CrossRef] [Scilit] [PubMed]
- Huang, X.; Luo, C.; Ma, F.; Niu, P.; Zhang, X.; Zhou, Y.; Chu, G.; Wang, M.; Luo, H. Appropriate nitrogen addition promoted the accumulation of nutrients and biomass by enhancing the nodule nitrogen fixation characteristic and nutrient utilization efficiency of Sophora alopecuroides under salt stress. Ind. Crops Prod. 2025, 232, 121279. [Google Scholar] [CrossRef] [Scilit]
- Allison, S.D.; Weintraub, M.N.; Gartner, T.B.; Waldrop, M.P. Evolutionary-economic principles as regulators of soil enzyme production and ecosystem function. In Soil Enzymology; Shukla, G., Varma, A., Eds.; Soil Biology; Springer: Berlin/Heidelberg, Germany, 2010; Volume 22, pp. 229–243. [Google Scholar] [CrossRef] [Scilit]
- Zhang, H.; Liu, X.; Long, J.; Yang, T.; Huo, H.; Jia, C.; Yi, L.; Herath, S.; Peng, X. Phosphorus addition stimulates overall carbon acquisition enzymes but suppresses overall phosphorus acquisition enzymes: A global meta-analysis. Agric. Ecosyst. Environ. 2024, 375, 109219. [Google Scholar] [CrossRef] [Scilit]
- Spohn, M.; Kuzyakov, Y. Phosphorus mineralization can be driven by microbial need for carbon. Soil Biol. Biochem. 2013, 61, 69–75. [Google Scholar] [CrossRef] [Scilit]
- Kuzyakov, Y.; Xu, X. Competition between roots and microorganisms for nitrogen: Mechanisms and ecological relevance. New Phytol. 2013, 198, 656–669. [Google Scholar] [CrossRef] [Scilit] [PubMed]
- Richardson, A.E.; Simpson, R.J. Soil microorganisms mediating phosphorus availability update on microbial phosphorus. Plant Physiol. 2011, 156, 989–996. [Google Scholar] [CrossRef] [Scilit] [PubMed]
- Mori, T. The newly proposed threshold for enzymatic stoichiometry: A reliable solution? Soil Biol. Biochem. 2025, 209, 109886. [Google Scholar] [CrossRef] [Scilit]
- Zhai, Z.; Lin, L.; Li, T.; Bu, Z.; Wang, M. Enzymatic stoichiometry and vector characteristics can indicate microbial resource limitation: Empirical evidence from experiment with multiple nutrient addition. Ecosystems 2025, 28, 4. [Google Scholar] [CrossRef] [Scilit]
- Sinsabaugh, R.L.; Lauber, C.L.; Weintraub, M.N.; Ahmed, B.; Allison, S.D.; Crenshaw, C.; Contosta, A.R.; Cusack, D.; Frey, S.; Gallo, M.E.; et al. Stoichiometry of soil enzyme activity at global scale. Ecol. Lett. 2008, 11, 1252–1264. [Google Scholar] [CrossRef] [Scilit] [PubMed]
- Sun, C.; Liu, J.; Zhao, L.; Wang, S.; Zuo, C.; Zhao, Z.; Wilkes, A.; Luo, C. Soil extracellular enzyme stoichiometry and microbial nutrient constraints: Implications for grassland sustainability in the Qilian Mountains. Sustainability 2026, 18, 5567. [Google Scholar] [CrossRef] [Scilit]
- Rosinger, C.; Rousk, J.; Sandén, H. Can enzymatic stoichiometry be used to determine growth-limiting nutrients for microorganisms? A critical assessment in two subtropical soils. Soil Biol. Biochem. 2019, 128, 115–126. [Google Scholar] [CrossRef] [Scilit]
- Mori, T.; Rosinger, C.; Margenot, A.J. Enzymatic C:N:P stoichiometry: Questionable assumptions and inconsistencies to infer soil microbial nutrient limitation. Geoderma 2023, 429, 116242. [Google Scholar] [CrossRef] [Scilit]

Disclaimer/Publisher’s Note: The statements, opinions and data contained in all publications are solely those of the individual author(s) and contributor(s) and not of MDPI and/or the editor(s). MDPI and/or the editor(s) disclaim responsibility for any injury to people or property resulting from any ideas, methods, instructions or products referred to in the content. |
© 2026 by the authors. Licensee MDPI, Basel, Switzerland. This article is an open access article distributed under the terms and conditions of the Creative Commons Attribution (CC BY) license.