


Abstract
Climate warming and demographic change pose interconnected challenges to urban sustainability, particularly for older adults and children who may face limited access to urban parks and elevated summer land surface temperatures. However, existing studies often examine park accessibility and thermal conditions separately, providing limited understanding of the fine-scale spatial mismatches among park accessibility, population distribution, and surface temperature across these two age groups. From a climate justice and urban sustainability perspective, this study develops a three-dimensional spatial screening framework integrating these dimensions, using the main urban area of Hefei, China, as a case study. Based on road-network data, WorldPop gridded population data, and MODIS/Terra MOD11A2 land surface temperature (LST) data for July 2024, park accessibility for older adults and children was assessed using the two-step floating catchment area (2SFCA) method. Bivariate local indicators of spatial association (Bi-LISA) were employed to identify local accessibility–population associations, which were subsequently overlaid with high-LST hotspots to delineate dual-vulnerability zones. The results indicate that: (1) pronounced inequality exists in modeled park accessibility, with population-weighted Gini coefficients based on normalized accessibility scores of 0.988 for children and 0.875 for older adults; (2) LH-type clusters, characterized by low accessibility at focal grid cells associated with high population density in neighboring cells, are concentrated in the old city core for both groups; and (3) dual-vulnerability zones account for 7.5% of the study area’s mapped area for older adults and 6.6% for children. These percentages represent area-based shares rather than population-based heat-exposure rates. Shared-risk areas are concentrated in the urban core, whereas age-specific risk areas are more fragmented along the periphery. By linking intergenerational equity in green-infrastructure accessibility with the spatial targeting of heat-adaptation interventions, this framework provides empirical evidence to support equitable green-infrastructure provision, age-inclusive climate adaptation, and more inclusive, climate-resilient, and sustainable urban development.
1. Introduction
Against the backdrop of global warming, the frequency and intensity of heatwaves continue to increase, while the urban heat island (UHI) effect further exacerbates heat exposure risks for residents in high-density built environments [1,2]. Simultaneously, China is experiencing rapid population aging, with the phenomenon of “aging in place” becoming particularly prominent in older urban districts [3,4]. Furthermore, the development of “child-friendly cities” has emerged as a core agenda in new urbanization strategies [5,6]. The physical spatial convergence of these triple challenges—extreme heatwaves, population aging, and child-friendly urban development—increasingly highlights the critical role of urban parks as local “cool islands” and daily recreational spaces [7,8]. However, under the dual pressures of climate change and demographic transitions, there remains a lack of systematic empirical research on whether a differentiated spatial mismatch exists between park supply and heat exposure among older adults and children [9].
Spatial equity in park accessibility is a fundamental topic in urban geography and environmental justice research [10,11]. Early studies primarily focused on the spatial equilibrium of park supply, later gradually shifting toward analyzing differentiated deprivation among various socioeconomic groups [12,13]. Recently, the equity of green space access for vulnerable groups, such as older adults and children, has garnered increasing attention [14,15,16]. Nevertheless, most studies focus solely on a single demographic, lacking a simultaneous comparison between the two core intergenerational groups of older adults and children [17,18]. Additionally, existing research predominantly relies on global measurements based on homogeneous population assumptions, failing to profoundly reveal the structural differences in accessing public resources caused by the physiological patterns and mobility limitations of different age groups [19,20,21].
From another perspective, thermal environmental justice research reveals the social differentiation of urban heat exposure [22,23,24]. Extensive empirical evidence indicates that older adults and children are more vulnerable to heat stress due to higher physiological thermal sensitivity, and they frequently reside in areas with elevated heat exposure risks [25,26]. Previous studies have examined urban park accessibility, green-space cooling services, and the equity implications of their spatial distribution, providing important foundations for understanding the relationship between green infrastructure and environmental justice [9,27,28,29]. However, a key question remains: whether and where insufficient park accessibility and elevated summer heat coincide spatially for different age groups, and how such compound risks differ between older adults and children. Rather than examining accessibility equity and thermal conditions as separate dimensions, this study adopts a staged spatial diagnostic approach that links three dimensions: park accessibility, the spatial distribution of the target populations, and heat exposure represented by land surface temperature (LST). Specifically, the two-step floating catchment area (2SFCA) method measures park accessibility, bivariate local indicators of spatial association (Bi-LISA) identify local mismatches between accessibility and population density, and the overlay of LST-derived heat hotspots with these mismatch areas identifies locations where accessibility deprivation and elevated surface temperatures coincide. This approach extends the analysis from assessing accessibility inequalities or cooling-related spatial disparities individually to identifying compound spatial vulnerability and examining its intergenerational similarities and differences. Accordingly, two research gaps motivate this study. First, further spatially explicit analysis is needed to connect population-sensitive park accessibility with LST-based heat conditions within a unified diagnostic framework. Second, comparative evidence remains needed on the spatial overlap and divergence of compound vulnerability between older adults and children, particularly in relation to the joint pressures of park-accessibility deprivation and elevated surface temperatures.
Addressing these research gaps and adopting a climate justice perspective, this study uses the main urban area of Hefei—a typical high-density city—as a case study to propose three core research questions: (i) What are the similarities and differences in the targeted spatial mismatch patterns between urban park accessibility and the older adult/child populations in Hefei? (ii) When these accessibility–population mismatch patterns are overlaid with LST-derived summer heat hotspots, which areas are identified as dual vulnerability zones requiring priority intervention? (iii) What intergenerational divergences emerge between older adults and children concerning global and local spatial equity (measured by Gini coefficients and mismatch clustering)?
To answer these questions, this study integrates multi-source spatial data, including high-resolution age- and sex-structured gridded population data from WorldPop [30], MODIS/Terra MOD11A2 V061 land surface temperature (LST) data for July 2024 [31], real-world road networks (OpenStreetMap, OSM) [32], and park points of interest (POI). Intergenerational park accessibility is precisely measured using the two-step floating catchment area (2SFCA) method [33]. Subsequently, bivariate local spatial autocorrelation (Bi-LISA) is employed to diagnose micro-spatial mismatches, followed by the overlay of July 2024 LST-derived high-temperature hotspots to identify compound dual vulnerability zones [34,35].
The core contributions of this study are as follows: Theoretically, it integrates intergenerational equity and thermal environmental justice into a unified framework, revealing the “trap of average equity” in urban resource allocation. Methodologically, its contribution lies in the staged integration of three complementary analytical dimensions rather than in proposing a new standalone algorithm: (1) 2SFCA-based assessment of park accessibility, (2) Bi-LISA-based identification of local accessibility–population mismatches, and (3) LST-based heat-hotspot identification and spatial overlay to delineate compound vulnerability zones. This framework distinguishes areas where park-accessibility deprivation coincides with elevated surface temperatures from areas characterized by accessibility mismatch or heat hotspots alone. By applying the same diagnostic procedure to older adults and children, the study further examines the spatial overlap and divergence of compound vulnerability between the two age groups. Practically, it provides a scientific, empirical targeting basis for implementing precise resource allocation and differentiated climate-adaptive planning within the dual contexts of age-friendly and child-friendly urban development.
From a broader urban sustainability perspective, the framework links equitable access to urban green infrastructure with spatially targeted heat adaptation. By identifying where park-accessibility deprivation coincides with relatively high surface temperatures among different age groups, this study provides empirical evidence to support more inclusive and climate-resilient urban development.
2. Study Area and Data
2.1. Study Area Overview
Hefei is the capital of Anhui Province and a sub-center of the Yangtze River Delta urban agglomeration [36]. This study focuses on the main urban area (built-up area) of Hefei, a region concentrating the city’s densest built environments and population activities [37]. Hefei features a subtropical monsoon climate characterized by hot and humid summers. Driven by the frequent occurrence of extreme heatwaves in recent years, the urban heat island (UHI) effect and associated thermal environmental risks have become increasingly prominent [38].
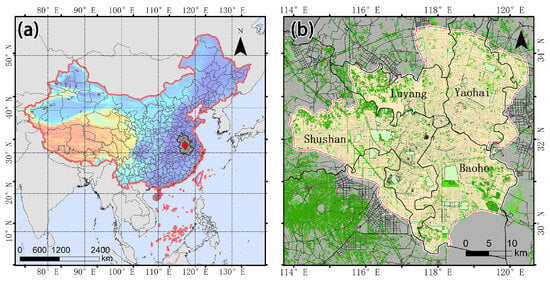
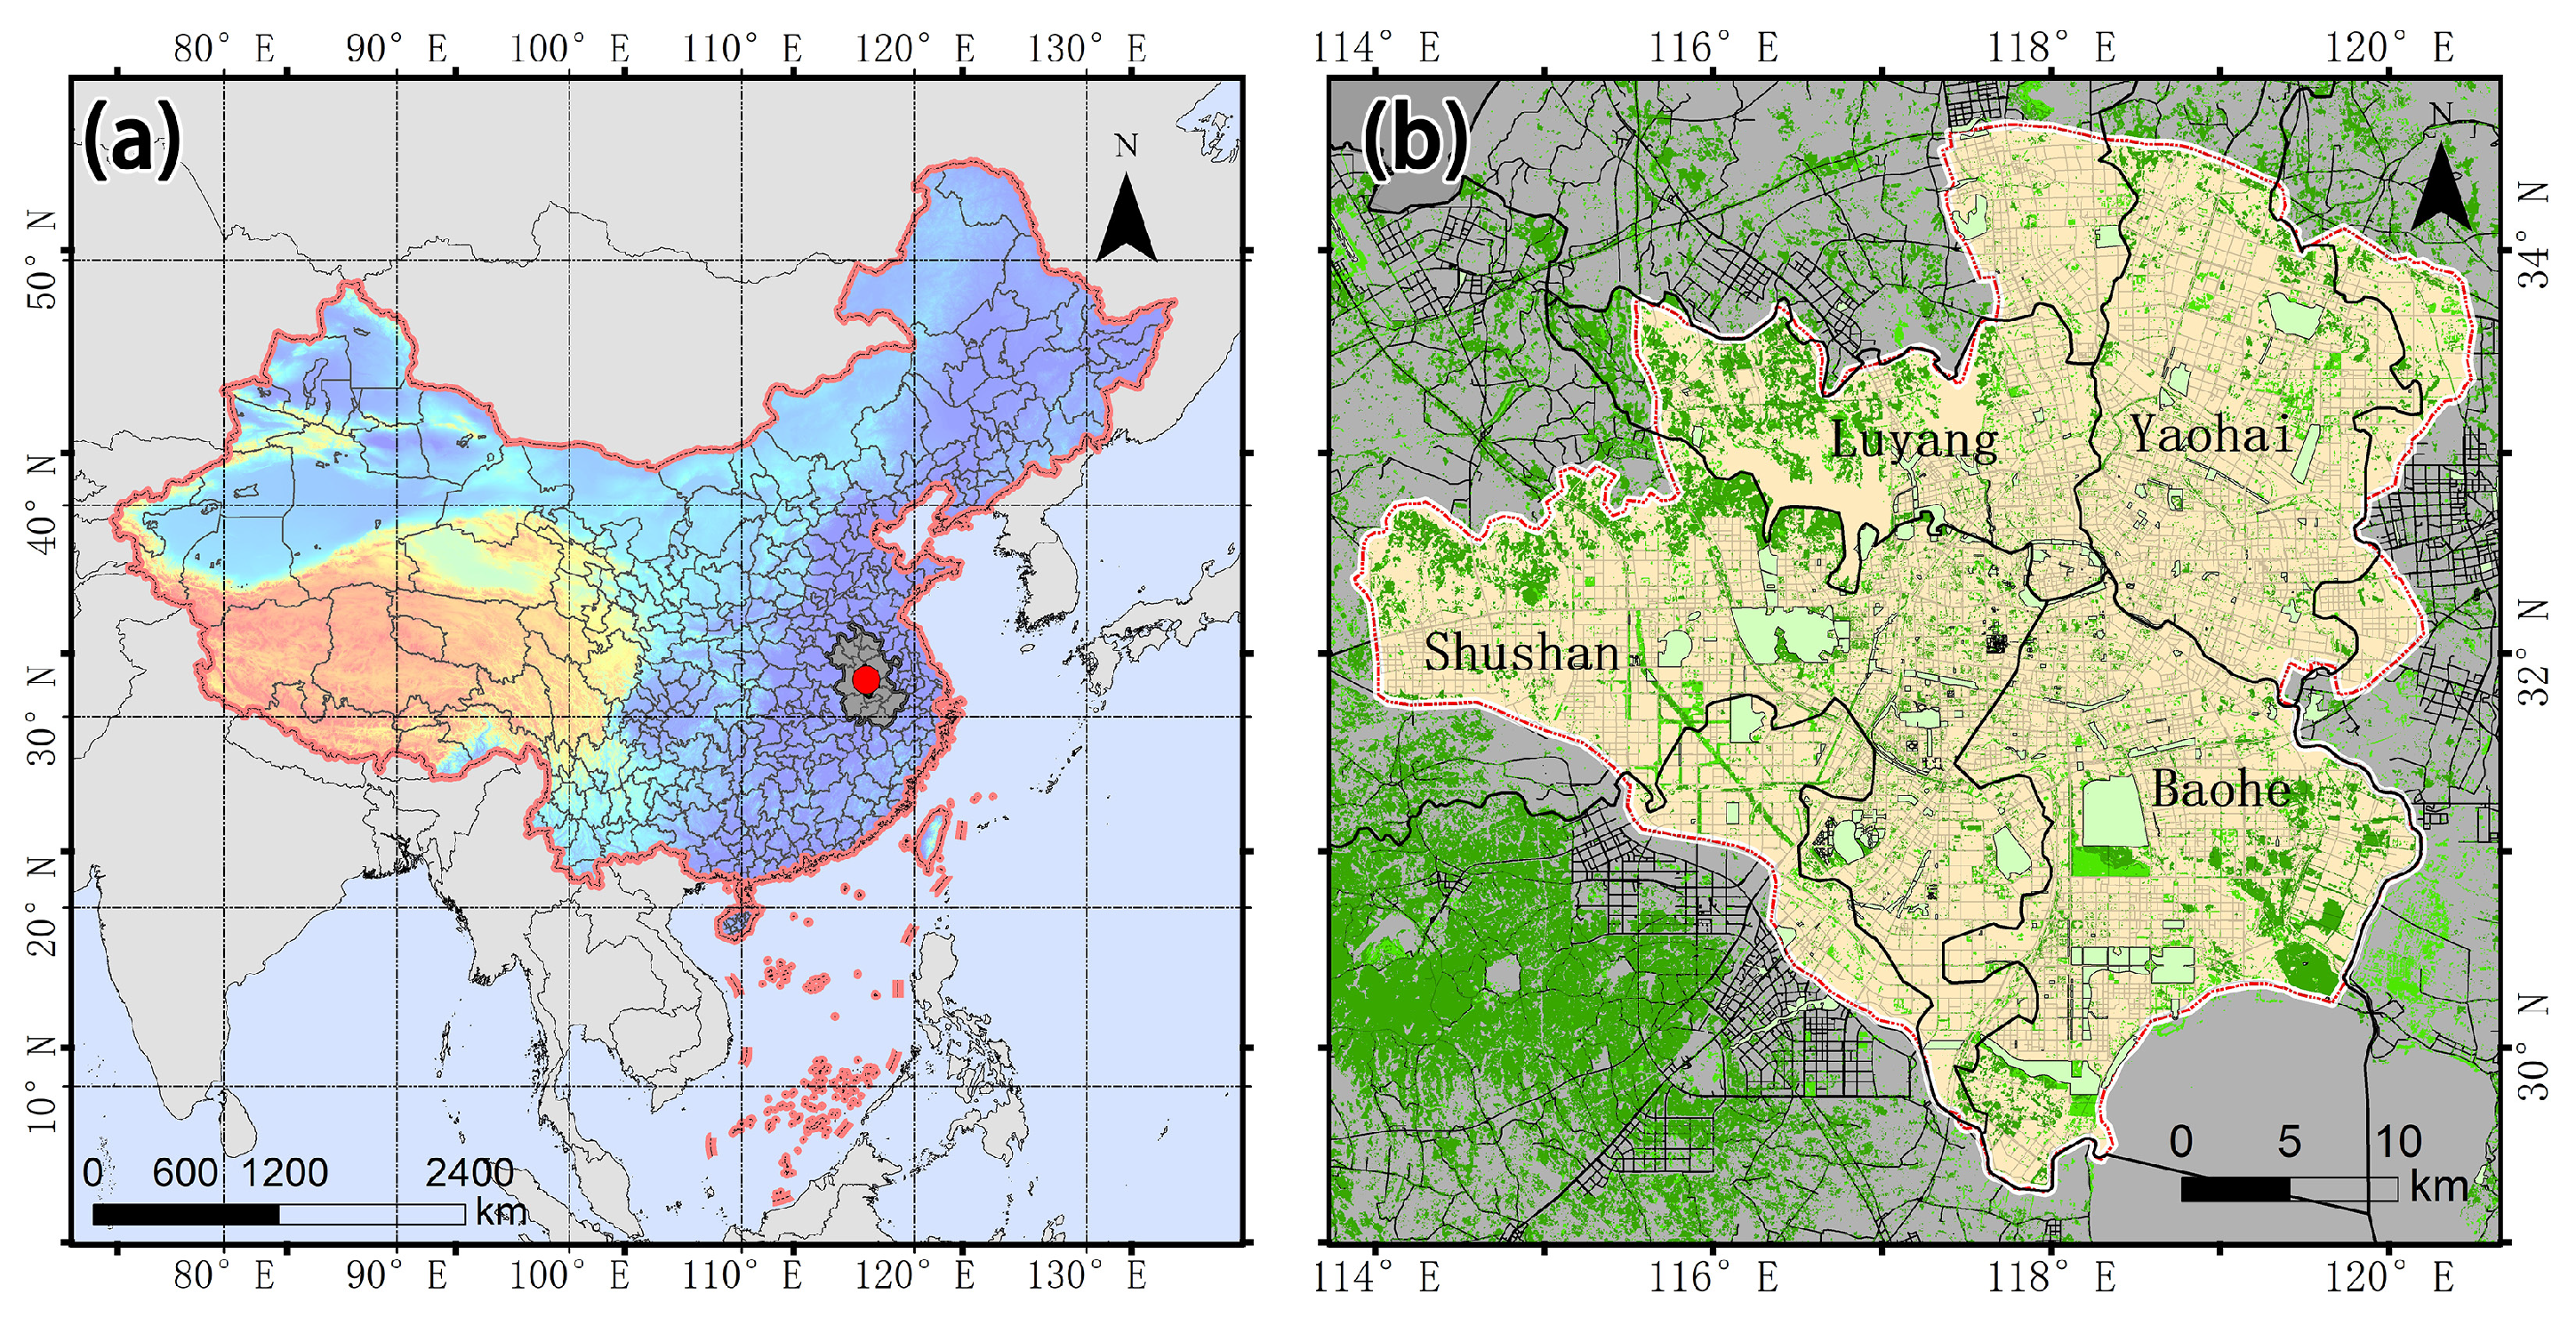
Regarding demographic evolution, the urban development of Hefei has entered a phase of quality-oriented enhancement [39]. On the one hand, the old city core exhibits a significant trend of “aging in place”; on the other hand, driven by the influx of young labor into new urban districts, the demand for public spaces among school-aged children has surged in localized areas. The supply–demand conflicts exacerbated by the dual pressures of climate change and demographic transitions render Hefei an ideal empirical case for investigating intergenerational environmental justice and climate-adaptive planning in high-density cities (Figure 1).
Figure 1.
Location of the study area. (a) Location of Hefei in China. The color gradient from blue to orange represents elevation, and the red dot indicates the location of the study area. (b) Built-up area of Hefei. The yellow area represents the urban built-up area, and the green areas indicate green spaces and parks within the study area.
2.2. Data Sources and Preprocessing
This study integrates multi-source geospatial data to construct the evaluation model. All spatial data were uniformly reprojected to the WGS_1984_UTM_Zone_50N coordinate system to eliminate analytical errors caused by projection distortion. The specific data sources and preprocessing procedures are detailed as follows (Table 1):
Table 1.
Overview of data sources and preprocessing.
(i) Park and road network data: Urban park data, including points of interest (POI) and area of interest (AOI) data, were obtained from the Amap API in 2024. Park POI data were used to identify park locations and served as destination points in the 2SFCA analysis, while AOI polygons were used to delineate park boundaries and derive park areas. Restricted-access green spaces (e.g., golf courses) were excluded from the analysis [40]. Pedestrian road network data were sourced from OpenStreetMap (OSM) in 2024. A refined pedestrian network dataset for 2SFCA measurement was constructed following topological checks, dangling-node repairs, and the removal of highways and restricted road segments within a geographic information system (GIS) platform. Park POI locations were used as proxies for park destinations rather than verified physical entrances. Park area was used as a proxy for potential park supply; however, this indicator does not directly capture usable recreational space, facility provision, or actual visitor capacity. These data and indicator limitations should be considered when interpreting the resulting accessibility estimates.
(ii) Land surface temperature data: Daytime land surface temperature (LST) data were obtained from the MODIS/Terra MOD11A2 V061 product distributed by the NASA Land Processes Distributed Active Archive Center (LP DAAC) [31]. MOD11A2 provides 8-day composite LST observations at a nominal spatial resolution of 1 km. Four 8-day composite products with nominal start dates in July 2024 were used to estimate July LST. The original HDF-EOS2 data were converted to GeoTIFF format and reprojected to the WGS 1984 UTM Zone 50N coordinate system. The resulting LST data were integrated with the 500-m analytical grid for spatial analysis. Because the native spatial resolution of MOD11A2 is 1 km, the 500-m analytical grid does not increase the intrinsic spatial resolution of the satellite observations.
(iii) Targeted population and administrative data: High-resolution (100-m) age- and sex-structured gridded population estimates for 2024 were obtained from the WorldPop dataset. The population estimates for children (0–14 years) and older adults (≥65 years) were extracted and aggregated to the 500-m analytical grids using Zonal Statistics.
3. Methods
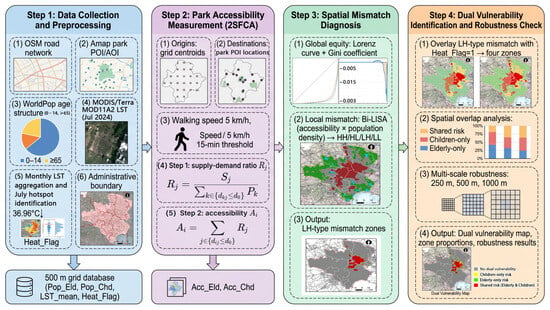
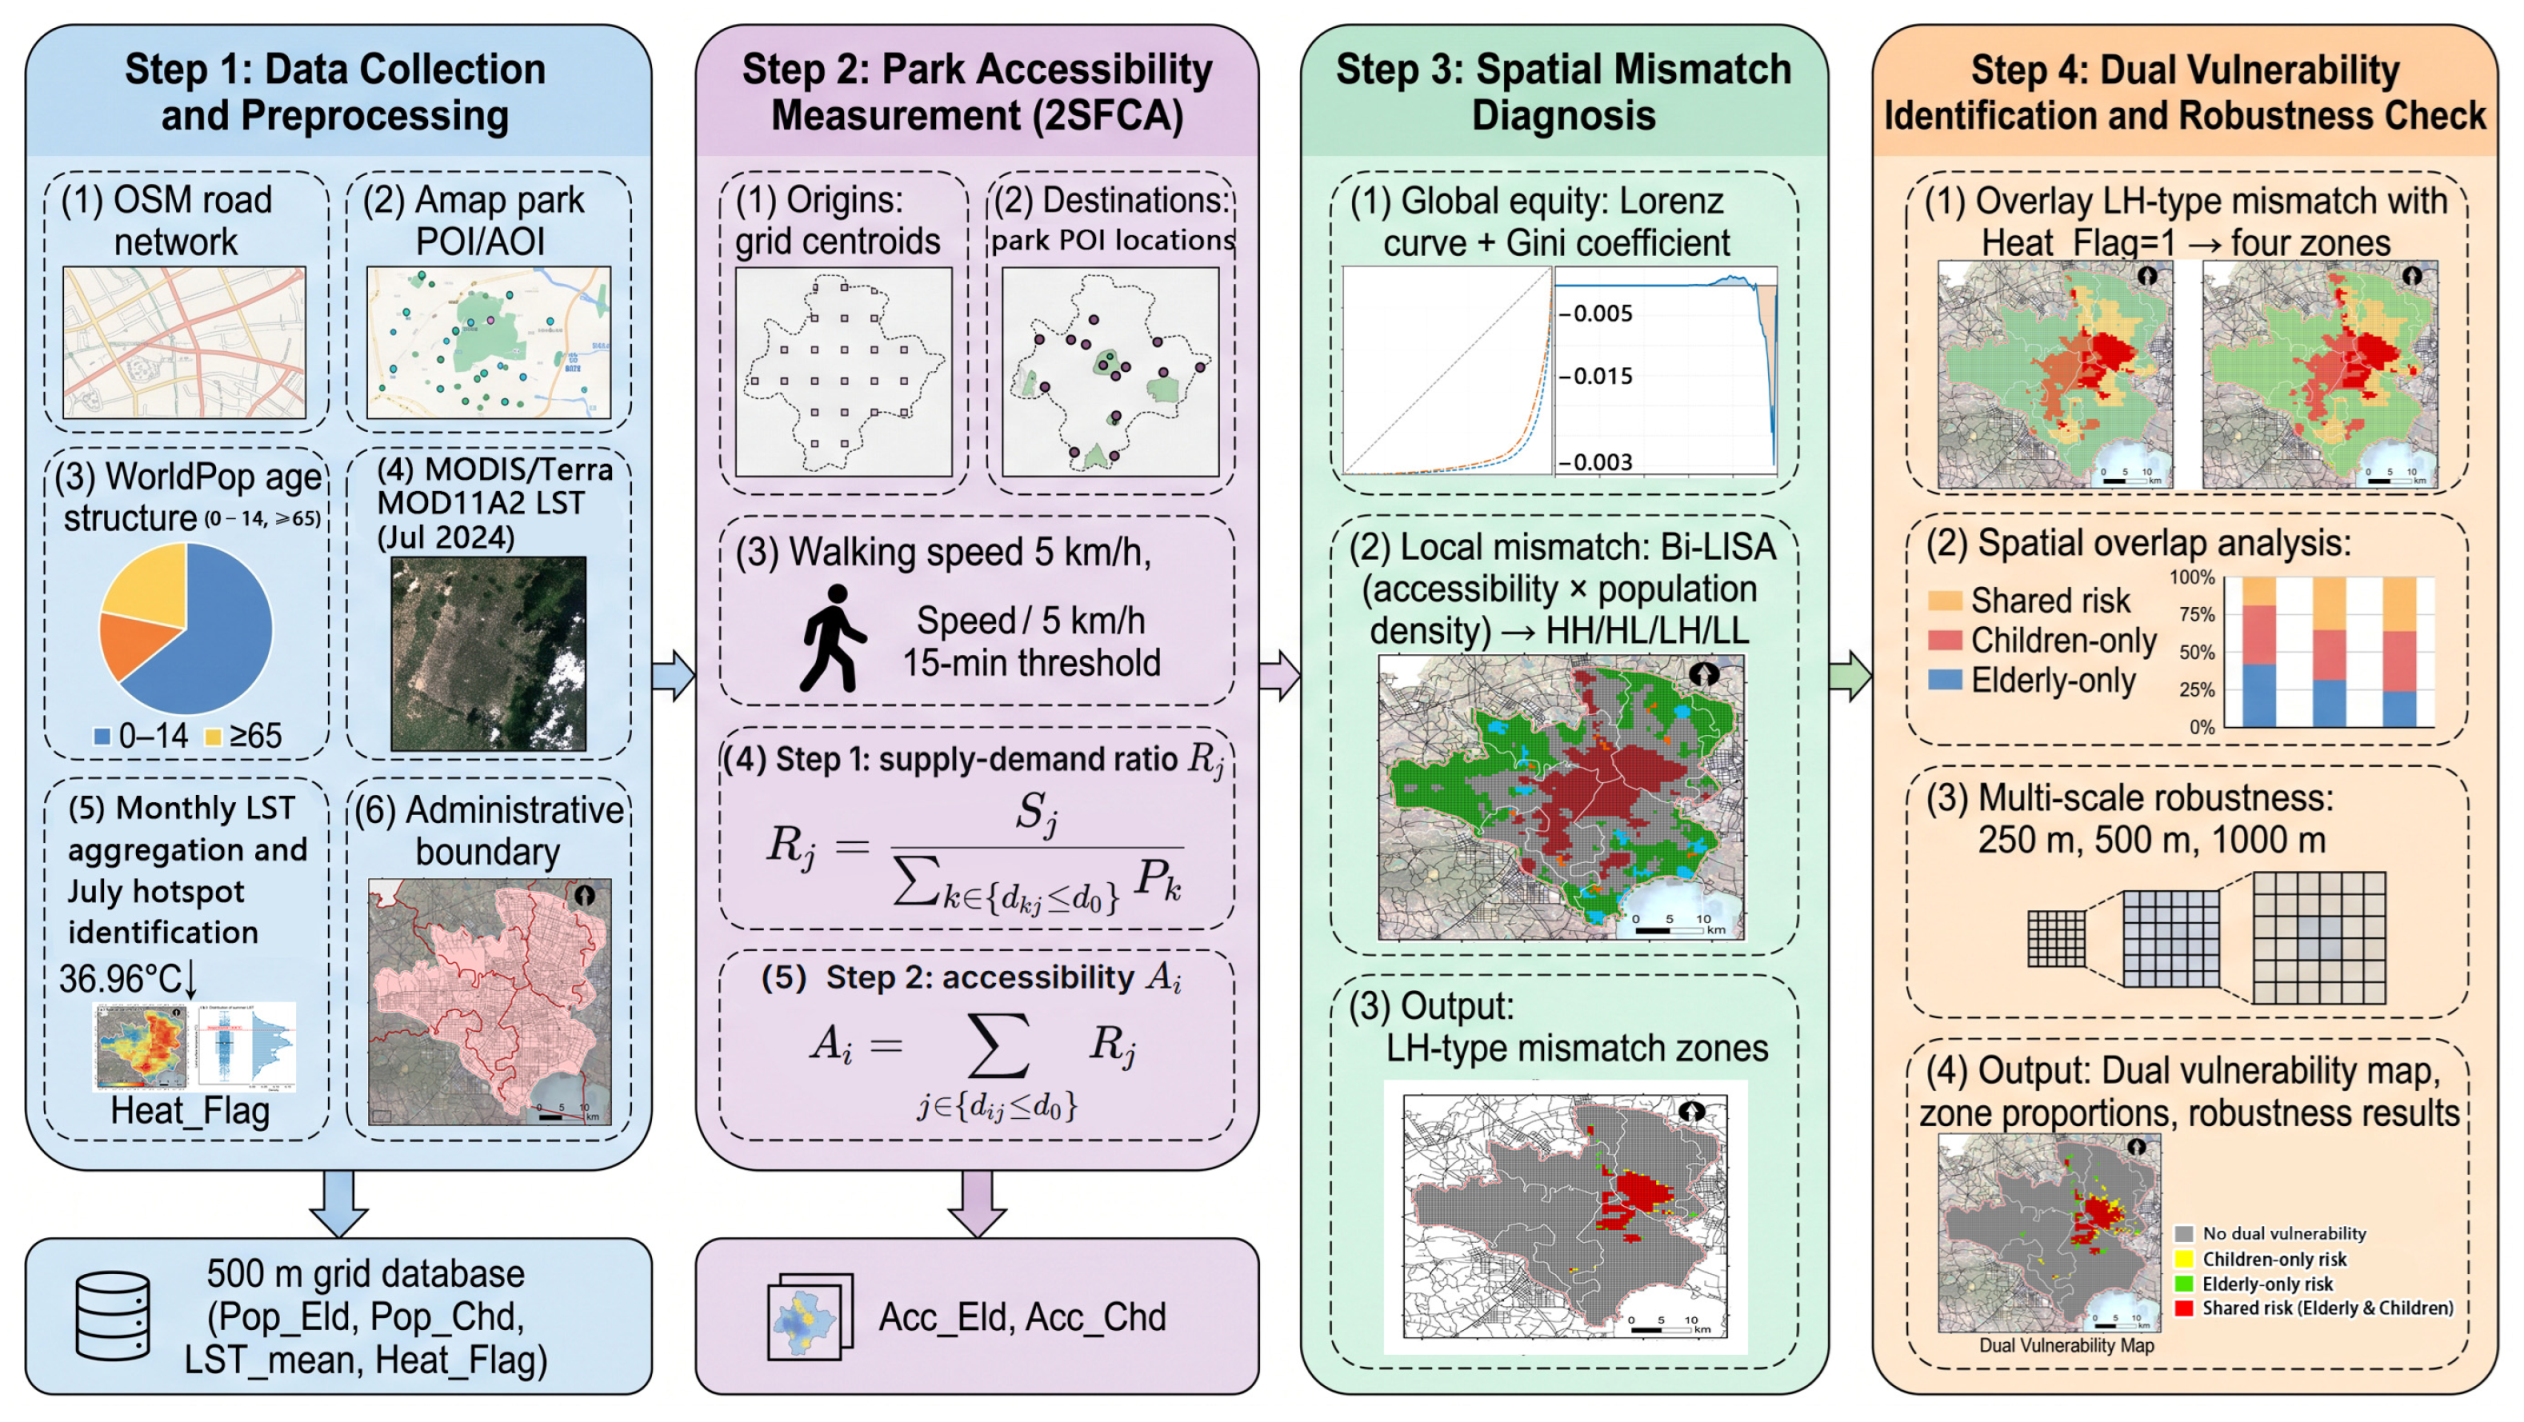
This study constructs a three-dimensional spatial risk diagnostic framework comprising four progressive stages (Figure 2). First (Step 1), multi-source data integration and preprocessing are conducted to construct a unified 500-m resolution grid database, extract targeted population distributions for older adults and children, and retrieve summer land surface temperatures (LST) to delineate high heat exposure risk zones. Second (Step 2), based on actual pedestrian road networks, the two-step floating catchment area (2SFCA) method is employed to independently measure the spatial park accessibility for older adults and children. Third (Step 3), the Lorenz curve, Gini coefficient, and bivariate local spatial autocorrelation (Bi-LISA) are used to assess global accessibility inequality and local accessibility–population associations, identifying LH-type clusters defined as low accessibility at focal grid cells associated with high population density in neighboring cells. Finally (Step 4), a three-dimensional spatial overlay of the LH-type mismatch zones and high heat risk zones is performed to delineate compound dual vulnerability zones. This facilitates an in-depth analysis of the risk overlap and divergence characteristics between the two demographic groups, while multi-scale calculations (250 m, 500 m, and 1000 m) are conducted to ensure the robustness of the findings.
Figure 2.
Overall analytical framework of the study, including four stages: (Step 1) data collection and preprocessing; (Step 2) park accessibility measurement using the two-step floating catchment area (2SFCA) method; (Step 3) spatial mismatch diagnosis using the Lorenz curve, Gini coefficient, and bivariate local indicators of spatial association (Bi-LISA); and (Step 4) dual-vulnerability identification and multi-scale robustness checks.
3.1. Delineation of Analytical Units and Multi-Source Data Fusion
To precisely characterize the spatial heterogeneity of urban park supply–demand dynamics and environmental risks at a micro scale, this study delineates the built-up area of Hefei using a 500 m × 500 m regular grid as the fundamental spatial analytical unit. Subsequently, multi-source spatial data were uniformly resampled and reprojected into this grid framework. To determine targeted population exposure, Zonal Statistics was employed to extract the total number of older adults (aged ≥ 65, denoted as Pop_Eld) and children (aged 0–14, denoted as Pop_Chd) within each grid from the WorldPop dataset, followed by the calculation of grid-level population densities. Grid-level population density indicators were normalized to the range of 0 to 1 using min–max normalization. Before the Bi-LISA analysis, the population-density and accessibility variables were subsequently z-standardized, as described in Section 3.4.2.
3.2. Accessibility Measurement Based on the Two-Step Floating Catchment Area (2SFCA) Method
This study employs the two-step floating catchment area (2SFCA) method to measure the pedestrian accessibility of urban parks for older adults and children, integrating park supply, spatial population demand, and pedestrian-network impedance. With grid centroids designated as demand origins (O) and park POI locations designated as destination points (D), the walking speed is set at 5 km/h, and a 15-min walking-time threshold is adopted for both groups. The uniform walking speed and time threshold provide a common baseline for comparing accessibility patterns between the two age groups. At 5 km/h, a 15-min walking period corresponds to a nominal distance of 1.25 km under uninterrupted walking conditions. In this study, however, accessibility is determined by walking time along the pedestrian network rather than by a fixed straight-line distance.
The use of a uniform walking speed does not imply that children and older adults have identical mobility capabilities. Actual walking speeds may vary with age, physical condition, and individual circumstances. Consequently, this assumption may overestimate accessibility for some individuals with lower mobility and may affect the estimated accessibility scores and the spatial extent of identified mismatch zones. The results should therefore be interpreted as a standardized spatial comparison under common walking assumptions rather than as individualized estimates of actual mobility.
Park POI locations were used as proxies for park destinations because the analysis did not separately model verified physical entrances. For parks with large areas or entrances located far from their mapped POI locations, the use of POI points may introduce errors in estimated network travel times and accessibility. The 2SFCA calculation is conducted in two steps.
First, the supply-to-demand ratio (Rj) for each park (j) is calculated within its service threshold (set as a 15-min walking isochrone, i.e., d0 = 15),
where Sj is the area of park j (representing supply capacity), Pk is the targeted population within grid k, and dkj is the shortest network walking time from grid k to park j. Second, for each grid (i), the supply-to-demand ratios (Rj) of all accessible parks within the 15-min walking threshold are summed to derive the park accessibility score (Ai) for that grid.
A higher Ai value indicates a greater capacity for the grid to access the cooling and recreational services provided by urban parks.
The area-based supply indicator reflects potential spatial provision relative to population demand but does not directly measure usable recreational space, facility provision, service quality, or actual visitor capacity. Accordingly, the calculated accessibility scores should be interpreted as estimates of potential park accessibility rather than realized park service capacity.
To facilitate comparison and visualization, the raw 2SFCA accessibility scores were normalized separately for each target group using min–max normalization: Ai* = (Ai − Amin)/(Amax − Amin), where Ai is the raw accessibility score of grid cell i, and Amin and Amax are the minimum and maximum scores for the corresponding target group. The normalized accessibility scores range from 0 to 1 and were used for accessibility mapping and the population-weighted Gini calculations. Before Bi-LISA analysis, accessibility and population-density variables were subsequently z-standardized.
3.3. Land Surface Temperature Processing and Identification of High-LST Hotspots
Daytime LST representing the July-focused summer observation period was estimated using four MODIS/Terra MOD11A2 V061 8-day composite products with nominal start dates of 3, 11, 19, and 27 July 2024. The LST_Day_1km band was converted to Kelvin using the scale factor of 0.02 and then to degrees Celsius by subtracting 273.15. Pixels for which the two mandatory quality-assurance bits (bits 0–1) of the QC_Day layer were not equal to 00 were excluded. The valid LST values from the four composites were averaged to obtain a July LST estimate. The resulting data were integrated with the 500-m analytical grid to derive grid-level mean LST values (LST_mean). Given the native 1-km resolution of MOD11A2, the 500-m grid represents the analytical unit rather than an increase in the intrinsic resolution of the thermal data.
To identify areas with relatively high summer surface temperatures, the mean-plus-one-standard-deviation method was applied to the July 2024 grid-level LST values. The hotspot threshold was defined as the spatial mean LST across the study area plus one standard deviation, as expressed in Equation (3):
where μ represents the mean of the July 2024 grid-level LST values across the study area, and σ denotes their standard deviation. Grid cells with LST_mean exceeding the threshold of 36.96 °C were classified as high-LST hotspots (Heat_Flag = 1); otherwise, they were classified as non-hotspots (Heat_Flag = 0).
LSThotspot > μ + σ
The mean-plus-one-standard-deviation criterion was adopted as a relative, distribution-based rule to identify grid cells with substantially higher LST than the study-area mean. Accordingly, 36.96 °C is a study-area-specific hotspot threshold derived from the July 2024 LST distribution, rather than an absolute physiological, meteorological, or public-health threshold for dangerous heat.
MODIS-derived LST represents radiometric land surface temperature, not near-surface air temperature or the full thermal conditions experienced by individuals. It does not directly capture the combined effects of humidity, wind, shading, individual activity, or indoor cooling conditions. Therefore, high-LST hotspots are interpreted as spatial indicators of relatively high summer surface temperatures for the subsequent overlay analysis, rather than as direct measurements of individual human heat exposure.
3.4. Targeted Spatial Equity Measurement and Mismatch Diagnosis
3.4.1. Global Equity: Gini Coefficient
To quantify the distributional equity of park accessibility among older adults and children at the macro level, this study introduces the Lorenz curve and the Gini coefficient. The Gini coefficient is calculated as follows:
The Gini coefficient is used to assess inequality in the distribution of urban park accessibility between the target populations of older adults and children. In constructing the Lorenz curve, grid cells are ranked in ascending order of normalized accessibility. The cumulative population share is calculated from the cumulative population of the corresponding target group, while the cumulative accessibility share is calculated from cumulative population-weighted normalized accessibility, defined as the product of the target population and the normalized grid-level accessibility score. Here, n denotes the number of intervals used in the numerical approximation of the Lorenz curve, Pi represents the cumulative proportion of the target population, and Ci represents the corresponding cumulative proportion of population-weighted normalized accessibility. The cumulative shares are expressed relative to their respective totals. In the computational implementation, the Lorenz curve was interpolated to 500 points, and the Gini coefficient was estimated from the area under the curve using the trapezoidal integration method.
Grid cells with zero accessibility are retained in the calculation. For grid cells containing a nonzero target population, zero accessibility contributes to the cumulative population share but not to the cumulative accessibility share. Grid cells with zero target population have zero population weight and do not contribute to the population-weighted distribution.
The min–max normalization of accessibility scores used for the Gini calculation is distinct from the subsequent z-standardization of accessibility and population-density variables for Bi-LISA analysis. In the Gini calculation, cumulative population and population-weighted normalized accessibility are expressed as proportions of their respective totals. Higher Gini coefficients indicate greater inequality in the distribution of modeled park accessibility among the target population.
3.4.2. Local Spatial Mismatch: Bivariate Local Moran’s I (Bi-LISA)
To diagnose the spatial mismatch patterns between park accessibility and targeted population density at the micro-grid scale, the bivariate local spatial autocorrelation (Bi-LISA) model is employed:
where denotes the standardized park accessibility value of focal grid cell i, denotes the standardized population density of the corresponding target group in neighboring grid cell j, and wij represents the spatial weight between grid cells i and j. The spatial weights matrix was constructed using the k-nearest neighbors (KNN) method based on grid coordinates, with (k = 8). The weights were row-standardized so that the weights associated with the neighbors of each grid cell sum to one.
The local bivariate Moran’s I statistic was calculated in Python (version 3.10.18) using the Moran_Local_BV function from the esda library (version 2.7.0), with spatial weights constructed using libpysal (version 4.13.0). Statistical significance was assessed using 999 random permutations and the resulting permutation-based pseudo-p-values psim. A significance threshold of psim < 0.05 was adopted. Grid cells satisfying this criterion were classified into four spatial association categories according to the signs of the focal-grid accessibility value and the spatially lagged population density: high accessibility–high neighboring population density (HH), low accessibility–high neighboring population density (LH), low accessibility–low neighboring population density (LL), and high accessibility–low neighboring population density (HL).
In this bivariate analysis, population density is an explicit component of the spatial association rather than an independent background characteristic. The LH category identifies focal grid cells with low park accessibility that are spatially associated with high population density in their neighboring grids, as defined by the KNN weights matrix. Accordingly, LH clusters indicate potential spatial mismatches between accessibility and surrounding population demand. These clusters represent statistically significant local spatial associations and should not be interpreted as direct evidence of individual park use or as proof of a causal relationship between population distribution and park accessibility.
3.5. Identification and Typological Definition of Dual Vulnerability Zones
Building upon the identified LH-type spatial deprivation zones, this study introduces a three-dimensional risk diagnostic framework by spatially overlaying them with the high heat risk zones (hotspots) identified via LST to delineate four climate-spatial intersection types (Table 2).
Table 2.
Typological definition of dual vulnerability zones.
3.6. Robustness Check of the Dual Vulnerability Identification Framework
In spatial analysis, variations in the scale of delineated grid units often exert potential impacts on statistical outcomes, a phenomenon known as the Modifiable Areal Unit Problem (MAUP). To assess the sensitivity of the results to the choice of analytical grid size, the 500-m grid-based workflow was repeated using 250-m and 1000-m grids. The Gini coefficients and the areal proportions of the vulnerability zones were compared across the three grid resolutions. This analysis evaluates the consistency of the results across the tested grid sizes but does not establish that the findings are independent of spatial scale. Moreover, the native spatial resolution of the MODIS/Terra LST data is 1 km, and finer analytical grids do not provide additional thermal information beyond that resolution.
4. Results and Analysis
4.1. Spatial Patterns of Park Accessibility and Heat Exposure
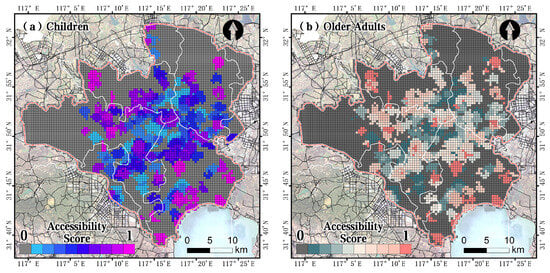
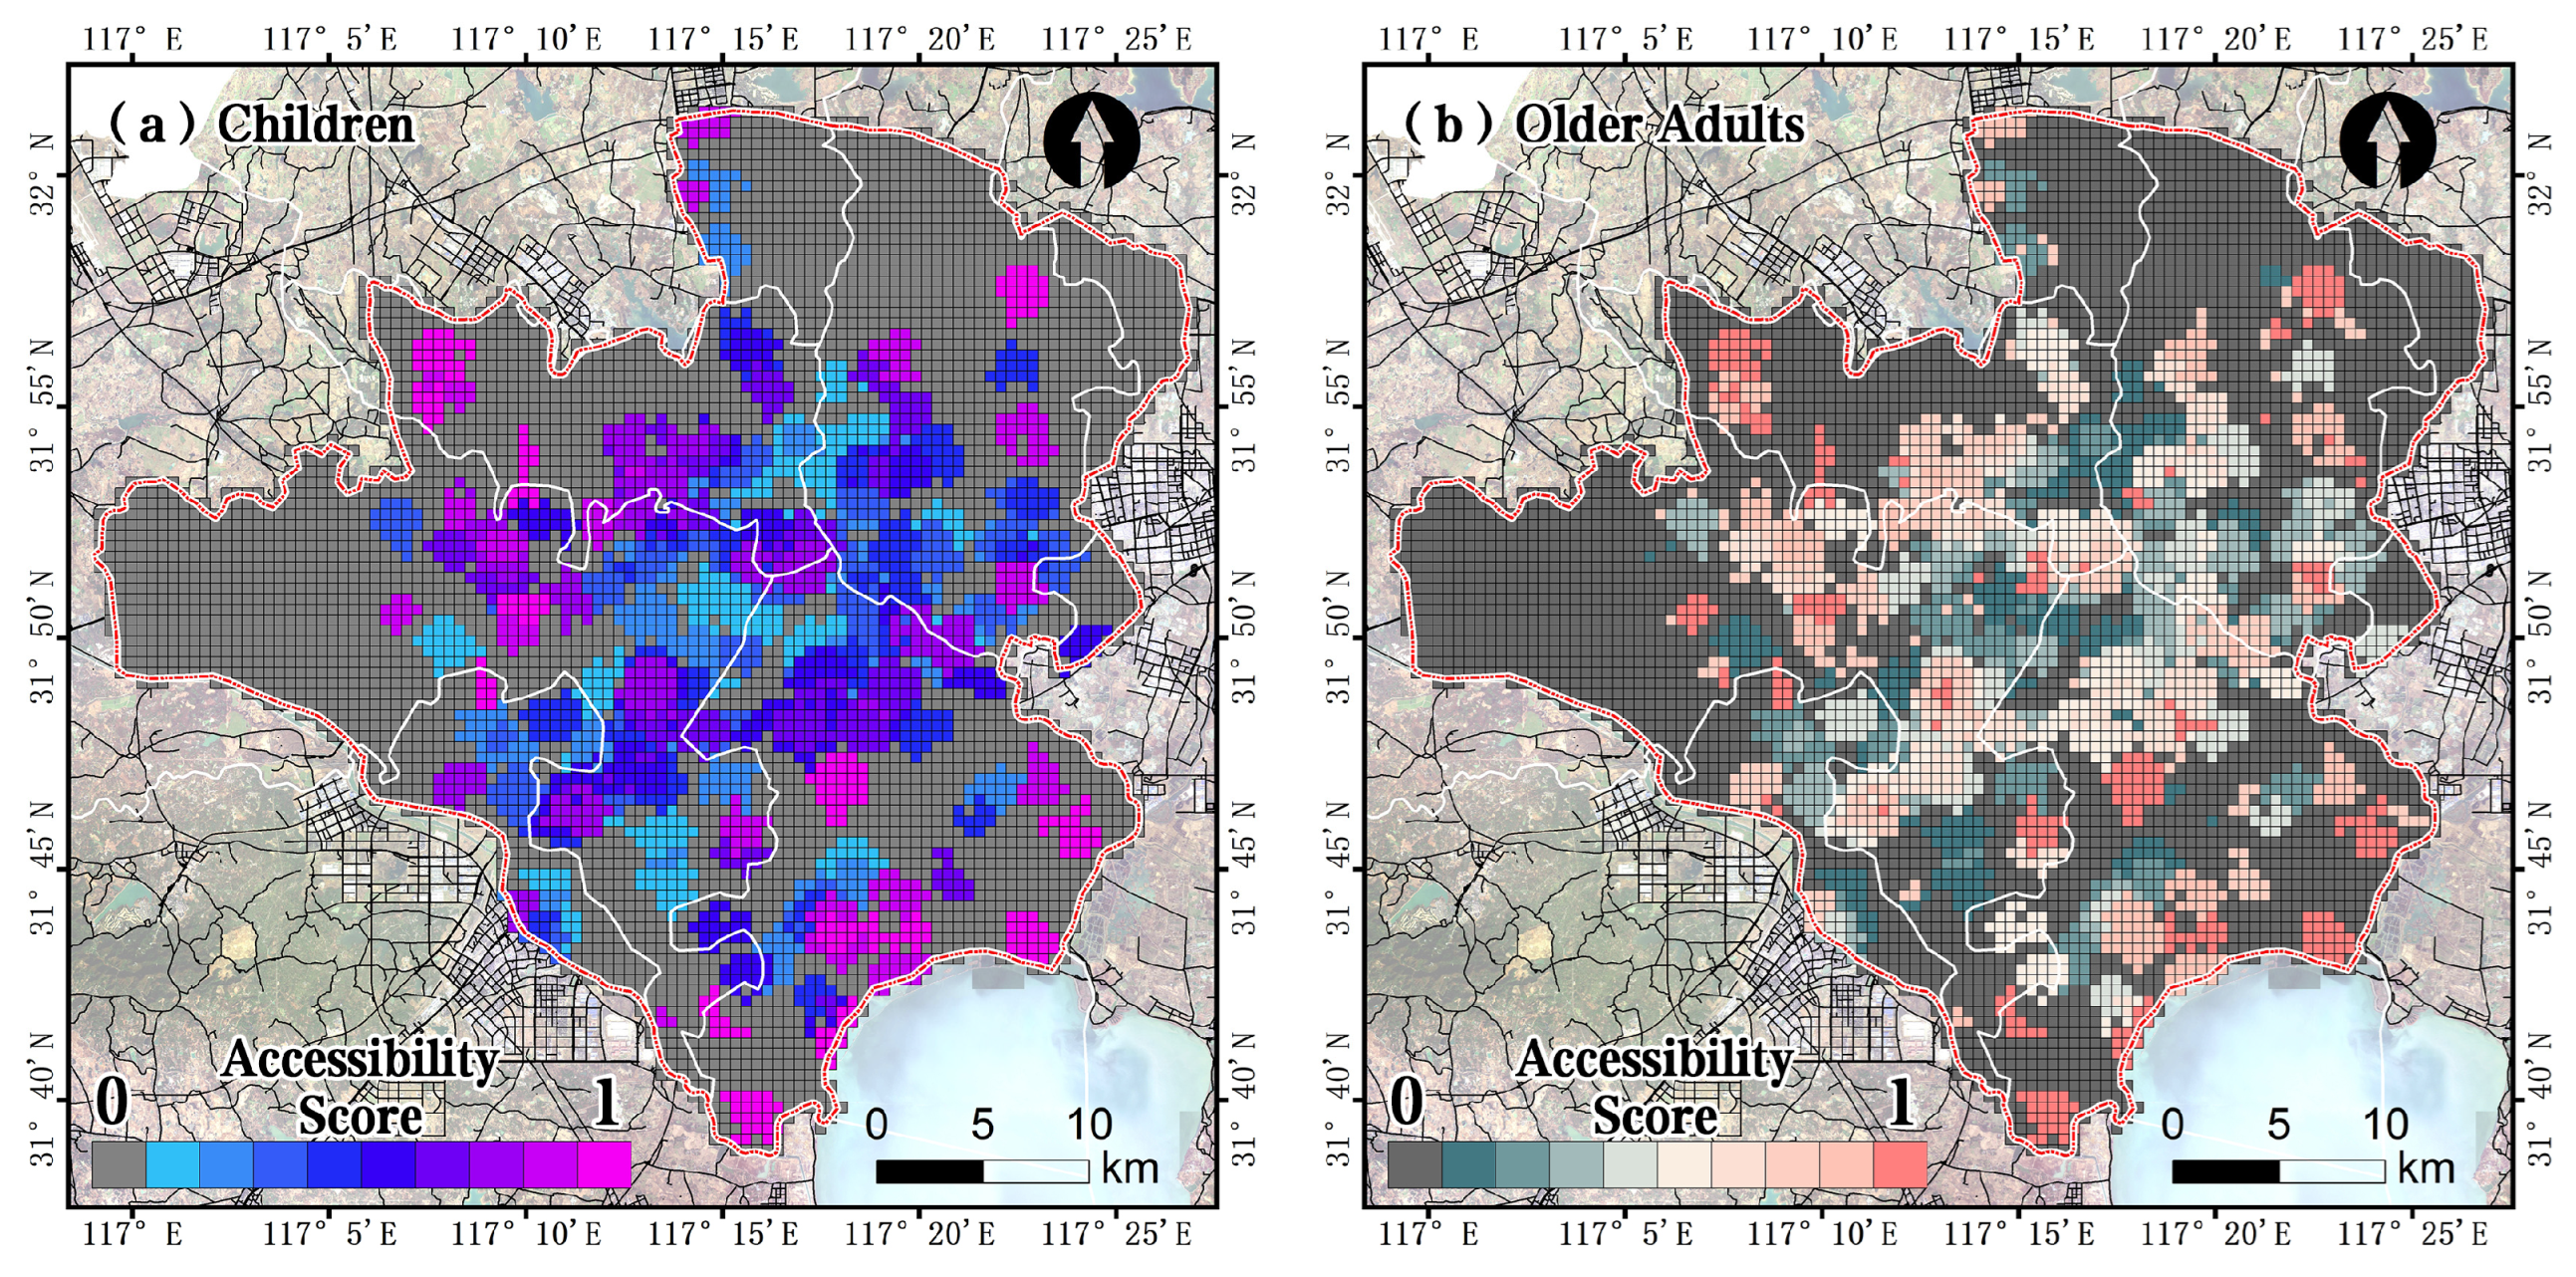
Urban park pedestrian accessibility and summer land surface temperature (LST) in Hefei exhibit strong spatial inequality and significant spatial heterogeneity. As shown in Figure 3, the park accessibility results calculated using the 2SFCA method at a 500-m grid scale indicate that highly accessible resources are spatially concentrated, whereas areas of low accessibility are extensively widespread. Specifically, high-accessibility grids with accessibility scores approaching 1 are sparsely clustered in the mid-eastern urban core, while scores in the vast western, southwestern, and peripheral areas generally approach 0, indicating comparatively low modeled park accessibility. A comparison of Figure 3a,b reveals that despite minor differences in accessibility benefits at the local grid level between children and older adults, the overall spatial deprivation patterns facing both groups are highly consistent. This indicates that the structural shortage of urban public green spaces universally constrains different vulnerable populations.
Figure 3.
Spatial patterns of urban park accessibility for children and older adults in Hefei. (a) Children; (b) Older adults. Accessibility scores are calculated using the Two-Step Floating Catchment Area (2SFCA) method at a 500 m grid scale. A higher score indicates better walking accessibility to urban parks.
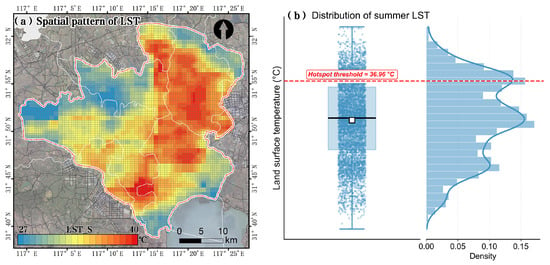
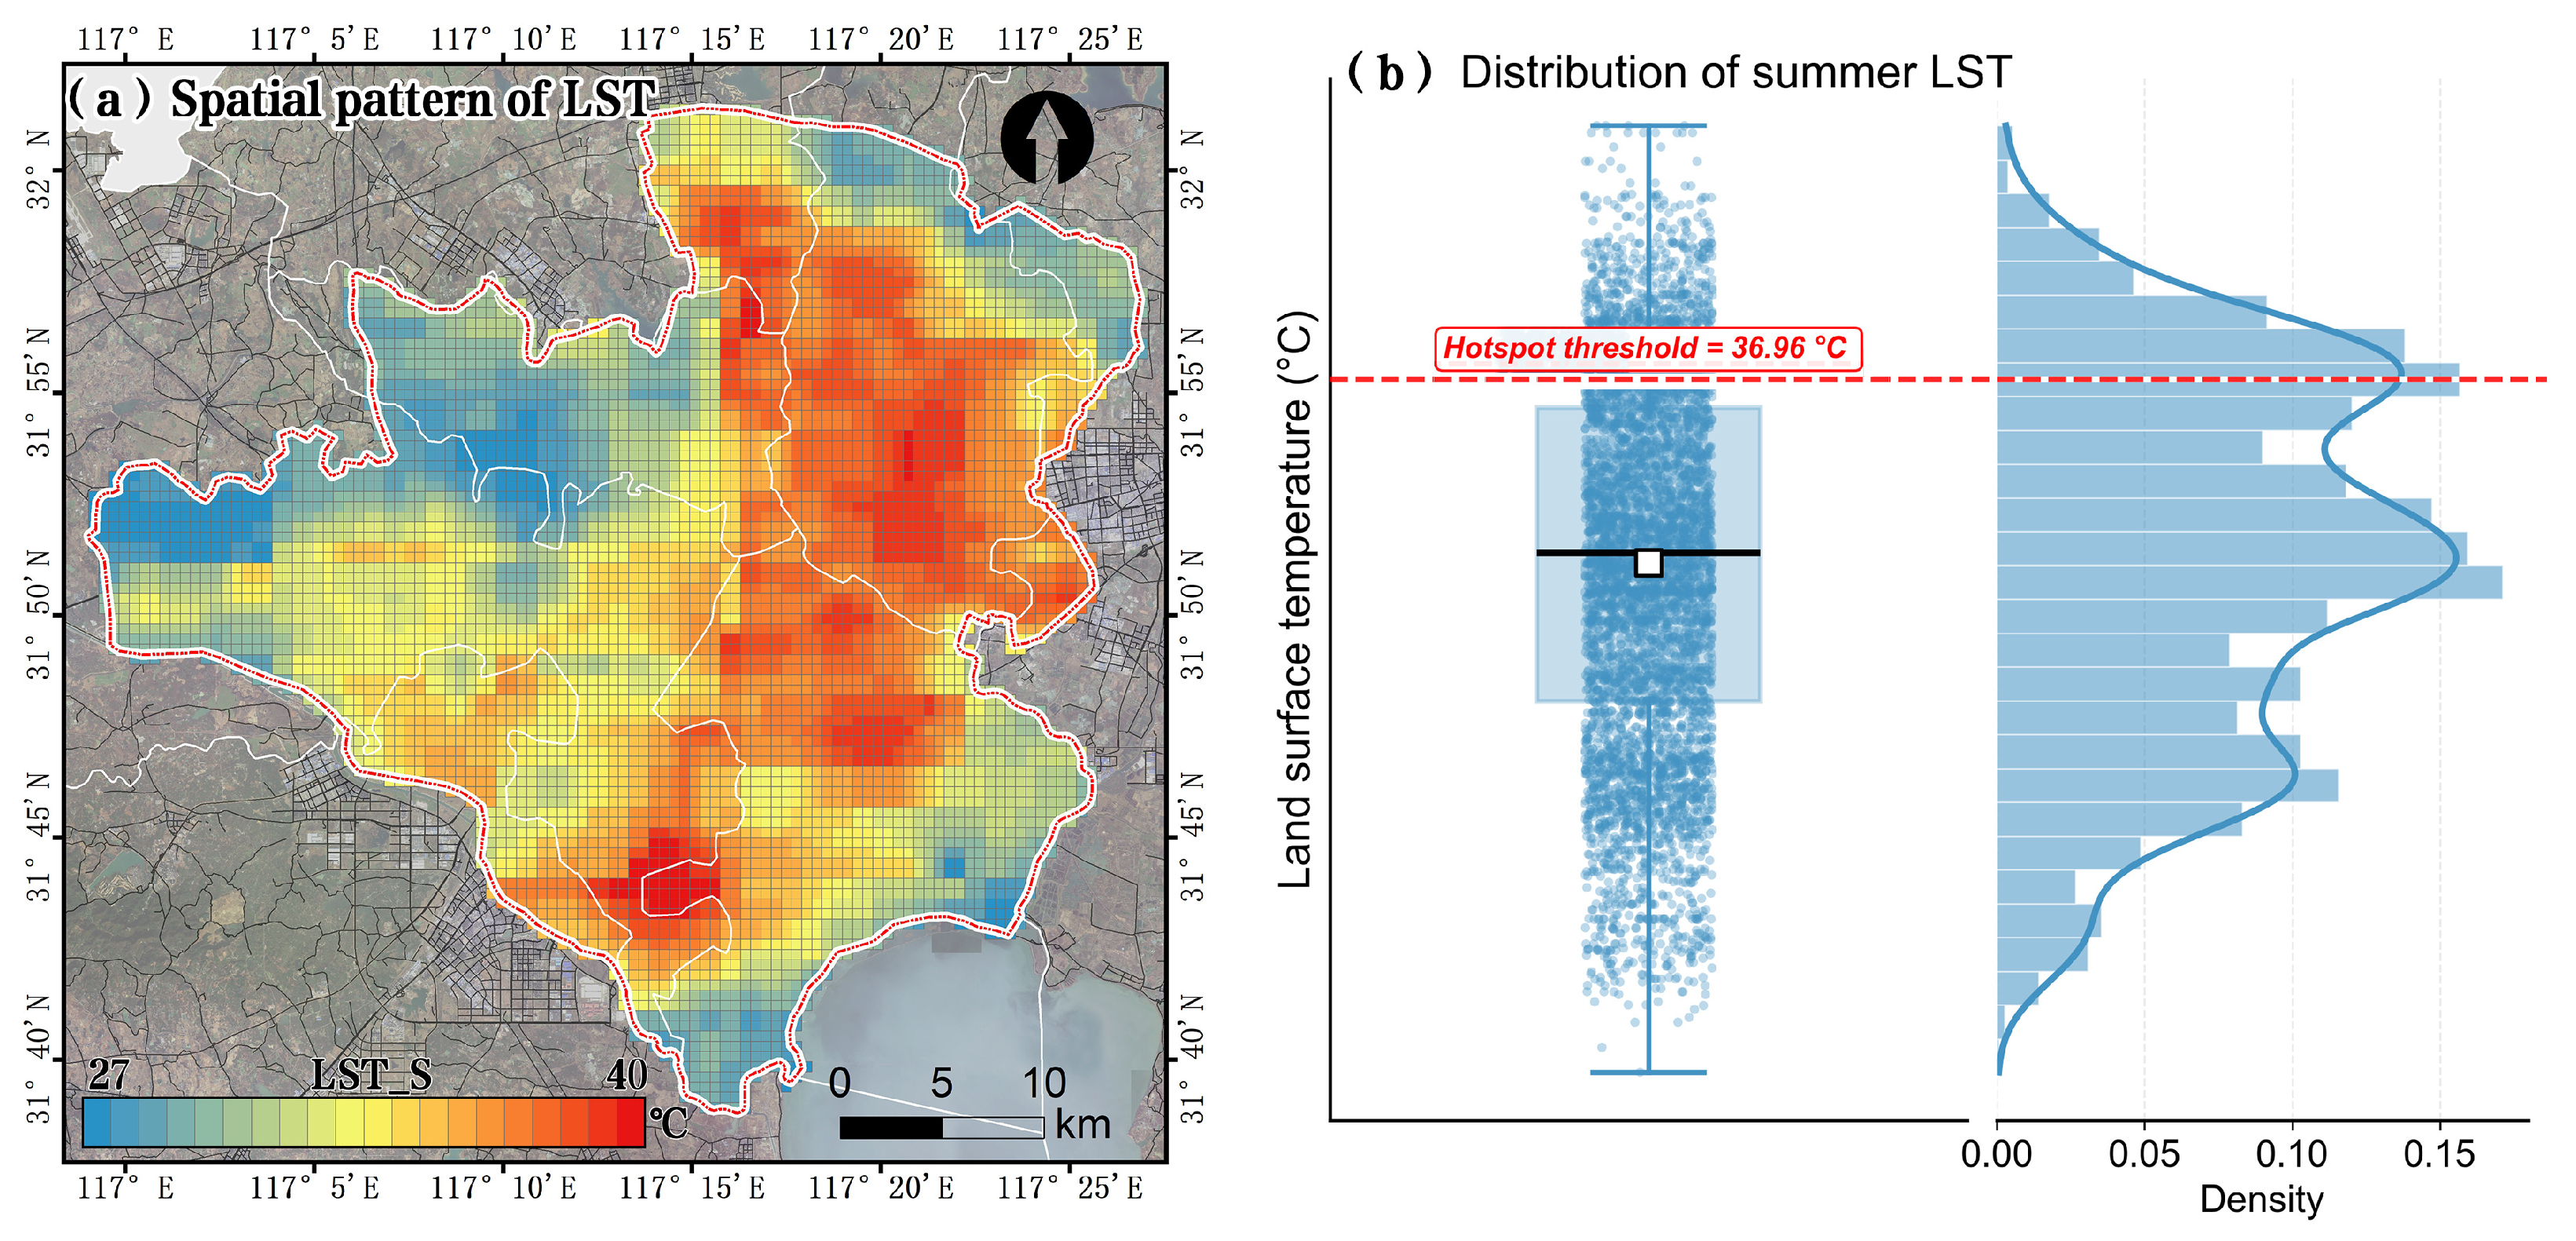
Regarding summer surface temperature, Figure 4 illustrates the spatial distribution and statistical characteristics of July 2024 LST in Hefei. The spatial pattern map (Figure 4a) shows that relatively high-LST hotspots are concentrated predominantly in the high-density built-up areas in the eastern and mid-southern parts of the study area, whereas the western region exhibits relatively lower surface temperatures. The statistical distribution shown in Figure 4b further characterizes the spatial variation in LST. The hotspot threshold is 36.96 °C, defined as the study-area mean LST plus one standard deviation.
Figure 4.
Spatial pattern and statistical distribution of July 2024 land surface temperature (LST) in Hefei. (a) Spatial distribution of LST across the study area; (b) Raincloud plot showing the distribution of LST across all grid cells. The red dashed line indicates the relative high-LST hotspot threshold (36.96 °C), defined as the July 2024 study-area mean plus one standard deviation. Grid cells above this threshold are classified as high-LST hotspots; the threshold is not an absolute health-based criterion for human heat exposure.
This threshold identifies grid cells with relatively high surface temperatures under the July 2024 conditions and should not be interpreted as a universal danger level or a health-based threshold for heat exposure. The spatial heterogeneity of park accessibility and LST reflects differences in the urban physical environment [41]. The spatial overlap between high-LST hotspots and LH-type accessibility–population mismatch zones indicates that some areas combine low park accessibility relative to surrounding population demand with relatively high surface temperatures. These areas are classified as dual-vulnerability zones for spatial screening and planning. This overlap identifies potential priority locations for combined green-space and heat-adaptation interventions, but does not establish the actual thermal dose or physiological heat stress experienced by individual older adults or children.
4.2. Global Equity: Intergenerational Disparities in Urban Park Accessibility
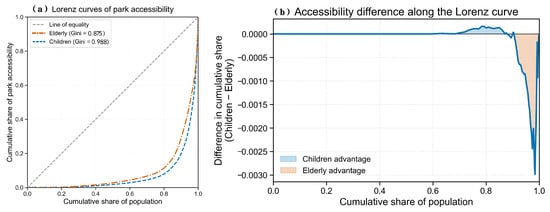
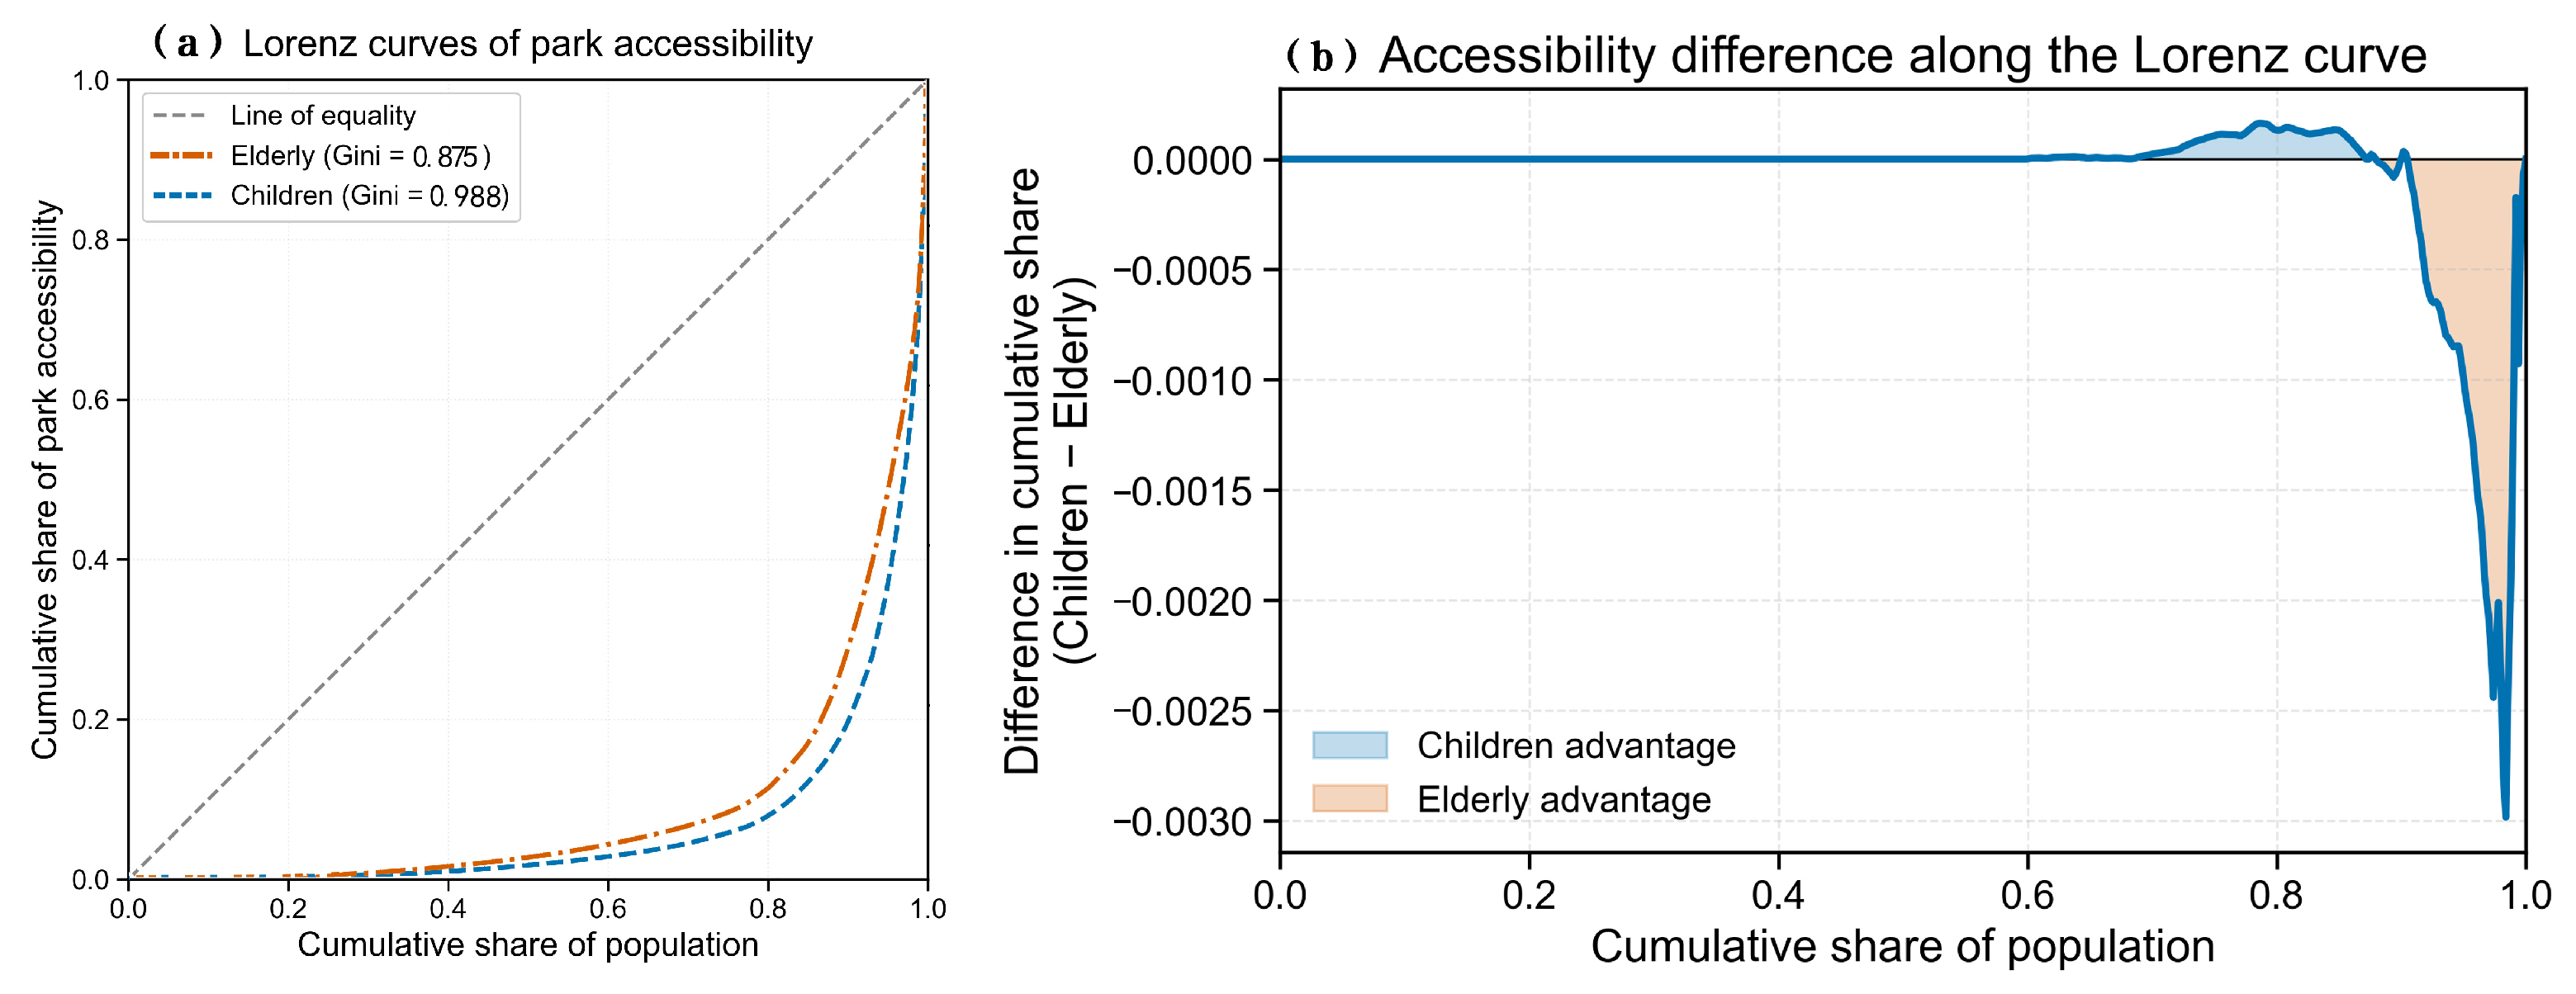
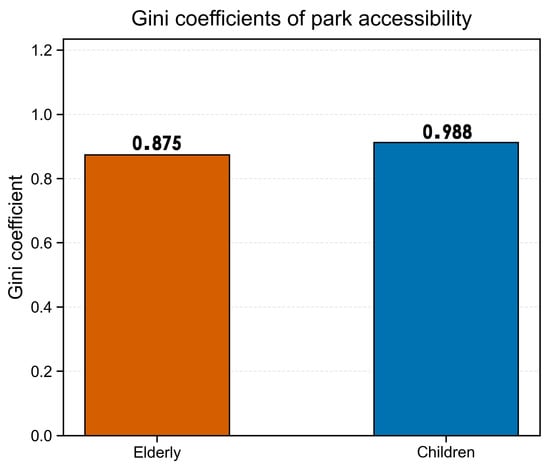
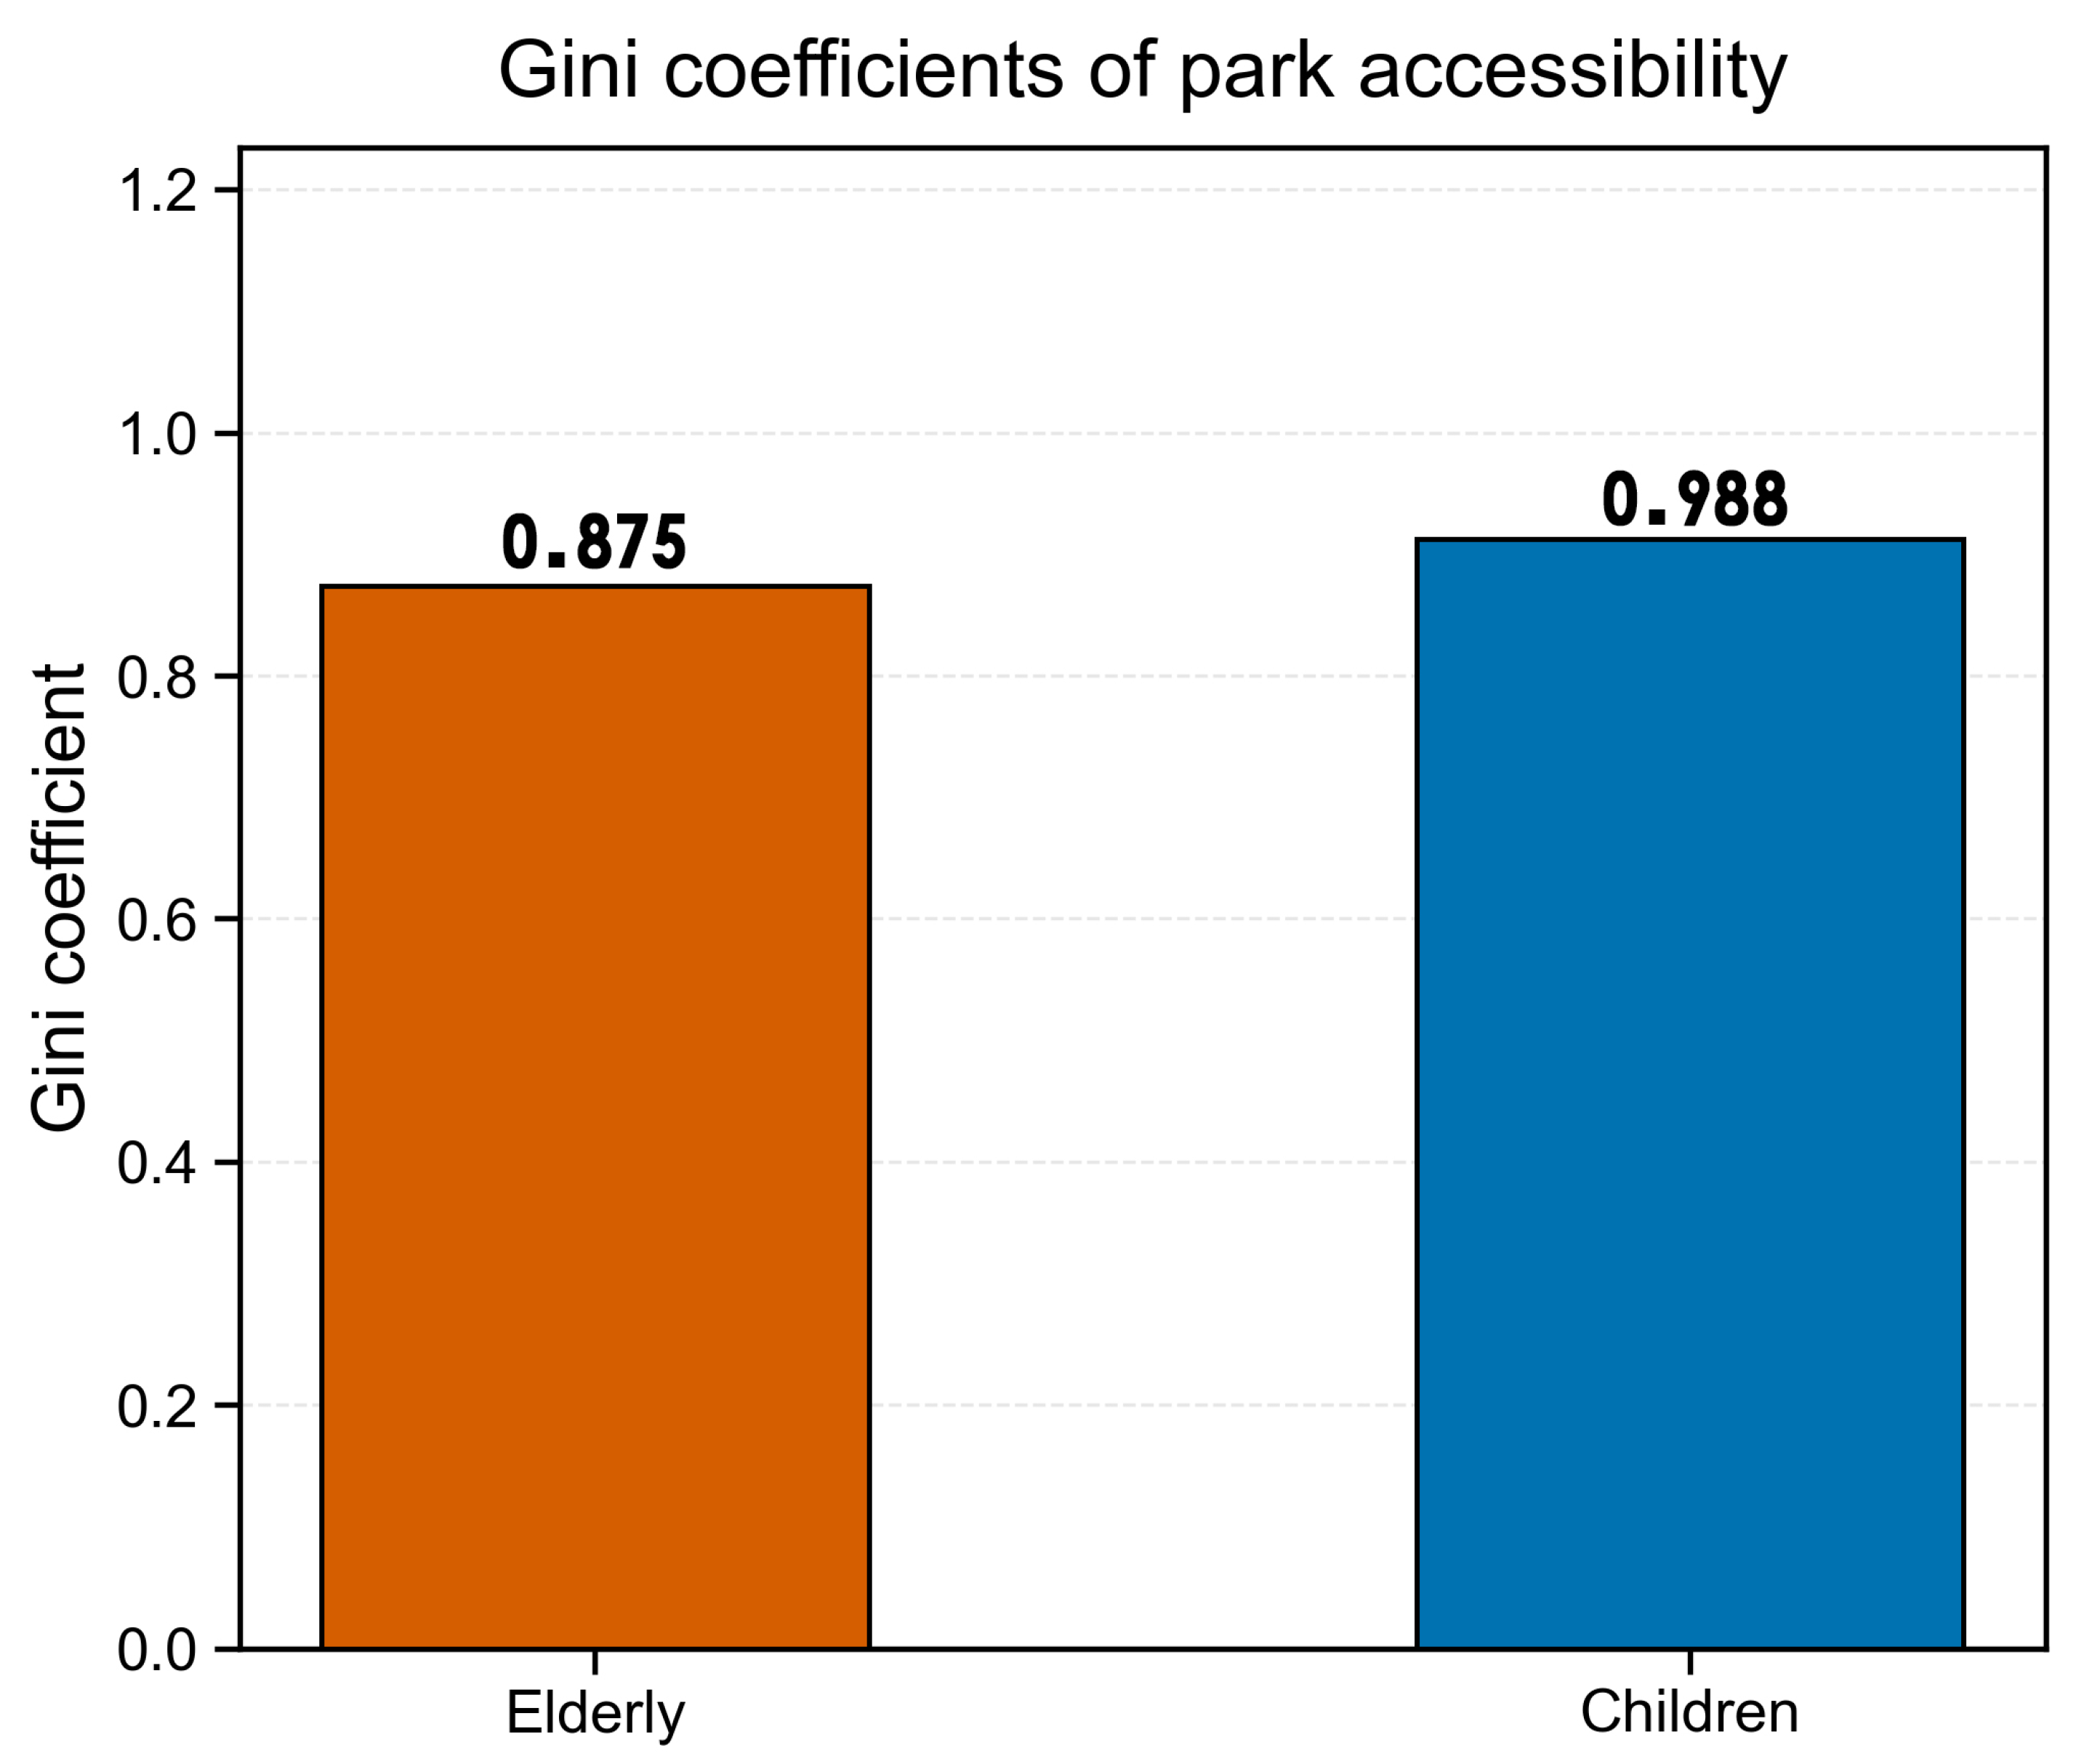
At the level of global spatial equity, urban park accessibility in Hefei exhibits substantial distributional inequality among both older adults and children. As shown in Figure 5a, the Lorenz curves for both groups deviate markedly from the line of equality, indicating an uneven distribution of modeled park accessibility. As illustrated in Figure 6, the reported Gini coefficients are 0.988 for children and 0.875 for older adults, suggesting a higher estimated level of accessibility inequality among children under the adopted analytical framework.
Figure 5.
Lorenz curves and accessibility difference for park accessibility among older adults and children in Hefei. (a) Lorenz curves of park accessibility for older adults (orange dashed line) and children (blue dashed line). The grey dashed line represents the line of equality. (b) Difference in cumulative share of park accessibility between children and older adults along the Lorenz curve. Blue shading indicates children’s advantage, while orange shading indicates older adults’ advantage.
Figure 6.
Comparison of Gini coefficients of park accessibility between older adults and children in Hefei. Higher Gini coefficients indicate greater inequality in park accessibility distribution.
These coefficients should be interpreted in conjunction with the population-weighting procedure and the treatment of zero-accessibility grid cells. Under the population-weighted approach, grid cells containing larger target populations contribute more to the cumulative population distribution. Grid cells with zero accessibility but a nonzero target population remain in the analysis, contributing to the cumulative population share without contributing to the cumulative accessibility share. Consequently, the presence and population distribution of zero-accessibility cells can influence the magnitude of the estimated Gini coefficient.
The reported coefficients describe inequality in the distribution of modeled park accessibility under the adopted 2SFCA framework. They should not be interpreted independently as a direct measure of the overall adequacy of park supply or as definitive evidence of the causes of inequality. The observed difference between children and older adults should also be interpreted in light of the population-weighting procedure, the spatial distribution of accessibility scores, and the treatment of zero-accessibility cells.
These global inequality results provide an overall assessment of accessibility distribution and should be considered alongside the subsequent local spatial mismatch analysis. The local analysis helps identify where the spatial distribution of park accessibility is poorly aligned with the distribution of the target populations, thereby providing more geographically specific evidence for differentiated urban planning interventions.
4.3. Local Spatial Mismatch: Targeted Spatial Deprivation Among Older Adults and Children
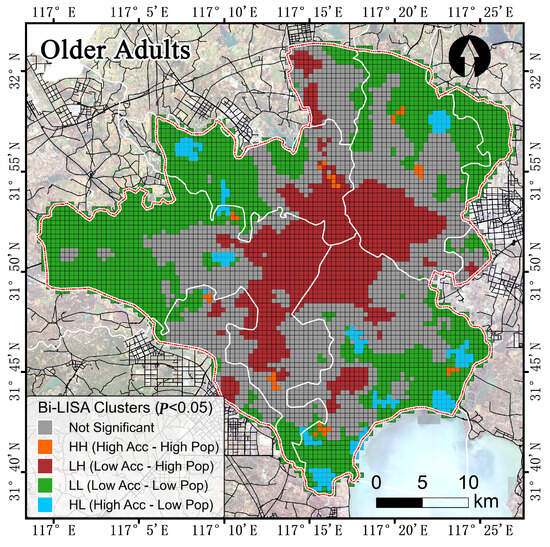
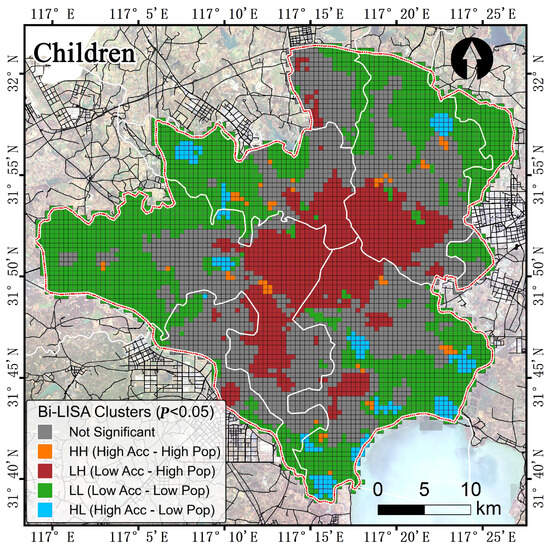
To identify local spatial associations between park accessibility and the distribution of the two target populations, this study employed the Bi-LISA model. As shown in Figure 7, the spatial pattern for older adults exhibits a clear core–periphery contrast. LH clusters, defined as focal grid cells with low accessibility associated with high population density in neighboring cells, are concentrated in the mid-eastern urban core, whereas LL clusters are more extensive in the western and peripheral areas. Figure 8 shows a broadly similar pattern for children, with LH clusters forming contiguous patches in the mid-eastern urban core. At a significance level of p < 0.05, LH and LL categories dominate the spatial associations for both groups, while HH clusters are rare. These results indicate that low-accessibility grid cells in the urban core tend to be spatially associated with higher population density in surrounding grid cells, suggesting localized accessibility–population mismatches. Because LH represents a bivariate local spatial association, it should not be interpreted as a direct measurement of demand within the focal grid cell, a quantified supply–demand deficit, or a causal relationship. Nevertheless, the identified clusters provide a spatial basis for prioritizing further investigation and targeted park-accessibility interventions.
Figure 7.
Bi-LISA clustering of park accessibility and older-adult population density in Hefei. The map shows statistically significant local bivariate spatial associations (p < 0.05). HH: high accessibility–high neighboring population density; LH: low accessibility–high neighboring population density (key mismatch); LL: low accessibility–low neighboring population density; HL: high accessibility–low neighboring population density. Gray indicates non-significant clusters.
Figure 8.
Bi-LISA clustering of park accessibility and child population density in Hefei. The map shows statistically significant local bivariate spatial associations (p < 0.05). HH: high accessibility–high neighboring population density; LH: low accessibility–high neighboring population density (key mismatch); LL: low accessibility–low neighboring population density; HL: high accessibility–low neighboring population density. Gray indicates non-significant clusters.
4.4. Spatial Delineation of Dual Vulnerability: Overlaying Park Deprivation and Heat Exposure
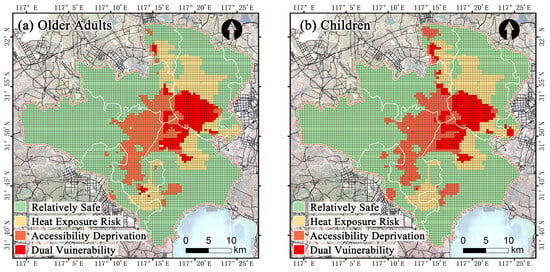
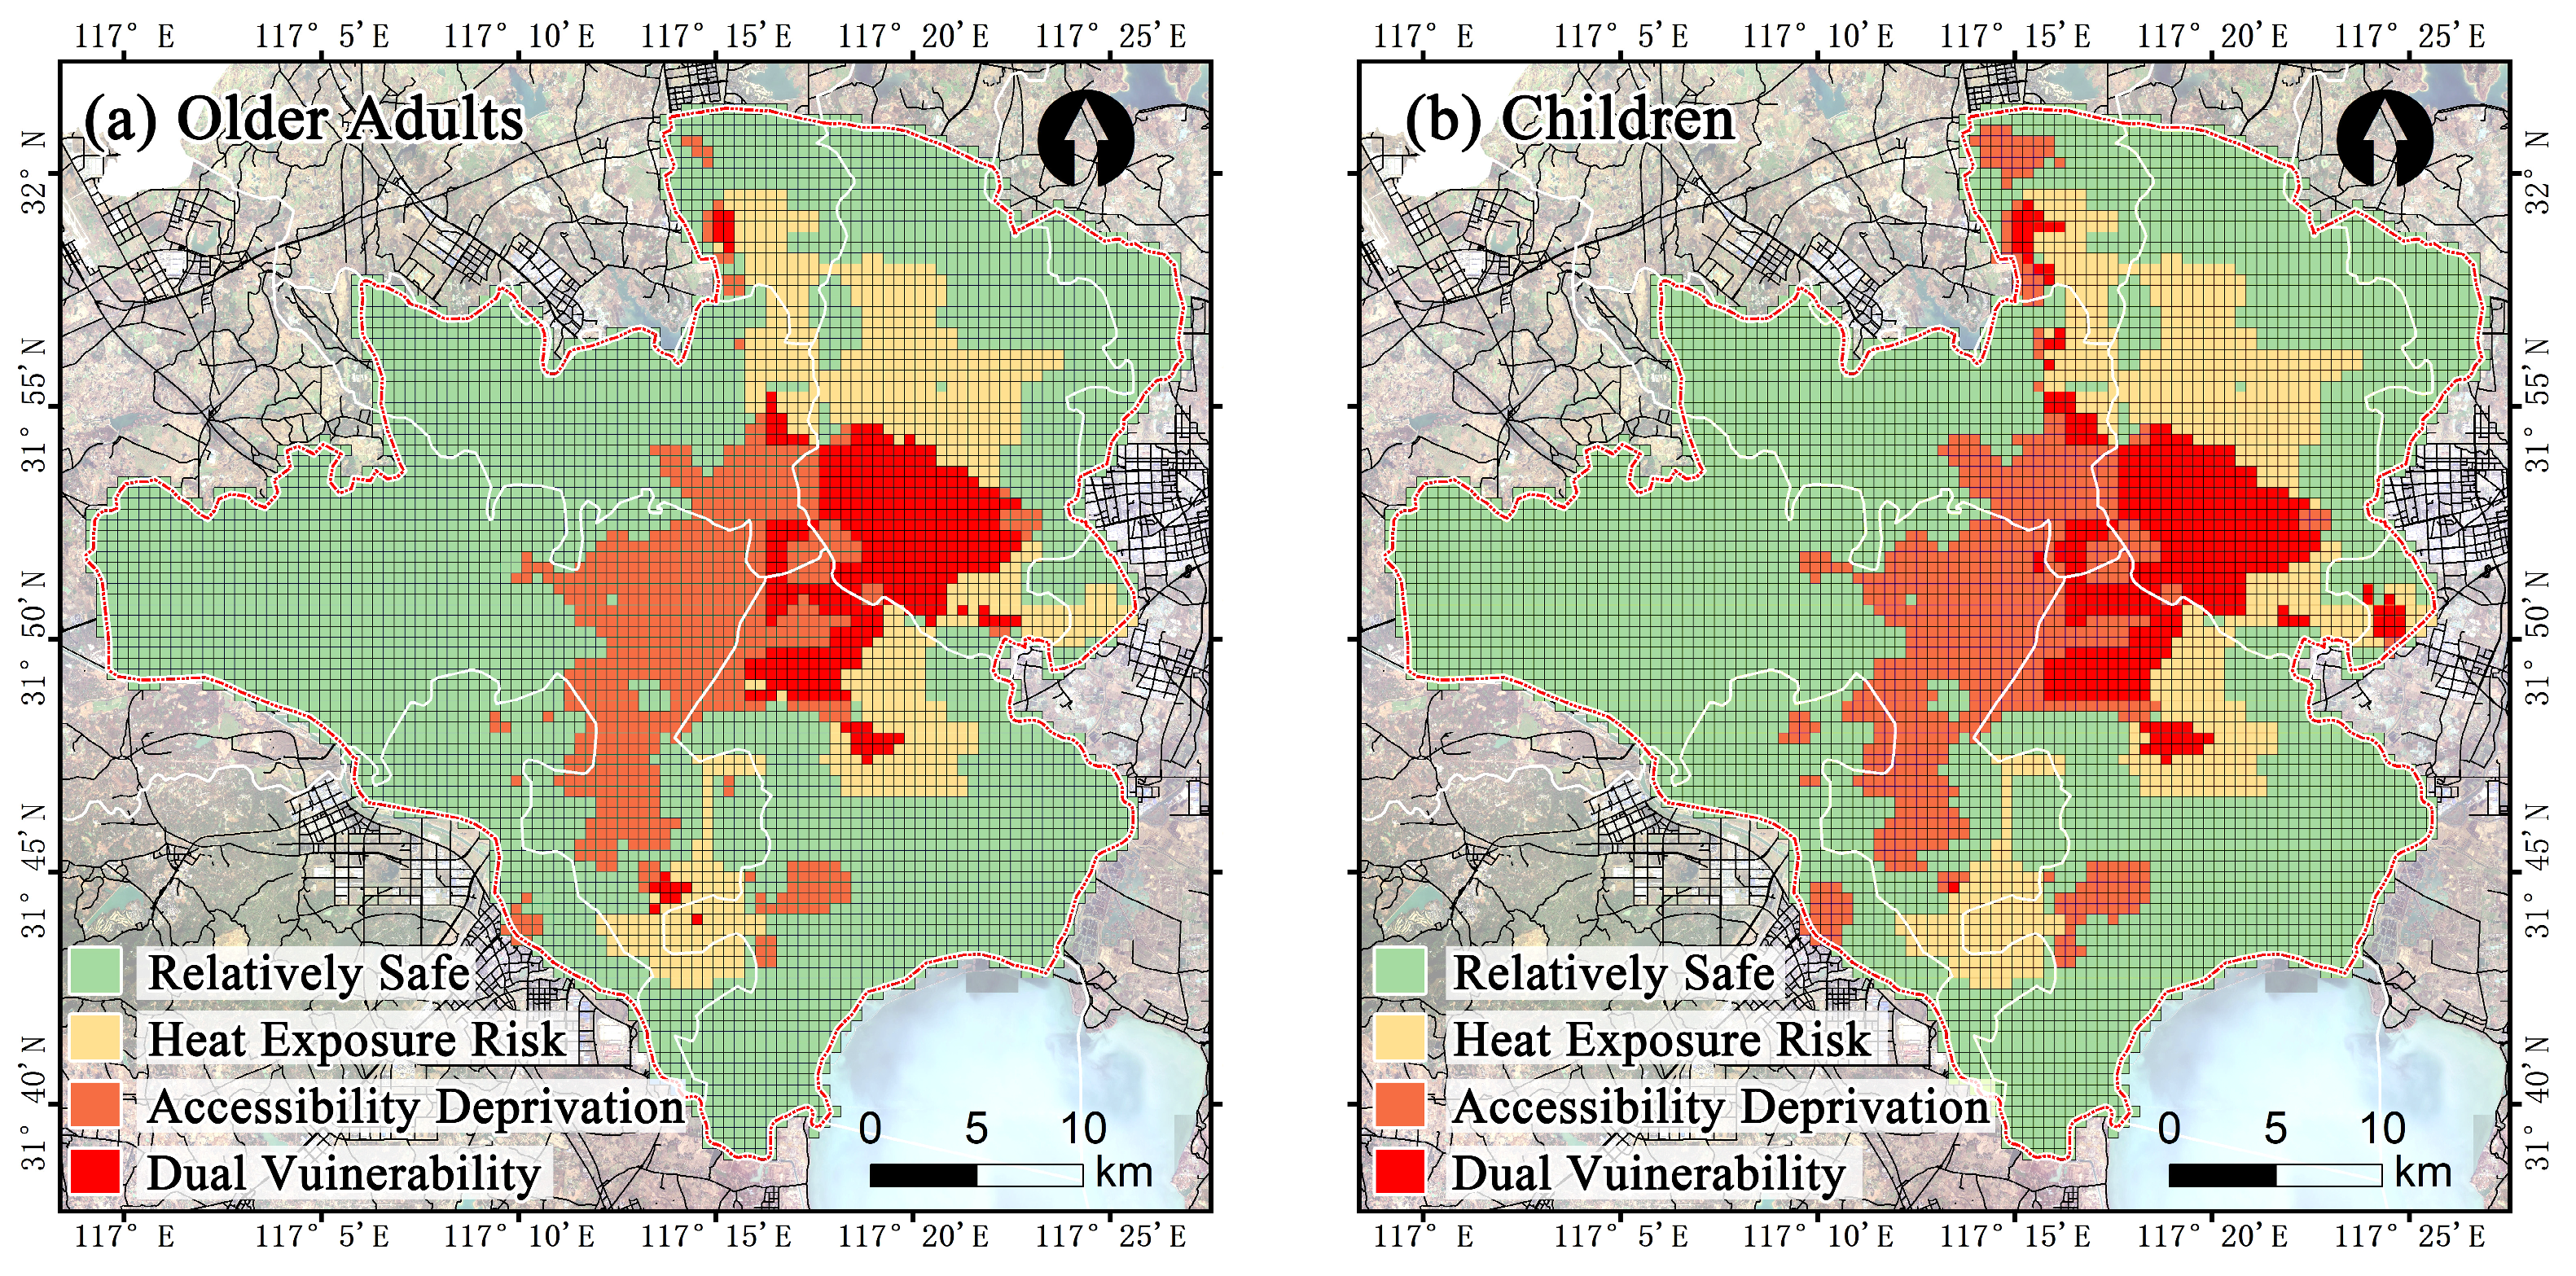
Following the spatial overlay of LH-type mismatches and July 2024 high-LST hotspots, the distribution of dual-vulnerability zones differs between older adults and children, although both groups show a high concentration of these zones in the central urban core (Figure 9 and Figure 10). For older adults, dual-vulnerability zones are primarily concentrated in the mid-eastern part of the central urban core, forming a continuous block-like pattern. Heat-exposure-risk zones, defined as high-LST hotspots without LH-type mismatch, are mainly located in the mid-northern area, whereas accessibility-deprivation zones, defined as LH-type mismatches without high-LST hotspots, are located in the mid-eastern area. Relatively safe zones under the adopted criteria are widespread in the western, southern, and peripheral areas (Figure 9a). Similarly, children’s dual-vulnerability zones form contiguous clusters in the central urban core, with additional smaller patches along the southern and eastern peripheries. Heat-exposure-risk zones are predominantly located in the east, accessibility-deprivation zones form a belt-like distribution along the mid-western axis, and relatively safe zones occupy much of the periphery (Figure 9b).
Figure 9.
Spatial distribution of the four vulnerability-related zones for older adults (a) and children (b) in Hefei. The zones are identified by overlaying LH-type accessibility–population mismatch with July 2024 high-LST hotspots: Dual Vulnerability (LH ∩ hotspot), Accessibility Deprivation (LH ∩ non-hotspot), Heat Exposure Risk (non-LH ∩ hotspot), and Relatively Safe (non-LH ∩ non-hotspot). The same color scheme is used for corresponding categories in both panels. These categories represent spatial screening outcomes rather than direct measurements of individual human heat exposure.
Figure 10.
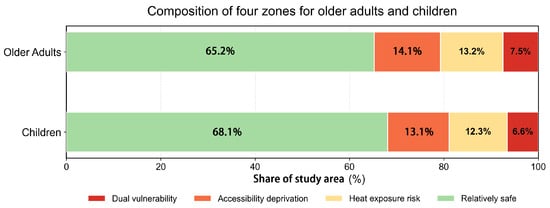
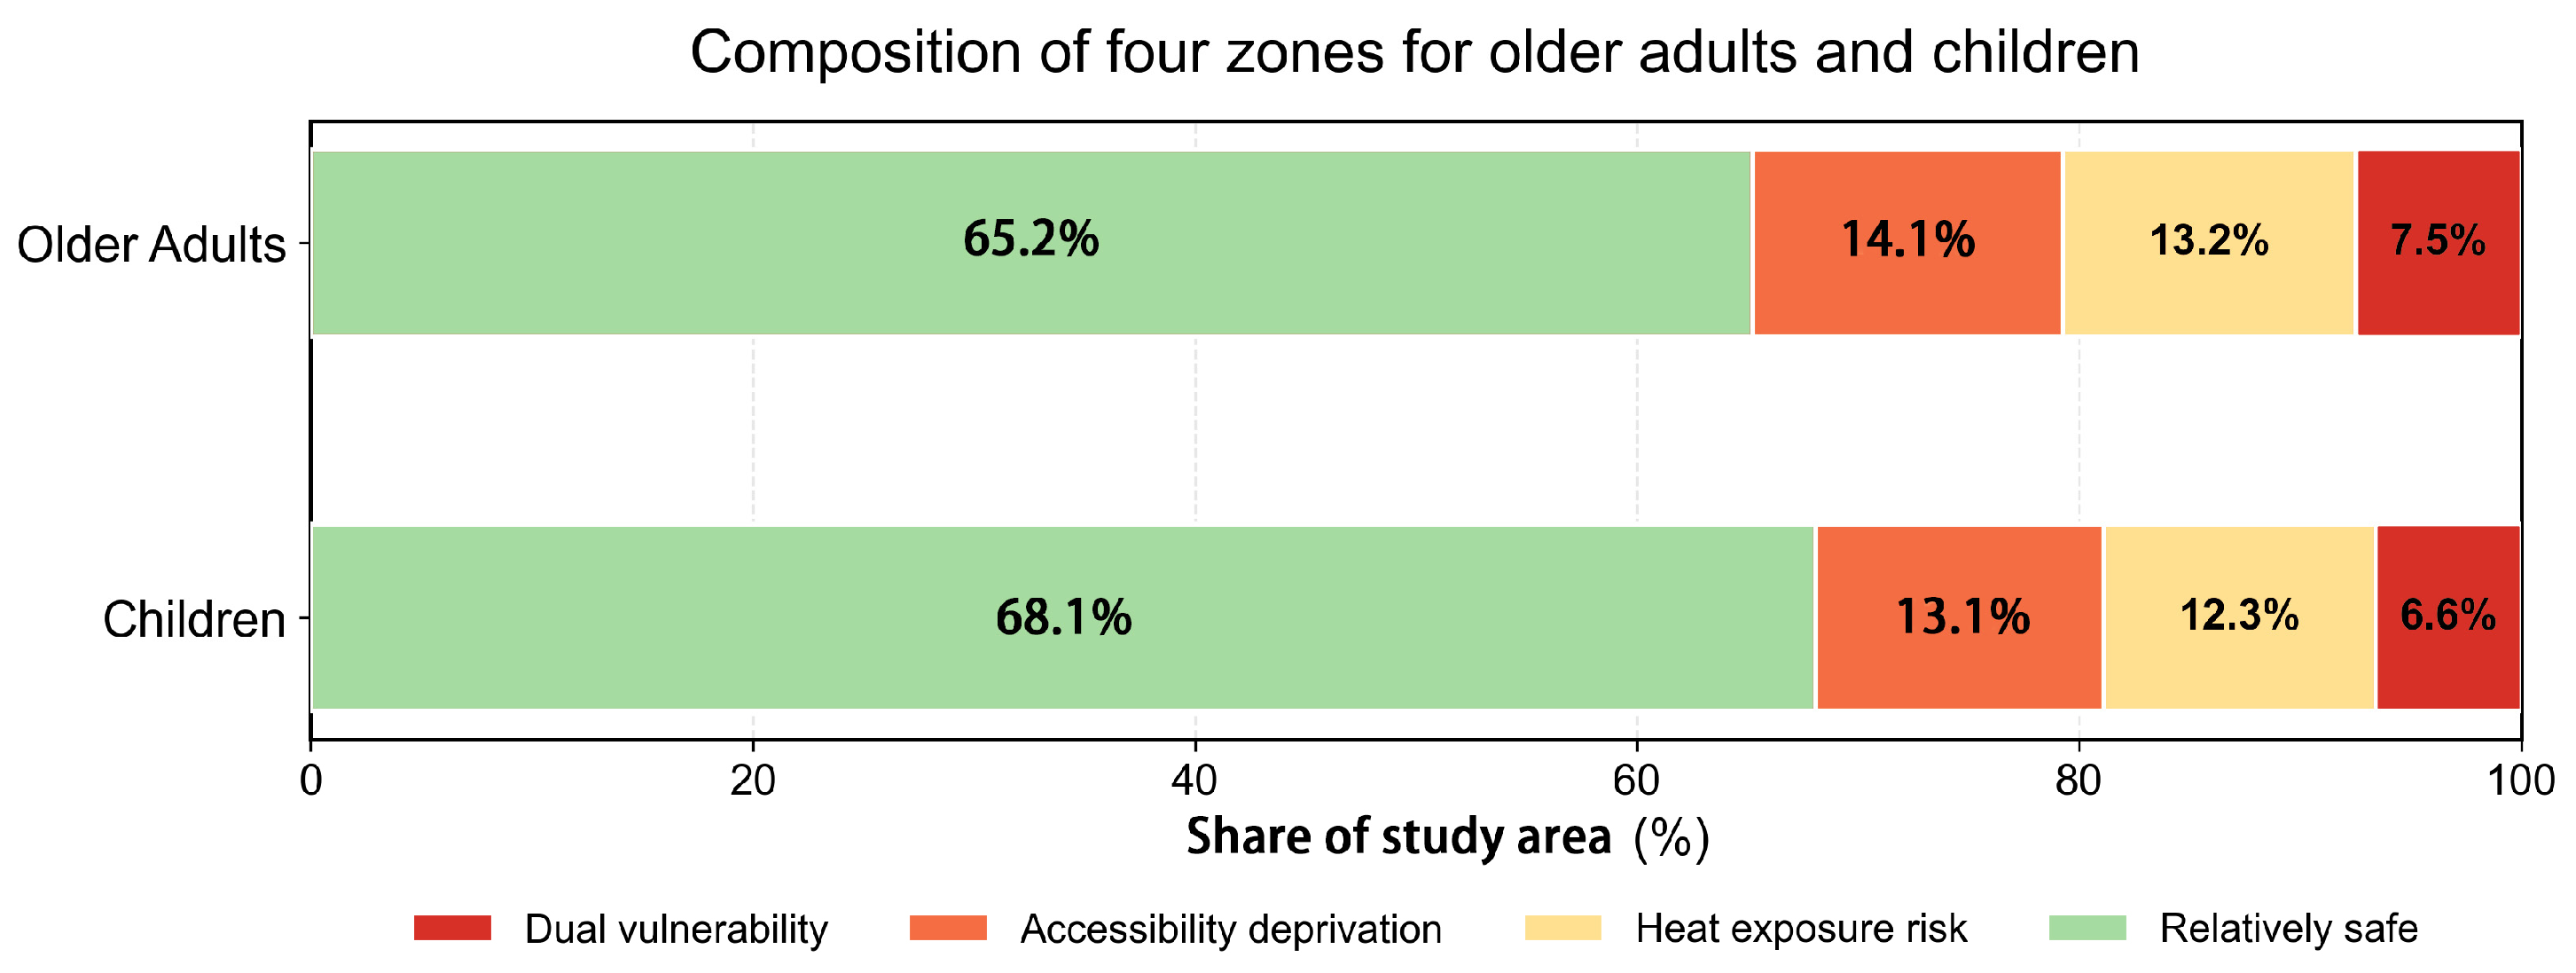
Composition of the four spatial zones for older adults and children in Hefei. Percentages represent the shares of the study area’s mapped area assigned to each category, rather than the proportions of the corresponding populations. Values are independently rounded to one decimal place; totals may differ slightly from 100% because of rounding.
In terms of areal proportions, the composition of the four zones varies between the two demographic groups (Figure 10). For older adults, the proportions of dual vulnerability, accessibility deprivation, heat exposure risk, and relatively safe zones are 7.5%, 14.1%, 13.2%, and 65.2%, respectively; the corresponding proportions for children are 6.6%, 13.1%, 12.3%, and 68.1%.
These percentages represent the shares of the study area’s mapped area assigned to each spatial category, rather than the proportions of older adults or children living in those zones. In particular, the values of 7.5% and 6.6% indicate the areal extent of the dual-vulnerability zones identified for older adults and children, respectively, and should not be interpreted as population-based heat-exposure rates.
The slightly larger area share of dual-vulnerability zones for older adults indicates that a larger spatial area meets both the LH-type accessibility–population mismatch and high-LST hotspot criteria for this group. However, this difference does not establish that a larger number or proportion of older adults is exposed to heat, nor does it demonstrate greater physiological heat stress among older adults.
A population-based exposure rate would require aggregating the age-specific population counts within the classified dual-vulnerability grids and comparing these counts with the total population of the corresponding age group. This additional population-weighted indicator was not estimated in the present study. Accordingly, the comparison here is restricted to the spatial extent and location of the identified zones, rather than the proportion of each demographic group potentially located within them.
These findings identify priority locations where park-accessibility deprivation and relatively high surface temperatures coincide. Such areas warrant further attention in green-space planning and heat-adaptation strategies, while individual heat exposure should not be inferred directly from satellite-derived LST alone.
4.5. Spatial Overlap and Divergence of Dual Vulnerability Between Older Adults and Children
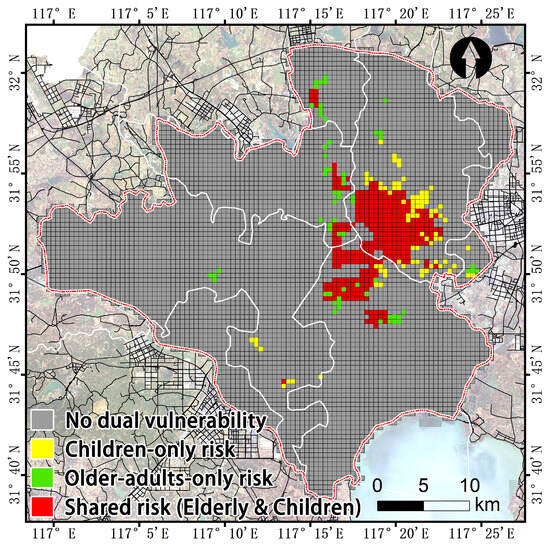
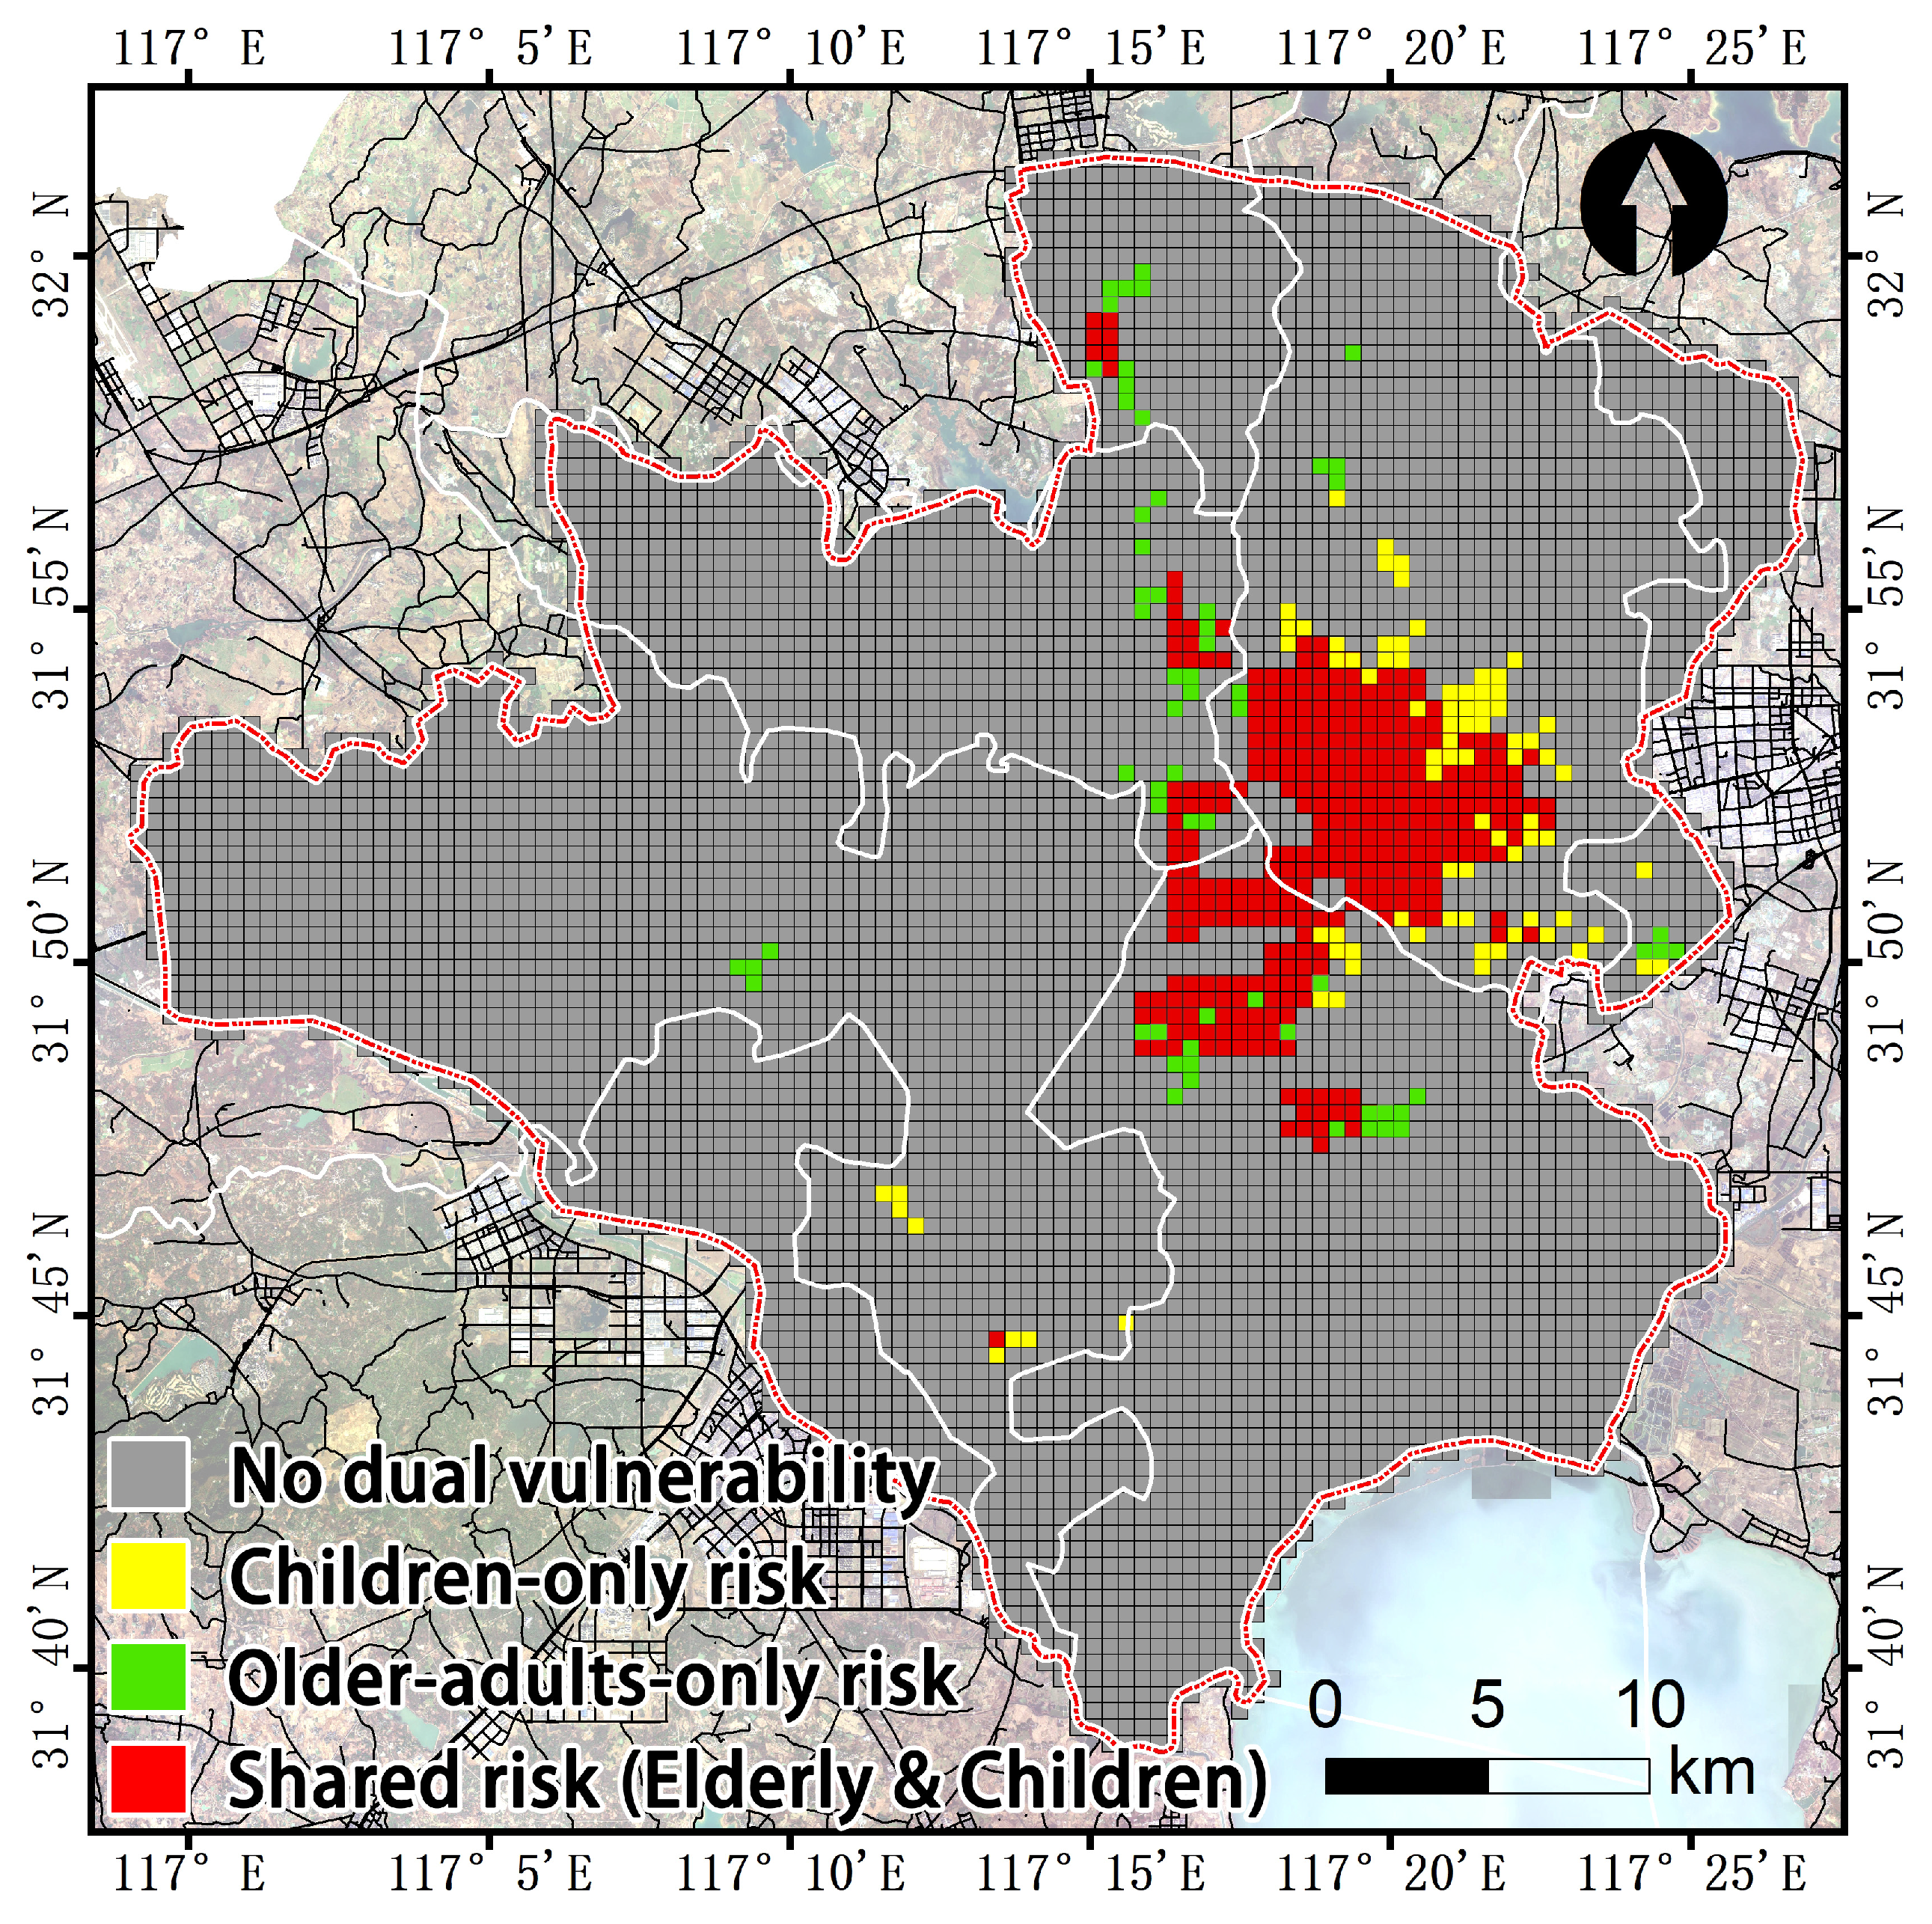
The spatial overlap analysis of dual-vulnerability zones for older adults and children reveals substantial spatial overlap in the urban core and local divergence along the urban periphery. As shown in Figure 11, the targeted grids are classified into four categories: “shared risk,” “children-only risk,” “older-adults-only risk,” and “no dual vulnerability.” The shared-risk zones represent grid cells in which both demographic groups are classified as having dual vulnerability because LH-type accessibility–population mismatch coincides with a July 2024 high-LST hotspot. These zones exhibit a strong centripetal clustering pattern, forming large contiguous areas over the high-density old city core in the mid-eastern part of Hefei. In contrast, the children-only and older-adults-only zones are more fragmented and are distributed mainly along the peripheral edges of the shared-risk areas and at localized nodes within western expansion areas.
Figure 11.
Spatial overlap of dual-vulnerability zones between older adults and children. Red grids indicate shared-risk areas where both demographic groups meet the study’s dual-vulnerability criteria. Yellow and green grids represent children-only risk and older-adults-only risk, respectively. The remaining grids are classified as no dual-vulnerability zones under the adopted criteria. These categories are based on the spatial overlap of LH-type accessibility–population mismatch and July 2024 high-LST hotspots and do not directly measure individual heat exposure.
This pattern of extensive overlap in the urban core and divergence at the periphery provides a spatial basis for prioritizing intergenerationally inclusive park planning and heat-adaptation interventions. Because the heat-related classification is based on satellite-derived LST, the identified zones should be interpreted as areas where accessibility deprivation and relatively high surface temperatures co-occur, rather than as direct evidence that all residents in these cells experienced severe physiological heat stress.
4.6. Multi-Scale Robustness Check of Spatial Equity and Vulnerability Patterns
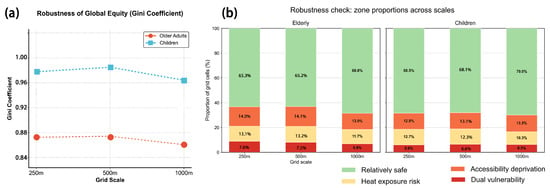
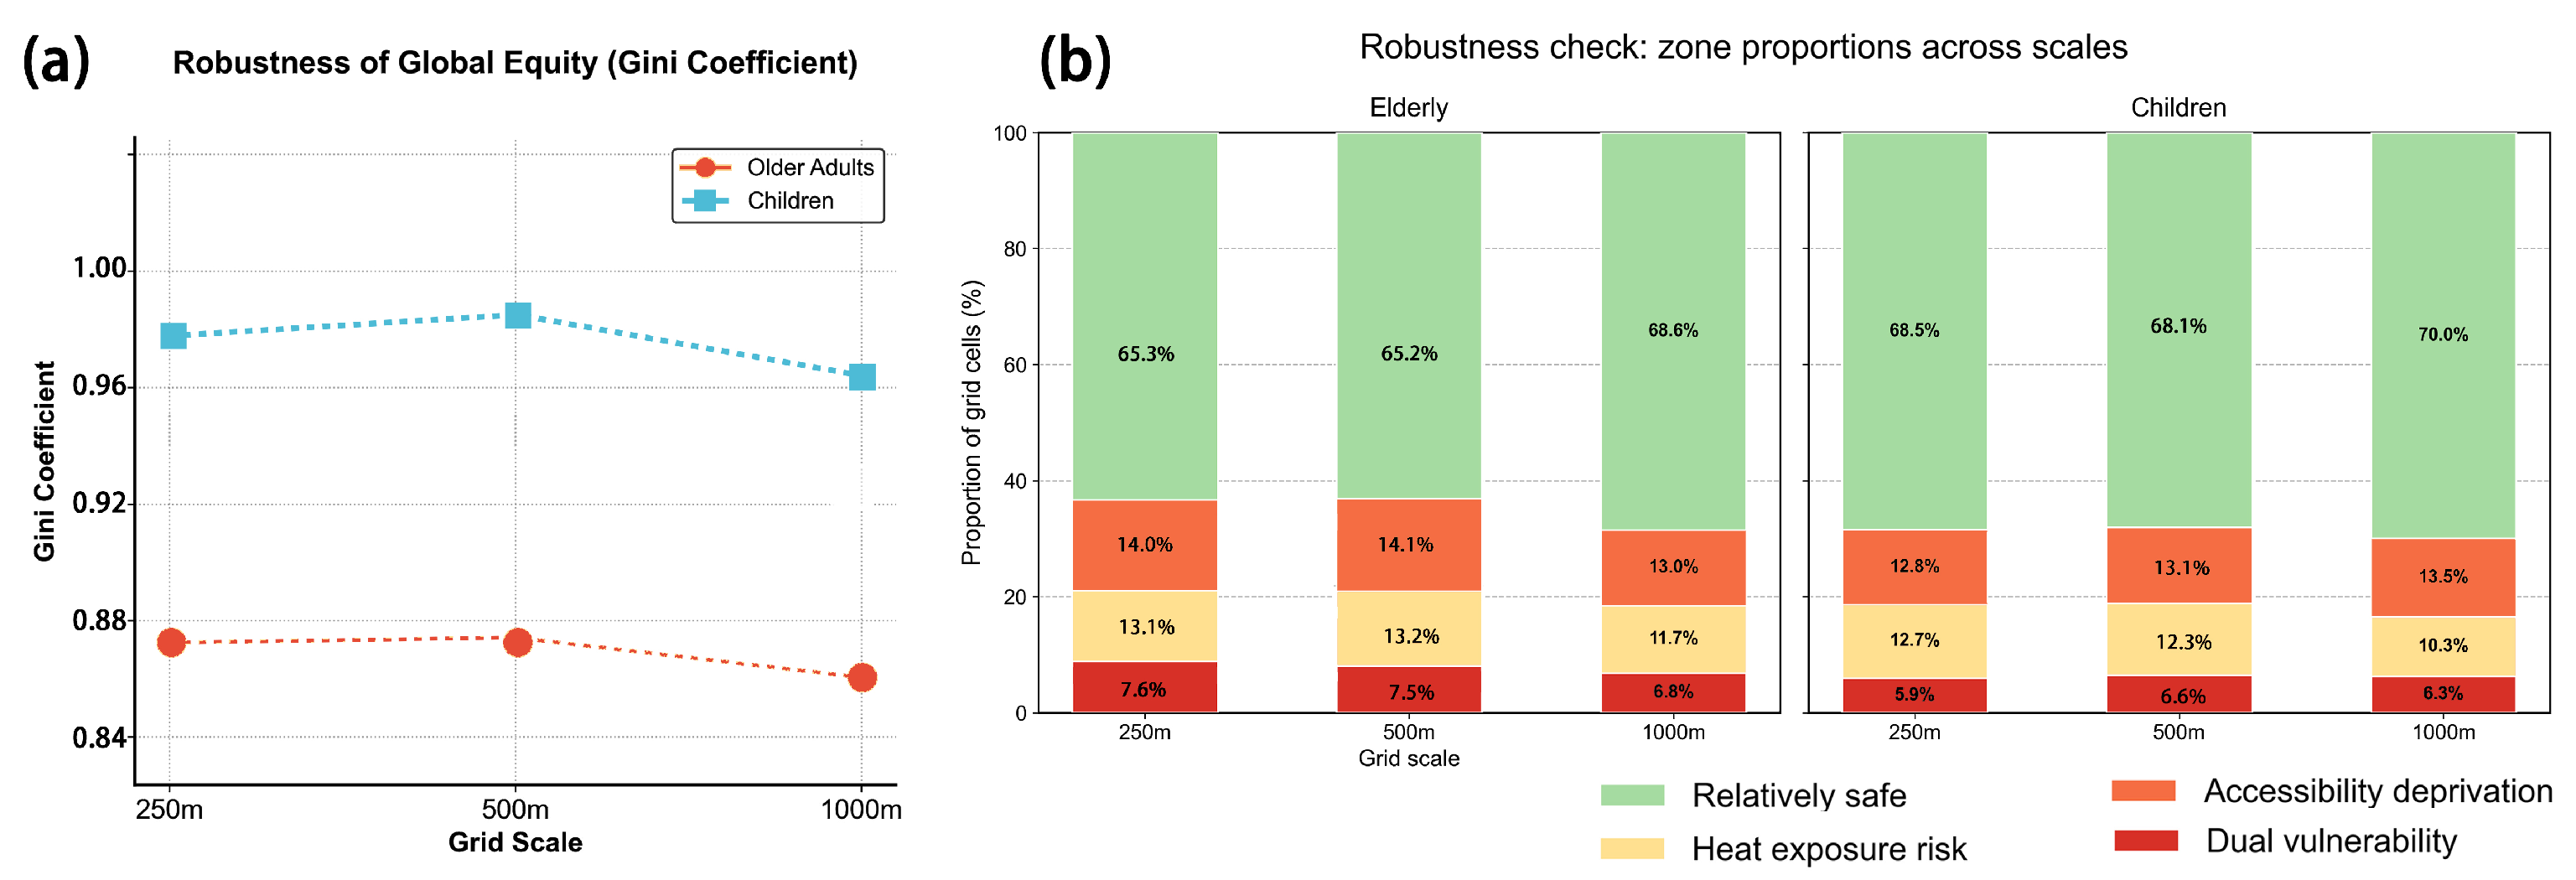
To verify the reliability of the research conclusions against the Modifiable Areal Unit Problem (MAUP), this study conducted a robustness check on the global equity measures and the areal proportions of each risk zone across three spatial scales: 250 m, 500 m, and 1000 m. As shown in Figure 12, the statistical results across different grid resolutions demonstrate extremely high internal consistency. Regarding global spatial equity (Figure 12a), the Gini coefficient of park accessibility for children remains stable between 0.964 and 0.988 across the three scales, consistently higher than that of older adults (which is maintained between 0.86 and 0.88). Regarding the areal proportions of the vulnerability zones (Figure 12b), although the proportion values fluctuate slightly at the 1000-m scale, the overall pattern remains unchanged: the dual vulnerability zones consistently account for the lowest proportion (6–8%), while the relatively safe zones consistently account for the highest proportion (65–70%). These results suggest that the broad spatial patterns are reasonably consistent across the three tested grid resolutions. However, the analysis does not establish independence from spatial scale, and further tests using additional grid resolutions and alternative zoning schemes are needed to assess the sensitivity of the findings.
Figure 12.
Robustness checks of global accessibility inequality and areal proportions of vulnerability zones across three analytical grid resolutions (250 m, 500 m, and 1000 m). (a) Population-weighted Gini coefficients of park accessibility for older adults and children across the three grid resolutions. (b) Proportions of grid cells classified into four vulnerability-related categories (relatively safe, heat exposure risk, accessibility deprivation, and dual vulnerability) for older adults and children across the three grid resolutions. Note: Percentages are rounded to one decimal place and may not sum to exactly 100.0%.
5. Discussion
5.1. The “Trap of Average Equity” and the Spatial Mechanisms of Structural Mismatch
This study reveals that the mismatch pattern between park accessibility and heat exposure in Hefei exhibits a significant “core-periphery” divergence, profoundly corroborating the “trap of average equity” in urban spatial allocation [42,43]. Although the citywide average accessibility metrics appear acceptable, the global Gini coefficients (0.875 for older adults and 0.988 for children) are substantially higher than the average levels reported in similar studies of Beijing and Shanghai [44,45]. These extreme values indicate that the vast majority of the population shares only a minuscule proportion of accessible park resources. The large-scale, contiguous distribution of LH-type clusters—defined as low accessibility at focal grid cells associated with high population density in neighboring cells—in the old city core, including Luyang and Yaohai districts, further indicates a spatial mismatch between park accessibility and the surrounding population distribution. This finding echoes the dialectical relationship between “distributional equity” and “procedural equity” in environmental justice research: even with an overall increase in resource supply (such as the construction of large comprehensive parks in urban peripheries), the actual benefits to disadvantaged groups remain highly limited if spatial allocation fails to align with actual demographic demands. The uniqueness of Hefei lies in its old city core being constrained by exceptionally high building density, which limits the provision of new green spaces; concurrently, the persistent aging trend and the agglomeration of school-aged children generate a dual “population–green space” squeeze that is significantly more pronounced than in other cities [46,47,48].
5.2. Driving Factors of Intergenerational Climate Vulnerability Divergence
The dual-vulnerability zones for older adults and children exhibit a pattern of “core overlap and peripheral divergence.” This pattern may reflect differences in population distribution, urban form, park accessibility, and summer surface temperatures. Previous studies have examined older adults’ thermal perceptions in urban parks and compound heat–humidity exposure among vulnerable populations [49,50]. Research on residents’ preferences for new and old parks in Hefei and the influence of microclimate on older adults’ outdoor activities provides additional context [51,52], although these studies do not establish the demographic mechanisms underlying the spatial patterns identified in Hefei. Under the adopted classification criteria, dual-vulnerability zones account for 7.5% of the study area’s mapped area for older adults and 6.6% for children. These percentages represent area-based shares rather than the proportions of either population experiencing heat exposure. Shared-risk areas are concentrated in the urban core, whereas group-specific risk areas are more fragmented along the periphery. Although this pattern is consistent with the spatial distribution of the two demographic groups, the present analysis is descriptive and does not establish that aging in place or population redistribution caused the observed patterns.
Mobility constraints may further influence the practical accessibility of urban parks. However, because the 2SFCA model applies the same walking speed of 5 km/h and the same 15-min walking-time threshold to both groups, the modeled results do not directly quantify age-specific differences in walking ability or actual travel behavior. Older adults with limited mobility may therefore experience greater access barriers than those captured by the standardized model. Nevertheless, the present study does not measure actual mobility behavior or individual health outcomes. The “last-mile” gap should therefore be understood as a potential planning concern that may constrain access to green space during hot conditions, rather than as direct evidence of a fatal health threat.
5.3. Theoretical Contributions and Identification Advantages of the Three-Dimensional Risk Diagnosis
The core methodological contribution of this study lies in extending the traditional two-dimensional “accessibility–population” mismatch analysis into a three-dimensional spatial screening framework integrating accessibility, population distribution, and surface temperature. A two-dimensional mismatch analysis can identify LH-type clusters but cannot distinguish between areas where low accessibility is spatially associated with high neighboring population density and relatively high surface temperatures and areas where this spatial association occurs without a high-LST hotspot. By overlaying LH-type clusters with July 2024 high-LST hotspots, this study further distinguishes locations where accessibility–population mismatch coincides with relatively high surface temperatures. This approach provides a practical basis for prioritizing spatially differentiated planning interventions. Importantly, the identified zones are spatial screening outcomes rather than direct measurements of individual heat exposure or physiological risk. For LH-type areas outside high-LST hotspots, improving park accessibility may be a primary intervention priority. For dual-vulnerability zones where LH-type clusters overlap with high-LST hotspots, accessibility improvements may need to be complemented by heat-adaptation measures, such as shading systems, cooling pavements, and ventilation corridors [53,54,55].
5.4. Planning Implications and Differentiated Governance Strategies
Urban green space planning should transition comprehensively from “total volume growth” to “demand-responsive precise allocation,” prioritizing the investment of limited public resources into dual vulnerability zones [56,57,58]. Based on the spatial overlap analysis and intergenerational demand differences, this paper proposes a differentiated governance framework targeting the three core risk zones (Table 3). Overall, the spatial distributions of these three risk zones are not isolated from one another; rather, they form a continuous risk gradient along the “old city core–transition zone–urban-rural fringe” axis. This implies that planning interventions should not be confined to patching single isolated patches. Instead, a three-tier network comprising “cooling corridors–community green spaces–pocket parks” should be constructed at the urban macro-scale. Coordinating cooling corridors, community green spaces, and pocket parks may help connect peripheral cooling resources with central mismatch zones while preserving green infrastructure in transition zones and urban-rural fringes. The strategic prioritization of urban green infrastructure for heat mitigation is supported by previous planning research [59]. The effectiveness of these interventions in Hefei should nevertheless be evaluated under future land-use and population-change scenarios.
Table 3.
Differentiated climate adaptation governance strategies for dual vulnerability zones.
From an urban sustainability perspective, these differentiated interventions connect the social dimension of sustainability, represented by equitable access to public green spaces, with the environmental dimension of climate adaptation. This spatially targeted approach provides planning evidence for promoting more inclusive and climate-resilient urban development.
5.5. Research Limitations and Future Directions
This study has several limitations that highlight directions for future research. First, the thermal dimension is represented by daytime MODIS/Terra LST observations for July 2024, with high-LST hotspots identified using a mean-plus-one-standard-deviation criterion. This threshold is a relative spatial classification rule rather than a health-based threshold. Satellite-derived LST measures radiometric surface temperature and does not directly quantify the actual thermal exposure experienced by older adults or children. It also does not fully account for air temperature, humidity, wind, shading, individual activity patterns, or indoor cooling conditions. Moreover, daytime observations from a single summer month cannot fully capture diurnal or interannual variability, particularly nighttime surface urban heat island conditions. Future research could combine multi-temporal thermal data with meteorological observations and human thermal-comfort indicators to develop a more comprehensive assessment of heat exposure.
Second, although the WorldPop gridded dataset offers high spatial resolution, it provides a static representation of the population and therefore does not fully capture residents’ spatiotemporal mobility, particularly that of commuters and school-aged children. Future studies could integrate dynamic trajectory data, such as location-based services (LBS), to evaluate temporal variations in population distribution and potential heat exposure.
Third, the 2SFCA model applies a common walking speed of 5 km/h and a 15-min walking-time threshold to both older adults and children. Although these uniform assumptions provide a standardized basis for comparing park accessibility between the two groups, they do not fully capture age-related differences in walking ability or individual variations associated with physical condition and mobility. Consequently, the estimated accessibility scores and mismatch zones may differ from those derived using age-specific or individually measured walking speeds, and accessibility may be overestimated for some individuals with limited mobility. Future research should evaluate age-specific walking parameters and conduct sensitivity analyses using alternative walking speeds and time thresholds.
Fourth, the proposed framework focuses on macro-level measurements of the outdoor physical environment without fully incorporating the moderating effects of indoor cooling capacity, such as air-conditioning availability and housing insulation, or socioeconomic status (SES) on actual thermal vulnerability. Future investigations should combine micro-level household surveys with environmental observations to construct a more multidimensional socio-spatial climate-equity evaluation model.
In addition, the reported percentages of dual-vulnerability zones are area-based shares rather than estimates of the proportions of older adults or children located within these zones. Because a population-based exposure rate was not calculated, the present results should be interpreted as spatial screening indicators rather than direct estimates of population exposure. Future research should overlay age-specific population counts with the classified risk grids to estimate the number and proportion of each demographic group located in areas where park-accessibility deprivation and high LST co-occur.
Finally, the robustness analysis examined only three grid resolutions (250 m, 500 m, and 1000 m). Although the broad spatial patterns were reasonably consistent across these tested scales, this agreement does not demonstrate that the findings are independent of spatial scale. Future studies should examine additional spatial resolutions and alternative zoning schemes to further assess the sensitivity of the results to the choice of analytical units.
6. Conclusions
Grounded in a climate justice perspective, this study integrates the two-step floating catchment area (2SFCA) method, land surface temperature (LST) retrieval, and the bivariate local spatial autocorrelation (Bi-LISA) model to examine the spatial mismatch between urban park accessibility and potential heat vulnerability among older adults and children in Hefei. The main conclusions are as follows:
First, park-accessibility inequality is pronounced, with children experiencing greater spatial deprivation than older adults. The Gini coefficient for park accessibility is 0.988 for children, compared with 0.875 for older adults. Bi-LISA analysis further identifies extensive LH-type (low accessibility–high neighboring population density) clusters in the high-density old city core, indicating spatial associations between low-accessibility cells and higher population density in neighboring cells for both demographic groups.
Second, overlaying LH-type mismatch zones with July 2024 high-LST hotspots identifies potential dual-vulnerability areas concentrated in the central urban core. These zones account for 7.5% of the study area’s mapped area for older adults and 6.6% for children; these figures represent spatial area shares rather than the proportions of the respective populations exposed. The results therefore identify locations where accessibility deprivation and relatively high surface temperatures coincide, rather than directly quantifying the number or proportion of people experiencing heat exposure.
Third, dual-vulnerability zones exhibit a pattern of “core overlap and peripheral divergence.” Figure 11 shows that shared-risk areas are concentrated in the urban core, whereas children-only and older-adults-only risk areas are more fragmented along the urban periphery. This pattern supports prioritizing intergenerationally inclusive green-space renewal and cooling interventions in shared-risk areas while tailoring interventions to the distinct needs of each demographic group in peripheral areas.
These findings should be interpreted in light of the limitations of static population data, uniform walking assumptions, and daytime LST observations. Although the broad spatial patterns were reasonably consistent across the three grid resolutions examined (250 m, 500 m, and 1000 m), the results cannot be considered independent of spatial scale. Overall, this study provides a spatial screening framework for identifying priority areas for equitable park provision and heat-adaptation planning, offering empirical support for socially inclusive, climate-resilient, and sustainable urban development.
Author Contributions
Conceptualization, Z.L. and C.W.; methodology, Z.L.; software, Z.L.; validation, Z.L., S.W. and C.W.; formal analysis, Z.L.; investigation, Z.L. and S.W.; resources, S.W.; data curation, Z.L.; writing—original draft preparation, Z.L.; writing—review and editing, Z.L., S.W. and C.W.; visualization, Z.L.; supervision, C.W.; project administration, C.W.; funding acquisition, S.W. All authors have read and agreed to the published version of the manuscript.
Funding
This research was funded by the Shandong Provincial Natural Science Foundation, grant number ZR2026MS0735.
Institutional Review Board Statement
Not applicable.
Informed Consent Statement
Not applicable.
Data Availability Statement
The original contributions presented in this study are included in the article. Further inquiries can be directed to the corresponding author.
Conflicts of Interest
The authors declare no conflicts of interest. The funders had no role in the design of the study; in the collection, analyses, or interpretation of data; in the writing of the manuscript; or in the decision to publish the results.
References
- Gao, S.; Chen, Y.; Chen, D.; He, B.; Gong, A.; Hou, P.; Li, K.; Cui, Y. Urbanization-induced warming amplifies population exposure to compound heatwaves but narrows exposure inequality between global North and South cities. npj Clim. Atmos. Sci. 2024, 7, 154. [Google Scholar] [CrossRef] [Scilit]
- Yu, W.; Yang, J.; Zhou, Y.; Xiao, X. Global dataset on heat wave exposure due to the urban heat island effect. Sci. Data 2026, 13, 449. [Google Scholar] [CrossRef] [Scilit]
- Liu, X.; Peng, Y.; Xing, Y.; Li, H. From survival to empowerment: A PLS-SEM analysis of residential aging-suitability for empty-nest seniors in urban China. medRxiv 2026. medRxiv:2026-03. [Google Scholar] [CrossRef] [Scilit]
- Wang, Y.; Kerr, N.; Macaden, L. Reframing ageing in place: Perspectives from Chinese older people. BMC Geriatr. 2026, 26, 97. [Google Scholar] [CrossRef] [Scilit]
- Cao, H.; Wang, Q.; Zhang, Q. Optimization of China’s Child-Friendly City Construction Policy from the Perspective of Policy Tools. Sustainability 2025, 17, 6220. [Google Scholar] [CrossRef] [Scilit]
- Liu, Y.; Wang, X.; Sun, Y. A Study on the Expected Risk Tolerance Mechanism of Child-Friendly Environment Transformation in High-Density Communities. Land 2025, 14, 1490. [Google Scholar] [CrossRef] [Scilit]
- Hung, W.-T.; Lin, J.-Y.; Chen, C.-F. Cool Island Effects of Urban Parks in a High-Density City: Evidence from 12 Parks in Central Taipei, Taiwan. Urban Sci. 2026, 10, 504. [Google Scholar] [CrossRef] [Scilit]
- Kabisch, N.; Van Den Bosch, M.; Lafortezza, R. The health benefits of nature-based solutions to urbanization challenges for children and the elderly—A systematic review. Environ. Res. 2017, 159, 362–373. [Google Scholar] [CrossRef] [Scilit]
- Xie, H.; You, M.; Xiao, Y.; Liu, X.; Li, S.; Liu, J.; Guan, C.; Bao, Z.; Gao, X. A supply-demand evaluation framework for uncovering age and gender inequities in urban green space cooling-A case study of Fuzhou. Urban For. Urban Green. 2026, 116, 129172. [Google Scholar] [CrossRef] [Scilit]
- Alemohammad, S.; Miandoab, A.M.; Mehrian, M.R. Park Accessibility and Environmental Justice: A Spatial Analysis of Urban Poverty in Tabriz, Iran. Int. J. Environ. Res. 2026, 20, 55. [Google Scholar] [CrossRef] [Scilit]
- Gupta, A.; De, B.; Feng, Z. Intra-city disparities in urban green space proximity and its association with infrastructures and demography. Remote Sens. Appl. Soc. Environ. 2025, 39, 101724. [Google Scholar] [CrossRef] [Scilit]
- Omollo, W.O. Socio-Spatial Inequalities in Access to Urban Public Parks: Implications for Spatial Justice. J. Parks 2026, 1, 11. [Google Scholar] [CrossRef] [Scilit]
- Collins, T.W.; Allain, M.L.; Grineski, S.E.; Rigolon, A. Comparing methods for measuring park access and equity using US census microdata in metropolitan Miami. Appl. Geogr. 2025, 178, 103579. [Google Scholar] [CrossRef] [Scilit]
- Kanav, A.; Kumar, J. Exploring the preferences of vulnerable populations in green spaces: A systematic review. Socio-Ecol. Pract. Res. 2024, 6, 411–432. [Google Scholar] [CrossRef] [Scilit]
- Tabatabaei, N.S. Designing small urban green spaces for equity: A framework for environmental justice. J. Salut. Archit. 2025, 4, 19–31. [Google Scholar] [CrossRef] [Scilit]
- Zhang, Y.; Zhao, J.; Mavoa, S.; Smith, M. Inequalities in urban green space distribution across priority population groups: Evidence from Tāmaki Makaurau Auckland, Aotearoa New Zealand. Cities 2024, 149, 104972. [Google Scholar] [CrossRef] [Scilit]
- Weber, R.; Haase, A.; Albert, C. Access to urban green spaces in Hannover: An exploration considering age groups, recreational nature qualities and potential demand. Ambio 2023, 52, 631–646. [Google Scholar] [CrossRef] [Scilit]
- Zhang, Z.; Tang, X.; Wang, Y. Evaluation of the intergenerational equity of public open space in old communities: A case study of Caoyang New Village in Shanghai. Land 2023, 12, 1347. [Google Scholar] [CrossRef] [Scilit]
- Luo, W.; Chen, H.; Yang, Z.; Liu, J. Accessibility and equity of park green spaces: Considering differences in walking speeds across age groups. Land 2024, 13, 2240. [Google Scholar] [CrossRef] [Scilit]
- Chen, J.; Li, H.; Luo, S.; Xie, J.; Su, D.; Kinoshita, T. Rethinking urban park accessibility in the context of demographic change: A population structure perspective. Urban For. Urban Green. 2024, 96, 128334. [Google Scholar] [CrossRef] [Scilit]
- Martinez, J.; Argota Sánchez-Vaquerizo, J.; Mahajan, S. Not your mean green: Beyond averages in mapping socio-spatial inequities in urban greenery for smart cities. EPJ Data Sci. 2026, 15, 25. [Google Scholar] [CrossRef] [Scilit]
- Kianmehr, A. Toward equity in heat mitigation planning: A review of literature, current practices, and future pathways. Local Environ. 2026, 31, 1872–1893. [Google Scholar] [CrossRef] [Scilit]
- Krenz, K.; Amann, L. Urban heat island effect: Examining spatial patterns of socio-demographic inequalities in Greater London. Cities Health 2025, 9, 901–924. [Google Scholar] [CrossRef] [Scilit]
- Silva, M.B.; Bressane, A.; Almendra, R.; Lyra, A.M.; Machado, V.M. Urban heat riskscape and green injustice: A scoping review of health and environmental impacts. Urban For. Urban Green. 2026, 118, 129305. [Google Scholar] [CrossRef] [Scilit]
- Bwire, C.; Juel, R.; Milner, J.; Bonnet, G.; Bonell, A.; Yeung, S.; Umesh, H.; Picetti, R.; Kuppili, S.K.; Gerard, J.; et al. Living through the heat: How urban children and young people experience and envision healthier cities. PLoS Glob. Public Health 2025, 5, e0004879. [Google Scholar] [CrossRef]
- Hu, W.; Hu, Y.; Ge, Y.; He, Z.; Ju, Y.; Zhai, G.; Lu, Y.; Mashhoodi, B. Thermal exposure across age groups: Social, spatial, and temporal inequalities in Nanjing, China. Sustain. Cities Soc. 2025, 124, 106282. [Google Scholar] [CrossRef] [Scilit]
- Lyra, A.M.C.; Silva, M.B.; da Silva, J.S.N.; de Souza, A.C.; Machado, V.M.; Almendra, R.; Bressane, A. Beyond technical metrics: Key indicators as boundary objects for assessing environmental injustice in green space access and urban heat exposure—A scoping review. Urban For. Urban Green. 2026, 120, 129453. [Google Scholar] [CrossRef] [Scilit]
- Xiao, Y.; Piao, Y.; Wei, W.; Pan, C.; Lee, D.; Zhao, B. A comprehensive framework of cooling effect-accessibility-urban development to assessing and planning park cooling services. Sustain. Cities Soc. 2023, 98, 104817. [Google Scholar] [CrossRef] [Scilit]
- Li, W.; Wu, T.; Xuan, L.; Weng, R.; Zhu, K.; Gu, H.; Yan, Z.; Wang, X.; Chen, S. Integrated optimization of cooling performance, perceived experience, and accessibility of urban parks under extreme heat events: A case study of Central Shijiazhuang, China. Int. J. Biometeorol. 2025, 69, 3435–3450. [Google Scholar] [CrossRef] [Scilit]
- Bondarenko, M.; Priyatikanto, R.; Tejedor-Garavito, N.; Zhang, W.; McKeen, T.; Cunningham, A.; Woods, T.; Hilton, J.; Cihan, D.; Nosatiuk, B.; et al. Estimates of 2015–2030 Total Number of People Per Grid Square Broken Down by Gender and Age Groupings at a Resolution of 3 Arc (Approximately 100 m at the Equator), R2025A, Version v1; Global Demographic Data Project, WorldPop; University of Southampton: Southampton, UK, 2025. [CrossRef]
- Wan, Z.; Hook, S.; Hulley, G. MODIS/terra Land Surface Temperature/Emissivity 8-Day L3 Global 1km SIN Grid V061; NASA EOSDIS Land Processes Distributed Active Archive Center: Sioux Falls, SD, USA, 2021. [Google Scholar] [CrossRef]
- Haklay, M.; Weber, P. Openstreetmap: User-generated street maps. IEEE Pervasive Comput. 2008, 7, 12–18. [Google Scholar] [CrossRef] [Scilit]
- Luo, W.; Wang, F. Measures of spatial accessibility to health care in a GIS environment: Synthesis and a case study in the Chicago region. Environ. Plan. B Plan. Des. 2003, 30, 865–884. [Google Scholar] [CrossRef] [Scilit]
- Anselin, L. Local indicators of spatial association—LISA. Geogr. Anal. 1995, 27, 93–115. [Google Scholar] [CrossRef] [Scilit]
- Anselin, L.; Syabri, I.; Smirnov, O. Visualizing multivariate spatial correlation with dynamically linked windows. In Proceedings of the CSISS Workshop on New Tools for Spatial Data Analysis, Santa Barbara, CA, USA, 10–11 May 2002; Center for Spatially Integrated Social Science: Santa Barbara, CA, USA; Volume 2.
- Zhang, Y.; Cao, W.; Zhang, K. Mapping urban networks through inter-firm linkages: The case of listed companies in Yangtze River Delta, China. J. Geosci. Environ. Prot. 2020, 8, 23–36. [Google Scholar]
- Huang, J.; Chu, C.; Wang, L.; Wu, Z.; Zhang, C.; Geng, J.; Zhu, Y.; Yu, M. Research on the extraction method comparison and spatial-temporal pattern evolution for the built-up area of Hefei based on multi-source data fusion. Remote Sens. 2023, 15, 5617. [Google Scholar] [CrossRef] [Scilit]
- Zhao, Y.; Zhong, L.; Zhou, K.; Liu, B.; Shu, W. Responses of the urban atmospheric thermal environment to two distinct heat waves and their changes with future urban expansion in a Chinese megacity. Geophys. Res. Lett. 2024, 51, e2024GL109018. [Google Scholar] [CrossRef] [Scilit]
- Yang, C.; Zhou, M.; Wei, H.; Dong, C. Delineating Dynamic-Static Coupled Living Circles: Diagnosing Walkable Vitality for Targeted Urban Renewal—A Case Study of Baohe District, Hefei, China. Urban Sci. 2026, 10, 259. [Google Scholar] [CrossRef] [Scilit]
- Yang, Z.; Fang, H.; Wei, G.; Mo, J.; Gao, X.; Zhang, S. An assessment of urban park accessibility using multi-source data in Hefei, China: A social equity perspective. Land Degrad. Dev. 2024, 35, 3627–3641. [Google Scholar] [CrossRef] [Scilit]
- Wang, S.; Wang, M.; Wang, C.; Liu, X.; Yu, J.; Li, Y.; Liu, Q. The day-night asymmetric and nonlinear impacts of human activity and 3D urban morphology on land surface temperature: Threshold mechanisms and spatial heterogeneity. Sustain. Cities Soc. 2026, 143, 107346. [Google Scholar] [CrossRef] [Scilit]
- Zeng, J.; Yang, P.; Liu, X.; Sun, Z. Spatial mismatch between heat exposure and cooling accessibility in the Middle Yangtze River Urban Agglomeration. Sci. Rep. 2026, 16, 31309. [Google Scholar] [CrossRef] [Scilit]
- Zeng, P.; Sun, F.; Shi, D.; Liu, Y.; Zhang, R.; Tian, T.; Che, Y. Integrating anthropogenic heat emissions and cooling accessibility to explore environmental justice in heat-related health risks in Shanghai, China. Landsc. Urban Plan. 2022, 226, 104490. [Google Scholar] [CrossRef] [Scilit]
- Feng, S.; Chen, L.; Sun, R.; Feng, Z.; Li, J.; Khan, M.S.; Jing, Y. The distribution and accessibility of urban parks in Beijing, China: Implications of social equity. Int. J. Environ. Res. Public Health 2019, 16, 4894. [Google Scholar] [CrossRef] [Scilit]
- Tang, Z.; Gu, S. An evaluation of social performance in the distribution of urban parks in the central city of Shanghai: From social equity to social justice. Urban Plan. Forum 2016, 227, 15–21. [Google Scholar]
- Han, J.; Huang, S.; Zhang, S.; Lin, Q.; Wang, X. Assessing supply and demand discrepancies of urban green space in high-density built-up areas based on vitality impacts: Evidence from Beijing’s central districts, China. Sustainability 2025, 17, 4828. [Google Scholar] [CrossRef] [Scilit]
- Gu, K.; Liu, J.; Wang, D.; Dai, Y.; Li, X. Analyzing the supply and demand dynamics of urban green spaces across diverse transportation modes: A case study of Hefei city’s built-up area. Land 2024, 13, 1937. [Google Scholar] [CrossRef] [Scilit]
- Gong, H.; Sun, L. Unveiling the Spatial Mismatch Between Green Space Equity and Residents’ Subjective Well-Being: An Integrated Approach Based on Machine Learning and Social Media Data. Land 2025, 14, 2205. [Google Scholar] [CrossRef] [Scilit]
- Ma, X.; Tian, Y.; Du, M.; Hong, B.; Lin, B. How to design comfortable open spaces for the elderly? Implications of their thermal perceptions in an urban park. Sci. Total Environ. 2021, 768, 144985. [Google Scholar] [CrossRef] [Scilit]
- Gao, M.; Sun, X.; Su, B.; Tang, L.; Cheng, X.; Jiang, T. Prolonged seasons of compound heat–humidity extremes amplify vulnerable population exposure in Eastern China. Atmos. Ocean. Sci. Lett. 2026, 19, 100663. [Google Scholar] [CrossRef] [Scilit]
- Ma, D.; Zhang, S.; Xiao, T.; Shui, T. Aspects of new and old urban parks most valued by residents on social media: A case study in Hefei. Sustainability 2023, 15, 13771. [Google Scholar] [CrossRef] [Scilit]
- Wang, S.; Wang, C.; Liu, Q.; Zhang, S.; Xu, Y.; Xia, Y. Seasonal Interaction Effects of Microclimate and Built Environment on Elderly Outdoor Activities: A Case Study in Xi’an, China. Buildings 2026, 16, 936. [Google Scholar] [CrossRef] [Scilit]
- Khante, V.; Haque, M. Thermally Inclusive Public Spaces: Designing Walkable Urban Environments In Hot And Arid Climates. Int. J. Comput. Inf. Syst. Ind. Manag. Appl. 2026, 18, 675–686. [Google Scholar] [CrossRef] [Scilit]
- Zeng, J.; Chen, Z. Cooling-resource mismatch and residual heat exposure among vulnerable populations in high-density Singapore: An equity-oriented diagnostic framework. Urban Clim. 2026, 70, 103154. [Google Scholar] [CrossRef] [Scilit]
- Wang, C.; Wang, S.; Ren, S.; Luo, W.; Yi, W.; Qing, M. GAN Predictability for Urban Environmental Performance: Learnability Mechanisms, Structural Consistency, and Efficiency Bounds. Atmosphere 2025, 16, 1403. [Google Scholar] [CrossRef] [Scilit]
- Yang, Z.; Bi, J.; Zheng, Q.; Jin, M.; Qiao, P. Small Public Green Spaces for Equitable Urban Regeneration: Community-Scale Compensation and Mismatch in Shenzhen, China. Sustainability 2026, 18, 7623. [Google Scholar] [CrossRef] [Scilit]
- Zhao, S.; Li, Y.; Nie, Z.; Li, Y. Supply–Demand Assessment of Cultural Ecosystem Services in Urban Parks of Plateau River Valley City: A Case Study of Lhasa. Land 2025, 14, 1301. [Google Scholar] [CrossRef] [Scilit]
- Ye, J.; Jiang, Z.; Li, R.; Du, S.; Yang, F. Budgeting urban tree canopy expansion for cooling-benefit equality: A graph neural network-based multi-objective framework. Comput. Environ. Urban Syst. 2027, 131, 102532. [Google Scholar] [CrossRef] [Scilit]
- Norton, B.A.; Coutts, A.M.; Livesley, S.J.; Harris, R.J.; Hunter, A.M.; Williams, N.S. Planning for cooler cities: A framework to prioritise green infrastructure to mitigate high temperatures in urban landscapes. Landsc. Urban Plan. 2015, 134, 127–138. [Google Scholar] [CrossRef] [Scilit]

Disclaimer/Publisher’s Note: The statements, opinions and data contained in all publications are solely those of the individual author(s) and contributor(s) and not of MDPI and/or the editor(s). MDPI and/or the editor(s) disclaim responsibility for any injury to people or property resulting from any ideas, methods, instructions or products referred to in the content. |
© 2026 by the authors. Licensee MDPI, Basel, Switzerland. This article is an open access article distributed under the terms and conditions of the Creative Commons Attribution (CC BY) license.