


Abstract
Coastal reclamation ecological restoration is critical for mitigating nearshore ecosystem degradation; however, achieving robust ecological assessment and effectively improving ecological health remain challenging for governance and sustainable development. This research develops an integrated framework based on two-step fuzzy-set qualitative comparative analysis (two-step fsQCA) that combines ecological assessment with pathway identification to address this issue under small-sample conditions. The framework includes: (i) constructing a tailored ecological health indicator framework; (ii) determining weights via a combined model selected by the Weighted Average of Mutual Information Redundancy (WAMIR) index; (iii) measuring health status and introducing the Rank Sum Ratio (RSR) for objective grading; and (iv) employing two-step fsQCA to identify configurational pathways. The framework was validated using time-series data from Laizhou Bay (1980–2019) and cross-sectional data from 14 functional zones in Zhejiang Province, China. Results show that, compared to previous approaches, the proposed framework can provide a robust ecological health assessment under small-sample conditions and effectively capture the hierarchical combinatorial causality between conditions and outcomes, offering a practical reference for assessment and differentiated management in coastal reclamation areas.
1. Introduction
Large-scale coastal reclamation projects have supported rapid regional economic development, but have inevitably altered bay shorelines and hydrodynamic regimes, triggering a series of ecological problems such as coastal wetland shrinkage, biodiversity decline, and water eutrophication [1,2]. With the deepening advancement of ecological civilization construction, the ecological restoration of coastal reclamation areas has become an urgent and major practical issue. This process typically involves a workflow of ecological problem identification, indicator construction, health assessment, driving factor diagnosis, restoration measure selection, and final management and decision-making. Relevant studies indicate that accurately quantifying the ecological health status of coastal reclamation areas and identifying the key factor combinations that drive ecological health are critical prerequisites for integrated coastal zone management and differentiated zonal restoration [3,4,5].
However, due to the strong site-specificity of reclamation projects and their ecological responses, available research cases and data are often limited, and small-sample scenarios have become a typical methodological constraint in this field. Therefore, in reclamation restoration practice, the following challenges remain: How can the ecological health status of different regions and time periods be assessed accurately and robustly? And how can key factor combinations associated with good ecological health status be identified to provide a basis for restoration strategies? To address these challenges, the core scientific question of this research focuses on: how to develop an integrated analytical framework that combines “robust assessment” and “hierarchical pathway identification” in reclamation areas characterized by limited cases, numerous influencing factors, and varying hierarchical levels of effects? Specifically, this research addresses two sequentially linked modules: the assessment module (quantifying regional ecological health status) and the analysis module (identifying the key factors and their combinations affecting ecological health status).
In the ecological health assessment module, multi-criteria decision analysis (MCDA) is a widely used quantitative analytical tool in marine and coastal ecological health research. By integrating multiple dimensions such as ecology, resources, and socio-economy, and balancing conflicts among different objectives, MCDA facilitates systematic comprehensive evaluation and analysis [6,7,8,9]. In specific assessment practices, researchers have constructed multi-tiered indicator systems based on frameworks such as the Pressure–State–Response (PSR) framework and the DPSIR framework to quantitatively assess the health status of coastal wetlands and bay ecosystems [10,11,12,13,14,15,16,17]. For example, Li et al. [18] combined the PSR framework with AHP and entropy weighting to assess ecosystem health in Sanna Bay; Chen et al. [10] integrated the DPSIR framework with TOPSIS to evaluate coastal zone ecosystem health; Du and Wang [12] applied AHP-entropy-based TOPSIS to assess ecological security in marine ranching; and Yuvaraj et al. [15] used integrated AHP-TOPSIS models to evaluate coastal ecological carrying capacity under reclamation pressure. These studies provide an important methodological foundation for ecological health measurement in reclamation and related coastal areas.
However, the above studies mainly focus on the application of a single combined weighting scheme, without fully considering the potential impact of the indicator composition and information overlap characteristics of specific cases on the stability of the final scores; the strategy for selecting weighting schemes thus warrants further exploration. Moreover, comprehensive evaluation results mainly reflect the overall level of ecological health and cannot adequately explain how such health status is formed [19,20]. Therefore, after completing the ecological health assessment, it is necessary to introduce corresponding analytical methods to identify key factor combinations associated with good ecological health status.
In the analysis module, exploring the driving factors of ecological health is a prerequisite for identifying restoration pathways. Existing review studies have systematically summarized this: reclamation and coastal engineering directly lead to the loss of coastal wetlands and habitat fragmentation by altering shoreline morphology and hydrological connectivity [21]; terrestrial nutrient and pollutant inputs are key driving factors for water quality degradation and eutrophication [22]; and coastal land use change, reclamation expansion, and urbanization jointly weaken the structure and function of ecosystems through the cumulative effects of multiple anthropogenic pressures [23]. These studies have revealed the diversity and complexity of the driving factors of ecological health in reclamation areas from different perspectives. In specific analyses, researchers have attempted to adopt different analytical methods to explore the ecological types and influencing factors of coastal reclamation areas. In terms of classification and zoning analysis, cluster analysis is commonly used to identify coastal ecological types and functional zoning. For example, Wang et al. applied cluster analysis to distinguish the functional zoning and ecological health types of coastal reclamation areas [24]. Pavirani et al. [25] compared the zoning effects of multiple unsupervised methods on marine ecosystem risks in the Mediterranean Sea, finding that different algorithms tend to produce broader or more focused risk zoning ranges, and that multi-method comparisons can provide a reference for management zoning. In terms of dominant dimension extraction, factor analysis and principal component analysis are commonly used to extract major influencing dimensions from multidimensional indicators. For example, Li et al. used factor analysis, including principal component analysis, to identify the dominant influencing dimensions behind coastal ecological health outcomes [26]; Rheuban et al. [27] conducted principal component and factor analyses on multi-year summer water quality data from Buzzards Bay, finding that in addition to nutrient loading, bay geomorphology is also an important driver of spatial water quality patterns. In terms of influencing factor pathways and regression analysis, structural equation modeling and regression analysis are commonly used to estimate the direct and indirect effects of environmental variables on ecological health outcomes. For example, Xu et al. [28], based on data from 22 coral reefs and 102 survey sites in the northern South China Sea, used panel regression and structural equation modeling to distinguish the direct and indirect effects of population, agricultural nitrogen emissions, and sea surface temperature on live coral cover; Wu et al. [29] applied structural equation modeling to analyze the regulatory pathways through which riverine nutrients, gravel habitat types, and sand cover changes affect benthic organism distributions in an algal reef ecosystem in Taiwan, revealing the complex mechanisms by which different environmental drivers influence biological communities through direct and indirect pathways.
Overall, the above methods focus on case classification, dimension extraction, or testing variable relationships under specific model specifications, which helps to summarize regional differences and identify major influencing factors [30,31,32,33,34,35,36,37]. However, these traditional statistical methods have obvious methodological limitations when dealing with the driving factors of coastal ecological health. First, they require a relatively large sample size, which limits their applicability in reclamation research with limited cases; the applicability and result stability of these methods may be affected by sample size, variable quantity, and model complexity. Among them, when samples are limited and indicators are numerous, cluster analysis results may be sensitive to individual cases and variable selection [25]; factor analysis has certain requirements for the ratio of sample size to variable quantity [14]; and the parameter estimation and model fitting of structural equation modeling and regression analysis depend on the match between sample size and model complexity, and estimation bias or instability may occur when the sample size is relatively small compared to the number of parameters to be estimated [38,39]. Second, these methods usually assume that factors act independently and that their effects can be simply superimposed, making it difficult to characterize the complex synergistic or substitution relationships among multiple causal conditions in small-sample scenarios. Therefore, further analyzing the combined effects of multiple factors and their relationship with ecological health outcomes under limited case conditions is of great significance for forming governance references with explanatory power.
In contrast, fuzzy-set qualitative comparative analysis (fsQCA) provides a configurational perspective for analyzing the combined effects of multiple factors. This method focuses on how different conditions synergize or substitute for one another, and how multiple equivalent pathways are linked to specific outcomes; it has been used in small- and medium-sample studies with complex causal relationships. In the field of coastal and marine governance, fsQCA has been applied to configurational analyses of issues such as fishery collaborative governance, blue finance and sustainable development of marine ranching, and marine economic resilience. For example, Qiu et al. used one-step fsQCA to explore the formation configurations of ecological protection participation behavior in coastal areas [19]. Roozee et al. [40] used fsQCA to analyze how combinations of organizational structural conditions in 10 regional fishery management organizations affect collaborative performance; Wang and Lian [41] used fsQCA to identify three configurational pathways—policy-led, market-driven, and capability-supported—for blue finance promoting the sustainable development of marine ranching; and Liu and Huang [42] used fsQCA with 11 coastal provinces in China as cases to analyze the configurational effects of conditions such as resistance, recovery, and renewal capacities on marine economic resilience. The above studies demonstrate the capacity of one-step fsQCA to identify condition combination pathways. However, when influencing factors involve different hierarchical levels, placing conditions at the same analytical level (flat hierarchy) may make it difficult to reveal their hierarchical differences. Specifically, the one-step method cannot effectively distinguish between slowly changing distal structural factors and rapidly changing, operable proximate governance responses, which often leads to numerous logical remainders and makes complex configurational relationships difficult to interpret.
In summary, ecological health research in reclamation areas faces the following methodological requirements in the assessment and driving factor analysis modules, respectively [43,44,45,46,47,48,49]:
- (1)
- Assessment module: The selection of combined weighting schemes in MCDA is often highly subjective. Most studies directly select a single combined weighting method and rarely systematically compare multiple combined weighting models based on different case characteristics (such as indicator dimension composition, factor quantity, and information overlap). Combined weighting methods still lack an adaptive selection mechanism, and whether the resulting composite scores are stable and can support robust ecological health assessment remains to be further explored [14,50].
- (2)
- Driving factor analysis module: Under conditions of limited cases, numerous influencing factors, and different hierarchical levels of conditions, one-step fsQCA may face problems such as numerous logical remainders, complex result interpretation, and difficulty in expressing condition hierarchies. When there are many candidate conditions and a limited number of cases, numerous logical remainders may appear in the truth table, increasing the difficulty of interpreting configurational results; moreover, if different conditions have different hierarchical levels, placing them at the same analytical level may make it difficult to fully reveal their differences in effect. Two-step fsQCA provides a methodological foundation for hierarchical configurational analysis and has been applied in other fields [51], but its application in identifying ecological health driving pathways in reclamation areas still has room for expansion, and whether it can yield key factor combinations that are moderate in number, clearly interpretable, and capable of supporting governance decisions requires further investigation.
To address the above two methodological requirements, this research develops an integrated framework combining ecological health assessment and pathway identification. Within this framework, the assessment and analysis modules are sequentially linked and logically integrated: First, MCDA serves as the foundational evaluation framework to establish a multidimensional indicator system; second, the WAMIR index is introduced as a “weighting filter” to objectively select the most robust weighting scheme from multiple candidates; subsequently, based on data characteristics, linear weighting or the TOPSIS model is employed to calculate the composite score, which is then subjected to the RSR method for five-level objective grading, thereby generating a reliable outcome variable (Y); finally, Y is fed into the two-step fsQCA as the analytical engine, which theoretically divides conditions into remote and proximate ones to identify the configurational pathways (X) driving ecological health. Each method performs its specific function and complements the others logically. Compared with existing studies, the main extensions of this research are as follows:
- (1)
- Assessment module: To address differences among reclamation cases in indicator composition and information overlap, a mutual-information-based selection mechanism for combined weighting schemes is introduced. Using the Weighted Average of Mutual Information Redundancy (WAMIR) as a quantitative basis, candidate combined weighting schemes are compared to provide a comparable screening criterion for scheme selection, thereby providing methodological support for answering “how to obtain robust ecological health assessment results” in the assessment module and providing a stable ecological health outcome variable for subsequent configurational analysis.
- (2)
- Driving factor analysis module: To address the problems that may arise in one-step fsQCA under limited cases and numerous candidate conditions, such as numerous logical remainders and difficulty in reflecting different condition hierarchies, two-step fsQCA is adopted: antecedent conditions are divided into remote structural conditions and proximate regulatory conditions based on theory, so as to hierarchically examine the relationships between different conditions and their combinations and ecological health outcomes. On this basis, multiple equivalent pathways associated with ecological health outcomes are identified, and the synergistic and substitution relationships among conditions are analyzed, providing a reference for identifying differentiated restoration pathways, thereby providing methodological support for answering “how to identify key factor combinations that are moderate in number, clearly interpretable, and capable of supporting governance decisions” in the analysis module.
In summary, the proposed integrated framework aims to solve two problems that traditional MCDA and existing fsQCA applications struggle to address under small-sample conditions: how to objectively select a combined weighting scheme in MCDA, and how to identify configurational pathways for ecological restoration on the basis of ecological health assessment. This framework is expected to identify the key factors affecting regional ecology in specific reclamation contexts, thereby supporting restoration measure selection and differentiated governance decisions. Apart from the above two extensions, the other steps of the proposed framework adopt existing mature techniques, including PSR-based indicator construction, AHP/EW weighting, RSR grading, and fsQCA. The proposed framework is validated through two case studies in Laizhou Bay and Zhejiang Province.
The remainder of this research is structured as follows: Section 2 elaborates on the components of the integrated framework developed in this research, including the construction of the indicator system, the determination of indicator weights, the measurement and grading of ecological health, and the two-step fsQCA configurational analysis. Section 3 briefly introduces the research cases and the construction of case-related indicator frameworks. Section 4 demonstrates the effectiveness of the proposed framework through the analysis of these two case groups. Section 5 discusses the advantages, applicable scope, and limitations of the proposed framework. Section 6 presents the conclusions of this research.
2. Methods
This section describes in detail the proposed path analysis method for ecological health in small-sample coastal reclamation areas, comprising four modules: construction of the indicator system, determination of indicator weights, measurement and grading of ecological health, and two-step fsQCA configurational analysis. The following subsections present the theory, calculation formulas, and operational procedures of each module in detail. The complete procedure is illustrated in Figure 1.
Figure 1.
Method flowchart.
2.1. Construction of the Indicator System
To conduct path analysis for driving ecological health in coastal reclamation areas, the ecological health status of the target areas must first be quantified. To this end, a series of indicators capable of characterizing the ecological health status of reclamation areas should be selected, and an appropriate method should be adopted to evaluate the ecological health status. Methods for assessing ecosystem health include the bio-evaluation method (BEM) and the indicator framework method (IFM), among others [52]. Among these, the indicator framework method has been widely applied in ecological health assessment due to its capacity to fully reflect the structure and function of ecosystems. Therefore, this research adopts the indicator framework method to evaluate the ecological health status, with the key to this method lying in the selection of basic evaluation indicators [10,18].
The first step of the indicator framework method involves establishing a hierarchical evaluation structure. Specifically, the target layer of the evaluation object should first be defined. Subsequently, based on the system composition and internal interrelationships of the evaluation object, the target layer is decomposed into several criterion layers. Finally, under each criterion layer, corresponding basic indicators are selected in accordance with the principles of scientific soundness, representativeness, data availability, comprehensibility, and systematicity [1]. In this research, we select regional ecological health status as the target layer. Then, conceptual models such as pressure–state–response (PSR) and driving force–pressure–state–impact–response (DPSIR) are adopted to systematically decompose the target layer into criterion layers. Finally, basic indicators are selected under each criterion layer [53,54].
To address the issue that, in the selection of sample indicators, different cases exhibit significant differences in spatial scale, temporal attributes, data sources, and management objectives, this research further divides the basic evaluation indicators into two categories: core conceptual indicators and region-specific indicators. Core conceptual indicators refer to conceptual indicators that are generally applicable across different cases under the three core dimensions of pressure (P), state (S), and response (R); region-specific indicators, by contrast, are supplementary indicators associated with a particular case and intended to reflect regional ecological characteristics. By integrating the ecological characteristics of coastal reclamation areas and drawing on existing research [10,11,12,13,14,15,16,17], the mapping between the core concepts and specific indicators selected in this research is presented in Table 1. Accordingly, the indicator framework applied to samples from different coastal reclamation areas should cover at least the core concepts listed in Table 1. The specific indicators adopted may vary from case to case, but they must be able to characterize the corresponding core concepts. The indicator systems of the two cases in this research each cover at least the core concepts listed in Table 1, thereby ensuring logical consistency in cross-case comparison. In addition, when data conditions permit, region-specific indicators are supplemented according to the ecological characteristics of each case, so as to construct the ecological health index for each case and conduct configurational analysis.
Table 1.
Mapping table of core concepts and specific indicators.
To examine the impact of indicator selection on the evaluation results, this research conducts a sensitivity analysis using three strategies: core indicator subset, dimension removal, and random indicator deletion. The core indicator subset test retains only the core conceptual indicators in Table 1. In the dimension-removal test, the P, S, and R dimensions are removed one at a time for cases adopting the PSR framework, whereas the P, S, R, D, and I dimensions are removed one at a time for cases adopting the DPSIR framework. In the random indicator deletion test, indicators are randomly deleted at proportions of 10%, 20%, and 30%, and this process is repeated 1000 times for each proportion. Under all the above strategies, whenever the indicator set changes, the weights are renormalized and the rankings are recalculated. To measure changes in the rankings, this research takes the ranking based on the full indicator set as the benchmark, employs Spearman’s rank correlation coefficient to measure overall ranking consistency, and uses the TopN overlap rate to measure the stability of top-ranked results. In the random indicator deletion experiment, the distributions of the above metrics across 1000 repetitions are further calculated to reflect the sensitivity and robustness of the final ranking results of the proposed method to changes in the indicator set.
Among these, Spearman’s rank correlation is used to measure the consistency of the overall ranking before and after perturbation. Let the ranks of sample i in the benchmark ranking and the perturbed ranking be ri and , respectively. Then, Spearman’s rank correlation coefficient can be expressed as:
where n is the number of samples. The value of ρ ranges from [−1, 1]. The closer it is to 1, the more consistent the rankings before and after perturbation. Referring to commonly used standards, ρ > 0.9 is judged as “robust”, 0.8 < ρ ≤ 0.9 as “relatively robust”, and ρ < 0.8 as “not robust”.
TopN overlap rate is used to measure the stability of the top key samples. It is calculated as follows: take the top N samples in the benchmark ranking and the perturbed ranking, and calculate the ratio of the intersection size of the two sets to N:
where SBenchmark and SDisturbance are the sets of the TopN samples in the benchmark ranking and the perturbed ranking, respectively. In this research, the number of samples in the Laizhou Bay case is 9, and Top3 is used; the number of samples in the Zhejiang case is 14, and Top5 is used. An overlap rate greater than 80% is judged as “robust,” 60–80% as “relatively robust,” and less than 60% as “not robust.”
After the indicator framework is determined, indicators often differ considerably in their sources, types, and other attributes, resulting in significant differences in value ranges and, consequently, a lack of comparability. To facilitate data comparison, analysis, and processing, it is necessary to standardize the raw data of each indicator. According to their directional effects, evaluation indicators can be classified into three categories: positive, negative, and interval-neutral. Each category has its own distinct standardized representation.
For positive indicators:
For negative indicators:
For interval-neutral indicators:
where Zij denotes the standardized value of the evaluation indicator, Xij denotes the raw value of the evaluation indicator, and k denotes the ideal value. Through the above processing, the values of all three types of indicators fall within the range of [0, 1]. A higher standardized value indicates a greater positive contribution of that indicator to the ecological health status.
2.2. Determination of Indicator Weights
After the construction of the indicator system, it is necessary to assign corresponding weights to each indicator to characterize the influence intensity of that indicator on the ecosystem health status. However, previous research has tended to select a combined weighting method rather subjectively when applying combined weighting approaches to determine the weights of each indicator, without adequately considering the structural characteristics among the indicators. Therefore, it is crucial to employ an objective method for the selection of an appropriate combined weighting scheme [55,56].
To balance domain expert experience and objective discrete information from indicator data, existing coastal ecological assessment research generally combine the subjective AHP method [55] with the objective Entropy Weight Method (EWM) [57] to determine indicator weights. The mainstream combined weighting methods currently employed in the field of coastal ecosystem analysis can be categorized into three types: the information entropy adaptive weighted combined weighting method, the minimum information discrimination combined weighting method, and the game theory-based combined weighting method [58].
- (1)
- Information entropy adaptive weighted combined weighting method
This method utilizes the information entropy of each indicator as the dynamic allocation coefficient for subjective and objective weights: the higher the discrimination of indicator data, the lower the information entropy, the stronger the credibility of the objective weights, and the correspondingly larger the proportion of entropy weights in the combined weights [53]. The calculation formula for the combined weight is:
where denotes the subjective weight of the j-th indicator calculated by the AHP method; denotes the objective weight calculated by the EWM; ej denotes the information entropy of indicator j; and m represents the total number of evaluation indicators.
- (2)
- Minimum information discrimination combined weighting method
This method constructs an objective function that minimizes information loss and derives the analytical solution of the fused weights using the Lagrange multiplier method. Its optimization objective is for the combined weights to simultaneously approach both the subjective AHP weights and the objective entropy weights, thereby preserving the information embedded in both types of weights to the greatest extent possible [59]. The objective optimization model is formulated as:
Through the Lagrange multiplier method, the analytical solution for the optimal combined weight is derived as:
- (3)
- Game theory-based combined weighting method
This method treats the subjective AHP weights and objective entropy weights as two independent decision-making agents. Taking the minimization of the overall deviation between the combined weights and the two types of weights as the game-theoretic equilibrium objective, the optimal linear combination coefficients are solved to achieve a game-theoretic equilibrium between subjective experience and objective data [30]. The objective function is formulated as the minimization of the overall deviation of the weights:
The three mainstream combined weighting models described above differ in their optimization objectives and directions, which poses a challenge to the selection of an appropriate combined weighting model. Therefore, it is necessary to establish a quantitative model selection mechanism. It is noteworthy that information redundancy often exists among indicators within the ecological evaluation indicator system for coastal reclamation areas. However, combined weighting methods treat each indicator independently during the calculation process, without adequately considering the information structural characteristics among indicators. This may lead to high weights being concentrated on indicator clusters with high mutual information, resulting in artificial compression bias of evaluation dimensions and repeated superposition scoring of information. Consequently, the selection of a weighting scheme should not only consider the balance between subjective and objective weights, but also examine whether the weight allocation is coordinated with the inherent information structure of the indicator system.
To address this issue, this research introduces the Weighted Average of Mutual Information Redundancy (WAMIR) index based on Mutual Information (MI), providing an information-theoretic quantitative criterion for the selection of combined weighting schemes by quantifying the degree of structural information redundancy among indicators under each weighting scheme [60].
For the standardized continuous indicator data Xi and Xj(i,j = 1,2,…,m), their Mutual Information (MI) is defined as:
where H denotes the information entropy.
The interpretation of mutual information is as follows: after knowing the value of indicator Xj, by how much the uncertainty of indicator Xi is reduced. I = 0 indicates that the two indicators are completely independent with no information overlap, while I > 0 indicates the presence of information overlap, with a larger value signifying higher redundancy. Compared with the Pearson correlation coefficient, the advantage of mutual information lies in its ability to capture nonlinear dependency relationships. Mutual information is computed for all indicator pairs, yielding an m × m mutual information matrix M, where Mij = I(Xi;Xj), and Mii = 0, i.e., the mutual information of an indicator with itself is excluded from the redundancy calculation. For a given set of candidate combined weights w = (w1, w2, …, wm)T, the global redundancy index is defined as:
The interpretation of this index is as follows: under a given weight allocation scheme, the information overlap between each pair of indicators is weighted and summed by the product of their respective weights. If a combined weighting scheme assigns large weights to indicator pairs with extremely high mutual information, the WAMIR value will increase significantly, indicating that the scheme suffers from the structural defect of “information superposition scoring.” Conversely, if the weights are reasonably dispersed across indicators with low mutual information and relative information independence, the WAMIR value will be lower, indicating that the evaluation dimensions are more diversified and parsimonious.
2.3. Measurement and Grading of Ecological Health
After assigning corresponding weights to each indicator, the ecological health status of the region is characterized by calculating the ecological health score. Then, in order to effectively classify and analyze each sample within the region, it is necessary to grade the ecological health scores. However, due to the distinct characteristics of each analytical region, an objective grading model for ecological health status needs to be established.
To achieve objective classification of the samples, it is first necessary to quantify the ecological health status of each sample. Both the linear weighted scores and TOPSIS scores are commonly used scoring models in the field of coastal ecological analysis to characterize ecological health status.
- (1)
- Linear weighted scores
Derived from the weighted summation of standardized indicator data, this method is computationally straightforward, offers intuitive result interpretation, and is well-suited for long-term dynamic evolution analysis of bays [61].
where Si is the ecological health score of the i-th sample; Wj is the combined weight of the j-th indicator; Zij is the standardized value of the j-th indicator for the i-th sample and m is the total number of indicators.
- (2)
- TOPSIS scores
Construct positive and negative ideal solutions, and calculate the Euclidean distances from each sample to the positive and negative ideal solutions. The closer the evaluation indicators are to the positive ideal solution and the farther they are from the negative ideal solution, the better the comprehensiveness of the evaluation object. This method is predominantly used for cross-sectional horizontal comparison across multiple regions [8].
Construct the weighted standardized matrix:
Determine the positive and negative ideal solutions:
Calculate the Euclidean distances:
Calculate the ecological closeness degree scores:
By employing the two scoring models described above, the ecological health status of each regional sample is characterized. Furthermore, based on the derived scores, each sample can be graded accordingly, thereby achieving a comprehensive evaluation of the ecological health status for all samples.
The Rank Sum Ratio (RSR) is a statistical analysis method capable of achieving objective ranking based on empirical data. By employing the linear weighted scores or TOPSIS closeness scores as an input sequence, all sample scores are ranked in descending order, and the RSR is subsequently calculated, thereby avoiding subjective bias that may arise from artificial classification grading [14,62]. The specific procedures are as follows:
- (1)
- The weighted rank sum ratio (WRSR) is calculated for each evaluation object:
- (2)
- The objects are sorted in ascending order of WRSR. The cumulative frequency is calculated as:
For the last group, the cumulative frequency is adjusted as Pn = 1 − 1/(4n).
- (3)
- The cumulative frequency is transformed into the Probit value:
- (4)
- A linear regression is established with Probit Z as the independent variable and the comprehensive score S as the dependent variable:
- (5)
- The theoretical quantiles q = {0.2, 0.4, 0.6, 0.8} are used to derive the score cutoffs:
The four cutoffs divide the objects into five grades: Poor, Relatively Poor, Medium, Good, and Excellent. Model performance is assessed using R2, adjusted R2, leave-one-out Q2, the F-statistic, and the parameter-to-sample ratio. The grading thresholds presented in Table 2 below.
Table 2.
Five-level grading rules based on theoretical quantiles.
The final evaluation grade of each sample is determined according to the interval into which its fitted RSR value falls.
2.4. Two-Step fsQCA Configurational Analysis
After achieving a quantitative characterization of regional ecological health status, an appropriate method is required to explore the configurational paths driving ecological health. When exploring the combined effects of different ecological indicators on reclamation ecological health, fuzzy-set Qualitative Comparative Analysis (fsQCA) [51] appears to be a sufficient method, as it is capable of detecting combinatorial causality between conditions and outcomes. However, the conventional one-step fsQCA often faces the dilemma of “too many variables, too few cases” in reclamation ecological health research, which may lead to overly complex results and limited diversity, while also failing to fully account for the interrelationships among indicators.
To address the above issues, this research employs the two-step fsQCA method proposed by Schneider and Wagemann (2006) [51], selecting key indicators as condition variables and using the calculated ecological health scores as the outcome variable for configurational analysis. The screening of condition variables is primarily based on two considerations. The first is causal relevance: priority is given to indicators that are strongly correlated with ecological health and whose associations are supported by existing research, thereby avoiding weakly correlated or redundant indicators that consume limited degrees of freedom. The second is representativeness and dimensional coverage: at least one representative indicator is retained under each criterion layer, so that the retained conditions collectively capture the causal chain structure of the PSR/DPSIR framework rather than being concentrated within a single dimension.
Once the condition variables have been determined, they are further divided into remote and proximate conditions according to two criteria. Specifically, remote conditions are slowly changing structural factors located upstream in the causal chain, with slower ecological responses; by contrast, proximate conditions are more rapidly changing variables located downstream and more directly related to the outcome [63]. Within the selected framework, indicators at the driving force (D), pressure (P), and state (S) levels are regarded as remote conditions, whereas indicators at the impact (I) and response (R) levels are regarded as proximate conditions.
In terms of operational procedures, the direct calibration method is first applied for variable calibration: the 5th, 50th, and 95th percentiles of the sample distribution for each condition variable are set as the thresholds for full non-membership, the crossover point, and full membership, respectively, transforming the standardized indicator data into fuzzy membership scores within the [0, 1] interval. Subsequently, to examine whether each condition variable constitutes a necessary condition for the outcome, a necessity analysis is conducted on the calibrated condition variables, where a consistency level exceeding 0.9 indicates that the condition variable is a necessary condition for the outcome. Finally, a two-step fsQCA is employed for sufficiency analysis [64,65,66]:
In the first step, remote conditions are used as antecedent conditions and the ecological health scores as the outcome, with the consistency threshold set at 0.6. Because the number of cases is small, a relatively lenient threshold is adopted so as to retain sufficient structural contexts. Only the parsimonious solutions are carried forward, yielding compact, structural configurations that reduce the number of logical combinations entering the second step.
In the second step, each remote configuration identified in the first step is operationalized as a fixed context condition (CTX). For a single remote condition, CTX is its calibrated membership score; for a conjunction of remote conditions, CTX is the minimum of their calibrated membership scores. CTX is then included together with all proximate conditions as antecedent conditions in a second-step fsQCA applied to the full set of cases, with a stricter consistency threshold of 0.8 and a PRI threshold of 0.6, as the larger set of conditions warrants more conservative criteria. In the truth table, all rows in which CTX = 0 are treated as logical remainders and excluded from the minimization, so that the direction of the remote configuration identified in the first step remains fixed. In this step, we focus exclusively on the complex solutions generated by the output, so as to reduce the complexity of causal combinations and thereby produce a highly consistent solution set.
To assess the robustness of the configurational results, the raw consistency threshold and the PRI threshold are raised in the robustness check, and the resulting solutions are compared with the baseline solutions. It should be noted that all antecedent and outcome conditions included in this research have undergone positive standardization during the indicator normalization stage described in Section 2.1. That is, a higher fuzzy-set membership score corresponds to stronger ecological friendliness of the indicator and a more significant positive effect on ecosystem health; conversely, its negation (~X, low membership) represents elevated ecological pressure and deteriorated health status. The specific type (+, −, or N) of each indicator is detailed in Table 3 and Table 4.
Table 3.
Indicator system for ecosystem health assessment in LZB.
Table 4.
Indicator system for ecosystem health assessment in Zhejiang.
3. Materials
3.1. Laizhou Bay
Laizhou Bay (36°25′–37°45′ N, 118°17′–120°45′ E) is located in the southern Bohai Sea and the northern Shandong Peninsula, China, as shown in Figure 2. More than ten rivers, including the Yellow River, discharge into the bay. Pollution accumulated from long-term economic activities in this region has led to water quality degradation, eutrophication, habitat destruction, and a decline in marine ecosystem services, imposing rigid constraints on the sustainable development of the coastal areas around Laizhou Bay. To analyze the evolutionary trend of ecological health over the past four decades and to identify configurational pathways under long-term dynamic conditions, this research collected time-series data for Laizhou Bay from 1980 to 2019, comprising nine annual samples for 1980, 1985, 1990, 1995, 2000, 2005, 2010, 2015, and 2019. The data were mainly obtained with reference to Wu et al. (2023) [1], with the original data derived from bulletins such as the China River Sediment Bulletin and yearbooks such as the China Statistical Yearbook on Environment.
Figure 2.
Laizhou Bay map (left); Zhejiang Province (right).
Regarding indicator selection, given the relatively abundant monitoring information available for the Laizhou Bay case, this case adopted the Driver–Pressure–State–Impact–Response (DPSIR) framework, comprising five criterion layers and 40 indicators, to characterize the causal chain from socio-economic drivers to ecological responses. The specific indicators are presented in Table 3. On the basis of the core conceptual indicators for Laizhou Bay listed in Table 1, and in light of the high intensity of economic activities and numerous inflowing rivers in Laizhou Bay, additional indicators were incorporated, including economic driver indicators (D1–D8), river-input-related indicators (P8, P9, P11), and impact indicators (I1–I4), thereby strengthening the mapping relationship between the indicator system and the actual ecological assessment of Laizhou Bay.
3.2. Coastal Reclamation Zones in Zhejiang Province
The second case group comprises 14 functional reclamation zones located in Zhejiang Province, China, as shown in Figure 2. Since the 1950s, large-scale reclamation in Zhejiang Province has significantly altered shoreline and hydrodynamic conditions. While supporting economic development, it has also led to coastal wetland shrinkage, biodiversity decline, and water eutrophication [2]. These 14 functional reclamation zones differ considerably in reclamation intensity, ecological baseline, and management regimes. This heterogeneity provides an ideal setting for identifying differentiated ecological restoration pathways using cross-sectional data. This research collected data for the 14 reclamation zones. The data were mainly obtained from secondary sources related to Zhejiang Province, including statistical yearbooks, environmental monitoring reports, and basic research data provided by the Zhejiang Institute of Surveying and Mapping Science and Technology.
Regarding indicator selection, given the considerable differences in geographical endowments among the zones and the limited number of common ecological indicators, this case adopted the Pressure–State–Response (PSR) framework, comprising three criterion layers and 14 indicators, as detailed in Table 4. Based on the core conceptual indicators for reclamation listed in Table 1, and in view of the prominent anthropogenic development and governance response factors in these zones, three additional indicators were incorporated: the proportion of urban construction land formed by reclamation (S1), landscape satisfaction (S6), and popular science education intensity (R4). This enhanced the capacity of the indicator system to characterize the actual ecological conditions of the reclamation zones.
4. Results
In this section, to further demonstrate the effectiveness of the proposed small-sample path analysis method for ecological health in reclamation areas, two distinct scenarios are selected for case analysis. In Section 4.1, based on long-term panel data of Laizhou Bay, a path analysis of the ecological health of the bay’s ecosystem is conducted over its evolutionary process from 1980 to 2019. In Section 4.2, cross-sectional data from 14 reclamation zones in Zhejiang Province are adopted to complete the path analysis of ecological health for different development blocks.
4.1. Case 1: Long-Term Sample of Laizhou Bay
The Laizhou Bay case was measured based on long-term time-series data from 1980 to 2019. The indicator framework was constructed based on the DPSIR (Driving–Pressure–State–Impact–Response) framework, encompassing 40 indicators across five criterion layers. A total of nine yearly samples, 1980, 1985, 1990, 1995, 2000, 2005, 2010, 2015, and 2019 were included.
After the indicator standardization was completed, the WAMIR (Weighted Average of Mutual Information Redundancy) index was employed to quantitatively select among the three combination weighting schemes. Based on the standardized data of the 40 indicators for Laizhou Bay, the WAMIR values corresponding to the weights derived from the information entropy-adaptive weighted combination weighting method, the minimum information discrimination combination weighting method, and the game theory combination weighting method were calculated, yielding values of 0.401, 0.402, and 0.405, respectively. Among these, the information entropy-adaptive fusion weights achieved the lowest WAMIR value, indicating that this scheme can effectively reduce information redundancy among indicators and avoid duplicate information scoring under the Laizhou Bay indicator framework. Consequently, it was selected as the weighting scheme for this case. The linear weighted summation model was adopted for the ecological health score calculation, so as to preserve the additivity of indicator contributions and ensure temporal comparability.
To examine the influence of the above indicator selection on evaluation results, this research conducts sensitivity analysis from three aspects: core indicator subset, dimension removal, and random indicator deletion. The results are shown in Table 5.
Table 5.
Experimental Results Table of Indicator Sensitivity Analysis of Case 1.
The results indicate that the core indicator subset has good consistency with the full-indicator ranking, and retaining only the core conceptual indicators can still reflect the overall evaluation results. Among the dimensions, pressure is the core constraint on ecological health in Laizhou Bay. After removing this dimension, the ranking changes significantly, which is consistent with the actual characteristics of the region being affected by long-term human activities. After random indicator deletion, the ranking is generally robust, and changes in score distribution are within an acceptable range. In summary, the core conceptual indicators of the Laizhou Bay case have good representativeness, the identification of key dimensions conforms to ecological logic, and the evaluation results are generally robust to indicator perturbation.
Based on the standardized indicator data, the information entropy-adaptive weighted combination weighting method was adopted to derive the indicator weights. Figure 3 illustrates the distribution of weights across the criterion layers under this weighting scheme. Under this weighting scheme, the pressure subsystem accounted for 35.5% of the total weight, ranking the highest among all dimensions. Moreover, pressure-layer indicators such as reclamation area and the amount of agricultural chemical fertilizer entering the sea exhibited particularly prominent weights, indicating that pressures originating from both land and the bay were the primary drivers of ecological degradation in Laizhou Bay.
Figure 3.
Weight distribution for Laizhou Bay.
Figure 4 presents the evolution curve of the linear weighted ecological health scores for Laizhou Bay from 1980 to 2019, derived from the information entropy-adaptive fusion weights. Over the period from 1980 to 2019, the linear weighted ecological health scores exhibited a phased characteristic, with an initial trend of fluctuating deterioration followed by a continuous recovery.
Figure 4.
Linear weighted score curve for Laizhou Bay.
Furthermore, the RSR (Rank Sum Ratio) model was employed to perform a five-level objective classification for each sample, transforming the obtained scores into standardized grade determination results. With RSR as the dependent variable and Probit as the independent variable, a linear regression was fitted, and the regression equation is presented as follows:
The R2 is 0.960, the adjusted R2 is 0.954, and the F-statistic is 167.18 (p < 0.05), indicating a relatively strong linear relationship between the composite score and Probit in the RSR–Probit anchoring. The leave-one-out cross-validation Q2 is 0.917, indicating that the regression relationship is insensitive to the removal of a single sample and can provide support for the grading results. The five-level score cutoffs are 0.4318, 0.4800, 0.5215, and 0.5697, and the resulting grades are presented in Table 6.
Table 6.
RSR comprehensive ranking table by year.
The ecological health status, characterized by the linear weighted scores, was adopted as the outcome variable, and the configurational analysis was conducted following the two-step fsQCA procedure described in Section 2.4. Following the method described in Section 2.4, five remote conditions and four proximate conditions were screened from the original forty indicators for Laizhou Bay. The five remote conditions were: GDP per capita (D2), the amount of agricultural chemical fertilizer entering the sea (P4), the reclamation area (P13), the natural wetland area (S1), and dissolved inorganic nitrogen (S10). The four proximate conditions were: the proportion of sea area below Class I sea water quality standard (I3), the centralized treatment rate of sewage treatment plants (R1), the retention rate of natural coastline (R3), and the proportion of marine protected areas (R4).
After completing the calibration procedure described in Section 2.4, a necessity test was performed. The results of the single-condition necessity test are presented in Table 7, which show that only natural wetland area (S1) achieved a consistency score of 0.9043, slightly exceeding the threshold of 0.9, while the consistency scores of all other antecedent conditions fell below 0.9. This result indicates that an adequate scale of natural wetlands is a necessary condition for maintaining the ecosystem health of Laizhou Bay. However, it cannot be concluded that other conditions with lower consistency scores are causally irrelevant, as they may still function as INUS conditions (i.e., an insufficient but necessary part of a condition that is itself unnecessary but sufficient for the outcome) and jointly induce the outcome in combination with other conditions. Against this backdrop, all selected antecedent conditions were incorporated into the configurational analysis.
Table 7.
Analysis of Necessary Conditions in LZB.
The parsimonious solution derived from the first-step fsQCA is presented in Table 8. With the five remote conditions as the antecedent factors, the configurational analysis yielded one remote configuration: the amount of agricultural chemical fertilizer entering the sea (P4), with a consistency of 0.9087, covering 83.99% of the cases with high ecological health scores. This configuration indicates that a low agricultural fertilizer input into the sea (where P4 denotes low fertilizer input into the sea; since P4 is a negative indicator and was positively standardized, a high P4 score represents the ecologically favorable state; see Table 3) serves as the core prerequisite for sustaining the ecosystem health of Laizhou Bay.
Table 8.
Configurations of remote conditions in LZB.
The complex solution derived from the second-step fsQCA is presented in Table 9. The analysis shows that when the low agricultural chemical fertilizer input into the sea (P4) was combined with all proximate conditions, a total of two configurational paths were identified. The overall consistency of the solution was 0.9817, and the overall coverage reached 0.5956, indicating that these two configurations exhibit good explanatory power for the ecological health samples of Laizhou Bay. The analysis reveals that the synergy among three factors—low agricultural fertilizer input into the sea, effective governance of coastal water quality (where I3 denotes good water quality; since I3 is a negative indicator and was positively standardized, a high I3 score represents the ecologically favorable state; see Table 3), and the development and improvement of marine protected areas—constitutes the core configurational architecture driving the ecological health of Laizhou Bay. The differences between the two paths are primarily reflected in the supplementary peripheral conditions. Based on these differences, the two paths can be further summarized into two governance models:
Table 9.
Configurations for High ecological benefits in LZB.
Artificial engineering-dominated ecological health path: For areas with a high degree of coastal development, limited natural habitat endowment, but relatively well-established municipal pollution treatment infrastructure, a high sewage treatment rate (R1) is the key to achieving ecological health. By enhancing the centralized treatment capacity of urban sewage, land-based pollution can be further reduced, which, in combination with source control of agricultural fertilizer inputs into the sea, enables comprehensive control of land-based pollution.
Natural conservation-dominated ecological maintenance path: For areas with low coastal development intensity and well-preserved shoreline resources, a high natural coastline retention rate (R3) is the key to achieving ecological health. Intact natural coastlines encompass natural purification units such as intertidal zones and coastal wetlands, which can attenuate pollutants entering the sea through natural processes including vegetation interception and microbial degradation. Moreover, marine protected areas can function in synergy with natural coastlines to establish an integrated ecological conservation space, further enhancing the self-regulating capacity of the ecosystem and achieving ecological restoration at relatively low governance costs.
To assess the robustness of the configurational results under small-sample conditions, three checks were conducted. First, the raw consistency threshold was raised from 0.8 to 0.85 and the PRI threshold from 0.6 to 0.65; the recalculated results remained largely consistent with the baseline. Second, the calibration anchors were shifted from the 5th, 50th, and 95th percentiles to the 10th, 50th, and 90th percentiles, and the core configurations remained essentially unchanged. Third, a leave-one-out test was performed. Each of the nine annual observations was removed in turn, the full two-step procedure was re-run on the remaining eight cases, and the resulting configurations were compared with the baseline. The core configuration remained largely stable across the nine runs, indicating that the identified pathways are not dominated by any single observation. In this case, based on the long-term time-series data of Laizhou Bay from 1980 to 2019, the proposed method successfully identified a combination weighting scheme with minimal information redundancy and distinguished two governance paths—namely, the engineering-dominated path and the conservation-oriented path. These results demonstrate that the small-sample path analysis method for ecological health in reclamation areas based on the two-step fsQCA, as constructed in this research, is effective in long-term evolutionary scenarios and can provide configurational evidence to inform differentiated policymaking.
4.2. Case 2: Cross-Sectional Sample of Reclamation Zones in Zhejiang Province
For the Zhejiang Province case, 14 functional reclamation zones within the province were selected for measurement. The relevant data and information were mainly obtained from secondary data sources pertaining to Zhejiang Province. The indicator framework was constructed based on the PSR (Pressure–State–Response) framework, encompassing 14 indicators across three criterion layers, with a total of 14 regional samples coded as P001–P014. After the indicator standardization was completed, the WAMIR index was employed to quantitatively select among the three combination weighting schemes. Based on the standardized data of the 14 indicators for Zhejiang Province, the WAMIR values corresponding to the weights derived from the information entropy-adaptive weighted combination weighting method, the minimum information discrimination combination weighting method, and the game theory combination weighting method were calculated, yielding values of 0.264, 0.263, and 0.265, respectively. Among these, the minimum information discrimination combination weighting method achieved the lowest WAMIR value, indicating that this scheme can effectively reduce information redundancy among indicators and avoid duplicate information scoring under the Zhejiang Province indicator framework. Consequently, it was selected as the weighting scheme for this case. The TOPSIS (Technique for Order Preference by Similarity to Ideal Solution) model was adopted for the ecological health score calculation, so as to enhance the discriminatory power for cross-sectional comparisons across multiple zones.
To examine the influence of the above indicator selection on evaluation results, this research likewise conducts sensitivity analysis from three aspects: core indicator subset, dimension removal, and random indicator deletion. The results are shown in Table 10.
Table 10.
Experimental Results Table of Indicator Sensitivity Analysis of Case 2.
The results indicate that the core indicator subset is highly consistent with the full-indicator ranking, and the core conceptual indicators can represent the full indicator system. The state dimension is the core dimension of ecological health in Zhejiang reclamation areas. After removing this dimension, the ranking changes significantly, which is consistent with the objective condition that the geographical endowments of different reclamation sample zones differ. After random indicator deletion, the ranking is generally robust, and the score distribution pattern remains stable. In summary, the core indicator subset of the Zhejiang case is highly representative of the full indicators, the identification of key dimensions conforms to ecological logic, and the evaluation results are generally robust to indicator perturbation.
Based on the standardized indicator data, the minimum information discrimination combination weighting method was adopted to derive the indicator weights. Figure 5 illustrates the distribution of weights across the criterion layers under this weighting scheme. Under this weighting scheme, the state subsystem accounted for 57.3% of the total weight, ranking the highest among all dimensions. Moreover, state-layer indicators such as the habitat quality coefficient and the proportion of ecological space exhibited particularly prominent weights, indicating that the ecological baseline conditions serve as the core priority for ecological restoration projects in reclamation zones of Zhejiang Province.
Figure 5.
Weight distribution for Zhejiang Province.
Figure 6 presents the TOPSIS scores of ecological health for the Zhejiang Province reclamation zones P001–P014, derived from the minimum information discrimination combination weights. The results show considerable variation in the ecological health status across the different zones.
Figure 6.
TOPSIS score curve for Zhejiang.
Furthermore, the RSR model was employed to perform a five-level objective classification, transforming the TOPSIS scores into standardized grade determination results. With RSR as the dependent variable and Probit as the independent variable, a linear regression was fitted, and the regression equation is presented as follows:
The R2 is 0.848, the adjusted R2 is 0.836, and the F-statistic is 67.16 (p < 0.05), indicating good model fit and a significant linear relationship between Probit and the composite score. The leave-one-out cross-validation Q2 is 0.791, which is 0.057 lower than the fitted R2. The five-level score cutoffs are 0.4467, 0.5137, 0.5715, and 0.6385, and the resulting grades are presented in Table 11.
Table 11.
Comprehensive rank analysis table of RSR for 14 evaluation projects.
The ecological health status, characterized by the TOPSIS scores, was adopted as the outcome variable, and the configurational analysis was conducted following the two-step fsQCA procedure described in Section 2.4. Following the method described in Section 2.4, five remote conditions and three proximate conditions were screened and divided from the original fourteen indicators for Zhejiang Province. The five remote conditions were: the reclamation area (P1), the ecological damage intensity per unit area (P3), the proportion of ecological space (S2), the marine biological resource stock (S3), and the habitat quality coefficient (S4). The three proximate conditions were: the fund investment execution rate (R1), the ecological restoration completion rate (R2), and the proportion of marine protected areas (R3).
After completing the calibration procedure described in Section 2.4, a necessity test was performed. The results of the single-condition necessity test are presented in Table 12, which show that the consistency scores of all condition variables in this case fell below 0.9, indicating that none of them constitute necessary conditions for the occurrence of the outcome. Therefore, no condition variables were excluded from the subsequent sufficiency analysis.
Table 12.
Analysis of Necessary Conditions in Zhejiang.
The parsimonious solution derived from the first-step fsQCA is presented in Table 13. With the five remote conditions as the antecedent factors, the configurational analysis yielded one remote configuration: high reclamation intensity * high habitat quality (~P1*S4) (where ~P1 denotes high reclamation intensity; since P1 is a negative indicator and was positively standardized, ~P1 represents the ecologically unfavorable state; see Table 4) with high ecological health scores. This configuration indicates that, for the reclamation zones in Zhejiang Province, even when the scale of reclamation development is relatively large, maintaining a sound habitat quality baseline in the marine area can still constitute the underlying foundational architecture supporting regional ecological health.
Table 13.
Configurations of remote conditions in Zhejiang.
The complex solution derived from the second-step fsQCA is presented in Table 14. In this step, the remote configuration ~P1*S4 identified in the first step was operationalized as a fixed context condition (CTX = min(~P1, S4)), and all rows with CTX = 0 were excluded from the truth table. CTX was then analyzed together with all proximate conditions across the full set of fourteen regional cases. A total of three configurational paths were identified. The overall consistency of the solution was 0.9595, and the overall coverage reached 0.6207, indicating that these three configurations exhibit good explanatory power for the ecological health samples of Zhejiang Province.
Table 14.
Configurations for High ecological benefits in Zhejiang.
The results show that, under the fixed context of high reclamation development intensity combined with high habitat quality (~P1*S4), ecological health can be achieved through three distinct pathways. Solution S1 consists of a high fund investment execution rate (R1) alone, with a raw coverage of 0.5563, indicating that well-executed restoration funding is sufficient to maintain ecological health in areas with a sound habitat baseline and relatively high historical reclamation intensity (~P1). Solution S2 combines a high ecological restoration completion rate (R2) with a low proportion of marine protected areas (~R3), with a raw coverage of 0.2874. Solution S3 combines a low ecological restoration completion rate (~R2) with a high proportion of marine protected areas (R3), with a raw coverage of 0.2832. Solutions S2 and S3 reveal an equivalent substitution relationship between engineering restoration measures and spatial protection measures: within the same context, ecological health can be achieved either by prioritizing ecological restoration projects or by prioritizing the establishment of marine protected areas. Based on these differences, the three paths can be further summarized into two differentiated ecological governance models:
Fund-led light-weighted governance path: A high fund investment execution rate (R1) is the core condition for achieving ecological health. A sound marine habitat baseline can effectively buffer the ecological disturbances caused by reclamation activities. On this basis, relying on well-implemented special restoration funds to carry out light-weighted governance projects—such as localized shoreline restoration, small-scale ecological compensation, and biological stock enhancement—can lead to positive ecological health outcomes. This path entails controllable governance costs and moderate implementation difficulty.
Restoration-protection equivalent governance path: Ecological health can be achieved through two equivalent sub-paths (Solutions S2 and S3). In sub-path S2, a high ecological restoration completion rate (R2) combined with a low proportion of marine protected areas (~R3) is sufficient; this indicates that engineering restoration measures alone can effectively remedy habitat loss. In sub-path S3, a low ecological restoration completion rate (~R2) combined with a high proportion of marine protected areas (R3) is sufficient; this indicates that spatial protection measures alone can achieve the same outcome. These two sub-paths demonstrate that engineering restoration and spatial protection are functionally equivalent under this context. Therefore, in such areas, relying solely on fund investment may be insufficient to repair habitat damage; it is necessary to either implement large-scale ecological restoration projects or establish extensive marine protected areas to effectively remedy the ecological losses caused by historical reclamation activities.
To assess the robustness of the configurational results under small-sample conditions, three checks were conducted. First, the raw consistency threshold was raised from 0.8 to 0.85 and the PRI threshold from 0.6 to 0.65; the recalculated results remained largely consistent with the baseline. Second, the calibration anchors were shifted from the 5th, 50th, and 95th percentiles to the 10th, 50th, and 90th percentiles, and the core configurations remained essentially unchanged. Third, a leave-one-out test was performed. Each of the 14 zones was removed in turn, the full two-step procedure was re-run on the remaining 13 zones, and the resulting configurations were compared with the baseline. The core configuration remained largely stable across the 14 runs, indicating that the identified pathways are not dominated by any single observation. In this case, based on the 14 reclamation zones in Zhejiang Province, the proposed method successfully identified a combination weighting scheme with minimal information redundancy and distinguished two governance paths—namely, the fund-led light-weighted governance path and the restoration-protection equivalent governance path. These results demonstrate that the small-sample path analysis method for ecological health in reclamation areas based on the two-step fsQCA, as constructed in this research, is effective in multi-zone cross-sectional scenarios and can provide configurational evidence to inform differentiated policymaking.
5. Discussion
5.1. Main Findings
This research conducted a case analysis on nine time series samples from Laizhou Bay in China and 14 cross-sectional samples from functional restoration areas in Zhejiang Province. It explores how the proposed method realizes ecological health assessment and the construction of ecological restoration pathways and strategies under small-sample reclamation scenarios. The research reached the following conclusions:
- (1)
- In assessing the ecological health status of coastal areas, MCDA is a commonly used methodological framework, but traditional MCDA frameworks often rely on subjective experience or convenience when selecting combined weighting schemes. For instance, Li et al. [18] directly adopted an equal-weight fusion method, combining the Analytic Hierarchy Process (AHP) and the Entropy Weight (EW) method to assess ecosystem health in Sanna Bay. Chen et al. [10] directly applied entropy weights to the weighted normalized matrix of TOPSIS. M. Ji et al. [53] and H. Gong et al. [30] employed an information-entropy-adaptive weighted combination weighting method and a game-theory-based combination weighting method, respectively, in their ecological case assessments. However, these research typically adopt only one combined weighting model, without systematically comparing multiple schemes according to case-specific characteristics or explicitly addressing information redundancy among indicators. When information overlap among indicators is strong, inappropriate weighting may distort health scores and make them unstable. To this end, this research proposes a mutual-information-based WAMIR index for screening indicator weighting schemes, thereby addressing this gap in the existing literature.
To test the effectiveness of WAMIR, this research conducts a random indicator-deletion perturbation experiment: indicators are randomly deleted at proportions of 10%, 20%, and 30%, with 1000 repetitions; the Spearman rank correlation coefficients of the score rankings before and after perturbation are then calculated and averaged. The results are reported in Table 15. The results show that the scheme selected by WAMIR (marked with an asterisk in the table) achieves the highest rank correlation levels in both the Laizhou Bay and Zhejiang cases, indicating strong robustness to perturbations in the indicator set. This helps reduce the risk of score instability caused by omissions, substitutions, and subjective trade-offs during indicator screening. Its theoretical significance lies in providing a robust outcome variable for configurational analysis, thereby ensuring the reliability of subsequent causal diagnosis.
Table 15.
Stability Analysis Table of Combined Weighting Scheme (Spearman Mean).
- (2)
- In the process of strategy analysis, fsQCA is an advanced method that can effectively analyze the configurational causal relationships between condition variables and assessment outcomes. Previous configurational research on coastal zones have mostly adopted one-step fsQCA. For example, Wang and Gong [31] used one-step fsQCA to examine the formation mechanism of collaborative environmental governance relationships in coastal zones, and Gong [30] applied one-step fsQCA to identify the driving pathways of bay environmental governance performance. However, when applied to small-sample scenarios, one-step fsQCA may generate a large number of logical remainders, making the results difficult to interpret. In addition, one-step fsQCA places all conditions at the same analytical level and can only answer “which conditions co-occur,” without distinguishing whether a condition is a structural constraint of the regional background or an adjustable governance response measure. The large number of logical remainders and lengthy pathways are manifestations of this flat hierarchy. To address the above issues, this research introduces two-step fsQCA.
The fundamental difference between the two-step and one-step methods lies in whether a causal hierarchy among condition variables is introduced. To demonstrate the effectiveness of two-step fsQCA, this research conducted a comparative experiment: all condition variables from the two cases in Section 4 were placed at the same level, and one-step fsQCA was re-run under the same thresholds (consistency 0.8, PRI 0.6), with its complex solution examined. The results showed that Laizhou Bay and Zhejiang produced 3 and 6 configurations, respectively. In terms of result form, the number of configurations was large and highly similar; each configuration covered almost all conditions; and all antecedent conditions were placed at a single analytical level, making the results lengthy and difficult to distill into specific governance pathways. In contrast, two-step fsQCA reduced the two cases to 2 and 3 configurations, respectively, and presented distal structural contexts and proximal regulatory conditions separately, markedly improving interpretability. Notably, although the number of configurations was substantially reduced, the solution coverage of the two-step results remained comparable to that of the one-step results, indicating that the two-step method can effectively enhance the parsimony and interpretability of the results with almost no loss of explanatory power, as summarized in Table 16.
Table 16.
Comparison of fsQCA solution indicators for one-step and two-step approaches.
Moreover, the theoretical contribution of the two-step method lies more in first identifying remote structural contexts and then identifying proximate governance responses under these contexts, so that each proximate pathway corresponds to a specific remote context. Table 17 lists representative complex-solution configurations from the one-step fsQCA, selected as the configuration with the highest raw coverage in each case: ~D2*P4*P13*S1*I3*~R1*R3*R4 for Laizhou Bay (raw coverage 0.4903) and ~P1*P3*~S2*S3*S4*R1*R3 for Zhejiang (raw coverage 0.2984). From the configuration content, the one-step method outputs an aggregated form of condition combinations without distinguishing the causal positions of conditions, and can only explain how ecological health governance is achieved through condition combinations. In contrast, the causal hierarchy of the two-step method is reflected as follows: for Laizhou Bay, two proximate pathways, I3*R1*R4 and I3*R3*R4, are obtained under the P4 context; for Zhejiang, three proximate pathways, R1, R2*~R3, and ~R2*R3, are obtained under the ~P1*S4 context. These two sets of results jointly indicate that the sufficiency of proximate governance responses is conditional on the remote context, which is manifested in two aspects. One aspect is that different proximate responses under the same remote context can separately constitute sufficient pathways: under the P4 context in Laizhou Bay, R1 and R3 appear in I3*R1*R4 and I3*R3*R4, respectively; under the ~P1*S4 context in Zhejiang, R2 and R3 appear in R2*~R3 and ~R2*R3, respectively. Another aspect is that proximate response conditions with similar meanings or ecological functions are combined differently under different remote contexts. For example, the proportion of marine nature/special reserves (marine parks) (R4) in Laizhou Bay needs to combine with the proportion of sea area below Class I sea water quality standard (I3) and either the centralized treatment rate of sewage treatment plant (R1) or the retention rate of natural coastline (R3) to constitute a pathway, whereas in Zhejiang, the proportion of marine protected areas (R3), which has a similar meaning, shows an equivalent substitution relationship with the ecological restoration completion rate (R2) (R2*~R3 and ~R2*R3). Therefore, the configuration results of the two-step method are clearer in causal structure, retaining the hierarchical relationship between remote contexts and proximate responses in the configurations, and can thus be used to determine the governance responses and priorities for regions with different structural backgrounds, realizing a clearer structural chain of “how a region achieves ecological health under what structural background.”
Table 17.
Representative configurations from one-step and two-step fsQCA.
By comparing the two approaches, it becomes evident that the value of the two-step method is neither limited to producing fewer configurations nor merely to identifying specific pathways; rather, its fundamental contribution lies in deeply revealing the causal hierarchy between distal structural contexts and proximate governance responses. In other words, the effectiveness of this approach is demonstrated not only by quantitative changes in the results, but also by its superior explanatory power regarding the underlying mechanisms. Specifically, this hierarchical analysis advances our understanding of ecological health pathways in coastal reclamation areas from three theoretical perspectives:
First, at the level of conditional constraints, it reveals that proximate governance responses are strictly bounded by distal structural contexts. Traditional net-effect analyses often assume that specific governance measures are universally effective. However, our two-step results demonstrate that the sufficiency of proximate responses is strictly conditional upon the remote structural background. This shifts the theoretical focus from “identifying universally effective measures” to “determining under what structural preconditions a specific measure becomes sufficient.” It provides a preconditional cognition for reclamation governance that both curbing new structural pressures and mitigating historical cumulative pressures are essential to ensure the effectiveness of subsequent restoration interventions.
Second, at the level of pathway selection, it clarifies that equifinality in reclamation ecosystems is context-dependent. The equivalent substitution relationship among governance measures is not an unconditional law; rather, it is inherently bounded by the remote structural context. This deepens our understanding of the “equifinality” mechanism in reclamation ecology, indicating that no absolute “panacea” exists for coastal restoration; instead, specific engineering or spatial protection measures must be precisely matched to the regional ecological baseline.
Third, at the level of systemic coordination, it establishes a “hierarchical matching” logic for ecological restoration. Since ecological health in reclamation areas is the result of the joint action of structural backgrounds and governance responses, achieving it requires matching actionable, proximate interventions with specific foundational structural constraints. By distinguishing the causal positions of “background constraints” and “intervention levers,” this logic constructs a systemic regulation framework from macro to micro, urging coastal management to shift from fragmented single-measure inputs to coordinated alignment. Consequently, it provides a robust theoretical foundation with greater explanatory power for understanding the formation mechanism of ecological health and formulating differentiated governance strategies in reclamation areas.
5.2. Research Insights
Based on the results of this research, the following two guidelines may be primarily used to inform the formulation of restoration measures. First, relevant authorities should act on the guidance of the Construction Plan for Major Projects of Coastal Ecological Protection and Restoration (2021–2035) concerning zoned management and the layout of key projects [67], establish a hierarchical habitat protection system based on the ecological health grading results, give priority attention to restoration units with weak ecological health and high cumulative anthropogenic stress, and include them within the ecological protection red line to safeguard the long-term stability of the ecosystem [68]. Second, relevant authorities should draw on the systematic governance framework of the “Xiamen Practice” of Xi Jinping’s ecological civilization thought [69], and, following the governance logic of source prevention and control, one bay one policy, and prioritizing natural restoration with artificial restoration as a supplement, formulate restoration strategies by combining the dominant stressor, the level of ecological resilience, and the intensity of human disturbance.
In the Laizhou Bay case, the long-term cumulative input of land-based pollution, centred on agricultural non-point source pollution, is the main factor driving the ecological evolution of the bay. Such stress originates from the loss of farmland nutrients within river basins that span administrative boundaries, so effective governance cannot be achieved by improving end-of-pipe water quality alone. A land–sea coordinated governance system is therefore needed, incorporating agricultural source-reduction measures such as the optimization of farmland water and fertilizer use and the construction of riparian buffer strips into the key control scope of regional ecological protection. On this basis, relevant authorities should pay attention to the long-term changes in the ecological health status of Laizhou Bay, adopt adaptive restoration strategies, give priority to restoring key ecological nodes, and enhance the ecosystem’s self-regulation capacity and overall resilience with minimal human intervention [70].
In the Zhejiang Province case, the differences in the ecological health status of the reclamation zones are dominated by the spatial gradients of development intensity and ecological baseline, so a hierarchical and zoned governance model is appropriate. Zones with relatively good ecological health should be managed mainly through ecological protection and natural recovery, and large-scale restoration engineering interventions should not be implemented; for zones with a degraded ecological baseline, the processes and mechanisms of natural recovery of coastal ecosystems should be fully considered, and a series of conservation and restoration measures for vulnerable and sensitive bay habitats should be implemented, including establishing marine protected areas, strengthening the supervision of important ecological function zones, stock enhancement and release, and the ecological retrofitting of hardened shorelines through ecological seawalls.
In summary, the method proposed in this research provides a reference for the zoned governance and precise restoration of complex reclamation ecosystems. In actual governance, relevant departments should clarify the regional ecological and environmental baseline conditions and core limiting factors, define targeted restoration objectives and build a long-term monitoring system, so as to achieve dynamic iterative optimization of restoration strategies, and at the same time encourage active public participation in restoration actions, thereby contributing to the sound and sustainable development of the ecology in reclamation areas.
5.3. Interpretation of Cross-Case Differences and Methodological Applicability Testing
To examine the applicability of the proposed methodological framework under different coastal reclamation scenarios, this research selects two case groups—Laizhou Bay and Zhejiang Province—with different data structures and ecological contexts for cross-case analysis, and discusses the relationship between the framework core and the context-adaptive modules.
The two cases differ in specific indicator measurement, scoring models, and configurational condition variables. However, such differences constitute operational adaptation within the same methodological framework, while the framework core remains consistent. The framework core mainly includes: the selection of core conceptual indicators and the construction of the indicator framework for coastal reclamation scenarios; the stepwise framework of assessment–grading–configurational analysis; and the two principles followed in two-step fsQCA condition selection. First, condition variables are selected using the dominant ecological pressure of the study area as the content basis; second, remote structural conditions and proximate governance conditions should be distinguished during selection. On this premise, specific indicator selection, sample organization, scoring models, and condition variable combinations can be adaptively adjusted according to the data structure and ecological context of each case.
In the specific indicator selection step, the two cases differ in data availability, management objectives, and regional ecological characteristics, which leads to differences in the number of indicators, the setting of criterion layers, and specific measurement approaches. Nevertheless, the indicator selection in both cases revolves around the core indicator concepts for coastal reclamation scenarios, so as to ensure consistency in the core dimensions and logic of assessment.
In the scoring and grading step, the scoring models of the two cases are selected according to sample structure and comparison purpose: the Laizhou Bay data constitute long-term time-series data for the same region, and the samples share a relatively consistent ecological baseline; therefore, the linear weighted scoring method is used to assess the relative ecological quality of different years, and RSR grading is performed accordingly, yielding a relatively high R2. The sub-regional samples in the Zhejiang case differ significantly in geographical endowment, reclamation intensity, and ecological baseline; therefore, the TOPSIS method is used for scoring to enhance comparability among heterogeneous sub-regions, and the R2 of its RSR grading is relatively lower. To further test the reliability of RSR grading, a leave-one-out stability analysis is conducted for both cases: each sample is sequentially removed, the model is refitted, and the samples are re-graded to examine whether the grades of the remaining samples change. The results show that the grading results of both cases are highly stable, indicating that RSR grading generally does not depend on any single sample and has good validity and stability. The stability rate of the Zhejiang case (92.86%) is higher than that of the Laizhou Bay case (87.5%), possibly because the sub-regional samples have stronger discrimination in spatial heterogeneity.
In the configurational analysis step, the condition variable combinations of the two cases are set according to the same logic, namely, centering on the dominant ecological pressure dimension of the study area and distinguishing remote structural conditions from proximate governance conditions in condition variable selection. In the Laizhou Bay case, constrained by limited natural purification capacity and cumulative land-based pollution, the condition variables in its configurational pathways are mostly related to pollution control, such as lower agricultural chemical fertilizer input into the sea (P4) and a higher sewage treatment rate (R1). The sub-regions in the Zhejiang case have a development context dominated by reclamation projects and considerable differences in geographical endowment; therefore, their configurational analysis incorporates indicators reflecting the ecological baseline of the sub-regions, such as habitat quality and reclamation intensity, and different pathway results are obtained after distinguishing different ecological baselines. The above differences indicate that the proposed methodological framework can incorporate corresponding condition variables according to regional ecological contexts and capture the spatial heterogeneity of sub-regions.
From the perspectives of grading stability and interpretability of configurational results, the methodological framework in this research can adapt to two typical scenarios: first, long-term time-series analysis of a single region, whose results focus on ecological pressures and regulatory factors evolving over time; second, spatial heterogeneity analysis of multiple sub-regions, whose results can incorporate regional ecological baselines and spatial differences into configurational interpretation. The differences among the two cases in indicator systems, scoring models, and condition variables reflect the stability of the framework’s core logic and the flexibility of its operational modules, indicating that the proposed methodological framework has certain transferability and operability under different data conditions and coastal reclamation scenarios.
The boundary conditions of the proposed framework should also be explained. Whether the proposed framework performs well mainly depends on three conditions: the indicator system must capture the dominant ecological pressure of the study area; the sample size must be sufficient to support the number of conditions included; and the ecological context must allow a meaningful distinction between remote structural conditions and proximate governance conditions. When these conditions are met, the two-step procedure is particularly useful because it can reduce the number of logical remainders. However, it should be noted that when the sample size is already sufficient for one-step fsQCA, the value of the stepwise operation in two-step fsQCA may diminish. In addition, when transferring and applying the proposed methodological framework, it is necessary to distinguish coastal scenarios from other ecosystem types. When applying the method to other bays, wetlands, and other coastal scenarios, the core indicator concepts proposed in this research for coastal reclamation scenarios can be adopted to maintain consistency in cross-regional ecological assessment. However, when extending the method to other ecosystem types, it is strongly recommended to redesign the indicator system according to the dominant ecological pressures and context of the study area, so as to more accurately capture and analyze the ecological conditions of the study area. Whether the proposed method can provide appropriate analysis for more coastal types, reclamation development intensities, and ecosystem types remains to be further verified in future research.
5.4. Limitations
Although this research has conducted a relatively systematic analysis, certain inevitable limitations remain, mainly in two respects. First, the case coverage is limited, as only two sample groups—Laizhou Bay and the coastal areas of Zhejiang Province—are selected, which may not be sufficient to cover the assessment scenarios under different coastal types and varying reclamation development intensities across China’s coastal regions. Second, this research relies mainly on cross-sectional and annual static indicators for measurement and does not incorporate long-term continuous dynamic data. Future research could integrate annual remote sensing monitoring data to construct dynamic configurational models, thereby revealing the evolutionary patterns of configurational pathways for reclamation ecological health over time.
Furthermore, constrained by data availability and case specificity, the indicators used to extract causal conditions partially overlap with those used to construct the composite ecological health score (the outcome variable). However, the following should be noted: First, both the composite outcome and the condition variables were transformed into fuzzy-set membership scores (0–1) via direct calibration before entering the fsQCA. This process severs the direct linear arithmetic linkage between the raw indicators, shifting the analytical object from an “algebraic sum of values” to a “set-theoretic subset relationship.” Second, QCA focuses on asymmetric causality; specifically, it identifies whether combinations of specific dimensional conditions, once crossing a critical threshold, are sufficient to trigger a systemic transition to high ecological health. The composite score represents the macro-level emergent state of the system, whereas the proximate conditions represent micro-level governance levers that can be directly intervened upon by policies; the two are conceptually distinct. To empirically test whether the identified pathways are sensitive to this overlap, a supplementary check was conducted: the selected proximate conditions were temporarily removed from the indicator pool, the composite score was recalculated with renormalized weights, and the two-step fsQCA was re-run while keeping the calibration of the remote conditions unchanged. The results demonstrated that the core pathways (especially the combinations of remote contexts and proximate responses) remained unchanged, with only slight fluctuations in consistency and coverage metrics. This further indicates that the identified pathways reflect genuine structural driving mechanisms rather than an artifact of index construction. If more comprehensive data become available in the future, it is recommended to achieve a fully independent treatment by replacing overlapping indicators with relative measures (e.g., ratios), integrating exogenous data, or selecting alternative representative indicators from the same dimension.
6. Conclusions
This research couples MCDA with two-step fsQCA to develop a method for identifying restoration priorities and analysing restoration strategies in reclamation areas, providing scientific support for the differentiated management and ecologically sustainable governance of different reclamation zones under small-sample conditions. This method advances restoration practice in reclamation areas by shifting the focus from a single ecological health score towards the identification of configurational pathways and the formulation of differentiated restoration strategies across different ecological backgrounds. The results show that the selection of a combined weighting scheme should be determined according to case characteristics, and that the WAMIR index can objectively select a weighting scheme on this basis, providing a stable and reliable variable for the subsequent configurational analysis. In terms of identifying the driving mechanism, the two-step fsQCA effectively reduces logical remainders under small-sample conditions and yields clearer and more interpretable configurations than the one-step fsQCA. On the basis of this method, the two cases exhibit different restoration orientations: the restoration pathway in Laizhou Bay is dominated by pollution control, whereas Zhejiang shows stronger spatial differentiation, which is the joint result of factors such as the regional ecological baseline, human activity intensity, and management conditions. The restoration priority results indicate that Laizhou Bay should first address the periods with the heaviest accumulation of long-term human activity, whereas the priority zones in Zhejiang are those with high development intensity and a weak ecological baseline. Overall, this research shows that restoration planning in reclamation areas needs to consider the robustness of the assessment results and the differences in the causes of degradation across zones, providing a scientific basis for ecologically resilient adaptive management and the delineation of differentiated restoration priorities in reclamation areas.
Author Contributions
Conceptualization, C.Z., X.W. and Y.L.; methodology, J.L. and H.L.; software, J.L. and H.L.; validation, J.L. and H.L.; formal analysis, J.L. and H.L.; investigation, C.Z., X.W. and Y.L.; resources, J.X. and P.H.; data curation, J.L. and H.L.; writing—original draft preparation, J.L. and H.L.; writing—review and editing, J.L. and H.L.; visualization, J.L. and H.L.; supervision, J.X. and P.H.; project administration, C.Z., X.W. and Y.L.; funding acquisition, C.Z., X.W. and Y.L. All authors have read and agreed to the published version of the manuscript.
Funding
This research was funded by Key Laboratory of Ocean Space Resource Management Technology, MNR (KF-2023-112).
Institutional Review Board Statement
Not applicable.
Informed Consent Statement
Not applicable.
Data Availability Statement
Part of the original data presented in the research are openly available at https://www.frontiersin.org/articles/10.3389/fmars.2023.1115896/full#supplementary-material (accessed on 11 July 2026). Restrictions apply to another part of the datasets presented in this research. The restricted basic research data obtained from Zhejiang Institute of Surveying and Mapping is not publicly available due to institutional confidentiality limitations. These restricted datasets in this research are available on reasonable request from the corresponding author.
Acknowledgments
We express our gratitude to Zhejiang Institute of Surveying and Mapping for providing the basic research data. We express our gratitude to Key Laboratory of Ocean Space Resource Management Technology and Marine Academy of Zhejiang Province for great help. We also thank Wu et al. (2023) [1] for their open supplementary data accompanying their article. Special thanks are extended to Rongkai Zhang (from Beijing Union University) for sorting out the references and during the manuscript revision process. We also thank Zhong Zheng (from Minzu University of China) and Yuheng Zhou (from Zhejiang Shuren University) for their help during the manuscript revision process. We are very grateful to the anonymous reviewers for their valuable comments and suggestions.
Conflicts of Interest
The authors declare no conflicts of interest. The funders had no role in the design of the research; in the collection, analyses, or interpretation of data; in the writing of the manuscript; or in the decision to publish the results.
References
- Wu, W.; Hu, J.; Song, D. Assessment of marine ecosystem health and its key influencing factors in Laizhou Bay, China. Front. Mar. Sci. 2023, 10, 1115896. [Google Scholar] [CrossRef] [Scilit]
- Zhang, C.; Wu, X.; Li, Y.X.; Zhu, B.Y.; Huang, P.J. Construction of evaluation index system for ecological restoration projects facing historical legacy issues of land reclamation: A case study of Zhejiang region. Ocean Dev. Manag. 2025, 42, 47–57. [Google Scholar]
- Ouyang, Y.; Wu, L.; Dai, J.; Wu, Y.; Cai, L.; Li, Q.; Wu, J.; Jiang, S. Technical methodologies for the assessment of the impacts of reclamation projects on marine ecology. Environ. Sci. Pollut. Res. 2021, 29, 7595–7603. [Google Scholar] [CrossRef] [Scilit]
- Daw, T.M.; Reid, N.J.; Coulthard, S.; Chaigneau, T.; António, V.M.; Cheupe, C.; Wells, G.; Bueno, E. Life satisfaction in coastal Kenya and Mozambique reflects culture, gendered relationships and security of basic needs: Implications for ecosystem services. Ecosyst. Serv. 2023, 62, 101532. [Google Scholar] [CrossRef] [Scilit]
- Klopertanz, N.; Amestoy, M.; Abate, S.; Winter, M. Monitoring macroplastic ingestion by birds and marine mammals in northeastern Patagonia, Argentina. Mar. Pollut. Bull. 2022, 185, 114288. [Google Scholar] [CrossRef] [Scilit]
- Xiao, K.; Tamborski, J.; Wang, X.; Feng, X.; Wang, S.; Wang, Q.; Lin, D.; Li, H. A coupling methodology of the analytic hierarchy process and entropy weight theory for assessing coastal water quality. Environ. Sci. Pollut. Res. 2022, 29, 31217–31234. [Google Scholar] [CrossRef] [Scilit]
- Wang, J.; Chen, J. How does the government guide marine resource enterprises in China to improve their business performance? A path analysis based on DEA-fsQCA. Water 2024, 16, 408. [Google Scholar] [CrossRef] [Scilit]
- Wang, Y.; Chen, H.; Zhao, S.; Fan, L.; Xin, C.; Jiang, X.; Yao, F. Benefit evaluation of carbon reduction in power transmission and transformation projects based on the modified TOPSIS-RSR method. Energies 2024, 17, 2988. [Google Scholar] [CrossRef] [Scilit]
- Yuan, Y.; Song, J.; Liu, M.; Li, J.; Yang, J.; Zhang, Y. Construction and application of marine ecological restoration project effect assessment system based on analytic hierarchy process. Water 2025, 17, 1334. [Google Scholar] [CrossRef] [Scilit]
- Chen, M.H.; Chen, F.; Tang, C.J.; Lu, Y.; Feng, Y.X. Integration of DPSIR framework and TOPSIS model reveals insight into the coastal zone ecosystem health. Ocean Coast. Manag. 2022, 226, 106265. [Google Scholar] [CrossRef] [Scilit]
- de Oliveira, M.; Morrison, T.; O’Brien, K.R.; Lovelock, C.E. Governance of coastal wetlands: Beyond the community conservation paradigm. Ocean Coast. Manag. 2024, 255, 107253. [Google Scholar] [CrossRef] [Scilit]
- Ribeiro, A.R.; Damasio, L.M.A.; Silvano, R.A.M. Fishers’ ecological knowledge to support conservation of reef fish (groupers) in the tropical Atlantic. Ocean Coast. Manag. 2021, 204, 105543. [Google Scholar] [CrossRef] [Scilit]
- Mao, M.J.; Wei, L.Y.; Ma, Y.X.; Mao, S.; Chen, Y.; Jia, J.T.; Liu, Q.X.; Gong, W.F.; Wu, L.B. An integrated DPSIR-TOPSIS modeling approach for assessing and predicting coastal wetland ecological security: A case study of Haikou, China. J. Clean. Prod. 2026, 538, 147255. [Google Scholar] [CrossRef] [Scilit]
- Xu, C.; Wang, C.; Liu, D.; Li, Y.; Liu, C.; Li, Z. Assessing Coastal Ecological Restoration Effectiveness in Qingdao Based on a Multi-Dimensional Entropy-Weighted TOPSIS Model. J. Mar. Sci. Eng. 2026, 14, 391. [Google Scholar] [CrossRef] [Scilit]
- Yuvaraj, R.M.; Ambrisha, S.; Muthunagai, S. Integrated AHP-TOPSIS models to evaluate suitability and sustainable development of beach tourism: A case in Chennai City, Tamil Nadu, India. J. Coast. Conserv. 2024, 28, 32. [Google Scholar] [CrossRef] [Scilit]
- Zhang, D.; Yu, W.; Chen, B.; Huang, H.; Liao, J.; Feng, L.; Chen, G.; Ma, Z.; Fang, Q.; Chen, S.; et al. Restoration-oriented multi-tiered framework for ecosystem degradation diagnosis: A coastal bay case study. Front. Mar. Sci. 2025, 12, 1549897. [Google Scholar] [CrossRef] [Scilit]
- Degraer, S.; Verfaillie, E.; Willems, W.; Adriaens, E.; Vincx, M.; Van Lancker, V. Habitat suitability modelling as a mapping tool for macrobenthic communities: An example from the Belgian part of the North Sea. Cont. Shelf Res. 2008, 28, 369–379. [Google Scholar] [CrossRef] [Scilit]
- Li, Y.; Huang, Y.; Zhang, X.; Jiang, Y.; Jing, X.; Deng, Y.; Li, R.; Jiang, D.; Mu, J. Ecosystem health assessment: A PSR analysis combining AHP and EW methods for Sansha Bay, China. Front. Mar. Sci. 2024, 11, 1396026. [Google Scholar] [CrossRef] [Scilit]
- Qiu, L.; Feng, W.; Yang, X.; Lu, X.; Wang, H. Institutional configurations and ecological participation: An fsQCA-IAD analysis of coastal farmers in China. Ocean Coast. Manag. 2026, 277, 108188. [Google Scholar] [CrossRef] [Scilit]
- Steele, K.; Carmel, Y.; Cross, J.; Wilcox, C. Uses and misuses of multicriteria decision analysis (MCDA) in environmental decision making. Risk Anal. 2009, 29, 26–33. [Google Scholar] [CrossRef] [Scilit]
- van Maren, D.S.; Schrijvershof, R.A.; Beemster, J.; Zhu, C.; Xie, D.; Zhou, Z.; Colina Alonso, A.; Hoitink, A.J.F. Land Reclamation Impacts on Tidal Landscape Evolution. Rev. Geophys. 2025, 63, e2024RG000860. [Google Scholar] [CrossRef] [Scilit]
- Howarth, R.W. Coastal nitrogen pollution: A review of sources and trends globally and regionally. Harmful Algae 2008, 8, 14–20. [Google Scholar] [CrossRef] [Scilit]
- Liu, J.; Wang, M.; Chen, P.; Wen, C.; Yu, Y.; Chau, K. Riding towards a sustainable future: An evaluation of bike sharing’s environmental benefits in Xiamen Island, China. Geogr. Sustain. 2024, 5, 276–288. [Google Scholar] [CrossRef] [Scilit]
- Maiti, S.; Das Adhikari, M.; Bera, A.; Chaudhury, N.R. Seismically-induced changes in sea-level markers: Jolly Buoy Island, South Andaman. Ocean Coast. Manag. 2022, 221, 106099. [Google Scholar] [CrossRef] [Scilit]
- Pavirani, L.; Bove, P.; Coro, G. Assessing marine ecosystem risks through unsupervised methods. Ecol. Inform. 2025, 90, 103334. [Google Scholar] [CrossRef] [Scilit]
- Gheoca, V.; Benedek, A.M.; Schneider, E. Exploring land snails’ response to habitat characteristics and their potential as bioindicators of riparian forest quality. Ecol. Indic. 2021, 132, 108289. [Google Scholar] [CrossRef] [Scilit]
- Rheuban, J.E.; Williamson, S.; Costa, J.E.; Glover, D.M.; Jakuba, R.W.; McCorkle, D.C.; Neill, C.; Williams, T.; Doney, S.C. Spatial and temporal trends in summertime climate and water quality indicators in the coastal embayments of Buzzards Bay, Massachusetts. Biogeosciences 2016, 13, 253–265. [Google Scholar] [CrossRef] [Scilit]
- Xu, H.; Li, Y.; Liu, T.; Wang, B.; Ma, L.; Bai, Z.; Yu, C.; Shan, X.; Li, Z.; Zhao, S.; et al. Impacts of local anthropogenic stressors outpace those of climate on coral reef collapse in the northern South China Sea. Nat. Commun. 2026, 17, 4136. [Google Scholar] [CrossRef] [Scilit]
- Wu, C.-W.; Liao, S.-W.; Lin, S.-M.; Huang, S.-C.; Chen, C.-P.; Shih, P.-K.; Hsieh, H.-L. Exploring the causal relationships between environmental factors and benthos distributions in an intertidal algal reef ecosystem via a structural equation model. Cont. Shelf Res. 2025, 285, 105382. [Google Scholar] [CrossRef] [Scilit]
- Gong, H. Research on the driving path of bay environmental governance performance-Based on fsQCA analysis of 17 Blue Bay Remediation Networks. In Proceedings of the Xiamen Symposium on Marine Environmental Science, Xiamen, China, 14–17 January 2025. [Google Scholar]
- Lafrenz, A.J. Designing Multifunctional Urban Green Spaces: An Inclusive Public Health Framework. Int. J. Environ. Res. Public Health 2022, 19, 10867. [Google Scholar] [CrossRef] [Scilit]
- Yan, Y.X.; Wang, N.; Cao, Y. Evaluation of ecological restoration effects and diagnosis of obstacle factors in coastal zones: A case study of Qinhuangdao city. Mar. Econ. Manag. 2024, 7, 1–17. [Google Scholar] [CrossRef] [Scilit]
- Li, M.H.; Huang, B.X.; Zhao, J.P.; Xu, H.T.; Hu, Q.J.; Wang, Z.F. Evaluation of marine ecological carrying capacity based on PSR framework and entropy weight TOPSIS: A case study of Jiaxing City. Appl. Ecol. Environ. Res. 2026, 24, 2643–2662. [Google Scholar]
- Han, L.; Li, H.; Zheng, W.; Ding, D.; Shi, H. Governance-pressure inversion and asynchronous recovery in urbanized coastal ecosystems: A spatially explicit DPSIR assessment of Jiaozhou Bay. Ecol. Indic. 2026, 184, 114723. [Google Scholar] [CrossRef] [Scilit]
- Ahmed, Z.; Ambinakudige, S. How does shrimp farming impact agricultural production and food security in coastal Bangladesh? Evidence from farmer perception and remote sensing approach. Ocean Coast. Manag. 2024, 255, 107241. [Google Scholar] [CrossRef] [Scilit]
- Woodside, A.G. Moving beyond multiple regression analysis to algorithms: Calling for adoption of a paradigm shift from symmetric to asymmetric thinking in data analysis and crafting theory. J. Bus. Res. 2013, 66, 463–472. [Google Scholar] [CrossRef] [Scilit]
- Formann, A.K. Die Latent-Class-Analyse: Einführung in Theorie und Anwendung; Beltz: Weinheim, Germany, 1984. [Google Scholar]
- Kline, R.B. Principles and Practice of Structural Equation Modeling, 4th ed.; Guilford Press: New York, NY, USA, 2016. [Google Scholar]
- Cohen, J.; Cohen, P.; West, S.G.; Aiken, L.S. Applied Multiple Regression/Correlation Analysis for the Behavioral Sciences, 3rd ed.; Routledge: New York, NY, USA, 2002. [Google Scholar]
- Roozee, E.; Temby, O.; Hickey, G.M. The impact of Regional Fishery Management Organization structure on collaborative performance. Ocean Coast. Manag. 2026, 271, 107961. [Google Scholar] [CrossRef] [Scilit]
- Wang, J.; Lian, X. The impact of blue finance on sustainable development in marine ranching: Exploring multiple pathway. Res. Int. Bus. Financ. 2026, 83, 103259, Correction in Res. Int. Bus. Finance 2026, 84, 103309. [Google Scholar] [CrossRef] [Scilit]
- Liu, D.; Huang, Z. Configuration analysis of marine economic resilience based on 11 coastal provinces of China: An fsQCA approach. Front. Mar. Sci. 2024, 11, 1398899. [Google Scholar] [CrossRef] [Scilit]
- Han, Y.; Wei, F.; Ye, G.; Yang, S.; Ma, P.; Hu, W. A study on evaluation the marine carrying capacity in Guangxi Province, China. Mar. Policy 2018, 91, 66–74. [Google Scholar] [CrossRef] [Scilit]
- Liu, C.; Yan, X.; Han, Z.; Liu, Y.; Li, X.; Li, X.; Zhong, J. Guiding and constraining reclamation for coastal zone through identification of response thresholds for ecosystem services supply–demand relationships. Land Degrad. Dev. 2024, 35, 1804–1817. [Google Scholar] [CrossRef] [Scilit]
- Hong, W.; Zhao, Y.; Yang, S.; Yang, X.; Li, Y.; Wang, C. An analytical framework based on social-ecological systems for identifying priority areas for ecological restoration in coastal regions. J. Environ. Manag. 2024, 370, 122958. [Google Scholar] [CrossRef] [Scilit]
- Li, Y.; Sun, L.; Wu, Z.; Liu, H. Evaluation and obstacle factors of marine resources and environment carrying capacity in Beibu Gulf Urban Agglomeration. Front. Mar. Sci. 2023, 10, 1196196. [Google Scholar] [CrossRef] [Scilit]
- Yang, Y.; Liu, D.; Xu, R.; Li, Z.; Shi, C.; Zhu, X.; Sun, X. The performance evaluation of marine ecological civilization construction (MECC): A case study of coastal cities in Jiangsu Province, China. Ocean Coast. Manag. 2024, 254, 107174. [Google Scholar] [CrossRef] [Scilit]
- Lin, Y.; Chen, Q.; Huang, F.; Xue, X.; Zhang, Y. Identifying ecological risk and cost-benefit value for supporting habitat restoration: A case study from Sansha Bay, southeast China. Ecol. Process 2023, 12, 20. [Google Scholar] [CrossRef] [Scilit]
- Xu, H.; Jia, A.; Song, X.; Bai, Y. Suitability evaluation of carrying capacity and utilization patterns on tidal flats of Bohai Rim in China. J. Environ. Manag. 2022, 319, 115688. [Google Scholar] [CrossRef] [Scilit]
- Gacitua, R.; Pereira, J.; Astudillo, H.; Taramasco, C.; Contreras, P. When hazard maps are not predictions: A critical assessment of MCDA in glacier hazard susceptibility. ISPRS Int. J. Geo-Inf. 2026, 15, 245. [Google Scholar] [CrossRef] [Scilit]
- Schneider, C.Q.; Wagemann, C. Reducing complexity in qualitative comparative analysis (QCA): Remote and proximate factors and the consolidation of democracy. Eur. J. Politic. Res. 2006, 45, 751–786. [Google Scholar] [CrossRef] [Scilit]
- Fu, S.; Zhao, L.; Qiao, Z.; Sun, T.; Sun, M.; Hao, Y.; Hu, S.; Zhang, Y. Development of Ecosystem Health Assessment (EHA) and Application Method: A Review. Sustainability 2021, 13, 11838. [Google Scholar] [CrossRef] [Scilit]
- Ji, M.; Li, J.R.; Li, L.P.; Zhang, L.G.; Wang, K.W. Ecosystem health in the Yellow River Estuary based on the DPSIR model: A case study in China. Sci. Rep. 2026, 16, 13587. [Google Scholar] [CrossRef] [Scilit]
- Wang, C.; Qu, A.; Wang, P.; Hou, J. Estuarine ecosystem health assessment based on the DPSIR framework: A case of the Yangtze Estuary, China. J. Coast. Res. 2013, 65, 1236–1241. [Google Scholar] [CrossRef] [Scilit]
- Saaty, T.L. A scaling method for priorities in hierarchical structures. J. Math. Psychol. 1977, 15, 234–281. [Google Scholar] [CrossRef] [Scilit]
- Chen, S.Q.; Ji, Z.Z.; Lu, L.H. A Method for Identifying Key Areas of Ecological Restoration, Zoning Ecological Conservation, and Restoration. Land 2025, 14, 1439. [Google Scholar] [CrossRef] [Scilit]
- Dong, J. Evaluation and Empirical Analysis of Marine Ecological Civilization Construction in China: Shandong Province as a Case Study. Master’s Thesis, Ocean University of China, Qingdao, China, 2019. [Google Scholar]
- Feng, L.; Zhu, X.; Sun, X. Assessing coastal reclamation suitability based on a fuzzy-AHP comprehensive evaluation framework: A case study of Lianyungang, China. Mar. Pollut. Bull. 2014, 89, 102–111. [Google Scholar] [CrossRef] [Scilit]
- Zhang, J.; Xia, L.; Xu, L.; Yang, Q.; Dong, W. Research on Comprehensive Evaluation Technology for Photovoltaic Power Generation Unit Based on Combined Weighting Method of Minimum Discriminant Information. J. Power Supply 2025, 23, 152–160. [Google Scholar]
- Peng, H.; Long, F.; Ding, C. Feature selection based on mutual information: Criteria of max-dependency, max-relevance, and min-redundancy. IEEE Trans. Pattern Anal. Mach. Intell. 2005, 27, 1226–1238. [Google Scholar] [CrossRef] [Scilit] [PubMed]
- Saaty, T.L. The Analytic Hierarchy Process; McGraw-Hill: Columbus, OH, USA, 1990. [Google Scholar]
- Zhang, H.; Hu, W.; Bai, C.; Cui, Y. Spatial heterogeneity of Luoyang graded heritage networks revealed by dual-path TOPSIS–RSR analysis and MGWR. npj Herit. Sci. 2026, 14, 216. [Google Scholar] [CrossRef] [Scilit]
- Han, J.; Kim, C. Public sector corruption in South Asia: Focusing on institutional factors with a two-step fsQCA. Humanit. Soc. Sci. Commun. 2025, 12, 148. [Google Scholar] [CrossRef] [Scilit]
- Schneider, C.Q.; Wagemann, C. Set-Theoretic Methods for the Social Sciences: A Guide to Qualitative Comparative Analysis; Cambridge University Press: Cambridge, UK, 2012. [Google Scholar]
- Cooper, B.; Glaesser, J. Qualitative comparative analysis, necessary conditions, and limited diversity: Some problematic consequences of Schneider and Wagemann’s enhanced standard analysis. Field Methods 2016, 28, 300–315. [Google Scholar]
- Fiss, P.C. Building better causal theories: A fuzzy set approach to typologies in organization research. Acad. Manag. J. 2011, 54, 393–420. [Google Scholar] [CrossRef] [Scilit]
- Ministry of Natural Resources of the People’s Republic of China; National Development and Reform Commission; National Forestry and Grassland Administration. Construction Plan for Major Projects of Coastal Ecological Protection and Restoration (2021–2035); National Development and Reform Commission (NDRC): Beijing, China, 2022.
- Wang, S.; Zhang, R.; Wang, J.; Li, Q.; Wang, R.; Li, Y.; Zhang, L. Identification and optimization of ecological corridors in the middle reaches of the Yellow River Basin. J. Clean. Prod. 2025, 512, 145676. [Google Scholar] [CrossRef] [Scilit]
- Ministry of Natural Resources of the People’s Republic of China; National Development and Reform Commission; Ministry of Finance; National Forestry and Grassland Administration. Opinions on Deepening Ecological Protection and Restoration in the New Era by Learning from and Applying the Xiamen Practice of Xi Jinping’s Ecological Civilization Thought. 2024. Available online: https://www.gov.cn/lianbo/bumen/202408/content_6968387.htm (accessed on 7 October 2026).
- MacArthur, M.; Naylor, L.A.; Hansom, J.D.; Burrows, M.T.; Loke, L.H.L.; Boyd, I. Maximising the ecological value of hard coastal structures using textured formliners. Ecol. Eng. 2019, 142, 100002. [Google Scholar] [CrossRef] [Scilit]
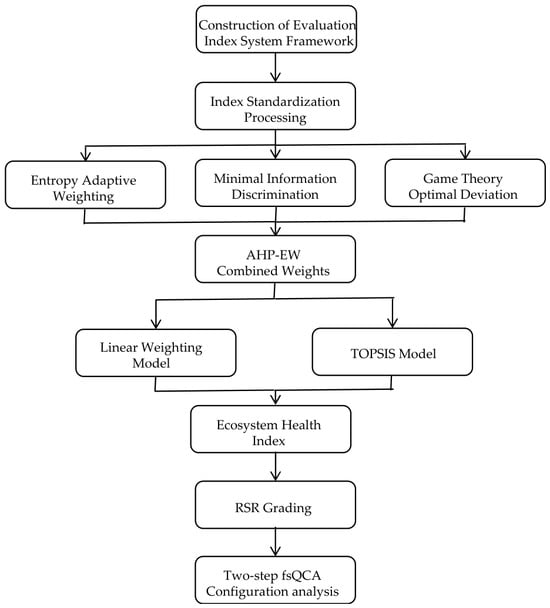
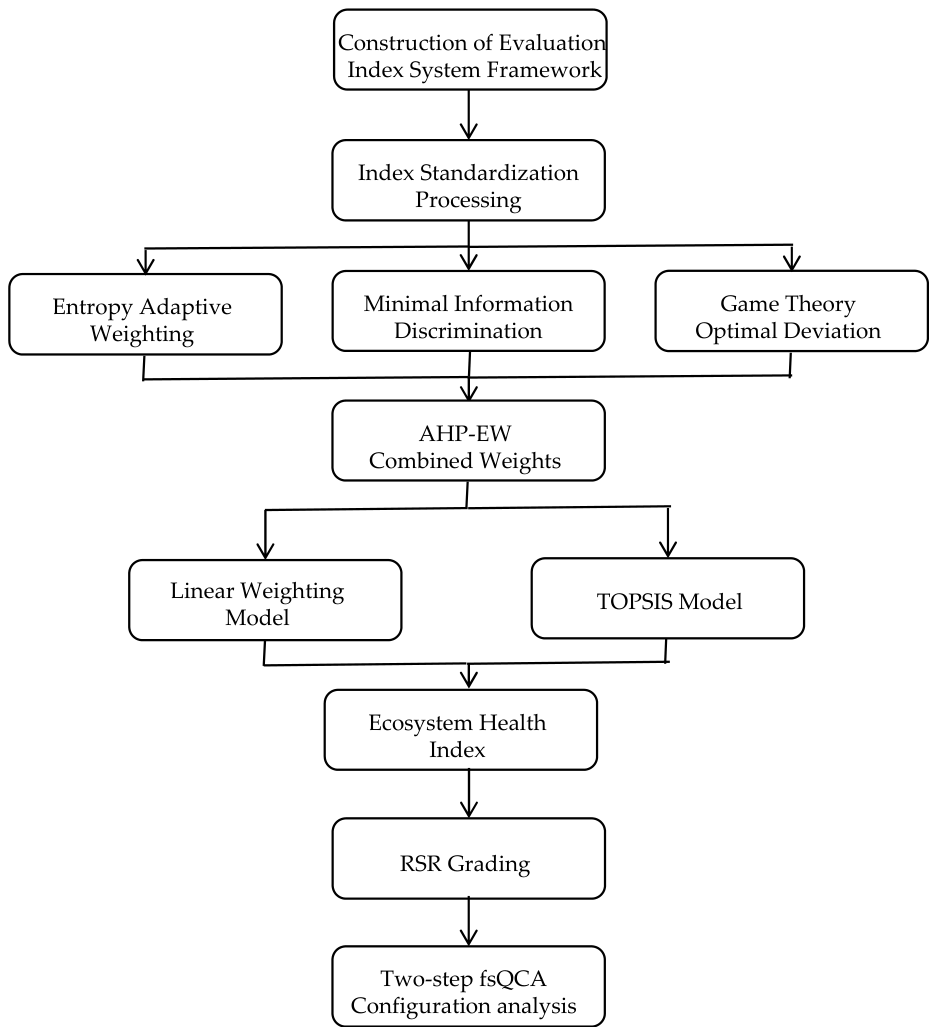
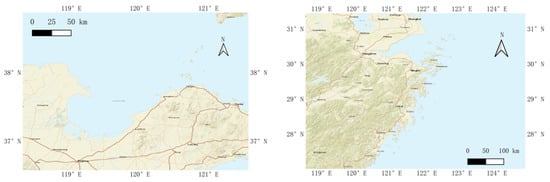
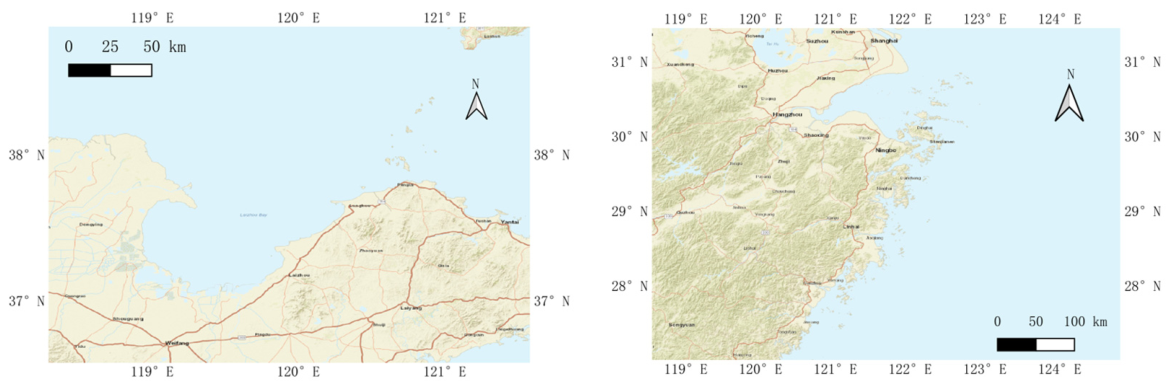
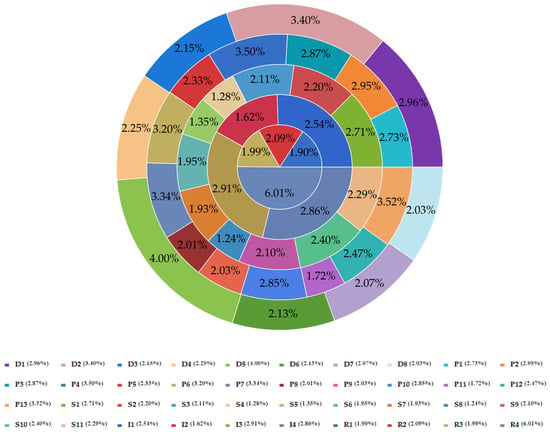
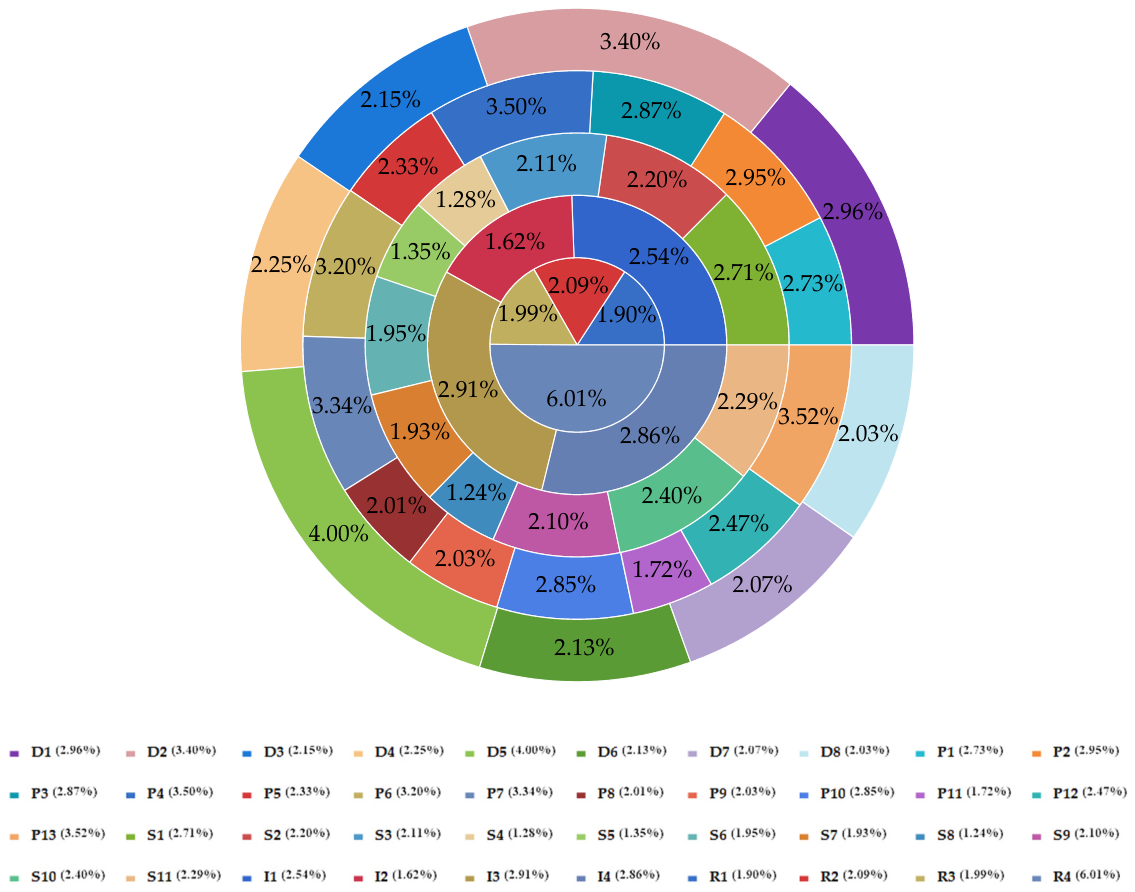
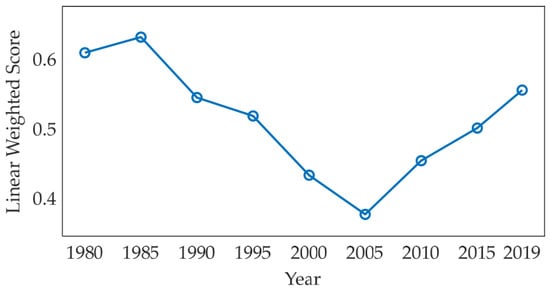
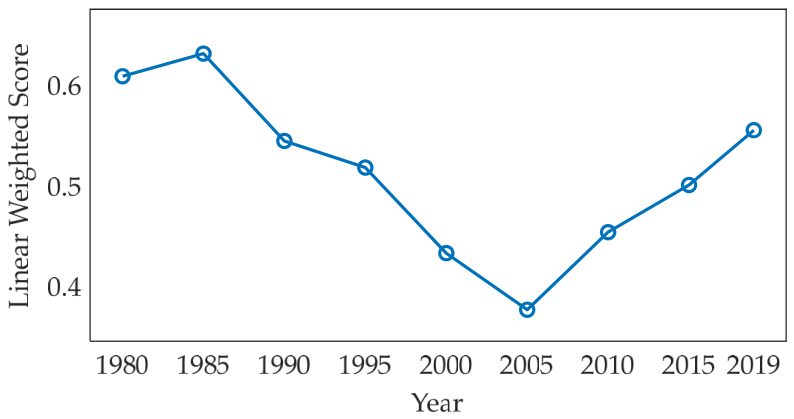
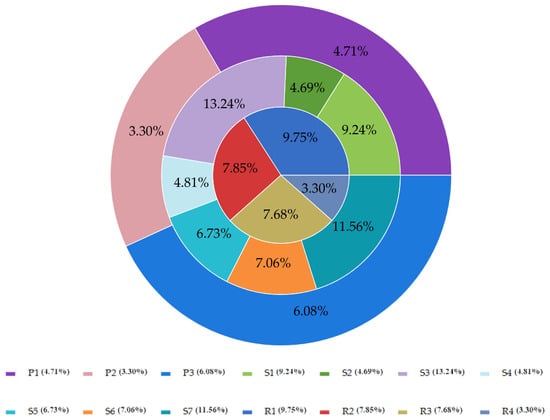
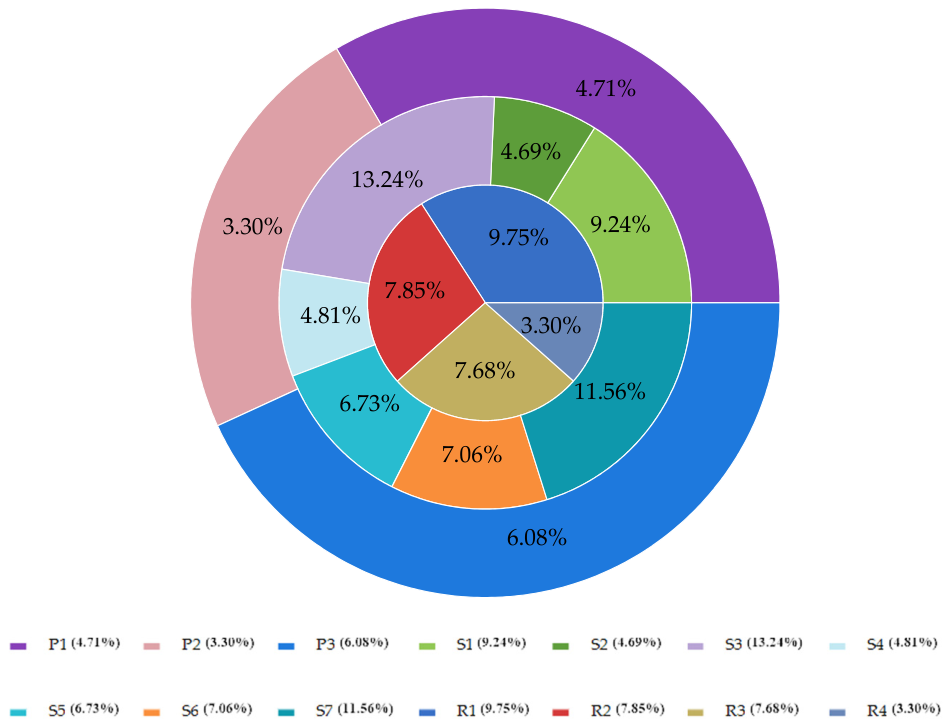
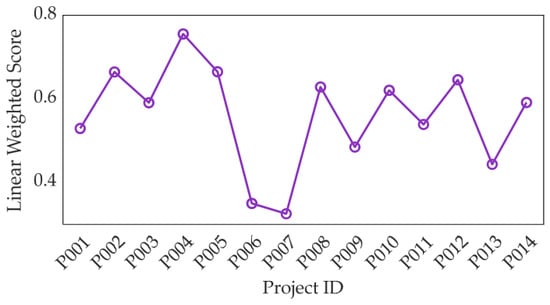
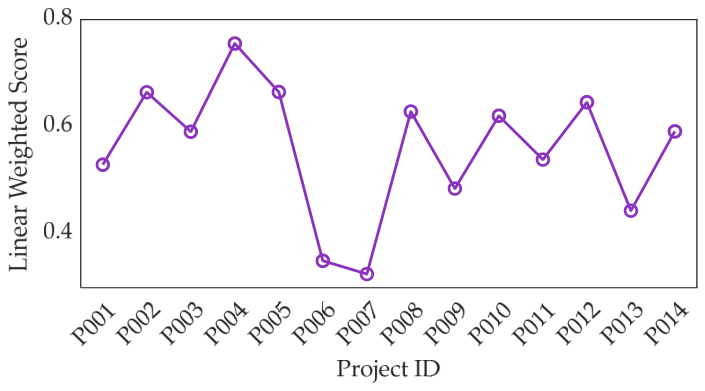

Disclaimer/Publisher’s Note: The statements, opinions and data contained in all publications are solely those of the individual author(s) and contributor(s) and not of MDPI and/or the editor(s). MDPI and/or the editor(s) disclaim responsibility for any injury to people or property resulting from any ideas, methods, instructions or products referred to in the content. |
© 2026 by the authors. Licensee MDPI, Basel, Switzerland. This article is an open access article distributed under the terms and conditions of the Creative Commons Attribution (CC BY) license.