


Abstract
This study examines the relationship between corporate artificial intelligence (AI) investment and climate risk disclosure specificity, together with the roles of analyst attention and physical climate exposure. Using a sample of Chinese A-share-listed firms from 2014 to 2023, we measure disclosure specificity as the share of company climate statements containing specific, checkable information. AI investment is positively associated with disclosure specificity, although the economic magnitude is modest. Further analysis indicates that this association primarily reflects a greater likelihood that firms provide specific climate information; among firms already providing such information, its share does not increase significantly with AI investment. Analyst attention and physical climate exposure both strengthen this association, indicating that external information monitoring and firms’ exposure to climate hazards are important contextual factors in the relationship between AI investment and specific climate disclosure.
1. Introduction
Climate risk has become a material concern for corporate reporting because physical hazards and the transition to a low-carbon economy can disrupt operations, impair assets, and affect future cash flows. Investors consequently need information that connects climate-related developments to individual firms’ exposure and responses. IFRS S2 Climate-related Disclosures (issued in 2023) reflects this need by focusing on climate-related risks and opportunities that may affect firms’ financial prospects [1]. Evidence on institutional investors’ demand for climate information further establishes the capital-market relevance of corporate disclosure [2].
In China, investors can express their demand for corporate information through exchange-operated interaction platforms [3]. The 2022 investor relations guidelines also incorporated environmental, social, and governance information into listed companies’ communication responsibilities [4]. These channels make investors’ questions visible and give firms opportunities to explain the implications of climate risk for their operations. They provide a setting in which to examine both the information firms disclose and the external attention surrounding their reporting.
The availability of communication channels does not ensure sufficiently specific climate reporting. Firms may expand their discussion of climate change without explaining which operations are exposed, how risks are assessed, or what responses have been implemented. Yang et al. [5] examine how corporate climate disclosure corresponds to investors’ climate concerns. Related research distinguishes general climate language from substantive company information through the concepts of climate cheap talk [6] and symbolic versus substantive reporting [7]. The distinction between detail and verifiability also matters because a concrete claim gives readers an identifiable basis for examination [8]. Drawing on these studies, we examine the specificity and checkability of firms’ climate statements. We refer to this text-based outcome as climate risk disclosure specificity (CRDS). The measure does not establish that a corporate claim is factually accurate or externally assured.
Corporate artificial intelligence investment (AII) may support such disclosure by improving the resources available for information processing. We understand AI investment as firms’ commitment of technological, human, and organizational resources to AI development and implementation. Research on AI-related human capital [9] and AI capability [10] supports this resource-based interpretation. AI research, systems, and specialist personnel can help firms assemble and interpret operating information. When these resources are used in risk assessment and reporting, they may support more specific explanations of climate exposure and corporate responses.
Recent research links AI to corporate disclosure. Wang et al. [11] examine AI application and climate risk disclosure, Qin et al. [12] investigate the disclosure consequences of China’s AI Pilot Zone policy, and Huang and Xu [13] consider environmental information disclosure and its governance conditions. Research on digital technology and carbon performance [14], and on environmental regulation, corporate responsibility, and green innovation [15], further emphasizes the organizational and external conditions surrounding technology use. These studies connect technology to disclosure and environmental outcomes. We focus on whether firms’ AI resource commitments are associated with specific, checkable climate information. We therefore ask whether corporate AI investment is associated with climate risk disclosure specificity and whether analyst attention strengthens this relationship.
We address these questions by combining organizational information processing theory with voluntary disclosure theory. The former explains how technological resources can alleviate constraints on information formation [16]; the latter explains how information conditions, disclosure costs, and managerial incentives influence public communication [17,18]. Analyst attention provides an external condition that may strengthen managers’ incentive to disclose information generated within the firm. A supplementary analysis examines physical climate exposure to assess whether the investment–disclosure relationship also varies with the climate risks surrounding the firm’s operations.
This study examines Chinese A-share-listed firms from 2014 to 2023. We measure AI investment using reported AI resource commitments and CRDS as the share of company climate statements containing specific, checkable information. The analysis combines these measures with financial and information-environment controls. AI investment is positively associated with CRDS in models with firm and year fixed effects. Analyst attention strengthens this association, and the supplementary interaction with climate exposure is also positive. Further analysis distinguishes whether a report contains specific climate content from the share of such content among positive-score reports.
The study makes two contributions. First, it connects firms’ AI resource allocation to climate risk disclosure specificity. Prior work examines AI applications, policy initiatives, and corporate disclosure [11,12,13], while research on substantive reporting highlights investor concerns, firm-specific content, and checkable detail [5,6,7,8]. Bringing these streams together, the analysis links AI resource investment to a clearly defined textual feature of climate reporting and extends prior emphasis on disclosure volume.
Second, the study clarifies how the external information environment and climate context shape the reporting implications of AI investment. The analysis of analyst attention links information-processing resources to incentives for public communication, while the climate-exposure analysis considers the relevance of physical climate risks surrounding the firm. Together, these results extend the understanding of the conditions under which technological resources are reflected in environmental reporting and connect the information-processing perspective to research on the environmental consequences of digitalization [14,15].
2. Theoretical Framework and Hypothesis Development
The reporting implications of corporate AI investment depend on whether information-processing resources are used to prepare and communicate climate information. Organizational information processing theory explains how firms develop the capacity to identify and integrate information [16]. Voluntary disclosure theory explains how the resulting information enters reporting decisions through disclosure costs and managerial incentives [17,18]. Combining these perspectives links information formation within the firm to its public reporting choices.
2.1. Corporate AI Investment and Climate Risk Disclosure Specificity
Organizational information processing theory links greater task uncertainty to a greater need to obtain and process information for coordination and decision-making [16]. Climate reporting presents this problem because firms must connect records dispersed across operating units to the implications of climate-related developments. AI research, systems, and specialized personnel provide resources for recognizing patterns and combining information across functions. Applied to risk assessment, these resources may help managers identify relevant changes and understand their consequences for the firm. They can therefore reduce some of the difficulties involved in assembling information for climate reporting.
The use of these resources within the organization is central to the argument. Mikalef and Gupta [10] explain that AI capability combines technological resources with human skills and organizational arrangements. Investment provides inputs whose reporting value depends on their integration into business and management processes. Research on digital technology adoption and carbon performance [14] similarly connects technological resources to organizational capabilities. In auditing, Fedyk et al. [19] combine an AI workforce measure with interviews about the tasks performed. Their approach illustrates how resource measures and evidence about actual applications can jointly inform an information-processing argument.
Public records document climate-related applications within the study period. China Baowu [20] described Baosteel’s 2022 launch of a carbon data platform that uses AI and other digital technologies, including cloud computing and big data, for carbon accounting and product-footprint calculations. In January 2023, the World Economic Forum reported that Haier’s Tianjin facility used AI for equipment power-load modeling and energy-oriented production scheduling [21]. These applications illustrate the proposed channel: AI resources can contribute to the operating information used in climate reporting when they enter the relevant information processes.
These examples clarify the informational step between resource investment and disclosure. Carbon accounting and equipment-load modeling generate records about identifiable operations; a reporting team can draw on those records when explaining an action, a measurement boundary or a result. The relevant use of AI can therefore occur before the report is written. The firm-level regressions examine whether reported resource commitments are associated with such disclosure content, while the applications illustrate the proposed pathway rather than directly identifying it in each sample firm.
Management must then decide whether to disclose the information available. Voluntary disclosure theory explains how disclosure costs and the quality of managers’ private information influence this choice [17,18]. Better access to operating records can reduce the effort required to interpret a risk assessment, reconcile information from different units, and prepare a supportable explanation. For example, linking a climate statement to a particular activity, a defined metric, or an implemented response requires information that general statements do not. Improvements in information preparation make such explanations more feasible.
These arguments connect AI investment to the content of climate disclosures. Firms with more developed information-processing resources should be better able to identify the operations concerned, explain their responses, and describe the basis of climate-related claims. Research distinguishing general climate language from substantive information [6,7] provides the disclosure perspective for this expectation. When AI resources are incorporated into relevant reporting processes, lower preparation costs and better access to company information provide a basis for expecting more specific climate risk disclosures. We therefore propose:
H1.
Corporate AI investment is positively associated with climate risk disclosure specificity (CRDS).
2.2. The Moderating Role of Analyst Attention
Information-processing capacity does not determine how managers use the information produced. Even when firms can prepare more detailed climate information, managers may give priority to internal operating decisions. Voluntary disclosure theory suggests that the costs of communication must be considered alongside its expected benefits [17,18]. Analyst attention can make reporting choices more visible and subject managers’ explanations to professional scrutiny, increasing the incentive to communicate information relevant to investors’ assessments.
Empirical research provides a basis for this argument. Yu [22] finds less earnings management among firms with greater analyst coverage, while Fan and Yao [23] report a positive association between analyst site visits and environmental information disclosure. Although the two studies examine different forms of analyst activity, both show the relevance of information intermediaries to corporate reporting. In the climate context, analysts’ evaluation of corporate prospects gives managers a reason to connect risk discussion with the firm’s operating conditions and plans. Research on environmental regulation, corporate responsibility, and green innovation [15] further shows that external conditions can shape the use of technological resources, although it examines a different outcome.
We expect analyst attention to strengthen the reporting implications of AI investment because the two operate through complementary parts of the disclosure process. AI resources are expected to reduce the information-processing difficulties involved in preparing company-specific explanations. Analyst following increases the incentive to communicate those explanations. With greater attention, managers have stronger reasons to use the additional processing capacity for public reporting. With less external attention, the same resources may be directed primarily toward internal decisions and have a smaller reporting role.
An alternative possibility is that analysts’ own information production substitutes for corporate disclosure. A well-developed information environment could also reduce the incremental benefit of additional AI investment. These possibilities imply a weaker interaction. However, analysts still depend on firms for operating details that are not otherwise publicly available, so their information production need not replace company explanations of climate exposure and responses. We therefore expect the incentive to communicate internally available information to support complementarity between analyst attention and AI investment. We propose:
H2.
Analyst attention positively moderates the relationship between corporate AI investment and climate risk disclosure specificity (CRDS).
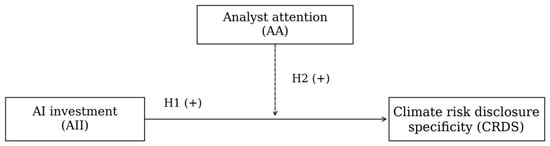
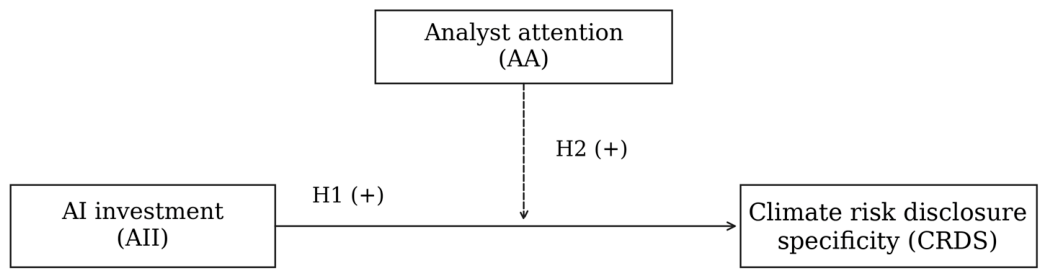
Figure 1 summarizes the theoretical framework and hypotheses.
Figure 1.
Theoretical framework. Notes: AII = corporate AI investment; CRDS = climate risk disclosure specificity; AA = analyst attention. The solid arrow represents H1, and the dashed arrow represents H2. Physical climate exposure is examined separately in the supplementary analysis in Section 4.4.
3. Research Design
3.1. Sample, Sources, and Observation Timing
We study Chinese A-share-listed firms from 2014 to 2023. The initial sample contains 22,125 firm-year observations after excluding financial firms, special-treatment firms, and observations missing key financial data. The sample begins in the first complete calendar year after the Shanghai interaction platform was launched [3] and ends in the latest year covered by the matched data. Financial and governance variables, institutional ownership, analyst following, and annual-report text come from CSMAR. Media coverage comes from CNRDS. Investor-question records come from the Shanghai and Shenzhen stock exchange interaction platforms. City-level physical climate-risk data come from the annual Chinese Climate Physical Risk Index (CCPRI) [24,25].
Financial, governance, and text variables are matched to the fiscal year they describe. Annual reports are generally published in the following year, whereas investor-question controls aggregate questions posted during calendar year t. The baseline model examines the contemporaneous relationship within the reporting period; Section 3.3.1 further uses lagged and lead AII specifications to examine timing.
The constructed CRDS measure is available for 21,550 firm-year observations. Requiring complete control variables leaves 21,529 observations; removing 26 fixed-effect singletons produces a baseline sample of 21,503 observations from 3483 firms. Each regression uses observations with complete data for the variables in that model.
3.2. Variable Measurement
AII and CRDS are constructed from the available management discussion and analysis (MD&A) fields of annual reports, including identified board-report sections used as substitutes in the source extraction Appendix A.1, Appendix A.2 and Appendix A.3 document the CRDS coding process, and Appendix B.1 and Appendix B.2 document the AII coding process. The remaining variables are measured from the sources described below and summarized in Table 1.
3.2.1. Corporate AI Investment
Let Ait denote the number of distinct qualifying sentences in firm i’s report for fiscal year t. A qualifying sentence must identify an AI-specific technology, refer to the reporting firm or a controlled subsidiary, and provide evidence of a concrete resource input. Eligible inputs include AI-specific research and development, procurement or paid licensing, committed research funds, and identifiable AI teams, laboratories, or personnel. We exclude generic information technology, routine computer assets, broad digitalization language, third-party descriptions, passive financial investment, negated activity, and unimplemented plans. A statement about AI use or adoption qualifies only if it also identifies a resource input. AI investment is measured as:
AIIit = ln(1 + Ait).
AII captures reported commitments of AI-specific technological, human, and organizational resources rather than the book value of broad software or computer assets. Babina et al. [9] use AI-related human capital to identify firm engagement with technology, while Mikalef and Gupta [10] emphasize the resources required to develop AI capability. Applying this resource perspective to annual-report sentences, we require evidence of research, acquisition, expenditure, or dedicated personnel, as detailed in Appendix B.2. The measure records the presence and breadth of reported input activity, not its monetary value; taking ln(1 + Ait) limits the influence of unusually high sentence counts. Appendix B.3 also defines alternatives that test whether the results depend on the particular way these inputs are counted.
3.2.2. Climate Risk Disclosure Specificity
Building on the distinction between generic climate language and substantive, checkable reporting [6,7], let Cit denote the number of distinct climate disclosure sentences attributable to the firm and Sit the subset containing specific, checkable information. Under the coding protocol, C includes both specific and generic company statements about climate risks, responses, governance, performance, targets, and explicitly climate-related transition opportunities; macro-policy descriptions and third-party statements are excluded. To enter S, a sentence must provide an identifiable basis for examination: a climate metric with a defined scope, a specific link between firm operations and climate exposure, an implemented action with concrete details, a testable target with a deadline or milestone, or an identifiable accounting method or boundary. A date, technical term, or unrelated financial number alone is insufficient. The score is:
CRDSit = 100 × Sit/Cit, for Cit > 0.
For the full-sample specification, we extend the score to zero when usable source text contains no identified company climate disclosure (C = 0). This is distinct from a report that contains company climate disclosure but no specific statement (C > 0, S = 0). The former describes whether qualifying disclosure is identified; the latter describes its content. Reports with unavailable text or only unresolved attribution candidates are not assigned zero. Before tail treatment, the positive-denominator ratio ranges from 0 to 100. We report the three disclosure states separately and estimate an additional model restricted to C > 0, retaining general-only disclosures at zero.
CRDS captures the specificity and checkability of disclosed climate information. A named project, implementation date, measurement boundary, or relevant quantity gives readers a concrete basis for examining a company’s claim. Cannon et al. [8] distinguish detail from verifiability, while Maji and Boruah [7] use specificity, quantification, and firm-specific content to distinguish symbolic from substantive climate disclosure. These studies support our focus on checkable content. CRDS measures whether the text provides an identifiable basis for scrutiny; it does not determine whether the underlying claim is factually accurate or externally assured.
We normalize the text, divide it into sentences, and remove exact duplicates within each firm year. A rule-based extraction program assigns sentence-level classifications for company attribution, climate relevance, and specificity, which are aggregated into C and S. The source corrections described in Appendix A.3 are applied before the revised measures are calculated. Two human coders independently classified a stratified sample of 300 sentences. Appendix A.4 describes the review procedure; Table A2 reports inter-coder agreement, Table A3 compares the program with each human coder for the specific category, and Table A4 provides translated source examples and classification rationales. The dictionary is adapted to the reporting context, following Loughran and McDonald [26].
3.2.3. Control and Moderating Variables
The controls address differences in financial capacity, growth opportunities, governance, and the volume of text available for measurement. Firm size, leverage, profitability, revenue growth, operating cash flow, and Tobin’s Q cover financial conditions; board size and independence, ownership concentration, CEO–chair duality, state ownership where estimable, and listing age cover governance and organizational characteristics. MD&A and investor-question lengths account for differences in the amount of observable text. Institutional ownership (INST), media coverage (MEDIA), and investor-question volume (QV) additionally capture visibility and information demand that may be correlated with analyst following. Table 1 gives the definitions and sources.
Analyst attention is AAit = ln(1 + Analystsit), where Analysts is the number of analysts following the firm in fiscal year t according to CSMAR.
Institutional ownership (INST) is the annual institutional-shareholding percentage from CSMAR divided by 100 and enters as a financial control. Media coverage (MEDIA) is ln(1 + the number of media reports about the firm), taken from the logged total-coverage series in CNRDS. Investor-question volume (QV) is ln(1 + the number of questions posted about the firm on the Shanghai and Shenzhen exchange interaction platforms in calendar year t). These variables are matched by firm code and year.
ClimateExposure is the CCPRI value for the firm’s registered city in the corresponding year. Higher values indicate greater city-level physical climate risk.
Table 1.
Variable definitions.
3.2.4. Data Treatment and Variable Transformations
We winsorize AII, CRDS, their continuous alternative measures, and the controls INST, MEDIA, and QV at the pooled 1st and 99th percentiles of nonmissing observations in the initial sample. This is done after constructing each measure and before applying the complete-case and singleton exclusions for particular models. Other continuous controls and AA enter from the already winsorized series. Binary indicators are left unchanged. The published city climate-risk index is used on its original scale in the main interaction model; Section 4.4 reports a robustness test after winsorizing that index at the pooled 1st and 99th percentiles.
After winsorization, AII ranges from 0 to 1.099 and CRDS from 0 to 28.571 percentage points. To examine whether large positive CRDS scores drive the association, we apply the inverse hyperbolic sine, IHS(CRDS) = ln[CRDS + √(CRDS2 + 1)]; it is defined at zero and compresses larger values. A separate within-year rank assigns the average rank to ties and divides it by the number of nonmissing observations, so the resulting scale is approximately 0 to 1. Both transformations start from the treated CRDS series. One- and two-year lags and the one-year lead of AII are matched to actual calendar years from the treated AII series.
3.3. Empirical Models
3.3.1. Baseline Model and Additional Tests
CRDSit = αi + λt + β AIIit + γ′ Controlsit + εit.
Here, i and t denote firm and year; αi and λt are firm and year fixed effects, and Controls contains the variables in Table 1. Standard errors are clustered by firm. Additional specifications include firm-specific linear trends, industry-by-year and province-by-year fixed effects, one- and two-year lags of AII, and a one-year lead of AII.
Measurement tests use alternative indicators of AI investment and climate disclosure specificity, together with the IHS and within-year rank transformations of CRDS. The alternative investment measures capture any qualifying AI resource input, input-sentence density, current or ongoing inputs, and investment sentences excluding overlap with climate disclosure. Appendix A.2 defines quantitative climate content, Appendix B.3 defines the alternative AI investment measures, and Section 3.2.4 explains the IHS and within-year rank transformations. A two-part analysis estimates a linear probability model for the presence of positive CRDS and a linear model for CRDS among positive-score observations; both include the baseline controls and fixed effects. To separate the two kinds of zero, we also estimate the level model among reports with C > 0, including reports with only general statements. A further coding sensitivity excludes observations with unresolved attribution candidates. Ownership and industry comparisons use pooled models with group-specific slopes for AII and the controls, group-specific firm and year effects, and firm-clustered inference; a Wald test evaluates equality of the AII coefficients.
3.3.2. Moderation Models
CRDSit = αi + λt + β1 AIIit + β2 Zit + β3 AIIit × Zit + γ′ Controlsit + εit, Z ∈ {AA, ClimateExposure}.
Z denotes analyst attention (AA) or physical climate exposure (ClimateExposure), each entered in a separate model. Both models include AII, the moderator, and their interaction. The AA model tests H2; the climate-exposure model provides a supplementary test of the climate context. The variables are not mean-centered, so β1 is the AII coefficient at Z = 0 and β1 + β3Z is the conditional slope.
4. Empirical Results
4.1. Descriptive Statistics and Sample Composition
Table 2 describes the analysis variables. Mean AII is 0.043, with a standard deviation of 0.189. CRDS averages 0.652 percentage points, with a standard deviation of 3.741. Of the 21,550 observations with an observed score, 15,042 (69.80%) contain no identified company climate disclosure, 5715 (26.52%) contain company climate statements but no specific statement, and 793 (3.68%) contain specific content. These are different reporting states, although the first two both enter the extended full-sample score at zero. The resulting zero share is 96.32%. The narrow company-attribution and specificity rules, and the restriction to MD&A or the identified substitute chapter, define what this distribution measures. In the baseline estimation sample, the corresponding counts are 15,022, 5693, and 788, totaling 21,503. Table A1 reports the composition, and Section 4.3 separates disclosure occurrence from content among disclosers.
Table 2.
Descriptive statistics of the analysis variables.
This composition distinguishes two reporting decisions relevant to the analysis. A firm may discuss climate matters without supplying a specific account of its own exposure or response, while a report without an identified company climate statement provides no basis for calculating a within-disclosure content share. The full-sample score combines these states when asking whether specific content is present. The conditional analyses below separate them to show which part of the reporting process is associated with AI investment.
4.2. Baseline Results
Table 3 estimates the AII–CRDS relationship with firm and year fixed effects. Column (1) omits the firm-level controls and yields an AII coefficient of 0.622; column (2) includes the financial, governance, and reporting controls in Table 1 and yields 0.551 (firm-clustered standard error = 0.209, p = 0.009). The association remains positive when these observed characteristics enter the model. Firm effects account for stable differences among firms, and year effects account for shocks common to all firms in a year.
Table 3.
Baseline regressions.
The absolute magnitude is modest. Using the baseline-sample standard deviation of AII (0.188928), the reported coefficient of 0.551 implies approximately 0.104 percentage points of CRDS for a one-standard-deviation difference in AII. An approximate 95% interval, calculated from the underlying coefficient and firm-clustered standard error, is 0.026 to 0.182 percentage points. Relative to the baseline-sample mean of 0.648 (compared with 0.652 for all observed scores in Table 2), the point estimate is about 16.0%, but this relative figure reflects the low mean and should not be interpreted as a large absolute change. These baseline results support the positive association proposed in H1 while indicating a modest economic magnitude.
The reporting margin helps place this magnitude in context. With specific content identified in 3.665% of baseline observations, an association with its occurrence concerns the availability of company information that readers would otherwise not find under the coding criteria. This differs from a claim that firms already providing specific information substantially expand their share. Section 4.3 examines these possibilities separately, so the economic interpretation follows the reporting behavior observed rather than the significance of the baseline coefficient alone.
4.3. Robustness and Supplementary Tests
Table 4 examines whether the baseline result depends on how climate content is scaled. The first row narrows the numerator of CRDS to statements containing climate-related quantities with an identifiable unit or basis; its AII coefficient is 0.060 (p = 0.594) and is not statistically significant. This stricter test asks about quantified details, whereas the baseline also counts identifiable exposures, implemented actions, and testable targets. The next two rows retain the baseline content rules but change the scale of CRDS: the inverse-hyperbolic-sine transformation reduces the influence of large positive scores while retaining zeros, and the within-year rank compares firms in the same reporting year. Their AII coefficients are 0.098 (p = 0.012) and 0.013 (p = 0.021), respectively, on 21,503 observations. For a one-standard-deviation change in AII, these are about 0.018 IHS units and 0.249 percentile points on the rank scale.
Table 4.
Robustness and supplementary tests.
The following four rows ask whether the finding is particular to counting all qualifying AI-input sentences. An indicator for at least one qualifying input captures the extensive margin and has a coefficient of 0.492 (p = 0.005). Scaling the count by MD&A length gives an input-sentence density coefficient of 0.355 (p = 0.063), addressing the possibility that longer reports simply contain more sentences. Restricting inputs to activity explicitly current or ongoing gives 0.306 (p = 0.140), which is not statistically significant. Finally, removing AI-input sentences that also enter the climate-disclosure sentence set gives 0.523 (p = 0.009). This last test addresses direct overlap between the two text measures; the result does not rely solely on sentences counted in both.
The remaining rows examine timing and omitted conditions shared across firms. Using the previous year’s AII gives 0.320 on 16,559 observations; a two-year lag gives 0.315 on 13,450 observations. Neither estimate is statistically significant, so these tests do not extend H1 to a persistent lagged relationship. The one-year lead gives −0.103, which is also insignificant; it is a timing diagnostic rather than proof that reverse causation has been eliminated. With industry-by-year and province-by-year fixed effects, the AII coefficient is 0.649 (p = 0.003), allowing common shocks to differ by sector and location over time. Adding firm-specific linear trends yields 0.552 (p = 0.040). These changes in outcome scale, input definition, overlap, and common-shock controls show where the positive contemporaneous pattern behind H1 persists; the stricter content and timing estimates set its empirical limits.
Table 5 examines the following two aspects of climate disclosure: whether a report contains specific climate information and the share of such information among reports that already contain it. Column (1) estimates a linear probability model for CRDS > 0. The AII coefficient is 0.0260 (p = 0.023), equivalent to approximately 0.491 percentage points for a one-standard-deviation difference in AII, against a baseline positive-score rate of 3.665%. Firms with greater AI investment are thus more likely to report at least one specific, checkable climate statement. Column (2) retains only observations with positive CRDS and examines the specific-information share within those reports. The unrounded AII coefficient is −1.4672 (SE = 3.1233, p = 0.639) and is not statistically significant. Of the 788 positive-score observations in the baseline sample, 475 observations from 186 firms remain after 313 fixed-effect singletons are removed.
Table 5.
Two-part analysis of the specificity of climate disclosures.
Column (3) estimates CRDS only where company climate disclosure is identified (C > 0), retaining general-only reports at zero. This separates the conditional content relationship from the comparison between nondisclosers and disclosers. The AII coefficient is 2.2522 (SE = 0.8885, p = 0.0113, and N = 5925). The estimate supports a positive association within reports containing company climate disclosure, including general-only reports. The 6481 eligible baseline observations yield 5925 observations from 1678 firms after removing 556 singletons under the conditional-sample fixed effects.
Columns (2) and (3) address different questions. Column (2) compares only reports that already contain specific information. Column (3) also includes reports containing general statements only, so its score reflects the distinction between general and specific disclosure. The positive estimate in column (3) is consistent with the presence-of-information result in column (1); it does not imply a significant conditional-share relationship in column (2). Together, these findings clarify the baseline association: firms with greater AI investment are more likely to provide specific, checkable climate information. Among firms already providing such information, the estimate for its share is not statistically significant, leaving its relationship with AI investment inconclusive.
The attribution sensitivity excludes firm years with unresolved company-climate candidates and retains the existing AII, CRDS, controls, and tail treatment. Its AII coefficient is 0.476 (SE = 0.197, p = 0.0158, and N = 20,659). The positive association also appears after this restriction, reducing dependence on observations with unresolved attribution candidates.
4.4. Analyst Attention and Physical Climate Exposure
Table 6 examines H2’s argument that external attention affects whether AI-related processing capacity is reflected in specific public climate information. Column (1) interacts AII with analyst attention and includes both main effects, the baseline controls, and firm and year fixed effects. The interaction coefficient is 0.5359 (standard error = 0.2187, p = 0.014), consistent with H2. Analysts can scrutinize the firm’s explanation of risks and plans, giving managers stronger incentives to translate available information-processing resources into specific public reporting. The positive interaction supports the predicted complementarity between AI investment and analyst attention.
Table 6.
Moderation by analyst attention and physical climate exposure.
Column (2) interacts AII with the physical climate-risk index of the firm’s registered city. The interaction coefficient is 0.0888 (standard error = 0.0427, p = 0.037). Column (3) repeats the model after winsorizing ClimateExposure at its pooled 1st and 99th percentiles (14.029 and 44.236). The interaction remains positive at 0.0856 (standard error = 0.0436, p = 0.049). Its similar magnitude shows that the value of 132.240 and the rest of the upper tail do not drive the interaction. Both columns indicate a more positive association at higher city-level exposure, consistent with the greater salience of climate information. The index describes conditions at the registered city and does not identify the location of each asset or the exact application of an AI system.
4.5. Heterogeneity Analysis
Table 7 compares the AII–CRDS association across ownership and industry groups. The coefficients are 0.458 for non-state-owned firms and 0.825 for state-owned firms, and 0.651 for nonmanufacturing firms and 0.349 for manufacturing firms. These estimates describe the relationship within each group under the same control-variable and fixed-effect specification.
Table 7.
Heterogeneity by ownership and manufacturing status.
Wald tests indicate no statistically significant between-group differences in the AII coefficient, with p-values of 0.515 for ownership groups and 0.471 for industry groups. The subgroup results therefore describe associations within each group without establishing a stronger association in one group.
5. Conclusions, Implications, and Limitations
5.1. Conclusions and Relation to Prior Research
For Chinese listed firms during 2014–2023, reported AI resource inputs are significantly positively associated with climate risk disclosure specificity. The full-model estimate remains positive with financial, governance, and reporting controls and firm and year fixed effects. Its absolute economic magnitude is modest: a one-standard-deviation difference in AII corresponds to an estimated 0.104-percentage-point difference in CRDS. Alternative outcome scales, exclusion of shared AI–climate sentences, and richer industry–year and province–year controls give compatible positive estimates, although the strictly quantitative outcome and lagged AII specifications are not statistically significant.
The two-part analysis clarifies the reporting behavior represented by the baseline association. Firms with greater AI investment are more likely to disclose at least one specific, checkable climate statement. Among firms already providing such information, its share is not significantly associated with AI investment. The positive association also remains when the sample is restricted to climate disclosers but includes reports containing general statements only. The evidence therefore concerns the provision of specific climate information; it does not establish that AI investment raises the specific-information share throughout the positive-score subsample or that corporate claims are factually accurate.
Analyst attention strengthens the AII–CRDS association, consistent with the role of external information demand. The supplementary climate-exposure interaction is positive in both the original model and the 1%/99% winsorized-index robustness test. The between-group tests show no significant differences by ownership or manufacturing status. Taken together, the results connect reported AI resource inputs to a defined textual feature of climate reporting, while the modest magnitude, mixed supplementary estimates, and coding uncertainty set clear limits on the interpretation.
5.2. Practical Implications
For boards and managers, the findings point to the reporting value of connecting AI resource planning with the preparation of climate information. A firm can specify which operating data support statements about exposure, mitigation actions, targets, or performance, identify the person or unit responsible for those data, and preserve the relevant scope and measurement basis. These steps help move a report from generic commitment language toward statements that readers can assess. They do not require every climate claim to contain a number: a defined risk to a particular activity or an implemented response can also be informative.
For analysts and investors, the distinction between a general pledge and a company-attributable, checkable claim offers a practical way to read annual reports. It directs attention to the basis of a firm’s statements and to whether an AI initiative has a plausible reporting application, rather than treating the presence of AI terms as evidence of better disclosure. Analyst following and city-level climate exposure provide context for comparing firms, while the positive-score analysis cautions against inferring that every firm with specific content necessarily provides more of it as AI investment rises.
5.3. Limitations and Future Research
The role of analyst attention may differ in markets where climate reporting is mandatory or investor communication relies on other channels. Comparing firms subject to different disclosure regimes would help establish whether external scrutiny remains complementary to AI investment when reporting obligations are more standardized.
The analysis identifies reported AI resource commitments at the firm-year level and does not distinguish projects used for risk assessment, report preparation, or production. The proposed information-processing mechanism is therefore not directly identified. Future research could link project implementation dates and specific applications to subsequent reporting changes, clarifying which uses of AI contribute to disclosure and when those benefits emerge. A second limitation concerns text classification. Conditional inter-coder agreement for specificity is moderate (κ = 0.5036), and the direct program–coder comparisons show nontrivial classification disagreement. CRDS may therefore contain measurement error, including missed specific statements under the conservative coding rules. Larger independently coded validation samples and application-linked source data would allow future research to refine the measure and test whether more specific disclosure is accompanied by energy-efficiency investment, adaptation measures, financing effects, or other corporate outcomes.
Author Contributions
Conceptualization, Y.G., J.T., Y.Z. and Z.T.; methodology, Y.G., J.T., Y.Z. and Z.T.; formal analysis, Y.G., J.T., Y.Z. and Z.T.; writing—original draft preparation, Y.G., J.T., Y.Z. and Z.T.; writing—review and editing, Y.G., J.T., A.M.A., Y.Z. and Z.T.; supervision, A.M.A. All authors have read and agreed to the published version of the manuscript.
Funding
This research received no external funding.
Institutional Review Board Statement
Not applicable.
Informed Consent Statement
Not applicable.
Data Availability Statement
The authors do not have permission to share the data used in this study.
Conflicts of Interest
The authors declare no conflicts of interest.
Appendix A. Climate Disclosure Coding Protocol
Appendix A.1. Unit, Scope, and Company Attribution
The unit of analysis is a distinct sentence in annual-report MD&A text or an identified board-report substitute, as described in Section 3.2. Chinese sentence-final punctuation and semicolons delimit sentences; decimal points do not. Text normalization and removal of whitespace identify exact duplicates, which are counted once within each firm-year. Each retained sentence is linked to its source text.
Candidate climate content covers physical weather hazards, climate-policy and carbon-transition risks, climate responses and governance, emissions and energy-related performance, and explicitly climate-related business opportunities. Attribution to the firm is established from the sentence, identified company or controlled-subsidiary names, the report section, and bounded adjacent context. Nearby climate context is normally limited to two sentences. A continuous energy or climate list with an explicit anchor may extend to six subsequent sentences, but inherited context does not renew the anchor. A new topic, third-party speaker, or discussion confined to financial matters ends this inheritance. General policy commentary does not qualify as company disclosure simply because it appears in an annual report.
Appendix A.2. Specificity and Quantitative Content
As defined in Section 3.2.2, C counts all climate statements attributable to the company, including generic aspirations; S counts the subset with specific content: (i) a climate-linked quantity with its object, unit, comparator, or accounting scope; (ii) an identifiable business activity or asset linked to a specific exposure or consequence; (iii) an implemented response with an identifiable object or implementation detail; (iv) a target with a measurable completion criterion and a deadline or milestone; or (v) a checkable climate-accounting method, boundary, or technical implementation. The same rules apply to positive and negative information. Weather-related exposure is coded separately from any explicit attribution to anthropogenic climate change.
The stricter quantitative subset contains statements in S with a climate-linked quantity and a relevant unit, object, or accounting basis. Unrelated revenue figures, year labels, awards, product model numbers, and generic technical parameters do not qualify. A low-carbon project’s capacity may describe transition activity without demonstrating emissions reductions. AI vocabulary or sentence length alone cannot establish specificity. The quantitative alternative equals 100 times the quantitative subset count divided by C and follows the main outcome’s rules for zero and missing values.
Appendix A.3. Zero, Missing, and Reproducibility Rules
When C > 0, the ratio is computed from sentences with confirmed company and climate attribution. Candidate sentences with unclear attribution are recorded separately and do not enter this confirmed denominator. A full-sample zero is assigned when usable text has C = 0 and no unresolved company-climate candidate remains; unavailable text and cases with no confirmed disclosure but unresolved candidates remain missing. The three states in Table A1 distinguish nondetection, general-only disclosure, and specific disclosure. The additional C > 0 model retains general-only reports, and the attribution-candidate sensitivity is reported alongside it.
The full-sample C and S counts are generated by the rule-based extraction procedure above, using the archived sentence-level classifications. The coding records retain source links, inclusion decisions, and exclusion reasons. To check external attribution, we searched the archived candidate-sentence pool for repeated passages and policy- or industry-attribution patterns and then inspected each flagged occurrence in its source context. This targeted source verification identified 26 firm-year sentence occurrences about external policies or industry conditions, including exact-text repeats across firm years. The 26 occurrences were removed from the company-climate counts, and the measures, tail treatment, and reported regressions were recalculated. The verification covered the flagged candidate occurrences; it was not a line-by-line manual review of every sentence in every annual report. Apart from these documented source corrections, the final counts retain the rule-based classifications.
Table A1.
Composition of the observed disclosure score.
The first state concerns nondetection in the extracted MD&A or identified substitute chapter, not the absence of disclosure throughout the annual report or other publications. The baseline column reproduces complete-case selection and iterative firm/year singleton removal; its 21,503 observations match Table 3.
Appendix A.4. Coding Review and Disclosure States
The 300-sentence review evaluates both inter-coder consistency and the program’s classification performance. The review sample contains 300 source sentences drawn from the archived candidate-sentence pool, stratified by year (2014–2023) and the extraction program’s initial classification. Each year contributes 10 specific, 10 general, eight excluded, and two unresolved-attribution sentences. Two human coders independently reviewed the source text and relevant context, assessing company attribution, climate relevance, and specificity under a common coding protocol. Each coder submitted a separate set of classifications without consulting the other coder’s judgments. Table A2 reports percentage agreement and Cohen’s κ between the two human coding sets before reconciliation; κ adjusts for chance agreement [27].
Agreement is reported separately for company attribution, climate relevance, and specificity. The full-sample specificity comparison retains the distinct categories “not applicable” and “unable to judge”. We also report yes/no specificity agreement within the 148 sentences that both coders identify as company-attributable climate disclosure. The conditional specificity agreement is 74.32% and κ = 0.5036, indicating moderate agreement and a potential source of measurement error for CRDS. Table A3 directly compares the program’s initial specific/not-specific classification with each coder’s independent specificity label. For coder A, precision is 0.670 and recall is 0.638; for coder B, precision is 0.500 and recall is 0.725. These are diagnostic statistics for the deliberately stratified 300-sentence sample, not population-wide accuracy estimates.
The 67 sentences with a difference between the two human coding sets remain recorded with both labels and their reasons; no consensus label was substituted solely on the basis of this comparison. The program–coder results and the moderate conditional κ are therefore treated as evidence of classification uncertainty rather than as validation of the factual accuracy of corporate claims.
Table A2.
Agreement between two human coders.
Table A3.
Comparison of program and human specificity classifications in the 300-sentence validation sample.
Table A4.
Illustrative source sentences and coding decisions.
Source identifiers give the firm code, reporting year, and research sentence identifier; parentheses contain the validation-sample identifier. S identifiers refer to fixed research sentence units rather than printed annual-report sentence numbers. Source texts are Chinese annual-report extracts, and the excerpts are author translations. Both coders agree on the climate relevance, company attribution, and specificity of these examples.
Appendix B. AI Resource-Input Coding Protocol
Appendix B.1. AI-Specific Vocabulary
The dictionary covers the Chinese-language equivalents of artificial intelligence, machine learning, deep learning, neural networks, natural language processing, computer vision, machine vision, speech recognition, image recognition, knowledge graphs, expert systems, reinforcement learning, generative AI, and large language models. A term match identifies a candidate sentence; inclusion also requires the resource and attribution criteria below.
Appendix B.2. Resource Evidence and Exclusions
The sentence containing an AI term must describe a resource action attributable to the firm or a controlled subsidiary. Under the contextual rules, the AI term and resource action must be no more than 100 characters apart. The preceding sentence and identified company aliases may help establish attribution, but the resource action must occur in the sentence containing the AI term. Eligible evidence includes concrete AI research or development, paid procurement or licensing, identified funding commitments, and inputs involving AI personnel, teams, laboratories, or organizational resources. Sentences are normalized and exactly deduplicated before counts are aggregated.
We exclude generic digitalization, ordinary software and computer assets without AI-specific evidence, descriptions of other firms or industry trends, capability slogans, negated activity, passive equity holdings, and future plans without evidence of implementation. Historical activity alone does not establish a current or ongoing input. Adoption or deployment qualifies only when resource evidence is present. Usable text with no qualifying sentence receives A = 0; unavailable or insufficiently usable text is not assigned zero. The counts represent distinct sentences containing evidence and need not equal the number or monetary value of projects.
Appendix B.3. Alternative AI Investment Measures
Four alternative measures assess different aspects of reported AI investment. The any-input indicator equals one if at least one sentence meets the AI resource-input criteria and zero otherwise. Input-sentence density is the number of qualifying sentences per 10,000 Chinese characters of MD&A. The current-or-ongoing input indicator equals one when a qualifying sentence explicitly refers to the reporting period or a continuing activity, and zero otherwise. The overlap-excluded measure is ln(1 + the number of qualifying AI input sentences remaining after removing sentences that also enter the company-climate disclosure set used to construct CRDS).
All four measures use the technology, company-attribution, and resource-evidence criteria described above. They are reported under these descriptive names in Table 4.
References
- IFRS Foundation. IFRS S2 Climate-Related Disclosures. 2023. Available online: https://www.ifrs.org/issued-standards/ifrs-sustainability-standards-navigator/ifrs-s2-climate-related-disclosures/ (accessed on 24 October 2026).
- Ilhan, E.; Krueger, P.; Sautner, Z.; Starks, L.T. Climate risk disclosure and institutional investors. Rev. Financ. Stud. 2023, 36, 2617–2650. [Google Scholar] [CrossRef] [Scilit]
- Shanghai Stock Exchange. SSE E-interaction Platform Opened to Facilitate Communication of Investors, Listed Companies. 2013. Available online: https://english.sse.com.cn/news/newsrelease/c/4947480.shtml (accessed on 24 October 2026).
- China Securities Regulatory Commission. CSRC Issues Guidelines for Investor Relations Management of Listed Companies. 2022. Available online: https://www.csrc.gov.cn/csrc/c100028/c2334692/content.shtml (accessed on 24 October 2026). (In Chinese)
- Yang, B.; Zhu, C.; Xiang, C.; Cao, Y. Honesty pays off: Climate risk disclosure credibility and firm value. Financ. Res. Lett. 2025, 86, 108414. [Google Scholar] [CrossRef] [Scilit]
- Bingler, J.A.; Kraus, M.; Leippold, M.; Webersinke, N. How cheap talk in climate disclosures relates to climate initiatives, corporate emissions, and reputation risk. J. Bank. Financ. 2024, 164, 107191. [Google Scholar] [CrossRef] [Scilit]
- Maji, S.G.; Boruah, R. Measuring climate disclosure credibility: Symbolic versus substantive reporting under TCFD in G7 economies. Corp. Soc. Responsib. Environ. Manag. 2026, e70991. [Google Scholar] [CrossRef] [Scilit]
- Cannon, J.N.; Denison, C.A.; Watanabe, O.V. Do detail and its verifiability serve as indicators of strategy effectiveness and as sources of credibility in voluntary qualitative disclosure? J. Account. Audit. Financ. 2021, 36, 557–584. [Google Scholar] [CrossRef] [Scilit]
- Babina, T.; Fedyk, A.; He, A.; Hodson, J. Artificial intelligence, firm growth, and product innovation. J. Financ. Econ. 2024, 151, 103745. [Google Scholar] [CrossRef] [Scilit]
- Mikalef, P.; Gupta, M. Artificial intelligence capability: Conceptualization, measurement calibration, and empirical study on its impact on organizational creativity and firm performance. Inf. Manag. 2021, 58, 103434. [Google Scholar] [CrossRef] [Scilit]
- Wang, M.; Yu, X.; Feng, S.; Xu, C. The application of artificial intelligence in corporate climate risk: Information disclosure, information advantage, and information prediction. J. Clean. Prod. 2025, 534, 147040. [Google Scholar] [CrossRef] [Scilit]
- Qin, W.; Song, L.; Zhang, Q.; Yuan, Z. Artificial intelligence and corporate sustainability disclosure: Evidence from corporate climate risk disclosure in China. Sustainability 2026, 18, 7313. [Google Scholar] [CrossRef] [Scilit]
- Huang, Y.; Xu, C. Artificial intelligence and environmental information disclosure: The roles of green innovation and corporate governance. Corp. Soc. Responsib. Environ. Manag. 2026. Epub ahead of printing. [Google Scholar] [CrossRef] [Scilit]
- Lin, W.; Wang, Y.; Zhang, Q.; Peron, M.; Lu, J. Emerging opportunities or paradoxes: Assessing the effect of digital technology adoption on corporate carbon performance. J. Environ. Manag. 2025, 391, 126399. [Google Scholar] [CrossRef] [Scilit] [PubMed]
- Wei, T.; Zhu, Q.; Liu, W. The effect of market-based environmental regulations on green technology innovation—The regulatory effect based on corporate social responsibility. Sustainability 2024, 16, 4719. [Google Scholar] [CrossRef] [Scilit]
- Galbraith, J.R. Organization design: An information processing view. Interfaces 1974, 4, 28–36. [Google Scholar] [CrossRef] [Scilit]
- Verrecchia, R.E. Discretionary disclosure. J. Account. Econ. 1983, 5, 179–194. [Google Scholar] [CrossRef] [Scilit]
- Verrecchia, R.E. Information quality and discretionary disclosure. J. Account. Econ. 1990, 12, 365–380. [Google Scholar] [CrossRef] [Scilit]
- Fedyk, A.; Hodson, J.; Khimich, N.; Fedyk, T. Is artificial intelligence improving the audit process? Rev. Account. Stud. 2022, 27, 938–985. [Google Scholar] [CrossRef] [Scilit]
- China Baowu. Making Carbon Data Traceable for Every Steel Coil: Baosteel Launches Its Smart Carbon Data Platform. 2022. Available online: https://www.baowugroup.com/glcmia/detail/277483 (accessed on 24 October 2026). (In Chinese)
- World Economic Forum. Against Economic Headwinds, 18 Manufacturing Lighthouses Show How to Boost Productivity and Sustainability by Scaling Advanced Technologies across Networks. 2023. Available online: https://www.weforum.org/media/against-economic-headwinds-18-manufacturing-lighthouses-show-how-to-boost-productivity-and-sustainability-by-scaling-advanced-technologies-across-networks/ (accessed on 24 October 2026).
- Yu, F. Analyst coverage and earnings management. J. Financ. Econ. 2008, 88, 245–271. [Google Scholar] [CrossRef] [Scilit]
- Fan, L.; Yao, S. Analyst site visits and corporate environmental information disclosure: Evidence from China. Int. J. Environ. Res. Public Health 2022, 19, 16223. [Google Scholar] [CrossRef] [Scilit] [PubMed]
- Guo, K.; Ji, Q.; Zhang, D. A dataset to measure global climate physical risk. Data Brief 2024, 54, 110502. [Google Scholar] [CrossRef] [Scilit] [PubMed]
- Guo, K.; Ji, Q.; Zhang, D. Climate Physical Risk Index (CPRI). Version 1. Available online: https://figshare.com/articles/dataset/Climate_Physical_Risk_Index_CPRI_/25562229/1 (accessed on 21 October 2026).
- Loughran, T.; McDonald, B. When is a liability not a liability? Textual analysis, dictionaries, and 10-Ks. J. Financ. 2011, 66, 35–65. [Google Scholar] [CrossRef] [Scilit]
- Cohen, J. A coefficient of agreement for nominal scales. Educ. Psychol. Meas. 1960, 20, 37–46. [Google Scholar] [CrossRef] [Scilit]

Disclaimer/Publisher’s Note: The statements, opinions and data contained in all publications are solely those of the individual author(s) and contributor(s) and not of MDPI and/or the editor(s). MDPI and/or the editor(s) disclaim responsibility for any injury to people or property resulting from any ideas, methods, instructions or products referred to in the content. |
© 2026 by the authors. Licensee MDPI, Basel, Switzerland. This article is an open access article distributed under the terms and conditions of the Creative Commons Attribution (CC BY) license.