


Abstract
Brand value is a strategic intangible asset that strengthens firms’ competitiveness and supports sustainable growth. This study examines the association between corporate environmental, social, and governance (ESG) performance and brand value using 8170 firm-year observations from Chinese A-share-listed companies during 2020–2024. Results show that ESG performance is positively and significantly associated with brand value. Mechanism analysis further indicates that innovation investment, proxied by annual firm-level R&D expenditure (INNO), mediates this association in the primary specification. The indirect effect remains positive when log-transformed R&D expenditure is used, whereas R&D intensity does not support the mediation effect. From a nonlinear perspective, the full-sample analysis identifies a significant single threshold in R&D expenditure, above which the ESG coefficient is significantly larger. Industry-level analyses show the same single-threshold pattern in both high-tech and traditional firms. Because R&D expenditure measures innovation input rather than realized innovation output, the estimated thresholds are interpreted as sample-specific empirical breakpoints rather than universal or optimal R&D-investment targets.
1. Introduction
In line with globalization, brands have emerged as the focal point of a new wave of international competition [1]. A robust brand image not only captures consumer attention but also assists enterprises in establishing a differentiation effect, thereby enhancing sustained competitive advantage [2]. Although Chinese enterprises have invested considerably in building brand value to gain a foothold in the international market, the resultant international influence of Chinese brands remains elusive [3,4]. Exploring how best to enhance brand value has become particularly crucial for China’s economic development.
Environmental, social, and governance (ESG) performance may shape brand value through a connected stakeholder–signal–resource-conversion process. Strong ESG performance can strengthen stakeholder trust and brand-related perceptions [5,6,7]. It can also reduce reputational risk and support differentiation [8,9,10]. These stakeholder responses and credible signals can improve access to financial, human, and knowledge resources, some of which firms may commit to innovation investment. In this study, that investment is proxied by annual R&D expenditure; it is treated as an input that may support later product and process improvements, not as evidence of realized technological innovation [11,12].
This study therefore examines both the mediating and threshold roles of innovation investment, proxied by annual R&D expenditure. Existing research reports mixed value implications of ESG [10]: stronger ESG performance may be associated with stakeholder trust, reputation, and firm value [5,6,13], but ESG activities may also absorb resources that could otherwise support core operations [14]. Li and Wang [15] document an ESG–brand value relationship through an R&D-related mediator. The remaining theoretical question is whether R&D expenditure also represents a complementary resource that changes the strength of the ESG–brand value association across investment regimes. The study addresses this question without treating R&D expenditure as realized innovation output.
Prior research suggests that ESG performance can influence technological innovation outcomes through financing, governance, and resource-allocation channels [16,17], and that innovation can contribute to product differentiation, operational efficiency, and firm value [18,19]. However, the empirical variable used in this study is narrower: annual R&D expenditure captures the resources committed to innovation activities rather than realized innovation outputs, such as new technologies or patents. Accordingly, the mediation analysis examines an innovation investment channel, whereas prior evidence on technological innovation outcomes provides a broader theoretical basis for understanding how such investment may subsequently translate into brand-related benefits [15,20].
R&D expenditure may also condition the ESG–brand value association. At low investment levels, firms may lack the absorptive and implementation capacity needed to convert ESG-related trust and stakeholder support into observable product, process, and brand-related benefits. Higher levels of R&D investment may strengthen this conversion capacity, whereas excessive or inefficient R&D expenditure may impose financial burdens and generate uncertain returns [21,22]. Accordingly, the relationship may exhibit one or more threshold effects. The main expectation is that the coefficient of ESG performance changes across R&D-expenditure regimes, while the empirical tests determine whether the data support a single- or multiple-threshold structure [20,23].
This study makes three contributions. First, building on prior work [15], it extends the mediation perspective by examining whether innovation investment also serves as a nonlinear boundary condition for the ESG–brand value association. This allows the study to assess not only whether innovation investment transmits the association between ESG performance and brand value, but also whether the strength of this association varies across different levels of R&D expenditure. Second, it integrates stakeholder theory, signaling theory, and the resource-based view into a resource-conversion framework. ESG performance can strengthen stakeholder support and signal credibility, thereby facilitating firms’ access to financial, human, and knowledge resources, while R&D expenditure represents an innovation input through which such resources may be deployed to generate brand-related outcomes. Third, it broadens the empirical coverage of ESG–brand value research by combining the Tsinghua CBRC brand-value measure with 8170 firm-year observations from 1634 Chinese A-share-listed firms, providing large-sample evidence from an emerging-market context.
The remainder of this paper is organized as follows. Section 2 reviews the relevant literature and develops the hypotheses. Section 3 describes the research design, data, variables, and empirical models. Section 4 reports and interprets the empirical findings. Section 5 concludes by summarizing the main results and outlining implications.
2. Literature Review and Hypotheses Development
2.1. ESG Performance and Brand Value
Brand value is widely regarded as a strategically significant intangible asset that enables enterprises to achieve price premiums, gain customer loyalty, and acquire long-term competitive advantages [24,25]. However, the factors contributing to the formation of brand value are diverse. As such, scholars have begun to assess whether ESG performance translates into brand value [26].
Early studies mainly explored the relationship between CSR and corporate reputation or other brand-related outcomes [27]. Based on stakeholder theory, scholars argued that enterprises are not only evaluated based on their financial performance, but also based on how they satisfy the interests of multiple stakeholders (including employees, consumers, communities, and the natural environment) [28,29]. As a key reputation asset, the brand provides an important perspective for stakeholders to assess the credibility and long-term orientation of the enterprise [30]. Empirical evidence shows that participation in CSR and sustainability disclosure can shift the attention of stakeholders from purely product attributes to the social and environmental behaviors of the enterprise, thereby promoting the formation of trust and reputation capital [31]. Subsequent studies have shown that there is a positive relationship between reputation capital and brand value, indicating that CSR practices constitute intangible assets related to the brand [32].
In recent years, ESG performance has been considered a more comprehensive and standardized framework for evaluating corporate social responsibility. Compared to traditional measures of corporate social responsibility, ESG performance encompasses the multidimensional participation of enterprises in sustainable development-related practices and provides more comparable information for external stakeholders [33,34]. From the perspective of signal transmission, outstanding ESG performance conveys a credible signal about the firm’s commitment to long-term value creation, risk management and responsible governance, thereby reducing information asymmetry and uncertainty faced by investors and consumers. Therefore, strong ESG performance enhances the confidence of stakeholders and improves the perception of the brand [7,35].
Furthermore, based on the resource-based view, ESG activities contribute to the accumulation of valuable, scarce, and difficult-to-imitate intangible resources, such as trust, legitimacy, and social capital [5,36]. Firms with outstanding ESG performance are more likely to gain the support of stakeholders and attract the attention of investors, thereby gaining an advantage in market competition and resource acquisition [37,38]. Intangible benefits integrated into corporate image can be transformed into sustainable brand value [39].
Although previous studies have shown a positive correlation between enterprises’ responsible behavior and brand-related outcomes, much is still to be learned about the relationship between ESG performance and brand value, especially in an emerging market such as China. The first hypothesis is as follows.
Hypothesis 1.
ESG performance is positively associated with firm brand value.
2.2. ESG Performance and Innovation Investment
Stakeholder theory and signaling theory jointly explain why ESG performance may be associated with innovation investment. Strong ESG performance can improve relationships with investors, employees, customers, suppliers, communities, and governments, thereby facilitating access to the financial, human, and knowledge resources required for costly and uncertain R&D projects. It can also signal stronger governance quality, lower non-financial risk, and a long-term strategic orientation, which may reduce information asymmetry and financing frictions [23,40,41]. These mechanisms may expand the resource base that firms can commit to R&D [42]. Because the empirical proxy is annual R&D expenditure, the hypothesis concerns innovation investment rather than innovation capabilities or realized innovation outcomes. R&D expenditure therefore represents resources committed to innovation activities rather than the broader capabilities and knowledge-conversion processes required to generate realized innovation outcomes [43].
Hypothesis 2.
ESG performance is positively associated with firm innovation investment.
2.3. Innovation Investment and Brand Value
Innovation investment may contribute to brand value by funding the development of products and processes that improve quality, functionality, environmental performance, and customer experience. When R&D projects yield commercially valuable outcomes, firms may respond more effectively to stakeholder expectations and changing market demand, thereby strengthening customer satisfaction, trust, brand recognition, and market competitiveness [44,45]. Sustained R&D expenditure may also signal a long-term commitment to technological development, although expenditure alone does not demonstrate that innovation outcomes have been realized [22]. From a resource-based perspective, R&D investment may facilitate the accumulation of knowledge, skilled human capital, organizational learning, and technological capabilities that can support product differentiation and stronger market positioning [21].
Accordingly, innovation investment, proxied by annual R&D expenditure, is expected to be positively associated with firm brand value because it finances the capabilities and activities through which product, process, and market differentiation may emerge.
Hypothesis 3.
Innovation investment is positively associated with firm brand value.
2.4. Mediating Role and Threshold Effect of Innovation Investment
Within the integrated theoretical framework, stakeholder theory explains why ESG performance may facilitate access to resources that support innovation investment. Firms that demonstrate stronger social and environmental responsibility may develop more durable relationships with key stakeholders and thereby gain access to the financial, human, and knowledge resources required for R&D [46,47,48]. ESG-related disclosure may further strengthen long-term stakeholder support and reduce resource constraints, encouraging firms to allocate more resources to R&D [49,50]. R&D expenditure may then support subsequent improvements in products, processes, and information systems [51]. To the extent that these improvements enhance customer satisfaction, stakeholder trust, and market recognition, they may contribute to the accumulation of brand-related intangible assets and, ultimately, brand value [52]. Importantly, the empirical analysis operationalizes innovation investment using R&D expenditure and therefore captures innovation input rather than realized innovation outcomes.
Signaling theory further explains how ESG-related resource advantages may operate under conditions of information asymmetry. Credible ESG practices may signal responsible governance and a long-term strategic orientation, thereby reducing agency and financing frictions and attracting investors willing to support uncertain R&D projects [19,53,54,55,56]. Sustained R&D expenditure may itself serve as a costly commitment to innovation activities, although it should not be interpreted as evidence of realized innovation outcomes such as patents or new technologies [21]. Accordingly, the mediating variable in this study represents innovation investment, proxied by annual R&D expenditure.
The resource-based view further explains how stakeholder support and signaling benefits may be converted into brand value. Trust, legitimacy, and reputational capital can contribute to competitive advantage when combined with complementary internal resources and capabilities [57]. Innovation investment provides an important input into this conversion process by supporting the development of knowledge, human capital, and technological capabilities needed to translate ESG-related resources into commercially valuable products, services, and process improvements. When R&D expenditure is relatively low, this conversion capacity may be constrained; as R&D investment increases, firms may be better able to deploy ESG-related resources, and the positive association between ESG performance and brand value may become stronger [58,59]. This perspective therefore provides a common theoretical basis for the mediation and threshold analyses.
Hypothesis 4.
Innovation investment mediates the positive association between ESG performance and firm brand value.
Innovation investment may also condition the ESG–brand value association in a nonlinear manner. At relatively low levels of R&D expenditure, firms may lack the complementary resources needed to convert ESG-related trust and legitimacy into commercially valuable products, services, and process improvements. As R&D investment increases, this conversion capacity may strengthen. However, because R&D activities are costly and their returns are uncertain, the strength of the ESG–brand value association may vary across different levels of R&D expenditure. Accordingly, the empirical analysis tests whether one or more threshold effects exist rather than imposing a single breakpoint a priori. Single-, double-, and triple-threshold specifications are therefore examined sequentially to determine the threshold structure supported by the data [23].
Hypothesis 5.
The positive association between ESG performance and brand value exhibits a threshold effect with respect to innovation investment.
2.5. Theoretical Framework
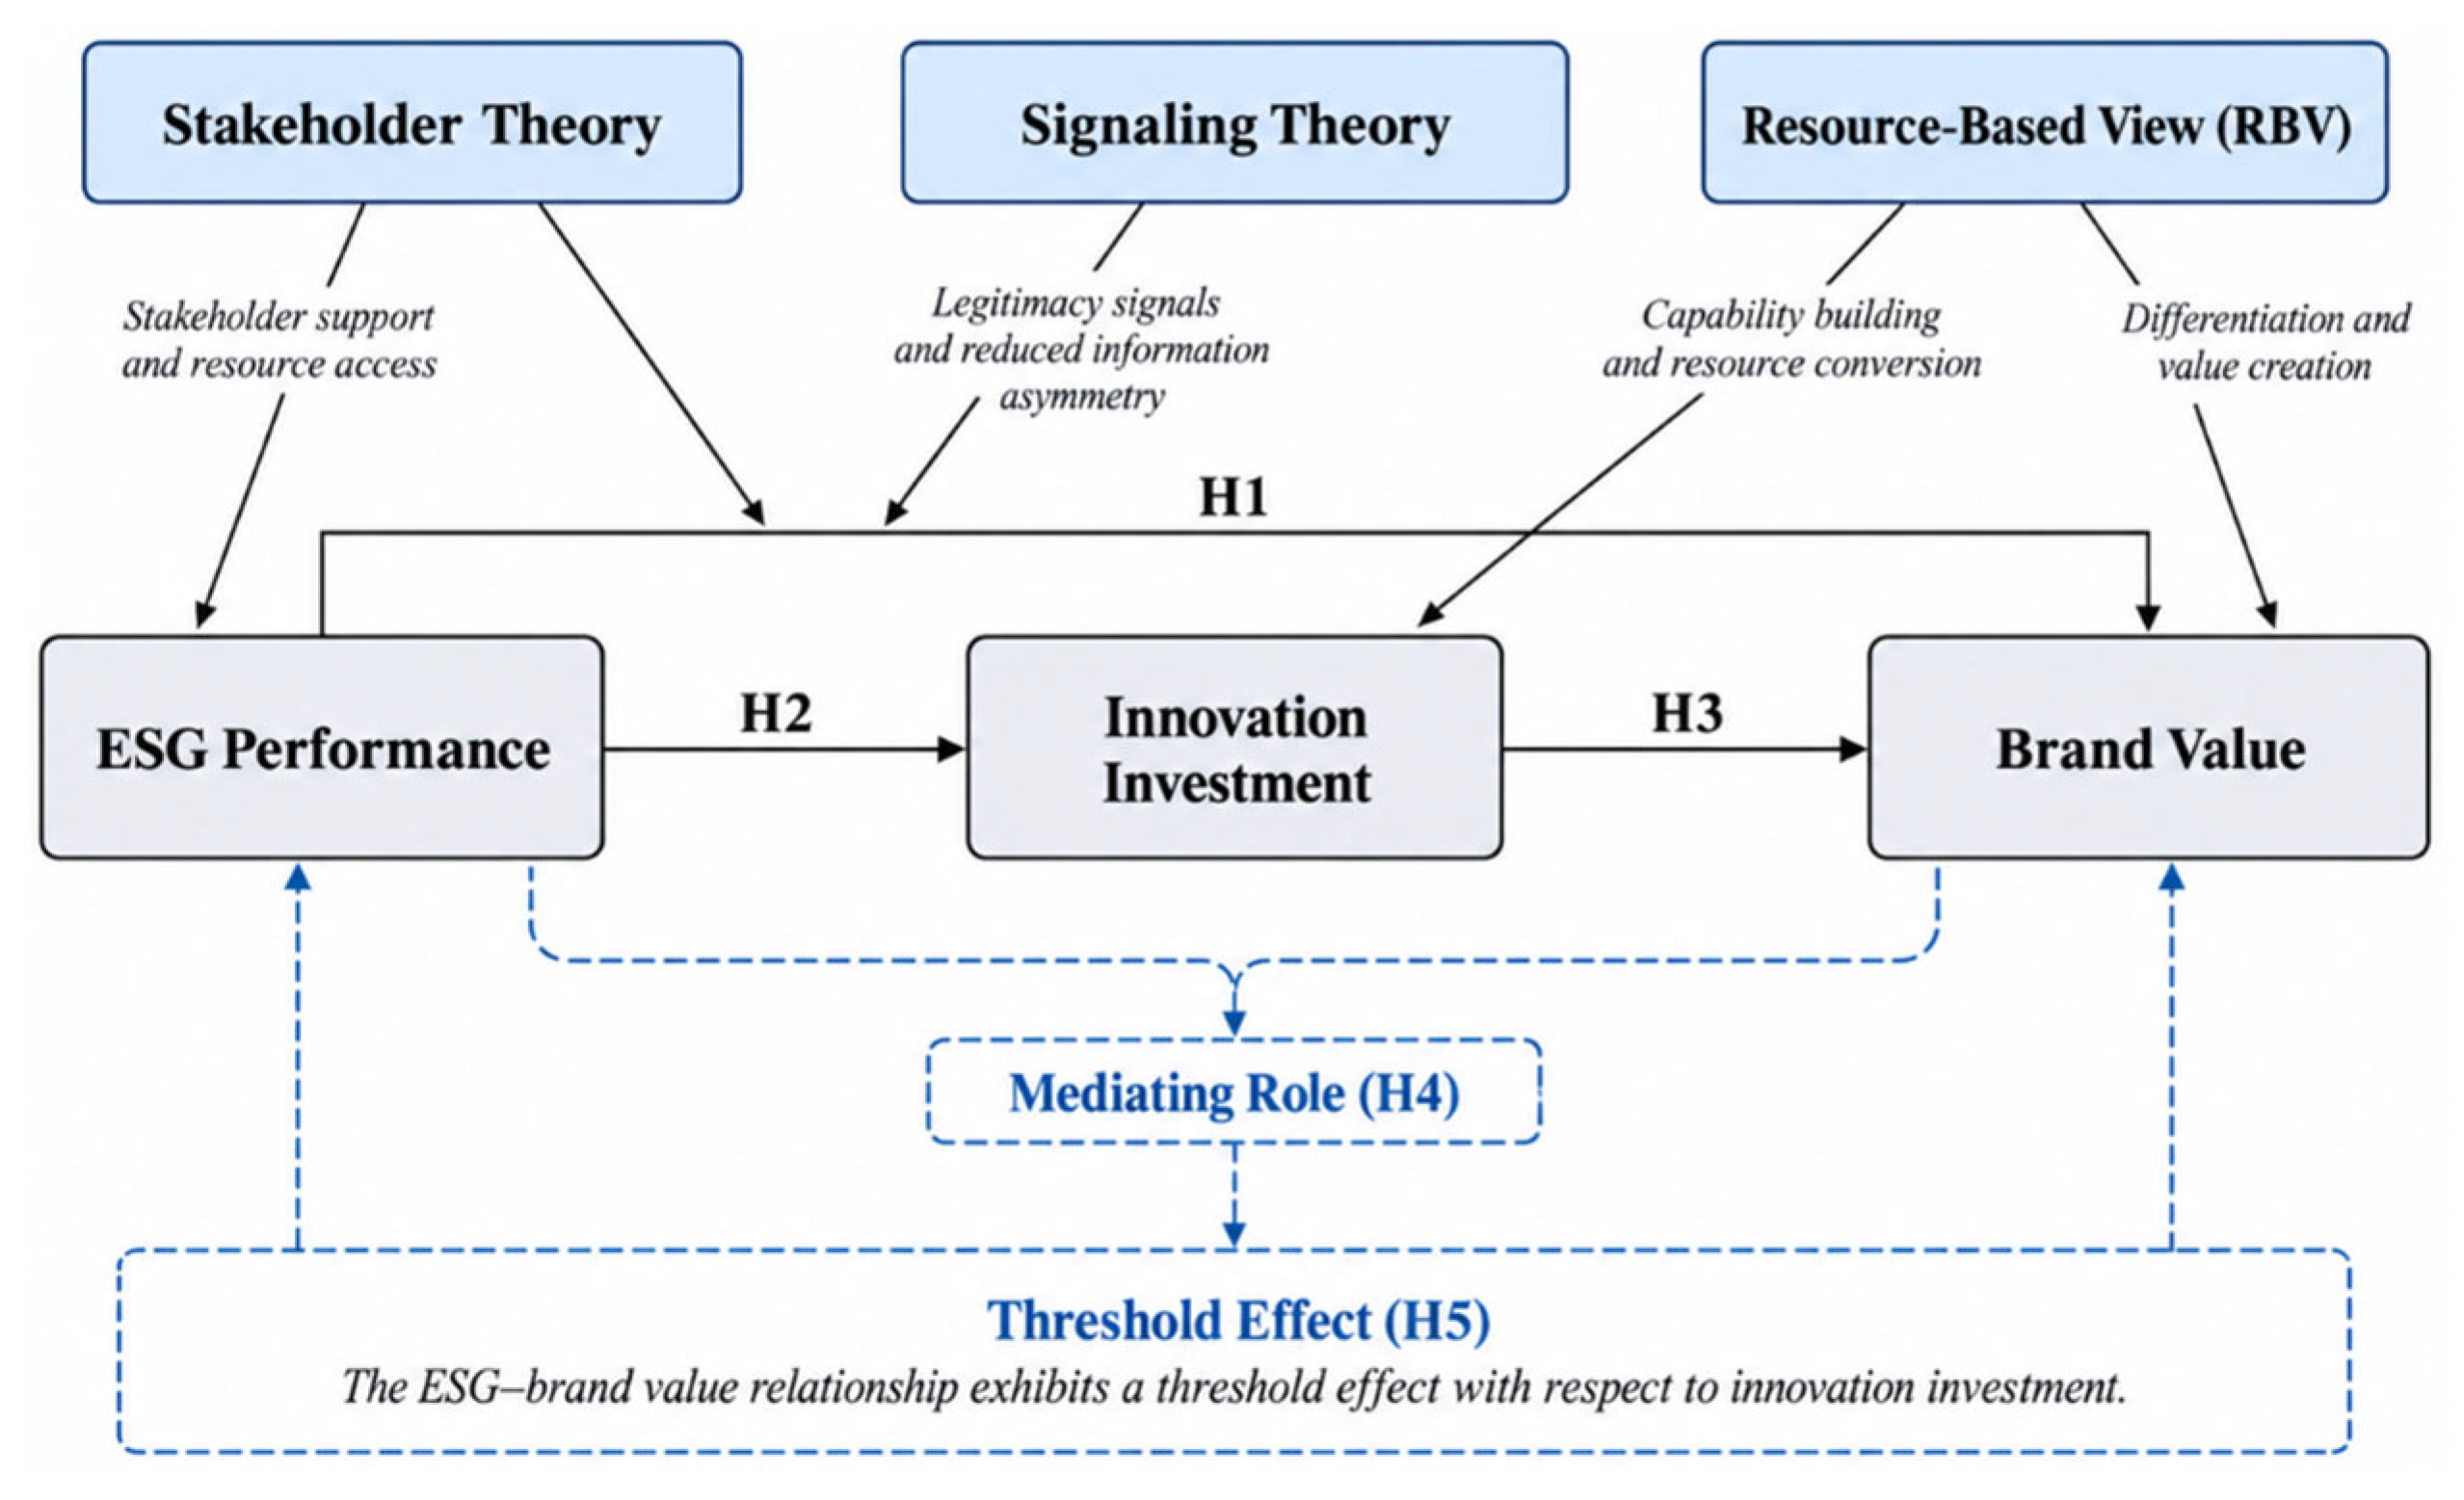
Figure 1 illustrates the integrated theoretical framework of the study. Stakeholder theory, signaling theory, and the resource-based view jointly explain how ESG performance may influence brand value directly and indirectly through innovation investment. Based on this framework, H1–H3 describe the direct and indirect paths, H4 captures the mediating role of innovation investment, and H5 proposes its threshold effect on the ESG–brand value relationship.
Figure 1.
Theoretical Framework.
3. Methodology
3.1. Research Sample
The initial dataset contained 15,000 firm-year observations. The sample-selection process removed 2500 observations for firms listed outside the Chinese A-share market, 180 observations for ST or *ST firms, 435 observations for financial firms, and 3715 observations with missing brand-value, ESG, or other required data. The resulting main sample contains 8170 firm-year observations from 1634 firms over 2020–2024. Owing to model-specific data requirements, the baseline models with controls use 8160 observations, the mediation analysis uses 7791 observations from 1567 firms, and the threshold analysis uses a strongly balanced panel of 7725 observations from 1545 firms. The mediation and threshold samples are derived separately from the same complete-case sample rather than sequentially. Brand-value data are obtained from the Tsinghua CBRC database, ESG ratings from Wind, and financial and accounting data from CSMAR [60]. All statistical analyses were performed using Stata version 18. ChatGPT 5.5 Sol was used solely to polish the English language of the manuscript. It was not used for study design, data collection, data analysis, or interpretation of the results. Table 1 summarizes the sample selection process.
Table 1.
Sample Selection and Estimation Samples.
3.2. Measurement of Variables
3.2.1. Dependent Variable
Brand value (BV) is obtained from the Tsinghua CBRC Listed Company Brand Value Database and the accompanying China Blue Book on Brand Value of Listed Companies [61]. The Blue Book has been released annually since 2020 and covers 3000 listed Chinese companies across the mainland, Hong Kong, and overseas markets; this study retains eligible Chinese A-share firms. Data from the Tsinghua CBRC database provide broad coverage and use a consistent valuation framework [62]: (1) The data are complete and have broad enterprise coverage, which helps to reduce selection bias. Currently, authoritative brand value rankings, such as Interbrand, World Brand Lab, and Brand Finance, cover only a small number of leading listed Chinese enterprises. (2) The theoretical foundation and the multidimensional valuation framework of CBRC conform to international brand asset research standards. (3) CBRC data are sourced from auditable market data, including audited annual-report information reflecting the market performance of products, as well as forward-looking adjustments to stock prices and market indices based on Wind data to measure capital market performance.
The BV assessment model is as follows (This brand value assessment model is derived from “Blue Book on Brand Value of Chinese Listed Companies”):
where
BV = BE × BR × BP
- BV—Brand Value;
- BE—Business Earnings. Determined by integrating the company’s revenue and profit data over the past five years.
- BR—Brand Ratio. Determined based on the proportion of the company’s main business revenue compared with the industry.
- BP—Brand Potential. Calculated by analyzing the daily stock price changes in listed companies over a period of three consecutive years and changes in the stock market index of the listed company’s location. Coefficients representing the competitive advantages and earnings of the brands are calculated.
3.2.2. Independent Variable
Corporate ESG performance is measured using quarterly Huazheng ESG ratings produced by Shanghai Huazheng Index Information Service Co., Ltd. and retrieved through the Wind financial terminal. This rating system is widely used in research on Chinese listed firms because of its broad coverage and alignment with the Chinese institutional context [5]. Each quarterly rating from AAA to C is converted into a numerical score from 9 to 1, with higher values indicating better ESG performance. The annual ESG score is the arithmetic mean of the four quarterly scores; annual values can therefore be fractional even though each quarterly rating is coded as an integer [63,64].
3.2.3. Mediating and Threshold Variable
Innovation investment (INNO) is proxied by annual firm-level R&D expenditure, measured in RMB 100 million. R&D expenditure records resources committed to research and experimental development and therefore captures innovation input rather than realized innovation output [65,66]. The proxy is used because Chinese listed firms report R&D expenditure consistently and because the measure includes both successful and unsuccessful projects [67,68]. To address scale dependence and right skewness, the supplementary analyses use LNINNO = ln (1 + annual R&D expenditure) and RDINT = annual R&D expenditure divided by operating revenue. These alternatives remain proxies for innovation investment and are not interpreted as innovation output. Accordingly, R&D expenditure is interpreted as an observable innovation input rather than a direct measure of firms’ broader innovation capabilities or realized innovation outcomes [43].
3.2.4. Control Variables
The control variables are revenue growth rate, debt-to-asset ratio, firm listing age, firm size, and operating cash-flow-to-assets ratio. Year and firm fixed effects are also included. Table 2 provides a summary of the symbols, variable names, definitions, and reference notes for all variables.
Table 2.
Summary of Variables.
3.3. Research Models
To test Hypothesis 1, which predicts a positive relationship between ESG performance and brand value, this study employs the fixed-effects regression model presented in Model (1) [63,64,75].
BVit = αi + τt + β1ESGit + γ′Xit + εit
To test Hypothesis 2, which proposes that ESG performance is positively associated with innovation investment, Model (2) uses annual R&D expenditure as the dependent variable. Model (3) examines whether innovation investment is associated with brand value after controlling for ESG performance. Hypothesis 4 is evaluated using Models (1)–(3) estimated on a common sample: Model (1) estimates the total association between ESG performance and brand value, Model (2) estimates the association between ESG performance and innovation investment, and Model (3) includes ESG performance and innovation investment jointly to estimate their associations with brand value [76]. Firm-clustered bootstrap confidence intervals are used as the primary test of the indirect effect.
INNOit = αi + τt + β1ESGit + γ′Xit + εit
BVit = αi + τt + γ1ESGit + γ2INNOit + θ′Xit + εit
Hypothesis 5 evaluates whether innovation investment, proxied by annual firm-level R&D expenditure, changes the strength of the ESG–brand value association. Following Hansen’s [77] panel-threshold approach, this study specifies the threshold regression model presented in Model (4).
where I (·) is an indicator function, λ denotes the estimated R&D-expenditure threshold, αi represents firm fixed effects, τt represents year fixed effects, and Xit is the vector of control variables.
BVit = αi + τt + δ1ESGit I (INNOit ≤ λ) + δ2ESGit I (INNOit > λ) + θ′Xit + εit
The threshold procedure sequentially tests whether one or more statistically significant thresholds are present. Bootstrap tests are conducted for single-, double-, and triple-threshold specifications, and regime-specific ESG coefficients are then estimated for the threshold structure supported by the data [77]. This procedure allows both the number and location of thresholds to be determined empirically rather than imposing a single breakpoint a priori.
4. Empirical Analysis
4.1. Descriptive Analysis
Table 3 presents the descriptive statistics. ESG scores are more concentrated, with the 25th and 75th percentiles at 4 and 5, respectively. Brand value (BV) is highly right-skewed, with a maximum of RMB 578.233 billion compared with a median of RMB 2.172 billion. Innovation investment (INNO), measured by annual firm-level R&D expenditure, shows a similarly right-skewed distribution, with a maximum of RMB 54.161 billion and a median of RMB 0.207 billion. The skewness coefficient of BV is 11.299; after the ln (1 + BV) transformation, it declines to 1.133, indicating a substantial reduction in right-skewness. This distributional feature motivates an additional robustness specification using the log-transformed dependent variable in Section 4.4.
Table 3.
Descriptive Statistics.
4.2. Correlation and VIF Analysis
Potential multicollinearity is assessed using Pearson correlation coefficients and variance inflation factors (VIFs). Table 4 reports absolute pairwise correlations ranging from 0.002 to 0.577, indicating generally weak to moderate linear associations among the variables. Table 5 reports a maximum VIF of 2.15 and a minimum tolerance of 0.465, suggesting no evidence of serious multicollinearity in the reported specification.
Table 4.
Pearson Correlation Matrix.
Table 5.
Variance Inflation Factor (VIF) Analysis.
4.3. Baseline Regression Analysis
The Hausman test favors fixed effects (p < 0.001), and thus, firm fixed effects are employed in the baseline analysis. Table 6 presents the results.
Table 6.
Baseline Regression Results.
Model (1) reports the unadjusted association between ESG performance and brand value [63,64,78]. The ESG coefficient is 52.295 and statistically significant at the 1% level. Model (2) adds PERFORM, DEBT, AGE, SIZE, and CASH; the ESG coefficient decreases to 14.870 but remains significant at the 1% level. Model (3) adds year fixed effects, while Model (4) includes both firm and year fixed effects. Models (5) and (6) report inference using firm-clustered and heteroskedasticity-robust standard errors, respectively. In both specifications, the ESG coefficient is 10.166 and remains statistically significant. Model (1) uses 8170 observations, whereas Models (2)–(6) use 8160 because 10 observations lack complete control-variable data. Overall, the positive association between ESG performance and brand value remains robust across the reported specifications.
The adjusted R2 increases from 0.040 in Model (1) to 0.947 in Models (4)–(6), largely because the latter specifications absorb time-invariant firm heterogeneity through firm fixed effects. Across the preferred fixed-effects specifications, ESG performance remains positively associated with brand value. Hypothesis 1 is therefore supported in associational terms.
4.4. Endogeneity and Robustness
To address potential endogeneity issues, the Durbin–Wu–Hausman test rejects exogeneity under the maintained model assumptions (χ2 = 4.612, p = 0.0317), indicating potential endogeneity [79,80]. Accordingly, MESG, defined as the average ESG score of other firms in the same industry and year, excluding the focal firm, is used as an instrument for firm-level ESG performance [81,82,83,84].
Table 7 reports the two-stage least squares results. In the first stage, MESG is postively and significantly associated with firm-level ESG performance (coefficient = 0.703, t = 12.95), supporting instrument relevance. The Kleibergen–Paap rk LM statistic is 173.84 (p < 0.001), rejecting the null hypothesis of underidentification. The Kleibergen–Paap rk Wald F statistic is 167.68, providing further evidence of a strong first-stage relationship and reducing concerns about weak instruments. In the second stage, the ESG coefficient is positive and statistically significant (coefficient = 20.534, t = 3.75), suggesting that the positive ESG–brand value relationship persists when ESG is instrumented by MESG. However, instrument relevance does not establish the exclusion restriction. Industry level ESG conditions may affect firm brand value through reputational spillovers, competitors’ responses or industry specific regulatory pressure. Because the model is exactly identified, an overidentification test is unavailable.
Table 7.
Instrumental Variable Regression (2SLS) Test Results.
This study also employs the two-step system generalized method of moments (system GMM) estimator as a supplementary robustness test to account for the dynamic nature of brand value and potential endogeneity. As reported in Table 8, the coefficient on the lagged dependent variable is positive and highly significant in both specifications (1.064 and 1.060), indicating very strong persistence in brand value. However, because both coefficients are slightly above unity, they also raise a potential concern regarding dynamic stability. The ESG coefficients remain positive and statistically significant under both specifications. Lagged ESG in Model (1) has a coefficient of 7.816 (p < 0.01), while contemporaneous ESG in Model (2) has a coefficient of 7.621 (p < 0.01). Thus, the positive ESG–brand value association remains directionally consistent after controlling for the lagged dependent variable and potential endogeneity. The specification diagnostics generally support the validity of the instrument set. The AR (1) tests are significant (p = 0.001 and p = 0.003), whereas the AR (2) tests are insignificant (p = 0.547 and p = 0.126), providing no evidence of second-order serial correlation in the transformed disturbances. The Hansen tests also fail to reject the joint validity of the instruments (p = 0.391 and p = 0.373), while the Difference-in-Hansen tests do not reject the exogeneity of the relevant instrument subsets (p = 0.506 and p = 0.573). Moreover, the number of instruments is limited to 13, substantially below the 1634 cross-sectional units, which reduces concerns regarding instrument proliferation. Taken together, the system GMM estimates provide supplementary evidence that the positive association between ESG performance and brand value is not driven solely by the static fixed-effects specification. Nevertheless, given that the estimated lagged dependent-variable coefficients are slightly above one, the dynamic GMM findings should not be interpreted as establishing a stable long-run adjustment process. The main conclusions of this study therefore continue to rely on the baseline fixed-effects estimates and the additional endogeneity and robustness analyses.
Table 8.
System GMM Estimation Results.
Four robustness tests are conducted: (1) replacing the Huazheng ESG measure with the Wind ESG measure [85,86]; (2) using one- and two-period lagged ESG measures to assess the sensitivity of the results to temporal ordering [87,88,89]; (3) expanding the sample to include financial firms to examine whether the findings depend on their exclusion from the baseline sample [90]; and (4) using ln(1 + BV) as an alternative functional form of the dependent variable to assess whether the baseline result is driven by the pronounced right-skewness of BV. Table 9 presents the results.
Table 9.
Robustness Test Results.
Table 9 reports a positive WESG coefficient of 6.547. The one-period lagged ESG coefficient is 8.598 and statistically significant at the 1% level, whereas the two-period lagged coefficient is 3.567 and not statistically significant (t = 1.288). Thus, the one-period lag provides additional support for the positive ESG–brand value association, while the two-period lag does not yield statistically significant evidence. Prior studies suggest that the effects of ESG information may vary with its temporal proximity and visibility to external stakeholders [91,92,93]. When financial firms are included, the ESG coefficient remains positive and statistically significant (coefficient = 10.225, t = 4.729). Given that ESG-related relationships may vary across sectors [94], this result indicates that the baseline finding is not sensitive to the exclusion of financial firms. Overall, the alternative ESG measure, the one-period lag specification, and the expanded sample produce results consistent with the positive ESG–brand value association, although the two-period lag estimate is not statistically significant [39,95].
To directly address the distributional concern regarding brand value, Column (5) replaces BV with ln (1 + BV). The transformation reduces the skewness coefficient from 11.299 to 1.133. The ESG coefficient remains positive and statistically significant at the 1% level (β = 0.047, t = 6.640; N = 8160), with firm and year fixed effects and firm-clustered standard errors. This result indicates that the positive ESG–brand value association is robust to the logarithmic transformation of the dependent variable and is not driven solely by extreme observations in the upper tail of the original BV distribution.
4.5. Mediating Effect Analysis
To test Hypothesis 4, this study examines whether innovation investment mediates the association between ESG performance and brand value. The indirect effect is evaluated primarily using firm-clustered bootstrap confidence intervals, while the stepwise path regressions following Baron and Kenny are reported as supplementary evidence. INNO, the primary proxy for innovation investment, is measured as annual firm-level R&D expenditure winsorized at the 1st and 99th percentiles to reduce the influence of extreme observations. LNINNO and RDINT are used as alternative operationalizations. All mediation models include firm and year fixed effects and are estimated on a common estimation sample.
Table 10 reports the path regressions. In Model I, ESG is positively associated with brand value (coefficient = 9.752, t = 4.080, p < 0.01), consistent with prior evidence [96,97]. In Model II, ESG is positively associated with INNO (coefficient = 0.459, t = 5.557, p < 0.01), consistent with evidence that stronger ESG performance can support firms’ R&D and innovation activities [16,17]. In Model III, INNO is positively associated with brand value after ESG is included (coefficient = 3.671, t = 4.779, p < 0.01), while the ESG coefficient remains positive and significant at 8.067. The LNINNO specification yields weaker path evidence: ESG predicts LNINNO at the 10% level (coefficient = 0.020, t = 1.936), and LNINNO predicts brand value at the 5% level (coefficient = 6.983, t = 2.393). Because significant component paths do not by themselves establish a significant indirect effect, the bootstrap estimates in Table 12 provide the primary mediation test.
Table 10.
Mediating Effects Testing Results.
Table 11 reports the RDINT path regressions. ESG is positively associated with RDINT only at the 10% level (coefficient = 0.001, t = 1.721). In the brand-value equation, RDINT has a negative but statistically insignificant coefficient (coefficient = −39.234, t = −1.413), while the ESG coefficient remains positive and significant at 9.779. The RDINT path regressions therefore do not support a mediating role for R&D intensity.
Table 11.
Alternative Measurement of Innovation Investment Using R&D Intensity.
Table 12 presents the firm-clustered bootstrap results. For INNO, the estimated indirect effect is 1.685, and both the percentile 95% confidence interval [0.905, 2.526] and the bias-corrected interval [0.972, 2.792] exclude zero. The direct effect remains significant at 8.067, so INNO partially mediates the ESG–brand value relationship. The mediated proportion is approximately 17.28% of the total effect, supporting Hypothesis 4 for the primary measure. For LNINNO, the indirect effect is 0.140; its percentile interval [0.00001, 0.394] and bias-corrected interval [0.006, 0.404] also exclude zero, although the estimated magnitude is small. By contrast, the RDINT indirect effect is −0.027, and both confidence intervals include zero. The mediation inference is therefore sensitive to the operationalization of innovation investment, and the primary conclusion rests on the INNO specification.
Table 12.
Firm-Clustered Bootstrap Mediation Test Results for Innovation Investment and Its Alternative Measures.
4.6. Threshold Effect Analysis
To test Hypothesis 5, this study applies Hansen’s [77] panel-threshold framework to examine whether innovation investment changes the strength of the ESG performance–brand value relationship. The primary analysis uses INNO (annual R&D expenditure) and a balanced panel of 7725 firm-year observations from 1545 firms over 2020–2024, with firm and year fixed effects, a 1000-point grid search, and 1000 bootstrap replications. The validation further reports regime sample sizes, formally tests coefficient differences, and re-estimates the threshold model using log-transformed R&D expenditure (LNINNO) and R&D intensity (RDINT). A 5% trimming rule is used for the baseline threshold search. Industry heterogeneity is subsequently examined by re-estimating the same threshold specification for stable high-tech and traditional industry groups.
4.6.1. Threshold Identification and Regime Distribution
Table 13 supports a single-threshold specification. The single-threshold test is significant (F = 88.18, p = 0.001), whereas the additional second and third thresholds are not (p = 0.338 and p = 0.599, respectively). The single-threshold model is therefore retained for the primary analysis.
Table 13.
Primary INNO Threshold-Effect Bootstrap Tests.
Table 14 shows that the estimated threshold is INNO = 26.6122 (approximately RMB 2.66122 billion), located at the 94.98th percentile of the sample R&D-investment distribution. Of 7725 observations, 7337 (94.98%) are at or below the threshold and 388 (5.02%) are above it. This confirms that the high-R&D regime represents a small, R&D-intensive subset of the sample; accordingly, the threshold is interpreted as a sample-specific breakpoint rather than an optimal or universal R&D target.
Table 14.
Primary INNO Threshold and Regime Distribution.
4.6.2. Regime-Specific ESG Effects and Formal Difference Test
ESG performance is positively associated with brand value in both regimes: the ESG coefficient is 8.251 below the threshold and 19.934 above it (both p < 0.001). The Wald test rejects equality of the two coefficients (F (1, 1544) = 13.68, p = 0.0002), and the estimated difference is 11.683 (t = 3.70, p < 0.001; 95% CI = [5.487, 17.879]). Thus, the threshold changes the strength, not the direction, of the ESG–brand value relationship. This pattern is consistent with resource complementarity: ESG-related stakeholder and reputational resources may generate greater brand-value returns when firms possess stronger innovation-investment capacity [1,15,98,99]. However, given the small high-R&D regime, the breakpoint remains a sample-specific boundary rather than a policy target. The results are shown in Table 15.
Table 15.
Primary Single-Threshold Regression and Formal Coefficient-Difference Test.
4.6.3. Robustness to Alternative Measures of Innovation Investment
To address concerns about the skewness and scale dependence of absolute R&D expenditure, the threshold analysis is re-estimated using LNINNO = ln(1 + annual R&D expenditure) and RDINT = annual R&D expenditure divided by operating revenue. Both specifications use the same balanced panel, controls, fixed effects, grid search, and bootstrap settings as the primary model.
As shown in Table 16, LNINNO reproduces the primary single-threshold result (single p = 0.001; double p = 0.338; triple p = 0.599). Its threshold of 21.7021 back-transforms to approximately RMB 2.661 billion, essentially the same economic breakpoint as INNO, indicating robustness to log transformation and severe right-skewness. RDINT also confirms nonlinear threshold behavior: the single-threshold test is significant (p = 0.032), and a second threshold is statistically detected (p = 0.001), while a third is not (p = 0.102). Yet the two RDINT cutoffs are extremely close and create a middle regime of only 10 observations (0.13%), making the additional regime economically fragile. Overall, threshold nonlinearity persists across alternative operationalizations, although the exact threshold structure is sensitive to normalization. The primary inference therefore remains based on the INNO single-threshold specification.
Table 16.
Robustness of Threshold Findings to Alternative Measures of Innovation Investment.
4.6.4. Industry-Level Threshold Heterogeneity
To examine whether the full-sample threshold masks industry differences, the threshold model is estimated separately for high-tech and traditional firms. Firms whose high-tech classification changes during 2020–2024 are excluded from this subgroup analysis to keep the two groups mutually exclusive. The final subgroup samples contain 560 high-tech firms (2800 observations) and 962 traditional firms (4810 observations). Both models use the same controls, firm and year fixed effects, 5% trimming rule, 1000-point grid search, and 1000 bootstrap replications as the full-sample analysis. The results are shown in Table 17.
Table 17.
Industry-Level Threshold Heterogeneity: High-Tech and Traditional Firms.
Both groups retain a single-threshold model. High-tech firms have a threshold of 20.4304 (RMB 2.043 billion); the second threshold is unsupported (p = 0.173), and the ESG coefficient rises from 3.357 to 10.056, with a significant regime difference (p = 0.0022). Traditional firms have a threshold of 22.7094 (RMB 2.271 billion); the second threshold is also unsupported (p = 0.236), and ESG rises from 11.642 to 25.997, again with a significant regime difference (p = 0.0039). The subgroup thresholds are therefore interpreted as sample-specific empirical breakpoints rather than universal R&D-investment targets.
5. Conclusions
5.1. Summary of Findings
This study examines Chinese A-share-listed firms during 2020–2024 and finds a positive and statistically significant association between ESG performance and brand value. This result is consistent with prior evidence that stronger ESG performance contributes to brand-related outcomes and firm value [15,26,39]. The present study extends this literature by providing large-sample evidence based on the Tsinghua CBRC brand-value measure and by jointly examining the mediating and nonlinear roles of innovation investment. The positive association remains generally robust across alternative ESG measures, the one-period lag specification, the expanded sample, IV-2SLS, system GMM, and the log-transformed brand-value specification. However, the insignificant two-period lag indicates that the evidence supports short-horizon persistence rather than a lasting effect.
The mediation analysis further shows that innovation investment, measured by annual R&D expenditure, carries a significant positive indirect effect between ESG performance and brand value. This finding is broadly consistent with Li and Wang [15] and Tan et al. [20], who document innovation-related channels linking ESG performance to firm value or brand value. However, the present study more narrowly operationalizes the mechanism as innovation investment rather than realized innovation output: the log-transformed R&D measure continues to yield a positive indirect effect, whereas R&D intensity does not support the mediation effect. This distinction clarifies that the empirical mechanism identified here concerns resources committed to innovation activities rather than realized innovation outcomes.
The threshold analysis further identifies a significant single-threshold structure in the full sample: ESG performance is positively associated with brand value in both regimes, and the ESG coefficient is significantly larger above the estimated threshold of INNO = 26.6122. This finding complements broader evidence that the economic consequences of ESG performance may exhibit nonlinear patterns [5,14,100], while extending that literature by identifying R&D expenditure as a resource condition associated with changes in the strength of the ESG–brand value relationship. Separate analyses of high-tech and traditional firms also support single-threshold structures, with significantly larger ESG coefficients above the estimated breakpoints. Overall, the results indicate that innovation investment operates both as a transmission channel and as a nonlinear boundary condition. The estimated thresholds should nevertheless be interpreted as sample-specific empirical breakpoints rather than universal or optimal R&D-investment targets.
5.2. Theoretical Implications
This study makes three theoretical contributions. First, it extends ESG research by shifting the outcome focus from conventional firm-value measures to brand value and by providing evidence from a large sample of Chinese listed firms. In doing so, it broadens the application of stakeholder and signaling perspectives to the formation of brand-related intangible value [15,26]. Second, the study sharpens the interpretation of the underlying mechanism by distinguishing innovation investment from realized innovation outcomes. Annual R&D expenditure captures resources committed to innovation activities rather than patents, new technologies, or other realized outputs [20,42]. This distinction helps clarify the resource-conversion process through which ESG-related stakeholder support and reputational advantages may be associated with brand value. Third, the threshold analysis adds a nonlinear boundary-condition perspective by showing that the strength of the ESG–brand value association varies across R&D-investment regimes rather than remaining constant across firms with different levels of innovation-resource commitment.
5.3. Managerial Implications
For managers, the findings suggest that ESG initiatives and innovation investment are better considered as complementary strategic activities rather than as isolated decisions. The positive ESG coefficient in both R&D regimes indicates that the estimated breakpoint should not be interpreted as a minimum investment requirement for ESG to be associated with brand value; rather, the association becomes stronger in the higher-investment regime. Managers should therefore align ESG and R&D decisions with firm-specific resources, technological opportunities, and industry conditions rather than treating the estimated thresholds as universal or optimal investment targets.
5.4. Policy Implications
For policymakers, the results caution against translating sample-specific R&D thresholds into one-size-fits-all innovation benchmarks. Policy frameworks may be more effective when they improve the quality and comparability of ESG information and reduce financing or knowledge-access barriers that constrain firms’ innovation investment, while allowing for differences in firm capabilities and industry conditions. These implications should also be interpreted in light of the 2020–2024 Chinese context, which encompassed pandemic-related disruptions and substantial developments in ESG disclosure, green finance, and sustainability-related regulation.
5.5. Limitations and Future Research
This study has several limitations. First, the sample is limited to Chinese listed firms and the relatively short 2020–2024 period. This period encompasses COVID-19-related disruptions as well as an evolving ESG disclosure and regulatory environment in China, both of which may have affected stakeholder attention, financing conditions, and firms’ allocation of resources to R&D [101,102]. Accordingly, some of the estimated relationships may partly reflect period-specific institutional conditions. Future research could extend the observation window beyond 2024 and examine whether the findings remain stable in a longer post-pandemic period and across different institutional settings. Second, innovation investment is primarily measured by annual R&D expenditure. Although LNINNO and RDINT are used as alternative measures, the results show some sensitivity to transformation and scaling. Future research could combine R&D inputs with realized innovation outputs, such as patents, green patents, or new products, to provide a more comprehensive assessment of the innovation process. Third, although IV-2SLS and system GMM are employed to alleviate endogeneity concerns, both approaches rely on identifying assumptions and cannot fully eliminate potential endogeneity. Future research could exploit quasi-natural experiments, policy shocks, or other exogenous sources of variation to strengthen causal identification. Finally, the estimated R&D thresholds are conditional on the sample, model specification, trimming rule, and industry classification. They should therefore be interpreted as sample-specific empirical breakpoints rather than universal or optimal levels of innovation investment.
A further limitation concerns sample selection. The initial screening removes observations with missing brand-value, ESG, or other required data, and the main analysis relies on observed complete cases rather than imputed values. Therefore, selection related to data availability cannot be completely ruled out. Future research with broader data coverage or appropriate missing-data designs could examine this issue more directly.
Author Contributions
Conceptualization, D.L., Y.W.L. and T.S.O.; methodology, D.L.; software, D.L.; validation, D.L., Y.W.L. and T.S.O.; formal analysis, D.L.; investigation, D.L.; resources, D.L.; data curation, D.L.; writing—original draft preparation, D.L.; writing—review and editing, D.L., Y.W.L. and T.S.O.; visualization, D.L.; supervision, Y.W.L. and T.S.O.; project administration, D.L. All authors have read and agreed to the published version of the manuscript.
Funding
This research received no external funding.
Institutional Review Board Statement
Not applicable.
Informed Consent Statement
Not applicable.
Data Availability Statement
The data supporting the findings of this study were obtained from the Tsinghua CBRC, Wind, and CSMAR databases under license and are not publicly available. Further information is available from the corresponding author upon reasonable request, subject to the data providers’ licensing terms.
Acknowledgments
During the preparation of this manuscript, the authors used ChatGPT 5.5 Sol for the purpose of polishing the English language of the manuscript. The authors have reviewed and edited the output and take full responsibility for the content of this publication.
Conflicts of Interest
The authors declare no conflicts of interest.
References
- Koshksaray, A.A.; Quach, S.; Trinh, G.; Keivani, S.B.; Thaichon, P. Brand Competitiveness Antecedents: The Interaction Effects of Marketing and R&D Expenditure. J. Retail. Consum. Serv. 2023, 75, 103532. [Google Scholar] [CrossRef] [Scilit]
- Bagna, E.; Cotta Ramusino, E.; Denicolai, S.; Strange, R. Intangible Assets and Firm Performance: The Relative Effects of Recognized and Unrecognized Assets. J. Open Innov. Technol. Mark. Complex. 2024, 10, 100356. [Google Scholar] [CrossRef] [Scilit]
- Liao, J.; Yang, M. New Internationalization Paths of Chinese Brands: A Configurational Study. PLoS ONE 2023, 18, e0292253. [Google Scholar] [CrossRef] [Scilit]
- Vecchi, A.; Brennan, L. Two Tales of Internationalization—Chinese Internet Firms’ Expansion into the European Market. J. Bus. Res. 2022, 152, 106–127. [Google Scholar] [CrossRef] [Scilit]
- Meng, T.; Dato Haji Yahya, M.H.; Ashhari, Z.M.; Yu, D. ESG Performance, Investor Attention, and Company Reputation: Threshold Model Analysis Based on Panel Data from Listed Companies in China. Heliyon 2023, 9, e20974. [Google Scholar] [CrossRef] [Scilit]
- Seok, J.; Kim, Y.; Oh, Y.K. How ESG Shapes Firm Value: The Mediating Role of Customer Satisfaction. Technol. Forecast. Soc. Change 2024, 208, 123714. [Google Scholar] [CrossRef] [Scilit]
- Zhang, R.; Zhou, X.; Liu, Q.; Wang, C. Brand Attitude as the Catalyst: Transforming Perceived ESG to Consumer’s Purchase Intention in Low-Carbon Consumption. Front. Psychol. 2025, 16, 1599472. [Google Scholar] [CrossRef] [Scilit]
- Chen, F.; Liu, Y.; Chen, X. ESG Performance and Business Risk—Empirical Evidence from China’s Listed Companies. Innov. Green Dev. 2024, 3, 100142. [Google Scholar] [CrossRef] [Scilit]
- Mandas, M.; Lahmar, O.; Piras, L.; De Lisa, R. ESG Reputational Risk and Market Valuation: Evidence from the European Banking Industry. Res. Int. Bus. Financ. 2024, 69, 102286. [Google Scholar] [CrossRef] [Scilit]
- Cardillo, M.A.D.R.; Basso, L.F.C. Revisiting Knowledge on ESG/CSR and Financial Performance: A Bibliometric and Systematic Review of Moderating Variables. J. Innov. Knowl. 2025, 10, 100648. [Google Scholar] [CrossRef] [Scilit]
- Asif, M.; Searcy, C.; Castka, P. ESG and Industry 5.0: The Role of Technologies in Enhancing ESG Disclosure. Technol. Forecast. Soc. Change 2023, 195, 122806. [Google Scholar] [CrossRef] [Scilit]
- Cillo, V.; Petruzzelli, A.M.; Ardito, L.; Del Giudice, M. Understanding Sustainable Innovation: A Systematic Literature Review. Corp. Soc. Responsib. Environ. Manag. 2019, 26, 1012–1025. [Google Scholar] [CrossRef] [Scilit]
- Mohammad, W.M.W.; Wasiuzzaman, S. Environmental, Social and Governance (ESG) Disclosure, Competitive Advantage and Performance of Firms in Malaysia. Clean. Environ. Syst. 2021, 2, 100015. [Google Scholar] [CrossRef] [Scilit]
- Bagh, T.; Fuwei, J.; Khan, M.A. Corporate ESG Investments and Firm’s Value under the Real-Option Framework: Evidence from Two World-Leading Economies. Borsa Istanb. Rev. 2024, 24, 324–340. [Google Scholar] [CrossRef] [Scilit]
- Li, Y.; Wang, H. Environmental, Social and Governance Performance on Brand Value in the Context of “Dual Carbon”: The Mediating Effect of R&D Innovation. Sustainability 2024, 16, 10046. [Google Scholar] [CrossRef] [Scilit]
- Chen, W.; Xie, Y.; He, K. Environmental, Social, and Governance Performance and Corporate Innovation Novelty. Int. J. Innov. Stud. 2024, 8, 109–131. [Google Scholar] [CrossRef] [Scilit]
- Li, Y.; Li, S. ESG Performance and Innovation Quality. Int. Rev. Econ. Financ. 2024, 92, 1361–1373. [Google Scholar] [CrossRef] [Scilit]
- Bai, X.; Zhao, W.; Tian, G. ESG Certification, Green Innovation, and Firm Value: A Quasi-Natural Experiment Based on SynTao Green Finance’s ESG Ratings: A Pre-Registered Study. Pac.-Basin Financ. J. 2024, 88, 102572. [Google Scholar] [CrossRef] [Scilit]
- Ruan, L.; Yang, L.; Dong, K. Corporate Green Innovation: The Influence of ESG Information Disclosure. J. Innov. Knowl. 2024, 9, 100628. [Google Scholar] [CrossRef] [Scilit]
- Tan, W.; Cai, Y.; Luo, H.; Zhou, M.; Shen, M. ESG, Technological Innovation and Firm Value: Evidence from China. Int. Rev. Financ. Anal. 2024, 96, 103546. [Google Scholar] [CrossRef] [Scilit]
- Lin, W.L.; Ho, J.A.; Sambasivan, M.; Yip, N.; Mohamed, A.B. Influence of Green Innovation Strategy on Brand Value: The Role of Marketing Capability and R&D Intensity. Technol. Forecast. Soc. Change 2021, 171, 120946. [Google Scholar] [CrossRef] [Scilit]
- Leung, T.Y.; Sharma, P. Differences in the Impact of R&D Intensity and R&D Internationalization on Firm Performance—Mediating Role of Innovation Performance. J. Bus. Res. 2021, 131, 81–91. [Google Scholar] [CrossRef] [Scilit]
- Zhang, W.; Zhao, Y.; Meng, F. ESG Performance and Green Innovation of Chinese Enterprises: Based on the Perspective of Financing Constraints. J. Environ. Manag. 2024, 370, 122955. [Google Scholar] [CrossRef] [Scilit]
- Rego, L.; Brady, M.; Leone, R.; Roberts, J.; Srivastava, C.; Srivastava, R. Brand Response to Environmental Turbulence: A Framework and Propositions for Resistance, Recovery and Reinvention. Int. J. Res. Mark. 2022, 39, 583–602. [Google Scholar] [CrossRef] [Scilit]
- Gálvez-Sánchez, F.J.; Molina-Prados, A.; Molina-Moreno, V.; Moral-Cuadra, S. Exploring the Three-Dimensional Effect of Corporate Social Responsibility on Brand Equity, Corporate Reputation, and Willingness to Pay. A Study of the Fashion Industry. J. Retail. Consum. Serv. 2024, 79, 103836. [Google Scholar] [CrossRef] [Scilit]
- Lee, M.T.; Raschke, R.L.; Krishen, A.S. Signaling Green! Firm ESG Signals in an Interconnected Environment That Promote Brand Valuation. J. Bus. Res. 2022, 138, 1–11. [Google Scholar] [CrossRef] [Scilit]
- Ali, W.; Bekiros, S.; Hussain, N.; Khan, S.A.; Nguyen, D.K. Determinants and Consequences of Corporate Social Responsibility Disclosure: A Survey of Extant Literature. J. Econ. Surv. 2024, 38, 793–822. [Google Scholar] [CrossRef] [Scilit]
- Freeman, R.E.; Dmytriyev, S.D.; Phillips, R.A. Stakeholder Theory and the Resource-Based View of the Firm. J. Manag. 2021, 47, 1757–1770. [Google Scholar] [CrossRef] [Scilit]
- Mahajan, R.; Lim, W.M.; Sareen, M.; Kumar, S.; Panwar, R. Stakeholder Theory. J. Bus. Res. 2023, 166, 114104. [Google Scholar] [CrossRef] [Scilit]
- Iglesias, O.; Ind, N. Towards a Theory of Conscientious Corporate Brand Co-Creation: The next Key Challenge in Brand Management. J. Brand Manag. 2020, 27, 710–720. [Google Scholar] [CrossRef] [Scilit]
- Du, S.; Bhattacharya, C.B.; Sen, S. Maximizing Business Returns to Corporate Social Responsibility (CSR): The Role of CSR Communication. Int. J. Manag. Rev. 2010, 12, 8–19. [Google Scholar] [CrossRef] [Scilit]
- Aggarwal, A.; Saxena, N. Examining the Relationship between Corporate Social Responsibility, Corporate Reputation and Brand Equity in Indian Banking Industry. J. Public Aff. 2023, 23, e2838. [Google Scholar] [CrossRef] [Scilit]
- Al-Issa, N.; Khaki, A.R.; Jreisat, A.; Al-Mohamad, S.; Fahl, D.; Limani, E. Impact of Environmental, Social, Governance, and Corporate Social Responsibility Factors on Firm’s Marketing Expenses and Firm Value: A Panel Study of US Companies. Cogent Bus. Manag. 2022, 9, 2135214. [Google Scholar] [CrossRef] [Scilit]
- Kimbrough, M.D.; Wang, X.; Wei, S.; Zhang, J. Does Voluntary ESG Reporting Resolve Disagreement among ESG Rating Agencies? Eur. Account. Rev. 2024, 33, 15–47. [Google Scholar] [CrossRef] [Scilit]
- Sun, Y.; Zhao, D.; Cao, Y. The Impact of ESG Performance, Reporting Framework, and Reporting Assurance on the Tone of ESG Disclosures: Evidence from Chinese Listed Firms. J. Clean. Prod. 2024, 466, 142698. [Google Scholar] [CrossRef] [Scilit]
- Bhandari, K.R.; Ranta, M.; Salo, J. The Resource-based View, Stakeholder Capitalism, ESG, and Sustainable Competitive Advantage: The Firm’s Embeddedness into Ecology, Society, and Governance. Bus. Strategy Environ. 2022, 31, 1525–1537. [Google Scholar] [CrossRef] [Scilit]
- Liang, Y.; Lee, M.J.; Jung, J.S. Dynamic Capabilities and an ESG Strategy for Sustainable Management Performance. Front. Psychol. 2022, 13, 887776. [Google Scholar] [CrossRef] [Scilit]
- Wang, X.; Xie, H.; Li, J.; Liu, X. The Effect of ESG Performance on Value Creation of Strategic Alliances. Res. Int. Bus. Financ. 2025, 79, 103093. [Google Scholar] [CrossRef] [Scilit]
- Wang, Y.; Cao, J.; Cai, X. The Impact of Environmental, Social and Governance Performance on Brand Value: The Role of the Digitalisation Level. S. Afr. J. Bus. Manag. 2024, 55, 1–13. [Google Scholar] [CrossRef] [Scilit]
- Chen, L.; Khurram, M.U.; Gao, Y.; Abedin, M.Z.; Lucey, B. ESG Disclosure and Technological Innovation Capabilities of the Chinese Listed Companies. Res. Int. Bus. Financ. 2023, 65, 101974. [Google Scholar] [CrossRef] [Scilit]
- Hao, Y.; Wu, W. Environment, Social, and Governance Performance and Corporate Financing Constraints. Financ. Res. Lett. 2024, 62, 105083. [Google Scholar] [CrossRef] [Scilit]
- Yang, X.; Li, Z.; Qiu, Z.; Wang, J.; Liu, B. ESG Performance and Corporate Technology Innovation: Evidence from China. Technol. Forecast. Soc. Change 2024, 206, 123520. [Google Scholar] [CrossRef] [Scilit]
- Ben Slimane, S. Absorption—Technological Absorptive Capacity and Innovation: The Primacy of Knowledge. In Innovation Economics, Engineering and Management Handbook 2; Uzunidis, D., Kasmi, F., Adatto, L., Eds.; Wiley: Hoboken, NJ, USA, 2021; pp. 43–49. [Google Scholar] [CrossRef] [Scilit]
- Sun, Z.; Wei, W. Green Technology Innovation and Corporate Brand Competitiveness: An Analysis Based on the Role of Environmental Policy. Financ. Res. Lett. 2025, 71, 106421. [Google Scholar] [CrossRef] [Scilit]
- Yang, M.; Wang, M. Brand Innovativeness and Brand Equity: The Mediating Role of Brand Attitude and the Moderating Role of Perceived Brand Ethicality. J. Prod. Brand Manag. 2024, 33, 888–901. [Google Scholar] [CrossRef] [Scilit]
- Liu, Y.; Chen, Y.; Ren, Y.; Jin, B. Impact Mechanism of Corporate Social Responsibility on Sustainable Technological Innovation Performance from the Perspective of Corporate Social Capital. J. Clean. Prod. 2021, 308, 127345. [Google Scholar] [CrossRef] [Scilit]
- Chang, L.; Yu, Q. Sustainability-Oriented Social Responsibility and Corporate Innovation. China J. Account. Res. 2024, 17, 100359. [Google Scholar] [CrossRef] [Scilit]
- Sun, X.; Xiong, X. ESG Performance and Corporate Innovation. Res. Int. Bus. Financ. 2025, 76, 102817. [Google Scholar] [CrossRef] [Scilit]
- Shen, J.; Peng, D.; Zhou, Y. Government-Led CSR Effort, Innovation, and Firm Value: Evidence from a Quasi-Natural Experiment in China. Res. Int. Bus. Financ. 2025, 77, 102923. [Google Scholar] [CrossRef] [Scilit]
- Zhang, H. Mandatory Corporate Social Responsibility Disclosure and Firm Innovation: Evidence from a Quasi-Natural Experiment. Financ. Res. Lett. 2022, 47, 102819. [Google Scholar] [CrossRef] [Scilit]
- Marín-García, A.; Gil-Saura, I.; Ruiz-Molina, M.-E. Do Innovation and Sustainability Influence Customer Satisfaction in Retail? A Question of Gender. Econ. Res.-Ekon. Istraž. 2022, 35, 546–563. [Google Scholar] [CrossRef] [Scilit]
- Cardoso, A.; Gabriel, M.; Figueiredo, J.; Oliveira, I.; Rêgo, R.; Silva, R.; Oliveira, M.; Meirinhos, G. Trust and Loyalty in Building the Brand Relationship with the Customer: Empirical Analysis in a Retail Chain in Northern Brazil. J. Open Innov. Technol. Mark. Complex. 2022, 8, 109. [Google Scholar] [CrossRef] [Scilit]
- Bilyay-Erdogan, S.; Danisman, G.O.; Demir, E. ESG Performance and Investment Efficiency: The Impact of Information Asymmetry. J. Int. Financ. Mark. Inst. Money 2024, 91, 101919. [Google Scholar] [CrossRef] [Scilit]
- Jin, C.; Monfort, A.; Chen, F.; Xia, N.; Wu, B. Institutional Investor ESG Activism and Corporate Green Innovation against Climate Change: Exploring Differences between Digital and Non-Digital Firms. Technol. Forecast. Soc. Change 2024, 200, 123129. [Google Scholar] [CrossRef] [Scilit]
- Li, W.; Zhu, J.; Liu, C. Environmental, Social, and Governance Performance, Financing Constraints, and Corporate Investment Efficiency: Empirical Evidence from China. Heliyon 2024, 10, e40401. [Google Scholar] [CrossRef] [Scilit]
- Xu, M.; Tse, Y.K.; Geng, R.; Liu, Z.; Potter, A. Greenwashing and Market Value of Firms: An Empirical Study. Int. J. Prod. Econ. 2025, 284, 109606. [Google Scholar] [CrossRef] [Scilit]
- Cabaleiro-Cerviño, G.; Mendi, P. ESG-Driven Innovation Strategy and Firm Performance. Eurasian Bus. Rev. 2024, 14, 137–185. [Google Scholar] [CrossRef] [Scilit]
- Iftikhar, K.; Bagh, T.; Shabbir, M.N. Corporate Reputation Gains from Green Innovation: Moderating Effects of Subsidies and Eco-Friendly Products. Res. Int. Bus. Financ. 2025, 80, 103108. [Google Scholar] [CrossRef] [Scilit]
- Li, Y.; Zou, C.; Huang, Y.; Wan, A. Environmental Regulation, Green Innovation, and Corporate Brand Value. Sustainability 2025, 17, 3445. [Google Scholar] [CrossRef] [Scilit]
- Lu, D.; Meng, T.; Lau, Y.W.; Ong, T.S. Mechanisms of Investor Attention in Enhancing ESG Performance: Evidence from Chinese Listed Companies. Discov. Glob. Soc. 2025, 3, 66. [Google Scholar] [CrossRef] [Scilit]
- Zhao, P.; Liu, X.D. 2024 China Blue Book on Brand Value of Listed Companies, 1st ed.; Tsinghua University Press: Beijing, China, 2024; ISBN 978-7-302-67154-1. Available online: https://www.tup.tsinghua.edu.cn/booksCenter/book_10738401.html (accessed on 25 September 2026).
- Yu, C.M.Y. Research on ESG and the Brand Value of Chinese Internationalized Enterprises . Caixin, 17 July 2025. Available online: https://promote.caixin.com/2025-07-17/102342179.html (accessed on 25 September 2026).
- Zhao, X.; Fang, L.; Zhang, K. Online Search Attention, Firms’ ESG and Operating Performance. Int. Rev. Econ. Financ. 2023, 88, 223–236. [Google Scholar] [CrossRef] [Scilit]
- Zhang, Z.; Zhang, L. Investor Attention and Corporate ESG Performance. Financ. Res. Lett. 2023, 60, 104887. [Google Scholar] [CrossRef] [Scilit]
- Blind, K.; Münch, F. The Interplay between Innovation, Standards and Regulation in a Globalising Economy. J. Clean. Prod. 2024, 445, 141202. [Google Scholar] [CrossRef] [Scilit]
- O’Connell, V.; AbuGhazaleh, N.M.; Browne, O.; Farrell, M.; Gleeson, M.; McGeown, E. Enhancing Sustainability: The Impact of Research and Development Expenditure on Future Environmental Innovation in European Firms. Sustainability 2025, 17, 5412. [Google Scholar] [CrossRef] [Scilit]
- Mohanram, P.; Sun, W.; Xin, B.; Zhu, J. Does Financial Information Presentation Format Matter? Evidence from Chinese Firms’ Reporting of Research and Development Expense. Rev. Account. Stud. 2025, 30, 1638–1682. [Google Scholar] [CrossRef] [Scilit]
- OECD. Measuring Science and Innovation for Sustainable Growth; OECD Publishing: Paris, France, 2025. [Google Scholar] [CrossRef] [Scilit]
- Tang, H.; Xiong, L.; Peng, R. The Mediating Role of Investor Confidence on ESG Performance and Firm Value: Evidence from Chinese Listed Firms. Financ. Res. Lett. 2024, 61, 104988. [Google Scholar] [CrossRef] [Scilit]
- McAlister, L.; Srinivasan, R.; Kim, M. Advertising, Research and Development, and Systematic Risk of the Firm. J. Mark. 2007, 71, 35–48. [Google Scholar] [CrossRef] [Scilit]
- Geng, H.; Hau, H.; Lai, S.; Liu, P. Does Shareholder Overlap Alleviate Patent Holdup? Res. Policy 2025, 54, 105167. [Google Scholar] [CrossRef] [Scilit]
- Cho, Y.-G. Control-Ownership Disparity and Executive Compensation. J. Korea Acad.-Ind. Coop. Soc. 2013, 14, 5434–5441. [Google Scholar] [CrossRef] [Scilit]
- Rajan, R.G.; Zingales, L. What Do We Know about Capital Structure? Some Evidence from International Data. J. Financ. 1995, 50, 1421–1460. [Google Scholar] [CrossRef]
- Zimny, A. The Impact of Asset Structure on a Company’s Financial Results Stability. Finans. Prawo Finans. 2022, 4, 107–128. [Google Scholar] [CrossRef] [Scilit]
- Imai, K.; Kim, I.S. On the Use of Two-Way Fixed Effects Regression Models for Causal Inference with Panel Data. Polit. Anal. 2021, 29, 405–415. [Google Scholar] [CrossRef] [Scilit]
- Baron, R.M.; Kenny, D.A. The Moderator-Mediator Variable Distinction in Social Psychological Research. Conceptual, Strategic, and Statistical Considerations. J. Pers. Soc. Psychol. 1986, 51, 1173–1182. [Google Scholar] [CrossRef]
- Hansen, B.E. Threshold Effects in Non-Dynamic Panels: Estimation, Testing, and Inference. J. Econom. 1999, 93, 345–368. [Google Scholar] [CrossRef] [Scilit]
- Xie, E.; Cao, S. Can Network Attention Effectively Stimulate Corporate ESG Practices?—Evidence from China. PLoS ONE 2023, 18, e0318880. [Google Scholar] [CrossRef] [Scilit]
- Guo, Z.; Kang, H.; Cai, T.T.; Small, D.S. Testing Endogeneity with High Dimensional Covariates. J. Econom. 2018, 207, 175–187. [Google Scholar] [CrossRef] [Scilit]
- Doko Tchatoka, F.; Dufour, J.-M. Exogeneity Tests, Incomplete Models, Weak Identification and Non-Gaussian Distributions: Invariance and Finite-Sample Distributional Theory. J. Econom. 2020, 218, 390–418. [Google Scholar] [CrossRef] [Scilit]
- Cheng, B.; Ioannou, I.; Serafeim, G. Corporate Social Responsibility and Access to Finance. Strateg. Manag. J. 2014, 35, 1–23. [Google Scholar] [CrossRef] [Scilit]
- Liang, H.; Renneboog, L. Corporate Social Responsibility and Sustainable Finance: A Review of the Literature. SSRN Electron. J. 2020. [Google Scholar] [CrossRef] [Scilit]
- Tang, H. ESG Performance, Investors’ Heterogeneous Beliefs, and Cost of Equity Capital in China. Front. Environ. Sci. 2022, 10, 992559. [Google Scholar] [CrossRef] [Scilit]
- Zhao, D.; Ngan, S.L.; Jamil, A.H.; Salleh, M.F.M.; Yusoff, W.S. Peer Effects on ESG Disclosure: Drivers and Implications for Sustainable Corporate Governance. Sustainability 2025, 17, 4392. [Google Scholar] [CrossRef] [Scilit]
- Zhu, C.; Yang, C. Divergences among ESG Rating Systems: Evidence from Financial Indexes. Econ. Anal. Lett. 2024, 3, 48. [Google Scholar] [CrossRef] [Scilit]
- Xu, X.; Sun, M. Digital Transformation, Internationalisation and ESG Performance of Multinational Companies. Manag. Decis. Econ. 2025, 46, 2709–2725. [Google Scholar] [CrossRef] [Scilit]
- Hawn, O.; Ioannou, I. Mind the Gap: The Interplay between External and Internal Actions in the Case of Corporate Social Responsibility. Strateg. Manag. J. 2016, 37, 2569–2588. [Google Scholar] [CrossRef] [Scilit]
- Lins, K.V.; Servaes, H.; Tamayo, A. Social Capital, Trust, and Firm Performance: The Value of Corporate Social Responsibility during the Financial Crisis. J. Financ. 2017, 72, 1785–1824. [Google Scholar] [CrossRef] [Scilit]
- Wedajo, A.D.; Salah, A.A.; Bhat, M.A.; Iqbal, R.; Khan, S.T. Analyzing the Dynamic Relationship between ESG Scores and Firm Value in Chinese Listed Companies: Insights from Generalized Cross-Lagged Panel Model. Discov. Sustain. 2024, 5, 336. [Google Scholar] [CrossRef] [Scilit]
- Bani-Khaled, S.; Azevedo, G.; Oliveira, J. Environmental, Social, and Governance (ESG) Factors and Firm Value: A Systematic Literature Review of Theories and Empirical Evidence. AMS Rev. 2025, 15, 228–260. [Google Scholar] [CrossRef] [Scilit]
- Dorfleitner, G.; Zhang, R. ESG News Sentiment and Stock Price Reactions: A Comprehensive Investigation via BERT. Schmalenbach J. Bus. Res. 2024, 76, 197–244. [Google Scholar] [CrossRef] [Scilit]
- Vu, T.N.; Junttila, J.-P.; Lehkonen, H. ESG News and Long-Run Stock Returns. Financ. Res. Lett. 2024, 60, 104915. [Google Scholar] [CrossRef] [Scilit]
- Jeong, S.; Han, J.; Jun, S.; Kim, S.; Kim, J.W. Investor Responses to ESG News Sentiment: Exploring Differential Effects and Industry Moderation. Corp. Soc. Responsib. Environ. Manag. 2025, 32, 3944–3964. [Google Scholar] [CrossRef] [Scilit]
- Buallay, A. Sustainability Reporting and Firm’s Performance: Comparative Study between Manufacturing and Banking Sectors. Int. J. Product. Perform. Manag. 2019, 69, 431–445. [Google Scholar] [CrossRef] [Scilit]
- Fatemi, A.; Glaum, M.; Kaiser, S. ESG Performance and Firm Value: The Moderating Role of Disclosure. Glob. Financ. J. 2018, 38, 45–64. [Google Scholar] [CrossRef] [Scilit]
- Lee, H.J.; Rhee, T. How Does Corporate ESG Management Affect Consumers’ Brand Choice? Sustainability 2023, 15, 6795. [Google Scholar] [CrossRef] [Scilit]
- Kousar, S.; Du, J.; Wattoo, M.U. The Role of Digital ESG Practices in Shaping Brand Perception and Consumer Engagement in the Beauty Industry. SAGE Open 2025, 15, 21582440251365029. [Google Scholar] [CrossRef] [Scilit]
- Barney, J. Firm Resources and Sustained Competitive Advantage. J. Manag. 1991, 17, 99–120. [Google Scholar] [CrossRef] [Scilit]
- Martinez-Conesa, I.; Soto-Acosta, P.; Palacios-Manzano, M. Corporate Social Responsibility and Its Effect on Innovation and Firm Performance: An Empirical Research in SMEs. J. Clean. Prod. 2017, 142, 2374–2383. [Google Scholar] [CrossRef] [Scilit]
- Pu, G. A Non-Linear Assessment of ESG and Firm Performance Relationship: Evidence from China. Econ. Res.-Ekon. Istraž. 2023, 36, 2113336. [Google Scholar] [CrossRef] [Scilit]
- Shen, H.; Lin, H.; Han, W.; Wu, H. ESG in China: A Review of Practice and Research, and Future Research Avenues. China J. Account. Res. 2023, 16, 100325. [Google Scholar] [CrossRef] [Scilit]
- Shanghai Stock Exchange Guidelines No. 14 of Shanghai Stock Exchange for Self-Regulation of Listed Companies—Sustainability Report (Trial). Available online: https://www.sse.com.cn/lawandrules/sselawsrules2025/stocks/mainipo/c/c_20250516_10779150.shtml (accessed on 25 September 2026).

Disclaimer/Publisher’s Note: The statements, opinions and data contained in all publications are solely those of the individual author(s) and contributor(s) and not of MDPI and/or the editor(s). MDPI and/or the editor(s) disclaim responsibility for any injury to people or property resulting from any ideas, methods, instructions or products referred to in the content. |
© 2026 by the authors. Licensee MDPI, Basel, Switzerland. This article is an open access article distributed under the terms and conditions of the Creative Commons Attribution (CC BY) license.