


Abstract
In the context of sustainable development and Beijing–Tianjin–Hebei regional integration, synergistic advancement of livelihood welfare and economic development efficiency is essential for addressing regional imbalances. In this study, the structural mismatch between these dimensions in resource-dependent provinces are examined with utilizing panel data from 11 prefecture-level cities in Hebei Province (2019–2024). A dual-dimensional evaluation system is constructed with the entropy weight method, mismatch index quantification, spatial visualization, and geographically and temporally weighted regression (GTWR) to analyze spatiotemporal evolution and driving mechanisms. Results show: (1) Both subsystems improved steadily while a “core-periphery” gradient pattern is exhibited. After 2021, several cities experienced a decline in their indices. (2) The mismatch exhibited an overall mitigating trend while retaining significant spatial heterogeneity. This was characterized by persistent high-level fluctuation and overall convergence, together with localized polarization in its spatial distribution. (3) Road network density was found to exacerbate the mismatch, while the remaining factors largely alleviated it, with all drivers showing pronounced spatiotemporal heterogeneity. This study advances sustainable regional development assessment by quantifying structural mismatch dynamics and providing evidence-based, place-based policy guidance for fostering inclusive and territorially balanced growth in resource-dependent regions.
1. Introduction
Amid the coordinated pursuit of high-quality development and the Beijing–Tianjin–Hebei (BTH) integration strategy, enhancing the synergy between livelihood well-being and economic development efficiency represents a critical pathway toward addressing regional sustainable development imbalances and achieving connotative, quality-oriented development. In practice, however, contemporary regional development reveals a marked asynchronicity between economic growth and well-being improvement. Specifically, a widespread structural mismatch persists, whereby economic achievements fail to translate effectively into gains in livelihood well-being: a predicament emblematic of the transformation dilemmas confronting resource-dependent regions.
Conceptually, the mismatch denotes the disequilibrium, disjunction, and incongruity between two interrelated systems with respect to their developmental levels, improvement velocities, and coordination states. Quantitatively, it can be characterized as the asynchronous, unbalanced, and non-synergistic gaps between these systems. Drawing upon spatial mismatch theory, Lu et al. argue that irrational policy configurations readily induce distortions in the spatial allocation of factors, engendering aggregate efficiency losses at the regional level; coordinated regional development therefore necessitates avoiding extensive development models plagued by factor misallocation [1]. Against this backdrop, well-being economics has catalyzed a paradigm shift in regional governance, whereby development evaluation systems are progressively decoupling from singular economic growth metrics and transitioning toward comprehensive assessment paradigms centered on residents’ well-being [2]. Accordingly, a dual-dimensional analytical framework considering livelihood well-being and economic development efficiency is constructed to elucidate their interactive nexus and underlying mismatch mechanisms.
Extant scholarship has developed a comprehensive research agenda on livelihood well-being and economic development efficiency, with a wealth of studies focusing on their spatiotemporal differentiation, driving mechanisms, and associative effects. Regarding the spatial effects of livelihood well-being, Wang et al. employ the Spatial Durbin Model to confirm that the integrated development of culture and tourism in the Yangtze River Economic Belt exhibits significant spatial dependence in its influence on livelihood well-being [3]. Li et al. utilize the coupling coordination model and obstacle degree model to find that the coupling coordination between tourism and livelihood well-being in the coastal urban agglomerations of Guangdong, Fujian and Zhejiang has been steadily improved. Nevertheless, talent shortages and inadequate social support act as principal constraints hindering their synergistic advancement [4]. Wang and He conduct empirical analyses grounded in the Spatial Lag Model to reveal positive spatial spillover effects of digital inclusive finance in enhancing common prosperity and livelihood well-being [5].
At the nexus of economic development efficiency and factor allocation mismatch, Cui et al. integrate spatial econometrics with mediation effect models to validate the heterogeneous impacts of coordinated two-way Foreign Direct Investment (FDI) development on resource misallocation, as well as the spatial transmission mechanisms of high-quality economic development under carbon neutrality constraints [6]. Furthermore, Liu et al., Fang and Yang successively applied the super-efficiency slack-based measure (SBM) and epsilon-based measure (EBM) models to examine the industrial ecological efficiency of the Yangtze River Economic Belt, and the Dagum Gini coefficient to analyze rural industrial integration efficiency nationwide, systematically revealing their gradient spatial differentiation patterns and underlying causes, thereby offering methodological and empirical references for research on regional efficiency disparities [7,8].
Some studies [9,10] predominantly apply coupling coordination models to assess the synergy between economic development and livelihood well-being [11,12]. However, these approaches are largely confined to qualitative identification of overall coordinated [13,14] or imbalanced system states, lacking direct quantitative characterization of mismatch features manifested through structural deviation and relative decoupling [15]. Moreover, conventional empirical studies have generally proceeded under a spatial homogeneity assumption, overlooking the heterogeneity of regional industrial structures and locational endowments. As a result, substantial gaps remain in our knowledge of the spatiotemporal evolutionary patterns, spatial differentiation characteristics, and distinct driving mechanisms of the mismatch between livelihood well-being and economic development efficiency.
Building upon the aforementioned research gaps, this study makes three primary contributions. First, it constructs a dual-dimensional analytical framework encompassing livelihood well-being and economic development efficiency, focusing on structural deviation characteristics to quantitatively identify the degree of mismatch between the two systems; this overcomes the analytical limitation of traditional studies that concentrate solely on coupling coordination while neglecting structural mismatch. Second, by integrating the entropy weight method, mismatch index measurement, spatial visualization, and the geographically and temporally weighted regression (GTWR) model [16], it systematically reveals the spatiotemporal evolutionary patterns and spatial differentiation characteristics of the dual-system mismatch. Third, from the perspective of spatiotemporal heterogeneity, it precisely identifies the differentiated driving mechanisms underlying mismatch phenomena, overcoming the limitation imposed by the spatial homogeneity assumption inherent in conventional empirical research, thereby enriching the theoretical and empirical framework for coordinated regional development of livelihood well-being and economic development efficiency.
This study anticipates the following principal findings.
- The overall levels of livelihood well-being and economic development efficiency are expected to improve steadily, exhibiting a marked core–periphery gradient pattern.
- Although the degree of dual-system mismatch is expected to show an overall alleviating trend, spatial disequilibrium is anticipated to remain prominent, with a persistent spatial differentiation pattern characterized by higher mismatch in the north and lower mismatch in the south, alongside localized polarization.
- The underlying driving mechanisms are expected to exhibit significant spatiotemporal heterogeneity. Specifically, road network density is likely to exacerbate the mismatch, whereas the other driving factors are expected to effectively mitigate it.
Together, these results are expected to provide scientific evidence and decision-making support for differentiated, zonal, and coordinated sustainable development in Hebei Province.
2. Materials and Methods
2.1. Overview of the Study Region
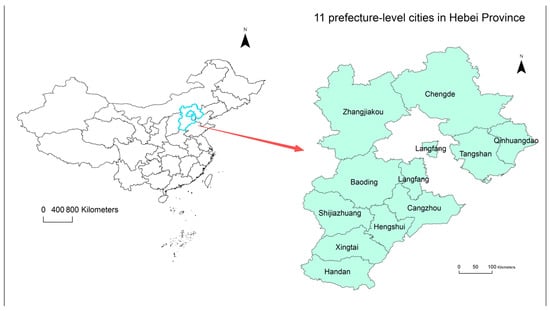
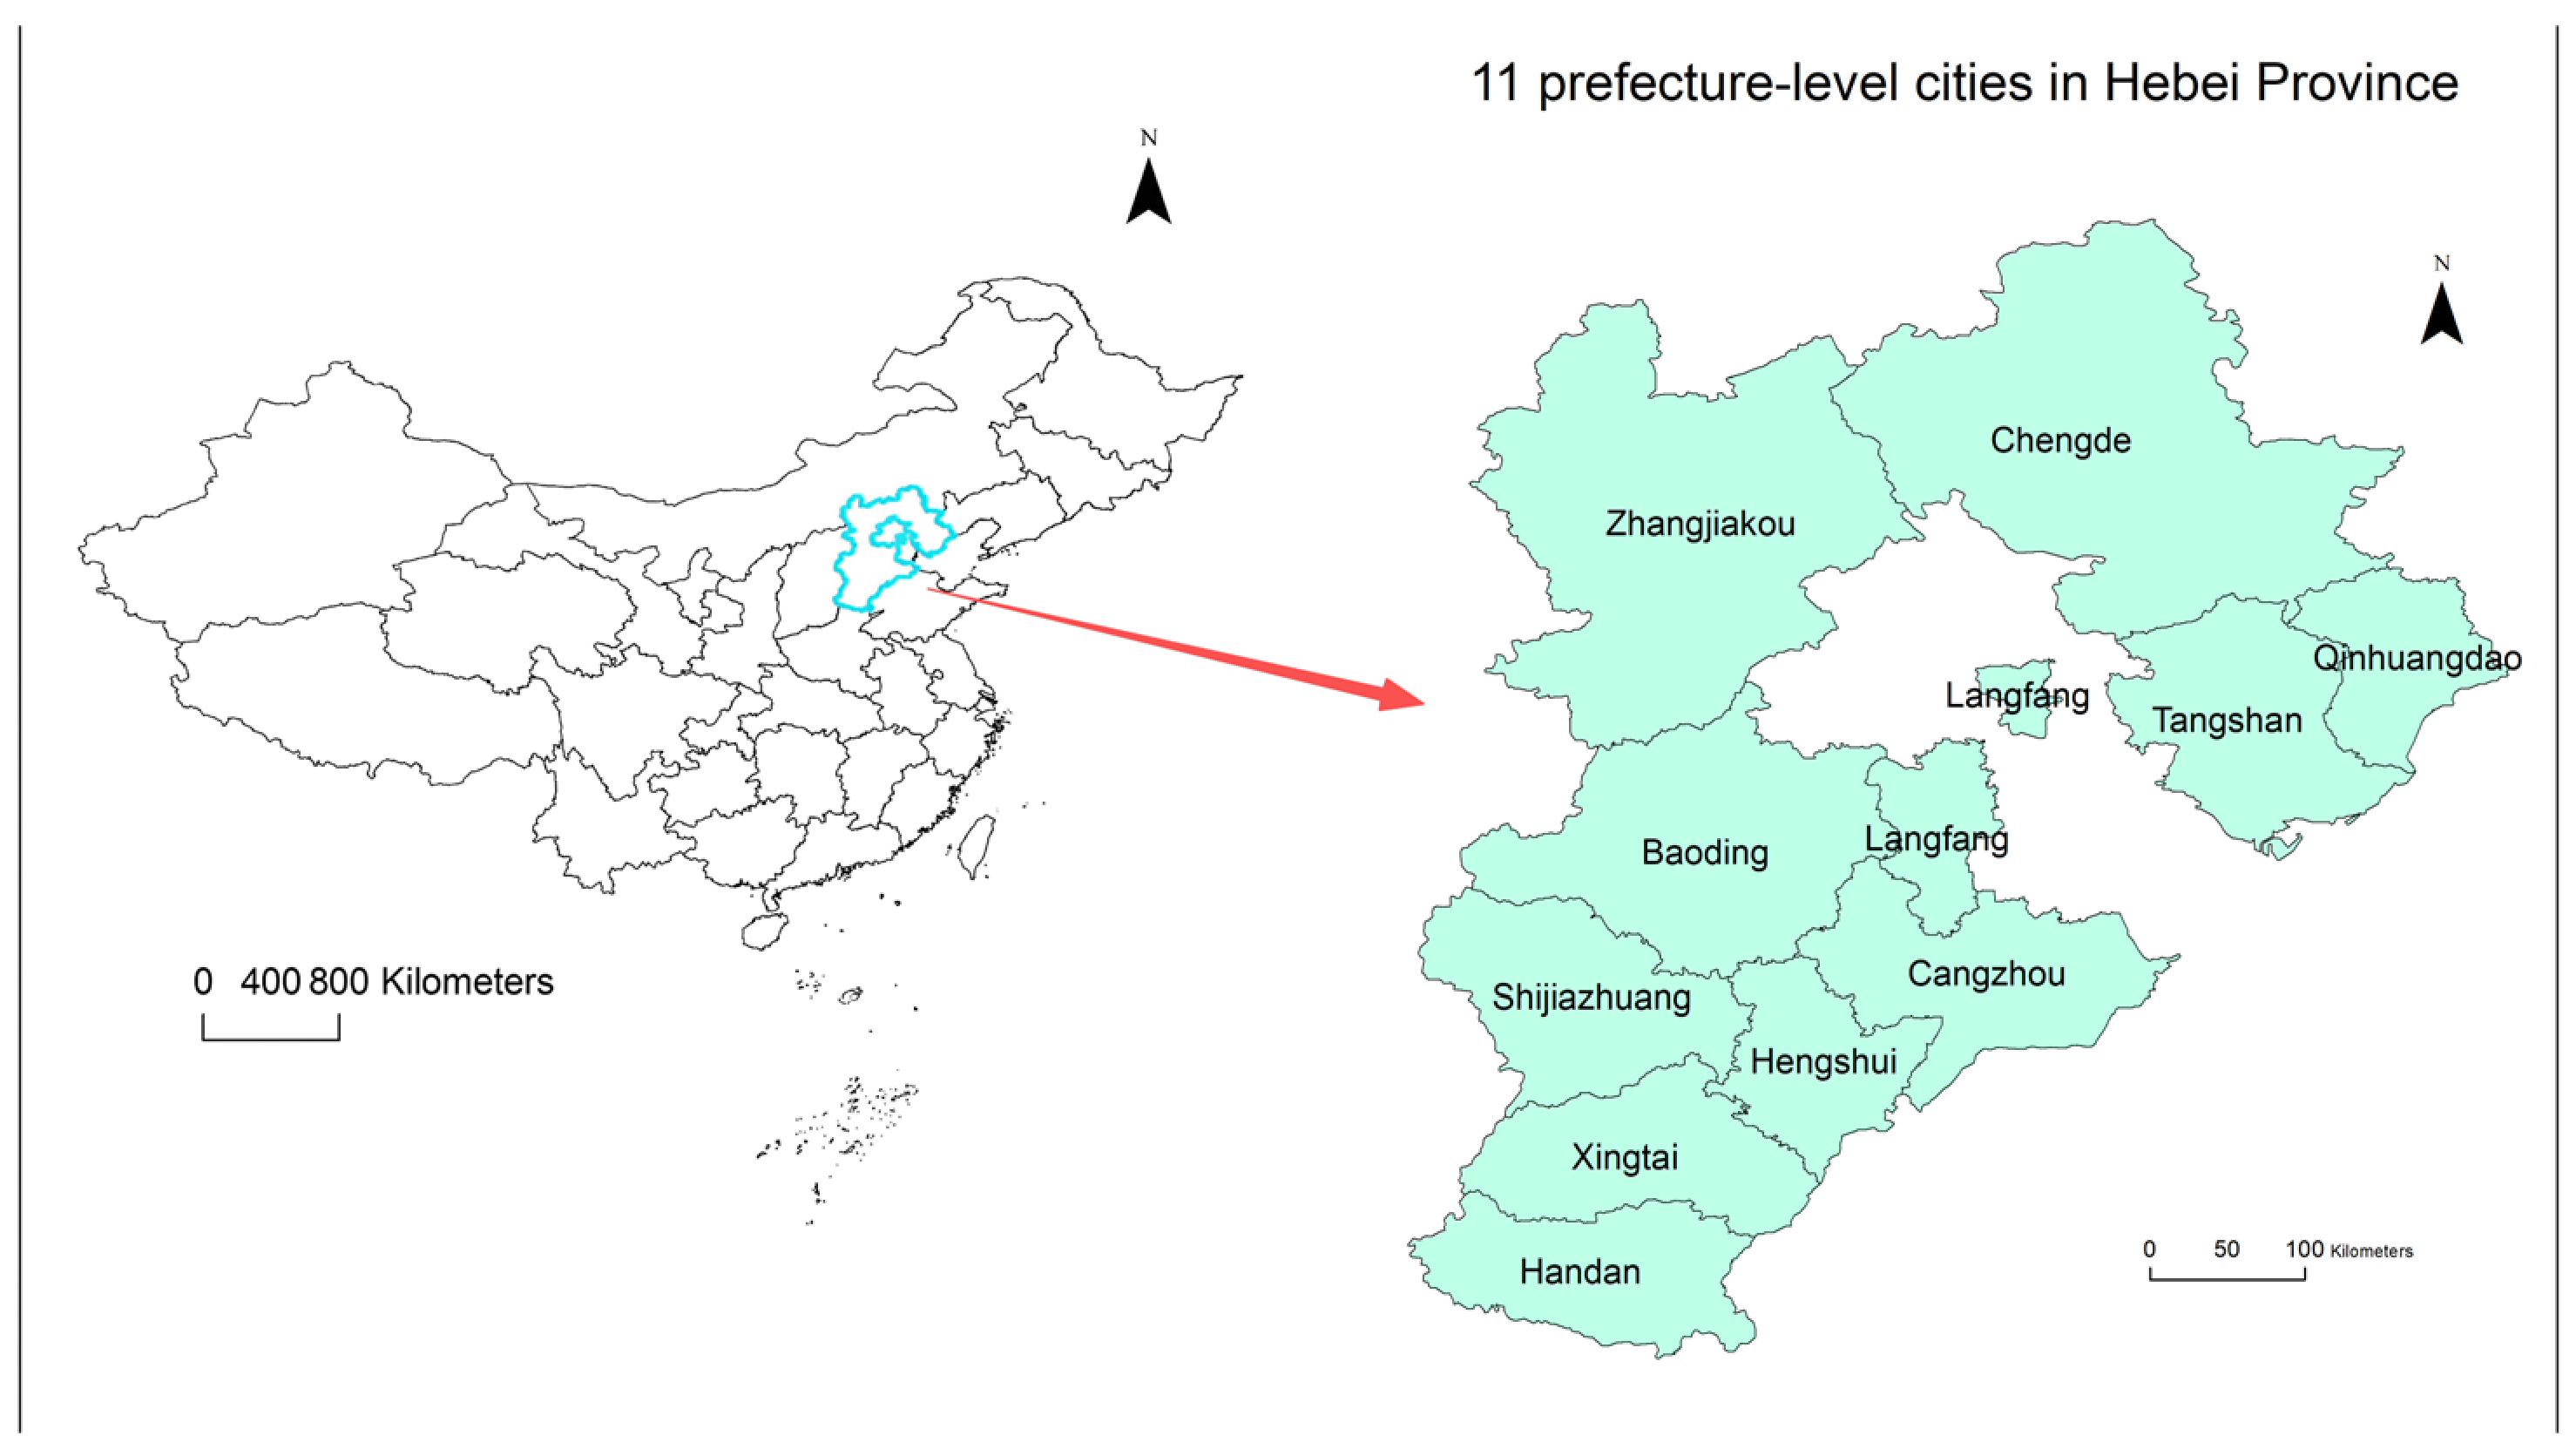
The study area is Hebei Province (as shown in Figure 1) including 11 prefecture-level cities situated within the core zone of the BTH coordinated development region. Characterized by diverse geomorphological features-including coastal plains, the Yanshan-Taihang mountainous areas and the Bashang Plateau, this region exhibits pronounced heterogeneity in economic development foundations and livelihood conditions. The analysis covers the period from 2019 to 2024, which provides complete municipal panel data meeting the methodological requirements for entropy weighting, spatial visualization and GTWR modeling.
Figure 1.
Study region: Hebei Province.
2.2. Data Sources
Data were obtained from the Hebei Statistical Yearbook, the China Urban Construction Statistical Yearbook, and the National Economic and Social Development Statistical Communiqués of prefecture-level cities in Hebei Province. Drawing on the existing literature and taking into account data availability and representativeness, this study selected livelihood well-being indicators from a sustainable development perspective, across four dimensions: economic foundation, social security, ecological environment, and cultural services [17,18]. More specifically, the economic foundation constitutes the material prerequisite for livelihood improvement; social security and welfare establish a risk-buffering safety net that protects residents against vulnerabilities; the ecological environment ensures basic health protection for human settlements; and public cultural services meet higher-order spiritual and cultural needs. Collectively, these dimensions capture the comprehensive development level of regional livelihood well-being. And economic development efficiency indicators [19,20] across five dimensions (green efficiency, openness and innovation, industrial structure, developmental support, and market vitality-green development efficiency) capture the resource–environment trade-offs and factor productivity inherent in economic growth. Openness and innovation capacity embodies the core driving force underpinning high-quality development; industrial structure reflects regional industrial evolution and the developmental state of the real economy; developmental support capacity provides foundational guarantees through fiscal resources and urban spatial infrastructure; and market vitality captures the dynamics of domestic-consumption-driven economic circulation. Together, these four dimensions constitute a comprehensive indicator system for evaluating the degree of structural mismatch between the two dimensions, as listed in Table 1. These data are authoritative, objective, and temporally continuous, providing robust empirical support for this analysis. IQR, Z-score(|Z| > 3. 0), MAD(|Z| > 3. 0) outlier test methods [21,22] were used to estimate the outlier situation [23]. The test result is shown in Table 2. Among the 1386 values, 33 were identified as outliers, accounting for approximately 2. 4% of the total, and 20 of these outliers were concentrated in Tangshan, a nationally designated demonstration zone for industrial transformation and upgrading. Relative to the pace of industrial transition in some southern Hebei cities, Tangshan’s high secondary-industry share represents a structurally elevated level attributable to its industrial positioning. The remaining outliers in other cities similarly reflect city-specific regional circumstances. Because all of these outliers are genuine values verified against official yearbooks and documents, we retained them as valid observations in this study.
Table 1.
HW-DED Index System.
Table 2.
Outlier test results of the data.
To eliminate dimensional differences among indicators, all raw variables were normalized using the min-max method before analysis.
2.3. Methodology Framework
2.3.1. Comprehensive Evaluation
Separate normalization equations were applied to positive (benefit-oriented) and negative (cost-oriented) indicators:
For positive indicator Xij, the normalized is calculated in Equation (1), and negative indicator is calculated in Equation (2), where i is the indicator order.
Then, the proportion Pij of indicator i for sample j is calculated in Equation (3).
The entropy value of i-th indicator is calculated in Equation (4), where n is the total number of samples; if Pij = 0, let PijlnPij = 0.
The entropy redundancy (difference coefficient) gi is defined in Equation (5).
gi = 1 − ei
The weight of the i-th indicator is defined in Equation (6). The entropy weight method [24] was subsequently adopted to calculate the weight for each primary indicator, where m is the total number of evaluation indicators.
The composite index is then computed in Equation (7), where Sij represents the composite index; X indicates the normalized value; and Wi denotes the weight of the individual indicator.
2.3.2. Mismatch Index Measurement
The coupling coordination model is widely regarded as a robust analytical framework for characterizing multi-variable interactions across distinct systems, effectively capturing the synergistic effects and holistic efficacy of coupled systems [25,26]. To quantify the structural imbalance between livelihood well-being and economic development efficiency, a mismatch index M based on the coupling coordination degree model is defined in the following equations.
where C is the coupling degree; T is the comprehensive coordination index; D is the coupling coordination degree; W and E are composite indices of livelihood well-being and economic development efficiency. M characterizes the degree of divergence from a synergistic state. To focus specifically on mismatch and imbalance, a directional transformation is applied to define the mismatch index as M = 1 − D [27]. This transformation preserves the information structure of the original coupling coordination model; it merely reorients the conceptual focus of the indicator from “level of synergy” to “degree of mismatch,” thereby permitting direct interpretation of regression coefficients in terms of each factor’s impact on mismatch intensity. Higher values of M signify greater decoupling between the internal structures of the two systems and an increasingly obstructed dividend-conversion mechanism, whereby the linkage between the internal efficiency factors of the economic system and the internal welfare factors of the livelihood system becomes fractured, and the dividend generated by economic growth fails to translate into tangible improvements in residents’ livelihoods. The mismatch index M is bounded within [0, 1], with higher values indicating more severe structural misalignment between the two systems and lower values suggesting a lesser degree of mismatch and better coordination.
T = αW + βE, α = β = 0.5
M = 1 − D
2.3.3. Geographically and Temporally Weighted Regression Model (GTWR)
Building upon conventional Geographically Weighted Regression (GWR), the GTWR framework incorporates a temporal dimension to simultaneously account for spatial heterogeneity and temporal evolution [16]. This approach enables the characterization of dynamic variations in variable relationships across different spatial and temporal contexts. The model specification is expressed in Equation (12).
where yit is the dependent variable for spatial unit i at time t; (ui,vi) is the spatial coordinates of unit i; β0(ui,vi,ti) is the spatiotemporal intercept; βk(ui, vi, ti) is the spatiotemporally varying regression coefficient for the k-th independent variable; xikt is the observed value of the k-th independent variable for unit i at time t; and it is the random error.
Drawing on the multidimensional nature of structural mismatch and the specific development context of Hebei Province, and from a sustainable development perspective, this study selects seven explanatory variables across distinct dimensions, as listed in Table 3 [28,29]. Industrial structure (X1) and urbanization (X2) capture structural transformation dynamics. Government expenditure (X3) reflects local public service capacity, and the fiscal self-sufficiency ratio—proxying for local fiscal autonomy—captures the discretionary capacity of local governments to allocate funds between economic construction and public welfare protection, thereby reflecting the influence of local fiscal resource allocation on the mismatch between residents’ welfare and economic development. Opening-up (X4) and innovation-driven development (X5) represent external integration and innovation-driven development, respectively. Transportation accessibility (X6), together with a geographical location dummy variable (X7), accounts for transportation accessibility and locational advantages [30]. All indicator data are sourced from statistical yearbooks, and the validity of these indicators is well documented in the existing literature.
Table 3.
Variable selection.
Prior to model specification, multicollinearity among the seven predictor variables is diagnosed using the Variance Inflation Factor (VIF), with values from 1. 475 to 2. 219 (well below the conventional threshold of 5) and tolerance statistics are larger than 0. 45. With the results listed in Table 4, the absence of severe multicollinearity and the suitability of these independent variables for regression analysis are confirmed.
Table 4.
Summary of multicollinearity results.
To test the robustness of the conclusions, we constructed a 5-variable GTWR model by excluding two variables and adopted it as the main analytical model. The variables are listed in Table 5. Two models employed identical bandwidth selection rules to ensure the comparability of the results.
Table 5.
Simplified model variables.
To evaluate the comparative performance of GTWR approach, the model was benchmarked against Ordinary Least Squares (OLS) and GWR alternatives. The GTWR specification demonstrated superior explanatory power, as evidenced by an adjusted R2 of 0.942 and a residual sum of squares (RSS) of 0.0088, substantially outperforming both OLS (adjusted R2 = 0.762) and GWR (adjusted R2 = 0.778), as listed in Table 6. Consequently, GTWR was adopted as the analytical framework for subsequent estimations.
Table 6.
Model comparison results.
OLS denotes the panel global regression. GWR is estimated using single-year cross-sectional data, where bandwidth indicates the number of adaptive nearest-neighbor samples. GTWR is estimated using the panel dataset, where bandwidth represents the spatiotemporal composite bandwidth. N/A signifies that the corresponding parameter is not applicable [31].
GWR was fitted to single-period cross-sectional data using an adaptive Gaussian kernel, whereas GTWR employed a Gaussian kernel. Bandwidth optimization for both models was performed via cross-validation based on the AICc criterion. Given that the spatial units comprise only 11 prefecture-level cities in Hebei Province, a lower-bound constraint was imposed on the bandwidth search range to prevent coefficient instability arising from insufficient local neighborhood samples, thereby ensuring adequate sample sizes for local regressions. In GTWR, the spatiotemporal distance ratio parameter was automatically identified from the data to balance the relative weights of spatial and temporal effects. The 5-variable model follows the same GTWR modeling framework and parameter settings.
3. Results
3.1. Temporal and Spatial Evolution of Livelihood Well-Being
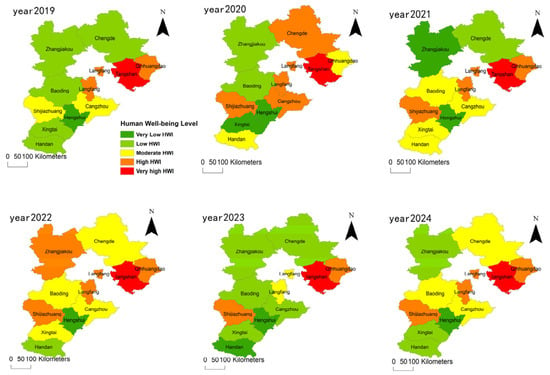
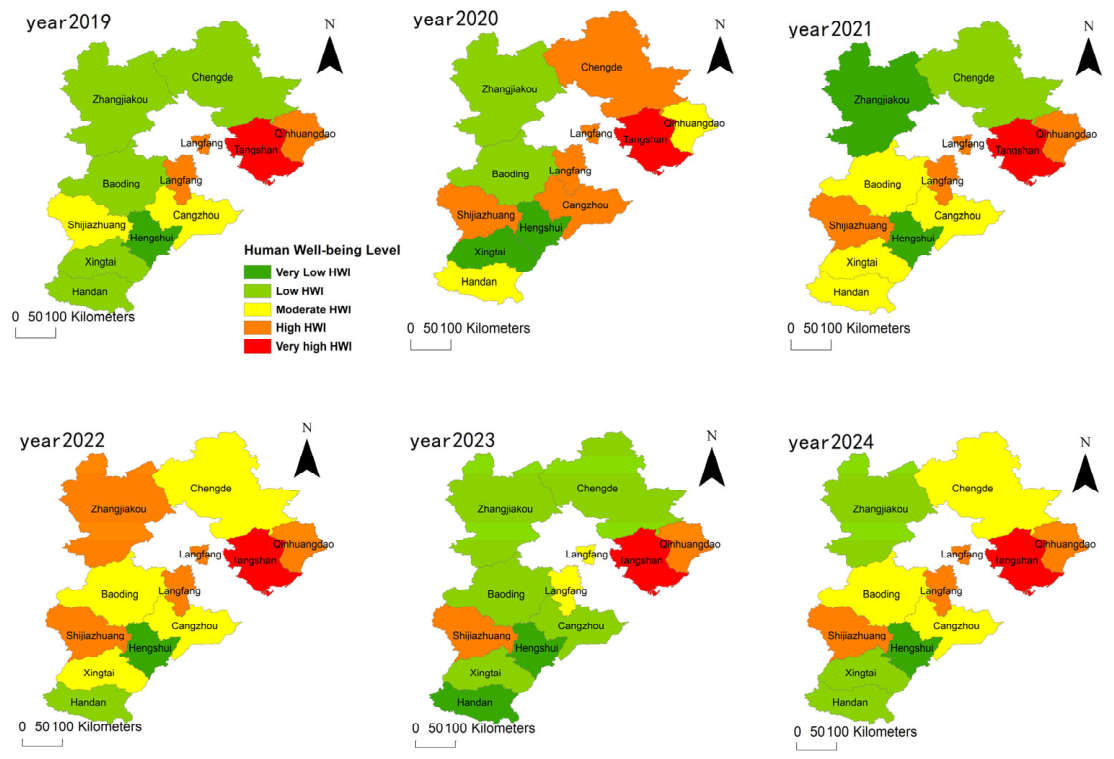
Based on the natural breaks (Jenks) method, the indices were classified into distinct levels (as shown in Figure 2).
Figure 2.
Spatial distribution map of livelihood well-being.
The livelihood well-being index (HWI) exhibited marked spatial heterogeneity, displaying a distinct core–periphery gradient centered on Tangshan, with elevated levels in central and coastal municipalities and comparatively depressed levels in northern and southern peripheral cities. Temporally, the evolution showed phased fluctuations. From 2019 to 2020, significant improvements were observed in Chengde, Shijiazhuang, Cangzhou, and Handan, which transitioned from low to moderate/high well-being categories. After 2021, however, these gains reversed in Zhangjiakou, Chengde, Baoding, Xingtai, and Handan, as evidenced by contractions in moderate and high well-being zones and a resurgence of low-well-being areas. From 2022 to 2024, the spatial pattern stabilized, with only marginal fluctuations detected in Zhangjiakou and Shijiazhuang. Notably, high-well-being clusters remained persistently anchored in Tangshan, whereas low-well-being regions became increasingly entrenched.
3.2. Temporal and Spatial Evolution of Economic Development Efficiency
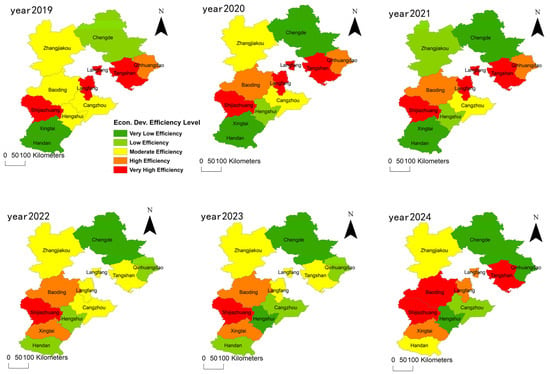
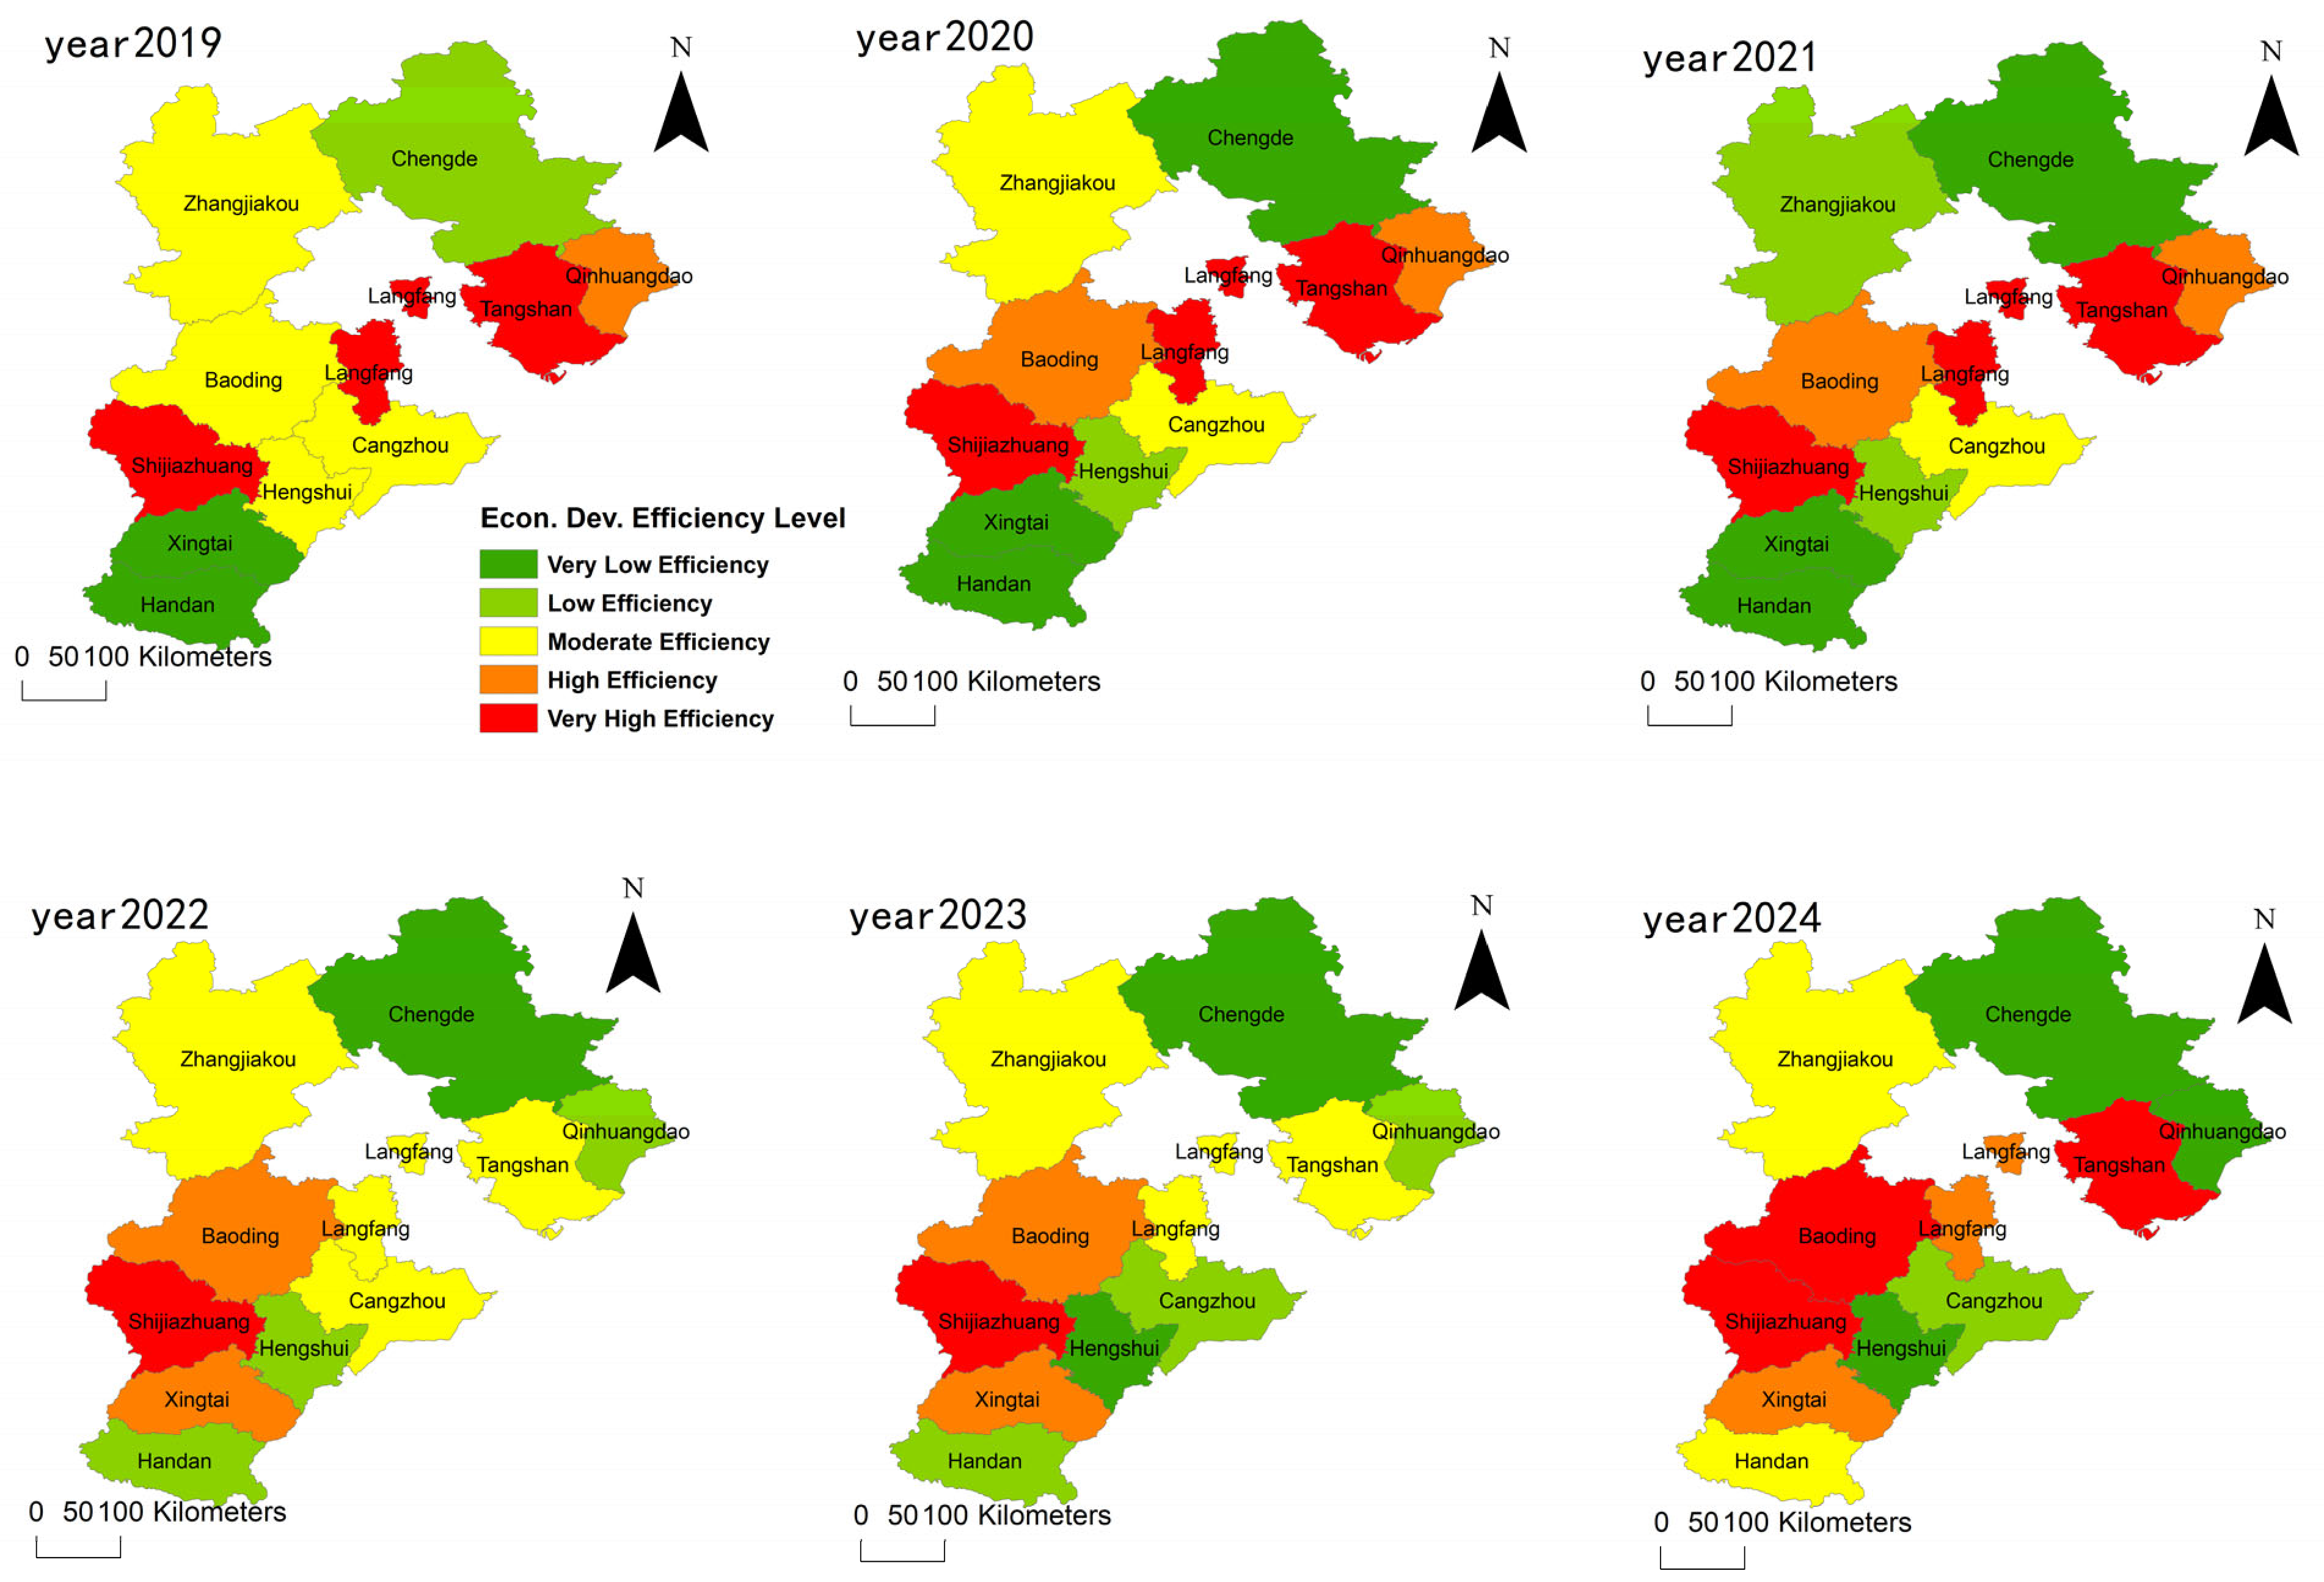
The economic development efficiency index (EDEI) exhibited pronounced core–periphery differentiation, characterized by a spatial pattern of “dual-core leadership, central support, and peripheral lag” (as shown in Figure 3). Temporally, efficiency showed a steady upward trajectory. From 2019 to 2020, substantial improvements were observed in Baoding, Shijiazhuang, and Xingtai, which transitioned from moderate- to high-efficiency categories. Subsequently, from 2021 to 2022, marginal declines occurred in Qinhuangdao, Cangzhou, and Tangshan, with these municipalities regressing from high- to moderate-efficiency zones. From 2023 to 2024, the spatial configuration stabilized and consolidated: the high-efficiency status of Shijiazhuang and Tangshan was further reinforced, Baoding upgraded from the high-efficiency tier to the highest tier, and low-efficiency areas remained concentrated in Chengde and Handan, with efficiency gains in peripheral cities progressing sluggishly.
Figure 3.
Spatial distribution map of economic development efficiency.
3.3. Analysis of the Mismatch Between Livelihood and Economy
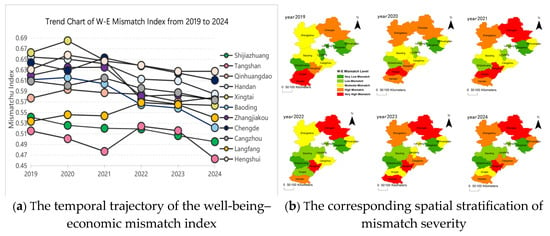
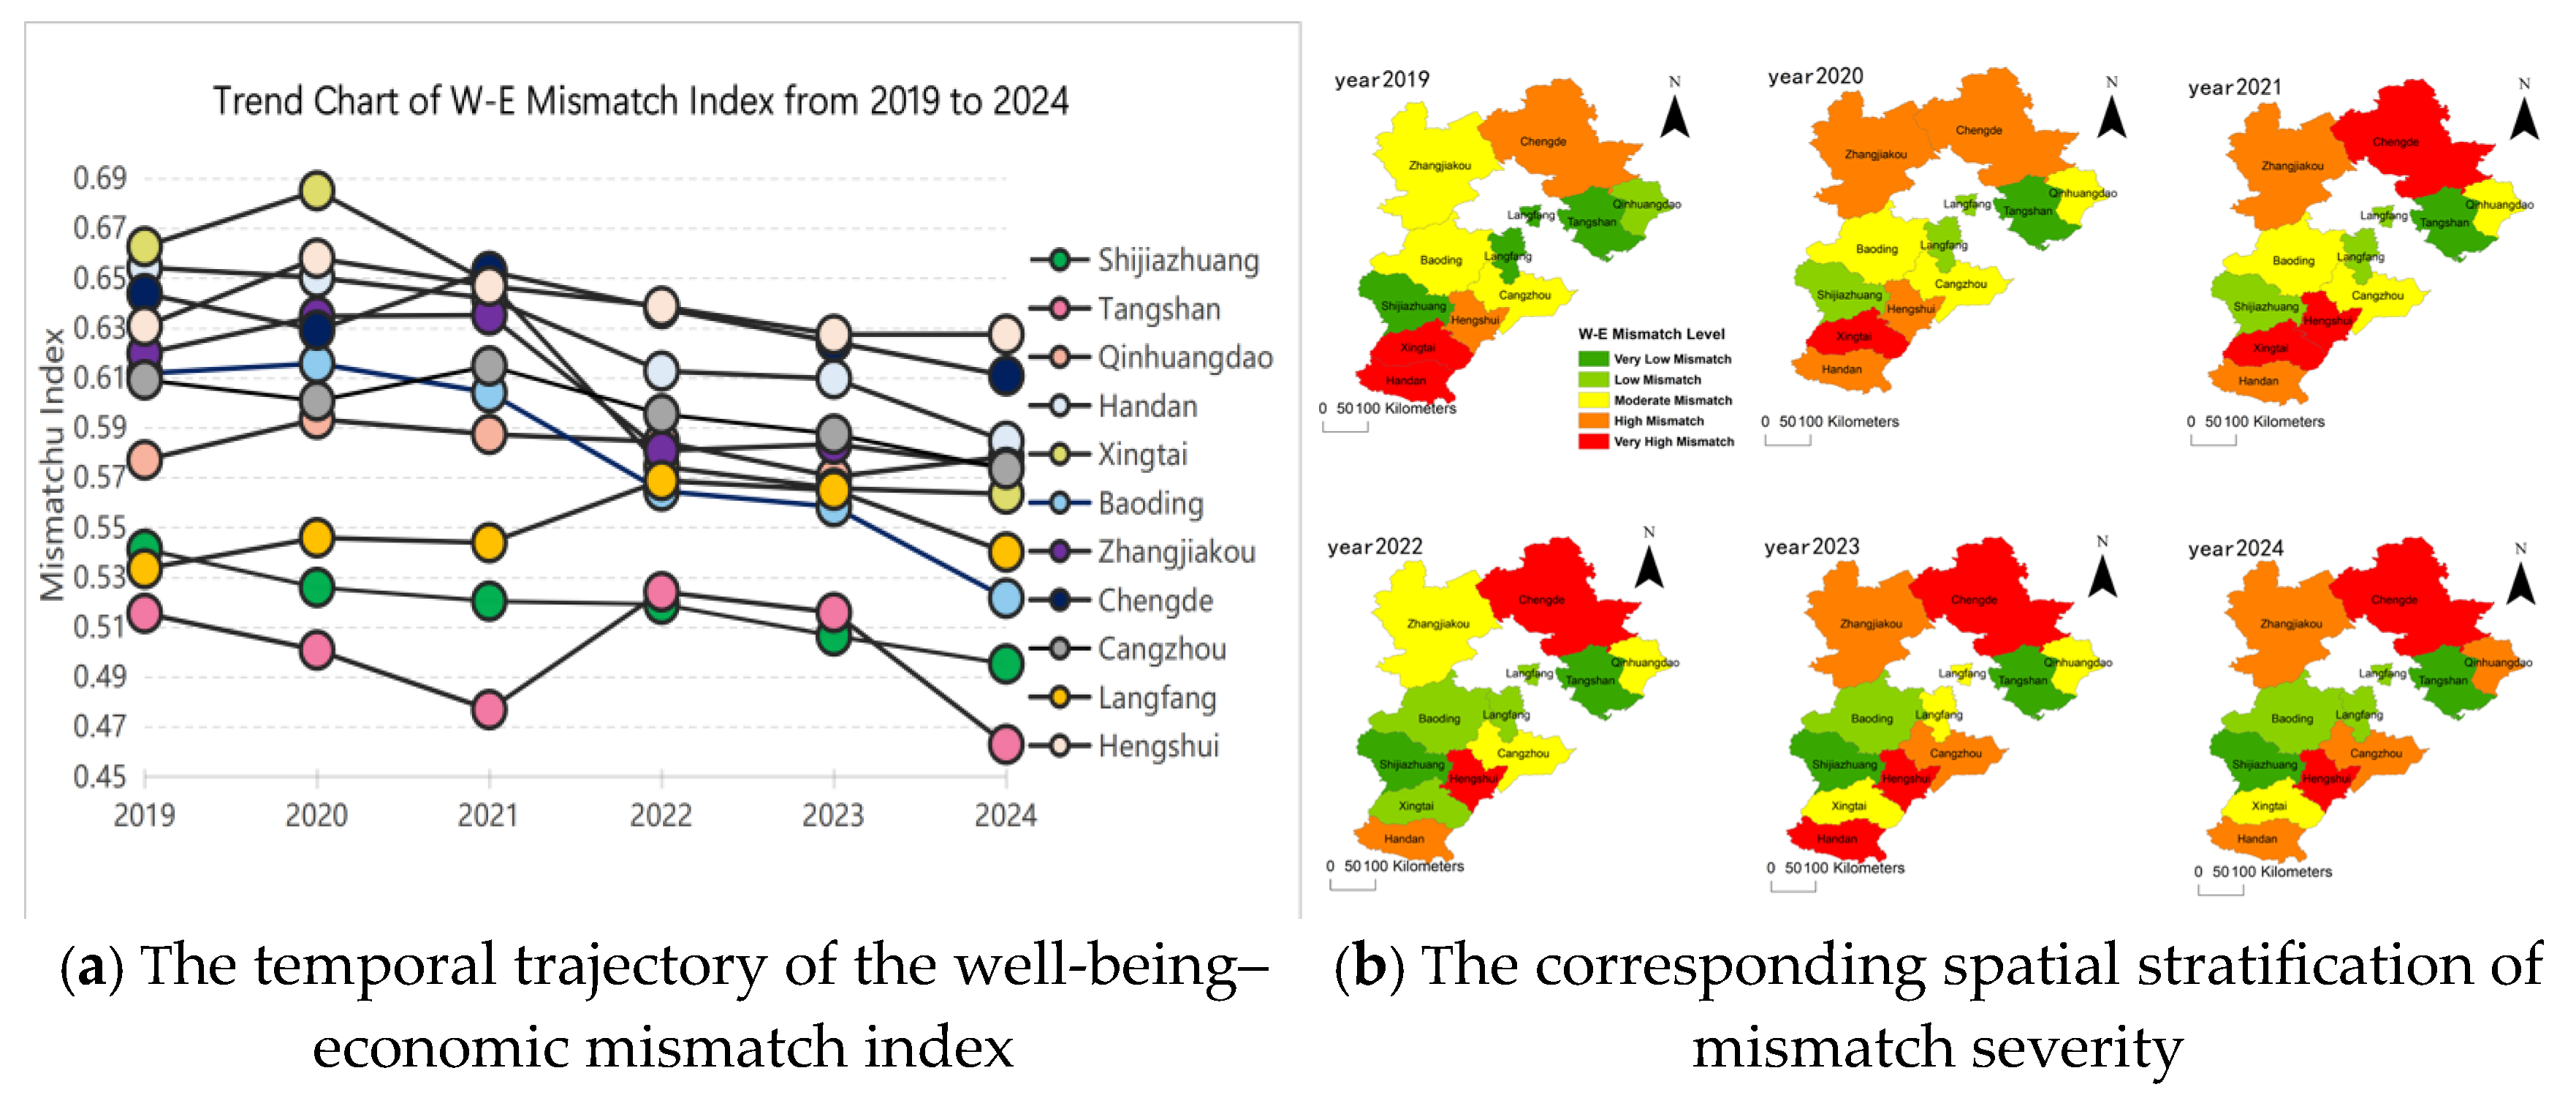
Panel (a) illustrates the temporal trajectory of the well-being–economic mismatch index across 11 prefecture-level municipalities in Hebei Province from 2019 to 2024, while Panel (b) depicts the corresponding spatial stratification of mismatch severity for each year (as shown in Figure 4). At the aggregate level, the provincial mismatch exhibited a fluctuating downward trend over the study period: most municipalities reached a transient peak in 2020, followed by sustained decline after 2021, with the entire region attaining its lowest mismatch level by 2024. Inter-municipal disparities in the index widened initially and then narrowed. Spatially, the mismatch pattern persistently maintained a configuration of “higher in the north, lower in the south, with localized polarization”: Chengde, in northern Hebei, consistently remained within high-to-extremely-high mismatch intervals, constituting the provincial core of mismatch; Handan and Xingtai, in southern Hebei, exhibited year-by-year escalation in mismatch degree, with southern polarization gradually intensifying; and Shijiazhuang and Baoding, in central Hebei, along with Qinhuangdao and Tangshan, in eastern Hebei, remained at low to relatively low mismatch levels, reflecting relatively stable well-being–economic synergies. Collectively, the north–south gradient of the spatial pattern remained fundamentally unchanged.
Figure 4.
Trend and spatial distribution map of the livelihood–economy mismatch.
3.4. Analysis of the Driving Forces of Livelihood-Economic Mismatch: A GTWR
3.4.1. Results of the Seven-Variable GTWR Model
The residuals of the seven-variable GTWR exhibit no significant global spatial autocorrelation (as listed in Table 7), indicating that the model has effectively captured spatial dependence and that the baseline model specification is reliable [32].
Table 7.
Residual global spatial autocorrelation: seven-variable GTWR model.
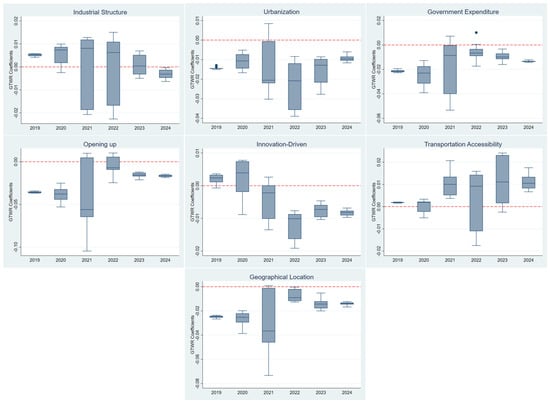
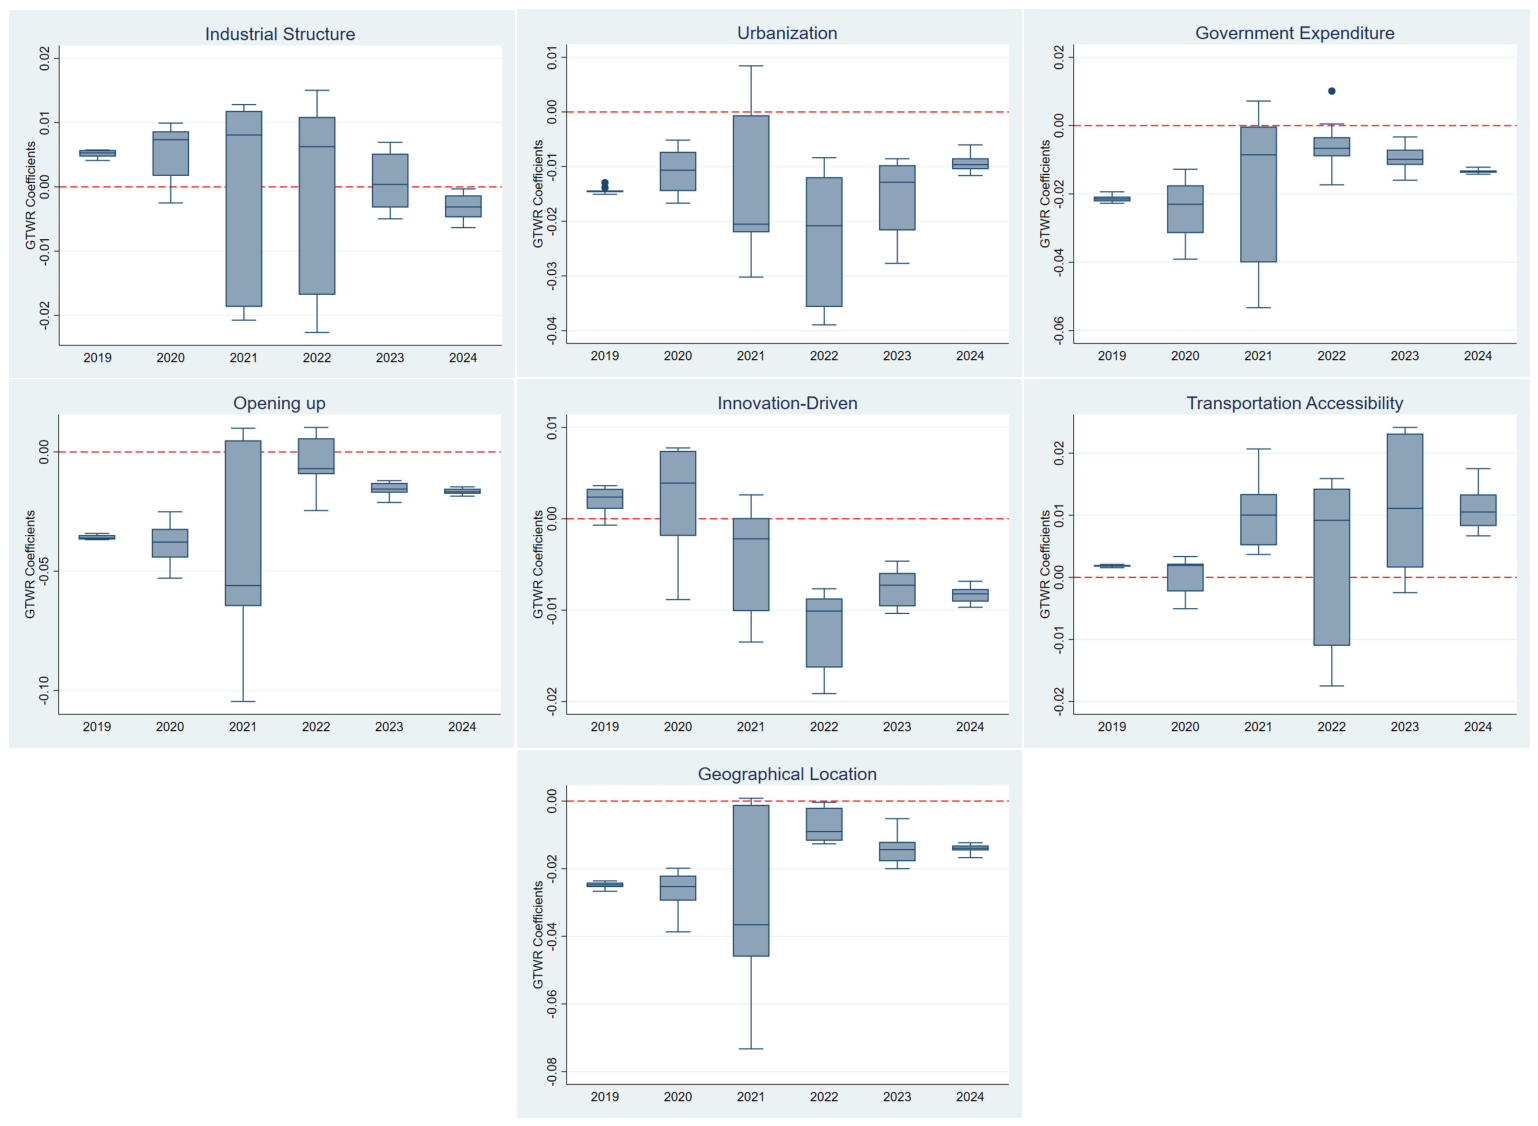
As illustrated by the GTWR regression coefficient boxplots for the 11 prefecture-level municipalities in Hebei Province during 2019–2024 (as shown in Figure 5), the influences of driving factors on the well-being–economic mismatch exhibit pronounced temporal heterogeneity. Positive coefficients denote mismatch-aggravating effects, whereas negative coefficients indicate mismatch-alleviating effects. The following section conducts a detailed analysis of spatial heterogeneity based on the five-variable GTWR model.
Figure 5.
GTWR regression coefficient time-series boxplot for seven variables (2019–2024). There are a few outliers (black dots) in urbanization and government expenditure figures.
3.4.2. Results of the Five-Variable GTWR Model
Table 8 reports the multicollinearity diagnostics for the OLS model: the VIF values of all explanatory variables range from 1.3419 to 1.7459, and the tolerance values range from 0.5730 to 0.7455, indicating no severe multicollinearity and confirming the appropriateness of the variable selection.
Table 8.
Summary of multicollinearity results.
The global Moran’s I of the residuals for the five-variable model is insignificant, indicating the absence of significant spatial autocorrelation and confirming the validity of the model specification (as shown in Table 9). The comparative results shown in Table 10 reveal that the seven-variable model attained a markedly lower corrected Akaike information criterion (AICc), indicating superior overall goodness-of-fit, whereas the five-variable model registered a marginally higher adjusted R2. Cross-model comparison of the local coefficients for X2, X3, X5, X6, and X7 demonstrates that their magnitudes, signs, and spatial differentiation patterns remained fundamentally stable, with no pronounced fluctuations or sign reversals. Consequently, the five-variable model was adopted as the final specification.
Table 9.
Residual global spatial autocorrelation: five-variable GTWR model.
Table 10.
Robustness comparison between the full and parsimonious models.
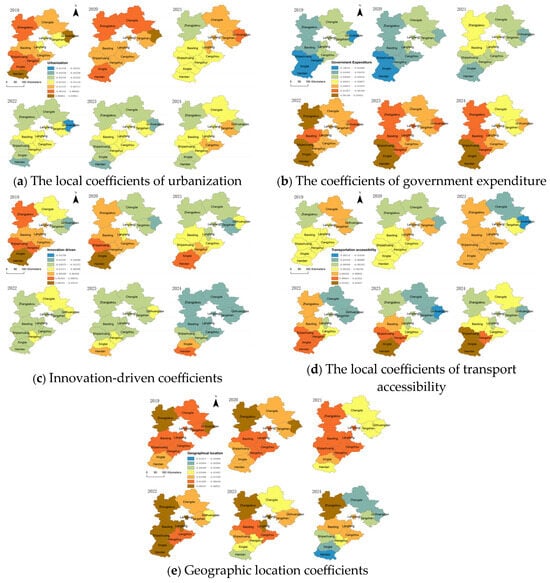
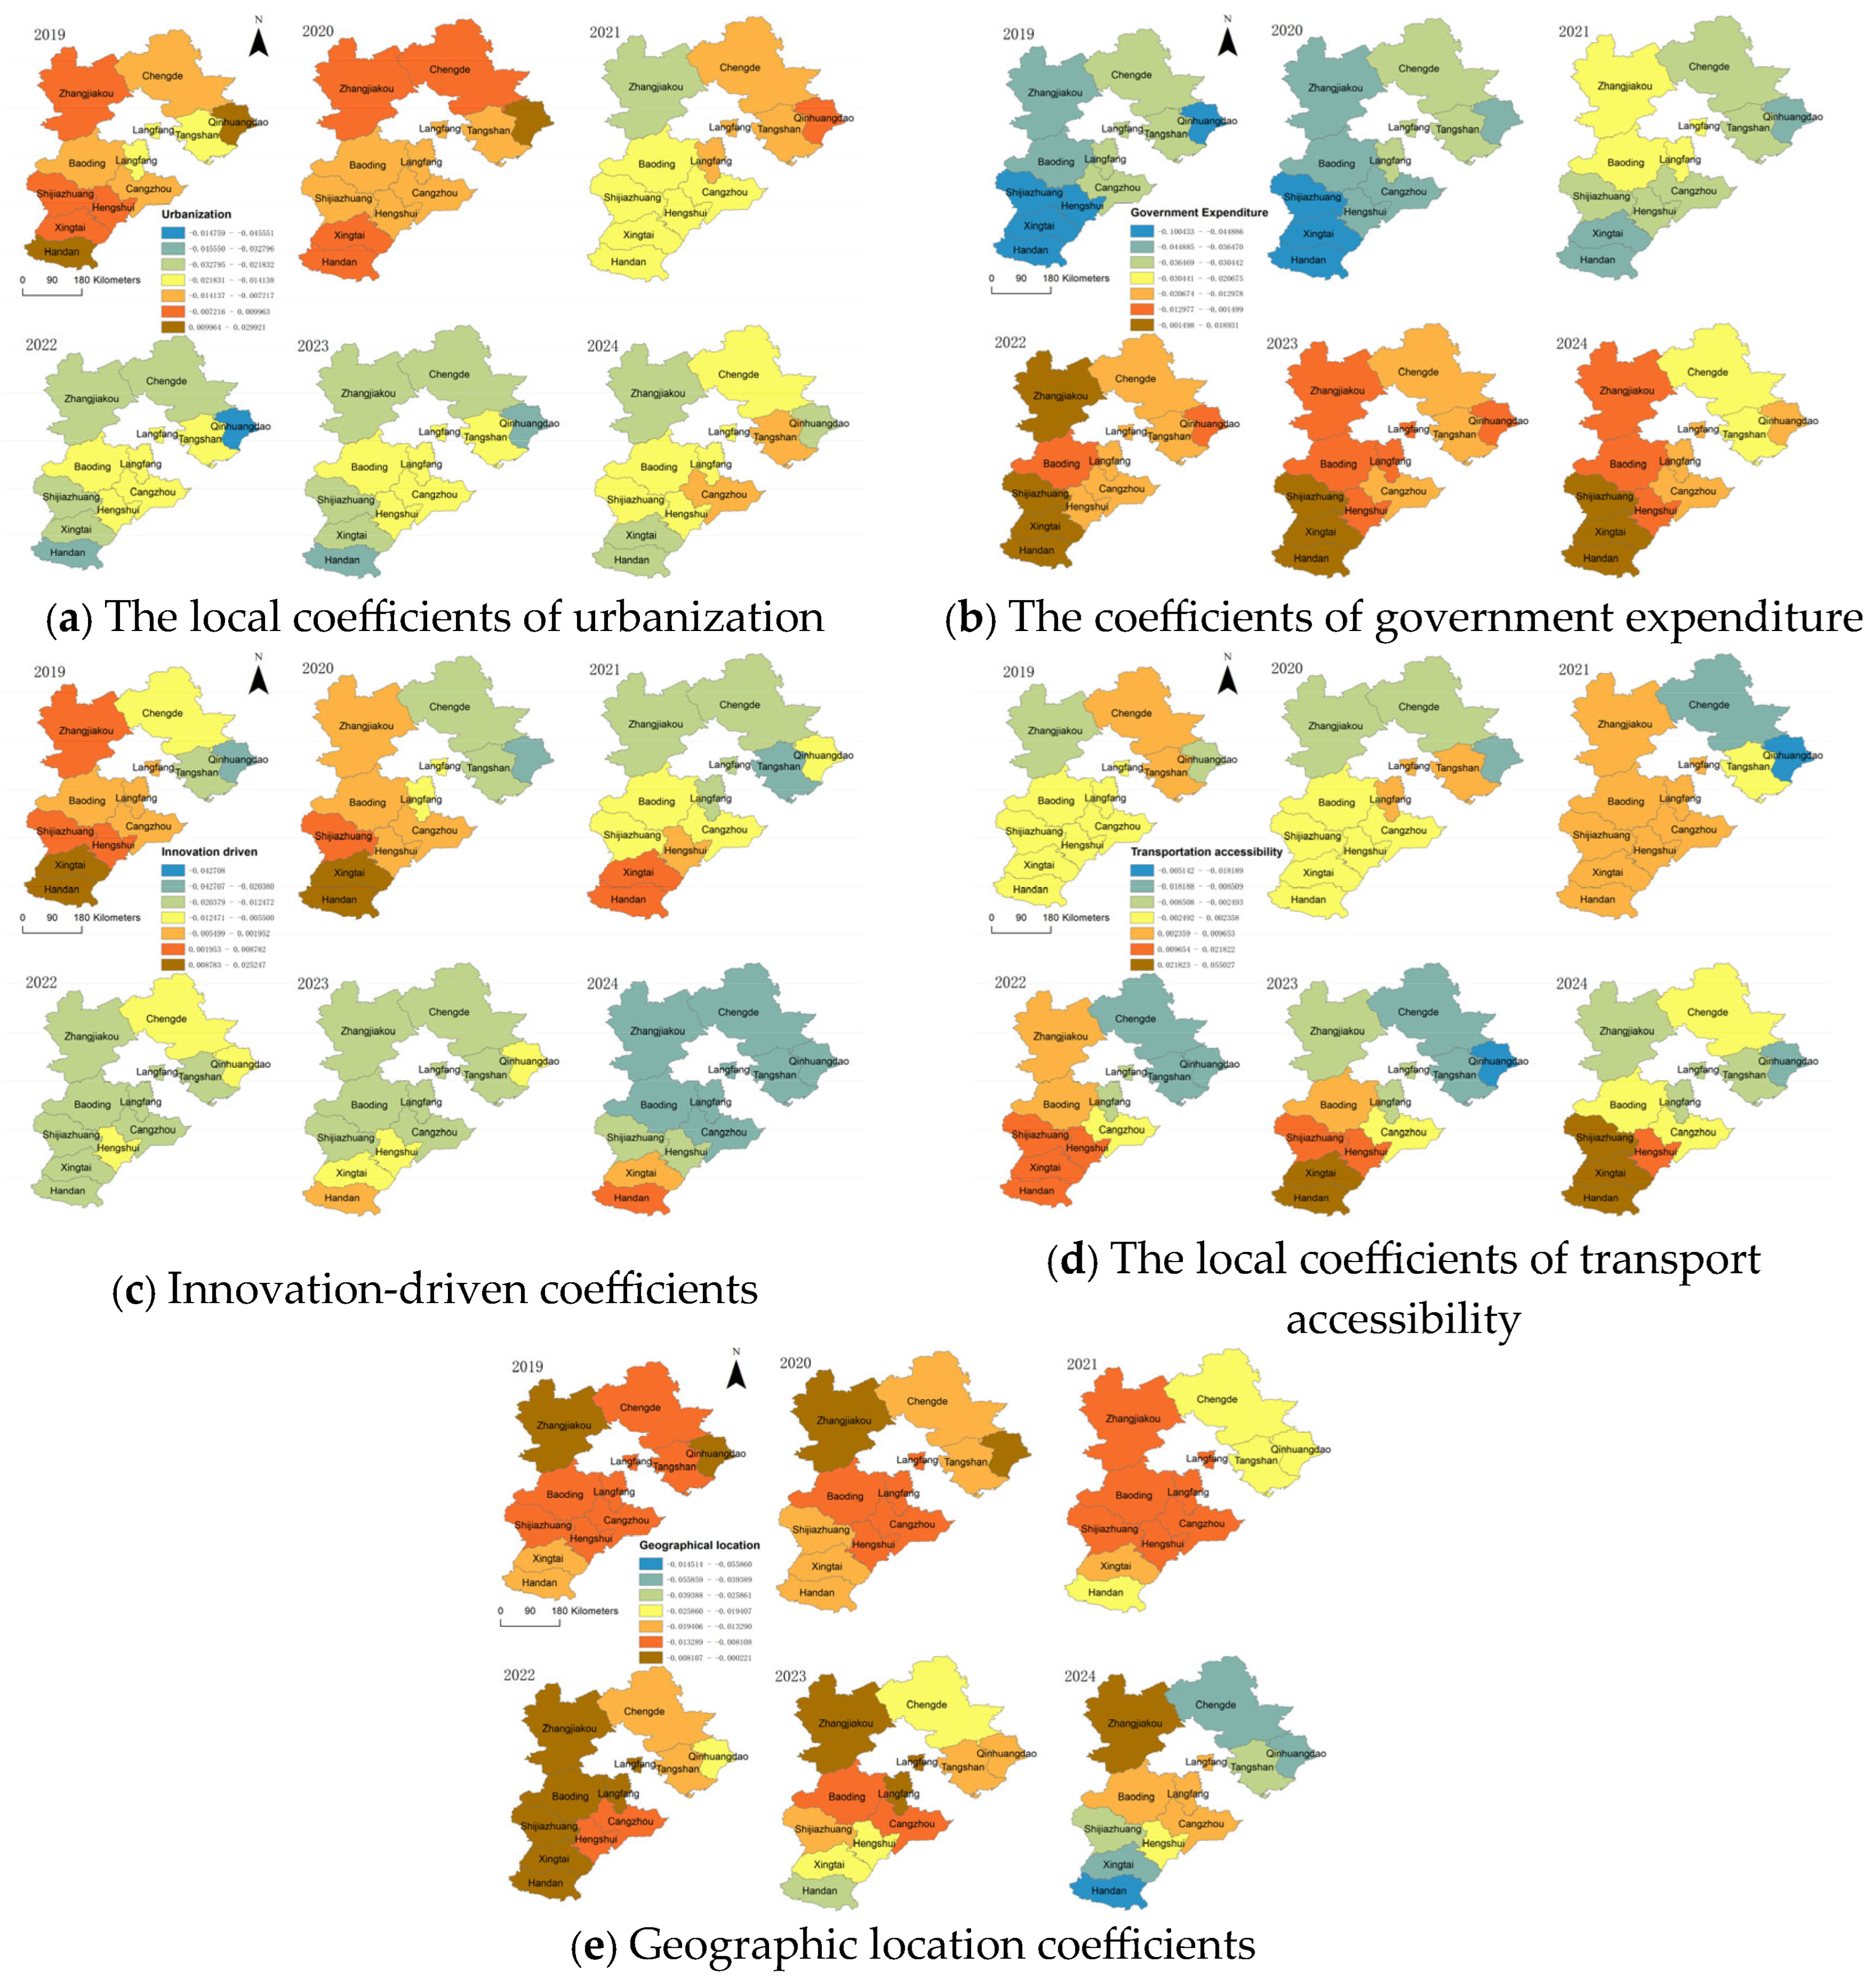
The spatial distribution of GTWR local regression coefficients for the factors influencing the mismatch between residents’ livelihood and economic development efficiency in Hebei Province from 2019 to 2024 is illustrated in Figure 6. To enable spatiotemporal comparison of the coefficients across years, a unified set of global classification breakpoints was generated using the natural breaks (Jenks) method on the full sample. All coefficient maps consistently adopt this identical breakpoint scheme for graded visualization.
Figure 6.
Spatial distribution of heterogeneous determinants of livelihood—economic mismatch.
The local coefficients of urbanization (a) exhibit a general transition from positive to negative over the study period. From 2019 to 2020, cities in northern and southern Hebei displayed significant positive effects in exacerbating the mismatch; thereafter, these positive effects continuously attenuated, indicating a progressively diminishing role of urbanization in widening the well-being–economy misalignment.
The coefficients of government expenditure (b) demonstrate a temporal shift from negative to positive. Province-wide negative effects dominated during 2019–2020, thereby suppressing the mismatch; however, after 2022, central and southern Hebei primarily exhibited positive effects, suggesting that fiscal investment has gradually amplified the misalignment between the two systems.
Innovation-driven coefficients (c) reveal pronounced spatial heterogeneity. Southern Hebei experienced strong positive effects in 2019, yet provincial coefficients generally declined after 2021, with only a few southern cities retaining positive effects by the end of the study period. This indicates a distinct regional attenuation in the amplifying effect of innovation on the mismatch.
The local coefficients of transport accessibility (d) increase continuously over time, forming high-positive clusters in southern Hebei. Transport accessibility positively enlarges the welfare–economy mismatch, as developed transportation networks accelerate cross-regional factor mobility, further aggravating the imbalance between regional livelihood supply levels and economic output capacity.
Geographic location coefficients (e) have predominantly maintained negative effects, with cities in northern Hebei (e.g., Zhangjiakou) consistently remaining within highly negative intervals. By 2024, the spatial pattern exhibited differentiation, indicating that inherent locational disparities continue to shape the spatial configuration of the well-being–economy mismatch.
4. Discussion
4.1. Analysis of the Temporal and Spatial Evolution Characteristics of Livelihood Well-Being
Livelihood well-being in Hebei Province exhibits pronounced spatial heterogeneity and periodic fluctuations. Spatially, advantageous resources continuously agglomerate in the central and coastal regions. Tangshan, leveraging industrial relocation and robust fiscal capacity, maintains superior public service provision and consistently ranks high in well-being; Langfang and Cangzhou capitalize on policy dividends from Beijing-adjacent and port-development initiatives; and Shijiazhuang benefits from the concentration of provincial capital resources. Collectively, these cities form high-welfare agglomerations. Conversely, Zhangjiakou and Chengde, constrained by ecological conservation zoning with restricted industrial development, rely predominantly on limited ecological compensation, whereas traditional heavy-industry cities such as Handan and Xingtai, affected by capacity-reduction policies and insufficient county-level livelihood investment, remain entrenched in low-welfare conditions. Together, these patterns create a stark north–south divide.
4.2. Analysis of the Temporal and Spatial Evolution Characteristics of Economic Development Efficiency
Hebei Province’s economic development efficiency is characterized by a distinct core–periphery pattern of “dual-core leadership, central support, and peripheral lag.” Spatially, Tangshan has evolved into a high-efficiency core through coastal port-development initiatives and resource-based city transformation policies, whereas Shijiazhuang has consolidated its core status through provincial capital industrial agglomeration and preferential resource allocation. Baoding and Langfang, capitalizing on Beijing–Tianjin–Hebei industrial relocation and airport-oriented economic incentives, have steadily enhanced industrial transformation efficiency as central-region cities. Conversely, Chengde remains confined to low-efficiency peripheral status due to strict industrial development constraints within ecological conservation zones, while Handan and Xingtai—constrained by capacity-reduction policies targeting traditional steel industries and protracted industrial restructuring cycles—have persistently occupied peripheral positions characterized by low efficiency. Such spatial disparities highlight the need to balance livelihood well-being and economic development efficiency, offering empirical implications for research on coordinated regional sustainability.
4.3. Analysis of the Factors Influencing the Misalignment Between Livelihood and Economic Development Efficiency
The GTWR estimations reveal pronounced spatiotemporal heterogeneity in the operation of driving forces; the impact of urbanization on the mismatch between residents’ livelihood and economic development efficiency gradually shifted from positive to negative. During the early study period, rapid urbanization drove population agglomeration into cities, yet livelihood-supporting infrastructure consistently lags behind economic expansion, aggravating systemic disequilibrium. As urbanization transitioned to a quality-oriented stage, the concurrent improvement of public service provision attenuates its role as a driver amplifying the mismatch.
Government fiscal expenditure exhibits a marked directional reversal. Early-stage spending is biased toward livelihood-oriented sectors, which alleviate the mismatch between the two systems; conversely, in the later stage, funds are increasingly channeled into industrial infrastructure, creating a disconnect between the pace of regional economic growth and livelihood improvement and thereby elevating the degree of mismatch.
The positive effect of innovation-driven development attenuates over time. Early-stage innovation activities in southern Hebei activate local economic vitality, but the insufficient inclusiveness of innovation outcomes hinders their synchronous translation into livelihood welfare. As innovation resources underwent spatial agglomeration, their pull effect on the mismatch is gradually weakened.
Transport accessibility serves as a critical factor amplifying the livelihood–economy mismatch. The continuous improvement of transportation networks in southern Hebei accelerates the spatial concentration of capital, labor, and other production factors into advantaged cities. While economic efficiency in these core areas rises rapidly, the spatial allocation of livelihood resources exhibits pronounced temporal lag, thereby exacerbating intra-regional imbalances between livelihood supply and economic development and engendering a pattern characterized by rapid economic agglomeration yet sluggish livelihood catch-up.
As a persistent underlying condition, geographic location structurally shapes the mismatch. Constrained by natural conditions, northern Hebei faces elevated costs in livelihood infrastructure construction, and enduring locational endowments continue to widen inter-regional disparities between the livelihood and economic systems. Together, these factors constitute a fundamental driver of the spatial differentiation in mismatch patterns.
5. Conclusions
5.1. Findings
Using panel data from 11 prefecture-level cities in Hebei Province over 2019–2024, this study constructs a dual-dimensional evaluation system encompassing livelihood well-being and economic development efficiency, and systematically examines the spatiotemporal evolutionary characteristics and underlying driving mechanisms of the structural mismatch between the two systems. The principal findings are summarized as follows.
- The developmental levels of the livelihood and economic systems improved steadily during the study period, yet exhibited pronounced “core–periphery” gradient differentiation. After 2021, several cities experienced a decline in their indices. Shijiazhuang and Tangshan, as dual-core cities, constituted low-mismatch leading zones, whereas peripheral cities such as Chengde and Xingtai persistently lagged behind, revealing clearly entrenched spatial hierarchies of “dual-core versus periphery.”
- Structural mismatch constitutes a phenomenon distinct from coordination deficiency, with the well-being–economy mismatch exhibiting evolutionary characteristics of “high-level fluctuation and overall convergence” over time. Despite the continuous decline in provincial mean values, certain cities in northern and southern Hebei remained chronically trapped in high-mismatch predicaments, engendering a disequilibrium pattern of “overall gradual alleviation yet local differentiation” in regional coordinated development.
- Driving factors manifest significant spatiotemporal heterogeneity. Road network density, under specific spatiotemporal contexts, paradoxically exacerbates the mismatch, exhibiting “asymmetric effects” that diverge from the conventional wisdom that improved road networks facilitate the spillover of public services. This finding corroborates the analytical framework proposed by Liang et al. regarding the efficiency of financial resource allocation [33], extending its logic to the domain of physical infrastructure. Namely, that physical connectivity per se does not automatically translate into welfare equalization. Furthermore, the influences of individual factors demonstrate pronounced spatiotemporal non-stationarity, with their directions and intensities exhibiting differentiated response patterns contingent upon geographic location and transformation stages.
5.2. Policy Implication
Building upon the foregoing findings, optimizing the well-being–economy nexus in Hebei Province and strengthening sustainable development necessitate adhering to the principles of place-based differentiation and sector-specific governance, thereby avoiding one-size-fits-all policy prescriptions.
- For peripheral municipalities exhibiting severe mismatch—including Chengde, Xingtai, Handan, and Hengshui—policy priorities should focus on enhancing employment inclusiveness in the course of industrial upgrading. This entails integrating vocational training systems with industrial transformation initiatives and developing labor-absorbing advanced manufacturing and consumer-oriented service industries, thereby mitigating the employment shocks associated with the phase-out of traditional industries. Furthermore, infrastructure investment portfolios should be rebalanced toward livelihood-oriented expenditures, preventing excessive crowding-out of public service resources by transportation investment and facilitating the transmission of economic dividends into the well-being domain.
- For moderately mismatched central cities—including Langfang, Baoding, Cangzhou, and Qinhuangdao—policies should capitalize on their proximity to the Beijing–Tianjin metropolitan area to accommodate industrial relocation while upgrading public service provision, particularly in education and healthcare. Such efforts should advance the equalization of essential public services and enhance the efficiency with which industrial agglomeration translates into well-being improvements.
- For core cities exhibiting low mismatch levels, such as Tangshan and Shijiazhuang, strategies should leverage their radiating capacity to narrow regional disparities through gradient industrial transfer and paired-assistance mechanisms in public service delivery. These cities should also pioneer development models that reconcile industrial upgrading with inclusive well-being sharing, thereby providing scalable paradigms for provincial replication.
- At the provincial level, authorities should institute an integrated monitoring and evaluation framework that prioritizes coordinated well-being–economic development. This necessitates de-emphasizing GDP-centric metrics in favor of differentiated assessment criteria tailored to regional characteristics, thereby creating institutional incentives for channeling economic achievements into tangible well-being gains.
5.3. Limitations and Prospects
This study is subject to several limitations. First, the spatial scope is constrained to prefecture-level cities, precluding the examination of mismatch heterogeneity at the county level; the underlying micro-level formation mechanisms thus warrant further validation using finer-scale datasets. Second, the selection of driving factors predominantly emphasizes economic structure indicators. Future investigations should incorporate novel variables—including ecological constraints, policy shocks, and the digital economy—to provide a more comprehensive explanation of the formation and evolutionary dynamics of the mismatch. Third, the mismatch index is derived from the coupling coordination degree model. Subsequent research could expand the methodological repertoire to encompass multidimensional mismatch measures—such as resource misallocation and factor market distortions—thereby enabling comparative analyses of spatial interdependencies and transmission channels across different dimensions.
Future research may pursue the following avenues. First, future studies could scale down the analytical resolution to the county level to elucidate the spatial micro-mechanisms governing mismatch patterns. Second, cross-provincial comparative studies could juxtapose Hebei’s experience against the Yangtze River Delta and Pearl River Delta regions to distill both universal principles and context-specific pathways for coordinated development in resource-dependent provinces. Third, machine learning methodologies could be integrated to enhance the precision of driver identification and predictive capabilities, thereby providing technical support for policy simulation and scenario analysis. Fourth, future research could incorporate regional policy orientation, industrial endowment heterogeneity, and external shocks into empirical regression tests, thereby enriching the analytical perspective on the driving mechanisms of the well-being–economy mismatch.
Author Contributions
Conceptualization, J.L. and Z.Z.; methodology, H.L. and Z.Z.; software, J.L.; validation, X.S. and Z.Z.; formal analysis, J.L.; investigation, J.L.; resources, Z.Z.; data curation, J.L. and Z.Z.; writing—original draft preparation, J.L. and Z.Z.; writing—review and editing, X.S. and H.L.; visualization, J.L.; supervision, Z.Z.; project administration, Z.Z. and H.L. All authors have read and agreed to the published version of the manuscript.
Funding
This research received funding from the General Project of the Education Department of Liaoning Province (No. LJ112410165073).
Institutional Review Board Statement
Not applicable.
Informed Consent Statement
Not applicable.
Data Availability Statement
The original contributions presented in this study are included in the article. Further inquiries can be directed to the corresponding author.
Conflicts of Interest
The authors declare no conflicts of interest.
References
- Fang, M.; Han, L.; Huang, Z.; Lu, M.; Zhang, L. Place-Based Land Policy and Spatial Misallocation: Theory and Evidence From China. Int. Econ. Rev. 2026, 67, 1159–1182. [Google Scholar] [CrossRef] [Scilit]
- Dwyer, L. ‘Measuring what matters’: Resident well-being and the tourism policy cycle. Sustainability 2024, 16, 9718. [Google Scholar] [CrossRef] [Scilit]
- Wang, Z.; Qiu, M.; Chen, Q. Spatial effects of integrated development of cultural and tourism industries on livelihood well-being in the Yangtze River Economic Belt. Resour. Environ. Yangtze River Basin 2025, 34, 2711–2726. [Google Scholar]
- Li, X.; Zhang, Y.; Lu, H. Coordination effects and obstacle factors between tourism development and livelihood well-being: A case study of the coastal urban agglomeration in Guangdong, Fujian and Zhejiang. J. Fujian Norm. Univ. (Nat. Sci. Ed.) 2025, 41, 83–91. [Google Scholar]
- Wang, K.; He, W. An Empirical Test of Digital Inclusive Finance Enabling Common Prosperity. Stat. Decis. 2024, 40, 132–137. [Google Scholar] [CrossRef]
- Cui, Y.; Zhong, C.; Cao, J.; Guo, M.; Zhang, M. Spatial effect of carbon neutrality target on high-quality economic development—Channel analysis based on total factor productivity. PLoS ONE 2024, 19, e0295426. [Google Scholar] [CrossRef] [PubMed]
- Liu, L.; Zhao, Y.; Yang, Y.; Liu, S.; Gong, X.; Jiang, P. Study on the measurement of industrial eco-efficiency, spatial distribution and influencing factors in Yangtze River Economic Belt. PLoS ONE 2023, 18, e0283964. [Google Scholar] [CrossRef] [Scilit] [PubMed]
- Fang, Y.; Yang, Y. Analysis of spatial differentiation and influencing factors of rural industrial integration efficiency in China. PLoS ONE 2026, 20, e0336477. [Google Scholar] [CrossRef] [Scilit] [PubMed]
- Cheng, M.; Hu, X. Research on coupling coordination and influencing factors of economic development and livelihood improvement in Qinghai Province. Ascent 2024, 43, 110–118. [Google Scholar] [CrossRef]
- Li, X.; Liu, K.; Tian, S. Spatiotemporal differentiation and influencing factors of coupling coordination degree between economic development and livelihood security in the Yangtze River Delta. J. Yangtze Univ. (Soc. Sci. Ed.) 2022, 45, 98–106. [Google Scholar] [CrossRef]
- Gan, S.; Hou, R. Dynamic coupling analysis of economic development and livelihood construction in Yunnan-Guizhou-Sichuan region. J. Yunnan Univ. Finance Econ. 2017, 33, 132–138. [Google Scholar] [CrossRef]
- Wang, J.; Zheng, X.; Wang, X. Empirical analysis of coupling laws between livelihood improvement and economic development in Jilin Province. Stat. Consult. 2016, 39–41. [Google Scholar] [CrossRef]
- Qi, M.; Lu, H.; Cao, S. Spatiotemporal Evolution Analysis of Economic Spatial Structure Based on the Gravity Model: A Case Study of Henan Province. Geogr. Res. 2018, 37, 883–897. [Google Scholar]
- Sun, Y.; Zhang, Y.; Zhao, Y. Spatial correlation network structure of carbon emission efficiency and its influencing factors in urban agglomerations of the Yellow River Basin. Econ. Geogr. 2025, 45, 77–84+107. [Google Scholar] [CrossRef]
- Sun, H.; Zhao, B. Spatial effect analysis of green technology innovation efficiency on regional high-quality economic development. Stat. Decis. 2024, 121–126. [Google Scholar] [CrossRef]
- Wang, H.; Zhang, B.; Liu, Y. Multidimensional Analysis of Urban Expansion Patterns and Driving Forces in the Beijing-Tianjin-Hebei Urban Agglomeration Based on the Center of Gravity-GTWR Model. Acta Geogr. Sin. 2018, 73, 1076–1092. [Google Scholar] [CrossRef]
- Fan, R.; Zhang, H. Evaluation Model of People’s Well-being and Enhancement Strategies: Based on Reliability and Structural Validity Analysis and Structural Equation Modeling. Econ. Manag. 2012, 34, 161–169. [Google Scholar] [CrossRef]
- Yu, Y.; Wang, Z. Spatiotemporal characteristics of livelihood well-being in the Yellow River Basin. Resour. Dev. Mark. 2025, 41, 1534–1540. [Google Scholar] [CrossRef]
- Yuan, C.; Peng, X.; Long, Z. Efficiency evaluation based on global entropy method and data envelopment analysis: A case study of economic development indicators in Hunan Province. J. Jishou Univ. (Nat. Sci. Ed.) 2019, 40, 61–65. [Google Scholar] [CrossRef]
- Zhao, X. Evaluation of Coupled Coordination among Water Resource Utilization, Economic Development, and Ecological Environment, and Analysis of Influencing Factors: An Empirical Study Based on 106 Cities in the Yangtze River Economic Belt. Hubei Soc. Sci. 2025, 80–91. [Google Scholar] [CrossRef]
- Deng, L.; Huang, J. Academic Assessment and Computerized Management. J. Jiangxi Norm. Univ. (Nat. Sci. Ed.) 1997, 73–77. [Google Scholar] [CrossRef]
- Zhao, Y.; Ye, L.; Zhu, Q. Characteristics and Processing Methods of Abnormal Data Clusters in Wind Power Plant Power Curtailment. Power Syst. Autom. 2014, 38, 39–46. [Google Scholar] [CrossRef]
- Huang, B.; Yang, B.; Li, M. An improved MAD method for clock bias and gross error detection. J. Wuhan Univ. (Inf. Sci. Ed.) 2022, 47, 747–752+761. [Google Scholar] [CrossRef]
- Zhang, T.; Li, M.; Xu, Y. Construction and Empirical Study of an Evaluation Indicator System for Rural Revitalization. Manag. World 2018, 34, 99–105. [Google Scholar] [CrossRef]
- Liu, Y.; Li, R.; Song, X. Analysis of the Coupling Degree Between Urbanization and the Ecological Environment in China. Acta Nat. Resour. 2005, 20, 105–112. [Google Scholar] [CrossRef]
- Wang, S.; Kong, W.; Ren, L. Common Misconceptions and Corrections of Coupled Coordination Models in China. Acta Nat. Resour. 2021, 36, 793–810. [Google Scholar] [CrossRef] [Scilit]
- Yang, G.; Gui, Q.; Zhang, F.; Gong, G.; Yang, Y. The Temporal and Spatial Characteristicsand Influencing Factors of Low-Carbon Economy Efficiency and Science and Technology Development Level in China’s Provinces From the Perspective of Uncoordinated Coupling. Front. Environ. Sci. 2022, 10, 886886. [Google Scholar] [CrossRef] [Scilit]
- Zhang, S.; Zhao, L.; Chen, X. Spatiotemporal evolution characteristics and driving factors of county-level ecological welfare performance in Shandong Province. Resour. Dev. Mark. 2026, 42, 531–541. [Google Scholar] [CrossRef]
- Zhou, C.; Luo, L.; Shi, C. Spatiotemporal Evolution Characteristics and Influencing Factors of Economic Development in the Guangdong-Hong Kong-Macao Greater Bay Area. Trop. Geogr. 2017, 37, 802–813. [Google Scholar] [CrossRef]
- Hu, X.; Zhang, Z.; Chen, X. Spatiotemporal Variations and Influencing Factors of County-Level Economic Development: A Geographical Investigation-A Case Study of Gansu Province. Geogr. Res. 2019, 38, 772–783. [Google Scholar] [CrossRef]
- Wang, H.; Zhang, B.; Liu, Y.; Liu, Y.; Xu, S.; Zhao, Y.; Chen, Y.; Hong, S. Urban expansion patterns and their driving forces based on the center of gravity-GTWR model: A case study of the Beijing-Tianjin-Hebei urban agglomeration. J. Geogr. Sci. 2020, 30, 297–318. [Google Scholar] [CrossRef] [Scilit]
- Zhao, Y. Study on a Geographic Weighted Regression Method Accounting for Global Considerations and Local Spatio-temporal Non-stationarity Differences. Ph.D. Thesis, Liaoning University of Technology, Liaoning, China, June 2017. [Google Scholar]
- Liang, H.; Li, Y.; Qi, X. Regional Financial Efficiency and Its Support for Economic Growth: A Case Study of Hebei Province. J. Tianjin Univ. Commer. 2009, 29, 22–26+69. [Google Scholar] [CrossRef]

Disclaimer/Publisher’s Note: The statements, opinions and data contained in all publications are solely those of the individual author(s) and contributor(s) and not of MDPI and/or the editor(s). MDPI and/or the editor(s) disclaim responsibility for any injury to people or property resulting from any ideas, methods, instructions or products referred to in the content. |
© 2026 by the authors. Licensee MDPI, Basel, Switzerland. This article is an open access article distributed under the terms and conditions of the Creative Commons Attribution (CC BY) license.