


Abstract
Global urbanization has reshaped grey–green spatial patterns and intensified surface urban heat islands, posing challenges for sustainable urban development. However, cross-regional multi-city studies of associations between grey–green morphology and surface UHII remain limited, while conventional urban–rural comparisons can obscure intra-urban thermal differentiation. This study applies a block–local climate zone (LCZ) framework to 150 Chinese cities across five climate zones. Clear-sky daytime Landsat 8 LST composites for June–September 2023 and multi-source spatial data were integrated at the block scale to quantify surface urban heat island intensity (UHII) and 18 2D and 3D grey–green morphological indicators. CatBoost–SHAP was used to examine predictor importance and nonlinear associations across climate zones. The mean surface UHII across the 150 cities was 1.65 °C; 138 cities showed positive values, with an overall south-high, north-low pattern. Intra-urban thermal differentiation was pronounced, with LCZ 8 exhibiting the highest surface UHII and LCZ A the lowest. At the climate-zone scale, DEM was the highest-ranked predictor in the middle temperate zone, whereas SPL_Grey ranked first in the southern temperate and three subtropical zones. At the city scale, the highest-ranked predictor shifted from DEM to SPL_Grey from north to south, while NDVI, FVC, and LAI showed recurring contributions across climate zones. SHAP dependence curves indicated model-derived response ranges, including NDVI values of 0.41–0.57 and building-density values of 10–25%. These findings provide comparative, block-scale evidence for climate-responsive grey–green spatial planning and sustainable urban heat mitigation.
1. Introduction
Global urbanization continues to accelerate. More than 50% of the world’s population currently lives in urban areas, and this proportion is projected to exceed 68% by 2050 [1]. During this process, natural green spaces such as farmland and woodland have been continuously replaced by artificial grey spaces such as buildings and roads [2]. This transformation has profoundly reshaped urban grey–green spatial patterns and, under global climate change, further intensified the urban heat island (UHI) effect [3]. UHI refers to the phenomenon in which urban temperatures are significantly higher than those in surrounding suburban or rural areas [4]. Its impacts include increased heat exposure and health risks, higher building cooling energy consumption, reduced suitable habitats for heat-sensitive species, and decreased outdoor labor productivity [5,6,7,8]. Against this background, systematically examining the relationships between grey–green spatial morphology and urban thermal conditions is important for climate adaptation and sustainable urban development.
Urban grey and green spaces together constitute a complex and dynamic urban landscape, with multidimensional effects on the urban thermal environment [9]. Grey space refers mainly to artificial built-up areas composed of buildings, roads, and other impervious infrastructure, while green space includes vegetated land such as woodland, parks, farmland, and roadside greenery [10,11]. Existing studies have used both two-dimensional (2D) and three-dimensional (3D) indicators to characterize grey–green morphology and analyze its relationship with land surface temperature (LST) or urban heat island intensity (UHII). Common 2D indicators include impervious surface ratio [12], building density [13], NDVI [14], green space ratio [15], and landscape pattern indices [16], while 3D indicators include floor area ratio [17], sky view factor [18], building height [19], and canopy height [20]. Overall, impervious surfaces tend to increase LST because of their strong heat storage capacity [21], while high building coverage intensifies local thermal stress by weakening ventilation and impeding heat dissipation [22]. Vegetation, by contrast, generally produces cooling effects through shading and evapotranspiration, and most studies have found a negative correlation between NDVI and UHII [23]. However, these relationships vary spatially. For example, green-space cooling differs across cities [24], and studies in Xiamen [25] and Shijiazhuang [26] reported opposite relationships between sky view factor and UHII. These findings suggest that macro-level background factors, such as urbanization level and climatic context, may moderate grey–green thermal effects. Existing single-city or single-region studies are therefore limited in their ability to distinguish local specificity from general patterns, making cross-regional, multi-city comparison necessary.
In multi-city research, a comparable UHII quantification system is essential. UHI can be classified into boundary-layer, canopy-layer, subsurface, and surface UHI [27]. These forms describe different components of the urban thermal environment and require corresponding observations. Surface UHI is generally quantified using satellite-derived LST, which provides spatially continuous information on surface thermal conditions [28]. Accordingly, this study uses surface UHII as its thermal indicator; unless otherwise specified, UHII hereafter refers to surface UHII. The conventional LST-based approach delineates urban and rural reference zones and calculates their temperature difference [29]. However, rural reference definitions vary, including non-urban areas within administrative boundaries [30], fixed-width urban buffers [31], and more distant rural areas selected to avoid suburban heat island effects [32]. Despite these differences, such methods all treat the city as a whole and reflect an urban–rural dichotomy. This paradigm treats the entire urban area as a single entity, meaning that intra-urban thermal differentiation is often obscured by overall averaging [33]. This limits the ability to analyze UHI from the perspective of differences in intra-urban grey–green morphology.
The local climate zone (LCZ) classification system offers a framework that combines fine-scale thermal differentiation with cross-city comparability. Based on building morphology, land-cover, and anthropogenic heat release, it divides urban space into 10 built types and seven natural land-cover types [34]. Within this framework, UHII can be quantified as the temperature difference between each LCZ type and a reference type whose thermal characteristics approximate the rural background. Existing studies commonly use LCZ 9, LCZ B, or LCZ D as the rural reference type [35]. This framework captures intra-urban thermal differentiation while maintaining cross-city comparability, thereby providing a basis for further examining the mechanisms through which grey–green morphology affects UHII. However, existing LCZ studies often use regular grids or buffer zones as analytical units, which may cut across building clusters and green-space patches and disrupt the spatial continuity of grey–green morphological features [36,37,38]. Blocks enclosed by road networks better preserve the integrity of urban fabric and align with the operational scale of urban planning and design [39]. Integrating blocks with the LCZ framework can therefore organize comparisons of intra-urban surface thermal conditions while retaining the spatial context of grey–green morphology in a multi-city setting.
Methods for analyzing UHI-influencing factors have evolved from linear models to nonlinear machine learning approaches. OLS regression [40], correlation analysis [41], and geographically weighted regression [42] have been widely used, with GWR allowing relationships to vary spatially. Nonlinear machine learning methods offer additional flexibility for examining complex associations. Models such as random forest and XGBoost can capture nonlinear relationships, yet their black-box nature limits interpretability [43,44]. SHapley Additive exPlanations (SHAP) [45] addresses this limitation by quantifying the direction and magnitude of each feature’s contribution to model predictions [46]. CatBoost is a gradient boosting algorithm that has been applied in related urban thermal-environment research [47]. Coupling CatBoost with SHAP therefore provides an interpretable way to examine nonlinear associations between 2D and 3D grey–green morphology and surface UHII while identifying important predictors in the fitted models.
Existing studies remain limited in three respects. First, many are based on single cities or urban agglomerations, making it difficult to distinguish common patterns from regional specificity in the relationships between grey–green morphology and surface UHII. Second, the urban–rural dichotomy treats urban areas as homogeneous wholes, obscuring intra-urban thermal differentiation and fine-scale differences in grey–green structure. Third, nonlinear associations and variation in predictor importance across climatic backgrounds remain insufficiently examined. To address these gaps, this study applies a block–LCZ framework to 150 cities across five climate zones in China and uses CatBoost–SHAP to investigate statistical associations between 2D and 3D grey–green morphology and surface UHII. The objectives are: (1) to construct a block–LCZ framework, quantify multi-city surface UHII using Landsat 8 LST products, analyze inter-city and climate-zone differences, and characterize surface UHII variation among LCZ types within cities; (2) to integrate grey–green morphological factors and identify important predictors of surface UHII and their spatial variation in model importance at climate-zone and city scales; and (3) to examine nonlinear associations and model-derived response ranges using SHAP dependence plots and discuss their implications for differentiated mitigation strategies. By integrating established methods within a consistent analysis across cities and climate zones, this study provides comparative evidence on recurring and climate-specific associations between 2D/3D grey–green morphology and surface UHII.
2. Study Area and Data Sources
2.1. Study Area
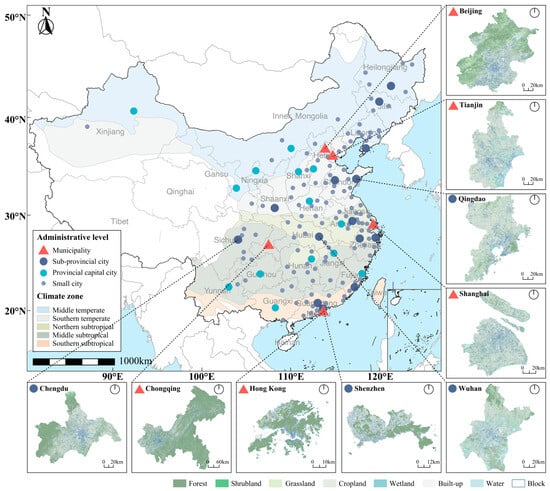
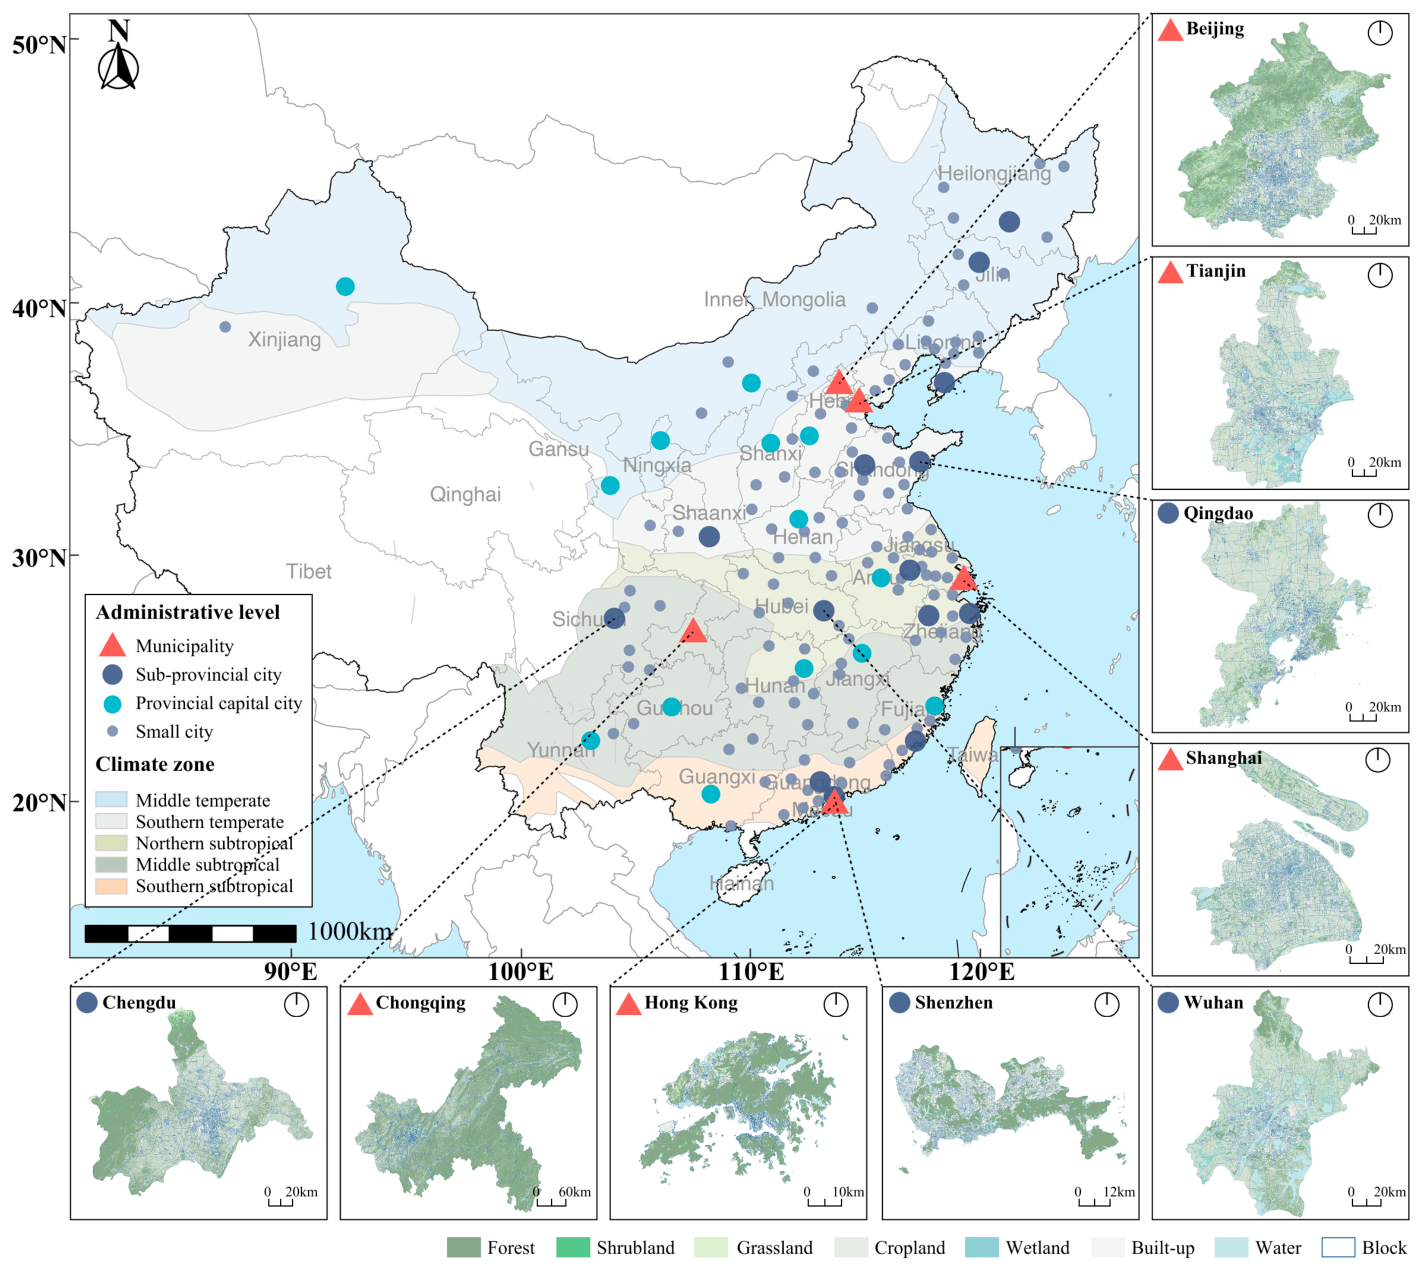
China is one of the fastest-urbanizing countries in the world, and sustained urban expansion has profoundly reshaped urban grey–green morphological patterns [48]. Its vast territory, diverse climate types, and pronounced geographical heterogeneity make it suitable for systematic multi-city studies of urban thermal environments [49]. This study selected 150 Chinese cities as the study area (Figure 1), including five municipalities, 14 sub-provincial cities, 14 provincial capitals, and 117 prefecture-level cities. These cities cover a wide range of built-up scales, contributed more than 75% of China’s GDP in 2020. According to China’s climate zone classification standards, the selected cities are distributed across five climate zones: the middle temperate zone (27 cities), southern temperate zone (39 cities), northern subtropical zone (33 cities), middle subtropical zone (30 cities), and southern subtropical zone (21 cities). These zones differ markedly in air temperature, precipitation, and the duration of periods with daily mean temperature above 10 °C [50], providing a comparative framework for examining inter-city thermal differences under different climatic backgrounds. The northern temperate zone, plateau climate zone, and tropical regions were excluded because of sparse urban populations or limited city samples.
Figure 1.
Study area.
Existing studies show that subtropical cities face relatively prominent UHI risks: from 2001 to 2020, their summer UHII was generally high, and the proportion of cities with significant upward trends exceeded that of temperate regions [51]. The northern subtropical zone is particularly representative because high population density, rapid urbanization, and frequent summer control by the Western Pacific Subtropical High can jointly intensify heat accumulation and weaken heat dissipation [35]. Temperate regions have received less attention, but peak summer UHII in central urban areas of middle temperate cities can reach 3.374 °C [31], indicating that they also have considerable research value.
2.2. Data Sources
Table 1 presents the multi-source datasets used in this study. (1) The MSDCW dataset [52] provides multi-level street-block division data for 985 cities worldwide, covering all 150 study cities and offering standardized block-level analytical units. (2) The Landsat 8 Collection 2 Level-2 products provide atmospherically corrected thermal infrared data at a resolution of 30 m. In this study, summer 2023 images with cloud cover below 10% were selected for LST retrieval and NDVI calculation. (3) The GLC_FCS10 land-cover dataset has a spatial resolution of 10 m [53] and was used to calculate the 2D grey–green landscape pattern factors. (4) The 3D-GloBFP global 3D building footprint dataset [54] provides building footprint and height information and was used to calculate building morphology factors. (5) Green vegetation characteristic data included sub-meter-resolution canopy height maps [55] and the Hi-GLASS LS20 LAI/FAPAR product [56], which were used to calculate 3D green factors. (6) Elevation data are derived from the 30 m resolution NASADEM product [57].
Table 1.
Data sources and description.
3. Methodology
3.1. Research Framework
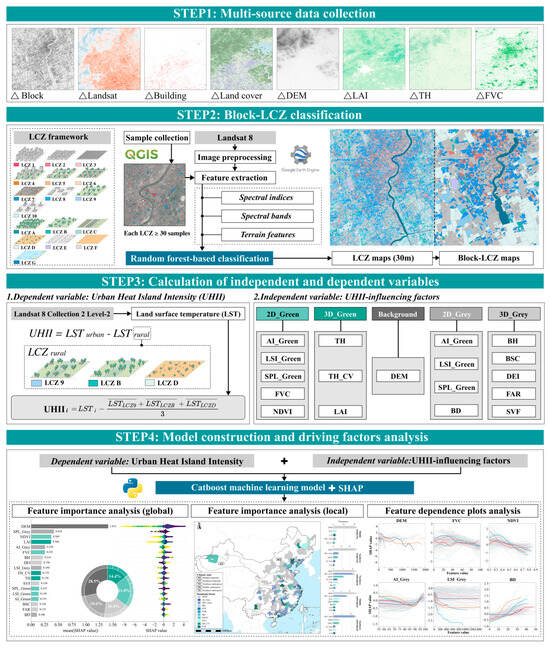
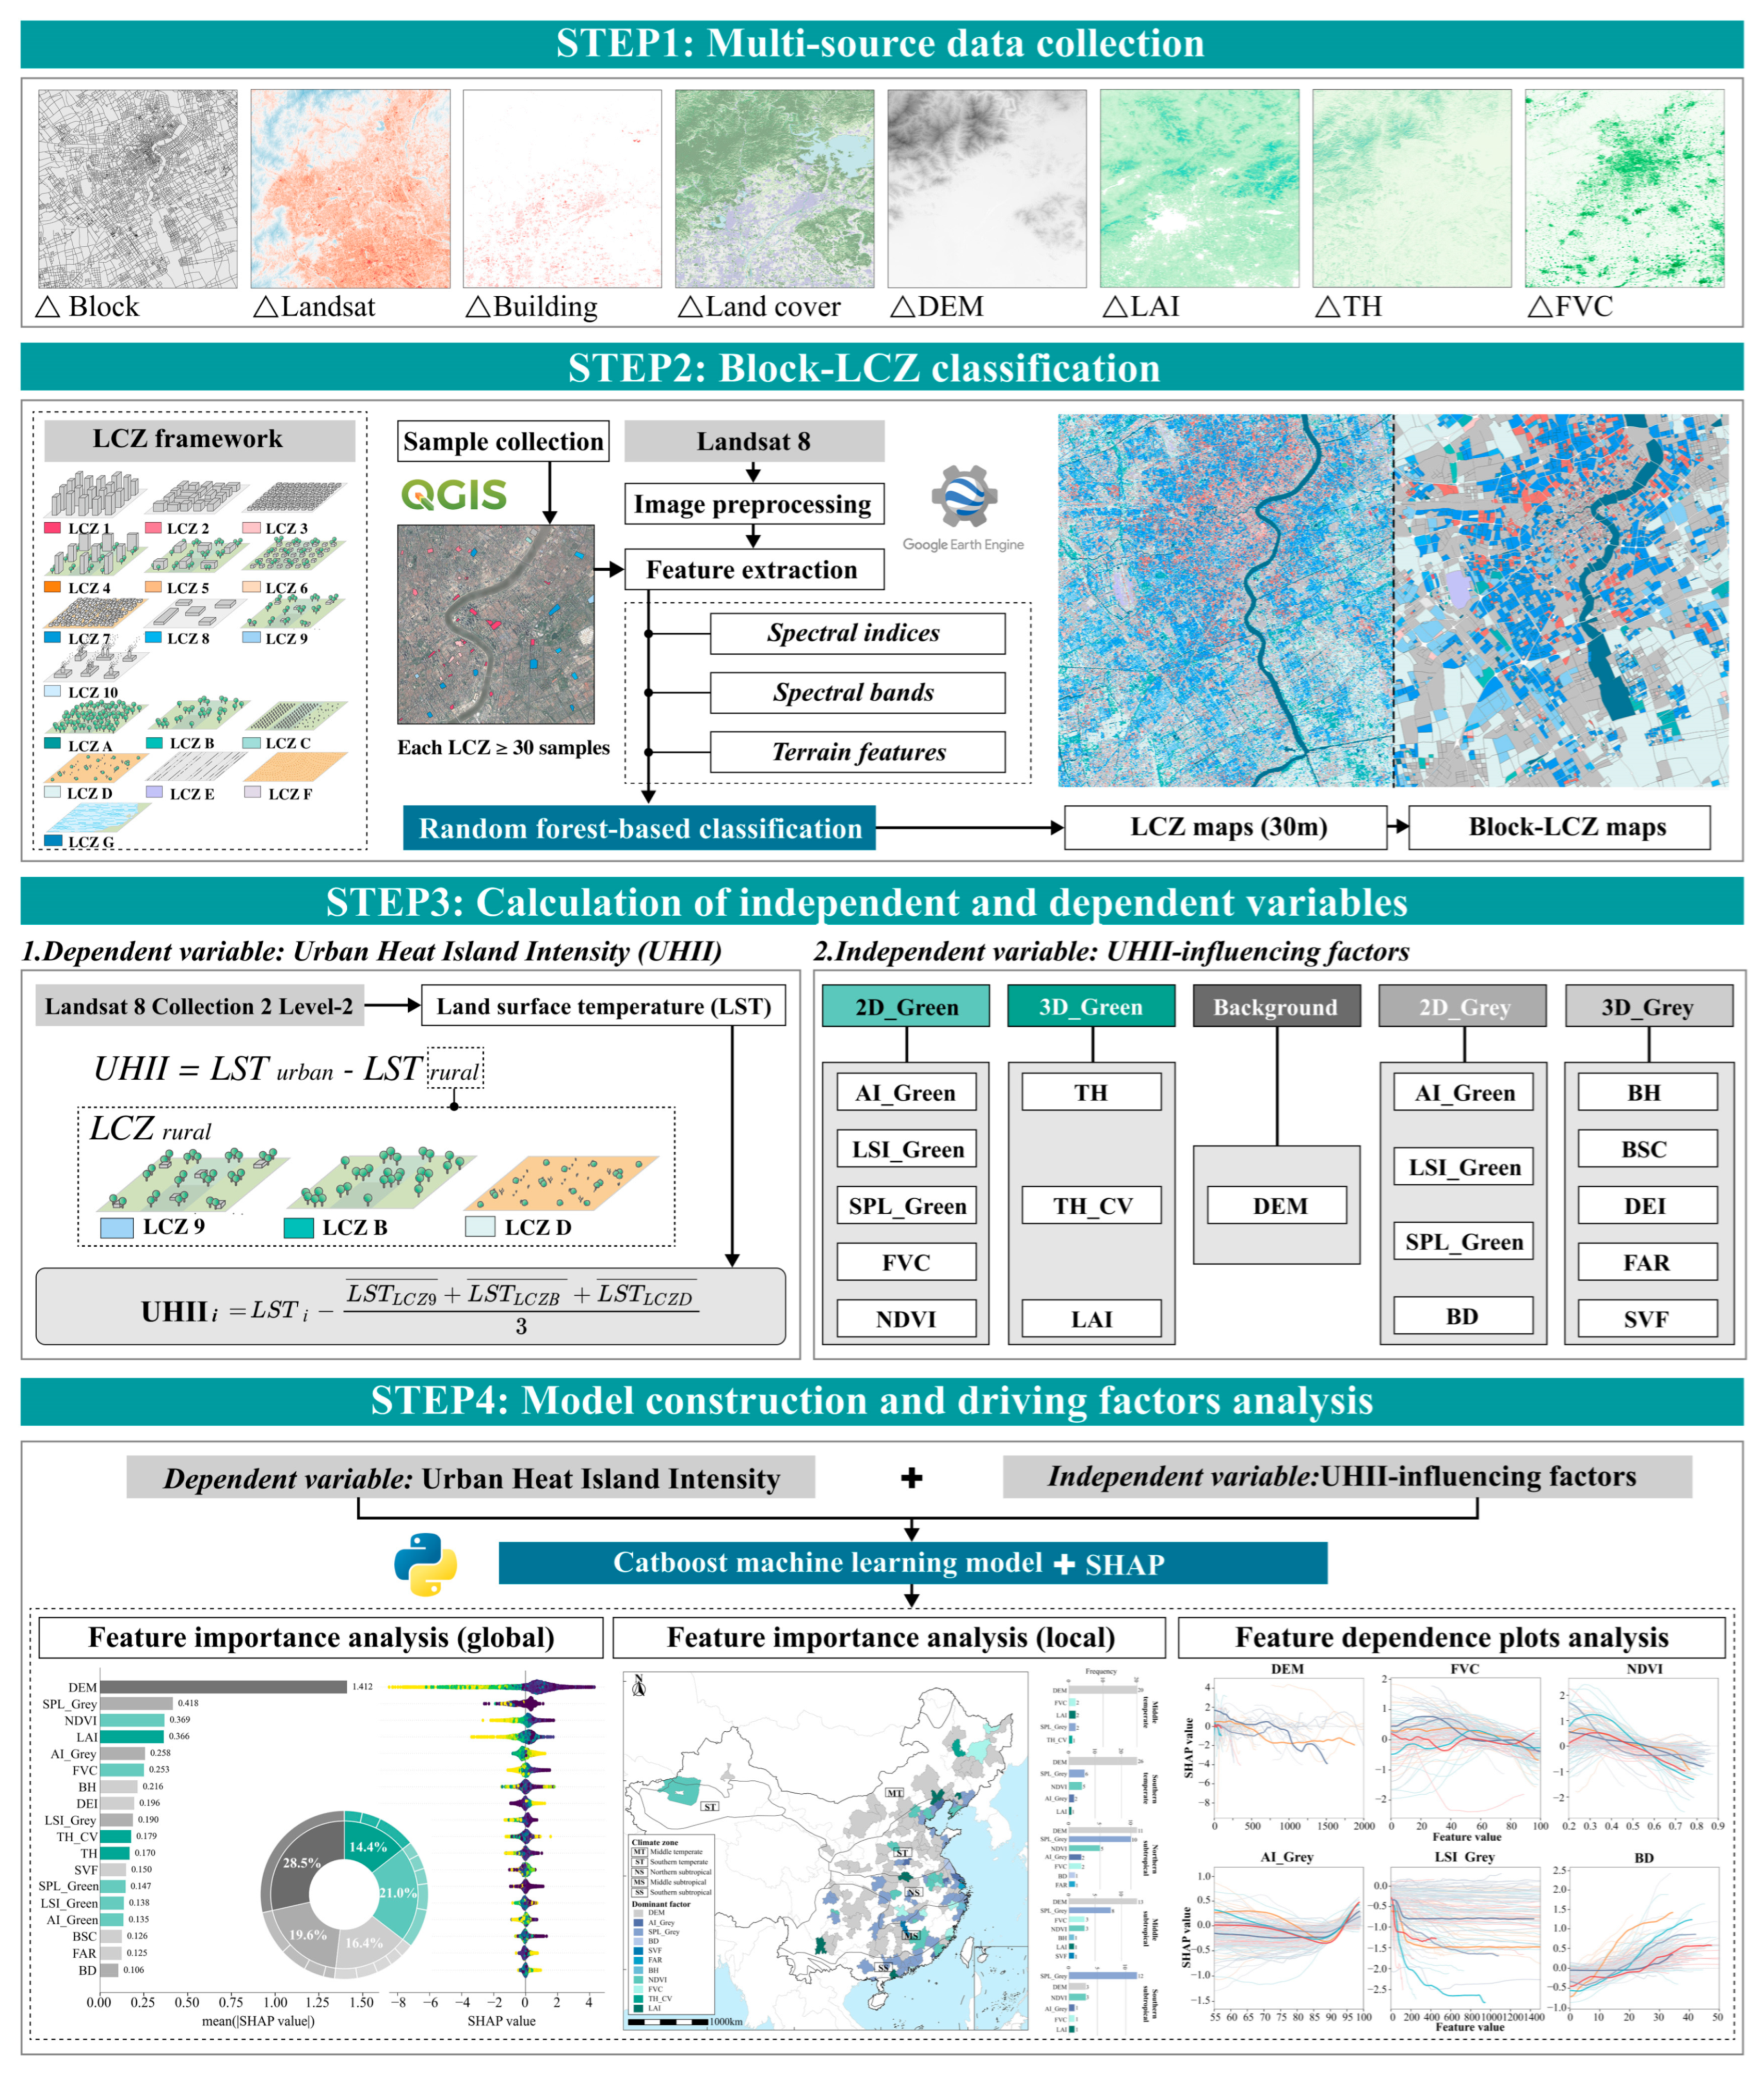
The framework of this study (Figure 2) consists of four steps. First, multi-source data, including block boundaries, Landsat imagery, building footprints, land-cover data, and vegetation structure data, were collected to provide the data basis for subsequent analyses. Second, blocks were used as analytical units, and a machine learning algorithm was applied to classify LCZs from Landsat imagery and generate block-scale LCZ maps. Third, surface UHII was calculated using Landsat 8 Collection 2 Level-2 products and the block–LCZ framework, and 18 predictors representing 2D and 3D grey–green morphology and topographic background were constructed. Fourth, CatBoost combined with SHAP was used to examine predictor importance and its spatial variation at climate-zone and city scales. SHAP dependence plots were then used to examine nonlinear associations and model-derived response ranges.
Figure 2.
Methodological framework.
3.2. Block–LCZ Classification
Because the 150 cities differ substantially in urban morphology and landscape characteristics, LCZ classification was conducted separately for each city using remote sensing imagery. The standard workflow included training sample collection, remote sensing feature construction, model training and classification, and accuracy assessment.
Training samples followed the standard 17-class LCZ system [34]. For each city, at least 30 samples per LCZ class were manually interpreted in QGIS (version 3.34.10)using high-resolution imagery from Google Earth Pro (version 7.3.7.1327). Remote sensing features were constructed on Google Earth Engine (GEE) by integrating Landsat imagery, removing clouds and cloud shadows with CFmask, and applying within-year median compositing to generate cloud-free composite imagery. Six reflectance bands (SR_B2 to zSR_B7), five spectral indices (NDVI, LSWI, NDSVI, NDBI, and MNDWI), and SRTM-derived elevation, slope, and aspect were combined into a 30 m feature dataset covering spectral, index-based, and topographic information. Sample attributes were extracted from this feature set to train a random forest classifier and generate 30 m LCZ rasters. Each block was assigned the LCZ class with the largest number of raster cells within its boundary (majority rule). Accuracy was evaluated using an error matrix based on the testing set; the mean overall accuracy was 0.922, and the mean Kappa coefficient was 0.894. City-level accuracy results are provided in Table S1 of the Supplementary Materials, and mean producer’s and user’s accuracies for each LCZ class are provided in Table S2.
3.3. UHII Calculation
The UHII calculation was implemented on GEE using Landsat 8 Collection 2 Level-2 products. Landsat 8 alone was used to maintain a consistent sensor composition across cities and avoid introducing variation associated with differing mixtures of Landsat 8 and 9 observations into the cross-city comparison. Summer 2023 images (June to September) with cloud cover below 10% were screened within the spatial extent of each city. Cloud and cloud-shadow pixels were removed using the QA_PIXEL quality assessment band through bitwise operations on bit 3 (cloud) and bit 4 (cloud shadow). The ST_B10 band was then calibrated with the official USGS scale factor and offset and converted to LST in degrees Celsius:
LST (°C) = DN × 0.00341802 + 149.0 − 273.15
The filtered image collection was mean-composited to generate 30 m clear-sky daytime LST maps for each city. The numbers of retained scenes per city are summarized by climate zone in Table S3. Block-level mean LST was extracted using QGIS zonal statistics, which averages valid cells whose centers fall within each block and applies overlap-area weighting when no more than one valid cell is selected.
Based on the urban–rural temperature difference definition of UHII and previous LCZ-based reference selection [58], this study designated LCZ 9, LCZ B, and LCZ D blocks as suburban reference areas. If a reference class was absent, the city-specific reference temperature was calculated as the mean LST of all retained reference blocks from the remaining available classes. Reference-block counts and sensitivity analyses using alternative references are provided in Tables S4 and S5. The UHII of each target block was calculated as follows:
where LSTi,c is the mean LST of target block i in city c, Rc is the set of eligible reference blocks in that city, and Nref,c is the total number of these reference blocks.
3.4. Calculation of 2D/3D Grey–Green Spatial Morphology Factors
To systematically investigate the multidimensional associations between urban grey–green spatial morphology and surface UHII, this study included 18 independent variables covering 2D green factors, 3D green factors, 2D grey factors, 3D grey factors, and background factors. Specifically, the 2D green factors included the normalized difference vegetation index (NDVI), fractional vegetation coverage (FVC), green aggregation index (AI_Green), green landscape shape index (LSI_Green), and green splitting index (SPL_Green). The 3D green factors included tree height (TH), the coefficient of variation of tree height (TH_CV), and leaf area index (LAI). The 2D grey factors included grey aggregation index (AI_Grey), grey landscape shape index (LSI_Grey), grey splitting index (SPL_Grey), and building density (BD). The 3D grey factors included building surface coefficient (BSC), building height (BH), distribution evenness index (DEI), floor area ratio (FAR), and sky view factor (SVF). A digital elevation model (DEM) was included as a background factor.
For the 2D landscape metrics, GLC_FCS10 classes were reclassified into green and grey categories. Green comprised cropland (codes 10–29), forest (50–99), shrubland (120–129), grassland (130–139), and sparse vegetation (140–159), whereas grey comprised impervious surfaces (190–199). Landscape metrics were calculated using the R package landscapemetrics (version 2.2.1). Eight-neighbor connectivity was used to delineate patches for SPL. AI was based on four-neighbor, edge-sharing adjacencies, while LSI was calculated from cell-edge lengths. Detailed definitions and calculation methods for all factors are provided in Table 2.
Table 2.
Detailed definitions and calculation methods for all factors.
3.5. CatBoost Machine Learning Model and SHAP
CatBoost is an ensemble learning algorithm based on the gradient boosting decision tree (GBDT) framework. Compared with traditional GBDT methods, CatBoost introduces an ordered boosting mechanism, in which the model is trained progressively based on random permutations of the training samples. This mechanism effectively avoids target leakage and prediction shift, thereby improving generalization performance [59]. Its core computational logic is as follows: in the m-th iteration, a new decision tree hm(x) is added to fit the negative gradient of the loss function with respect to the current model output, namely the prediction residual, while the learning rate η controls the update step size:
Fm(x) = Fm−1(x) + η ⋅ hm(x)
After M iterations, the final prediction is the sum of the initial prediction and the cumulative contributions of all weak learners:
This study used 2D and 3D grey–green morphological factors and DEM as predictors and surface UHII as the dependent variable, constructing CatBoost regression models independently at city and climate-zone scales. After data screening, 268,941 blocks were retained. Sample sizes for the city- and climate-zone-level models are presented in Figure S1 and Table S6, respectively. All predictors had VIF values ≤ 10. Pairwise Spearman correlations were assessed using |ρ| ≥ 0.80 as the threshold for high correlation, with climate-zone-specific correlation matrices provided in Figure S2.
The dataset was divided into training and testing sets at an 8:2 ratio; five-fold cross-validation and random search were used for hyperparameter optimization within the training set. Model performance was evaluated using R2 and RMSE on the held-out test set. CatBoost was used as the primary algorithm in this study, with the optimal hyperparameters for the climate-zone and city-level models reported in Tables S7 and S8, respectively. Supplementary spatial-block and selected-city holdout validations were conducted, with hyperparameters tuned independently within each outer training set. These analyses assessed predictive performance and the stability of the top five predictors under spatial separation and transfer to unseen cities within the same climate zone (Tables S9–S11). In the selected-city holdout analysis, entire cities were reserved for testing, and inner cross-validation was grouped by city. A city-equal weighting sensitivity analysis was also conducted to assess the influence of unequal city sample sizes on predictor importance (Table S12).
SHAP was used to interpret the fitted CatBoost models. SHAP originates from cooperative game theory and decomposes each model prediction into the additive contribution of each feature to that prediction [45]. The SHAP value φi of feature i is defined as the weighted average of its marginal contributions across all possible feature coalitions:
where N denotes the full set of features, S represents any feature subset that does not contain feature i, f(S) is the model prediction obtained using only the features in subset S, and |⋅| denotes the cardinality of a set. In this study, SHAP values were used to conduct two analyses for the city- and climate-zone-level models. First, predictor importance was ranked based on mean absolute SHAP values. Second, feature dependence plots were used to characterize nonlinear associations and model-derived response ranges. Supplementary LOWESS analyses using 100 paired bootstrap resamples were conducted for the climate-zone curves. All SHAP analyses were implemented using the shap package in Python 3.11.
4. Results
4.1. Spatial Patterns of UHII
4.1.1. Inter-City UHII Distribution and Climate Zone Characteristics
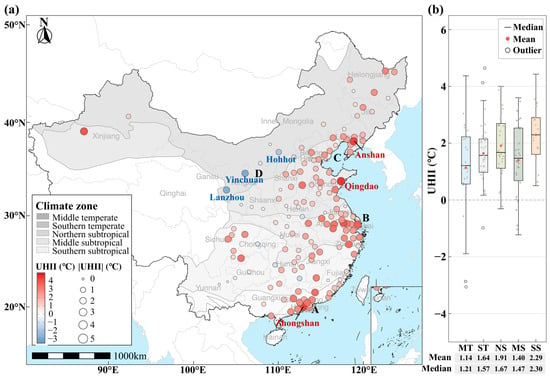
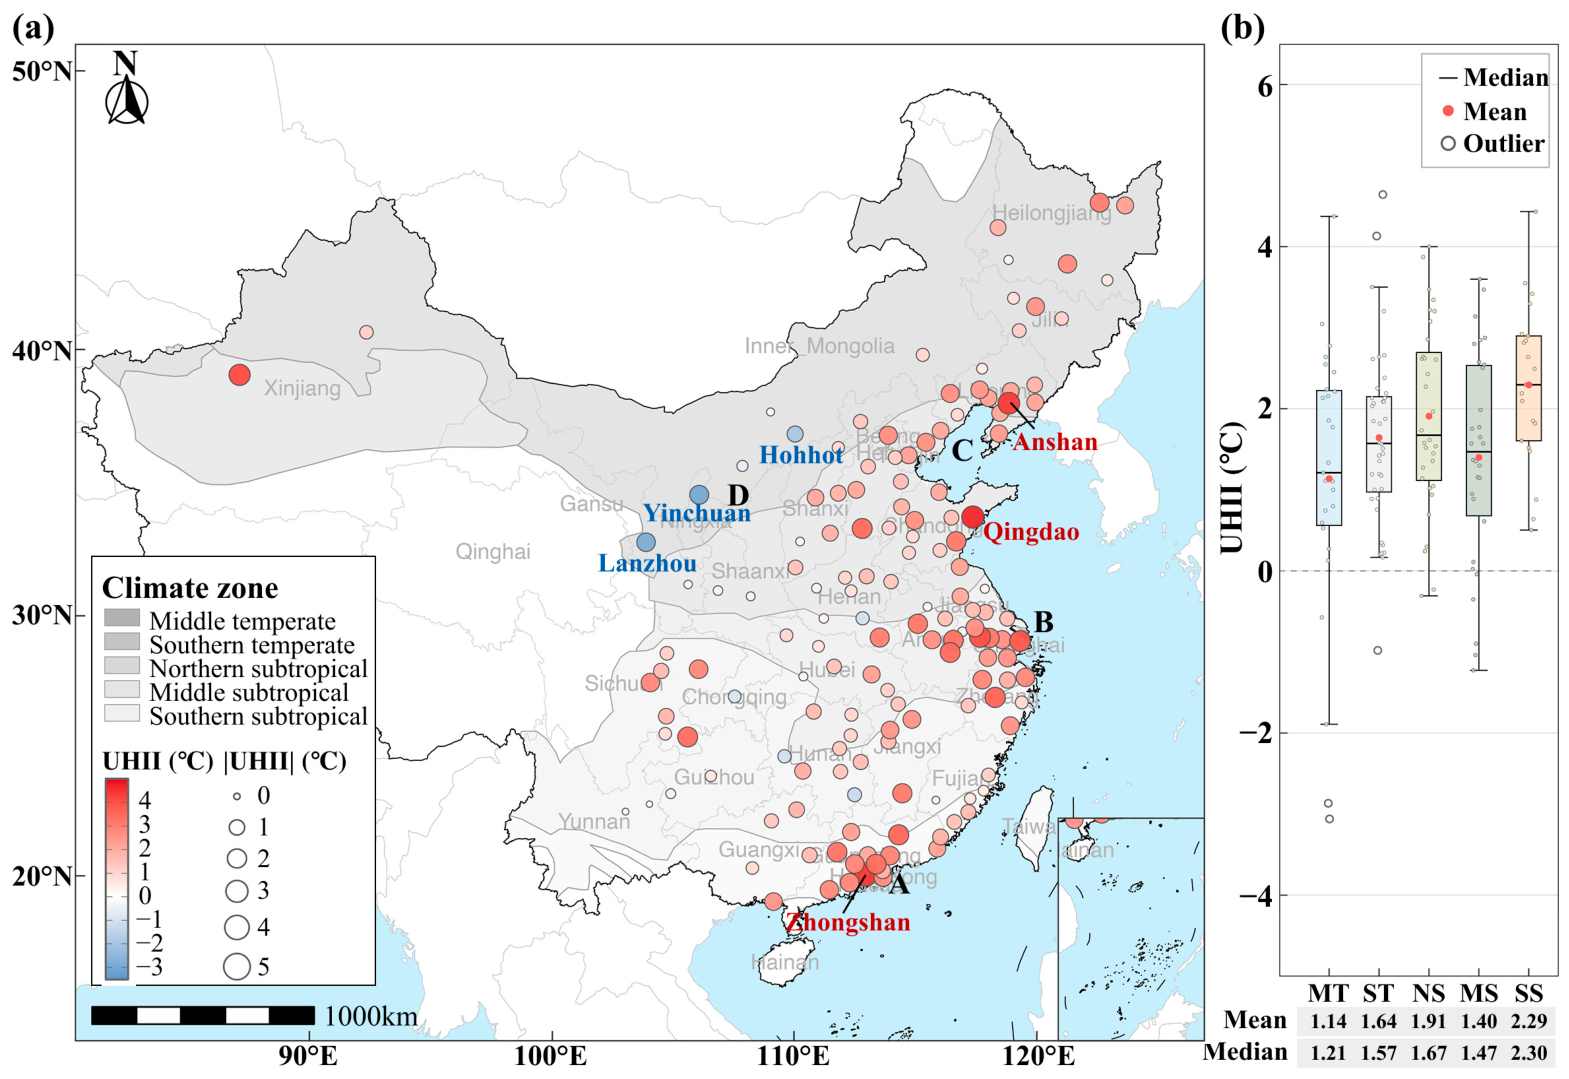
The mean surface UHII derived from the 2023 clear-sky daytime LST composites across the 150 study cities was 1.65 °C, with a median of 1.63 °C and a range from −3.00 °C to 4.66 °C (Figure 3a). Positive UHII values occurred in 138 cities (92%), indicating a widespread UHI effect, while 12 cities showed urban cool island conditions. High-UHII cities were concentrated in the Pearl River Delta (A), Yangtze River Delta (B), and Bohai Rim (C), with the highest values in Qingdao (4.66 °C), Zhongshan (4.43 °C), and Anshan (4.37 °C). Cool island cities were mainly located in northwestern inland China, especially Inner Mongolia, Ningxia, and Gansu, with the lowest values in Yinchuan (−3.00 °C), Lanzhou (−2.85 °C), and Hohhot (−1.89 °C).
Figure 3.
Spatial distribution and climate-zone differences of surface UHII across 150 sample cities: (a) Spatial distribution of UHII. (b) Boxplots of UHII across climate zones.
Across climate zones, mean UHII decreased broadly from south to north, except in the middle subtropical zone (Figure 3b). The southern subtropical zone had the highest mean UHII (2.29 °C), followed by the northern subtropical (1.91 °C), southern temperate (1.64 °C), middle subtropical (1.40 °C), and middle temperate zones (1.14 °C). All 21 southern subtropical cities had positive UHII values, whereas the middle temperate zone showed the largest inter-city variation, including both strong-UHI cities such as Anshan and cool island cities such as Yinchuan.
4.1.2. LCZ-Based Differentiation Characteristics of UHII
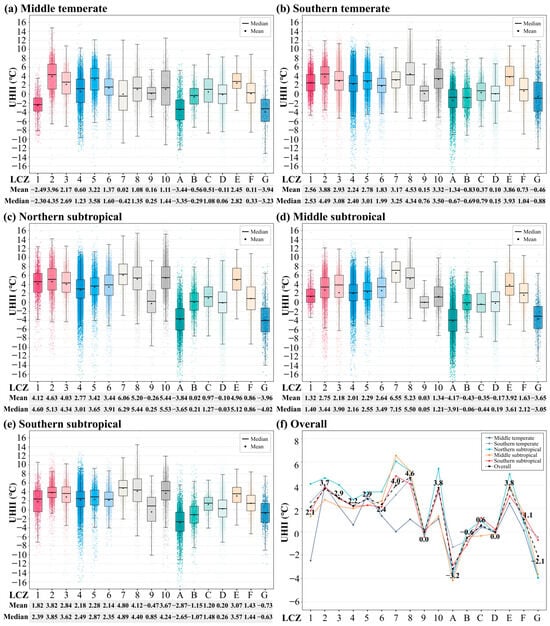
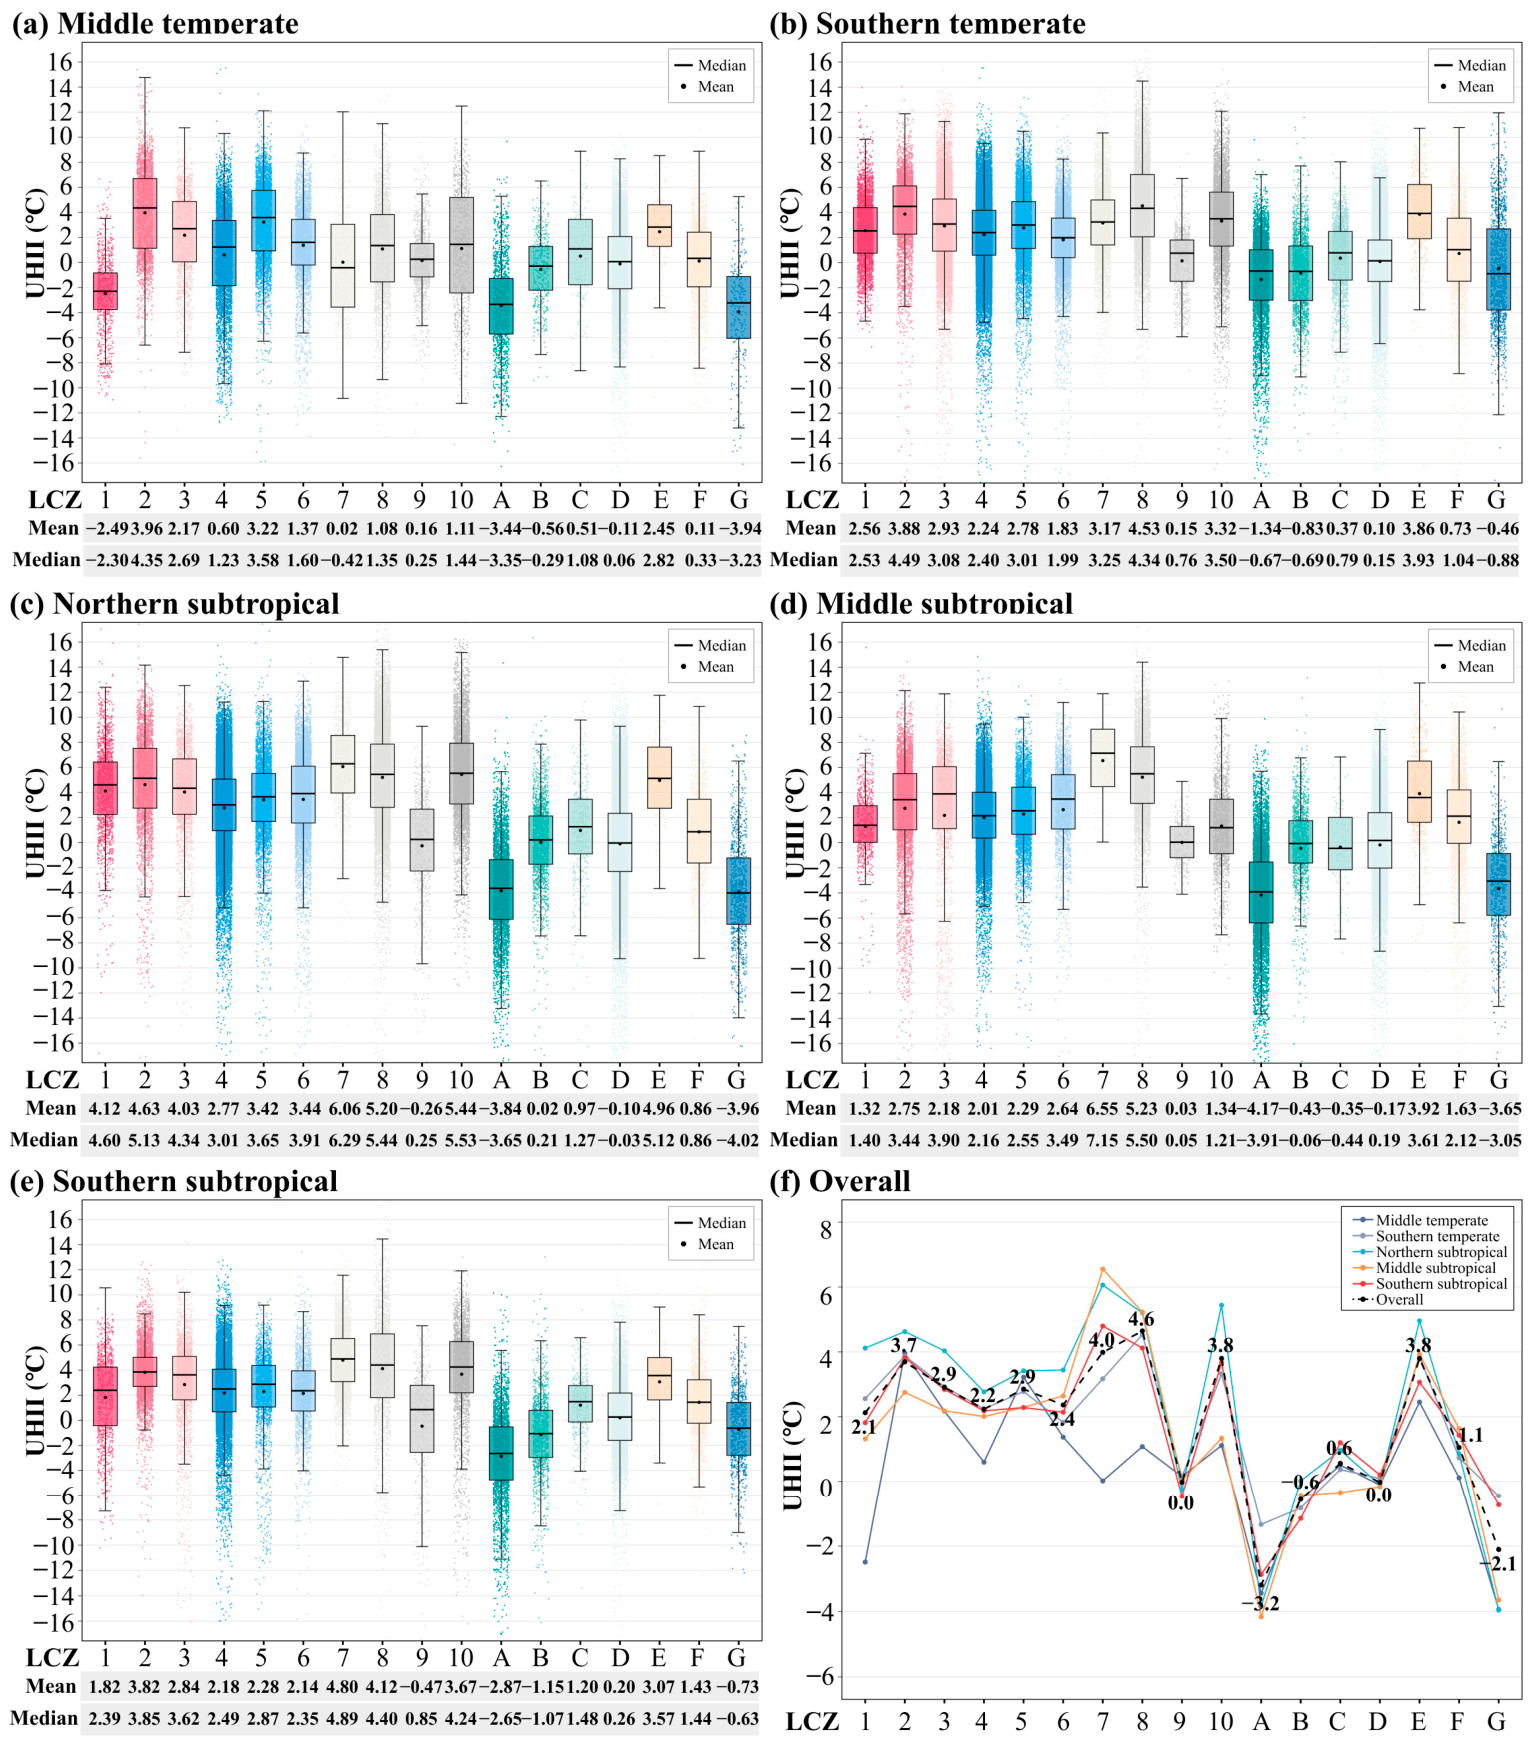
At the intra-urban scale, UHII differed significantly among LCZ types. In terms of the full-sample mean (Figure 4f), UHII values for built types (LCZ 1–10) were generally positive, whereas those for natural types (LCZ A–G) were overall close to neutral or showed an urban cool island effect, with a mean of approximately −0.1 °C. Among the built types, LCZ 8 (4.65 °C) and LCZ 7 (3.99 °C) showed the strongest warming, whereas LCZ 9 (−0.02 °C) was close to zero. Among the natural types, LCZ A (−3.19 °C) and LCZ G (−2.11 °C) had the lowest UHII values, whereas LCZ E (3.80 °C) showed a relatively high positive value.
Figure 4.
UHII distributions across LCZ types by climate zone and for the full sample: (a–e) UHII boxplots for LCZ types in the middle temperate, southern temperate, northern subtropical, middle subtropical, and southern subtropical zones, respectively. (f) Mean UHII profiles across LCZ types for each climate zone and the full sample.
Climate background further differentiated LCZ effects (Figure 4a–e). Most built LCZs reached their highest UHII in the northern subtropical zone and their lowest values in the middle temperate zone. LCZ 7 increased from 0.02 °C in the middle temperate zone to more than 6 °C in the northern and middle subtropical zones, and LCZ 8 rose from 1.08 °C to 4.12–5.23 °C in the other zones. LCZ 1 was the only built type with a negative UHII value in the middle temperate zone (−2.49 °C), which may be related to the strong shading effect of high-rise buildings on solar radiation in high-latitude regions. LCZ 2 showed mean surface UHII values of 2.75–4.63 °C across climate zones, while LCZ 9 remained near zero. Among natural types, LCZ A consistently showed negative surface UHII, LCZ D remained close to zero, LCZ E showed positive values, and LCZ G showed more pronounced negative values in several zones than in the southern temperate and southern subtropical zones.
4.2. Climate-Zone-Scale Importance of Grey–Green Morphology Factors
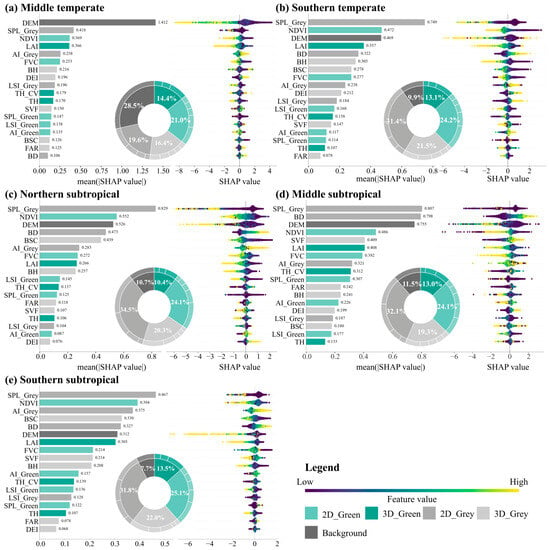
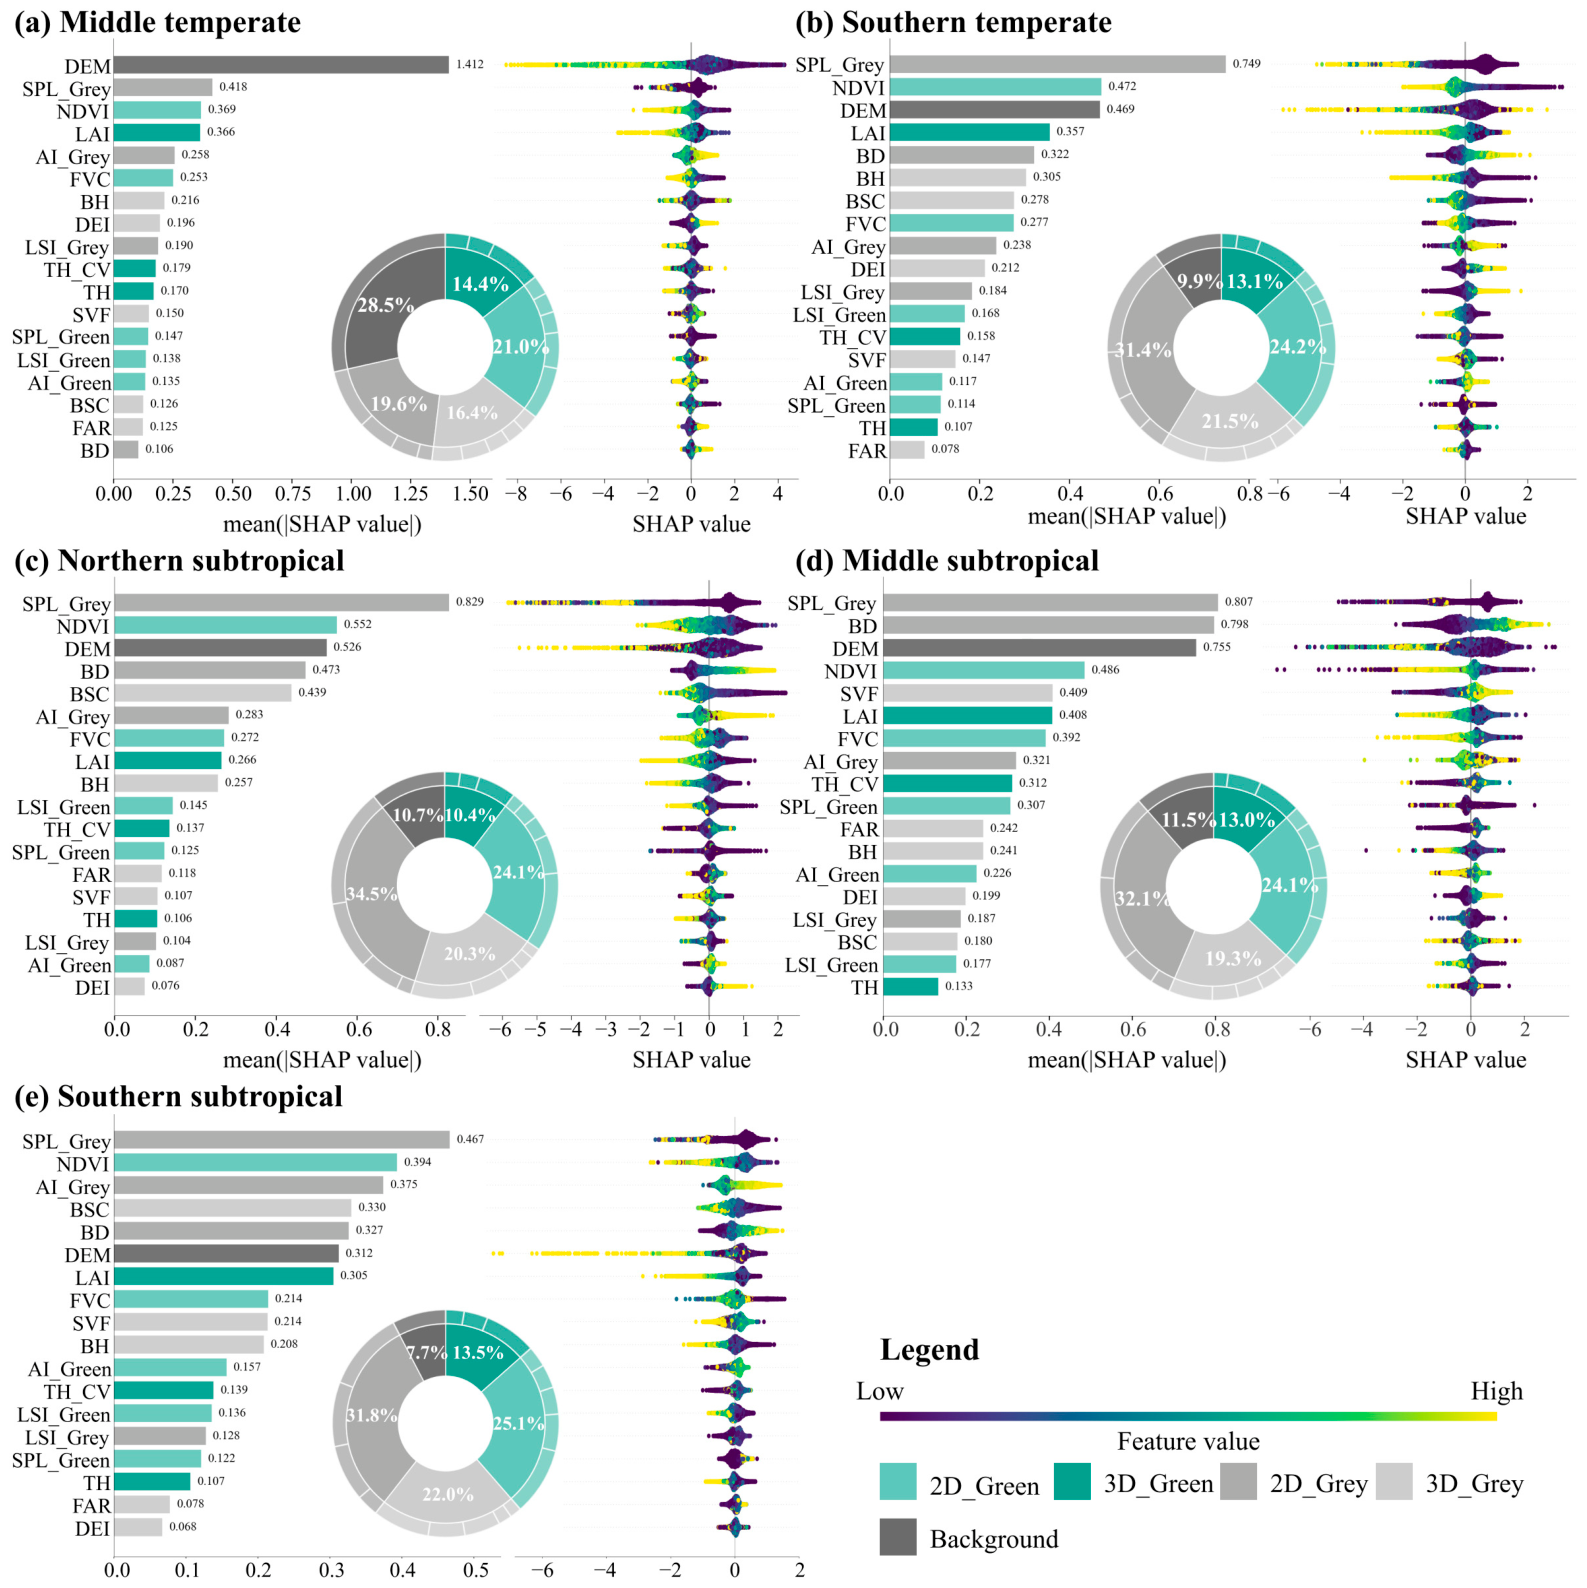
Figure 5 shows that the relative SHAP contributions of predictor categories differed among climate zones. In the middle temperate zone, Background had the largest contribution (28.5%), followed by relatively balanced contributions from 2D_Green (21.0%), 2D_Grey (19.6%), and 3D_Grey (16.4%). In the other four zones, 2D_Grey had the largest contribution, contributing 31.4–34.5%, while Background declined to 7.7–11.5%. 2D_Green ranked second and was relatively stable across zones (24.1–25.1%), 3D_Grey remained third (19.3–22.0%), and 3D_Green was consistently among the categories with the lowest contributions (10.4–14.4%).
Figure 5.
SHAP-based predictor importance by climate zone: (a) Middle temperate zone. (b) Southern temperate zone. (c) Northern subtropical zone. (d) Middle subtropical zone. (e) Southern subtropical zone.
Single-variable importance also varied by climate zone. DEM ranked first in the middle temperate zone (mean |SHAP| = 1.412), but SPL_Grey ranked first in all other zones, making it the most consistently high-ranked grey predictor. NDVI remained among the top four variables in every zone and was the most consistently high-ranked green predictor. In the southern temperate zone, SPL_Grey ranked first, while NDVI and DEM contributed similarly; in the northern subtropical zone, BD and BSC also entered the top five, highlighting their model importance in this zone. In the middle subtropical zone, SPL_Grey, BD, and DEM had similar importance, whereas in the southern subtropical zone the differences among top variables were smaller. FAR, DEI, TH, AI_Green, LSI_Grey, and LSI_Green had relatively low model contributions across all zones.
4.3. City-Scale Spatial Heterogeneity in Grey–Green Morphology Factor Importance
4.3.1. Spatial Patterns and Frequency Characteristics of Dominant Factors
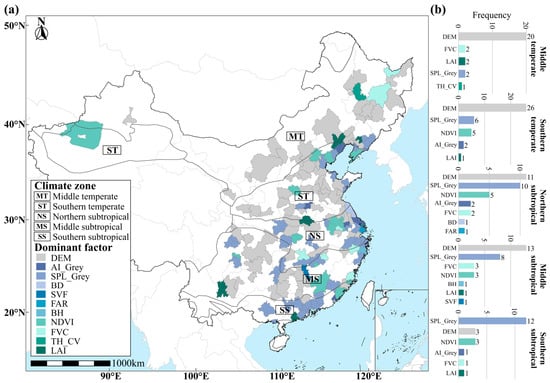
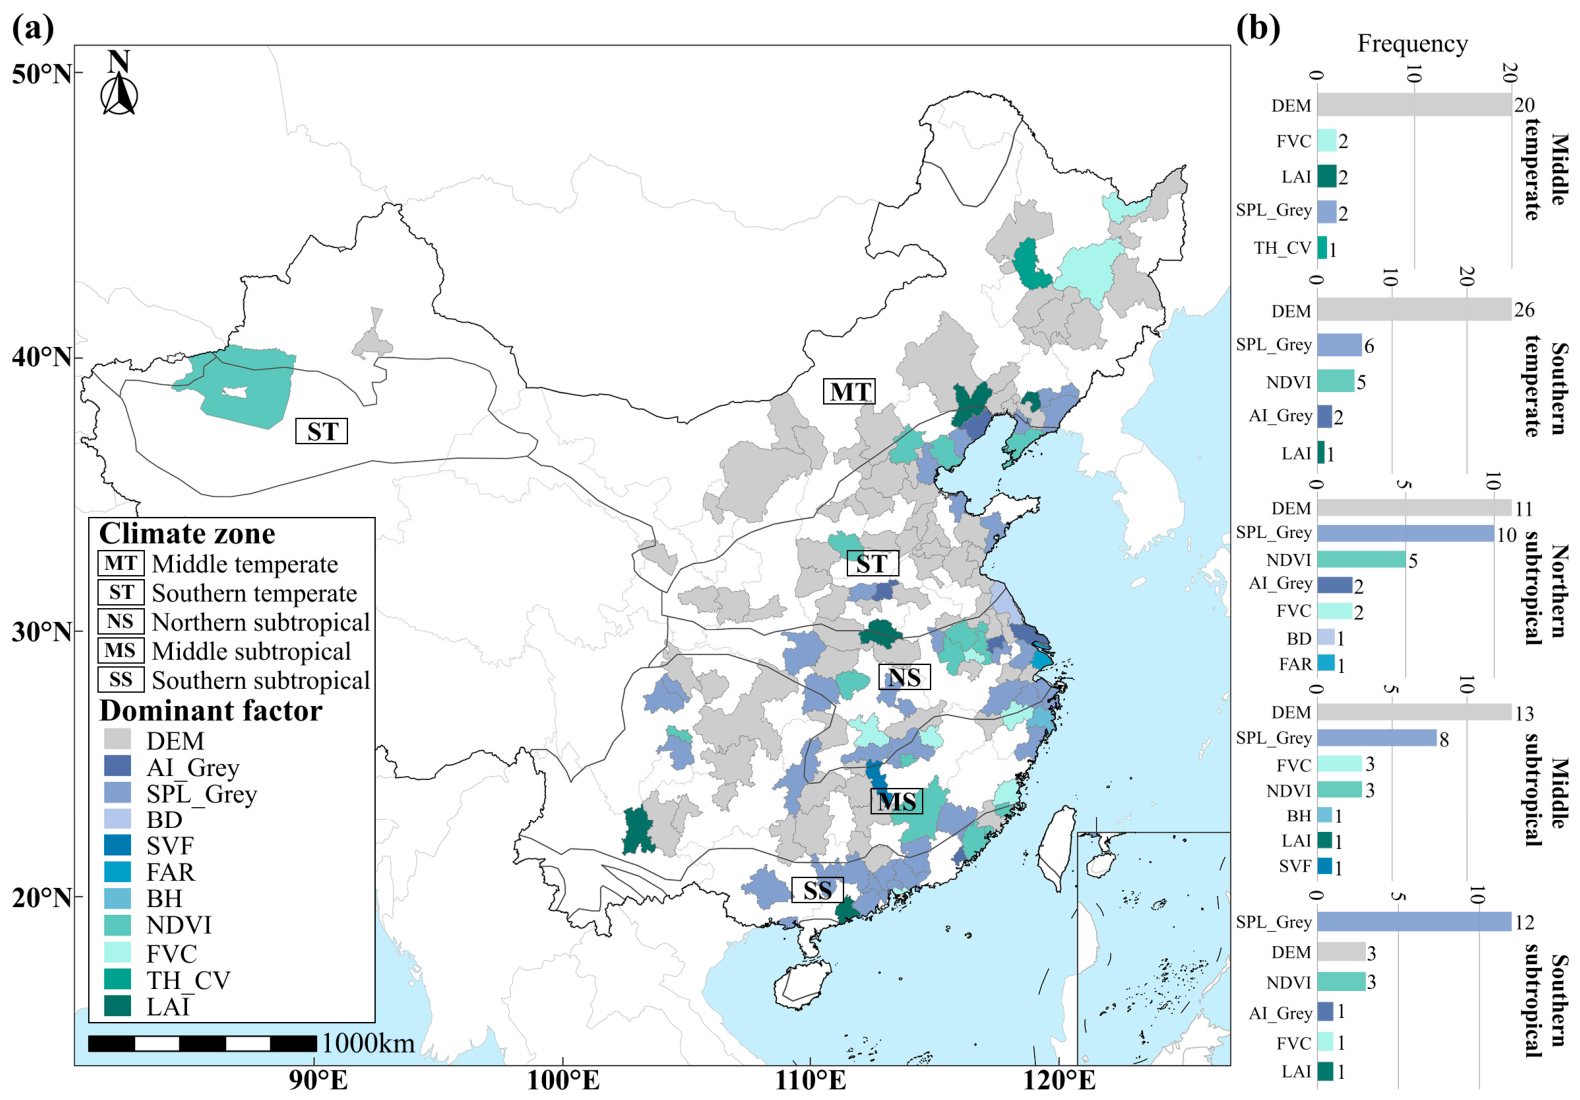
City-level CatBoost–SHAP results showed a north-to-south shift in the highest-ranked predictor of surface UHII from DEM to SPL_Grey (Figure 6). The proportion of cities in which DEM ranked first decreased from 74% in the middle temperate zone and 64% in the southern temperate zone to 4% in the southern subtropical zone. In contrast, the proportion in which SPL_Grey ranked first increased southward and reached 57% in the southern subtropical zone, mainly along high-density coastal urban areas. Other variables ranked first in only a limited number of cities.
Figure 6.
Spatial distribution and climate-zone frequencies of the highest-ranked predictors across 150 sample cities: (a) Highest-ranked predictor in each city model. (b) Frequencies by climate zone.
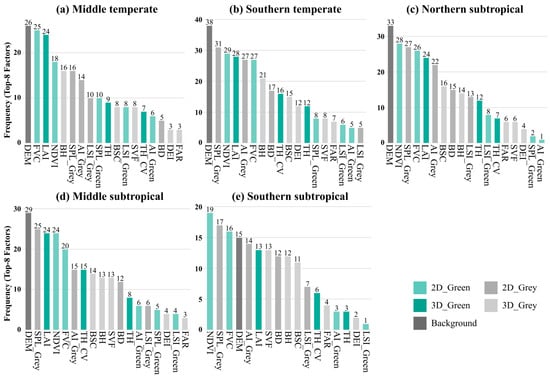
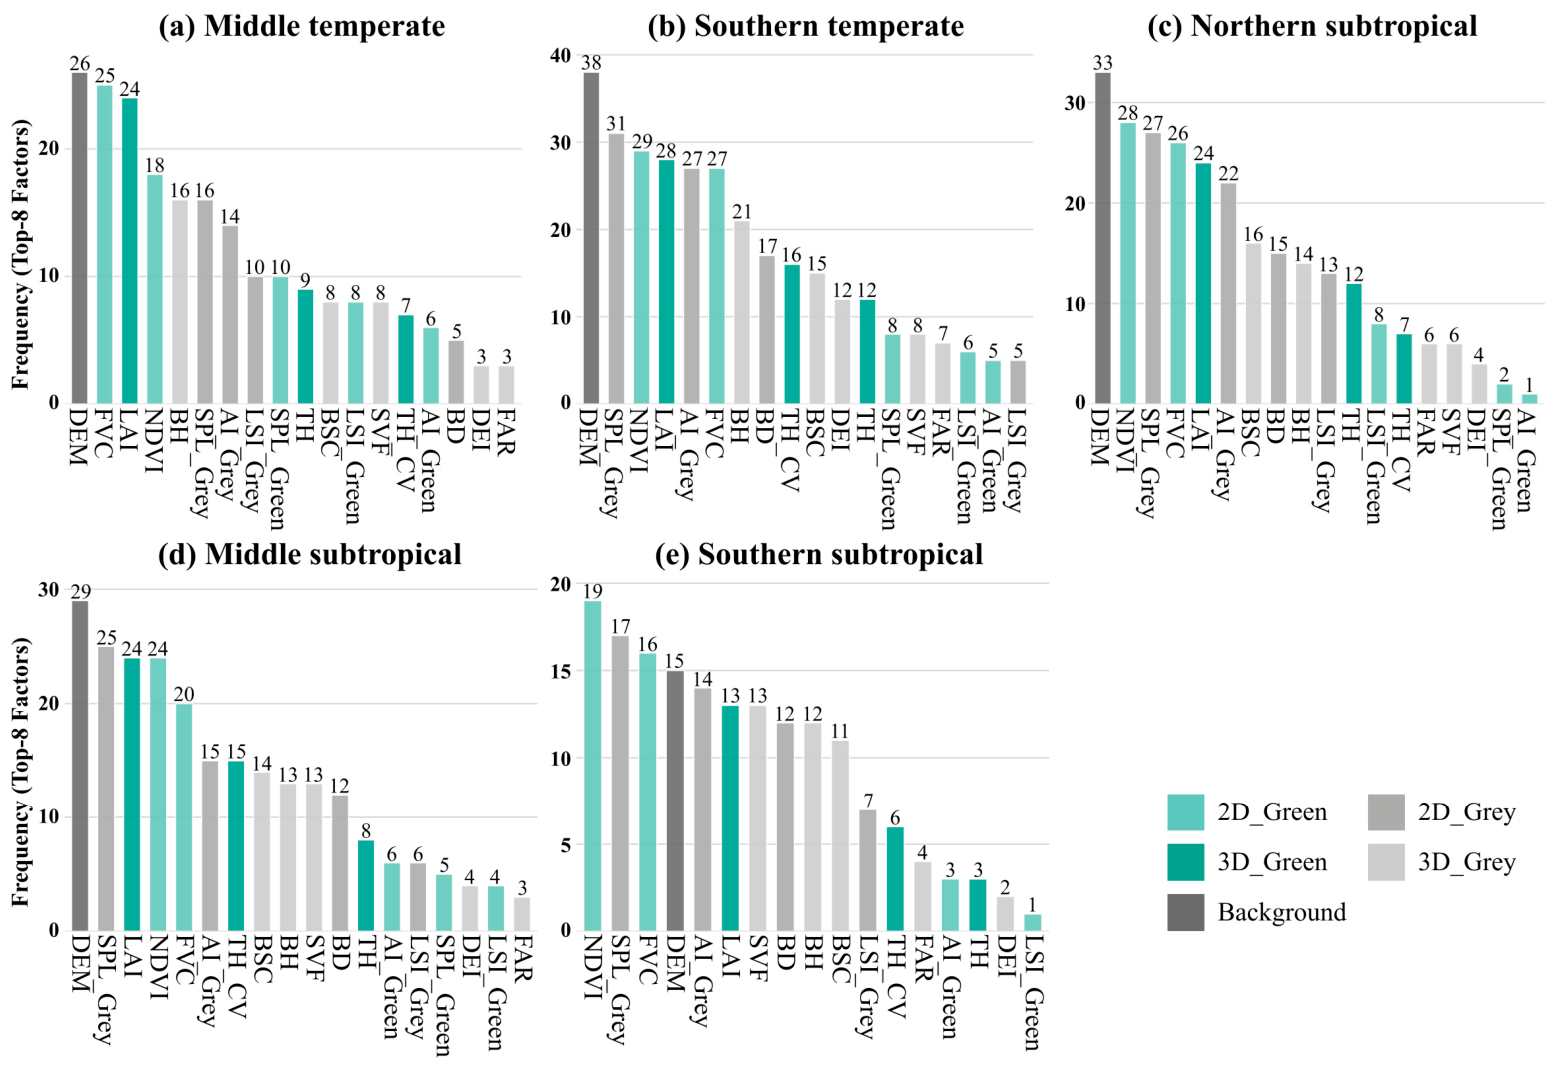
The frequency with which variables entered the top eight city-level rankings further confirmed this pattern (Figure 7). DEM had the highest frequency of inclusion among the top eight predictors in four climate zones. Green factors such as NDVI, FVC, and LAI rarely ranked first in individual city models but appeared frequently across zones, indicating stable secondary contributions. SPL_Grey maintained high frequencies south of the southern temperate zone, AI_Grey was most prominent in the northern subtropical zone, BD peaked in the southern temperate and northern subtropical zones, and SVF showed clearer importance in the middle and southern subtropical zones.
Figure 7.
Frequencies with which predictors appear among the top eight city-level importance rankings by climate zone: (a) Middle temperate zone. (b) Southern temperate zone. (c) Northern subtropical zone. (d) Middle subtropical zone. (e) Southern subtropical zone.
4.3.2. Spatial Differentiation in Relative Factor Contributions
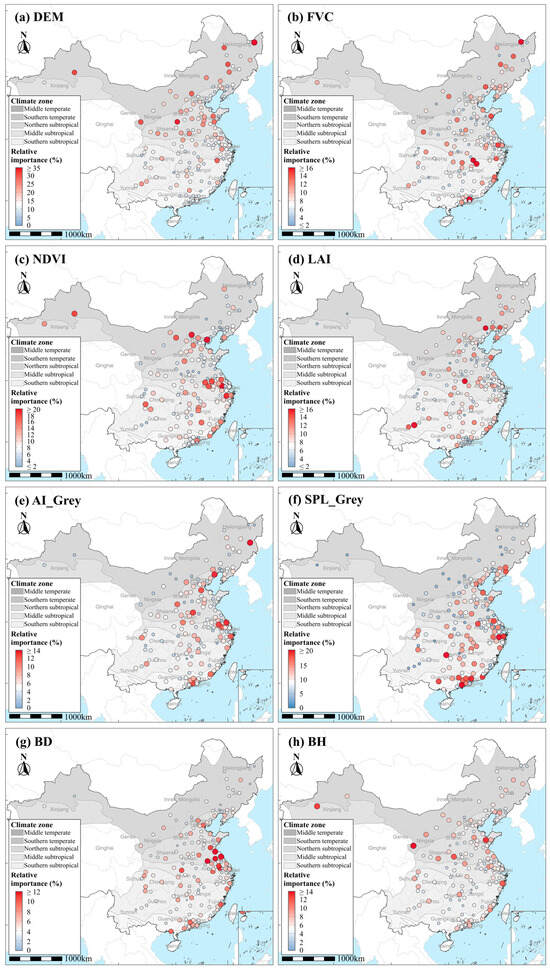
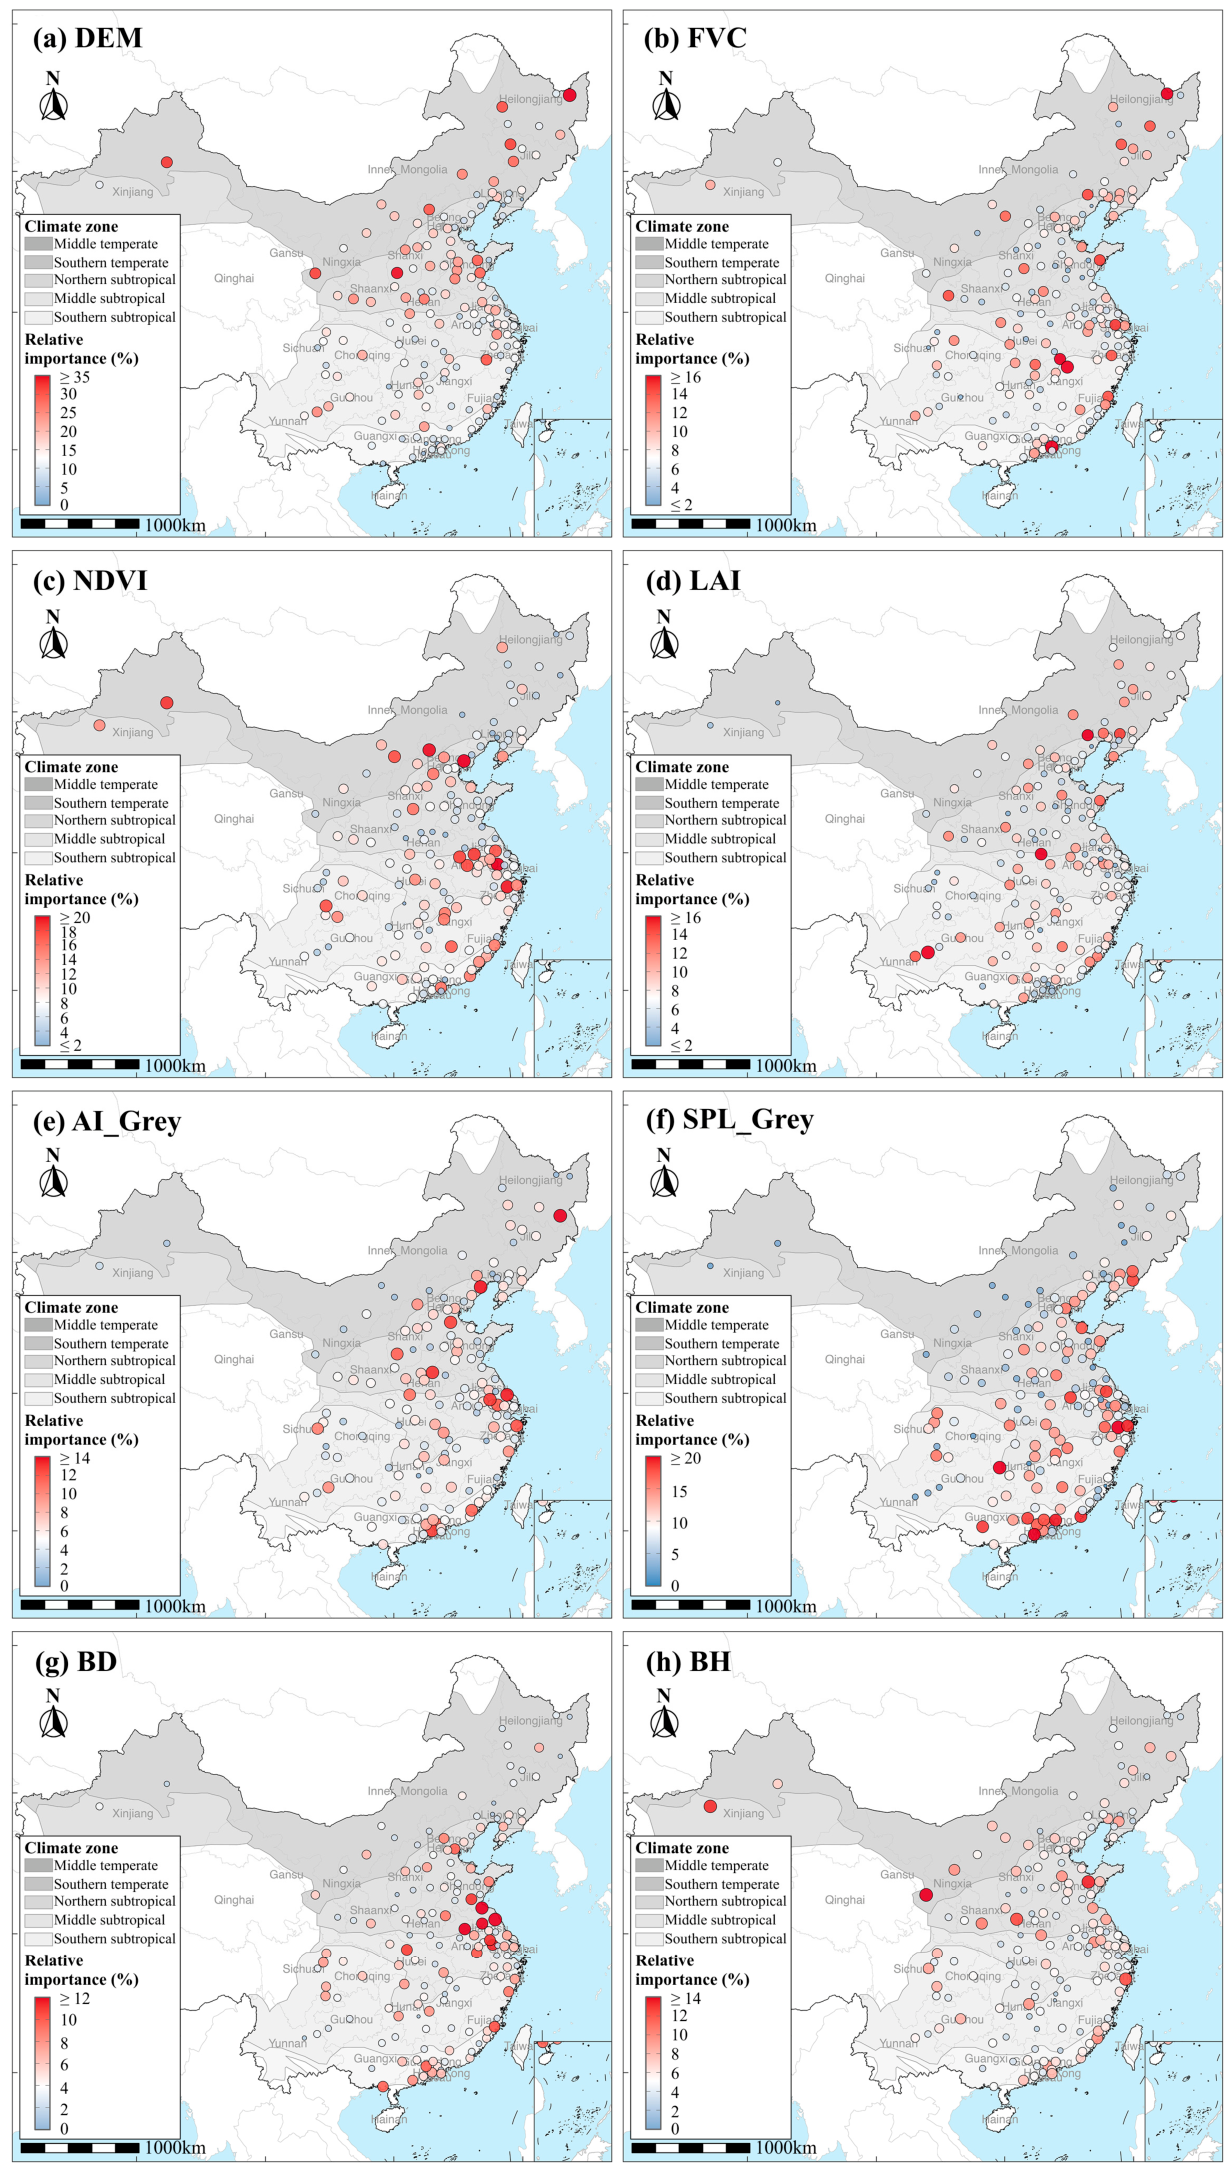
Figure 8 highlights clear spatial differentiation in relative factor contributions. SPL_Grey and DEM displayed the strongest regional patterns and an almost mirror-like relationship. High SPL_Grey contributions were concentrated along the southeastern coast and in South China, with Shaoxing ranking first (23.2%), and generally decreased toward northern inland cities. DEM contributions varied more widely (2.7–47.5%), with high values in topographically complex cities in Northeast and Northwest China and values below 10% in much of the southern subtropical zone. Other factors showed weaker or more localized spatial clustering: NDVI was relatively important from the North China Plain to the Jianghuai region and Yangtze River Delta, BD clustered in the northern Jiangsu–Jianghuai Plain, and FVC, LAI, BH, and AI_Grey mainly appeared as local extremes.
Figure 8.
Spatial patterns in the relative importance of selected predictors of surface UHII: (a) DEM. (b) FVC. (c) NDVI. (d) LAI. (e) AI_Grey. (f) SPL_Grey. (g) BD. (h) BH.
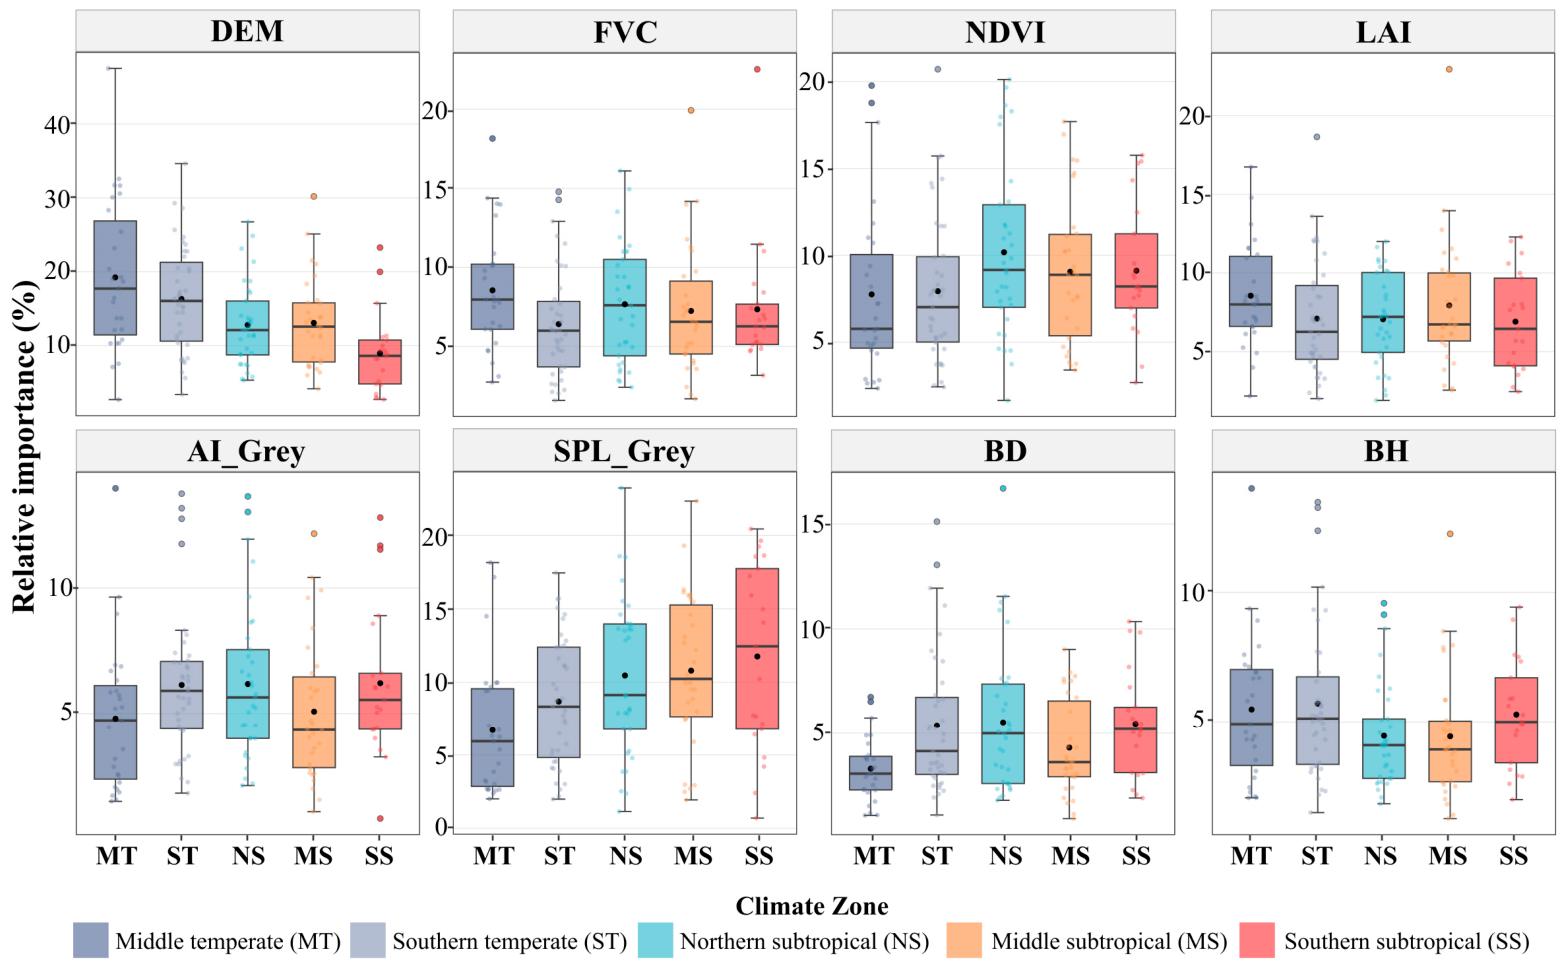
The climate-zone statistics in Figure 9 support these spatial patterns. Mean DEM contribution declined from 19.2% in the middle temperate zone to 9.0% in the southern subtropical zone, while SPL_Grey increased from 6.7% to 11.8% and showed greater inter-city dispersion in the south. Green factors (NDVI, FVC, and LAI) remained within a narrow mean range of 6.4–10.2%, whereas BD increased from 3.3% in the middle temperate zone to approximately 4.3–5.5% elsewhere. AI_Grey and BH showed no clear climate-zone gradient.
Figure 9.
Inter-climatic-zone differences in the relative importance of selected predictors of surface UHII, shown as boxplots.
4.4. Nonlinear Associations Between Selected Predictors and UHII
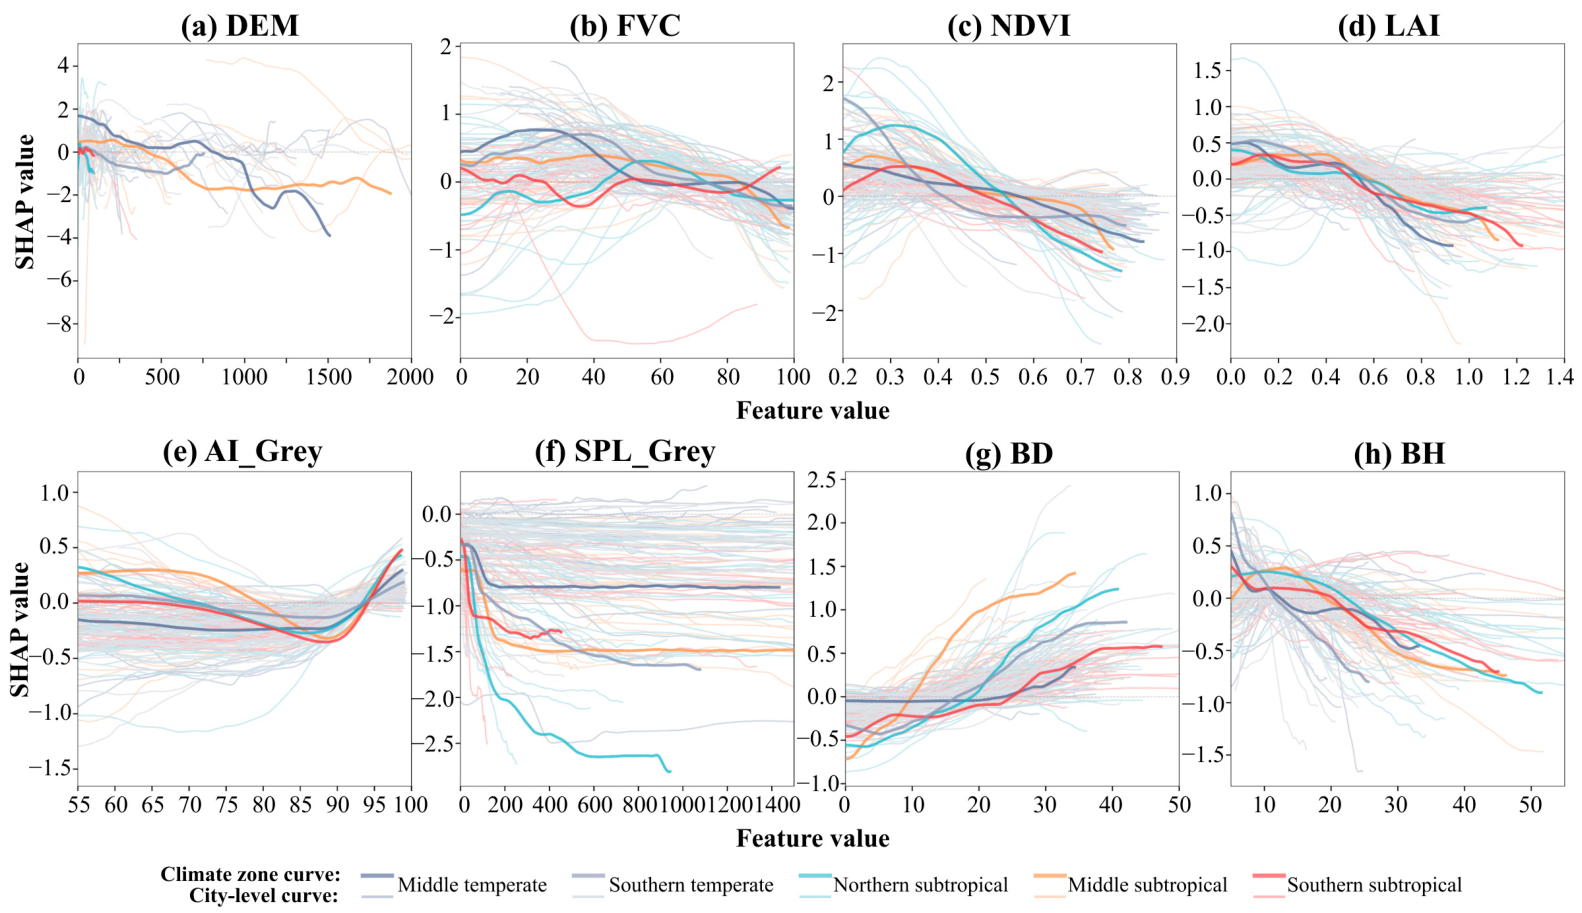
Figure 10 presents the SHAP dependence curves for eight selected predictors at the climate-zone and city scales. The reported response ranges summarize the zero crossings of the climate-zone curves and represent exploratory model-derived patterns. Corresponding zero crossings and supplementary intervals are reported in Table S13. The corresponding predictor distributions are provided in Figure S3 to indicate sample support across the displayed ranges.
Figure 10.
SHAP dependence plots for selected predictors of surface UHII: (a) DEM. (b) FVC. (c) NDVI. (d) LAI. (e) AI_Grey. (f) SPL_Grey. (g) BD. (h) BH.
DEM generally showed positive SHAP contributions at lower elevations and negative contributions at higher elevations in the temperate and middle subtropical zones, whereas its contributions were predominantly negative in the northern and southern subtropical zones. NDVI and LAI showed similar patterns of contribution changes: SHAP values were positive at low values but became negative after approximately 0.41–0.57 for NDVI and 0.51–0.59 for LAI, with increasingly negative contributions at higher values. The SHAP contributions of FVC were relatively small and showed greater regional variation. In the temperate zones and the middle subtropical zone, FVC contributed positively at low to medium coverage levels and became weakly negative only at higher coverage levels, with zero crossings at approximately 55–84% and the highest crossing value occurring in the middle subtropical zone. In the northern subtropical zone, the opposite pattern was observed: FVC contributed negatively at low coverage levels and became briefly positive only at medium coverage levels, approximately 43–74%. In the southern subtropical zone, FVC fluctuated around zero throughout the range, with no clear transition.
Grey morphology factors also showed nonlinear associations. AI_Grey followed a U-shaped curve: contributions were near zero at low aggregation, became negative as aggregation increased, reached a trough around 85–90%, and turned sharply positive above approximately 93%. SHAP contributions for SPL_Grey declined rapidly as fragmentation increased and then plateaued, with the strongest decline in the northern subtropical zone. BD showed negative SHAP contributions at low densities, followed by positive and increasing contributions at higher densities. The transition from negative to positive SHAP values for BD occurred at approximately 10% in the middle subtropical zone and 25% in the southern subtropical zone, with the most pronounced increase observed in the middle subtropical zone. BH showed the opposite pattern, with SHAP values generally changing from positive to negative as height increased. The transitions occurred at approximately 12 m in the temperate zones and 20–22 m in the northern and southern subtropical zones; in the middle subtropical zone, positive SHAP values occurred mainly at heights of 5–19 m.
5. Discussion
5.1. Spatial Patterns of UHII from the Block–LCZ Perspective
The mean UHII showed a clear latitudinal gradient, with subtropical zones generally exhibiting higher values than temperate zones. The relatively high UHII in the northern and southern subtropical zones and the low value in the middle temperate zone are consistent with previous multi-city studies [28,60]. The middle subtropical zone was an exception: several megacities, such as Chongqing and Kunming, even showed urban cool island effects. This may be related to extensive mountainous terrain and continuous natural vegetation, which form dense cold-spot clusters and lower the citywide mean. By contrast, studies using rural reference zones may assign these low-temperature areas to the rural category, thereby enlarging the urban–rural difference [61]. Together with evidence that UHII decreases from urban core to fringe [31], these results show that urban thermal patterns are highly heterogeneous. A simple urban–rural dichotomy can therefore obscure the intra-urban thermal differentiation caused by land-cover and building morphology [62]. The LCZ framework used here helps capture this full intra-city thermal profile.
From the LCZ perspective, the intra-urban UHII range reached 7.84 °C, close to the overall difference among the 150 cities. This indicates that thermal differentiation among LCZ types can be comparable in magnitude to differences among cities. Among built types, LCZ 8 and LCZ 7 showed the highest surface UHII. LCZ 8 is dominated by large industrial or warehouse surfaces, extensive impervious pavement, sparse vegetation, and limited evapotranspirative cooling, allowing radiative heat to accumulate [63]. LCZ 7 often consists of compact low-rise buildings, crowded layouts, and bare or impervious surfaces; limited vegetation and exposed surfaces may contribute to reduced evapotranspirative cooling and greater surface heat storage [34,64]. The UHII values of LCZ 7 and LCZ 8 increased markedly from the middle temperate zone to subtropical zones, potentially reflecting differences in surface energy exchange under contrasting climatic conditions [35]. In contrast, LCZ 1 had negative surface UHII in the middle temperate zone, potentially reflecting mutual shading within high-rise clusters under low solar-elevation angles, as also discussed for Beijing [65]. This interpretation is specific to daytime observations. BH and FAR may be associated with daytime surface temperatures through building shading, whereas stored heat release and restricted longwave radiative cooling under low SVF may become more important at night. The daytime associations should therefore not be directly extrapolated to nighttime conditions. Among natural types, LCZ A showed negative surface UHII, consistent with canopy shading and transpiration [66], whereas LCZ E showed positive values associated with unvegetated surfaces [47,67]. These findings highlight the variation in surface thermal conditions among combinations of building structure, land-cover, and climatic background. A simple urban–rural binary classification is therefore insufficient to fully capture the spatial heterogeneity of UHII.
5.2. Dual-Scale Analysis of the Effects of Grey–Green Morphology on UHII
At the climate-zone scale, the predictor-importance patterns reflect associations with both geographical background and grey–green morphology. In the middle temperate zone, cities span plains, plateaus, and mountainous terrain. The importance of DEM may therefore reflect both within-city elevation variation and between-city differences in geographical setting, rather than an isolated elevation effect. SPL_Grey ranked first in several climate zones. This association may reflect the extensive impervious cover and limited vegetated interruptions within contiguous grey patches, which can favor surface heat storage and limit evapotranspirative cooling [68]. This is consistent with studies showing that continuous grey patches enhance warming, whereas more fragmented configurations can produce cooling effects [9]. The negative SHAP contributions of NDVI may be interpreted in relation to the climatic dependence of vegetation cooling [69,70]. Differences in water availability and atmospheric demand can influence evapotranspiration and may help explain the regional variation in NDVI–UHII associations [71]. BH also showed a nonlinear relationship with UHII. At lower heights, buildings may increase heat storage, whereas taller buildings can enhance shading over surrounding ground surfaces and adjacent buildings. The balance between shading and heat storage provides a possible explanation for the observed contribution changes, rather than a mechanism directly established by the models [72,73]. The transition from positive to negative SHAP contributions occurred at higher BH values in the northern and southern subtropical zones (about 20–22 m) than in temperate zones (about 12 m), potentially reflecting differences in shading associated with solar-elevation angles [74].
At the city scale, the highest-ranked predictors showed clear spatial differentiation. SPL_Grey had the largest model contribution in southeastern coastal cities. In these areas, built-up density often approaches saturation, reducing inter-city differences in the total amount of grey surface; spatial configuration may therefore provide additional information about surface thermal variation beyond the amount of grey cover alone. This agrees with evidence from high-density areas in the Yangtze River Delta and Pearl River Delta, where shape indices are associated with the thermal environment [75]. BD was more important in the northern Jiangsu–Jianghuai Plain, where topographic effects are weak and development intensity has not reached saturation; this association may reflect differences in surface shading and heat storage associated with building coverage [76]. Green factors, including NDVI, FVC, and LAI, remained important across climate zones and city types, consistent with the potential roles of evapotranspiration and shading under different hydrothermal conditions [24,77].
Overall, climate-zone models summarize associations across cities with heterogeneous geographical backgrounds, whereas city-scale models characterize variation within individual cities. Even within the same climate zone, different cities may still have different highest-ranked predictors, such as BD, SVF, or AI_Grey. The two scales therefore provide complementary evidence on recurring associations and local variation in the model importance of grey–green morphology.
5.3. UHII Mitigation Strategies Based on Grey–Green Morphology Optimization
Green morphology optimization should consider vegetation condition and canopy structure alongside green-space area. NDVI and LAI showed more consistent negative SHAP contributions than FVC, suggesting that vegetation condition and canopy leaf area warrant attention alongside planar coverage. Cities could therefore consider tree proportion, vertical canopy structure, and leaf area density to strengthen shading and evapotranspiration within limited space [78,79]. In high-UHII LCZs with limited greening space, such as LCZ 7 and LCZ 8, street-tree rows, green roofs, and vertical greening can improve unit greenness efficiency [80,81]. In hot-humid southern cities, canopy design should consider both surface shading and evapotranspirative cooling.
Grey morphology optimization should consider spatial configuration alongside development intensity. In southern and coastal high-density cities, the model importance and nonlinear associations of SPL_Grey and AI_Grey suggest that the arrangement of impervious and vegetated surfaces warrants attention. Large continuous hard surfaces could be interrupted by green spaces or shaded tree rows, supplemented by cool pavements, permeable pavements, and high-reflectance materials to reduce heat absorption and enhance evapotranspirative cooling [9,82]. Building morphology regulation should consider density and height together. The SHAP curves showed transitions from negative to positive contributions for BD at approximately 10–25% and from positive to negative contributions for BH at approximately 12 m in temperate zones and 20–22 m in northern and southern subtropical zones. These model-derived associations suggest that density–height configurations warrant further consideration in relation to daytime surface shading.
Governance priorities should be differentiated by climate zone and LCZ. In the middle temperate zone, where DEM had high model importance, urban renewal should account for terrain-related differences in surface thermal conditions. Southern cities should focus more on impervious-surface configuration and greenness quality. These implications are informed by statistical associations between grey–green morphology and surface UHII. The identified response ranges should therefore be treated as context-dependent references rather than optimal intervention thresholds, particularly where sample support is limited. Their applicability requires assessment under local conditions.
5.4. Limitations and Future Perspectives
This study systematically examined associations between grey–green morphology and UHII across Chinese climate zones using a block–LCZ framework, but several limitations remain.
First, because high-quality thermal infrared imagery and synchronized morphology data are difficult to obtain for large-scale, multi-city, long-term analysis, this study focused on summer 2023. Future work should examine interannual variation, seasonal transitions, and responses during extreme heat events. Limited availability of consistent, temporally matched building footprint and height data across all 150 cities resulted in a mismatch between the 2020 building data and 2023 LST observations, potentially overlooking changes in rapidly developing areas. Terrain is comparatively stable over this interval. More frequently updated building datasets would enable closer temporal alignment of morphological and thermal observations.
Second, Landsat 8 thermal imagery is affected by clouds, cloud shadows, and atmospheric conditions, especially in humid southern China. Although cloud-cover screening, quality-control masking, and mean compositing were used, residual retrieval errors may remain; spatiotemporal fusion methods could improve LST stability in cloudy regions. The composite represents available clear-sky daytime observations, whose frequency varies among cities. More frequent and higher-resolution thermal observations could improve seasonal coverage and the representation of small blocks affected by mixed pixels. Satellite-derived surface UHII does not directly represent near-surface air temperature, human thermal comfort, or outdoor heat exposure. Future studies could combine satellite observations with near-surface meteorological measurements and thermal-comfort indices to assess the broader thermal implications of grey–green morphology.
Third, differences in LCZ classification accuracy among cities introduce uncertainty into LCZ-specific surface UHII estimates. More consistent reference samples and higher-resolution observations could improve classification consistency and the assessment of this uncertainty. Spatial dependence among neighboring blocks and uncertainty in the shared city-specific reference temperature may also affect model evaluation and interpretation. The overall stability of the top-five predictor rankings across validation schemes supports interpretive robustness. However, lower R2 values under spatial-block and selected-city holdout validation indicate reduced predictive generalization in some climate zones, requiring caution and local validation when applying the models to unseen cities, particularly in the southern subtropical zone. Spatial hierarchical models could further address the remaining dependencies. Landscape metrics such as SPL_Grey may also be influenced by block geometry, boundary delineation, and raster resolution, which should be considered when interpreting their model importance.
Finally, CatBoost–SHAP identifies statistical associations rather than causal effects. The current models cannot fully distinguish elevation-related associations from broader geographical context. Climate-zone grouping cannot isolate individual climatic influences, and the coarse resolution of available climate data limits the representation of block-scale variation. Consistent block-scale anthropogenic heat data are difficult to obtain across all 150 cities, and LCZ classification alone cannot quantify cooling from nearby water bodies. These influences were therefore not explicitly controlled. Future studies could incorporate terrain, quantitative climate variables, climate–morphology interactions, anthropogenic heat, and water proximity within hierarchical models, while longitudinal observations and causal inference designs could help examine causal relationships.
6. Conclusions
This study examined 150 Chinese cities across five climate zones using a block–LCZ framework and CatBoost–SHAP to quantify surface UHII and examine its statistical associations with 2D and 3D grey–green morphology at climate-zone and city scales. The main conclusions are as follows:
(1) The mean surface UHII across the 150 cities was 1.65 °C, with 138 cities showing positive values and an overall spatial pattern of higher surface UHII in the south and lower surface UHII in the north. The block–LCZ framework revealed strong intra-urban thermal differentiation: LCZ 8 had the highest surface UHII, whereas LCZ A had the lowest. Thermal differences among LCZ types were comparable in magnitude to those observed among cities.
(2) At the climate-zone scale, predictor importance varied regionally. DEM was the highest-ranked predictor in the middle temperate model, whereas SPL_Grey ranked first in the southern temperate and three subtropical models. NDVI ranked among the top four predictors in all five climate zones, indicating its consistently high model importance among green morphological factors.
(3) At the city scale, the highest-ranked predictor shifted from DEM in northern and temperate cities to SPL_Grey in high-density southeastern coastal and southern cities. DEM was more important where topographic background was complex, whereas SPL_Grey became increasingly important where built-up areas were dense and development approached saturation. Green factors such as NDVI, FVC, and LAI rarely ranked first in individual city models but showed recurring contributions across climate zones.
(4) Key grey–green factors showed nonlinear and climate-zone-specific associations with surface UHII. SHAP values for NDVI and LAI generally changed from positive to negative at values of approximately 0.5, with the transition varying more clearly across climate zones for NDVI than for LAI. These findings suggest that urban greening should consider vegetation condition and canopy leaf area alongside planar coverage, rather than relying solely on expanding green-space area. BD showed transitions from negative to positive SHAP values at approximately 10–25%, whereas BH generally showed the opposite pattern as building height increased. These associations provide context-dependent references for coordinating building density and height.
By integrating block-scale LCZ classification, 2D/3D grey–green morphology, and CatBoost–SHAP across 150 cities and five climate zones, this study provides a broad empirical comparison of grey–green morphology–surface UHII associations. The comparison highlights recurring vegetation-related associations alongside regional differences in the importance of DEM and SPL_Grey and in nonlinear response patterns. These findings provide context-dependent evidence for urban greening and development planning under different climatic conditions.
Supplementary Materials
The following supporting information can be downloaded at: https://www.mdpi.com/article/10.3390/su182111150/s1.
Author Contributions
Conceptualization, K.L.; Methodology, K.L.; Software, J.S.; Validation, J.S.; Formal analysis, J.S.; Investigation, H.C.; Resources, H.C.; Data curation, H.C.; Writing—original draft, K.L.; Writing—review and editing, H.W.; Visualization, K.L.; Supervision, H.W.; Project administration, H.W.; Funding acquisition, H.W. All authors have read and agreed to the published version of the manuscript.
Funding
This work was supported by the Hebei Natural Science Foundation [grant number D2025204001] and the Science and Technology Project of the Hebei Education Department [grant number QN2025433].
Institutional Review Board Statement
Not applicable.
Informed Consent Statement
Not applicable.
Data Availability Statement
Processed block-level data and shareable code for morphological-metric calculation and CatBoost–SHAP analysis are available upon request from the corresponding author. Requests should specify the intended use and materials required. Third-party input datasets are subject to their respective licensing terms and should be obtained from the original providers listed in Table 1.
Conflicts of Interest
The authors declare no conflicts of interest.
References
- Un-Habitat. World Cities Report 2022: Envisaging the Future of Cities; UN: New York, NY, USA, 2022. [Google Scholar]
- Zhou, Y.; Chen, M.; Tang, Z.; Mei, Z. Urbanization, Land Use Change, and Carbon Emissions: Quantitative Assessments for City-Level Carbon Emissions in Beijing-Tianjin-Hebei Region. Sustain. Cities Soc. 2021, 66, 102701. [Google Scholar] [CrossRef] [Scilit]
- Liu, J.; Wu, J.; Yang, Y.; Zhang, B.; Yin, L. Evaluation of the Seasonal Thermal Environmental Benefits of Urban Green Space in the Core Areas of Urban Heat Island. Forests 2023, 14, 1500. [Google Scholar] [CrossRef] [Scilit]
- Voogt, J.A.; Oke, T.R. Thermal Remote Sensing of Urban Climates. Remote Sens. Environ. 2003, 86, 371–384. [Google Scholar] [CrossRef] [Scilit]
- Ballester, J.; Quijal-Zamorano, M.; Méndez Turrubiates, R.F.; Pegenaute, F.; Herrmann, F.R.; Robine, J.M.; Basagaña, X.; Tonne, C.; Antó, J.M.; Achebak, H. Heat-Related Mortality in Europe during the Summer of 2022. Nat. Med. 2023, 29, 1857–1866. [Google Scholar] [CrossRef] [Scilit] [PubMed]
- Chrysoulakis, N.; Grimmond, S.; Feigenwinter, C.; Lindberg, F.; Gastellu-Etchegorry, J.-P.; Marconcini, M.; Mitraka, Z.; Stagakis, S.; Crawford, B.; Olofson, F.; et al. Urban Energy Exchanges Monitoring from Space. Sci. Rep. 2018, 8, 11498. [Google Scholar] [CrossRef] [Scilit] [PubMed]
- Krehbiel, C.P.; Jackson, T.; Henebry, G.M. Web-Enabled Landsat Data Time Series for Monitoring Urban Heat Island Impacts on Land Surface Phenology. IEEE J. Sel. Top. Appl. Earth Obs. Remote Sens. 2016, 9, 2043–2050. [Google Scholar] [CrossRef] [Scilit]
- Parsons, L.A.; Masuda, Y.J.; Kroeger, T.; Shindell, D.; Wolff, N.H.; Spector, J.T. Global Labor Loss Due to Humid Heat Exposure Underestimated for Outdoor Workers. Environ. Res. Lett. 2022, 17, 14050. [Google Scholar] [CrossRef] [Scilit]
- Zhang, J.; Hong, S.; Shi, S.; Chen, B.; Wu, S. Synergistic Impacts of 2D/3D Grey-Green Spatial Morphology on Land Surface Temperature Across Local Climate Zones in the Guangdong-Hong Kong-Macao Greater Bay Area. Sustain. Cities Soc. 2026, 139, 107231. [Google Scholar] [CrossRef] [Scilit]
- Suligowski, R.; Ciupa, T.; Cudny, W. Quantity Assessment of Urban Green, Blue, and Grey Spaces in Poland. Urban For. Urban Green. 2021, 64, 127276. [Google Scholar] [CrossRef] [Scilit]
- Zhong, Q.; Li, Z.; Zhu, J.; Yuan, C. Revealing Multiscale and Nonlinear Effects of Urban Green Spaces on Heat Islands in High-Density Cities: Insights from MSPA and Machine Learning. Sustain. Cities Soc. 2025, 120, 106173. [Google Scholar] [CrossRef] [Scilit]
- Zhang, Z.; Luan, W.; Yang, J.; Guo, A.; Su, M.; Tian, C. The Influences of 2D/3D Urban Morphology on Land Surface Temperature at the Block Scale in Chinese Megacities. Urban Clim. 2023, 49, 101553. [Google Scholar] [CrossRef] [Scilit]
- Han, D.; Cai, H.; Wang, F.; Wang, M.; Xu, X.; Qiao, Z.; An, H.; Liu, Y.; Jia, K.; Sun, Z.; et al. Understanding the Role of Urban Features in Land Surface Temperature at the Block Scale: A Diurnal Cycle Perspective. Sustain. Cities Soc. 2024, 111, 105588. [Google Scholar] [CrossRef] [Scilit]
- Saini, J.; Gupta, A.K.; Shrivastava, A.; Dhupper, R. Study of Urban Warming in Chandigarh Union Territory, India: Geospatial Approach. Theor. Appl. Climatol. 2024, 155, 8245–8261. [Google Scholar] [CrossRef] [Scilit]
- Liu, S.; Wang, Z.; Kumilamba, G.; Yu, L. Optimizing Green Space Configuration for Mitigating Land Surface Temperature: A Case Study of Karst Mountainous Cities. Sustain. Cities Soc. 2025, 125, 106345. [Google Scholar] [CrossRef] [Scilit]
- Li, Y.; Ren, C.; Ho, J.Y.; Shi, Y. Landscape Metrics in Assessing How the Configuration of Urban Green Spaces Affects Their Cooling Effect: A Systematic Review of Empirical Studies. Landsc. Urban Plan. 2023, 239, 104842. [Google Scholar] [CrossRef] [Scilit]
- Jiang, X.; Ma, T.; Liang, J.; Wang, Y. The Greener the Cooler? Nonlinear Thresholds in the Cooling Effects of Urban Blue-Green Spaces and Implications for Sustainable Planning in the Yangtze River Delta. Urban Clim. 2025, 64, 102679. [Google Scholar] [CrossRef] [Scilit]
- Wang, Z.; Zhou, R.; Rui, J.; Yu, Y. Revealing the Impact of Urban Spatial Morphology on Land Surface Temperature in Plain and Plateau Cities Using Explainable Machine Learning. Sustain. Cities Soc. 2025, 118, 106046. [Google Scholar] [CrossRef] [Scilit]
- Yang, L.; Chen, Y.; Li, Y.; Zhu, H.; Yang, X.; Li, S.; Tang, G. Is 3D Building Morphology Really Related to Land Surface Temperature? Insights from a New Homogeneous Unit. Build. Environ. 2024, 266, 112101. [Google Scholar] [CrossRef] [Scilit]
- Zhong, X.; Zhao, L.; Ren, P.; Zhang, X.; Luo, C.; Li, Y.; Wang, J. Downscaled High Spatial Resolution Images from Automated Machine Learning for Assessment of Urban Structure Effects on Land Surface Temperatures. Build. Environ. 2024, 264, 111934. [Google Scholar] [CrossRef] [Scilit]
- Bečić, D.; Gašparović, M. Urban Heat Islands and Land-Use Patterns in Zagreb: A Composite Analysis Using Remote Sensing and Spatial Statistics. Land 2025, 14, 1470. [Google Scholar] [CrossRef] [Scilit]
- Karimimoshaver, M.; Khalvandi, R.; Khalvandi, M. The Effect of Urban Morphology on Heat Accumulation in Urban Street Canyons and Mitigation Approach. Sustain. Cities Soc. 2021, 73, 103127. [Google Scholar] [CrossRef] [Scilit]
- Li, K.; Wang, H. Spatial and Data-Driven Approaches for Mitigating Urban Heat in Coastal Cities. Buildings 2025, 15, 3544. [Google Scholar] [CrossRef] [Scilit]
- Lu, Y.; Wu, J.; Liu, M. Decoding the Cooling Potential of Urban Green Spaces: A Cross-City Investigation of Driving Factors in 311 Chinese Cities Under Varying Climate Zones. Sustain. Cities Soc. 2025, 126, 106410. [Google Scholar] [CrossRef] [Scilit]
- Zhu, Z.; Shen, Y.; Fu, W.; Zheng, D.; Huang, P.; Li, J.; Lan, Y.; Chen, Z.; Liu, Q.; Xu, X.; et al. How Does 2D and 3D of Urban Morphology Affect the Seasonal Land Surface Temperature in Island City? A Block-Scale Perspective. Ecol. Indic. 2023, 150, 110221. [Google Scholar] [CrossRef] [Scilit] [PubMed]
- Ding, L.; Xiao, X.; Wang, H. Temporal and Spatial Variations of Urban Surface Temperature and Correlation Study of Influencing Factors. Sci. Rep. 2025, 15, 914. [Google Scholar] [CrossRef] [Scilit] [PubMed]
- Oke, T.R.; Mills, G.; Christen, A.; Voogt, J.A. Urban Climates; Cambridge University Press: Cambridge, UK, 2017. [Google Scholar]
- Wang, Y.; Wang, H.; Yao, F.; Stouffs, R.; Wu, J. An Integrated Framework for Jointly Assessing Spatiotemporal Dynamics of Surface Urban Heat Island Intensity and Footprint: China, 2003–2020. Sustain. Cities Soc. 2024, 112, 105601. [Google Scholar] [CrossRef] [Scilit]
- Li, S.; Liang, Y.; Yang, D.; Shen, J. Effect of Blue-Green Landscape Pattern and Urban Forms on Surface Urban Heat Island Intensity: Evidence from 816 Chinese Urban Clusters. Ecol. Indic. 2025, 178, 113949. [Google Scholar] [CrossRef] [Scilit]
- Ren, T.; Zhou, W.; Wang, J. Beyond Intensity of Urban Heat Island Effect: A Continental Scale Analysis on Land Surface Temperature in Major Chinese Cities. Sci. Total Environ. 2021, 791, 148334. [Google Scholar] [CrossRef] [Scilit] [PubMed]
- Zhou, Z.; Liu, Y. Surface Urban Heat Island Disparities and the Role of Urban Form Across the Urban-Rural Gradient. Environ. Impact Assess. Rev. 2026, 116, 108144. [Google Scholar] [CrossRef] [Scilit]
- Chen, G.; Li, X.; Liu, X.; Chen, Y.; Liang, X.; Leng, J.; Xu, X.; Liao, W.; Qiu, Y.; Wu, Q.; et al. Global Projections of Future Urban Land Expansion Under Shared Socioeconomic Pathways. Nat. Commun. 2020, 11, 537. [Google Scholar] [CrossRef] [Scilit] [PubMed]
- Liu, X.; Wu, T.; Jiang, Q.; Ao, X.; Zhu, L.; Qiao, R. The Nonlinear Climatological Impacts of Urban Morphology on Extreme Heats in Urban Functional Zones: An Interpretable Ensemble Learning-Based Approach. Build. Environ. 2025, 273, 112728. [Google Scholar] [CrossRef] [Scilit]
- Stewart, I.D.; Oke, T.R. Local Climate Zones for Urban Temperature Studies. Bull. Am. Meteorol. Soc. 2012, 93, 1879–1900. [Google Scholar] [CrossRef] [Scilit]
- Deng, J.; Lai, G.; Fan, A. Effects of the Western Pacific Subtropical High on the Urban Heat Island Characteristics in the Middle and Lower Reaches of the Yangtze River, China. Comput. Urban Sci. 2024, 4, 25. [Google Scholar] [CrossRef] [Scilit]
- Wu, Z.; Long, Q.; Tong, Z. Investigating the Response of Urban Surface Thermal Environment to Urban Morphology Changes in Nanjing. J. Environ. Manag. 2024, 370, 122875. [Google Scholar] [CrossRef] [Scilit] [PubMed]
- Yuan, B.; Zhou, L.; Hu, F.; Wei, C. Effects of 2D/3D Urban Morphology on Land Surface Temperature: Contribution, Response, and Interaction. Urban Clim. 2024, 53, 101791. [Google Scholar] [CrossRef] [Scilit]
- Zhao, J.; Yu, L.; Zhao, L.; Fu, H.; Gong, P. Asymmetric Influence of Urban Morphology Changes on Land Surface Temperature Between Daytime and Nighttime. Sustain. Cities Soc. 2025, 124, 106307. [Google Scholar] [CrossRef] [Scilit]
- Chen, X.; Wei, F. Combined Effects of Urban Morphology on Land Surface Temperature and PM2.5 Concentration Across Fine-Scale Urban Blocks in Hangzhou, China. Build. Environ. 2025, 278, 112979. [Google Scholar] [CrossRef] [Scilit]
- Connors, J.P.; Galletti, C.S.; Chow, W.T.L. Landscape Configuration and Urban Heat Island Effects: Assessing the Relationship Between Landscape Characteristics and Land Surface Temperature in Phoenix, Arizona. Landsc. Ecol. 2013, 28, 271–283. [Google Scholar] [CrossRef] [Scilit]
- Li, J.; Song, C.; Cao, L.; Zhu, F.; Meng, X.; Wu, J. Impacts of Landscape Structure on Surface Urban Heat Islands: A Case Study of Shanghai, China. Remote Sens. Environ. 2011, 115, 3249–3263. [Google Scholar] [CrossRef] [Scilit]
- Li, W.; Cao, Q.; Lang, K.; Wu, J. Linking Potential Heat Source and Sink to Urban Heat Island: Heterogeneous Effects of Landscape Pattern on Land Surface Temperature. Sci. Total Environ. 2017, 586, 457–465. [Google Scholar] [CrossRef] [Scilit] [PubMed]
- Hong, T.; Yim, S.H.L.; Heo, Y. Interpreting Complex Relationships Between Urban and Meteorological Factors and Street-Level Urban Heat Islands: Application of Random Forest and SHAP Method. Sustain. Cities Soc. 2025, 126, 106353. [Google Scholar] [CrossRef] [Scilit]
- Li, Y.; Zhang, Y.; Wu, Q.; Xue, R.; Wang, X.; Si, M.; Zhang, Y. Greening the Concrete Jungle: Unveiling the Co-Mitigation of Greenspace Configuration on PM2.5 and Land Surface Temperature with Explanatory Machine Learning. Urban For. Urban Green. 2023, 88, 128086. [Google Scholar] [CrossRef] [Scilit]
- Lundberg, S.M.; Lee, S.-I. A Unified Approach to Interpreting Model Predictions. In Proceedings of the Advances in Neural Information Processing Systems; Curran Associates, Inc.: Red Hook, NY, USA, 2017; Volume 30. [Google Scholar]
- Fu, X.; Wang, M.; Zhang, D.; Chen, F.; Peng, X.; Wang, L.; Tan, S.K. An XGBoost-SHAP Framework for Identifying Key Drivers of Urban Flooding and Developing Targeted Mitigation Strategies. Ecol. Indic. 2025, 175, 113579. [Google Scholar] [CrossRef] [Scilit]
- Liu, Q.; Hang, T.; Wu, Y. Unveiling Differential Impacts of Multidimensional Urban Morphology on Heat Island Effect Across Local Climate Zones: Interpretable CatBoost-SHAP Machine Learning Model. Build. Environ. 2025, 270, 112574. [Google Scholar] [CrossRef] [Scilit]
- Yang, H.; Wu, Z.; Qiu, S.; Wu, F.; Dawson, R.J.; Ford, A.; Barr, S. Surface Urban Heat Island Variations Under the 3-Decadal Urban Expansion in China: Patterns and Driving Factors. Sustain. Cities Soc. 2025, 130, 106640. [Google Scholar] [CrossRef] [Scilit]
- Peng, J.; Ma, J.; Liu, Q.; Liu, Y.; Hu, Y.; Li, Y.; Yue, Y. Spatial-Temporal Change of Land Surface Temperature Across 285 Cities in China: An Urban-Rural Contrast Perspective. Sci. Total Environ. 2018, 635, 487–497. [Google Scholar] [CrossRef] [Scilit] [PubMed]
- Yang, C.; Zhao, S. Synergies or Trade-Offs Between Surface Urban Heat Island and Hot Extreme: Distinct Responses in Urban Environments. Sustain. Cities Soc. 2024, 101, 105093. [Google Scholar] [CrossRef] [Scilit]
- Geng, X.; Zhang, D.; Li, C.; Yuan, Y.; Yu, Z.; Wang, X. Impacts of Climatic Zones on Urban Heat Island: Spatiotemporal Variations, Trends, and Drivers in China from 2001–2020. Sustain. Cities Soc. 2023, 89, 104303. [Google Scholar] [CrossRef] [Scilit]
- Tang, J.; Xu, L.; Yu, H.; Jiang, H.; He, D.; Li, T.; Xiao, W.; Zheng, X.; Liu, K.; Li, Y.; et al. A Dataset of Multi-Level Street-Block Divisions of 985 Cities Worldwide. Sci. Data 2025, 12, 456. [Google Scholar] [CrossRef] [Scilit] [PubMed]
- Zhang, X.; Liu, L.; Zhao, T.; Zhang, W.; Guan, L.; Bai, M.; Chen, X. GLC_FCS10: A Global 10-m Land-Cover Dataset with a Fine Classification System from Sentinel-1 and Sentinel-2 Time-Series Data in Google Earth Engine. Earth Syst. Sci. Data 2025, 17, 4039–4062. [Google Scholar] [CrossRef] [Scilit]
- Che, Y.; Li, X.; Liu, X.; Wang, Y.; Liao, W.; Zheng, X.; Zhang, X.; Xu, X.; Shi, Q.; Zhu, J.; et al. 3D-GloBFP: The First Global Three-Dimensional Building Footprint Dataset. Earth Syst. Sci. Data 2024, 16, 5357–5374. [Google Scholar] [CrossRef] [Scilit]
- Tolan, J.; Yang, H.-I.; Nosarzewski, B.; Couairon, G.; Vo, H.; Brandt, J.; Spore, J.; Majumdar, S.; Haziza, D.; Vamaraju, J.; et al. Very High Resolution Canopy Height Maps from RGB Imagery Using Self-Supervised Vision Transformer and Convolutional Decoder Trained on Aerial Lidar. Remote Sens. Environ. 2024, 300, 113888. [Google Scholar] [CrossRef] [Scilit]
- Ma, H.; Wang, Q.; Li, W.; Chen, Y.; Xu, J.; Ma, Y.; Huang, J.; Liang, S. The First Gap-Free 20 m 5-Day LAI/FAPAR Products over China (2018–2023) from Integrated Landsat-8/9 and Sentinel-2 Analysis Ready Data. Remote Sens. Environ. 2025, 331, 115048. [Google Scholar] [CrossRef] [Scilit]
- Jpl, N. NASADEM Merged DEM Global 1 Arc Second V001. In NASA EOSDIS Land Processes Distributed Active Archive Center (DAAC) Data Set; NASADEM_HGT.1; Land Processes Distributed Active Archive Center: Sioux Falls, SD, USA, 2020. [Google Scholar] [CrossRef]
- Deng, H.; Feng, J.; Liu, K.; Xiong, Y.; Cao, J. Local Climate Zone Framework: Seasonal Dynamics of Surface Urban Heat Island and Its Influencing Factors in Three Chinese Urban Agglomerations. GISci. Remote Sens. 2025, 62, 2490317. [Google Scholar] [CrossRef] [Scilit]
- Hancock, J.T.; Khoshgoftaar, T.M. CatBoost for Big Data: An Interdisciplinary Review. J. Big Data 2020, 7, 94. [Google Scholar] [CrossRef] [Scilit] [PubMed]
- Zheng, M.; Zheng, D.; Shen, Q.; Jia, F. Quantifying Long-Term Spatiotemporal Variation in and Drivers of the Surface Daytime Urban Heat Island Effect in Major Chinese Cities: Perspectives from Different Climate Zones. ISPRS Int. J. Geo-Inf. 2025, 14, 239. [Google Scholar] [CrossRef] [Scilit]
- Liu, H.; He, B.; Gao, S.; Zhan, Q.; Yang, C. Influence of Non-Urban Reference Delineation on Trend Estimate of Surface Urban Heat Island Intensity: A Comparison of Seven Methods. Remote Sens. Environ. 2023, 296, 113735. [Google Scholar] [CrossRef] [Scilit]
- Wang, Z.-H. Reconceptualizing Urban Heat Island: Beyond the Urban-Rural Dichotomy. Sustain. Cities Soc. 2022, 77, 103581. [Google Scholar] [CrossRef] [Scilit]
- Quan, J. Multi-Temporal Effects of Urban Forms and Functions on Urban Heat Islands Based on Local Climate Zone Classification. Int. J. Environ. Res. Public Health 2019, 16, 2140. [Google Scholar] [CrossRef] [Scilit] [PubMed]
- Oke, T.R. Street Design and Urban Canopy Layer Climate. Energy Build. 1988, 11, 103–113. [Google Scholar] [CrossRef] [Scilit]
- Zheng, Z.; Xu, G.; Li, N.; Gao, H. Classification of Urban Underlying Surfaces in Beijing and Its Impact on Summer High Temperature and Heat Wave Event. Atmos. Sci. Lett. 2025, 26, e1283. [Google Scholar] [CrossRef] [Scilit]
- Li, H.; Zhao, Y.; Wang, C.; Ürge-Vorsatz, D.; Carmeliet, J.; Bardhan, R. Cooling Efficacy of Trees Across Cities Is Determined by Background Climate, Urban Morphology, and Tree Trait. Commun. Earth Environ. 2024, 5, 754. [Google Scholar] [CrossRef] [Scilit]
- Liao, S.; Cai, H.; Tian, P.; Zhang, B.; Li, Y. Combined Impacts of the Abnormal and Urban Heat Island Effect in Guiyang, a Typical Karst Mountain City in China. Urban Clim. 2022, 41, 101014. [Google Scholar] [CrossRef] [Scilit]
- Sun, Z.; Li, Z.; Zhong, J. Analysis of the Impact of Landscape Patterns on Urban Heat Islands: A Case Study of Chengdu, China. Int. J. Environ. Res. Public Health 2022, 19, 13297. [Google Scholar] [CrossRef] [Scilit] [PubMed]
- Naserikia, M.; Hart, M.A.; Nazarian, N.; Bechtel, B. Background Climate Modulates the Impact of Land Cover on Urban Surface Temperature. Sci. Rep. 2022, 12, 15433. [Google Scholar] [CrossRef] [Scilit] [PubMed]
- Zhou, W.; Yu, W.; Zhang, Z.; Cao, W.; Wu, T. How Can Urban Green Spaces Be Planned to Mitigate Urban Heat Island Effect Under Different Climatic Backgrounds? A Threshold-Based Perspective. Sci. Total Environ. 2023, 890, 164422. [Google Scholar] [CrossRef] [Scilit] [PubMed]
- Zhu, Y.; Zheng, Z.; Zhao, G.; Zhu, J.; Zhao, B.; Sun, Y.; Gao, J.; Zhang, Y. Evapotranspiration Increase Is More Sensitive to Vegetation Greening than to Vegetation Type Conversion in Arid and Semi-Arid Regions of China. Glob. Planet. Change 2025, 244, 104634. [Google Scholar] [CrossRef] [Scilit]
- Chang, Y.; Xiao, J.; Li, X.; Middel, A.; Zhang, Y.; Gu, Z.; Wu, Y.; He, S. Exploring Diurnal Thermal Variations in Urban Local Climate Zones with ECOSTRESS Land Surface Temperature Data. Remote Sens. Environ. 2021, 263, 112544. [Google Scholar] [CrossRef] [Scilit]
- Wang, M.; Xu, H. The Impact of Building Height on Urban Thermal Environment in Summer: A Case Study of Chinese Megacities. PLoS ONE 2021, 16, e0247786. [Google Scholar] [CrossRef] [Scilit] [PubMed]
- Yu, K.; Chen, Y.; Wang, D.; Chen, Z.; Gong, A.; Li, J. Study of the Seasonal Effect of Building Shadows on Urban Land Surface Temperatures Based on Remote Sensing Data. Remote Sens. 2019, 11, 497. [Google Scholar] [CrossRef] [Scilit]
- Zou, Y.; Pan, R.; Chen, J.; Ning, S.; Zheng, Z.; Wang, X.; Zhou, Y.; Geng, J.; Zhang, L.; Thapa, B.R. Comparative Analysis of Urban Heat Island Dynamics in China’s Coastal Megaregions: An Evolution-Mechanism-Heterogeneity Framework. Ecol. Indic. 2026, 187, 114940. [Google Scholar] [CrossRef] [Scilit]
- Chen, L.; Guo, G. Exploring the Nonlinear Interactions and Threshold Effects of Urban Building Morphology and Green Space on Land Surface Temperature in High-Density Areas: A Cross-City Comparative Study. Sustain. Cities Soc. 2026, 136, 107069. [Google Scholar] [CrossRef] [Scilit]
- Yu, Z.; Xu, S.; Zhang, Y.; Jørgensen, G.; Vejre, H. Strong Contributions of Local Background Climate to the Cooling Effect of Urban Green Vegetation. Sci. Rep. 2018, 8, 6798. [Google Scholar] [CrossRef] [Scilit] [PubMed]
- Li, Y.; Svenning, J.-C.; Zhou, W.; Zhu, K.; Abrams, J.F.; Lenton, T.M.; Ripple, W.J.; Yu, Z.; Teng, S.N.; Dunn, R.R.; et al. Green Spaces Provide Substantial but Unequal Urban Cooling Globally. Nat. Commun. 2024, 15, 7108. [Google Scholar] [CrossRef] [Scilit] [PubMed]
- Lin, L.; Zhao, Y.; Zhao, J.; Wang, D. Comprehensively Assessing Seasonal Variations in the Impact of Urban Greenspace Morphology on Urban Heat Island Effects: A Multidimensional Analysis. Sustain. Cities Soc. 2025, 118, 106014. [Google Scholar] [CrossRef] [Scilit]
- Alexandri, E.; Jones, P. Temperature Decreases in an Urban Canyon Due to Green Walls and Green Roofs in Diverse Climates. Build. Environ. 2008, 43, 481–493. [Google Scholar] [CrossRef] [Scilit]
- Zuo, M.; Li, M.; Li, H.; Chen, T. Discovering Morphological Impact Discrepancies on Thermal Environment Among Urban Functional Zones Using Essential Urban Land Use Categories and Machine Learning. Urban Clim. 2025, 61, 102423. [Google Scholar] [CrossRef] [Scilit]
- Santamouris, M. Using Cool Pavements as a Mitigation Strategy to Fight Urban Heat Island—A Review of the Actual Developments. Renew. Sustain. Energy Rev. 2013, 26, 224–240. [Google Scholar] [CrossRef] [Scilit]

Disclaimer/Publisher’s Note: The statements, opinions and data contained in all publications are solely those of the individual author(s) and contributor(s) and not of MDPI and/or the editor(s). MDPI and/or the editor(s) disclaim responsibility for any injury to people or property resulting from any ideas, methods, instructions or products referred to in the content. |
© 2026 by the authors. Licensee MDPI, Basel, Switzerland. This article is an open access article distributed under the terms and conditions of the Creative Commons Attribution (CC BY) license.