


Abstract
Forests across the European Union represent a renewable resource, yet felling volumes consistently fall short of the net annual increment, producing persistent “wood mobilization gaps.” Greece exemplifies this imbalance, remaining a net importer of wood despite its large forest resources. This study develops a GIS-based multi-criteria evaluation framework to quantify Greece’s wood mobilization suitability at the NUTS-3 scale—a measure of relative eligibility rather than harvestable timber volume or economic supply—integrating eight biophysical, infrastructural, and socioeconomic criteria while accounting for protected area, terrain, and post-fire exclusion constraints. Applying these exclusions reduces Greece’s 3.4 million ha to approximately 2.43 million ha of forest estate eligible for mobilization, with legal protection—rather than terrain or fire—the dominant constraint. Regions with larger eligible areas are distinguished primarily by socioeconomic rather than biophysical criteria, and regional rankings remain broadly robust across alternative policy-weighting schemes, though agreement narrows among top-priority regions under conservation-oriented weighting. The post-fire exclusion window shows a fire-history-specific, nonlinear increase near four years rather than a confirmed ecological threshold, while mobilization potential is spatially diffuse rather than concentrated, indicating that no compact high-value core exists for targeted intervention. These findings suggest that expanding Greece’s domestic wood mobilization suitability requires geographically distributed, regionally coordinated policy, not a few flagship investments.
1. Introduction
Forests across the European Union are increasingly recognized as a strategic renewable resource, supplying raw materials for construction, the circular bioeconomy, and renewable energy while contributing to climate change mitigation and broader sustainability objectives [1,2]. Yet a substantial share of the wood that could be harvested sustainably remains unharvested each year: pan-European assessments consistently report that felling volumes fall well below the net annual increment, a persistent shortfall commonly referred to as the “wood mobilization gap” [2,3]. Understanding where, and under what conditions, additional wood resources could be mobilized without compromising ecological integrity has therefore become a central question for European forest policy.
Greece exemplifies this pattern in an especially pronounced form. The country is a net importer of wood and wood products, yet a substantial share of its domestic forest resource remains underexploited, with much of the potential annual increment left unharvested [4,5]. As in other Mediterranean countries, Greek trade in wood and wood products is dominated by imports, reflecting a consistent decline in domestic supply for several wood product categories [5,6]. Koulelis et al. [5] further report that Greece ranks among the EU Member States with comparatively low wood productivity and that the sector has historically carried a substantial trade deficit in forest products.
Multiple interacting factors help explain this persistent underutilization. In Greece, these include institutional and governance constraints—such as administrative complexity, regulatory uncertainty, and limited implementation capacity—as well as economic barriers including restricted investment in timber production, inefficient wood markets, high production costs, and limited value addition within the domestic forest sector [4,5]. At the European scale, harvesting intensity is shaped by interacting forest resource, environmental, accessibility, and country-specific factors, with the relative importance of these drivers varying substantially among regions [7]. Their spatial heterogeneity underscores the need for spatially explicit approaches that can identify where additional wood can be mobilized sustainably within environmentally diverse countries such as Greece.
This underutilization is not simply a matter of missed economic opportunity. As in many countries, the true economic contribution of Greece’s forest sector is likely underestimated because many public goods and services—including non-wood forest products and a wide range of forest ecosystem services—are not fully reflected in official economic statistics [2]. At the same time, Greece’s forest growing stock has increased substantially in recent decades, from approximately 162 to 192 million m3 between 1990 and 2020 [6], a trend consistent with broader patterns of forest expansion, rural land abandonment, and relatively low harvesting intensity reported across the Mediterranean region [6,8,9]. However, greater standing biomass does not necessarily translate into greater wood availability, improved forest health, higher productivity, or better accessibility, underscoring the need to look beyond national aggregate statistics toward the spatially explicit conditions that determine whether individual forest stands can realistically contribute to sustainable wood mobilization.
Superimposed on these structural and economic pressures is the accelerating impact of climate change. Greece is recognized as a climate change hotspot, with an average warming rate of approximately 0.05 °C per year, corresponding to a cumulative increase of about 1.5 °C between 1991 and 2020. However, warming rates vary considerably among regions [10]. Rising temperatures and associated changes in precipitation are expected to influence forest growth, wood formation, and ultimately both the quantity and quality of timber production, reinforcing the need for adaptive forest management strategies that enhance forest resilience under changing climatic conditions [11,12]. Climate change is also projected to intensify wildfire danger across the Mediterranean basin: projections for Greece indicate a substantial increase in the number of days with critical fire-weather conditions across all considered emissions scenarios [13]. As a consequence, wildfires further reduce the area available for sustainable wood mobilization by delaying timber harvesting until ecological recovery has occurred, in addition to the constraints already imposed by protected areas, steep terrain, and other environmental and operational limitations. Beyond delaying access, burned areas also face an elevated risk of soil erosion that can persist for years after a fire, a well-documented driver of land degradation in Mediterranean landscapes [14].
Reconciling these environmental, infrastructural, socioeconomic, and climatic dimensions within a single spatially explicit assessment is inherently complex. Evaluating forest management sustainability requires integrating multiple, often competing, environmental and socioeconomic criteria in a transparent and spatially consistent manner across heterogeneous forest landscapes [15]. Geographic Information System (GIS)-based multi-criteria evaluation (MCE) has become a well-established framework for spatial decision support and land-suitability analysis, enabling diverse environmental, accessibility, and socioeconomic criteria to be standardized, weighted, and integrated into a single suitability surface, while supporting explicit sensitivity analyses of alternative weighting schemes [16,17]. Within forest planning and management, comparable GIS-MCE approaches have been successfully applied to problems ranging from sustainable forest management to biomass energy planning. For instance, Perpiña et al. [18] integrated environmental, economic, and social criteria to support biomass energy planning in eastern Spain across alternative weighting scenarios. However, no comparable spatially explicit, sub-national assessment has yet been developed for Greece, despite the country’s pronounced environmental heterogeneity and regional variation in forest condition, accessibility, and socioeconomic characteristics.
Developing such a spatially explicit assessment is a prerequisite for designing targeted interventions to revitalize the Greek forest sector. Proposed measures include the establishment of well-organized small-scale industrial plantations; investment in domestic sawmilling and wood-processing capacity; development of a skilled, cost-efficient workforce; and economic incentives for the primary wood-processing and furniture industries [5]. Without a spatially explicit evidence base, however, such measures risk being implemented independently of where wood resources can realistically be mobilized under acceptable environmental and economic conditions, thereby limiting efforts to expand domestic timber production, strengthen forest-dependent rural economies, and reduce Greece’s reliance on wood imports.
The present study addresses this need by developing a spatially explicit framework for assessing wood mobilization suitability across Greece. The framework integrates biophysical, infrastructural, and socioeconomic variables within a GIS-based MCE while explicitly accounting for protected area, terrain, and post-fire exclusion constraints. Specifically, our study addresses four questions: (i) how much of Greece’s forest estate remains eligible for wood mobilization once legal protection, terrain, and recent fire history are accounted for, and how is this eligible resource distributed across NUTS-3 regions; (ii) to what extent are regional differences in mobilization potential associated with biophysical site conditions as opposed to infrastructural and socioeconomic factors; (iii) how robust are the resulting eligible area and regional prioritization to two sources of uncertainty in the underlying assumptions (the length of the post-fire recovery window and alternative policy-weighting schemes); and (iv) how spatially concentrated or diffuse is the wood mobilization potential across Greece’s eligible forest estate, and what does this imply for national versus regionally differentiated forest policy? More broadly, our framework is intended to support transparent, spatially informed decision-making for sustainable forest resource management across alternative policy priorities.
2. Materials and Methods
2.1. Study Area
The study area encompasses the terrestrial part of Greece, covering approximately 13.06 million ha [19]. Greece exhibits a highly heterogeneous landscape characterized by extensive mountainous terrain, a fragmented coastline, and a Mediterranean climate with marked spatial gradients in precipitation and growing conditions [20].
National borders were defined using the NUTS (Nomenclature of Territorial Units for Statistics) level-0 boundary, which excludes the autonomous monastic community of Mount Athos. Regional analysis was conducted at the NUTS level 3 (NUTS-3) administrative units (n = 52), providing sufficient spatial resolution to capture sub-national heterogeneity in forest resources and socioeconomic conditions, while remaining consistent with the spatial resolution of the available statistical data. All vector boundaries were sourced from Eurostat [19], projected to the European LAEA projection (EPSG:3035), which was adopted as the common coordinate reference system for all spatial layers throughout the analysis.
Greece’s forested land (Figure 1), characterized by using the CORINE Land Cover (CLC) dataset at 100 m resolution [21], is distinguished into three principal forest classes: broadleaved forest (CLC 311), coniferous forest (CLC 312), and mixed forest (CLC 313). To incorporate more recent changes in forest cover, the CLC 2018 layer was updated with forest extent information from the Copernicus Climate Change Service Land Cover dataset at 300 m resolution [22,23], following reclassification of the ESA land cover classes to the corresponding three-digit CLC codes. The ESA layer was reprojected to EPSG:3035, resampled to the CLC grid using nearest-neighbor interpolation, and used to overwrite CLC forest pixels, thereby updating the baseline land cover with more recent forest extent information (Figure 1). This update prioritizes forest extent currency over spatial precision: the 300 m source is coarser than the 100 m CLC baseline it overwrites, so forest boundaries in updated areas inherit the lower positional accuracy of the source layer.
Figure 1.
Study area map of Greece showing forest cover by CORINE Land Cover (CLC). Broadleaved (CLC 311), coniferous (CLC 312), and mixed (CLC 313) forest types are distinguished by color-shading. NUTS-3 administrative boundaries are overlaid. Resolution of the original raster map: 100 m.
The resulting forest layer covers approximately 3.4 million ha, and comprises broadleaved, coniferous, and mixed forests distributed across the country (Figure 1). Broadleaved forests dominate the northern and central mainland, while coniferous forests are primarily distributed within mountainous areas throughout mainland Greece, including the Peloponnese, Central Greece, Epirus, Macedonia, and Thrace. Mixed forests occur primarily as transitional stands in northern and central Macedonia.
2.2. General Analytical Framework and Software
A schematic overview of the methodological workflow is provided in Figure 2. All analyses were performed in R [24]. Spatial raster operations were conducted with the terra package [25]. Vector spatial data were handled with sf [26]. Statistical analysis and data manipulation relied on the tidyverse collection of packages [27]. Socioeconomic data were retrieved programmatically from the Eurostat API using the eurostat package [28]. Road network data were obtained from OpenStreetMap via the osmextract package [29]. Landscape metrics were computed using the landscapemetrics package [30]. Principal component analysis was performed with FactoMineR [31]. Figures were produced with ggplot2 [32], and tidyterra [33].
Figure 2.
Methodological flow chart illustrating the sequence of data preparation, MCE index computation, and analytical steps described in Section 2.3, Section 2.4, Section 2.5 and Section 2.6, distinguishing hard exclusion criteria from the eight continuous suitability criteria entering the weighted linear combination.
2.3. Spatial Criteria Preparation
Eight spatial criteria were assembled, each intended to capture a distinct mechanism relevant to wood mobilization suitability. Terrain suitability (slope) reflects the physical operability of harvesting equipment and personnel safety on a given pixel. Forest accessibility (road distance) reflects the practical cost and feasibility of transporting harvested timber to the road network. Forest productivity (dry matter productivity) proxies the rate of biomass accumulation available for periodic harvest. Forest type reflects differences in the proportion of stem biomass that is commercially usable across broad species groups. Population density proxies the local availability of a working-age population from which forestry labor may be drawn. Agricultural employment share proxies the presence of a rural labor market with skills and practices adjacent to forestry work. Years since last fire reflects the ecological recovery status of burned stands and the operational safety constraints on harvesting recently burned areas. Soil stability (erosion risk) reflects the ecological cost, in terms of soil loss, of removing forest cover in a given location. Each criterion is described in detail, including its data source and any limitations specific to its construction, in Section 2.3.1, Section 2.3.2, Section 2.3.3, Section 2.3.4, Section 2.3.5, Section 2.3.6, Section 2.3.7 and Section 2.3.8.
2.3.1. Terrain Suitability
Elevation data were obtained from the Copernicus Digital Elevation Model (DEM) for Europe at 100 m resolution [34].
Slope was derived in degrees using the terra package [25]. The resulting slope raster was resampled to the common 100 m CLC analysis grid using bilinear interpolation to ensure exact spatial alignment (EU-LAEA projection).
2.3.2. Road Accessibility
Road accessibility was quantified as a slope-weighted cost distance to the nearest road. The road network was obtained from OpenStreetMap (Geofabrik, Greece extract) using the osmextract package [29]; filtered to primary, secondary, tertiary, and track-class highways (highway = ‘primary’, ‘secondary’, ‘tertiary’, ‘track’); reprojected to EPSG:3035; and clipped to the national boundary.
A friction surface was derived from the slope raster using a simple slope-dependent cost function, , where is the slope in radians. This formulation approximates the increasing traversal cost with terrain steepness and is conceptually inspired by Tobler’s hiking function [35]. Friction values were capped at the value corresponding to a 35° slope to maintain consistency with the hard exclusion threshold applied in the MCE (Section 2.4).
The cost distance to the nearest road pixel was then computed using the costDist() function of terra [25], with road pixels assigned a cost of zero.
2.3.3. Dry Matter Productivity
Annual dry matter productivity (DMP) was derived from the Copernicus Global Land Service Dry Matter Productivity product of 10-day composites at 300 m spatial resolution [36]. The 10-day composites for 2025 were downloaded from the Copernicus Data Space Ecosystem API, selecting the highest available reprocessing version for each nominal acquisition date (RT6, when available).
Individual composites were cropped to a buffered extent surrounding Greece, reprojected to the European LAEA projection (EPSG:3035), and converted from raw digital values to physical units by replacing the no-data fill value (65,535) with NA and applying the official scale factor of 0.01 (kg DM ha−1 day−1 per raw unit). Annual DMP (kg DM ha−1 yr−1) was obtained as the weighted sum of the 10-day composites using the number of days represented by each composite as temporal weights (summing to 365 days). The resulting annual DMP raster was resampled to the common 100 m CLC analysis grid using bilinear interpolation.
Because the Copernicus GLS DMP product characterizes the productivity of the entire vegetated land surface rather than the tree layer specifically, DMP values in open-canopy or sparse forest stands can include a proportionally larger contribution from understory shrubs and herbaceous ground cover than in closed-canopy stands. This is addressed further as a study limitation (Section 4.5).
2.3.4. Forest Type
Forest type composition was characterized directly from the updated CLC raster described in Section 2.1. Each forest pixel was assigned a discrete suitability score based on the biomass expansion factor (BEF), which relates stem biomass to total above-ground woody biomass [37]. Although BEFs are primarily intended for biomass estimation rather than harvestability assessment, they may provide a species-group-specific proxy for the proportion of commercially usable stem biomass and were therefore used to differentiate forest types within the MCE. This proxy does not capture within-species variation in wood quality, stem form, or market value, which can vary substantially by region and stand condition; it should therefore be read as a coarse structural indicator of relative biomass utility between broad forest types, not a market-value ranking.
Coniferous forests (CLC 312) received a score of 1.00, whereas broadleaved forests (CLC 311) received a score of 0.83, obtained by normalizing the reported BEF values (1.33 and 1.60, respectively) to the coniferous reference (). Mixed forests (CLC 313) were assigned an intermediate score of 0.92, corresponding to the arithmetic mean of the coniferous and broadleaved scores ().
2.3.5. Working-Age Population Density
Working-age population (ages 15–64) by NUTS-3 region was obtained from the Eurostat demographic database (table demo_r_pjanaggr3) for the latest year 2025 [38].
Working-age population density (persons km−2) was calculated by dividing the regional population by the area of each NUTS-3 polygon. The resulting NUTS-3 values were rasterized onto the common 100 m CLC analysis grid, assigning the regional mean density to all pixels within each administrative unit.
This criterion assumes that areas with a larger working-age population have greater access to forestry labor; this is an indirect proxy, since working-age population density reflects total regional demographics rather than forestry-sector employment or skills specifically.
2.3.6. Agricultural Employment Share
Agricultural employment was represented by the share of employment in NACE Rev. 2 sector A (agriculture, forestry, and fishing), obtained from the Eurostat regional accounts database (table nama_10r_3empers) using data for the latest year 2023 [39]. Forestry-specific employment (NACE A02) is not available at the NUTS-3 level in Eurostat; therefore, the NACE sector A at the NUTS-2 level was used as the closest available proxy.
Records were filtered to total employed persons (wstatus = ‘EMP’). For each NUTS-3 administrative unit, the employment share was calculated as the ratio of employment in NACE sector A to total employment, expressed as a percentage. The resulting regional values were rasterized onto the common 100 m CLC analysis, assigning the corresponding regional value to all pixels within each administrative unit.
2.3.7. Fire History
Post-fire exclusion and the fire history criterion were derived from the MODIS Burned Area product MCD64A1, Collection 6.1, at a monthly resolution at 500 m [40,41].
Monthly data for MODIS tiles h19v04, h19v05, h20v04, and h20v05 covering Greece were acquired for the period 2006–2025. For each month, the four tiles were mosaicked, reprojected to the European LAEA projection (EPSG:3035) at 500 m resolution using nearest-neighbor interpolation, and converted to a binary burned area raster (1 = burned, 0 = unburned) based on the Burn Date layer. Monthly binary rasters were subsequently aggregated into annual burned area maps by assigning a value of 1 to pixels burned in at least one month of the corresponding year.
The year of the most recent fire was then determined for each pixel, and the number of years since the last fire was calculated relative to the reference year 2025. Pixels with no recorded fire during the 2006–2025 observation period were assigned the maximum value of 19 years. Finally, the years-since-last-fire raster was resampled to the common 100 m CLC analysis grid using nearest-neighbor interpolation to preserve integer values and masked to the national boundary.
2.3.8. Soil Stability (Post-Fire Erosion Risk)
Post-fire soil erosion risk was derived from the global dataset of cumulative post-fire soil erosion estimates [42], available at 200 m spatial resolution in the ISEA 3H Equal Area projection (EPSG:6933).
Four tiles covering Greece (tiles 14, 15, 39, and 40) were processed, and the 2019 cumulative post-fire erosion layer (band 19) was extracted from each tile. The tiles were mosaicked using the terra package [25], applying the mean to overlapping edge pixels. The resulting raster was reprojected to the European LAEA projection (EPSG:3035) at approximately 200 m resolution using bilinear interpolation and subsequently resampled to the common 100 m CLC analysis grid, again using bilinear interpolation.
Pixels without recorded post-fire erosion were assigned a value of zero, representing the absence of post-fire erosion risk. The resulting erosion layer (Mg ha−1 yr−1) was incorporated into the multi-criteria evaluation as an inverse criterion, whereby lower erosion risk corresponded to higher suitability for wood mobilization.
2.4. Multi-Criteria Evaluation (MCE)
2.4.1. Normalization
Each of the eight criteria was normalized to a common 0–1 suitability scale prior to combination:
- Terrain suitability (inverted slope) was normalized linearly between 0° (score = 1.0) and 35° (score = 0.0), after clamping values to this range.
- Road accessibility (inverted cost distance) was normalized by capping the cost distance at 2000 m (equivalent cost units) and applying the transformation: score = (2000 − distance)/2000. The cost-distance surface was capped at 2000 m because it is consistent with operational efficiency limits reported for low-intensity skidding operations in similar forest conditions. Borz et al. [43] showed that for removal intensities of 7–15 m3 ha−1—comparable to the low harvesting intensities typical of Greek forests—productivity decreases to one-fourth and fuel consumption quadruples at 2000 m relative to a 200 m reference, indicating a practical upper bound beyond which mobilization becomes operationally and environmentally prohibitive.
- Dry mass productivity was normalized using min–max scaling computed over forest pixels only (CLC 311–313), clamped to [0, 1].
- Forest type was scored according to the discrete values described in Section 2.3.4, and non-forest pixels were assigned a score of zero.
- Working-age population density was capped at 150 persons km−2 prior to min–max normalization, to limit the influence of extreme urban densities.
- The agricultural employment share was normalized using min–max scaling across the observed NUTS-3 range.
- Years since last fire was normalized by dividing by the maximum observed value in the fire record (19 years), with recent fire pixels retaining low scores.
- Soil stability (inverted post-fire erosion risk) was normalized by capping erosion at 50 Mg ha−1 yr−1 and applying: score = (50 − erosion)/50.
2.4.2. Exclusion Mask
Prior to the weighted linear combination, an exclusion mask was constructed to remove pixels considered categorically unsuitable for wood mobilization, irrespective of their individual criterion scores.
Four exclusion criteria were applied:
- A binary protected area exclusion mask was constructed by combining two spatial datasets. The first comprised the Natura 2000 network from the end-2021 revision [44], including all sites designated as Special Areas of Conservation (SAC), Special Protection Areas (SPA), or combined SAC/SPA sites (site types C, D, and B, respectively). The second comprised the Common Database on Designated Areas (CDDA) [45], filtered to include sites assigned to strict IUCN protected area categories (Ia, Ib, II, and III) or designation types corresponding to “Strict Nature Reserve”, “National Park”, “Wilderness Area”, “Biosphere Reserve”, “Scientific Reserve”, and “Nature Protection Area”. The two polygon layers were merged, geometrically simplified using a 25 m tolerance, dissolved into a single multipart feature, and rasterized onto the common 100 m CLC analysis grid, assigning a value of 1 to protected pixels.
- Steep terrain was excluded using a threshold of 35°. This threshold was adopted as a conservative operational constraint for the present suitability assessment and was applied consistently as the upper limit of the slope-dependent friction function.
- Forests burned within the preceding seven years (years since last fire < 7) were excluded to account for post-fire ecological recovery and operational constraints. This binary threshold marks the ecological and operational cutoff below which stands are categorically unavailable for mobilization, whereas the continuous years-since-fire criterion (Section 2.3.7) differentiates suitability among already-eligible stands based on their position along the post-fire recovery trajectory. This reflects the standard distinction in GIS-based multi-criteria evaluation between exclusionary constraints (Boolean, remove infeasible areas) and continuous suitability factors (rank the remaining feasible areas) [16]. The influence of this threshold on the final suitability assessment was subsequently evaluated through sensitivity analysis (Section 2.6).
- All terrestrial pixels not classified as broadleaved (CLC 311), coniferous (CLC 312), or mixed forest (CLC 313) were removed from the analysis.
- Pixels satisfying one or more exclusion criteria were assigned NA in the final suitability raster prior to the weighted linear combination.
2.4.3. Weighted Linear Combination (WLC)
The MCE wood mobilization index was computed as a linear combination of the eight normalized criteria:
where denotes the normalized score for criterion , and is the corresponding weight. The equal-weights baseline () treats all eight criteria as equally important, providing a transparent reference against which alternative policy weightings can be compared (Section 2.6.2).
The resulting MCE score is a measure of relative spatial suitability for mobilization—reflecting the biophysical, infrastructural, and socioeconomic conditions favorable to accessing and working a given forest pixel—rather than a direct estimate of harvestable timber volume, economic value, or actual wood supply, none of which are modeled here. Eligible area is correspondingly interpreted throughout as the area meeting a necessary spatial condition for mobilization, not as a quantity of available timber.
2.5. Regional Analysis and Descriptive Statistics
NUTS-3 level summaries were derived via zonal statistics applied to the MCE raster, the normalized raster layers corresponding to the eight MCE criteria, the exclusion mask, and the forest type raster. For each of the 52 NUTS-3 units, the following metrics were computed: (i) mean MCE over eligible forest pixels; (ii) total eligible forest area (ha), calculated as the count of non-NA MCE pixels multiplied by the pixel area (1 ha at 100 m resolution); (iii) coefficient of variation (CV, %) of MCE over eligible pixels; and (iv) mean Euclidean nearest-neighbor distance between eligible forest patches, computed using the lsm_c_enn_mn() function of the landscapemetrics package [30], applied per NUTS-3 unit.
To characterize the contribution of each exclusion type to constrained forest area, eligible forest pixels were contrasted with the total CLC 311–313 forest extent per NUTS-3 unit. Constrained pixels were classified into seven mutually exclusive Venn cells defined by the combination of active exclusion flags (protection “P”, steep terrain “S”, and recent fire “F”), yielding cells P, S, F, P ∩ S, P ∩ F, S ∩ F, and P ∩ S ∩ F. Per-NUTS-3 pixel counts for each cell were obtained via zonal summation.
Inter-regional correlates of eligible forest area were investigated through two complementary approaches. Because eligible area is determined entirely by the hard exclusion criteria (forest extent, protection status, slope, and fire history; Section 2.4.2), this analysis tests which of the remaining, continuously scored criteria differentiate regions with large versus small eligible endowments, not which criteria determine eligible area itself. First, Wilcoxon rank-sum tests (non-parametric) were used to compare zonal-mean criterion scores between the 10 NUTS-3 units with the greatest eligible forest area and the 10 with the least. p-values were adjusted for multiple comparisons using the Benjamini–Hochberg (BH) false discovery rate procedure [46]. Effect sizes were quantified as the rank-biserial correlation coefficient r, with thresholds of |r| ≥ 0.1 (small), |r| ≥ 0.3 (moderate), and |r| ≥ 0.5 (large), following [47]. Statistical tests were performed using the rstatix package [48].
Second, a principal component analysis (PCA) was conducted on the matrix of NUTS-3 zonal-mean criterion scores (52 rows × 8 columns), after standardization to zero mean and unit variance. PCA was performed using the PCA() function of the FactoMineR package [31]. The resulting biplot was used to visualize the structure of inter-regional variation, with points sized by eligible forest area and colored by mean MCE score.
To assess whether the resulting axis structure was sensitive to the coarse spatial resolution of the agricultural employment proxy (Section 2.3.6), the PCA was additionally repeated on the remaining seven criteria, excluding agricultural employment share; the two solutions were compared using Spearman rank correlation of PC1 scores across NUTS-3 units.
2.6. Sensitivity Analyses
2.6.1. Fire Exclusion Window
To quantify the influence of the fire history exclusion criterion on estimated wood mobilization potential, four counterfactual scenarios were evaluated in which the exclusion window was progressively reduced from seven years to six, five, four, and three years since the last recorded fire.
For each scenario, only forest pixels excluded exclusively because of recent fire—i.e., belonging to the F cell of the exclusion-mask Venn diagram and not simultaneously excluded by protected area (P) or steep slope (S) constraints—were considered eligible for recovery. Pixels whose time since last fire exceeded the alternative threshold, but remained below the original seven-year threshold, were reintroduced into the eligible forest area, providing a conservative estimate of the additional mobilizable area attributable solely to relaxing the fire criterion.
Counterfactual MCE scores for the recovered pixels were calculated using the same equal-weight WLC of the normalized criterion layers as in the baseline analysis. Protected area and slope exclusions remained unchanged across all scenarios.
For each counterfactual scenario, the total recovered forest area (ha), the mean counterfactual MCE of the recovered pixels, and their spatial distribution were quantified and compared with the baseline solution.
2.6.2. Alternative Policy Weight Scenarios
The robustness of the equal-weights baseline ranking to different policy priorities was assessed by recomputing the MCE index under three alternative weighting schemes (Table 1):
Table 1.
Criterion weights assigned under the four MCE scenarios used in the sensitivity analysis. The baseline scenario assigns equal weights to all eight criteria (0.125 each). The three alternative scenarios represent contrasting policy priorities—economic development, climate resilience, and ecological footprint—while maintaining the same exclusion mask and ensuring that criterion weights sum to one. Boldface indicates weights that are stronger than the 0.125 of the baseline.
- Economic development, which assigned greater weight to road accessibility, dry matter productivity, and agricultural employment share;
- Climate resilience, which emphasized years since last fire and soil stability;
- Ecological footprint, which increased the influence of terrain (slope) and forest type.
- In all scenarios, criterion weights were constrained to sum to one, while the exclusion mask (protected areas, steep terrain, and recent fire) and all normalized criterion layers, remained unchanged.
For each weighting scheme, a new pixel-level MCE raster was generated using the weighted linear combination, and NUTS-3 mean MCE values were recalculated from eligible forest pixels.
The agreement between each alternative weighting scheme and the equal-weights baseline was quantified using Spearman’s rank correlation coefficient (ρ), calculated from the rankings of the 52 NUTS-3 units based on their mean MCE values. The statistical significance of the Spearman’s correlation coefficients was also evaluated.
Consistency among the highest-priority regions was further evaluated using the Rank Agreement Index (RAI), defined as the Jaccard similarity coefficient between the sets of the ten highest-ranked NUTS-3 units under the alternative () and baseline () scenarios:
where and denote the respective top-10 regional sets.
To identify robust regional priorities, the membership of the top-10 NUTS-3 units under each weighting scheme was compared with the baseline and among alternative scenarios, allowing regions consistently or selectively prioritized across policy framings to be identified.
2.6.3. Slope Exclusion Threshold and Normalization Caps
Sensitivity to the slope exclusion threshold and to three normalization cap parameters (road distance cap, population density cap, erosion cap) was evaluated using the same one-at-a-time design as in Section 2.6.1, holding all other thresholds and weights at baseline. The slope threshold was varied at 30°, 35° (baseline), and 40°; the road distance cap at 1500 m, 2000 m (baseline), and 2500 m; the population density cap at 100, 150 (baseline), and 200 persons km−2; and the erosion cap at 40, 50 (baseline), and 60 Mg ha−1 yr−1. Alternative values were set at approximately ±15–20% around baseline in the absence of literature-based alternative thresholds for the Greek context.
2.7. Concentration Curve and Spatial Targeting Analysis
To quantify the degree to which the mobilization potential is spatially concentrated among the highest-scoring eligible pixels, a concentration curve was constructed. All eligible MCE pixel values were extracted and sorted in descending order. The cumulative sum of the MCE scores (representing the cumulative share of national mobilization potential) was then plotted against the cumulative share of eligible forest area, analogous to a Lorenz curve.
The Gini coefficient was computed by trapezoidal integration of the area between the concentration curve and the 45° line of perfect equality (Gini = 2 × area under the curve − 1). The threshold area shares required to capture 50%, 80%, and 90% of the national mobilization potential were identified as policy read-off points. Pixels with MCE values greater than or equal to the score corresponding to the 80% potential threshold were designated the “top pixel pool”. For each NUTS-3 unit, the total area of top-pool pixels and the proportion of the region’s own eligible forest belonging to the pool were calculated.
To assess whether the degree of spatial concentration is sensitive to the weighting scheme, the concentration curve analysis was repeated under the three alternative weight scenarios defined in Section 2.6.2. In each case, eligible pixel values were re-scored using the scenario-specific weighted linear combination, sorted in descending order, and used to compute cumulative potential and area shares. Gini coefficients and the 50%, 80%, and 90% potential threshold read-offs were calculated following the same procedure as for the baseline. The eligible pixel pool remained unchanged across all four scenarios; only the criterion weights differed.
The regional composition of the top pixel pool was further compared across weighting scenarios by ranking NUTS-3 units according to their contribution to each scenario’s own top pixel pool (defined by that scenario’s 80% potential threshold). Membership of the ten highest-ranked regions was then compared across scenarios to identify consistently prioritized regions and scenario-specific differences.
To assess whether the reported Gini coefficients were sensitive to the inclusion of criteria with near-saturated national distributions (years since fire, soil stability, road accessibility; Section 3.1), the concentration-curve analysis was repeated for all four scenarios after excluding these three criteria and renormalizing the remaining weights to sum to 1.
2.8. Generative AI Use
During the preparation of this manuscript, the authors used Claude Sonnet 5 (Anthropic) as a writing and coding assistant. The tool was used to (i) draft and edit portions of the manuscript text, and (ii) assist in writing and debugging the R analysis code used for data preparation, the multi-criteria evaluation framework, and the statistical analyses described in this section. All GenAI-assisted text and code were reviewed, verified, and edited by the authors, who take full responsibility for the accuracy, integrity, and originality of the content, analyses, and results reported in this manuscript.
3. Results
3.1. Forest Cover and Multi-Criteria Evaluation Framework
Application of the exclusion mask reduced Greece’s total forest area (CLC classes 311–313) to approximately 2.43 million ha of eligible forest available for wood mobilization assessment. This figure does not imply that the full extent is operationally accessible or economically viable for timber harvesting. Criteria such as road network density, stand composition, and ownership fragmentation may further limit the area where wood mobilization is practically feasible.
The eight normalized evaluation criteria exhibited distinct spatial patterns across the country (Figure 3). Terrain suitability and road accessibility were generally highest in the northern lowlands and in other gently sloping, well-connected landscapes (Figure 3a,b). In contrast, dry matter productivity reached its highest values in the more productive forests of Epirus and in the northern mainland (Figure 3c). Working-age population density and agricultural employment share displayed strong regional gradients associated with major population centers and agricultural regions, respectively (Figure 3e,f). In contrast, years since last fire and soil stability showed relatively limited spatial variability, with values close to their upper normalization limits across much of the eligible forest, indicating that these criteria contributed comparatively little discrimination at the national scale (Figure 3g,h). This pattern is examined quantitatively in the inter-regional analyses presented in Section 3.3.
Figure 3.
Eight MCE criteria (0 = lowest suitability, 1 = highest suitability), shown over the full national extent prior to forest masking: (a) terrain suitability (inverted slope); (b) road accessibility (inverted cost-distance to roads); (c) dry mass productivity (DMP); (d) forest type score (coniferous = 1.0; mixed = 0.92; broadleaved = 0.83); (e) working-age population density; (f) agricultural employment share; (g) years since last fire; and (h) soil stability (inverted post-fire erosion risk). Layers are shown unmasked to preserve the readability of spatially continuous criteria; masking to eligible forest pixels (CLC 311–313) is applied during MCE computation. Resolution of original raster map: 100 m.
3.2. Spatial Distribution and Regional Ranking of Wood Mobilization Potential
The combined MCE index ranges from 0.39 to 0.84 across eligible forest pixels (Figure 4). High-scoring pixels (MCE > 0.7) are concentrated in the north and eastern mainland, and along the west side of the Pindus range. Conversely, low scores occur in the northwestern mainland and the rest of the Pindus range.
Figure 4.
Pixel-level wood extraction potential index (MCE, equal weights) across eligible forest pixels in Greece. Values range from 0 (low suitability) to 1 (high suitability). Non-forest land is shown in white; sea in cyan. NUTS-3 boundaries are overlaid. Eligible pixels exclude areas within protected zones (Natura 2000 and national parks), terrain with slope ≥ 35°, and forests affected by fire within the preceding 7 years.
At the NUTS-3 level, four choropleth metrics capture complementary dimensions of regional mobilization capacity (Figure 5). Mean MCE over eligible pixels is highest in central Macedonia—Thessaloniki (0.76), Pella (0.75), and Imathia (0.74)—and across Attica—Kentrikos Tomeas Athinon (0.75), and Anatoliki Attiki (0.75)—as well as in the Ionian Islands, where Zakynthos (0.75) and Kerkyra (0.75) combine small but high-scoring eligible areas (Figure 5a).
Figure 5.
Four-panel NUTS-3 choropleth maps: (a) mean MCE score over eligible forest pixels; (b) total eligible forest area (ha); (c) coefficient of variation of MCE (%; lower = more homogeneous quality); (d) mean inter-patch nearest-neighbor distance (m, log scale; lower = more spatially clustered patches). NUTS-3 boundaries in white, and national border in dark gray.
The largest eligible forest endowments are concentrated in the northwestern and central mainland: Ioannina (186,754 ha), Drama (176,158 ha), Aitoloakarnania (169,507 ha), and Grevena–Kozani (154,608 ha) each exceed 150,000 ha of eligible area, while the Attica districts and most Aegean island units hold negligible amounts (Figure 5b).
Internal quality heterogeneity, expressed as the CV of MCE, is greatest in Dytiki Attiki (11%), Ithaki–Kefallinia (7.3%), Drama (7.1%), and several northern Aegean island units, reflecting the coexistence of fire-disturbed and intact stands within the same administrative boundary; Evros, Chalkidiki, Thessaloniki, and Attica are the most internally uniform, with CV values below 3.5% (Figure 5c).
The spatial cohesion of eligible patches is strongest in Kentrikos Tomeas Athinon (269 m) and Xanthi (387 m) and across Epirus and the central western mainland—Evrytania (273 m), Ioannina (404 m), and Arta–Preveza (423 m). Cohesion deteriorates markedly in Crete (Irakleio, 1913 m) and the Cyclades (2654 m) and on the mainland in Florina (1349 m) and the neighboring Attica units of Dytikos and Voreios Tomeas Athinon (1531 m and 1767 m, respectively) (Figure 5d). The divergence within Attica itself—where Kentrikos Tomeas Athinon is among the most cohesive units nationally, while adjacent Dytikos and Voreios Tomeas Athinon rank among the least—suggests that patch cohesion, unlike eligible area or mean quality, does not track a simple urban–rural gradient.
The ten regions with the largest eligible forest areas are dominated by mainland prefectures (Table 2). Xanthi records the highest eligible fraction of total forest (94.6%), followed by Grevena–Kozani (91.6%), Evrytania (88.7%), and Aitoloakarnania (88.6%). Ioannina, though the single region with the greatest absolute forest area (261,692 ha), yields a lower eligible fraction (71.4%), primarily because 26.3% of its forest falls within protected areas (Table 2).
Table 2.
Constrained forest decomposition for the 10 NUTS-3 regions with the greatest eligible forest area. Columns show total forest area, the percentage eligible after all exclusions, and the percentage of total forest attributable to each mutually exclusive exclusion cell: P = protected only; S = steep terrain only; F = recent fire only; PS, PF, SF, PSF = pairwise and triple combinations. Exclusion thresholds: protected areas (Natura 2000/national parks); slope ≥ 35°; fire within the preceding 7 years.
The exclusion analysis reveals that protection status is overwhelmingly the dominant constraint on eligible forest area across the top-10 regions—Ioannina and Karditsa–Trikala being the clearest examples, with protection alone accounting for 26.3% and 34.2% of their respective total forest areas—while the steep terrain and recent fire exclusions contribute negligibly at the NUTS-3 scale in most regions (Table 2). Evvoia is a notable exception: 29.3% of its total forest is excluded on fire grounds alone, a legacy of the catastrophic 2021 wildfires, making it the only top-10 region where recent fire history—rather than protection status—is the dominant single constraint. This fire-driven exclusion reduces Evvoia’s eligible fraction to 65.6%, despite its large absolute forest endowment.
3.3. Correlates of Inter-Regional Variation in Eligible Area
To identify which of the eight criteria are associated with regions of large versus small eligible forest endowments—noting that none of them determine eligibility itself, which is fixed by the hard exclusion criteria (Section 2.4.2)—the zonal means of all eight normalized criteria were computed for each of the 52 NUTS-3 units and compared between the top-10 and bottom-10 regions ranked by eligible area. Wilcoxon rank-sum tests with Benjamini–Hochberg (BH) correction indicated that four criteria show statistically significant large effect differences (Table 3), though these associations should be read as correlational rather than explanatory of eligible area formation.
Table 3.
Wilcoxon rank-sum test comparing zonal-mean criterion scores between the top-10 and bottom-10 NUTS-3 regions by eligible forest area. Effect size r is the rank-biserial correlation (positive = top-10 scores higher; negative = bottom-10 scores higher). Magnitude thresholds (magn.): (S) small |r| ≥ 0.1; (M) moderate |r| ≥ 0.3; (L) large |r| ≥ 0.5. Significance (sign.) is indicated when the BH-adjusted p < 0.05 (“*”; “ns” = non-significant).
Population density is substantially lower in the top-10 regions (mean = 0.11) than in the bottom-10 regions (mean = 0.51; r = −0.73, p = 0.013): regions with large eligible endowments tend to be more rural, though population density itself has no bearing on which pixels are eligible. Agricultural employment share is markedly higher in the top-10 group (0.48) than the bottom-10 group (0.24; r = 0.56, p = 0.027), consistent with these regions’ more agrarian economies (note that this criterion is a NUTS-2-level proxy; values are therefore identical across NUTS-3 units sharing the same NUTS-2 parent). Road accessibility is, somewhat paradoxically, lower in the top-10 regions (0.85) than in the bottom-10 regions (0.92; r = −0.58), i.e., the largest eligible endowments are not concentrated in the most road-accessible regions, though accessibility still shapes each pixel’s MCE score within the eligible pool. Forest type score is likewise lower in the top-10 regions (0.90) than in the bottom-10 regions (0.98), implying that the largest-area regions tend to contain a higher mix of broadleaved and mixed stands relative to conifers. Dry mass productivity and terrain suitability show moderate, non-significant effects, and soil stability and fire history exhibit negligible differences (|r| < 0.13), consistent with the near-uniform national scores observed in Figure 3g–h.
A principal component analysis (PCA) of the eight zonal-mean criteria across all 52 NUTS-3 units corroborates these findings and reveals additional structure (Figure 6). The first two principal components jointly explain 64.5% of the total variance. PC1 separates regions along a rural forestry potential gradient: agricultural employment share and dry mass productivity load positively, while road accessibility, population density, and terrain suitability load negatively, placing the productive rural prefectures in the positive quadrant. PC2 reflects a disturbance history and soil stability axis, with years since last fire and soil stability both loading positively—consistent with the observed correlation between these two criteria (Pearson r = 0.64 at the pixel level; Figure S1). Forest type loads negatively on both axes, reflecting its geographical decoupling from high-productivity stands (pixel-level r = −0.34 with DMP), a consequence of coniferous forests occupying higher-altitude, lower-productivity terrain in Greece. Notably, regions with the highest mean MCE scores tend to cluster on the negative PC1 side—among the more accessible, less rural units—while regions with the greatest eligible area dominate the positive end. This spatial decoupling of quality and quantity implies that strategies maximizing total mobilization volume and those maximizing extraction efficiency per hectare would target largely different sets of regions, a tension with direct policy implications.
Figure 6.
PCA biplot of the eight normalized MCE criteria computed as NUTS-3 zonal means (n = 52 regions). Points represent individual NUTS-3 regions, sized by eligible forest area and colored by mean MCE score (viridis scale). Loading arrows show criterion contributions; labels use shortened criterion names. The ten regions with the greatest eligible forest area are labeled. Criteria were standardized (z-scores) before the PCA.
To evaluate whether this axis structure depends on the NUTS-2-resolution agricultural employment proxy, the PCA was repeated excluding this criterion (Figure S2). PC1 scores from the two solutions were highly correlated after accounting for the arbitrary sign of the axis (Spearman ρ = 0.94, Pearson r = 0.98, n = 52, p < 0.001), and the relative loading magnitudes of the remaining seven criteria were essentially unchanged (e.g., population density: 0.80 vs. 0.77; dry matter productivity: 0.77 vs. 0.78 on the reduced-criteria PC1). The socioeconomic–biophysical structure of PC1 therefore does not depend on the inclusion of agricultural employment share specifically: population density and forest type anchor the axis with or without it.
Criterion-level profiles for representative region tiers further confirm that the dominant gradients are socioeconomic rather than biophysical: population density increases and agricultural employment share decreases steadily from the top to the bottom tier, while biophysical criteria—years since last fire, soil stability, terrain suitability, and road accessibility—vary only marginally across tiers (Figure S3).
3.4. Sensitivity Analyses for Alternative Exclusions and Policies
3.4.1. Opportunity Cost of the Fire Exclusion Window
The baseline MCE excludes forest pixels burned within the preceding seven years, a threshold reflecting both ecological recovery norms and operational safety conventions. To quantify the mobilization potential foregone under this constraint, we modeled four counterfactual scenarios in which the exclusion window is progressively reduced from seven to six, five, four, and three years. In each case, only pixels excluded solely on fire grounds—with no concurrent protection or slope lift of constraint—were counted as recoverable. Hence, the estimates represent a conservative lower bound on the policy-relevant area.
The results reveal a markedly nonlinear relationship between the exclusion window and recoverable potential (Figure 7). Contracting the window by one year (seven → six) releases approximately 16,864 ha with a mean counterfactual MCE of 0.54—a modest gain concentrated in Larisa, Evvoia, and Voiotia (Figure 7a; Table S1). A further reduction to five years nearly doubles the recovered area (28,531 ha) and yields a marginally higher mean quality score (0.573), suggesting that stands in the six-to-five-year recovery bracket are, on average, more productive than those just exiting the exclusion window (Figure 7b). The transition from a five- to a four-year threshold, however, produces a qualitatively different outcome: recoverable area increases more than fivefold to approximately 148,591 ha (Figure 7c; Table S1). The mean counterfactual MCE under this scenario (0.594) remains above the national eligible-forest average, indicating that the additional pixels are not marginal stands but productive forest distributed across Evvoia, Dytiki Attiki, and Ileia—the last two placing this potential squarely within the Attica fire perimeter of recent years. Reducing the window to three years yields only a further 20,000 ha. This pattern—a disproportionate area release specifically between the five- and four-year thresholds—is consistent with the concentration of Greece’s most severe recent wildfires in 2021 (four years prior to the study’s 2025 baseline), rather than necessarily reflecting a general ecological recovery threshold at four years post-fire (Figure 7d).
Figure 7.
Spatial distribution of forest pixels becoming eligible for biomass mobilization under progressive relaxation of the post-fire exclusion window. Black pixels indicate forest areas excluded solely on fire grounds that would be recovered under each scenario; green pixels indicate the current eligible forest under the 7-year baseline. NUTS-3 administrative boundaries are shown for reference. Panels correspond to exclusion windows of (a) 6, (b) 5, (c) 4, and (d) 3 years since last fire. Slope (≥35°) and protection exclusions remain fixed across all scenarios.
3.4.2. Prioritization Under Alternative Policy Objectives
When the criterion weights were adjusted to favor economic development, climate resilience, or ecological footprint objectives, the NUTS-3 rankings remained strongly correlated with the equal-weights baseline (Spearman’s ρ = 0.9, 0.84, and 0.78, respectively; all p < 0.001), confirming that the relative ordering of regions is largely preserved across a wide range of plausible policy framings and validating the equal-weights baseline as a robust summary of Greece’s wood mobilization potential. Nevertheless, the systematic decline in correlation toward the ecological footprint scenario reveals that the baseline is more aligned with an economic-logistics logic than with a conservation logic. At the upper tail—where policy prioritization is most consequential—agreement is weaker: top-10 overlaps range from 5 to 7 regions out of 10, with Rank Agreement Index (Jaccard) values of 0.538 for both economic development and climate resilience and 0.333 for ecological footprint (Table S2).
Despite the high overall rank correlations among scenarios, agreement within the highest-priority regions was more selective and revealed three distinct membership patterns (Figure 8). Two regions (Thessaloniki and Ileia) maintained top-10 status across all scenarios, making them the only universally robust priorities. Five regions (Pella, Zakynthos, Kerkyra, Rodopi, and Imathia) ranked among the top 10 under the baseline, economic development, and climate resilience scenarios but fell out under the ecological footprint scenario. The remaining three regions (Kentrikos Tomeas Athinon, Anatoliki Attiki, and Voreios Tomeas Athinon) were top-ranked only under the baseline and ecological footprint scenarios, dropping out under both the economic and climate framings. No region paired the ecological footprint scenario with either economic development or climate resilience, indicating that conservation-oriented criteria were the principal source of disagreement in regional prioritization (Figure 8).
Figure 8.
Rank trajectories of the ten baseline top-10 NUTS-3 regions across four weight scenarios (baseline of equal weights, economic development, climate resilience, and ecological footprint). The y-axis shows regional rank by mean MCE (1 = highest); lines connecting ranks trace each region’s trajectory across scenarios. Gray lines represent all 52 NUTS-3 regions for context. Colored lines highlight the ten baseline top-10 regions, grouped by membership pattern across the three alternative scenarios: blue = top-10 in all scenarios (universal); orange = top-10 under baseline, economic development, and climate resilience but not ecological footprint; red = top-10 under baseline and ecological footprint only. Region names are labeled at the right edge.
3.4.3. Sensitivity to Slope, Road, and Erosion Thresholds
Beyond the fire exclusion window, four additional thresholds were tested for sensitivity: the slope exclusion (35°); and three normalization caps (Table S3), namely, road distance (2000 m), population density (150 persons km−2), and erosion risk (50 Mg ha−1 yr−1). Each was varied independently by roughly ±15–20% around its baseline value, holding all other thresholds and weights fixed.
The three normalization caps had a minimal effect on the regional rankings: Spearman rank correlations between NUTS-3 mean MCE rankings under each alternative cap and the baseline ranking remained above 0.97 in every case (n = 52 regions; Table S3). The erosion cap had essentially no effect (ρ ≥ 0.9998; national mean MCE shifted by less than 0.0003 across the tested range). The road distance cap produced the largest shift among the three normalization caps (ρ = 0.997–0.999; national mean MCE ranged from 0.688 to 0.696), and the population density cap fell in between (ρ = 0.970–0.982), with the direction of the mean MCE shift consistent with the compression of the normalization range at lower cap values.
The slope exclusion threshold, by contrast, produced a real and asymmetric change in eligible area. Tightening the threshold from 35° to 30° removed 185,608 ha of previously eligible forest (–51,425 mobilization-weighted hectares, isolating pixels excluded solely by slope), a reduction of approximately 7.6% of the total eligible pool. Loosening the threshold to 40° recovered only 50,799 ha (+13,079 mobilization-weighted hectares, ≈2.1% of the eligible pool). This asymmetry reflects the underlying distribution of slope values across Greek forest land rather than an ecological threshold effect at 35° specifically.
3.5. Spatial Targeting Versus Equity Trade-Offs
When eligible forest pixels were ranked by MCE score, the mobilization potential was only weakly concentrated among the highest-scoring eligible areas (Figure 9). Under the equal-weights baseline, the concentration curve lies only slightly above the diagonal (Gini = 0.037; Figure 9; Table S4). Approximately 47.5% of eligible forest area captures 50% of the national mobilization potential, whereas 78.0% is required to capture 80% (corresponding to all pixels with MCE ≥ 0.661; approximately 1.9 million ha), and 88.6% to capture 90%. These thresholds indicate that progressively larger proportions of the eligible forest must be mobilized to achieve increasingly ambitious national targets.
Figure 9.
Concentration curves of wood mobilization potential across eligible forest pixels in Greece, under the equal-weights baseline and the three alternative weight scenarios of Section 3.4.2 (economic development, climate resilience, ecological footprint). Pixels are ranked from highest to lowest score under each scenario’s weighting; curves plot the cumulative share of national mobilization potential (y-axis) against the cumulative share of eligible forest area (x-axis). The dashed diagonal represents perfect proportionality (uniform distribution of quality). Dotted guide lines mark the area share required to capture 80% of potential under each scenario. The eligible pixel pool is identical across all four scenarios (2,434,469 ha; 100 m resolution); only within-pool weighting differs.
Repeating the analysis under the three alternative weighting scenarios of Section 3.4.2 showed that the choice of equal weights does not drive this pattern: the Gini coefficients ranged from 0.021 (climate resilience) to 0.048 (economic development), while the area required to capture 80% of the national potential varied by only 1.5 percentage points across all four scenarios (77.4–78.8%; Figure 9; Table S4). This consistency indicates that, regardless of the policy logic used to value the eligible forest, there is no compact, high-value core that could be prioritized for disproportionate returns; spatial targeting offers only modest efficiency gains over random area selection across all policy framings tested. This finding is consistent with the near-ceiling national scores for soil stability and years since last fire (Section 3.1), as well as with the PCA results showing that the dominant axes of inter-regional variation are socioeconomic rather than biophysical.
Because three criteria (years since last fire, soil stability, and road accessibility) have near-ceiling national distributions (Section 3.1), we tested whether their inclusion mechanically compressed the concentration curves and deflated the Gini coefficients. Excluding these criteria and renormalizing the remaining weights increased the Gini coefficients by a broadly consistent margin across all four scenarios (baseline: 0.037→0.063; economic development: 0.048→0.077; climate resilience: 0.021→0.054; ecological footprint: 0.042→0.073), while the area required to capture 80% of the potential shifted by less than two percentage points in every case (Table S5). The relative ordering of scenarios was unchanged, and the Gini coefficients remained below 0.08 throughout, well within the “modest concentration” range reported above. We therefore retain the equal-weights baseline result as the primary estimate but note that the climate resilience scenario’s distinctiveness as the lowest-Gini scenario is the most sensitive of the four to this choice of criteria (Table S5).
The regional composition of the top pixel pool is equally robust across scenarios. Nine of the ten baseline top-10 regions by pool share retain top-10 status under all three alternative weight scenarios, a higher degree of agreement than that observed for the mean MCE rankings in Section 3.4.2 (Figure S4). The sole exception is Xanthi, which ranks tenth under the baseline but falls out of the top-10 under all alternative scenarios, reflecting its comparatively small eligible area and the sensitivity of its pool share to the specific weighting of productivity and socioeconomic criteria.
Given this stability, the following regional breakdown focuses on the equal-weight baseline, which is representative of the regional composition across all four weighting scenarios. Large northwestern and central mainland prefectures dominate the pool: Aitoloakarnania, Grevena–Kozani, and Karditsa–Trikala together account for over 20% of the national pool area (Table S6), consistent with their dominant position in the eligible area rankings in Section 3.2. More diagnostically, regions such as Thessaloniki, Chalkidiki, and Rodopi have virtually all their eligible forest at or above the MCE cutoff, meaning that nearly any intervention there targets high-quality stands. Conversely, the largest-endowment regions—Ioannina, Evrytania, and Drama—have only around half their eligible forest in the pool, implying that spatial selectivity within the region is necessary to capture the higher-scoring fraction. The efficiency–equity tension identified in the PCA therefore operates primarily at the intra-regional rather than the inter-regional scale: the regions with the greatest contribution to national volume targets are also those where eligible forest quality is most internally heterogeneous.
4. Discussion
This study developed a spatially explicit, NUTS-3-level multi-criteria framework to quantify Greece’s wood mobilization potential, addressing the disconnection between national aggregate statistics—which suggest ample untapped capacity [5,6]—and the site-specific conditions that ultimately determine whether individual forest stands can be sustainably and economically harvested. Four findings underpin this narrative. First, once legal protection, steep terrain, and recent fire history are accounted for, only about 2.43 million ha (71%) of Greece’s 3.4 million ha of forest remain eligible for mobilization, and legal protection—not topography or fire—is overwhelmingly the dominant constraint. Second, the regions holding the largest eligible areas are not necessarily those with the highest per-hectare suitability, and the criteria separating high- from low-endowment regions are predominantly socioeconomic rather than biophysical. Third, the results are notably robust: alternative weighting schemes reflecting distinct policy priorities preserve the broad regional ranking, while the fire exclusion window matters far more than the choice of weights, with a disproportionate area release between five and four years that reflects Greece’s 2021 fire history rather than a confirmed ecological threshold. Fourth, and arguably most consequential for policy, the mobilization potential across Greece’s eligible forest is spatially diffuse rather than concentrated: no compact high-value core exists that could be prioritized for disproportionate returns, so that national-scale mobilization targets will require geographically distributed rather than spatially targeted interventions. Together, these findings reframe Greece’s wood mobilization gap less as a question of where the best forest is located, and more as a question of how a diffuse, socioeconomically structured resource can be organized into a coherent, geographically distributed supply chain. The four themes developed in the sections that follow correspond to the four questions posed in the Introduction, situating our findings within the wider European literature on forest availability and mobilization.
4.1. Spatial Distribution and Implications of Forest Eligibility
The finding that almost 30% of Greece’s forest estate is categorically excluded from mobilization, primarily because of protected area status rather than terrain or recent fire, has clear ecological implications but more complex socioeconomic and policy implications.
Ecologically, the dominance of the protection constraint is consistent with the country’s extensive Natura 2000 network and reflects a deliberate policy choice to prioritize biodiversity conservation over timber supply in a substantial share of forest land [11]. This is not unique to Greece: harmonized European assessments of forests available for wood supply (FAWS) likewise identify environmental restrictions—particularly protected area status—as one of the most consistently applied exclusion criteria across countries, although the thresholds used to determine when such restrictions significantly limit wood supply differ among national definitions and remain difficult to harmonize internationally [49,50]. Our NUTS-3-level decomposition adds a spatial dimension that national FAWS statistics cannot provide: it shows that the same national protection share can arise from very different regional configurations, from regions such as Xanthi and Grevena–Kozani where protection removes only a small fraction of a large forest base, to Karditsa–Trikala and Ioannina where protection alone removes more than a quarter of the total forest area. The Evvoia case is the clearest illustration of why an exclusion analysis must be spatially explicit rather than aggregated nationally: nowhere else does the compound interaction of protection, slope, and recent fire remove so much of a region’s forest, and this is a direct legacy of the 2021 wildfires burning through Natura 2000-designated, topographically constrained terrain. This kind of compound, place-specific vulnerability is invisible in national-level reporting but is precisely the sort of information that regional forest services and disaster recovery planners need.
From a socioeconomic and policy perspective, the eligible area maps reframe the question of “how much wood is available” to one of “available where, and under what management regime.” Because protection is a legal and administrative rather than a biophysical constraint, it is, in principle, more amenable to changes in management policy than terrain or fire history. Natura 2000 is explicitly a use-compatible designation in which site-specific management plans may permit sustainable forestry activities consistent with conservation objectives; our binary treatment of the entire designated area as excluded is therefore conservative, and the effective eligible area in regions with a high share of Natura 2000 forest—Ioannina and Karditsa–Trikala prominent among them—is likely larger than reported here. This mirrors a broader tension in European forest policy between the EU Forest Strategy’s promotion of the bioeconomy, and the concurrent expansion of strict protection under the EU Biodiversity Strategy [1], a tension that is negotiated locally through management-plan design rather than resolved at the level of national targets.
Compared with other GIS-based wood supply assessments, our analysis occupies an intermediate spatial scale. It is coarser than the parcel-level feasibility mapping developed for Galicia [51], yet considerably finer than continental assessments of forest biomass availability [52]. This intermediate scale appears to be particularly well suited to informing regional forest policy and targeting EU rural development and bioeconomy instruments in a country as environmentally heterogeneous as Greece.
4.2. Socioeconomic and Biophysical Conditions of Forest Eligibility
Our framework’s use of an exclusion mask likely explains why population density, agricultural employment share, road accessibility, and forest type separate high- and low-endowment regions more sharply than dry matter productivity, terrain, soil stability, or fire history (Table 3). Except for forest type, these are primarily socioeconomic or infrastructural variables. Because the most biophysically constrained forests—steep, protected, or recently burned—were already excluded from the eligible pool, the remaining biophysical variables are compressed toward the higher end of the suitability range, leaving relatively little variation to distinguish among regions. What is left to differentiate NUTS-3 units is therefore dominated by the socioeconomic and infrastructural layers, a pattern reinforced by the PCA (Figure 6): the dominant axis of inter-regional variation (PC1) is more of a rural-forestry gradient defined by agricultural employment and DMP on one side and population density, accessibility, and terrain on the other, rather than a fire- or erosion-related axis, a structure that persists when agricultural employment share is excluded from the analysis entirely, indicating that this socioeconomic–biophysical separation is not an artifact of the coarsest single proxy in the criterion set. This suggests that, once fundamental environmental exclusions are imposed, regional differences in forest eligibility are shaped less by ecological limitations than by the socioeconomic conditions that determine the feasibility of mobilizing the remaining resource.
Ecologically, this points to a methodological lesson rather than a substantive absence of biophysical constraint: biophysical homogeneity among eligible forest does not imply biophysical homogeneity across the total forest estate. It is instead the signature of an exclusion step that has already performed most of the biophysical sorting. Socioeconomically, the finding that population density is markedly lower and agricultural employment share markedly higher in the highest-endowment regions is consistent with the broader Mediterranean pattern of rural depopulation and land abandonment, which reduces competition for land while simultaneously eroding the local workforce available for forest management [8,9]. This mirrors the structural constraint identified by [4,5]: a shortage of skilled, cost-efficient forestry labor even where forest resources are abundant. Infrastructurally, the fact that road accessibility is, if anything, slightly higher in the bottom-10 regions is a useful corrective to the intuitive assumption that proximity to infrastructure is the binding constraint on mobilization: our results suggest that accessibility is necessary but not sufficient, consistent with the multi-factor view of harvesting-intensity drivers found across Europe more broadly [7].
At the policy level, these results have a direct practical payoff. Because the socioeconomic variables that account for much of the remaining inter-regional variation are routinely available through Eurostat, they could serve as a cost-effective first-stage screening tool once the eligible forest resource has been delineated. More detailed biophysical and remote-sensing datasets would then be reserved for validating and refining priorities within the most promising regions. This also argues for explicitly embedding forest mobilization policy within rural development and agricultural employment policy instruments—including the EU Common Agricultural Policy and rural development funding—rather than treating it as a sector-specific intervention running parallel to the wider rural economy [15,16,17].
4.3. Sensitivity to Exclusion Thresholds and Policy Weighting
The sensitivity analyses evaluated two sources of structural uncertainty—fire exclusion window and weighting scheme—which behaved in qualitatively different ways. The fire exclusion window showed a markedly nonlinear relationship with recoverable area: incremental relaxation from seven to six and then five years made comparatively little additional forest eligible, whereas reducing the window from five to four years added more than 149,000 ha—a fivefold increase. Ecologically, the most plausible explanation is that Mediterranean post-fire recovery is itself nonlinear. The first years after fire are characterized by elevated erosion risk and incomplete canopy recovery [14,42]. In contrast, many burned areas are likely to transition toward a more stable ecological condition after this initial recovery period, increasing the proportion of stands that may become potentially suitable for wood mobilization. In Greece, this four-year mark coincides with the aftermath of the exceptionally severe 2021 fire season, explaining why Evvoia, Dytiki Attiki, and Ileia dominate the four-year recovery scenario. Because the analysis is anchored to a single 2025 baseline year, this result should be read as area sensitivity under Greece’s specific recent fire history rather than evidence of a general four-year ecological recovery threshold; disentangling the two would require comparison across multiple baseline years or regional subgroup analysis, which is beyond the scope of the present study. We therefore do not interpret this finding as support for shortening the exclusion window as a general policy, though it does suggest that post-fire monitoring of specific burned cohorts, rather than a uniform national rule, may be a more defensible basis for any future review of the exclusion period.
The additional sensitivity analyses further indicate that the study’s regional rankings and headline conclusions are robust to the specific normalization cap values chosen for road accessibility, population density, and erosion risk, with rank correlations against the baseline exceeding 0.97 across all tested alternatives (Section 3.4.3). The erosion cap in particular had negligible influence, consistent with the compressed national distribution of this criterion already noted in the concentration analysis (Section 3.5). The slope exclusion threshold showed a more substantive, asymmetric sensitivity—tightening it by 5° removed a larger share of eligible area than an equivalent loosening restored—reflecting the underlying distribution of slope values across Greek forest land rather than an ecological discontinuity at 35° specifically. This pattern parallels the nonlinear response to the fire exclusion window discussed above and reinforces the broader point that threshold-driven nonlinearities in this framework should be read as artifacts of the underlying data distribution rather than as evidence of ecological or operational thresholds in themselves.
The alternative weighting schemes produced a different pattern: even sizeable shifts in criterion emphasis, from an economic development framing to a climate resilience or ecological footprint framing, leave the overall regional ranking strongly correlated with the equal-weight baseline (Spearman’s ρ = 0.78–0.90). This addresses a longstanding criticism of GIS-based multi-criteria evaluation—that results may be overly sensitive to subjective weighting choices, particularly when weights are not elicited from stakeholders [16,17]. Instead, the principal spatial gradients appear to be supported by multiple criteria rather than being artifacts of the equal-weight assumption. This broadly aligns with previous GIS-based multi-criteria studies, such as in [18], which likewise found that testing alternative weighting scenarios helps distinguish robust spatial priorities from those that depend more strongly on policy preferences. At the same time, agreement narrows appreciably among the ten highest-priority regions, and it narrows the most for the ecological footprint scenario (Rank Agreement Index = 0.333 versus 0.538 for the other two alternatives). This tells a specific policy story: conservation-oriented criteria, not economic or climate resilience criteria, are the principal source of disagreement about which regions should be prioritized first, even though they change little about the overall shape of the national picture. For institutions weighing competing mandates—a ministry of rural development versus an environment ministry, for instance—this narrows the practical disagreement to a small subset of regions whose priority depends on the weighting scheme (for example, Kentrikos Tomeas Athinon, Anatoliki Attiki, and Voreios Tomeas Athinon, which rank highly only under the baseline and ecological footprint scenarios), suggesting that targeted, negotiated management approaches may be more productive than blanket national rules.
This robustness is reinforced by a second internal-consistency check: agreement on the spatial distribution of the highest-priority forest (the top pixel pool, Section 3.5) is even more stable across weighting scenarios than agreement on precise regional rank (nine of ten regions retained across all scenarios, versus five to seven of ten for mean MCE rankings). In practice, this means that even if the exact ordering of priority regions shifts with the policy lens applied, the physical location of the country’s best mobilizable forest does not—a property that should increase confidence among decision-makers that the regions identified here are not artifacts of a particular model specification and that the marginal returns from further debate over alternative weighting schemes are likely small [5].
4.4. Diffuse Mobilization Potential and Regional Policy
The concentration-curve result is arguably the most counter-intuitive finding of this study because it runs counter to the common expectation in GIS-based spatial prioritization that suitability mapping will reveal relatively compact priority areas—or “hotspots”—where interventions can be concentrated [18,52]. Here, the opposite holds. The Gini coefficient of the concentration curve is remarkably low (0.037 at baseline, 0.021–0.048 across alternative weightings) and remains consistently low despite the underlying criterion weights varying substantially—indicating that the diffuseness of Greece’s eligible forest resource is a structural property of the landscape rather than a modeling artifact. Roughly 78% of eligible forest area is required to capture 80% of the national mobilization potential; in effect, there is no compact priority area that a spatial-targeting strategy could exploit for disproportionate returns. This conclusion is robust to the inclusion of criteria with near-saturated national distributions: excluding years since fire, soil stability, and road accessibility raises the Gini coefficients by a comparable margin across all weighting scenarios (Section 3.5; Table S5) without altering the substantive finding that Greece’s eligible forest lacks a compact high-value core.
More generally, the compensatory, linearly-averaged structure of the WLC (Section 2.4.3) tends to smooth differences between pixels and regions regardless of any single criterion’s distribution, since extremes in one criterion are offset by moderate scores in others; the low Gini coefficient should therefore be read partly as a property of this aggregation method and not solely as evidence about the underlying landscape.
Ecologically and socioeconomically, this diffuseness is the composite outcome of the two patterns already discussed: near-ceiling, low-variance biophysical suitability across the eligible forest pool (Section 4.2), combined with socioeconomic gradients that vary gradually and continuously across NUTS-3 regions rather than concentrating sharply in a few “super-regions”. The practical implication for policy is direct: national wood mobilization targets cannot realistically be met by directing infrastructure investment and extension services toward a handful of NUTS-3 regions, as might be justified if a small number of hotspots dominated the resource. Instead, achieving substantial increases in mobilization requires coordinated interventions across a broad set of moderately endowed regions. This is consistent with the broader European finding that harvesting intensity reflects a heterogeneous mix of forest resource, accessibility, and country-specific drivers whose relative importance varies geographically [7]. Accordingly, policy instruments—including investment in sawmilling and wood-processing capacity, workforce development, and extension services [5]—should be designed for broad regional deployment, with national forest-sector strategy implemented through regionally differentiated measures rather than a uniform national program.
This does not mean that spatial targeting is irrelevant. Rather, its greatest leverage shifts from inter-regional prioritization to intra-regional site selection. Within individual high-endowment regions, the proportion of eligible forest belonging to the highest-priority pool varies sharply—from nearly 100% in Thessaloniki, Chalkidiki, and Rodopi to roughly half in Ioannina, Evrytania, and Drama. This indicates that site selection within regions remains highly consequential even where differences among regions offer comparatively little leverage. In practice, these findings support a two-tier management architecture: national and regional policy should treat mobilization potential as broadly distributed and coordinate investment accordingly, while finer-resolution, forest-district-level decision-support tools—in the spirit of high-resolution feasibility mapping [51], or operational decision-support frameworks for harvesting and forest access [53,54]— should be used to identify the stands within priority regions where mobilization efforts can be implemented most effectively.
It is also worth noting that the policy implications discussed above are framed entirely in terms of timber mobilization suitability. Our MCE framework does not quantify, and this study does not assess, the trade-offs between expanding wood mobilization and other forest values, including carbon sequestration and storage, biodiversity and habitat provision, erosion control (beyond the erosion criterion’s role in the suitability score itself), and recreational or tourism value. Scaling up mobilization in any given region would need to weigh these dimensions explicitly rather than treating timber-focused suitability as the sole criterion for regional prioritization.
4.5. Study Limitations
Several limitations should be considered when interpreting these results. First, eligibility in this framework is a necessary but not sufficient condition for actual wood mobilization. The analysis does not account for forest ownership structure and fragmentation, fine-grained road density beyond the friction-surface approximation used here, or local market and mill-capacity constraints, all of which further limit the forest area where mobilization is practically and economically feasible [49,50]. In addition, the updated forest layer (Section 2.2) has not been independently validated against ground-based forest inventory data; while the 300 m source used to update forest extent is a well-established land cover product, resolution-driven boundary imprecision in updated areas cannot be ruled out, and future work should verify the resulting layer against National Forest Inventory plot data where available.
Second, two of the three exclusion criteria—steep terrain and legal protection—were treated as fixed, binary constraints in the baseline analysis. The slope threshold’s influence was subsequently tested through sensitivity analysis (Section 3.4.3), which showed a real but asymmetric effect on eligible area (−7.6% at a 30° threshold, +2.1% at 40°); the protection mask, by contrast, remains untested against alternative zone-level treatments for the reasons discussed above. The road distance, population density, and erosion normalization caps were also tested and had minimal effects on regional rankings (Section 3.4.3). While the slope threshold reflects a genuine physical constraint on conventional harvesting machinery, the protection mask treats the entire Natura 2000 and national park estate as uniformly unavailable, even though Natura 2000 is a use-compatible designation that allows site-specific management plans to permit sustainable forestry activities. The effective exclusion area attributable to protection status is therefore likely overstated in regions with a large share of Natura 2000 forest, and a finer-grained treatment distinguishing strict reserves from actively managed buffer zones was beyond the scope of the data available here.
Third, the agricultural employment criterion, one of the two variables found to carry the greatest discriminatory power in this study, was represented using a NUTS-2-level proxy because forestry-specific employment (NACE A02) is not available at the NUTS-3 level in Eurostat. This introduces spatial smoothing that assigns identical values to all NUTS-3 units within a NUTS-2 region, potentially diluting the true strength of the labor availability signal at the finer spatial resolution most relevant to on-the-ground planning. However, a robustness check in which the PCA was repeated with this criterion excluded produced a near-identical axis structure, indicating that the socioeconomic–biophysical gradient identified in Section 3 is not an artifact of this proxy’s resolution, even though the criterion’s own contribution to individual pixel-level scores remains subject to the smoothing described above.
Fourth, the multi-criteria evaluation uses a fully compensatory linear combination, in which high scores on others can always offset a low score on one criterion. This is a standard and transparent choice [16], but it may not fully reflect operational thresholds. For example, a site with extremely poor road access may be effectively unharvestable regardless of how productive or otherwise suitable it is.
Fifth, the forest-type score is a biomass-expansion-factor-based proxy for commercially usable stem biomass rather than a direct measure of timber market value or species-specific demand. In addition, the framework was not validated against independent historical harvest or accessibility records, as such georeferenced operational data are not currently available for Greece.
Sixth, the dry matter productivity (DMP) criterion is derived from a satellite biophysical product that characterizes the productivity of the entire vegetated land surface within each pixel, rather than tree biomass specifically. In closed-canopy stands, the signal is dominated by the tree layer, but in sparse or open forest—including degraded stands and naturally open Mediterranean forest types—a larger share of the DMP signal can originate from understory shrubs and herbaceous ground cover. This may inflate DMP scores and, by extension, MCE scores in low-density stands whose actual standing woody biomass and harvestable increment are comparatively modest. We retain DMP because no nationally consistent, spatially continuous product isolating tree-specific productivity is currently available for Greece at a comparable resolution and because the DMP’s influence on the composite MCE score is moderated by its combination with the forest-type score and the compensatory weighting scheme (Section 2.5), rather than acting alone. Nonetheless, this is a directional bias worth flagging explicitly: eligible pixels in open-canopy stands are more likely to have their mobilization potential overstated than those in denser stands.
Finally, the framework provides a static assessment of present-day forest eligibility. Although the sensitivity analysis explored uncertainty in the fire exclusion period and alternative weighting schemes, it does not account for future changes in disturbance regimes, infrastructure, forest management, or conservation policy that may alter mobilization potential over time. Extending the framework to incorporate these dynamic processes represents an important direction for future research.
4.6. Future Perspectives
These limitations point toward several concrete directions for extending the framework. A finer-grained treatment of protected areas—distinguishing strict reserves from actively managed buffer zones using site-level Natura 2000 management-plan data—would allow the framework to move from a conservative binary exclusion toward a more realistic representation of where sustainable forestry is genuinely compatible with conservation objectives. Incorporating forest-road network density and condition directly, alongside ownership fragmentation data where available, would also move the assessment closer to genuine operational and economic accessibility, in the direction pursued by high-resolution feasibility mapping in Mediterranean forest landscapes [51] and by terrain-specific operability frameworks for mechanized harvesting [53], supported by broader analyses of forest slope constraints relevant to harvesting operations [55]. Future implementations could also substitute a canopy-cover-weighted or tree-specific productivity proxy—for example, combining DMP with a fractional canopy-cover mask—to isolate the woody biomass component of productivity from understory contributions.
A second priority is to make the framework dynamic rather than static. Repeating the analysis using multi-year productivity climatologies together with forward-looking fire danger and climate change projections [13,56] would allow eligible area and regional priorities to be projected under future climate scenarios rather than assessed only against current and historical conditions. This represents a natural extension of the present study, given that the sensitivity analysis demonstrated how strongly the assumed post-fire exclusion window influences the total area considered available for wood mobilization.
Third, complementing the biophysical and infrastructural layers used here with an explicit economic component—including timber prices, harvesting and transport costs, and value-chain resilience—would help translate eligible forest into genuinely economically available wood supply. Such an extension would align the framework more closely with ongoing European efforts to harmonize assessments of forests available for wood supply (FAWS) [49,50] while also incorporating spatial economic-valuation approaches developed for Mediterranean forest systems [57]. Relatedly, recent work on the resilience of local forest value chains under disturbance [58] suggests that future assessments could evaluate not only where wood can be mobilized but also how resilient the associated regional value chains are to future disturbances; a question of particular importance for a country repeatedly affected by large wildfires.
Fourth, future work could also extend the framework beyond wood mobilization to incorporate non-wood forest products and ecosystem services, which are not systematically captured in official statistics on the forest sector’s economic contribution [2]. Because this study’s highest-endowment regions are concentrated in the same rural, lower-density areas plausibly rich in non-market forest values, a multi-value extension of the framework would show whether wood mobilization priorities align with or compete against other forest functions in these regions.
Finally, subsequent studies should elicit criterion weights directly from Greek stakeholders—including forest managers, regional authorities, industry representatives, and environmental agencies—through structured participatory processes, to determine whether the robustness observed here under a priori policy archetypes also holds for weights reflecting real-world stakeholder preferences. The framework could also be benchmarked explicitly against broader European spatial assessments of forest biomass availability and ecosystem-service provision [52,59] while relating its findings to the long-standing literature on Greek roundwood markets and trade dependence [60]. Such comparisons would place Greece’s wood mobilization potential within both its wider European context and its evolving forest-sector development trajectory.
5. Conclusions
This study provides a spatially explicit framework for supporting wood mobilization planning in Greece by moving beyond national aggregate statistics toward NUTS-3-scale assessments that bridge the gap between national reporting and local operational planning. By integrating legal protection, terrain, recent fire history, and multi-criteria evaluation within a GIS environment, it identifies not only how much forest remains potentially available for wood mobilization but also where that eligible area is located and how consistently priority regions emerge under alternative policy assumptions.
For forest managers and regional forestry services, the principal value of the framework lies in supporting operational planning through fine-resolution identification of priority forest, rather than relying solely on regional averages that can mask substantial within-region variation in accessibility and suitability. At the national level, strong agreement across regional rankings under contrasting weighting scenarios demonstrates that the principal spatial priorities are robust to alternative policy perspectives. Investment and incentive programs aimed at strengthening Greece’s forest sector—including processing capacity, workforce development, and forest management support [5]—can therefore focus on consistently identified priority regions without waiting for consensus on a single weighting scheme.
This study also highlights two policy levers with particular influence on future wood mobilization. First, the post-fire exclusion window is an administrative rule rather than a validated ecological threshold, and our sensitivity analysis shows its calibration substantially affects the area considered available for mobilization, though the sharp area increase observed near four years reflects Greece’s 2021 fire history rather than a confirmed recovery threshold (Section 4.5). Rather than a uniform shortening of the exclusion period, post-fire monitoring of specific burned cohorts offers a more defensible basis for any future review of this rule. Second, protected area status represents the largest single constraint on forest eligibility, particularly in several high-endowment regions. Because Natura 2000 designation is compatible with sustainable forest management under site-specific plans, the eligible area estimates reported here should be interpreted as a conservative lower bound on forest availability rather than a direct measure of the area truly unavailable for mobilization. A more detailed differentiation within Natura 2000 management planning—distinguishing strictly protected areas from forests where sustainable management is compatible with conservation objectives—will offer an important opportunity to improve the balance between biodiversity conservation and sustainable wood production.
More broadly, the findings indicate that Greece’s mobilization potential is geographically diffuse rather than concentrated within a small number of exceptional regions. Consequently, increasing domestic wood mobilization will depend less on flagship regional investments and more on coordinated interventions distributed across many moderately endowed regions. Concretely, this could include targeted co-financing for small-scale or mobile timber processing infrastructure rather than centralized large-capacity plants, forestry extension officers assigned specifically to priority NUTS-3 regions to support smallholders and fragmented ownership structures, vocational training and labor-incentive schemes in regions identified as labor-constrained (Section 4.2), and prioritization of these priority regions within existing EU Rural Development Programme and CAP Strategic Plan forestry funding measures. As new land-cover, burned area, infrastructure, and socioeconomic data become available, the framework presented here can be updated and expanded to incorporate operational and economic information, providing an increasingly comprehensive decision-support tool for sustainable forest management.
By supporting planning with transparent and routinely updated spatial evidence, this approach provides a stronger basis for aligning forest management, regional development, and environmental policy. In doing so, it offers a practical pathway to reduce the long-standing gap between Greece’s substantial forest resource and its continued dependence on imported wood while supporting the sustainable development of the national forest sector.
Supplementary Materials
The following supporting information can be downloaded at https://www.mdpi.com/article/10.3390/su182111127/s1, Figure S1: Correlation matrix of the eight normalized MCE criteria; Figure S2: PCA biplot of seven MCE criteria (agricultural share is out); Figure S3: Radar plots of zonal-mean normalized criterion scores; Table S1: Mobilization under relaxation of post-fire exclusion window; Table S2: Comparing three policy weighted MCE rankings; Table S3: Sensitivity to normalization cap choices; Table S4: Mobilization potential across weight scenarios; Figure S4: Top-10 NUTS-3 by share of top pixel pool across scenarios; Table S5: Sensitivity of concentration-curve Gini coefficients; Table S6: NUTS-3 share of top pixel pool under baseline weighting.
Author Contributions
Conceptualization, D.A.K., P.P.K. and D.F.; methodology, D.A.K., P.P.K. and D.F.; software, D.A.K.; formal analysis, D.A.K., P.P.K. and D.F.; data curation, D.A.K.; writing—original draft preparation, D.A.K. and P.P.K.; writing—review and editing, D.A.K., P.P.K. and D.F.; visualization, D.A.K. All authors have read and agreed to the published version of the manuscript.
Funding
This research received no external funding.
Institutional Review Board Statement
Not applicable.
Informed Consent Statement
Not applicable.
Data Availability Statement
The R scripts used for all analyses are publicly available via Zenodo at https://doi.org/10.5281/zenodo.21538725 [61].
Acknowledgments
The authors acknowledge the following data providers: CORINE Land Cover 2018, produced with funding by the European Union under the Copernicus Land Monitoring Service, European Environment Agency (EEA); Dry Matter Productivity data, generated by the Copernicus Global Land Service, based on PROBA-V data (copyright BELSPO, distributed by VITO NV) and Copernicus Sentinel-3 data; ESA land cover data, downloaded from the Copernicus Climate Change Service Climate Data Store and used with funding by the European Union; MODIS burned area data (MCD64A1), provided by the NASA Land Processes Distributed Active Archive Center (LP DAAC); Eurostat statistical data, used under the Creative Commons Attribution 4.0 International license (Source: European Commission, Eurostat); and Natura 2000 and Common Database on Designated Areas (CDDA) data, provided by the European Environment Agency (EEA). OpenStreetMap road data are © OpenStreetMap contributors. During the preparation of this study, the authors used Claude Sonnet 5 (Anthropic) for the purposes of drafting and editing the manuscript text and for writing and debugging the R analysis code used in this study. The authors have reviewed and edited the output and take full responsibility for the content of this publication.
Conflicts of Interest
The authors declare no conflicts of interest.
References
- European Commission. New EU Forest Strategy for 2030. Communication from the Commission to the European Parliament, the Council, the European Economic and Social Committee and the Committee of the Regions; COM(2021) 572 Final; European Commission: Brussels, Belgium, 2021; Available online: https://eur-lex.europa.eu/legal-content/EN/TXT/?uri=CELEX:52021DC0572 (accessed on 20 October 2026).
- FOREST EUROPE. State of Europe’s Forests 2025; FOREST EUROPE Liaison Unit Sweden: Uppsala, Sweden, 2026. [Google Scholar]
- Lawrence, A. Do Interventions to Mobilize Wood Lead to Wood Mobilization? A Critical Review of the Links between Policy Aims and Private Forest Owners’ Behaviour. Forestry 2018, 91, 401–418. [Google Scholar] [CrossRef] [Scilit]
- Koulelis, P. A Study of the Greek Trade Deficit in Forest Products: Current Conditions and Prospects. For. Syst. 2012, 21, 549–554. [Google Scholar] [CrossRef] [Scilit]
- Koulelis, P.; Tsiaras, S.; Andreopoulou, Z.S. Greece’s Forest Sector from the Perspective of Timber Production: Evolution or Decline? Forests 2023, 14, 2331. [Google Scholar] [CrossRef] [Scilit]
- FAO. The Status of Mediterranean Forests 2025; Food and Agriculture Organization of the United Nations: Rome, Italy, 2025; ISBN 978-92-5-140114-9. [Google Scholar] [CrossRef] [Scilit]
- Levers, C.; Verkerk, P.J.; Müller, D.; Verburg, P.H.; Butsic, V.; Leitão, P.J.; Lindner, M.; Kuemmerle, T. Drivers of Forest Harvesting Intensity Patterns in Europe. For. Ecol. Manag. 2014, 315, 160–172. [Google Scholar] [CrossRef] [Scilit]
- Fayet, C.M.J.; Reilly, K.H.; Van Ham, C.; Verburg, P.H. What Is the Future of Abandoned Agricultural Lands? A Systematic Review of Alternative Trajectories in Europe. Land Use Policy 2022, 112, 105833. [Google Scholar] [CrossRef] [Scilit]
- Kiziridis, D.A.; Mastrogianni, A.; Pleniou, M.; Karadimou, E.; Tsiftsis, S.; Xystrakis, F.; Tsiripidis, I. Acceleration and Relocation of Abandonment in a Mediterranean Mountainous Landscape: Drivers, Consequences, and Management Implications. Land 2022, 11, 406. [Google Scholar] [CrossRef] [Scilit]
- Lagouvardos, K.; Dafis, S.; Kotroni, V.; Kyros, G.; Giannaros, T.M. Exploring Recent (1991–2020) Trends of Essential Climate Variables in Greece. Atmosphere 2024, 15, 1104. [Google Scholar] [CrossRef] [Scilit]
- Kiziridis, D.A.; Salonikidou, E.; Eleftheriadou, N.; Fotakis, D. Balancing Non-Timber Services with Biomass Production via Sustainable Forest Management: A Review of Conflicting Demands and Suggested Approaches. Forests 2025, 16, 348. [Google Scholar] [CrossRef] [Scilit]
- Nocentini, S.; Travaglini, D.; Muys, B. Managing Mediterranean Forests for Multiple Ecosystem Services: Research Progress and Knowledge Gaps. Curr. For. Rep. 2022, 8, 229–256. [Google Scholar] [CrossRef] [Scilit]
- Rovithakis, A.; Grillakis, M.G.; Seiradakis, K.D.; Giannakopoulos, C.; Karali, A.; Field, R.; Lazaridis, M.; Voulgarakis, A. Future Climate Change Impact on Wildfire Danger over the Mediterranean: The Case of Greece. Environ. Res. Lett. 2022, 17, 045022. [Google Scholar] [CrossRef] [Scilit]
- Shakesby, R.A. Post-Wildfire Soil Erosion in the Mediterranean: Review and Future Research Directions. Earth-Sci. Rev. 2011, 105, 71–100. [Google Scholar] [CrossRef] [Scilit]
- Kazana, V.; Kazaklis, A.; Raptis, D.; Stamatiou, C. A Combined Multi-Criteria Approach to Assess Forest Management Sustainability: An Application to the Forests of Eastern Macedonia & Thrace Region in Greece. Ann. Oper. Res. 2020, 294, 321–343. [Google Scholar] [CrossRef] [Scilit]
- Malczewski, J. GIS-Based Land-Use Suitability Analysis: A Critical Overview. Prog. Plan. 2004, 62, 3–65. [Google Scholar] [CrossRef] [Scilit]
- Malczewski, J. GIS-based Multicriteria Decision Analysis: A Survey of the Literature. Int. J. Geogr. Inf. Sci. 2006, 20, 703–726. [Google Scholar] [CrossRef] [Scilit]
- Perpiña, C.; Martínez-Llario, J.C.; Pérez-Navarro, Á. Multicriteria Assessment in GIS Environments for Siting Biomass Plants. Land Use Policy 2013, 31, 326–335. [Google Scholar] [CrossRef] [Scilit]
- Eurostat. GISCO: NUTS 2024—NUTS Regions, 1:1 Million Scale (NUTS_RG_01M_2024_3035), 2024. Available online: https://gisco-services.ec.europa.eu/distribution/v2/nuts/ (accessed on 20 October 2026).
- European Commission. Climate Action Progress Report 2024: Country Profile—Greece; European Commission: Brussels, Belgium, 2025; Available online: https://climate.ec.europa.eu/document/download/ed870f48-1758-41d5-be98-adadd79ca3fe_en?filename=el_2024_factsheet_en.pdf (accessed on 20 October 2026).
- European Environment Agency (EEA); Copernicus Land Monitoring Service. CORINE Land Cover 2018 (Raster 100 m), Europe, 6-Yearly—Version 2020_20u1; EEA: Copenhagen, Denmark, 2020. [Google Scholar] [CrossRef]
- Copernicus Climate Change Service (C3S); Climate Data Store. Land Cover Classification Gridded Maps from 1992 to Present Derived from Satellite Observations; C3S Climate Data Store: 2019. Available online: https://doi.org/10.24381/cds.006f2c9a (accessed on 20 October 2026). [CrossRef]
- Harper, K.L.; Lamarche, C.; Hartley, A.; Peylin, P.; Ottlé, C.; Bastrikov, V.; San Martín, R.; Bohnenstengel, S.I.; Kirches, G.; Boettcher, M.; et al. A 29-year time series of annual 300 m resolution plant-functional-type maps for climate models. Earth Syst. Sci. Data 2023, 15, 1465–1499. [Google Scholar] [CrossRef] [Scilit]
- R Core Team. R: A Language and Environment for Statistical Computing; R Foundation for Statistical Computing: Vienna, Austria, 2024. [Google Scholar]
- Hijmans, R.J. Terra: Spatial Data Analysis. R. Package 2024. Available online: https://cran.r-project.org/web/packages/terra/index.html (accessed on 20 October 2026).
- Pebesma, E. Simple Features for R: Standardized Support for Spatial Vector Data. R. J. 2018, 10, 439–446. [Google Scholar] [CrossRef] [Scilit]
- Wickham, H.; Averick, M.; Bryan, J.; Chang, W.; McGowan, L.D.; François, R.; Grolemund, G.; Hayes, A.; Henry, L.; Hester, J.; et al. Welcome to the Tidyverse. J. Open Source Softw. 2019, 4, 1686. [Google Scholar] [CrossRef] [Scilit]
- Lahti, L.; Huovari, J.; Kainu, M.; Biecek, P. Retrieval and Analysis of Eurostat Open Data with the eurostat Package. R J. 2017, 9, 385–392. [Google Scholar] [CrossRef] [Scilit]
- Gilardi, A.; Lovelace, R. Osmextract: Import and Manipulate OpenStreetMap Data Extracts. J. Open Source Softw. 2021, 6, 3078. [Google Scholar] [CrossRef] [Scilit]
- Hesselbarth, M.H.K.; Sciaini, M.; With, K.A.; Wiegand, K.; Nowosad, J. Landscapemetrics: An Open-Source R Tool to Calculate Landscape Metrics. Ecography 2019, 42, 1648–1657. [Google Scholar] [CrossRef] [Scilit]
- Lê, S.; Josse, J.; Husson, F. FactoMineR: An R Package for Multivariate Analysis. J. Stat. Softw. 2008, 25, 1–18. [Google Scholar] [CrossRef] [Scilit]
- Wickham, H. Ggplot2: Elegant Graphics for Data Analysis; Springer: New York, NY, USA, 2016; ISBN 978-3-319-24277-4. [Google Scholar]
- Hernangómez, D. Using the Tidyverse with Terra Objects: The Tidyterra Package. J. Open Source Softw. 2023, 8, 5751. [Google Scholar] [CrossRef] [Scilit]
- Neteler, M.; Haas, J.; Metz, M. Copernicus Digital Elevation Model (DEM) for Europe at 100 Meter Resolution (EU-LAEA) Derived from Copernicus Global 30 Meter DEM Dataset. 2022. Available online: http://data.europa.eu/88u/dataset/74d0e58f-9f51-444e-a5a7-eff4c20f05b1 (accessed on 20 October 2026).
- Tobler, W.R. Three Presentations on Geographical Analysis and Modeling: Non-Isotropic Geographic Modeling Speculations on the Geometry of Geography and Global Spatial Analysis (93-1). 1993. Available online: https://escholarship.org/uc/item/05r820mz (accessed on 20 October 2026).
- Copernicus Land Monitoring Service. Dry Matter Productivity 2014–2026 (Raster 300 m), Global, 10-Daily—Version 1. 2023. Available online: https://doi.org/10.2909/67797662-7edc-4a29-b93b-a58af384b137 (accessed on 20 October 2026). [CrossRef]
- FAO. Global Forest Resources Assessment 2010; FAO: Rome, Italy, 2010; ISBN 978-92-5-106654-6. [Google Scholar]
- Eurostat. Population on 1 January by Broad Age Group, Sex and NUTS 3 Region (demo_r_pjanaggr3); Eurostat: Luxembourg, 2025. [Google Scholar] [CrossRef]
- Eurostat. Employment (Thousand Persons) by NUTS 3 Region (nama_10r_3empers); Eurostat: Luxembourg, 2023. [Google Scholar] [CrossRef]
- Giglio, L.; Justice, C.O.; Boschetti, L.; Roy, D.P. The Collection 6 MODIS Burned Area Mapping Algorithm and Product. Remote Sens. Environ. 2018, 217, 72–85. [Google Scholar] [CrossRef] [Scilit] [PubMed]
- Giglio, L.; Justice, C.; Boschetti, L.; Roy, D. MODIS/Terra+Aqua Burned Area Monthly L3 Global 500m SIN Grid V061 [Dataset]; NASA Land Processes Distributed Active Archive Center: Sioux Falls, SD, USA, 2021. [Google Scholar] [CrossRef]
- Vieira, D.C.S.; Borrelli, P.; Scarpa, S.; Liakos, L.; Ballabio, C.; Panagos, P. Global Estimation of Post-Fire Soil Erosion. Nat. Geosci. 2026, 19, 59–67. [Google Scholar] [CrossRef] [Scilit]
- Borz, S.A.; Mariş, A.-C.; Kaakkurivaara, N. Performance of Skidding Operations in Low-Access and Low-Intensity Timber Removals: A Simulation of Productivity and Fuel Consumption in Mature Forests. Forests 2023, 14, 265. [Google Scholar] [CrossRef] [Scilit]
- European Environment Agency (EEA). Natura 2000 (Vector)—Version 2021, Revision 1 (October 2022); European Environment Agency: Copenhagen, Denmark, 2022; Available online: https://sdi.eea.europa.eu/catalogue/srv/eng/catalog.search#/metadata/dae737fd-7ee1-4b0a-9eb7-1954eec00c65 (accessed on 20 October 2026).
- European Environment Agency (EEA). Nationally Designated Areas (CDDA)—Version 20, June 2022; European Environment Agency: Copenhagen, Denmark, 2022; Available online: https://sdi.eea.europa.eu/catalogue/srv/eng/catalog.search#/metadata/95460d62-5764-4c50-be95-6b576cf85c0c (accessed on 20 October 2026).
- Benjamini, Y.; Hochberg, Y. Controlling the False Discovery Rate: A Practical and Powerful Approach to Multiple Testing. J. R. Stat. Soc. Ser. B 1995, 57, 289–300. [Google Scholar] [CrossRef] [Scilit]
- Cohen, J. A Power Primer. Psychol. Bull. 1992, 112, 155–159. [Google Scholar] [CrossRef] [PubMed]
- Kassambara, A. rstatix: Pipe-Friendly Framework for Basic Statistical Tests. 2023. Available online: https://doi.org/10.32614/CRAN.package.rstatix (accessed on 20 October 2026). [CrossRef] [Scilit]
- Alberdi, I.; Bender, S.; Riedel, T.; Avitable, V.; Boriaud, O.; Bosela, M.; Camia, A.; Cañellas, I.; Castro Rego, F.; Fischer, C.; et al. Assessing Forest Availability for Wood Supply in Europe. For. Policy Econ. 2020, 111, 102032. [Google Scholar] [CrossRef] [Scilit] [PubMed]
- Fischer, C.; Gasparini, P.; Nylander, M.; Redmond, J.; Hernandez, L.; Brändli, U.-B.; Pastor, A.; Rizzo, M.; Alberdi, I. Joining Criteria for Harmonizing European Forest Available for Wood Supply Estimates. Case Studies from National Forest Inventories. Forests 2016, 7, 104. [Google Scholar] [CrossRef] [Scilit]
- Rodríguez-Dorna, A.; Alonso, L.; Picos, J.; Armesto, J. Mapping Feasibility for Wood Supply: A High-Resolution Geospatial Approach to Enhance Sustainable Forest Management in Galicia (NW Spain). Forests 2023, 14, 2124. [Google Scholar] [CrossRef] [Scilit]
- Verkerk, P.J.; Fitzgerald, J.B.; Datta, P.; Dees, M.; Hengeveld, G.M.; Lindner, M.; Zudin, S. Spatial Distribution of the Potential Forest Biomass Availability in Europe. For. Ecosyst. 2019, 6, 5. [Google Scholar] [CrossRef] [Scilit]
- Phelps, K.; Hiesl, P.; Hagan, D.; Hotaling Hagan, A. The Harvest Operability Index (HOI): A Decision Support Tool for Mechanized Timber Harvesting in Mountainous Terrain. Forests 2021, 12, 1307. [Google Scholar] [CrossRef] [Scilit]
- Tampekis, S.; Sakellariou, S.; Samara, F.; Sfougaris, A.; Jaeger, D.; Christopoulou, O. Mapping the Optimal Forest Road Network Based on the Multicriteria Evaluation Technique: The Case Study of Mediterranean Island of Thassos in Greece. Environ. Monit. Assess. 2015, 187, 687. [Google Scholar] [CrossRef] [Scilit] [PubMed]
- Lundbäck, M.; Persson, H.; Häggström, C.; Nordfjell, T. Global Analysis of the Slope of Forest Land. For. Int. J. For. Res. 2021, 94, 54–69. [Google Scholar] [CrossRef] [Scilit]
- Kiziridis, D.A.; Mastrogianni, A.; Pleniou, M.; Tsiftsis, S.; Xystrakis, F.; Tsiripidis, I. Simulating Future Land Use and Cover of a Mediterranean Mountainous Area: The Effect of Socioeconomic Demands and Climatic Changes. Land 2023, 12, 253. [Google Scholar] [CrossRef] [Scilit]
- Ojea, E.; Ruiz-Benito, P.; Markandya, A.; Zavala, M.A. Wood Provisioning in Mediterranean Forests: A Bottom-up Spatial Valuation Approach. For. Policy Econ. 2012, 20, 78–88. [Google Scholar] [CrossRef] [Scilit]
- García-Jácome, S.P.; Brudermann, A.; Stern, T.; Lindner, M.; Lloret, F.; Uzquiano, S.; Asada, R.; Picos, J.; Nuhlíček, O.; Vuletić, D.; et al. Factors Affecting the Forest Value Chain Resilience—A Local Economic Perspective in Five European Countries. Front. For. Glob. Change 2025, 8, 1653665. [Google Scholar] [CrossRef] [Scilit]
- Orsi, F.; Ciolli, M.; Primmer, E.; Varumo, L.; Geneletti, D. Mapping Hotspots and Bundles of Forest Ecosystem Services across the European Union. Land Use Policy 2020, 99, 104840. [Google Scholar] [CrossRef] [Scilit]
- Zafeiriou, E.; Arabatzis, G.; Koutroumanidis, T. The Round Wood Market in Greece: An Empirical Approach. For. Syst. 2012, 21, 31–41. [Google Scholar] [CrossRef] [Scilit][Green Version]
- Kiziridis, D.; Koulelis, P.; Fotakis, D. Code for the Paper “From Forest Potential to Accessible Supply: A Spatial Multi-Criteria Assessment of Wood Mobilization Potential in Greece” [Zenodo Data Set]. Available online: https://zenodo.org/doi/10.5281/zenodo.21538725 (accessed on 24 July 2026).
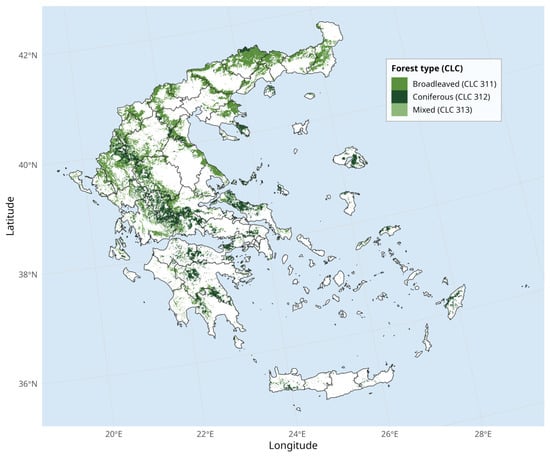
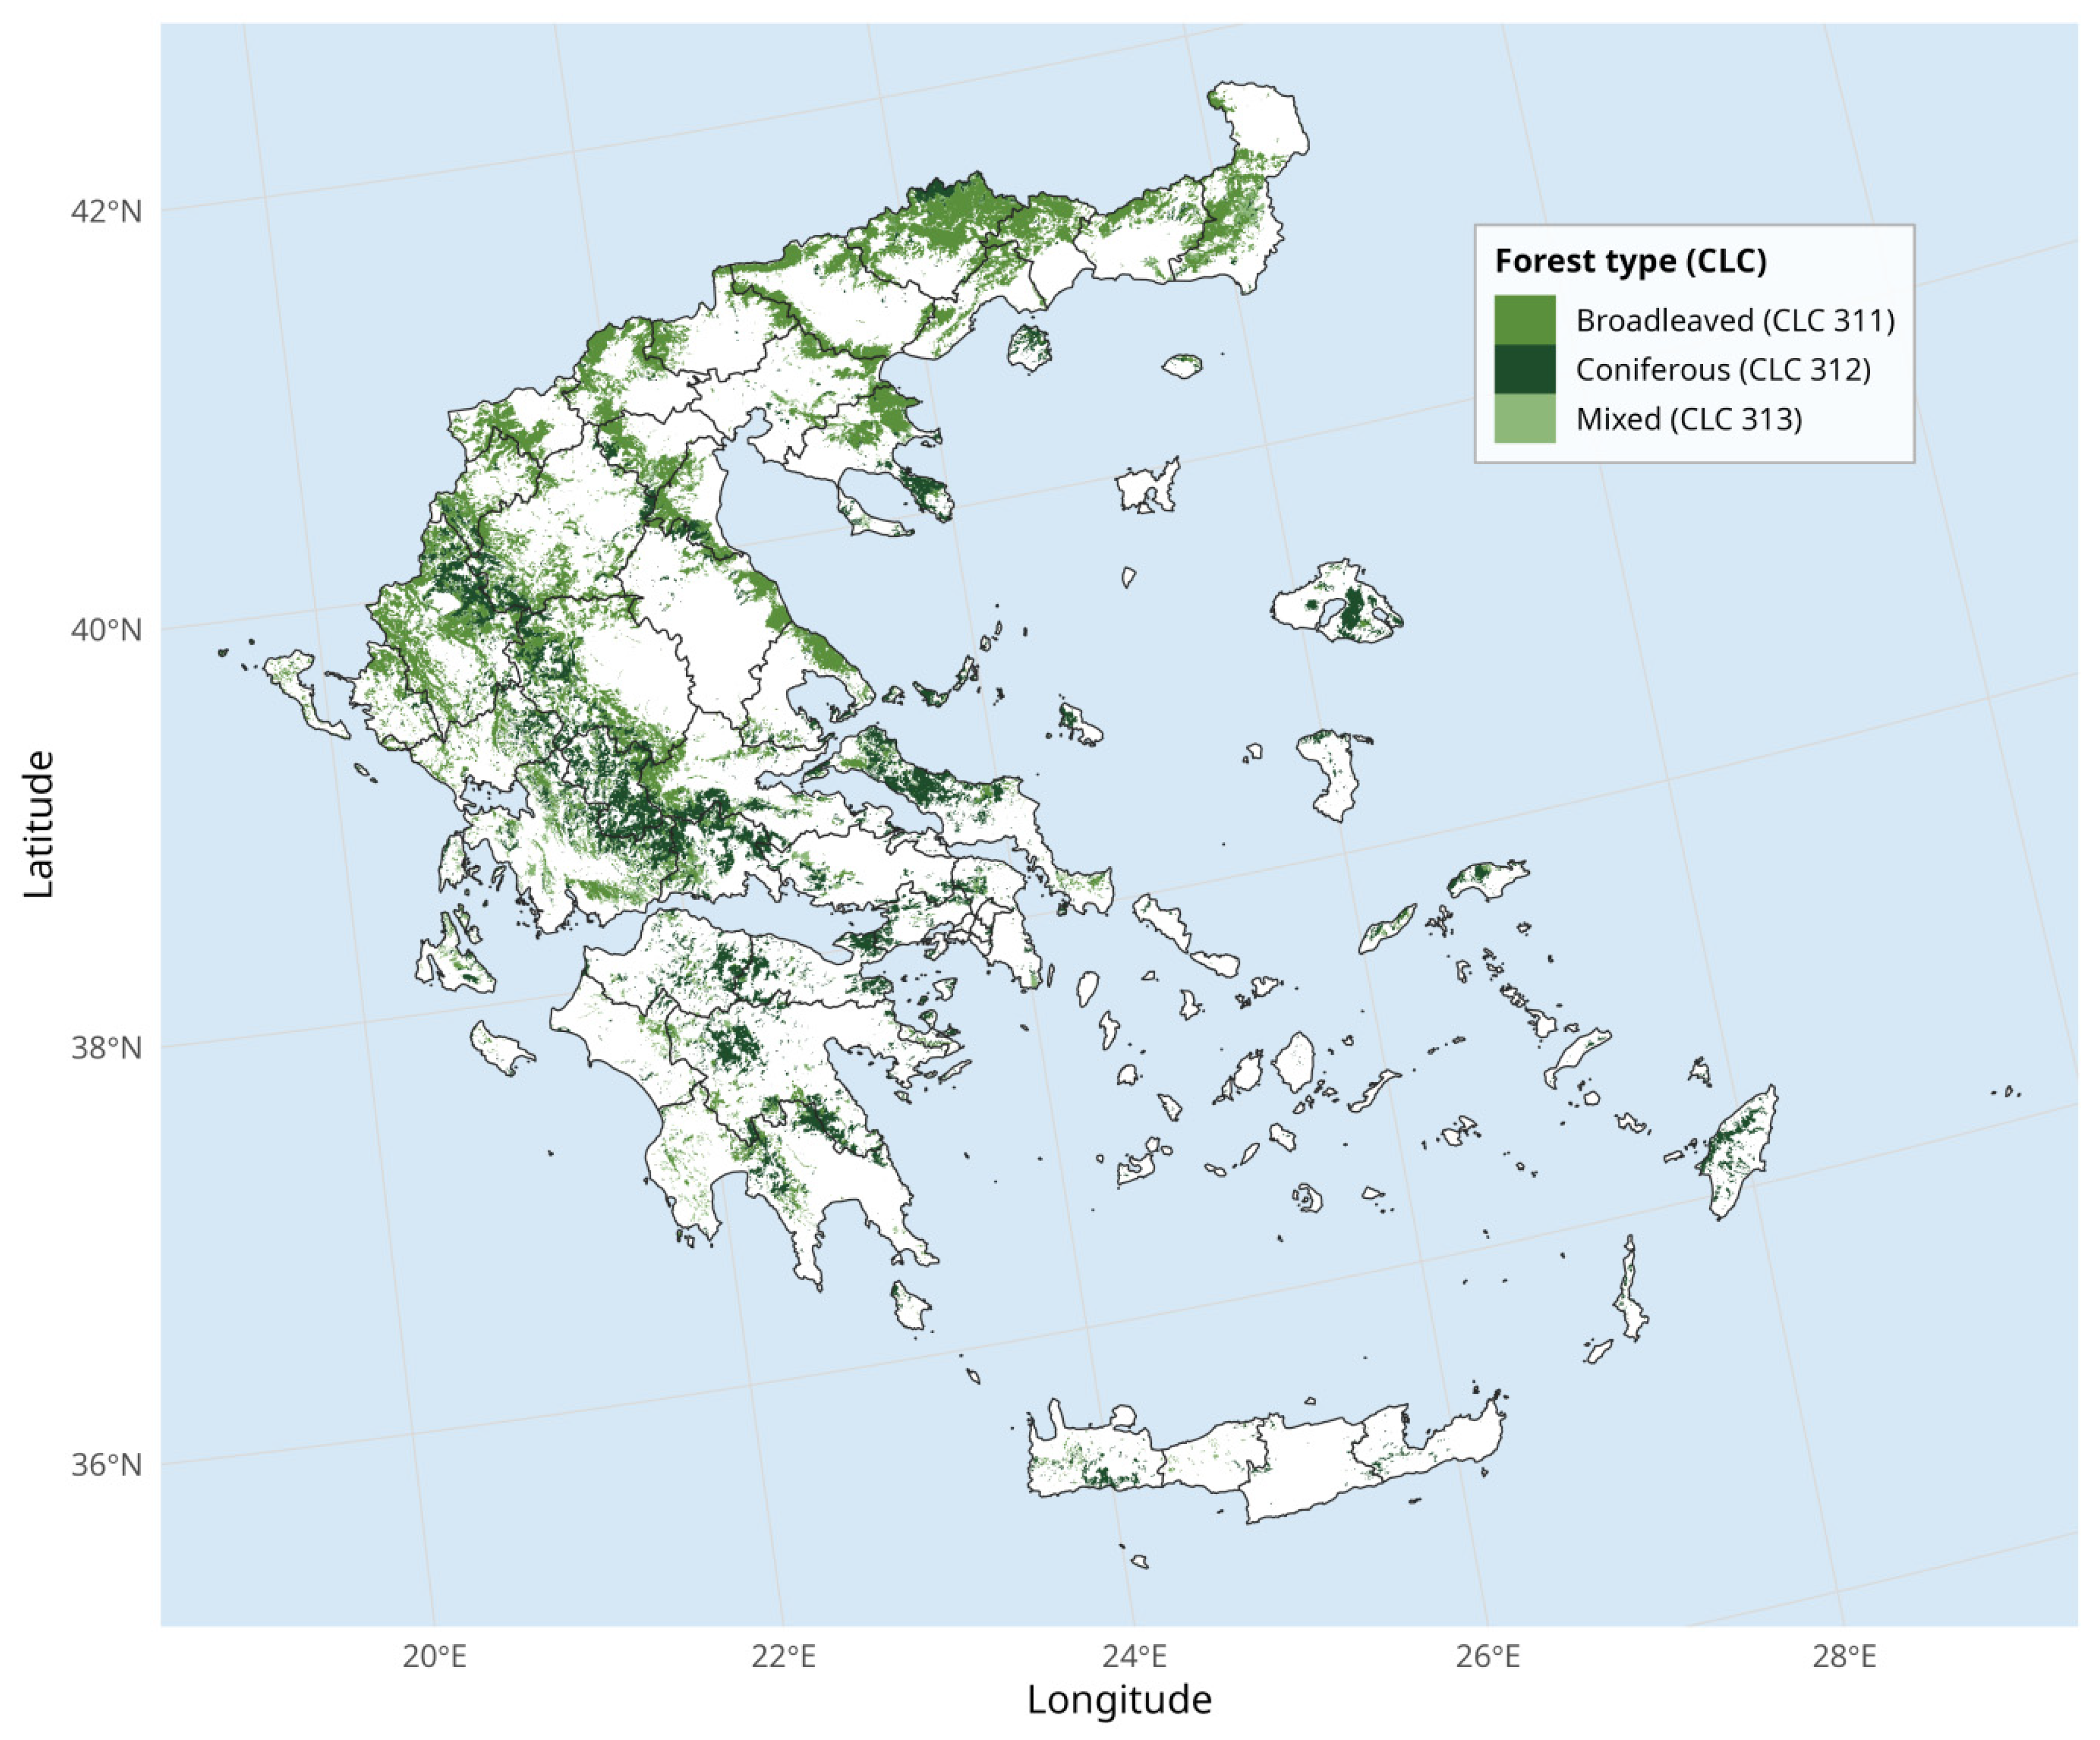
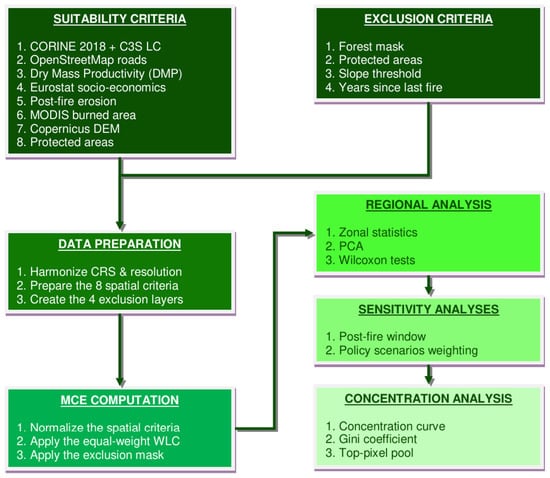
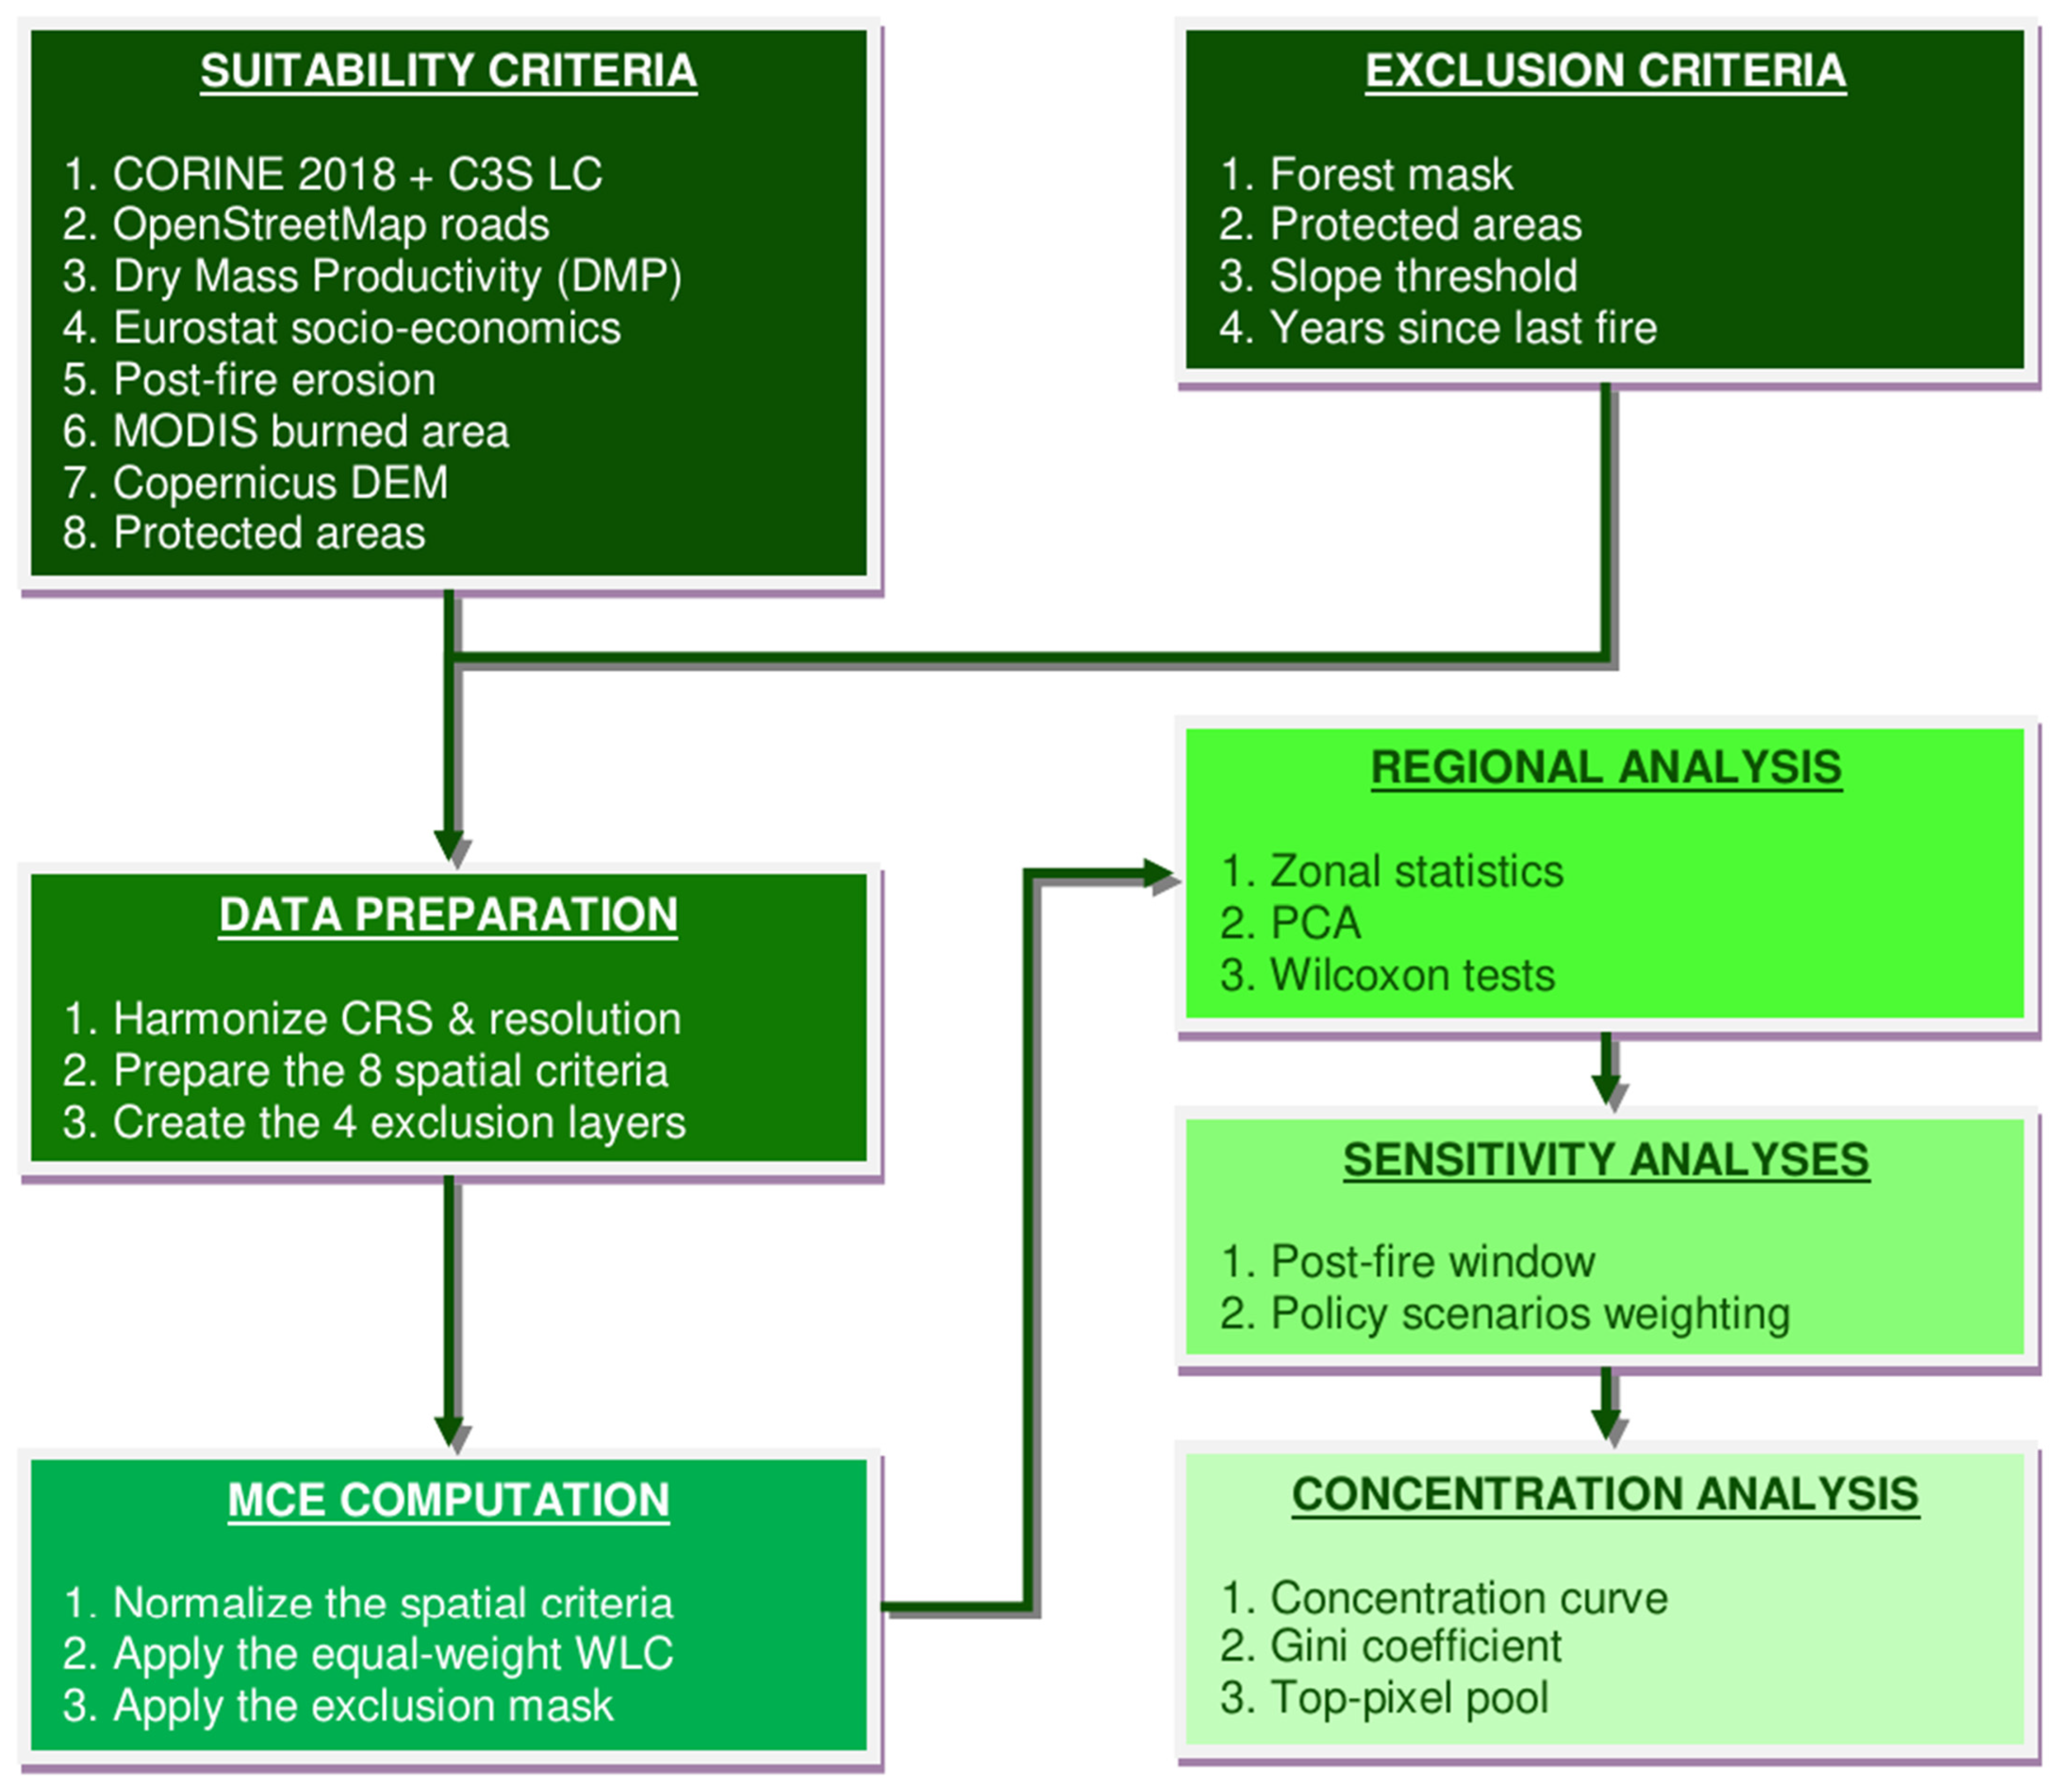
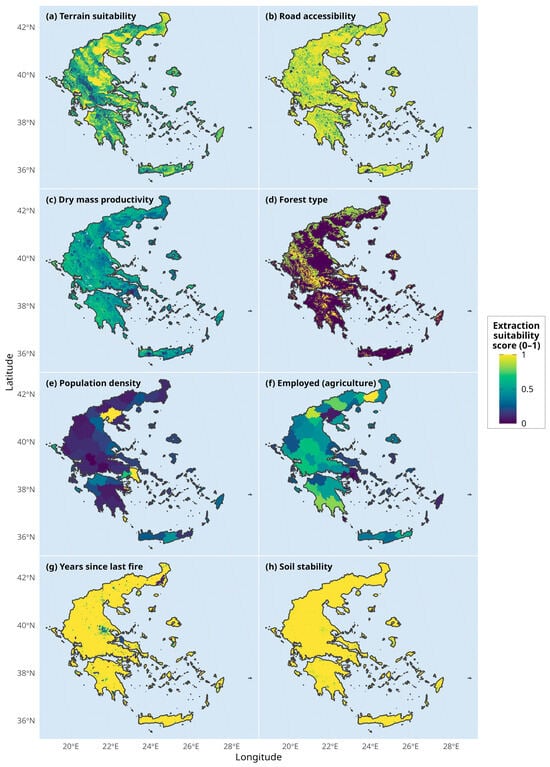
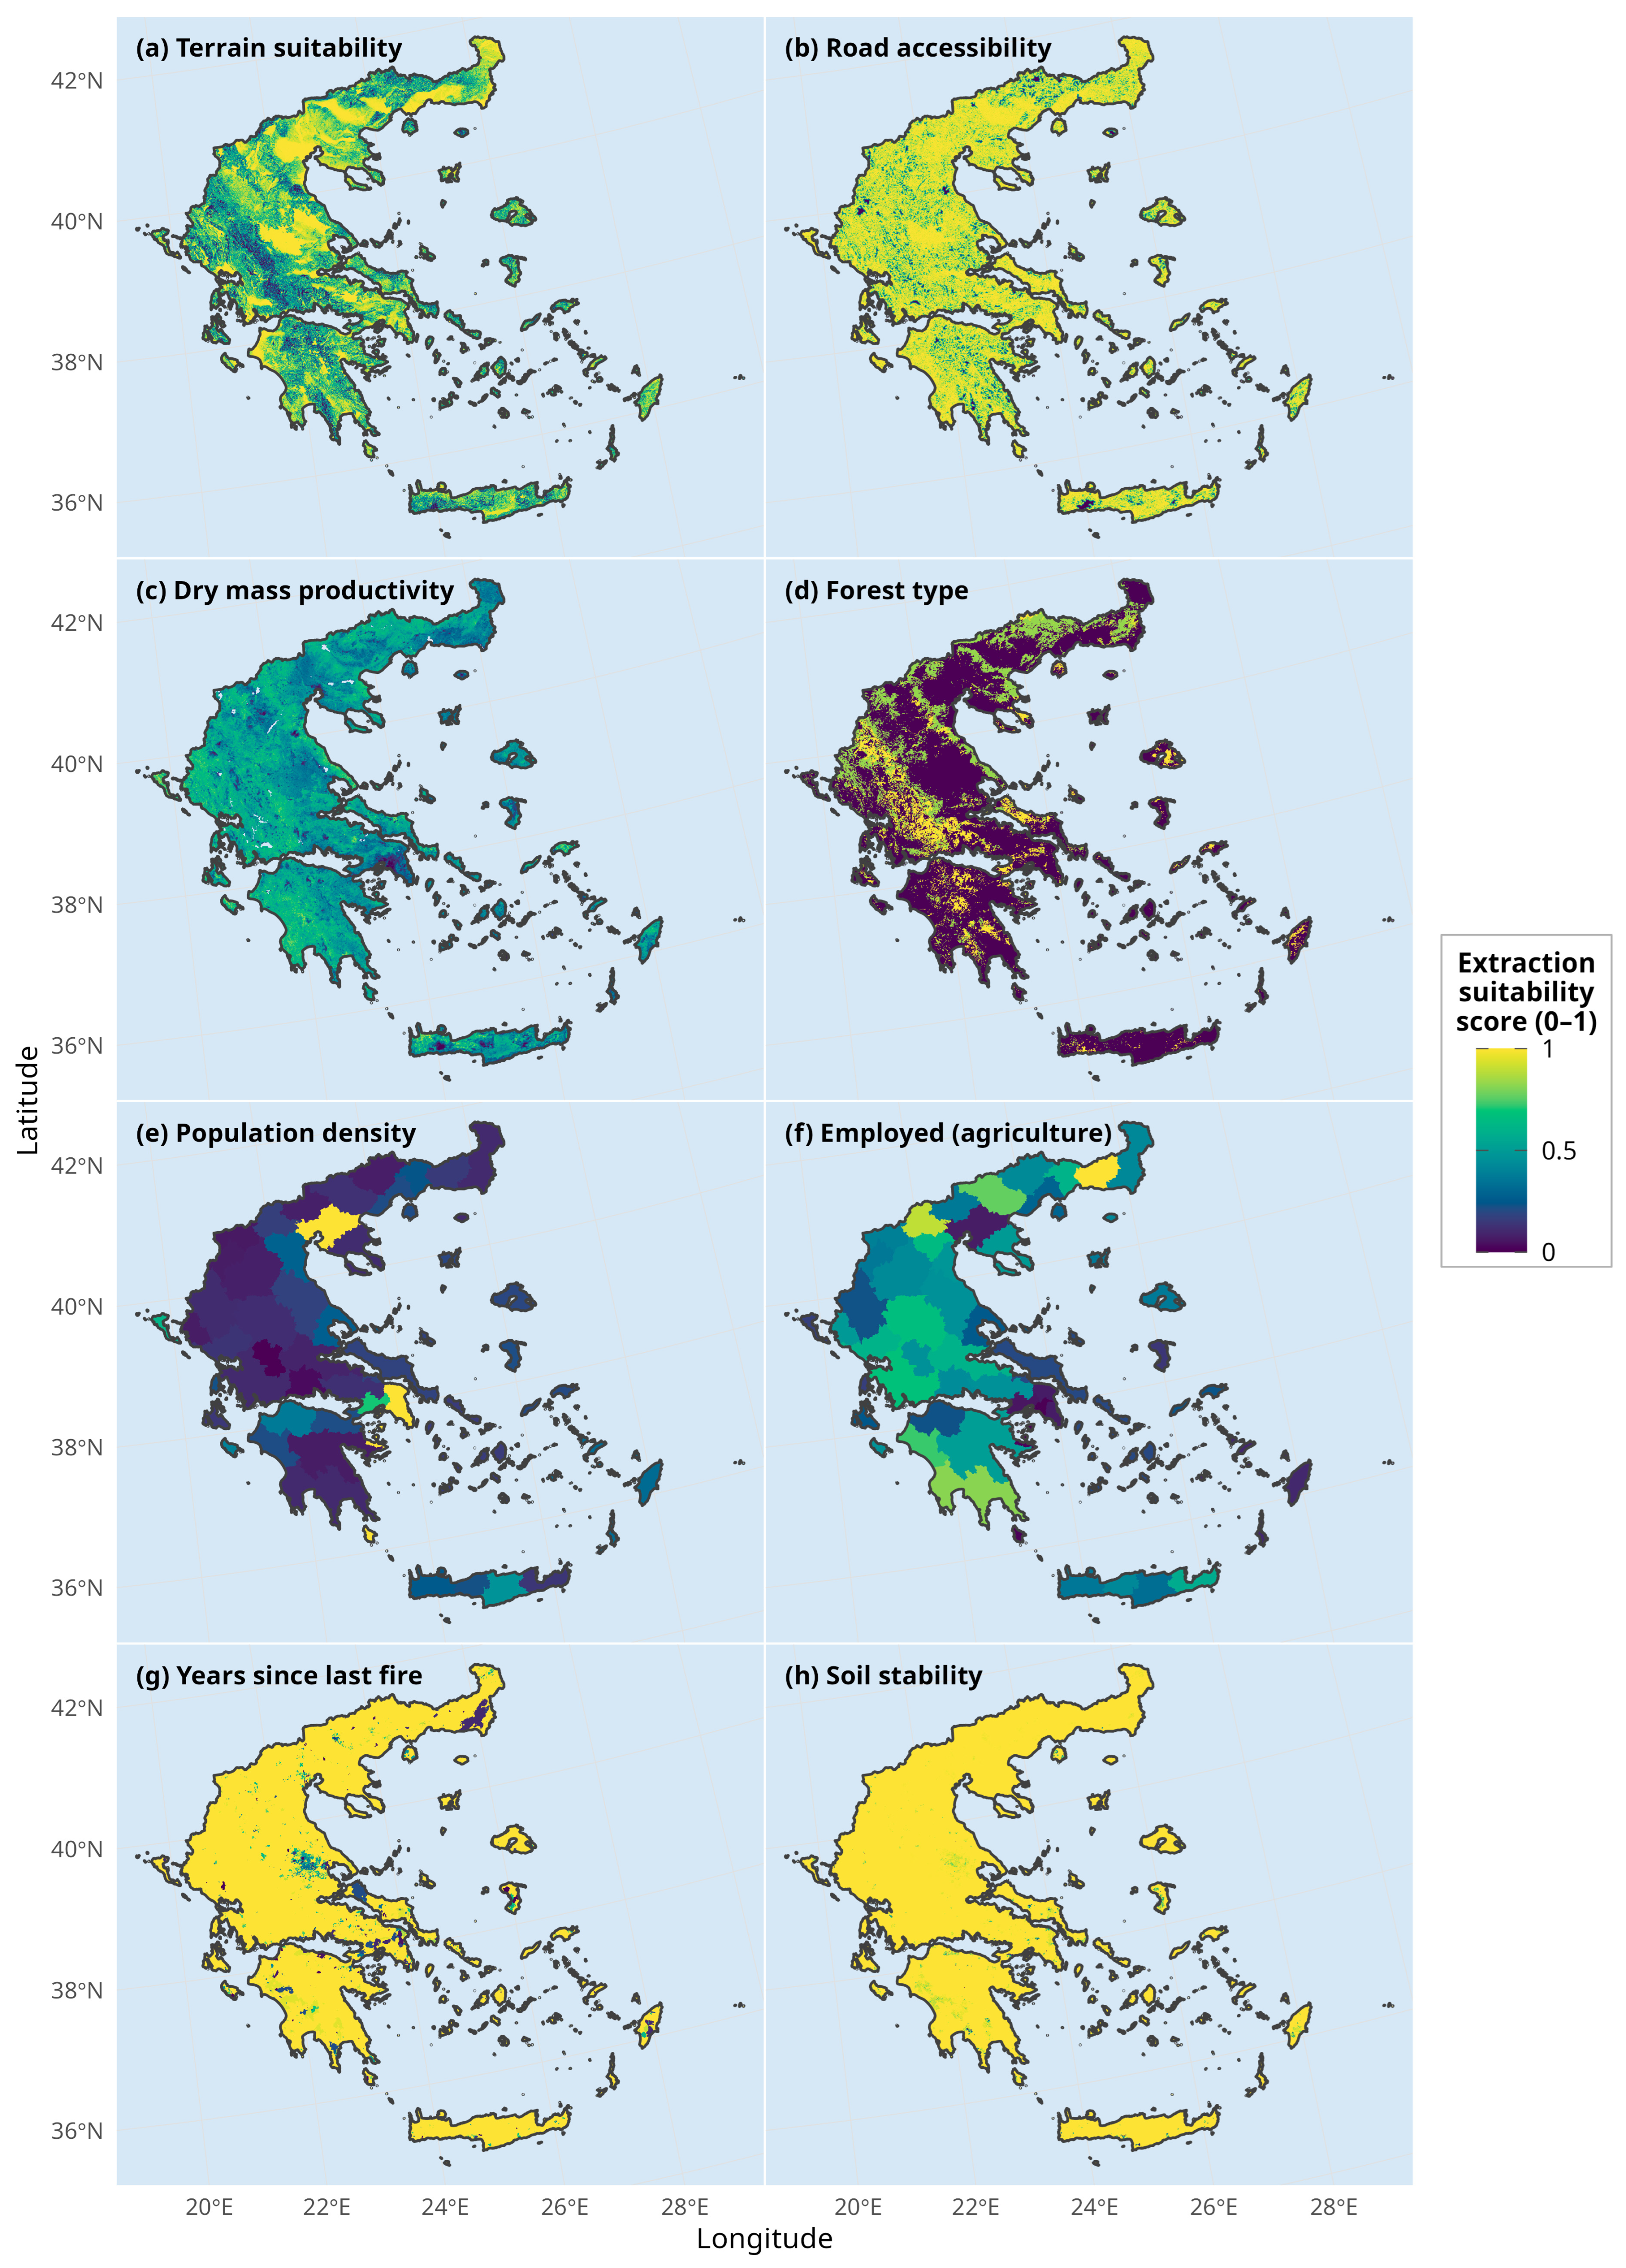
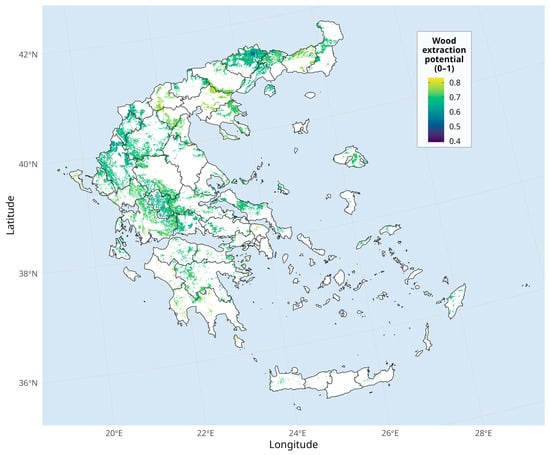
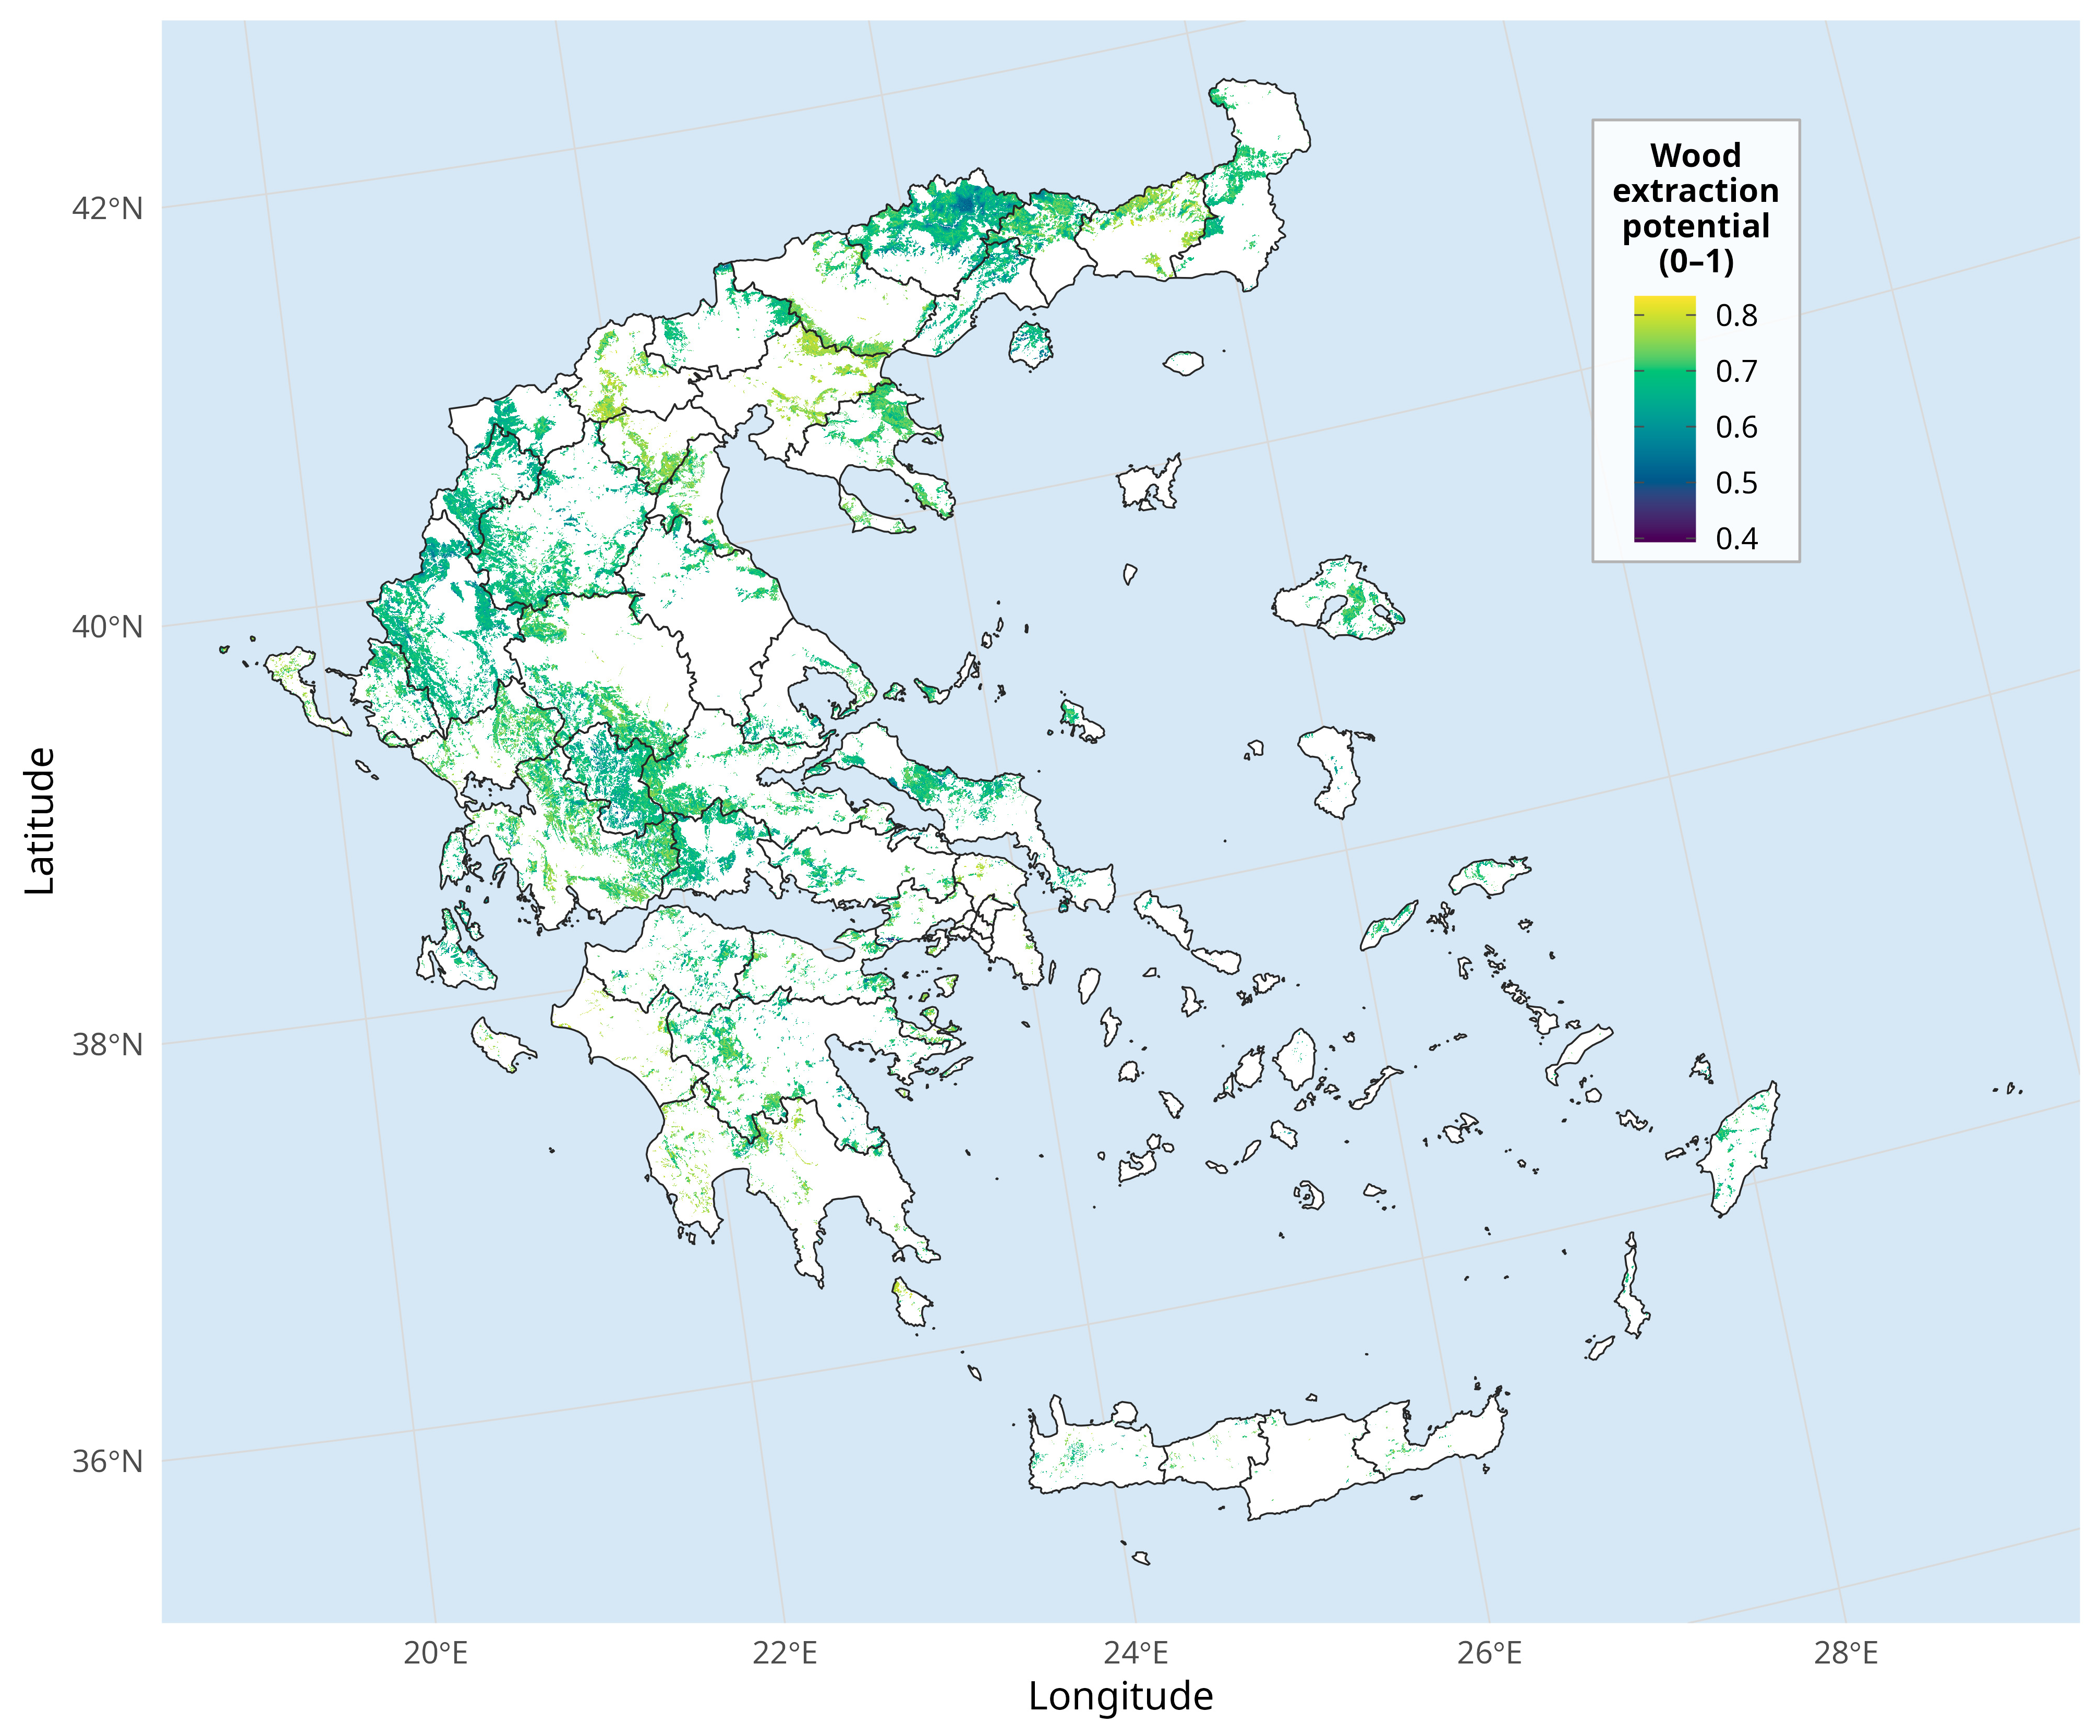
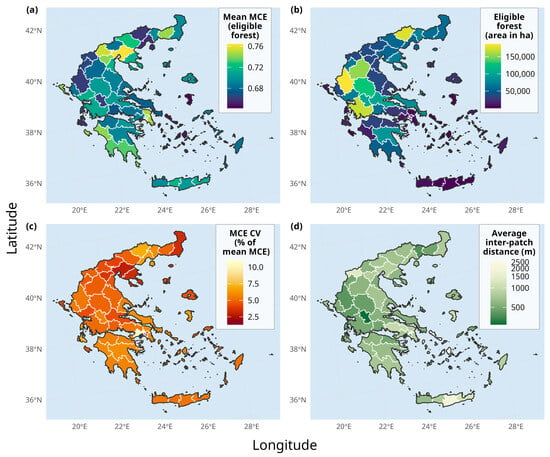
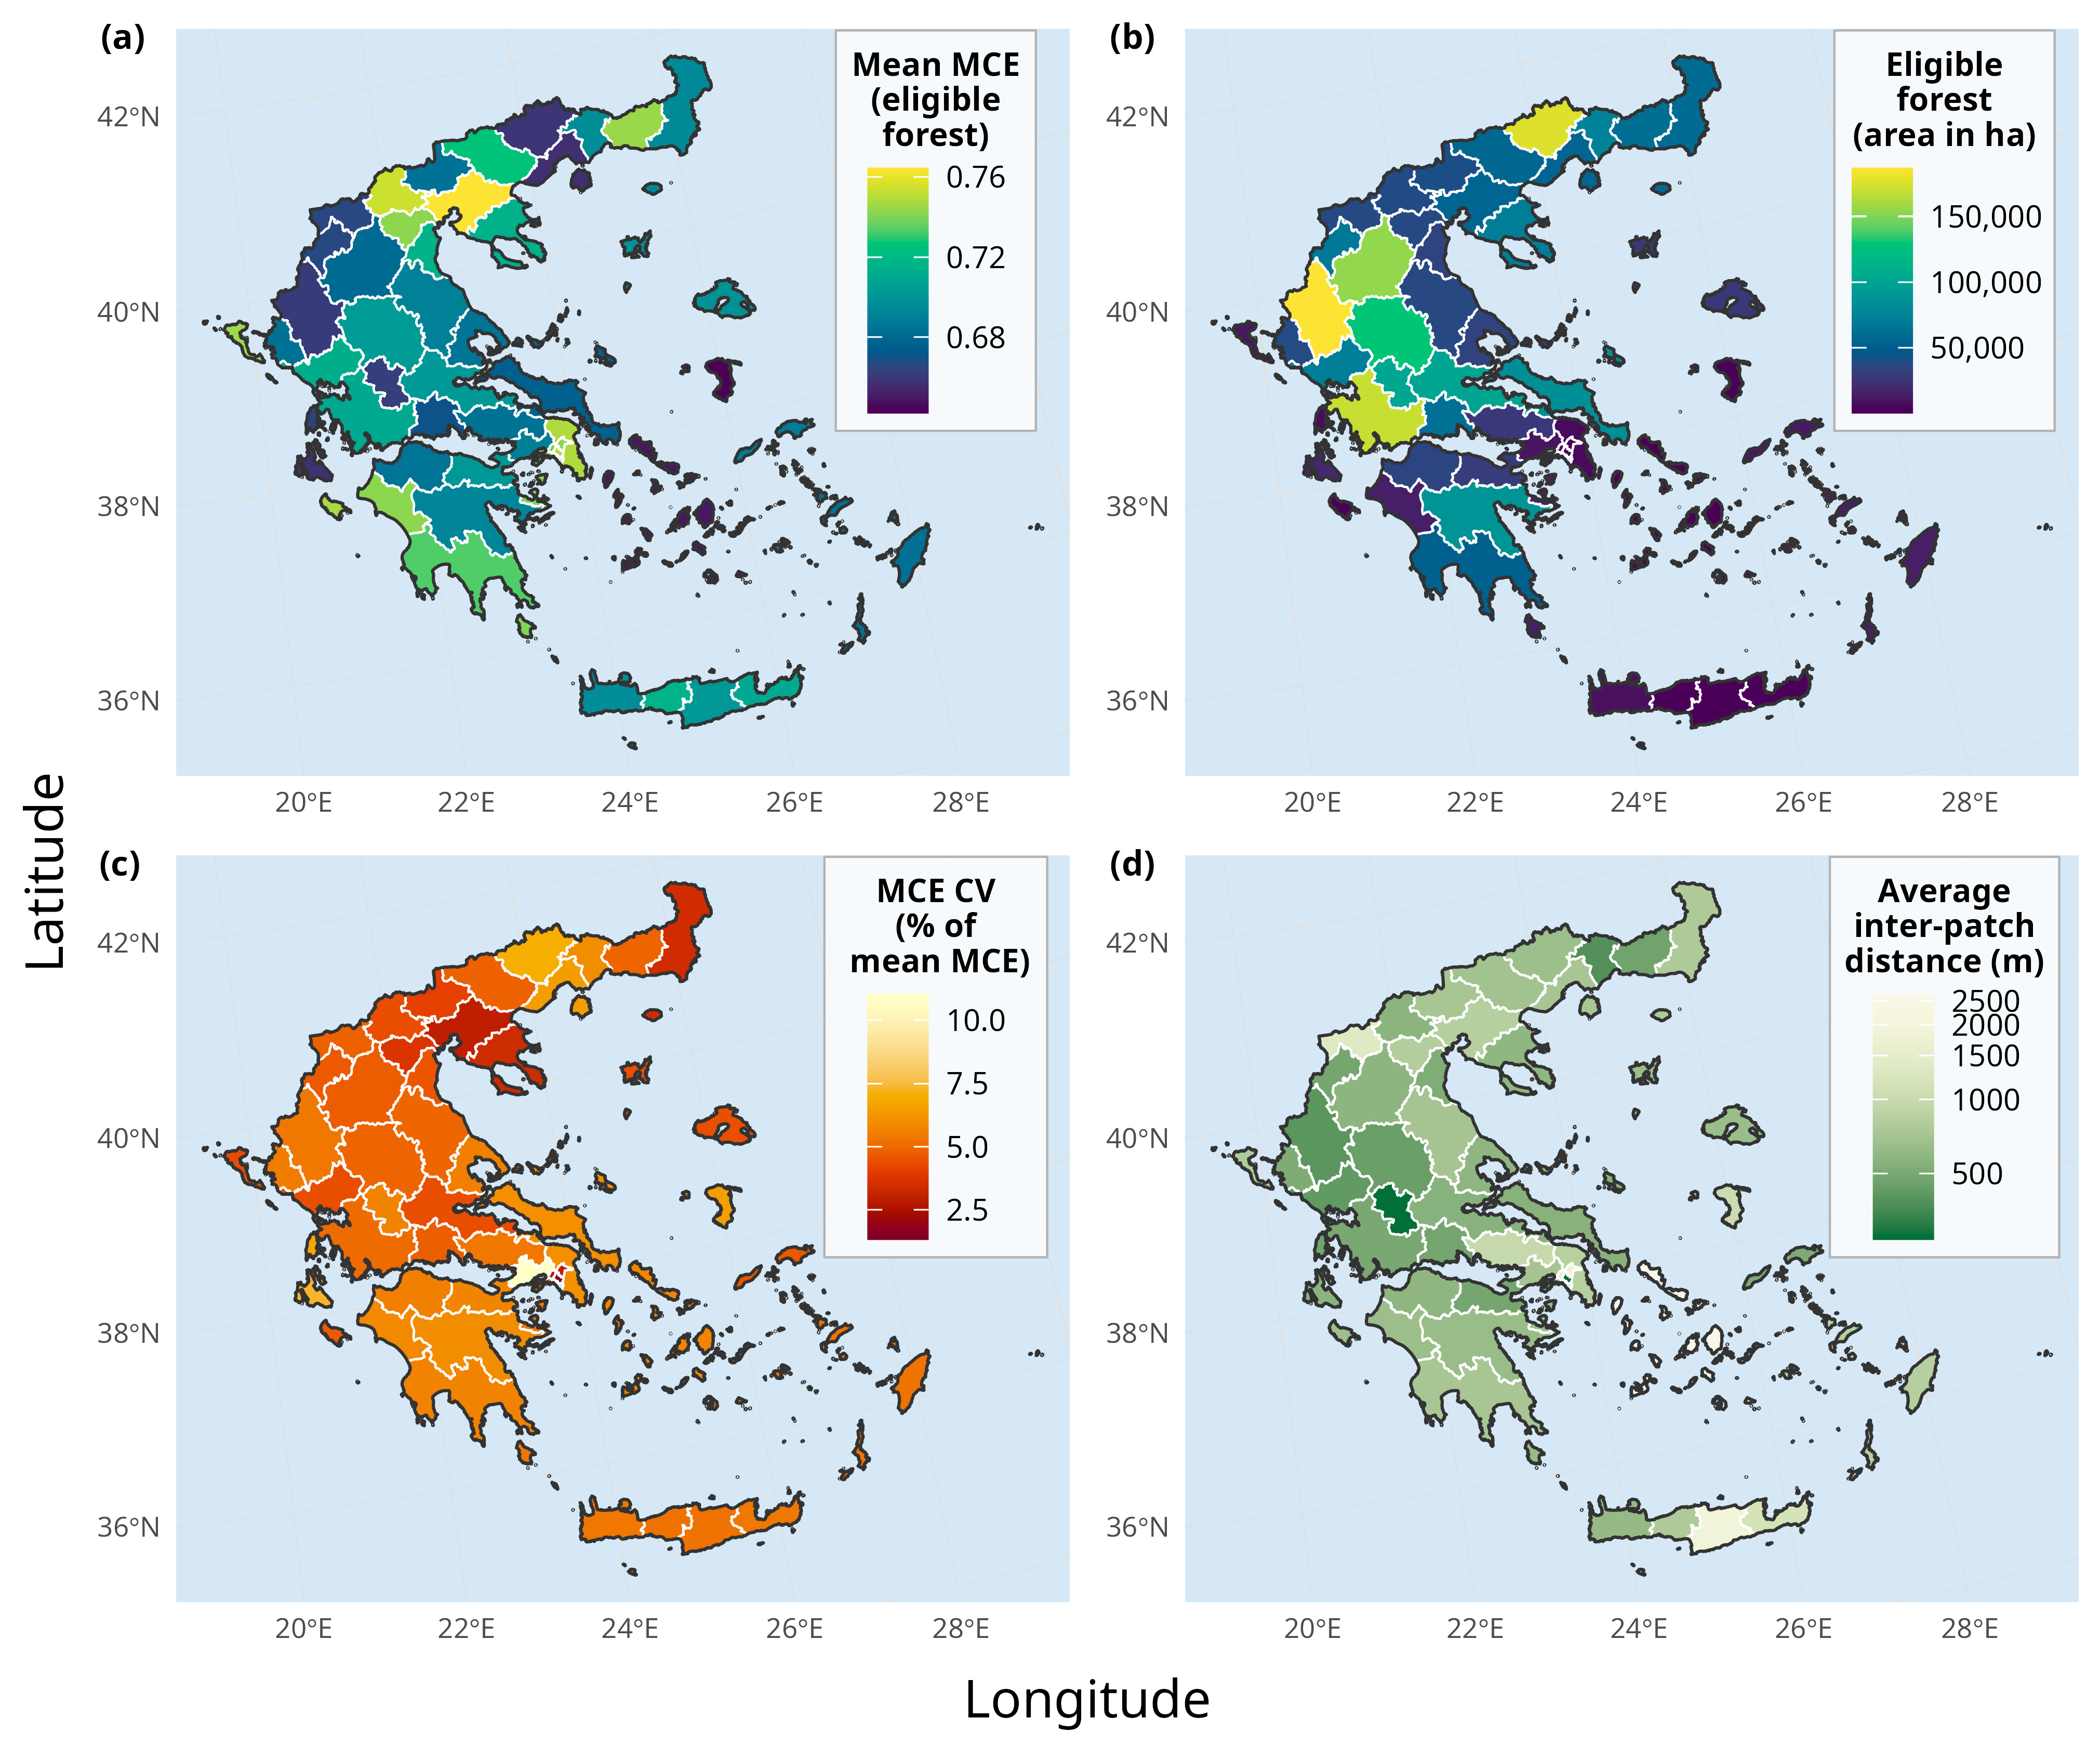
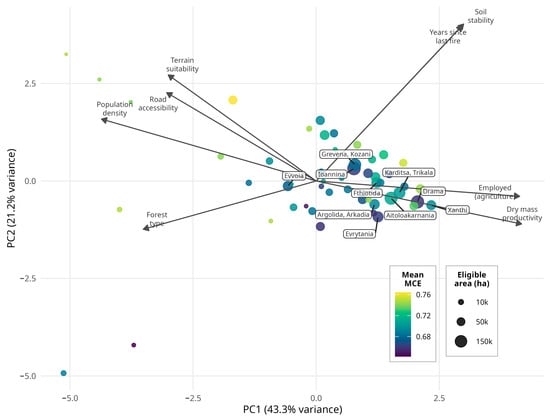
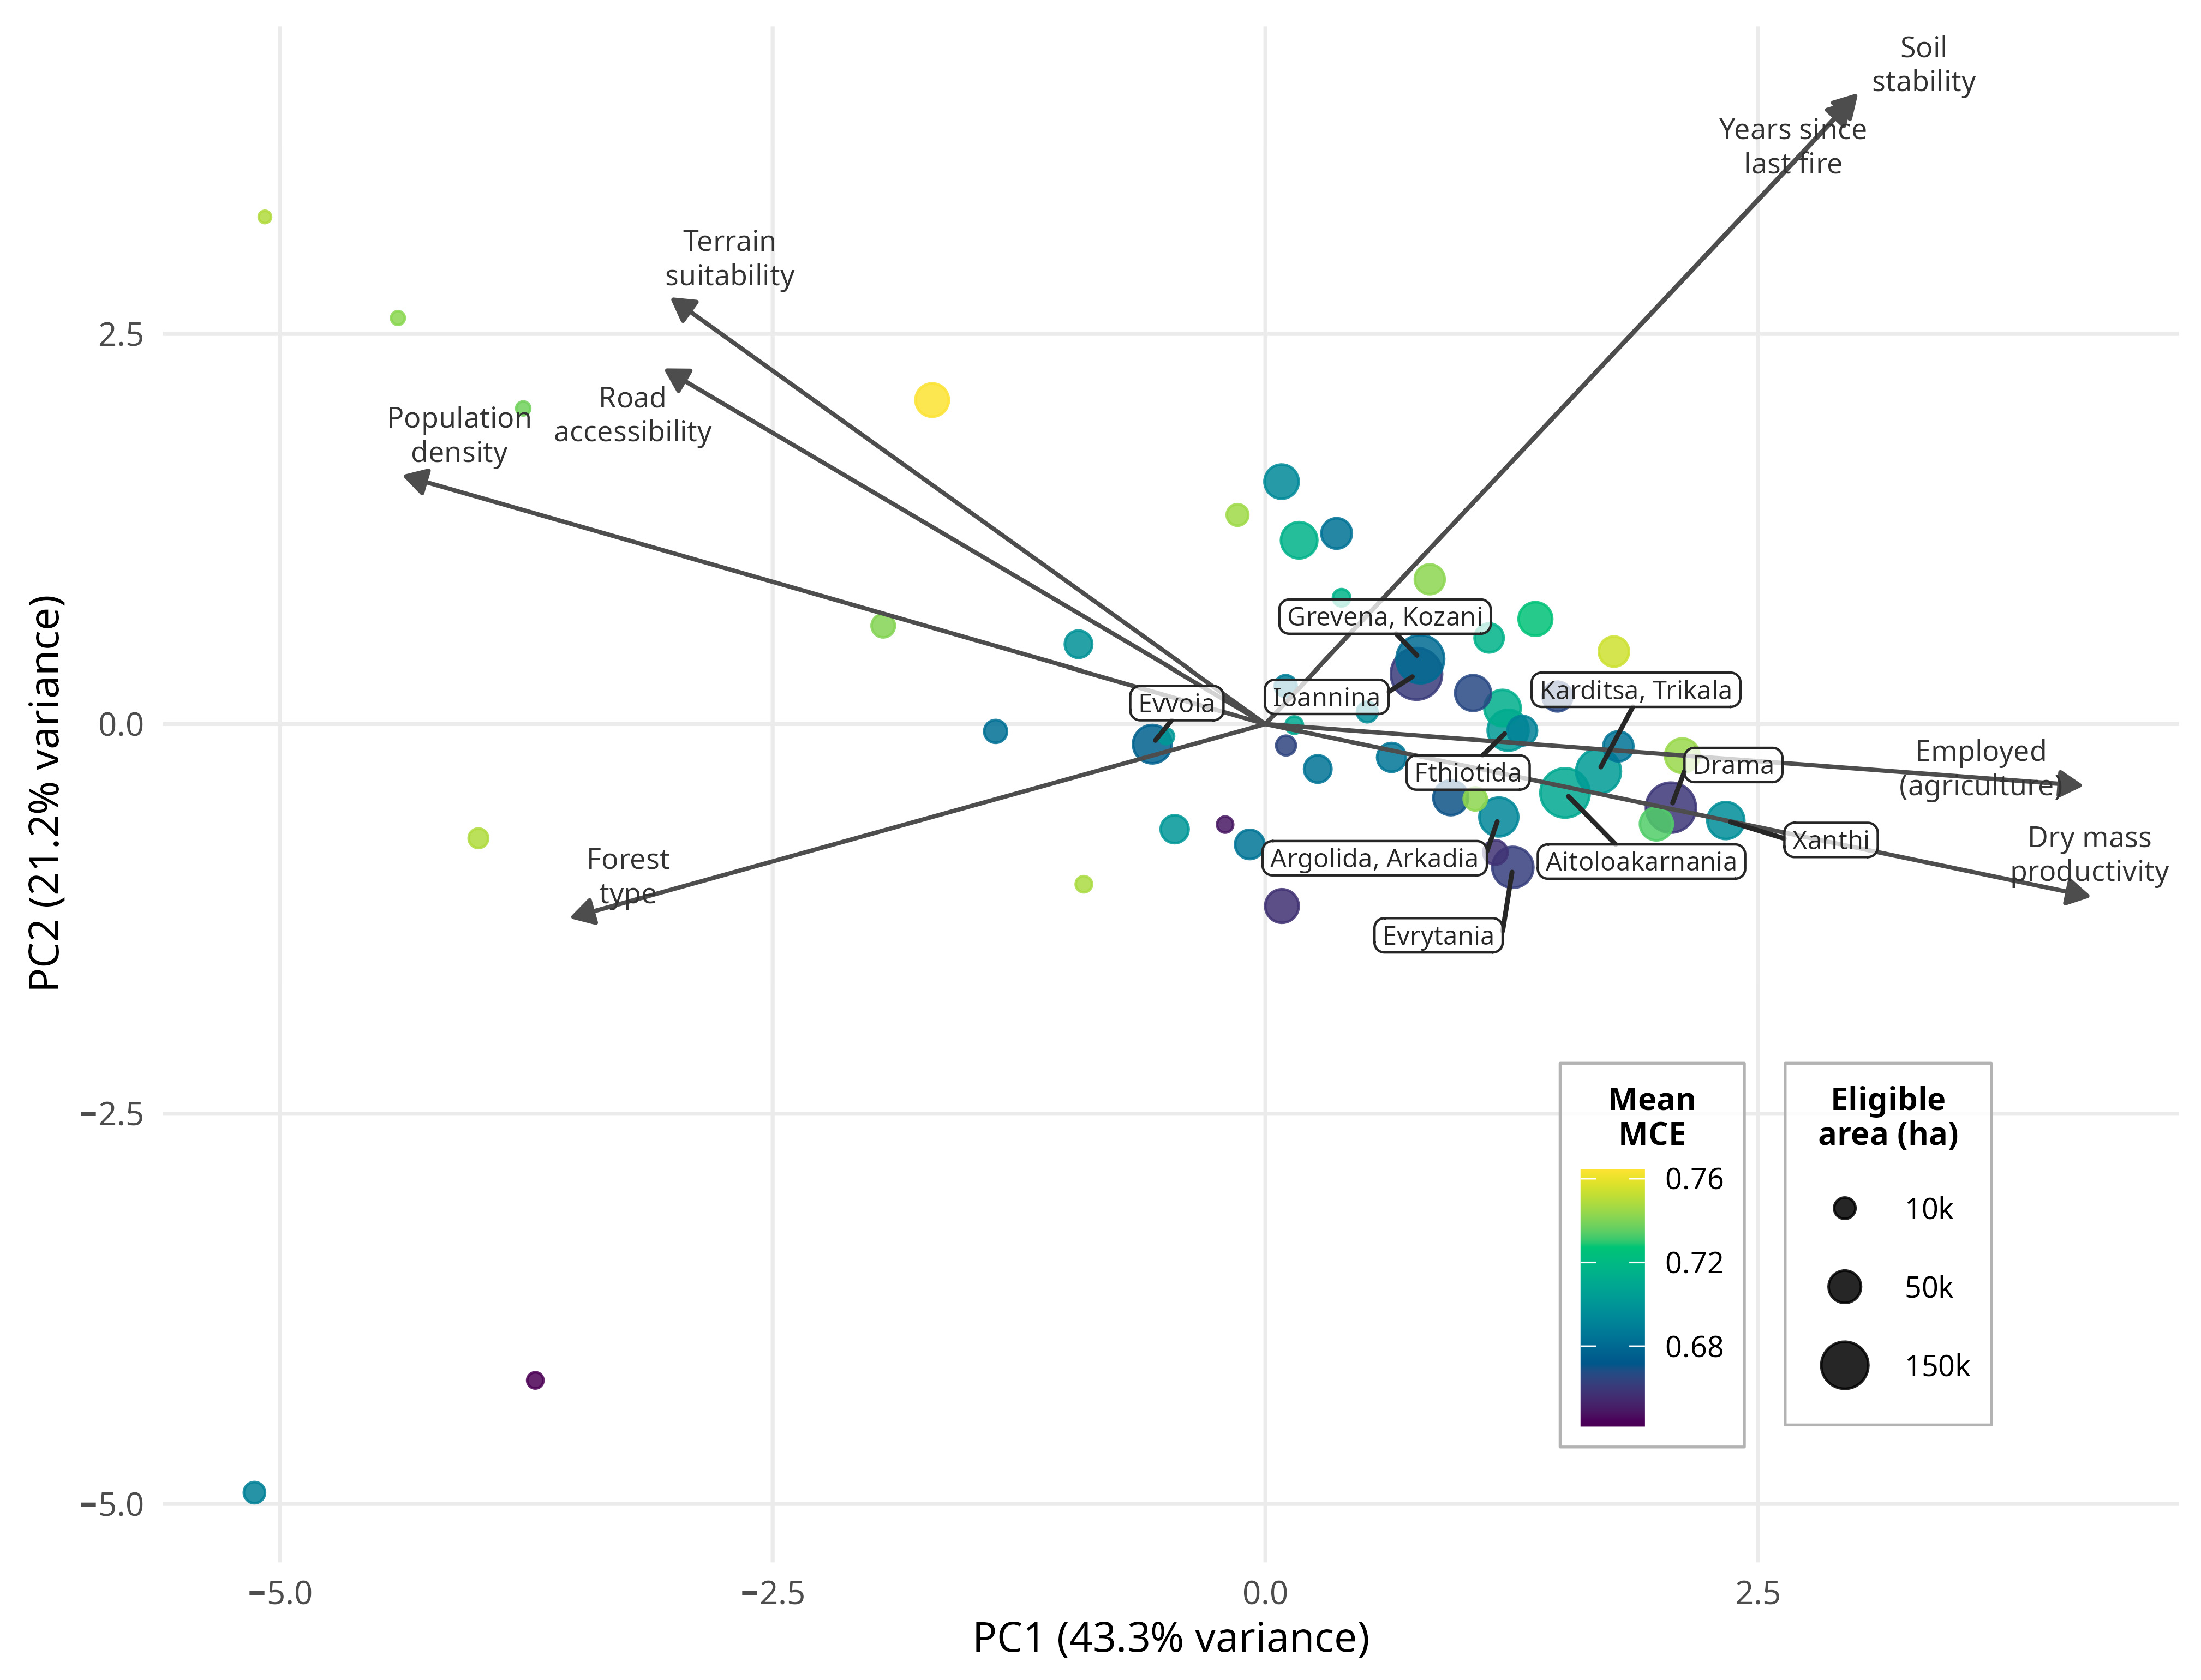
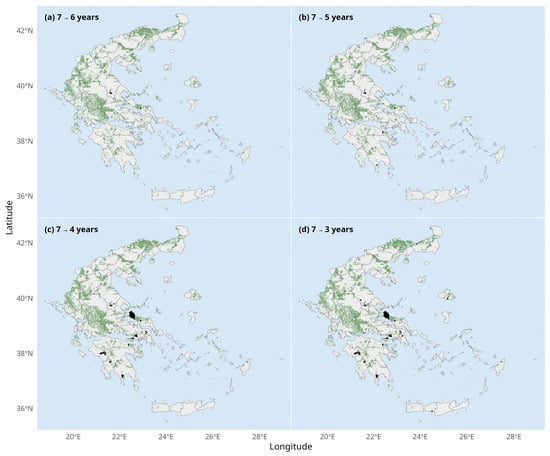
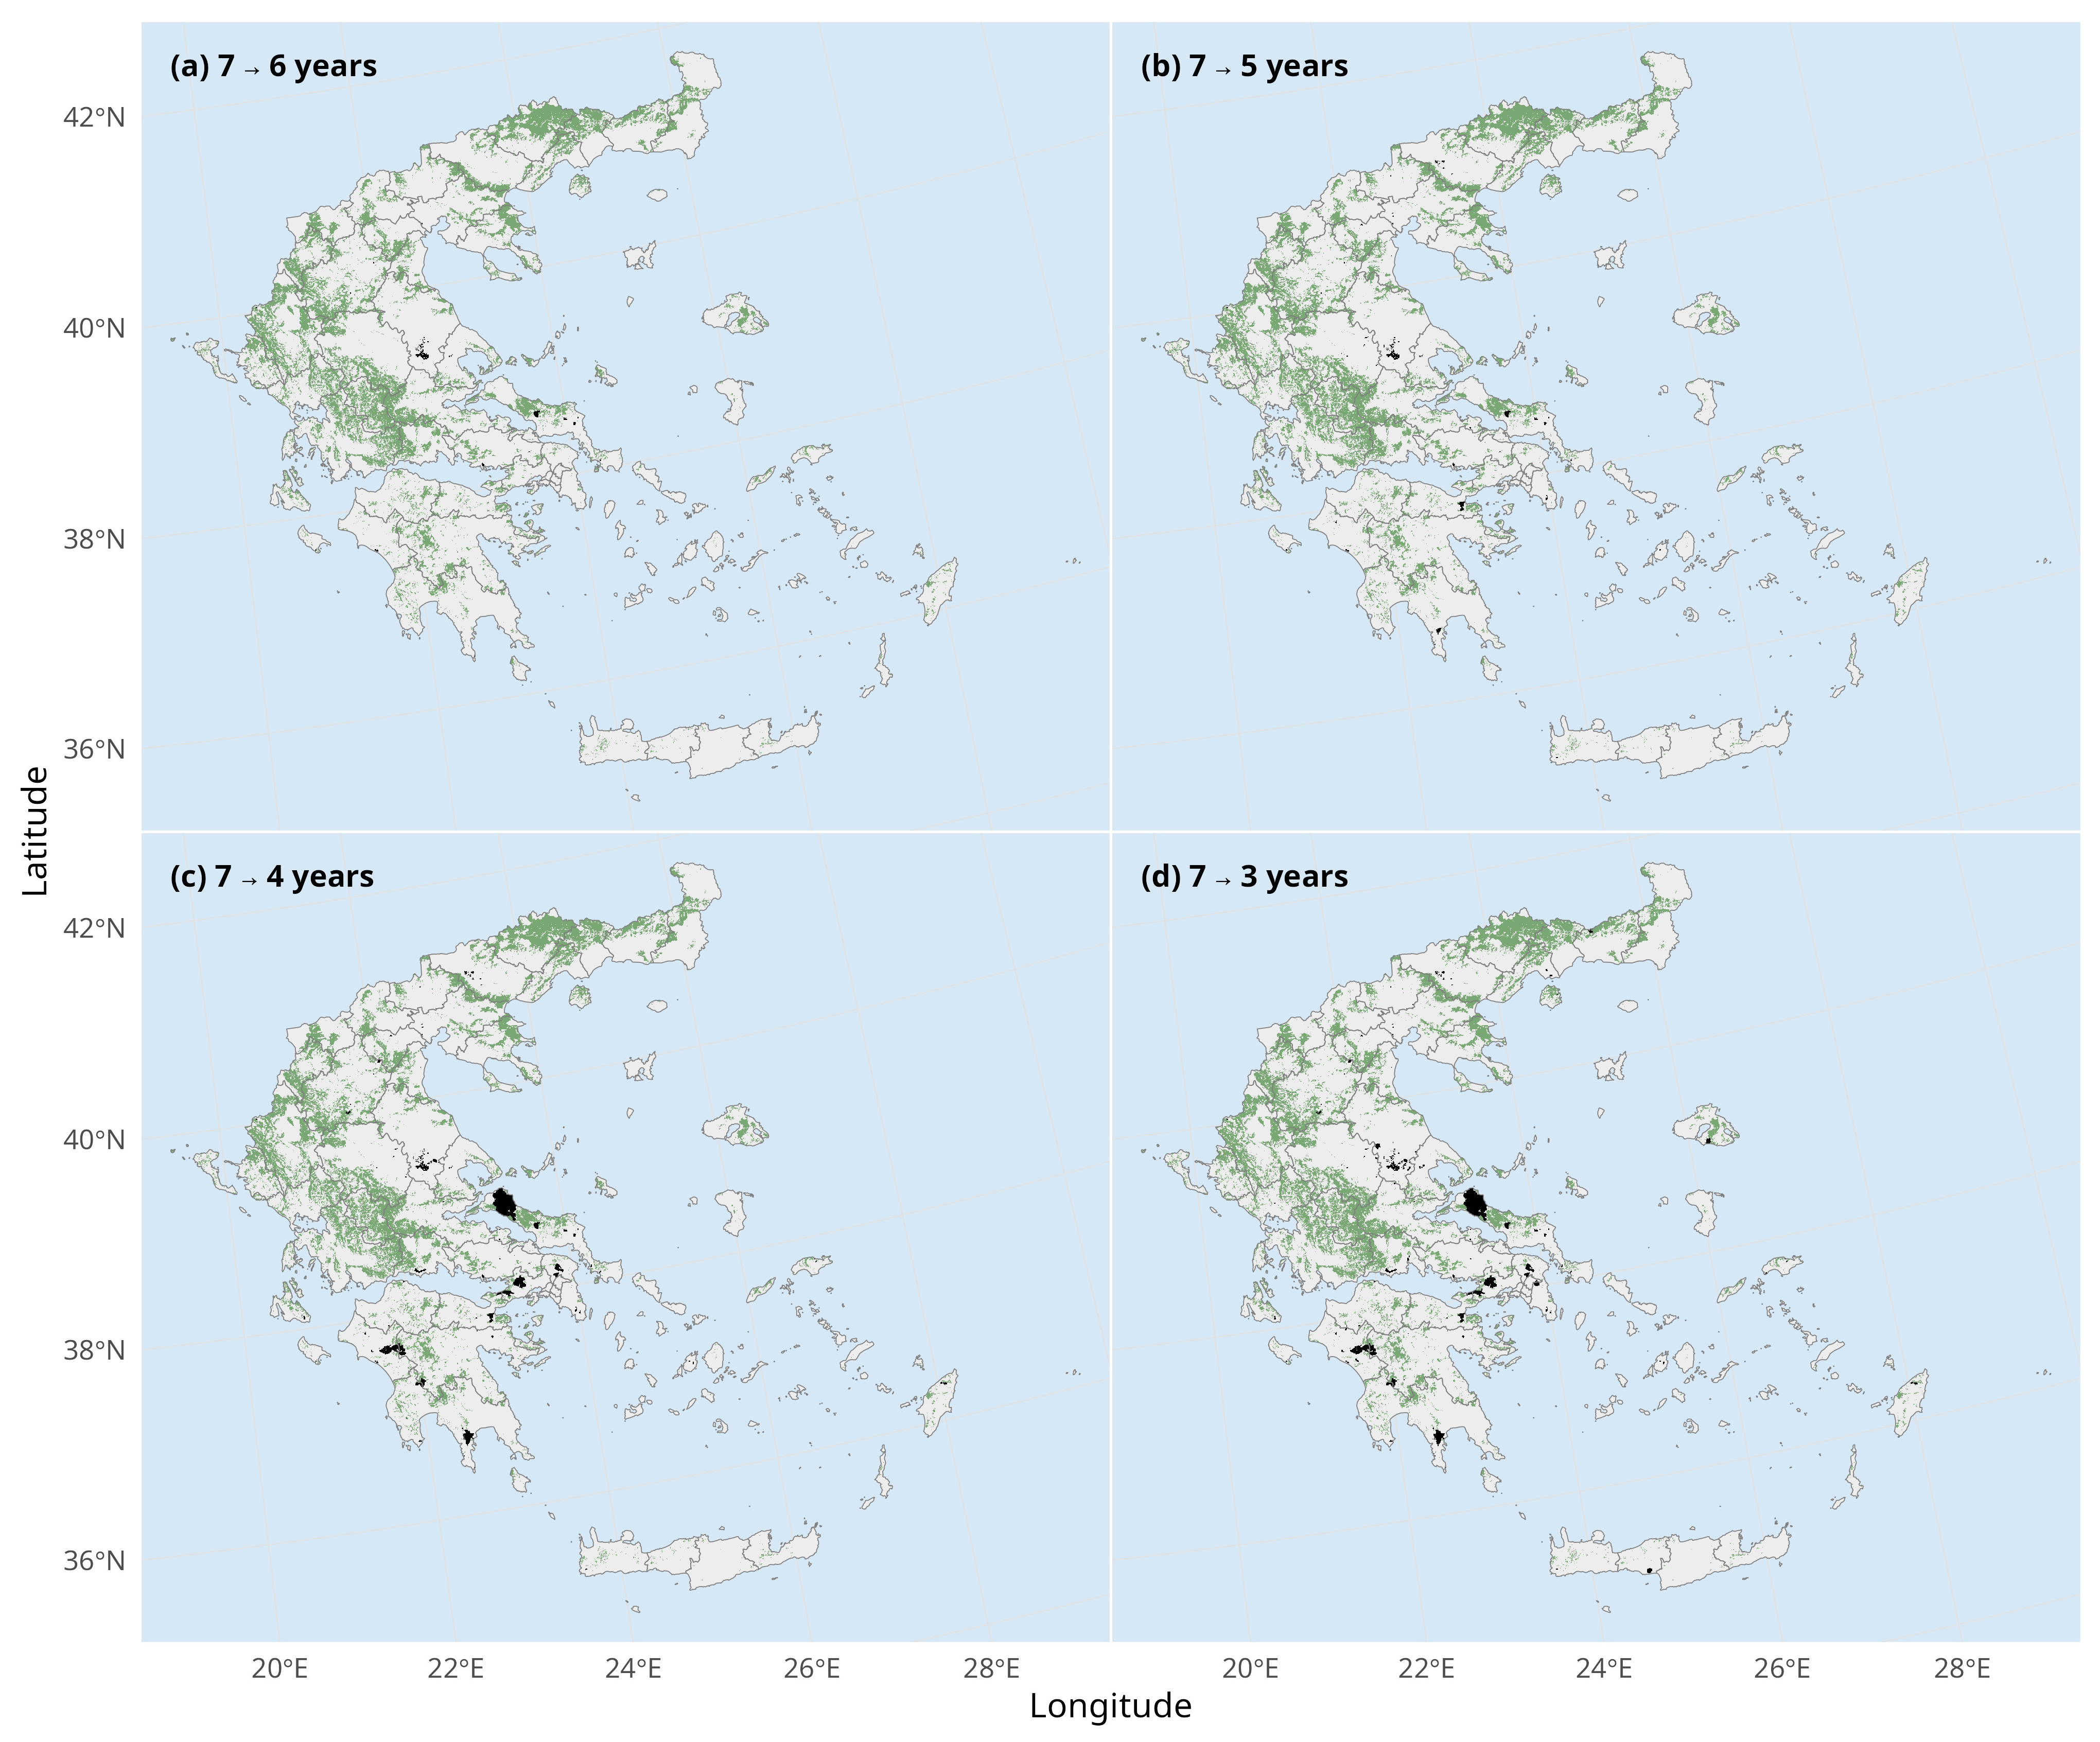
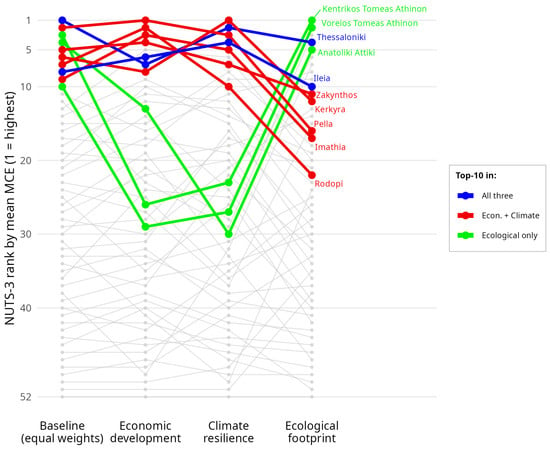
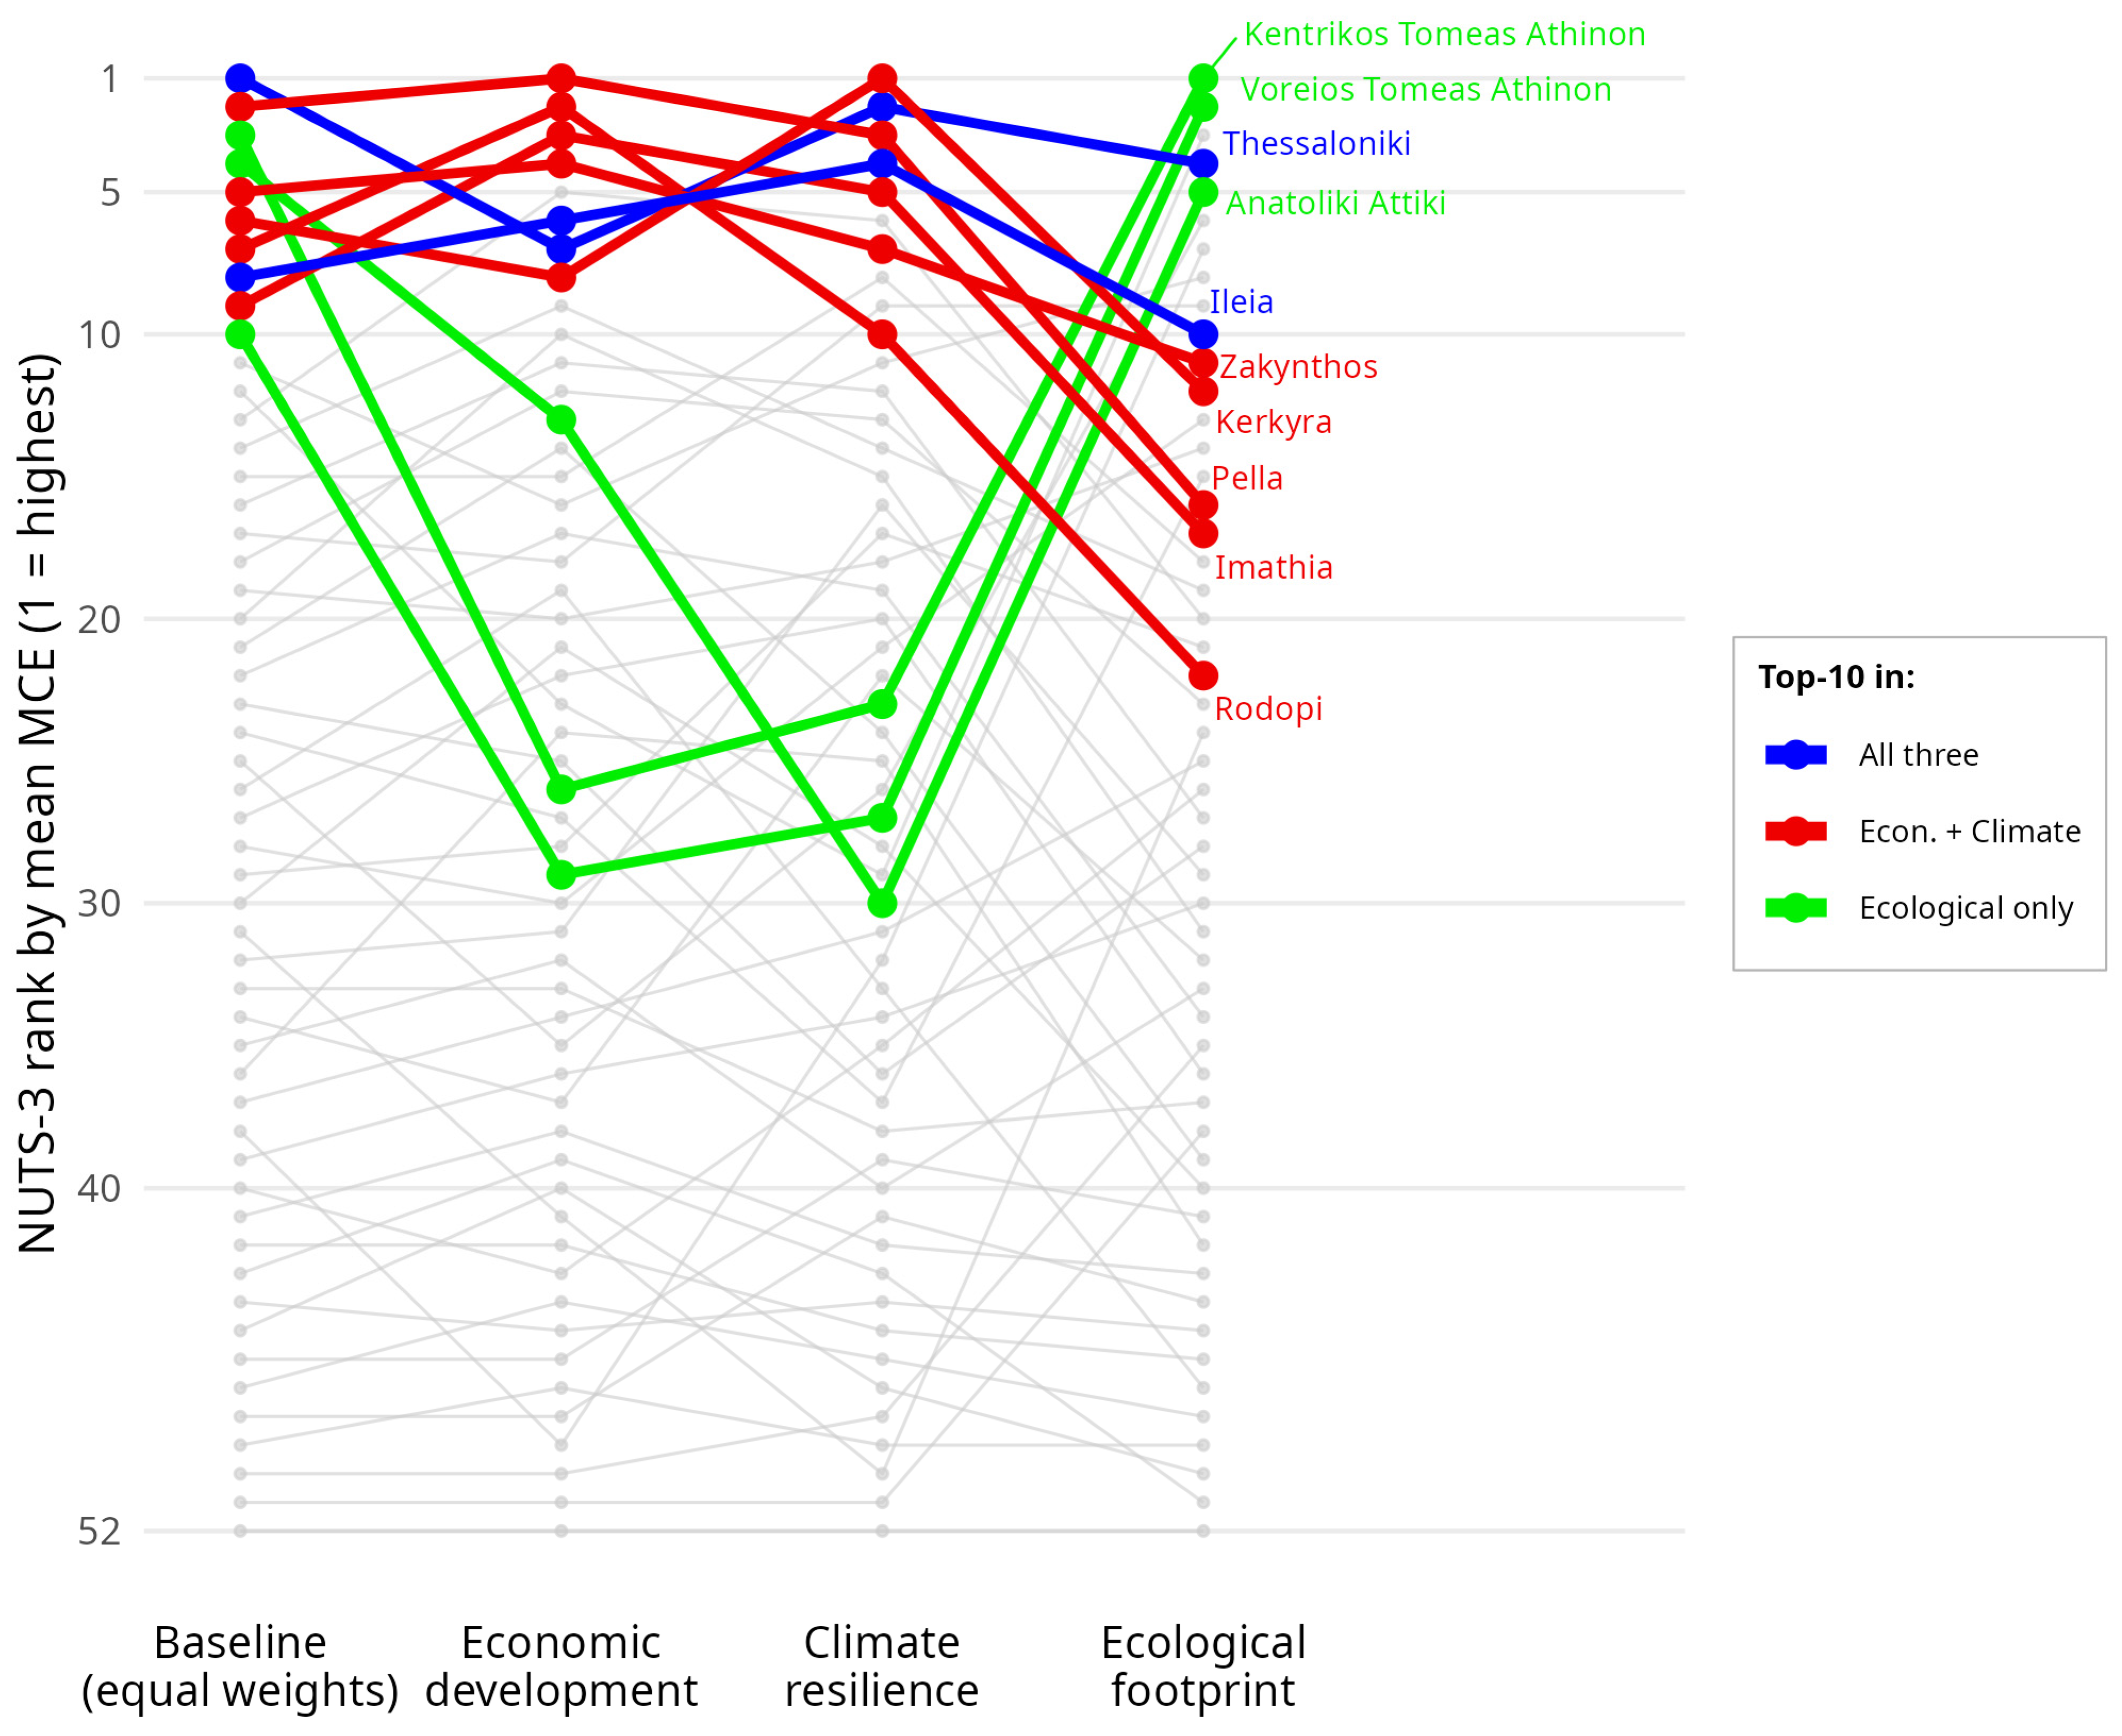
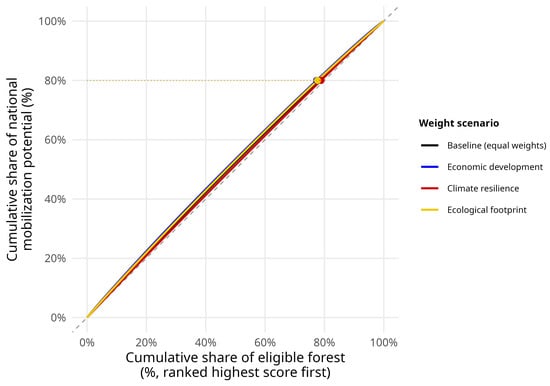
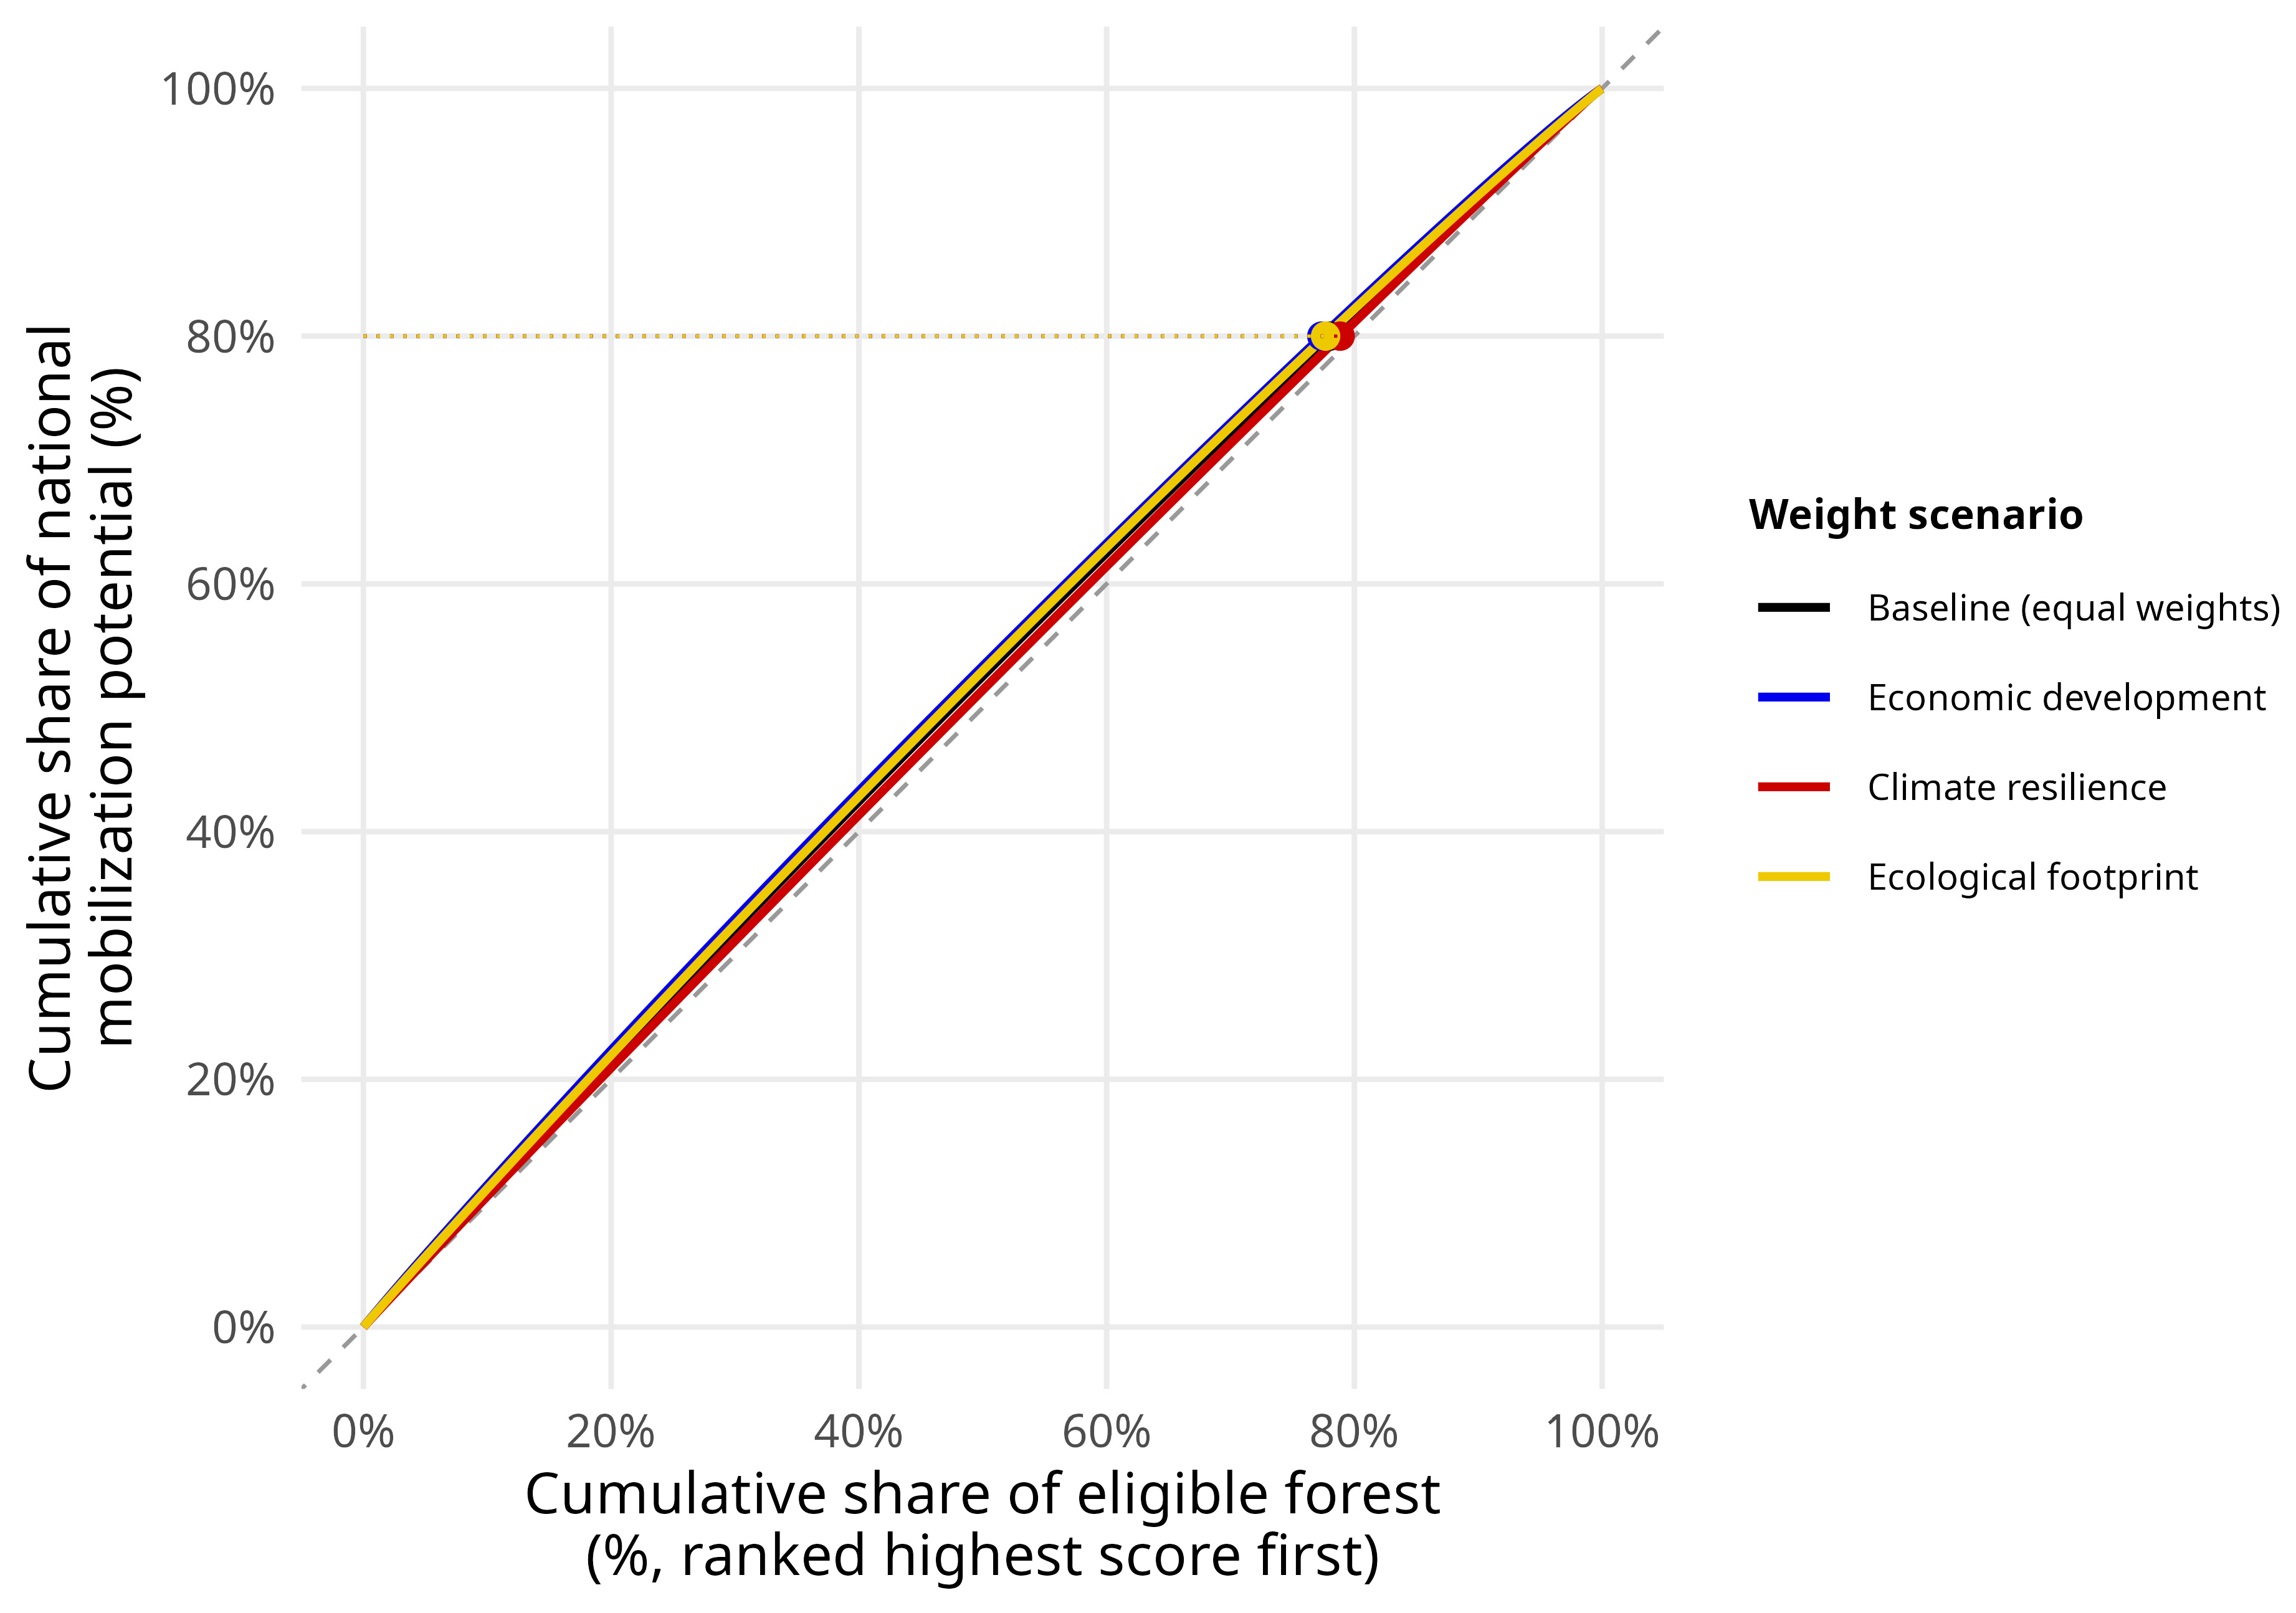

Disclaimer/Publisher’s Note: The statements, opinions and data contained in all publications are solely those of the individual author(s) and contributor(s) and not of MDPI and/or the editor(s). MDPI and/or the editor(s) disclaim responsibility for any injury to people or property resulting from any ideas, methods, instructions or products referred to in the content. |
© 2026 by the authors. Licensee MDPI, Basel, Switzerland. This article is an open access article distributed under the terms and conditions of the Creative Commons Attribution (CC BY) license.