


Abstract
Understanding how urban functional structure shapes inter-county daily mobility at fine scales is essential for sustainable polycentric planning. However, existing origin-destination (OD) models often treat regions as independent observations and lack prior policy evaluation capacity. This study proposes a Graph Convolutional Network (GCN) framework that uses 14 Points of Interest (POI) categories as functional proxies for inter-county daily mobility in 50 counties of the Greater Bay Area, China, drawing on over 6.26 million POI records and county-level mobile signaling OD data. The framework constructs a spatial adjacency graph and learns non-linear mappings between functional profiles and mobility through an encoder–decoder architecture. It achieves a test R2 of 0.766, outperforming gravity, linear, machine-learning, and graph-only baselines. Perturbation-based sensitivity analysis identifies shopping and consumption venues, catering services, corporations and enterprises, and daily life services as the categories most strongly associated with mobility, with rankings stable across perturbation magnitudes and seeds. Scenario simulations reveal heterogeneous, stage-dependent responses. A 10% increase in transport and corporate facilities in Foshan yields a mean response of 6.18%, positive across all 110 county pairs along the mature Guangzhou-Foshan corridor; corporate expansion in the peripheral Guangzhou-Zhaoqing corridor is positive for nearly all county pairs but elicits a smaller mean response; and tourism expansion in the Shenzhen-Zhongshan corridor elicits a weak, near-symmetric negative response. We propose a stage-dependent planning perspective, with mature corridors prioritizing service optimization and job-housing balance and peripheral ones prioritizing capacity investment, and stress that these responses are model-implied diagnostics requiring validation against independent mobility evidence.
1. Introduction
Urban mobility, manifested in the form of inter-regional daily mobility, constitutes the lifeblood of metropolitan economic systems. The spatial configuration of these flows, quantified by origin–destination (OD) matrices, not only reflects the daily activity patterns of residents but also reveals the underlying functional interdependencies among regions within a city-region [1]. Understanding what drives the spatial structure of daily mobility is critical for sustainable urban planning, transportation infrastructure investment, and regional economic coordination [2].
Among the myriad factors shaping inter-regional daily mobility patterns, urban functional structure—the composition and spatial organization of economic activities, services, and facilities—stands out as a fundamental determinant [3,4]. The spatial distribution of functions, where people work, what types of jobs are available, and how different economic activities are spatially organized, directly shapes the supply and demand of labor mobility across regions [5]. Regions with complementary functional profiles tend to generate systematic daily mobility flows, as workers reside in one area specialized in residential functions and commute to another area specialized in employment functions [6]. This functional specialization, driven by agglomeration and spatial division of labor, is particularly pronounced in large metropolitan regions where economic activities have become increasingly decentralized yet functionally integrated [6,7]. The resulting commuting patterns have direct consequences for transport-related greenhouse gas emissions and energy use, and they also influence social equity by determining which population groups can access employment centers within reasonable travel time. Yet despite its well-recognized conceptual importance, empirical investigations into the specific impact of urban functional structure on daily mobility flows at fine administrative scales, such as the county level, remain relatively scarce.
Conventional econometric and statistical approaches, while valuable for identifying aggregate correlations, typically treat regions as independent observations and thus fail to account for the intrinsic network dependencies inherent in OD flow data, where flows between county pairs are inherently interdependent [8,9]. Moreover, existing studies predominantly rely on coarse industrial classification schemes derived from aggregated employment censuses, which lack the spatial granularity to capture intra-city functional differentiation and often overlook the heterogeneous roles played by different service and facility categories in generating daily mobility [5,10]. Furthermore, the vast majority of current OD prediction models are designed solely for accuracy-oriented forecasting, without incorporating a policy-scenario simulation capability that could quantitatively assess the daily mobility consequences of alternative land-use and infrastructure investment strategies, a function urgently needed for evidence-based regional planning [2,11]. Such simulation capability is particularly critical for sustainability-oriented planning, because it allows prior evaluation of how proposed interventions, such as relocating industrial parks, improving transit connectivity, or adjusting land-use mix, would affect travel distances, modal shares, and consequently the carbon footprint of daily mobility, as well as the spatial equity of job accessibility across different counties.
Recent advances in deep learning, particularly Graph Convolutional Networks (GCNs), offer a promising avenue to address these limitations [12,13]. By operating directly on non-Euclidean spatial graphs, GCNs can naturally encode the topological relationships among geographic units and capture higher-order spatial dependencies that traditional models miss [14]. Beyond predictive power, GCNs can be readily adapted to simulate counterfactual scenarios, making them valuable tools for sustainability decision-making because they allow planners to test the mobility outcomes of alternative industrial and infrastructure policies before implementation. However, existing GCN applications in transportation have been predominantly confined to link-level traffic forecasting or city-level aggregated demand prediction, with surprisingly few attempts to model fine-grained inter-county OD flows, let alone to link such predictions explicitly to urban functional characteristics [15,16].
To bridge these gaps, this study proposes a GCN-based analytical framework that integrates three components: a spatial adjacency graph of county-level contiguity, a high-resolution node feature matrix from 14 POI categories as functional proxies, and a scenario simulation module for systematic policy perturbation analysis. Applied to 50 county-level units in the GBA with daily OD flows, the framework enables county-level OD prediction, sensitivity-based identification of influential functional categories, and advanced assessment of policy scenarios. Methodologically, it extends GCN application from link-level forecasting to county-level OD modeling; analytically, it provides a systematic ranking of functional categories by their model-implied marginal mobility associations; practically, it offers a scenario simulation tool for designing spatially equitable and resource-efficient land-use–transport interventions. Collectively, these contributions directly resonate with the core sustainability agenda by equipping planners with evidence to balance economic efficiency, social equity, and environmental quality in regional development.
2. Literature Review
2.1. Graph Convolutional Networks for Origin–Destination Flow Modeling
The modeling of OD flows has long been a central concern in transportation geography and regional science. Classical approaches, most notably the gravity model, posit that spatial interaction between two regions is proportional to their respective “masses” (commonly measured by population or economic output) and inversely related to the spatial distance separating them [17,18]. While parsimonious and theoretically grounded, gravity-type models rely on strong parametric assumptions that often fail to capture the complex, non-linear dependencies inherent in real-world mobility systems [19,20]. Alternative formulations, such as the intervening opportunities model and radiation model, have addressed some of these limitations but remain constrained by their aggregate-level specification and limited capacity to incorporate multi-dimensional regional attributes.
The advent of deep learning, and particularly Graph Neural Networks (GNNs), has opened new avenues for transportation modeling. Unlike conventional neural networks that assume Euclidean input structures, GNNs can naturally represent non-Euclidean spatial relationships, making them ideally suited for capturing the complex interdependencies among regions in a transportation network [21,22]. Among GNN variants, GCNs have emerged as a particularly powerful tool for spatial flow data, as they efficiently aggregate feature information from neighboring nodes through spectral or spatial graph convolutions [12,22].
A growing body of research has applied GCNs and their variants to various traffic forecasting problems [21,23]. Studies have demonstrated the effectiveness of GCNs for link-level traffic speed and volume prediction, ride-sourcing demand forecasting, and public transit OD flow estimation [24,25,26]. Wang et al. [26] proposed a two-stage GCN-GRU network for large-scale urban rail transit OD prediction, demonstrating that graph-based architectures effectively capture both spatial adjacency and temporal periodicity in passenger flows. More recently, researchers have extended GCN frameworks to OD-level demand prediction, often combining them with recurrent neural networks or attention mechanisms to capture temporal dynamics [12,14,27]. Jiao and Zhang [28] developed a hierarchical spatiotemporal graph–hypergraph network for urban traffic flow prediction, framing their contribution within the sustainable intelligent transportation systems agenda and underscoring that GNN-based prediction models can serve as decision-support instruments for reducing congestion and promoting efficient urban mobility. These studies have consistently shown that GNN-based approaches outperform traditional statistical and machine learning methods by jointly modeling spatial correlations and capturing higher-order network effects that are invisible to pairwise interaction models [15,29].
However, most existing GCN applications in transportation remain focused on link-level traffic states (e.g., road segments) or city-aggregated demand, with surprisingly limited attention to fine-grained inter-county OD flow prediction [15,16]. Furthermore, the node features in these models are typically derived from coarse demographic or economic aggregates, which lack the spatial resolution to capture intra-urban functional heterogeneity [5]. These methodological gaps motivate the present study’s use of high-resolution POI data as node features in a GCN-based OD prediction framework, enabling a more nuanced representation of regional functional profiles than has been achieved in prior GCN applications.
2.2. Urban Functional Structure and Mobility Patterns
The relationship between urban functional structure and mobility patterns has been extensively investigated in urban economics and transportation geography. The fundamental premise is that the spatial distribution of employment opportunities, determined by the location and composition of industries, shapes where people work and, consequently, how they commute. Regions with different industrial specializations attract different types of workers and generate distinct patterns of daily mobility [30,31].
Empirical studies have examined this relationship from multiple angles. Research on Chinese cities has investigated how industrial dynamics affect changing commuting patterns in megacities, highlighting the tensions and potential reconciliations between industrial transition and commuting efficiency [4]. Studies on intercity migration have found that higher levels of industrial structure rationalization and non-agricultural industrial development are associated with greater in-migration and lower out-migration [32]. Within the GBA context, researchers have examined how commuting efficiency varies dramatically across different industry sectors, with findings that have directly informed regional infrastructure planning [30].
Nevertheless, most existing studies on industrial structure and daily mobility rely on econometric or statistical approaches that model aggregate relationships at the city or prefecture level. These approaches typically treat regions as independent observations and struggle to capture the network structure of daily mobility, the fact that flows between region pairs are interdependent and collectively constitute a spatially embedded network. Moreover, these studies typically use coarse industrial classification schemes derived from official employment censuses, which are updated infrequently and lack the spatial granularity to capture intra-city functional differentiation [33].
In recent years, POI data have emerged as a valuable alternative source for characterizing urban functional landscapes. POIs represent individual facilities and services with precise geographic coordinates, enabling researchers to capture the fine-grained spatial distribution of economic activities and public services [34,35]. Studies have used POI data to delineate urban functional zones, assess the vitality of commercial districts, and even estimate population distributions [36,37]. However, the application of POI data as predictors of inter-regional daily mobility, particularly within a graph-based deep learning framework, remains surprisingly underexplored. Given that different POI categories, such as corporations and enterprises, financial institutions, tourist attractions, and transportation hubs, directly reflect the employment and service functions that generate daily mobility, they offer a theoretically sound and empirically rich proxy for urban functional structure at fine spatial scales [33,38]. This study fills this gap by integrating POI-derived functional profiles as node features in a GCN architecture, thereby enabling both accurate OD prediction and interpretable analysis of which functional categories are most strongly associated with inter-county mobility.
In summary, the literature review reveals that while GCNs have proven effective for spatial flow modeling, their application to fine-grained county-level OD prediction using high-resolution functional proxies remains limited. Likewise, while the conceptual link between urban functional structure and daily mobility is well established, empirical quantification at fine spatial scales using facility-level data is lacking. Furthermore, the absence of policy-scenario simulation capabilities in existing OD prediction models represents a critical gap for planning applications. The framework proposed in this study directly addresses these three gaps by combining GCN-based spatial learning, POI-derived functional characterization, and systematic scenario simulation within a unified analytical architecture applied to the GBA.
3. Materials and Methods
3.1. Study Area
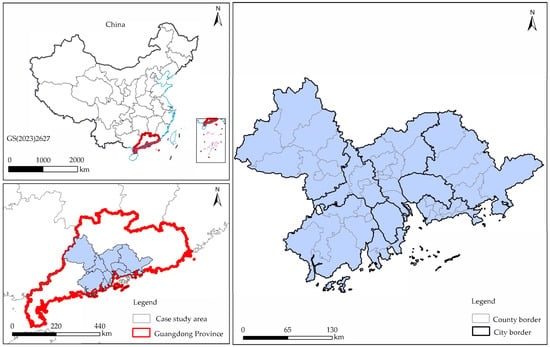
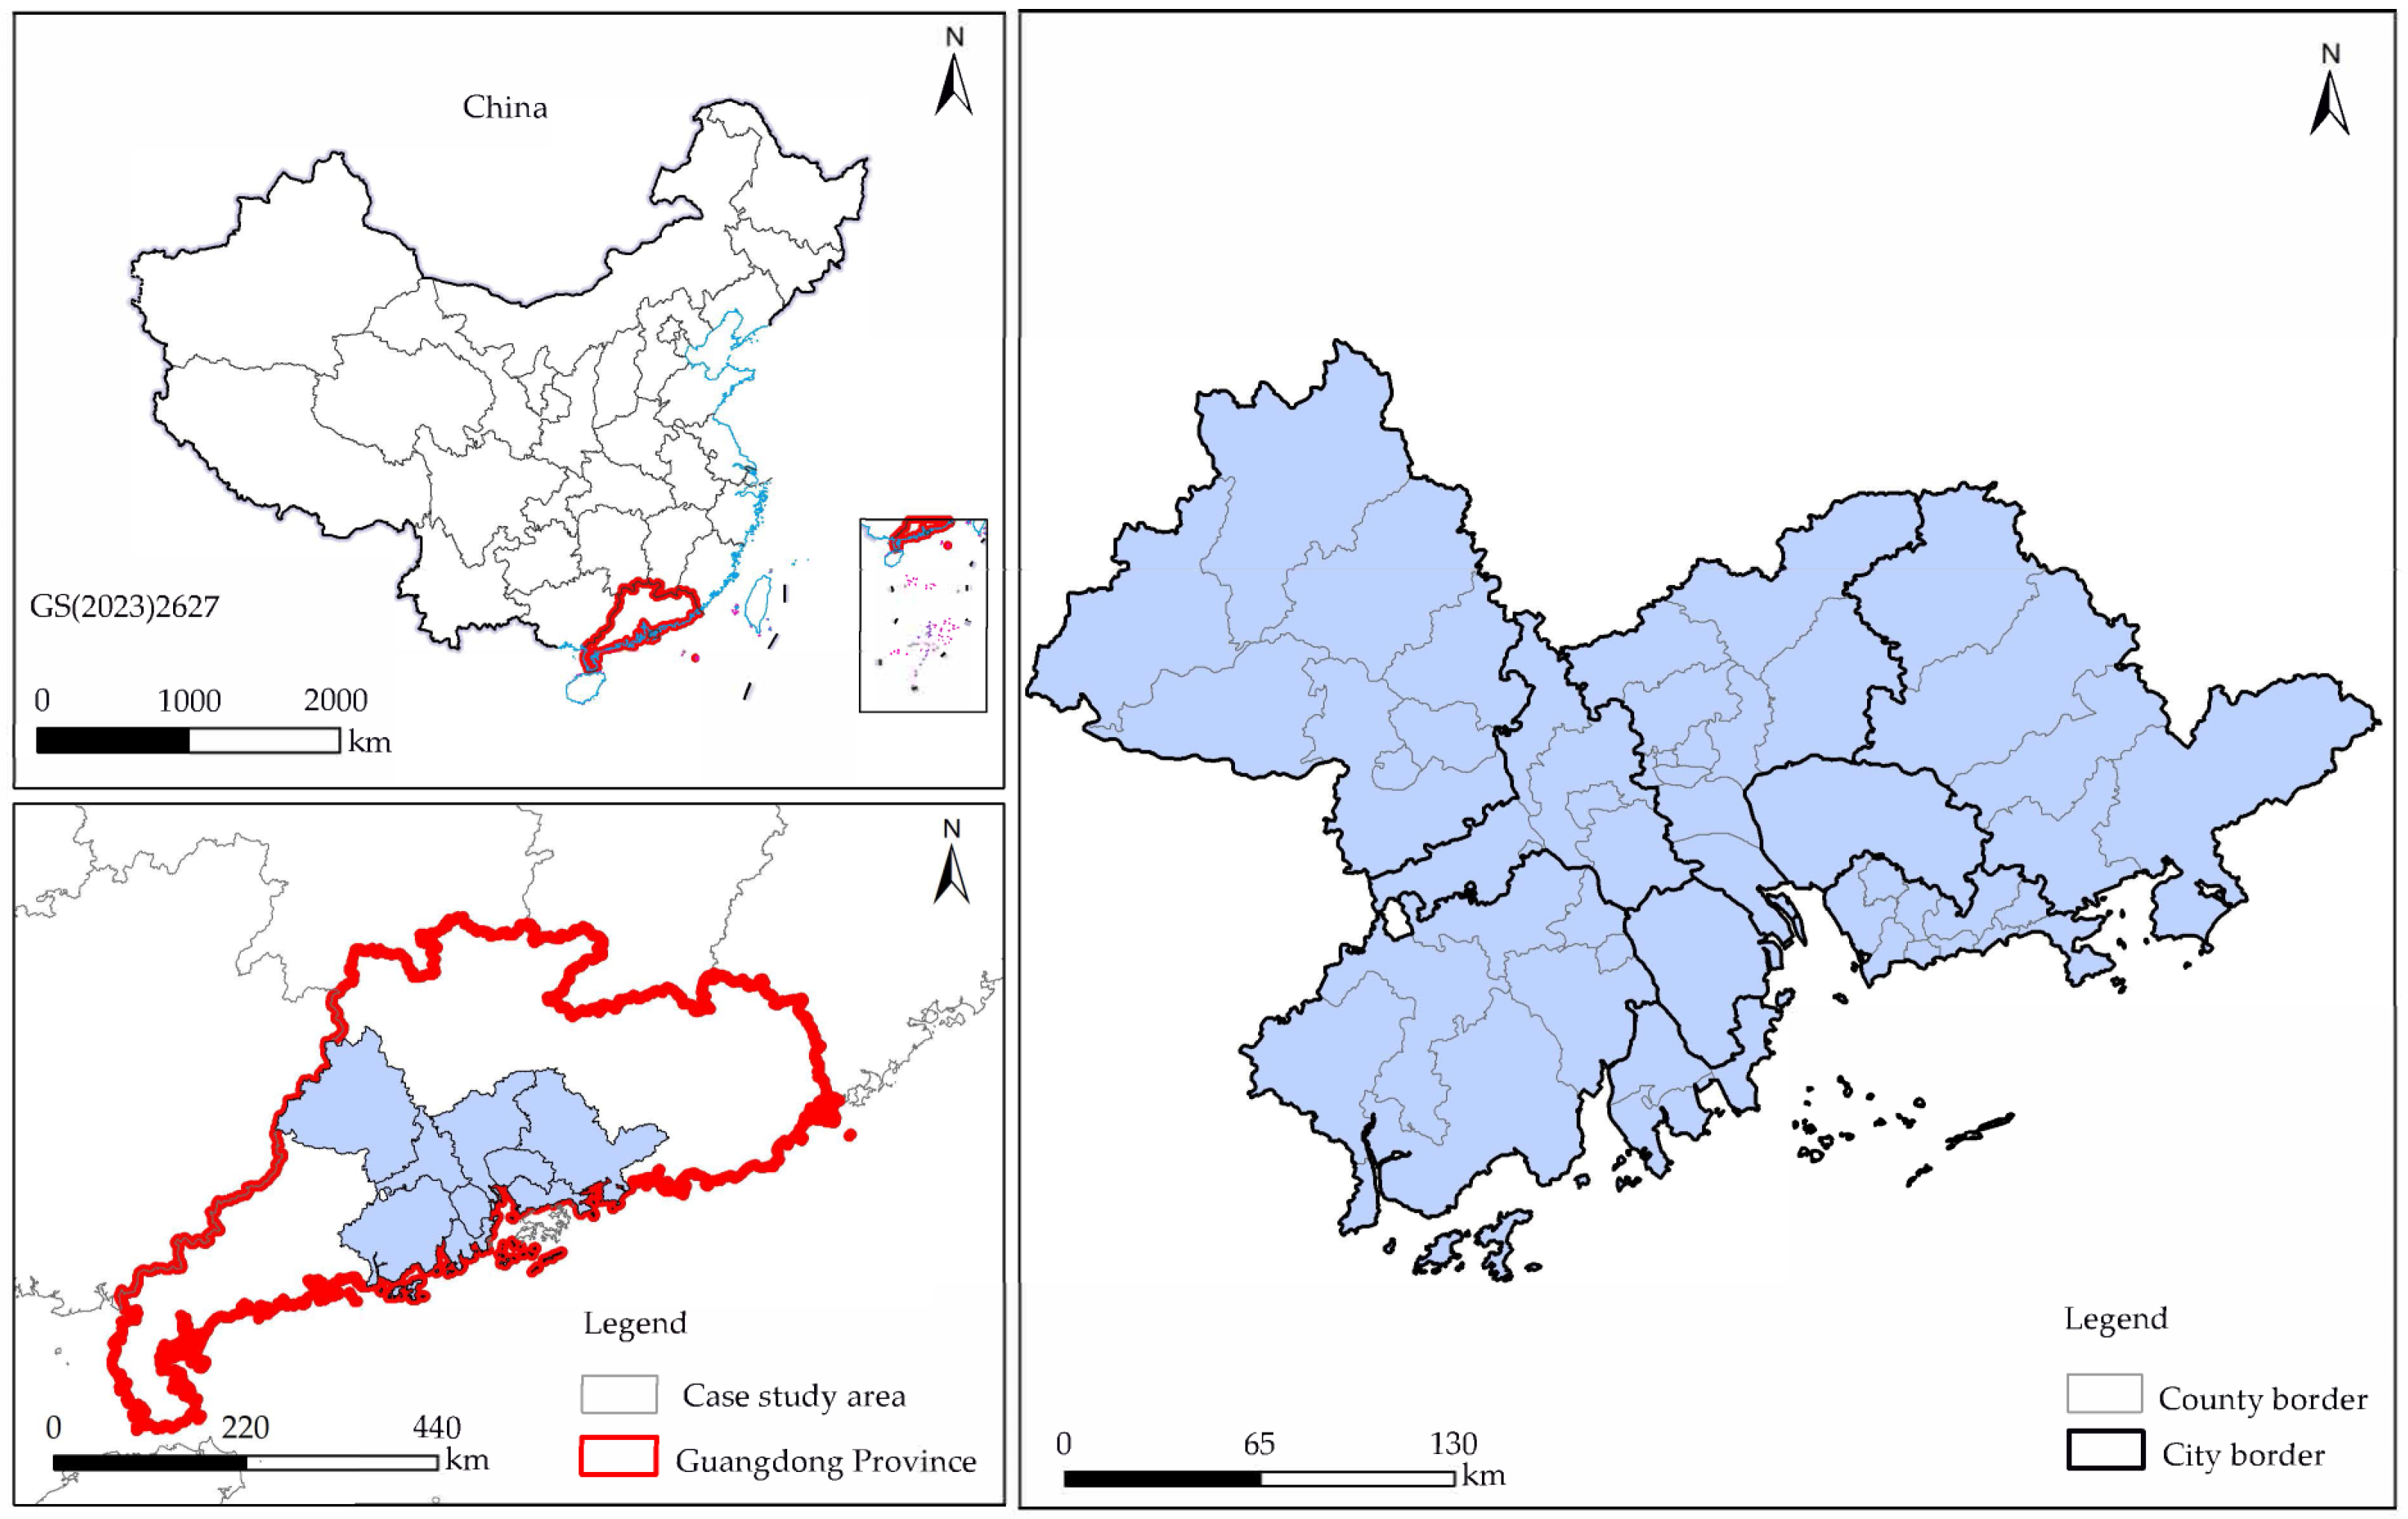
As shown in Figure 1, the Guangdong–Hong Kong–Macao Greater Bay Area (GBA) is one of China’s most economically dynamic and spatially integrated megacity regions. Covering approximately 56,000 km2, it comprises nine cities in Guangdong Province: Guangzhou, Shenzhen, Zhuhai, Foshan, Huizhou, Dongguan, Zhongshan, Jiangmen, and Zhaoqing, along with the Special Administrative Regions of Hong Kong and Macao. Due to data availability constraints on cross-border mobility, this study focuses on the nine Guangdong cities. The GBA exhibits pronounced intra-regional functional differentiation, with each city developing distinct and complementary industrial specializations: Guangzhou and Shenzhen serve as comprehensive service and innovation hubs; Dongguan and Foshan excel in advanced manufacturing; Zhuhai specializes in high-end equipment and tourism; and the remaining cities fulfill diverse roles in the regional division of labor. This functional specialization has shaped several integrated metropolitan sub-regions, the Guangzhou–Foshan conurbation, the Shenzhen–Dongguan–Huizhou corridor, and the Zhuhai–Zhongshan–Jiangmen cluster, linked by extensive transport infrastructure and characterized by high-volume inter-city flows. These attributes render the GBA an ideal natural laboratory for the relationship between urban functional structure and inter-regional daily mobility patterns at the county level.
Figure 1.
Study area.
3.2. Data
3.2.1. OD Flow Data
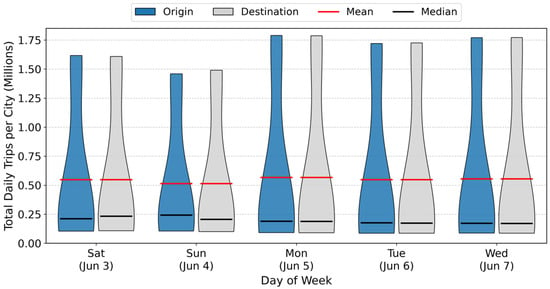
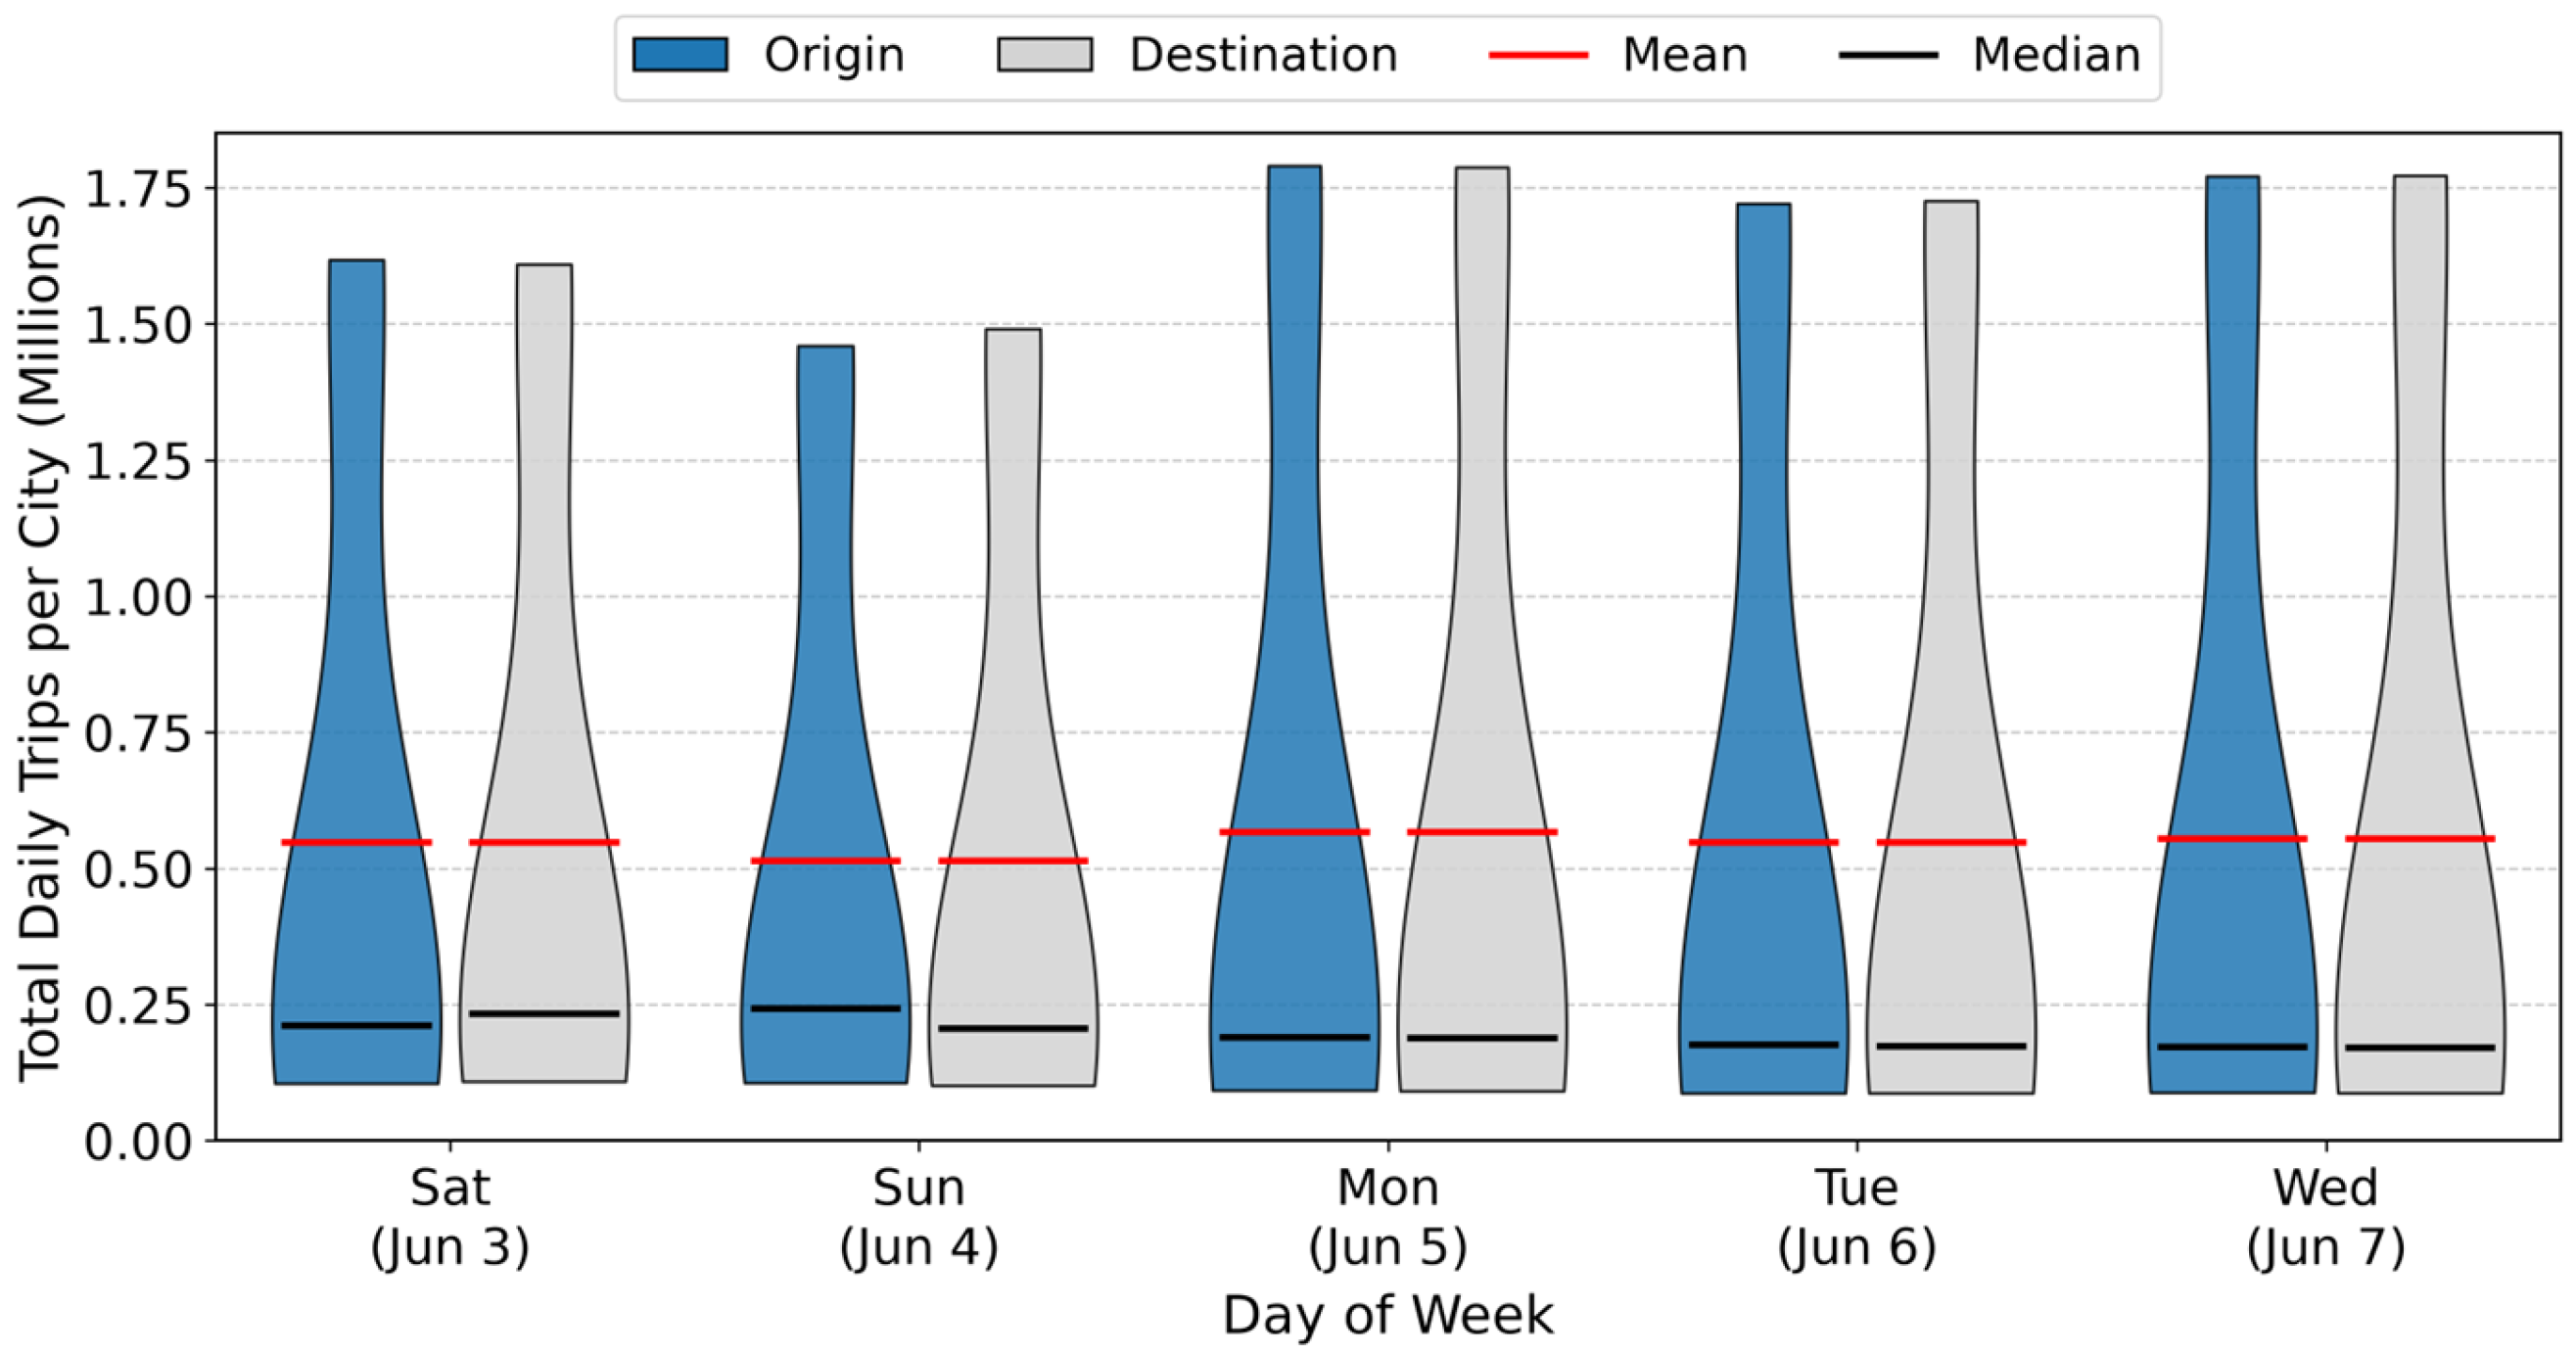
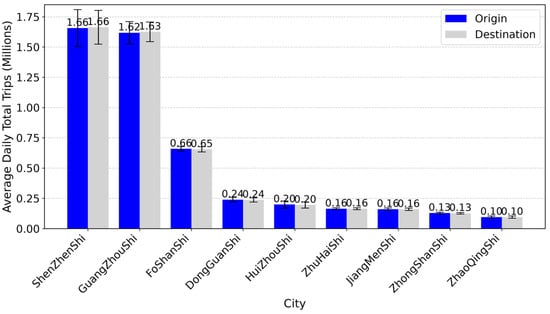
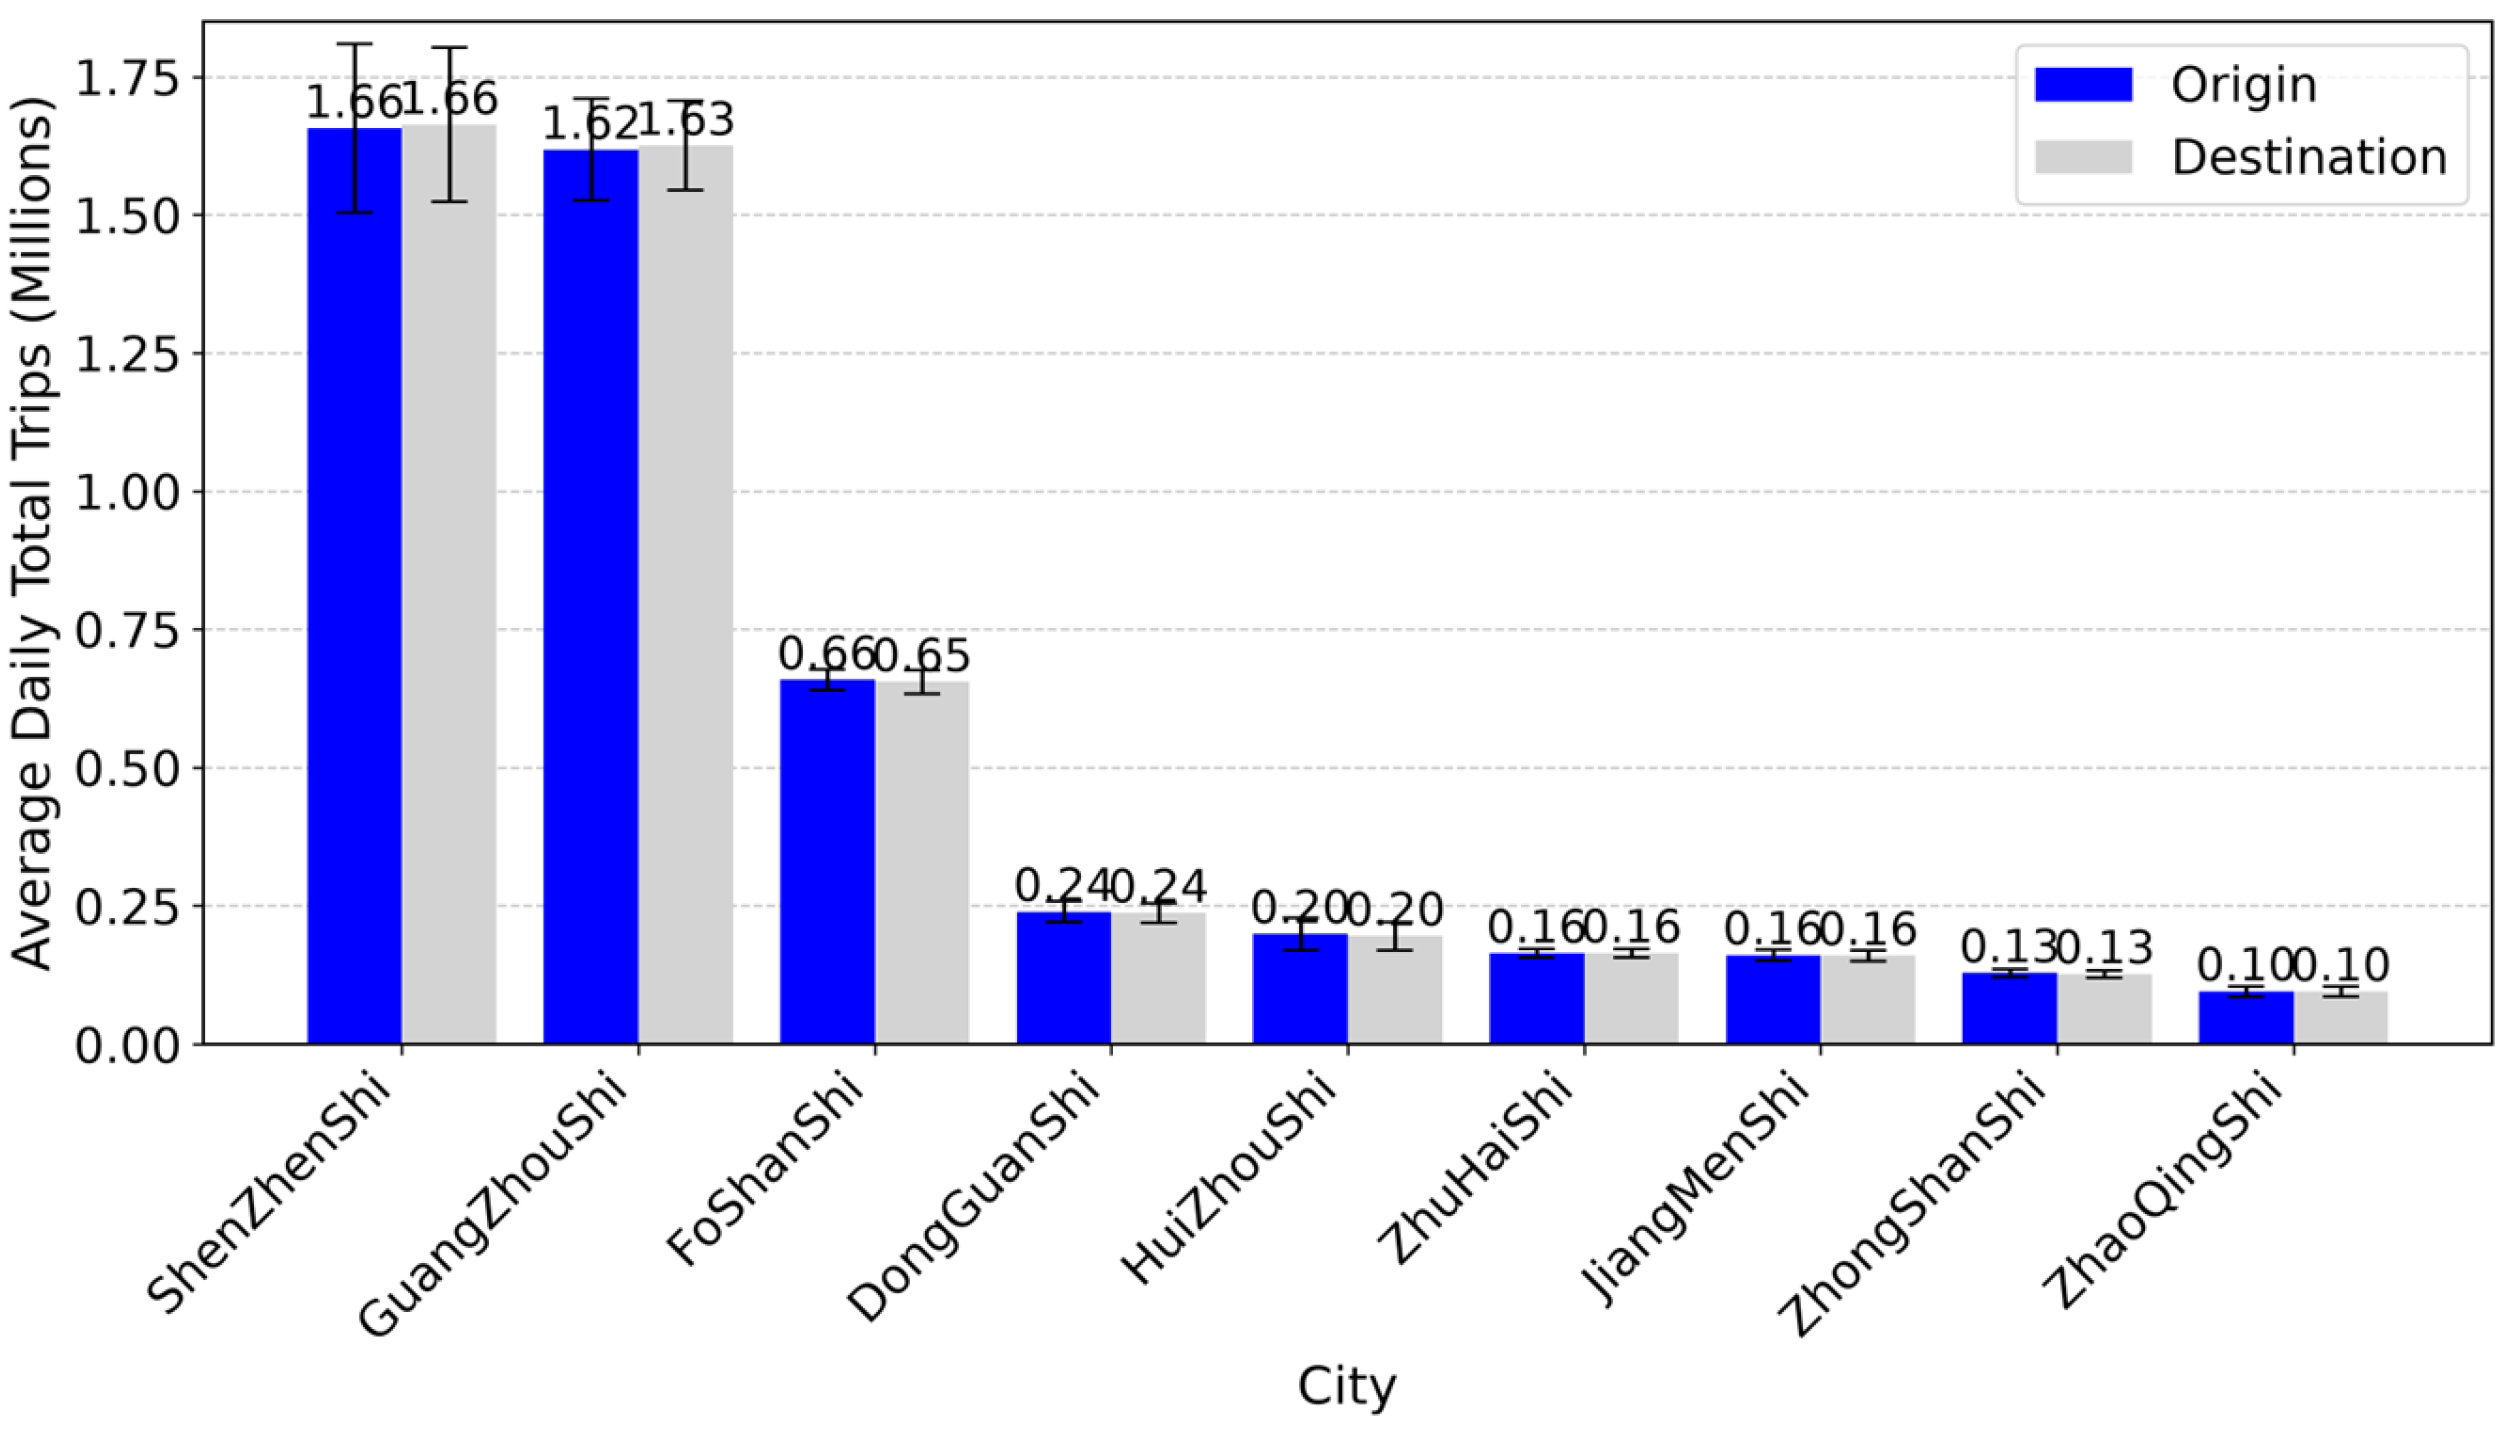
The OD flow data are county-level population movement records derived from commercial mobile signaling data of China Unicom, one of the major mobile network operators in China. The dataset, purchased for research use, is built from anonymized subscriber locations that the operator aggregates directly into origin-destination flows between the 50 county-level units of the nine Guangdong cities of the GBA. The data cover a five-day period from 3 June to 7 June 2023, spanning both the weekend (3–4 June) and weekdays (5–7 June), and allowing the model to learn mobility patterns across different activity contexts. Figure 2 illustrates the daily variation in municipal average trips across this observation window. The total inter-county population flow among the 50 county-level units amounted to 24,610,303 person-trips, yielding a daily average of 4,922,061 person-trips, whose distribution across the nine cities is summarized in Figure 3. We averaged the five-day OD matrices to smooth out daily stochastic fluctuations and intra-week behavioral heterogeneity, e.g., the inherent difference between weekday commutes and weekend leisure trips; the separate weekday and weekend matrices are retained for the robustness analysis. All 2450 inter-county OD pairs exhibit positive flows, so no OD pairs are excluded from the analysis. This averaging approach yields a representative baseline mobility landscape that reflects the equilibrium functional interactions between counties, rather than day-specific anomalies, ensuring that the predicted flows capture the structural impact of functional composition rather than transient behavioral noise. The final OD matrix captures routine mobility patterns at the county scale, representing the dependent variable in our predictive framework.
Figure 2.
Daily municipal average trips across the five-day observation window (3–7 June 2023).
Figure 3.
City-level average daily trips.
3.2.2. POI Data
The POI data serve as the primary source for characterizing the urban functional structure and service attributes of each county-level unit. The data were retrieved from Amap, one of the major commercial digital map platforms in China, and encompass 14 categories of facilities: transportation facilities, leisure and entertainment, corporations and enterprises, healthcare services, commercial and residential buildings, tourist attractions, automotive services, daily life services, science and education institutions, shopping and consumption venues, sports and fitness facilities, hotel and accommodation, financial institutions, and catering services. These categories collectively capture the multifaceted functional composition of urban spaces, reflecting both economic activities (e.g., enterprises, retail, finance, catering, hotels) and public services (e.g., healthcare, education, transportation), which together define the functional and service profile of each county. These categories describe where economic activities and services concentrate; we therefore treat this 14-category profile as a measurable proxy for the urban functional structure of each county, of which the industrial composition is a central component.
As shown in Table 1, a total of 6,265,297 POI records were obtained for the 50 county-level units across the nine GBA cities. The spatial distribution of POIs reveals significant intra-regional disparities: Shenzhen has the largest number of POIs, with 1,762,360 records, while Zhaoqing has the fewest, with only 170,482 records. This distribution aligns closely with the hierarchy of urban economic and population sizes, confirming that POI density serves as a reliable proxy for the level of urban functional agglomeration. Table 1 reports the total POI counts by city, illustrating the pronounced unevenness in urban functional development across the region.
Table 1.
Descriptive statistics of POI counts by category across 50 county-level units.
In terms of category composition, Table 1 reports the proportional distribution, mean, standard deviation, and minimum POI counts across the 50 county-level units for each of the 14 categories, illustrating the substantial functional heterogeneity within the study area. Shopping and consumption venues account for the largest share, representing approximately 22.8% of all POIs, underscoring the consumption-driven economic vitality of the GBA. Catering services follow at 13.4%, and corporations and enterprises at 12.8%, reflecting the region’s strong entrepreneurial and industrial base. Daily life services (9.1%) and transportation facilities (7.2%) also constitute substantial proportions, indicating well-developed urban service and transport infrastructure. In contrast, tourist attractions (0.8%) and sports and fitness facilities (1.1%) account for the smallest shares. This composition, dominated by commercial and industrial/service-oriented POIs, is consistent with the GBA’s status as a manufacturing and service-oriented megacity region.
3.3. Methodology
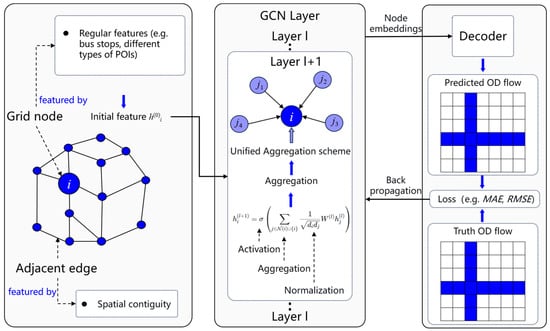
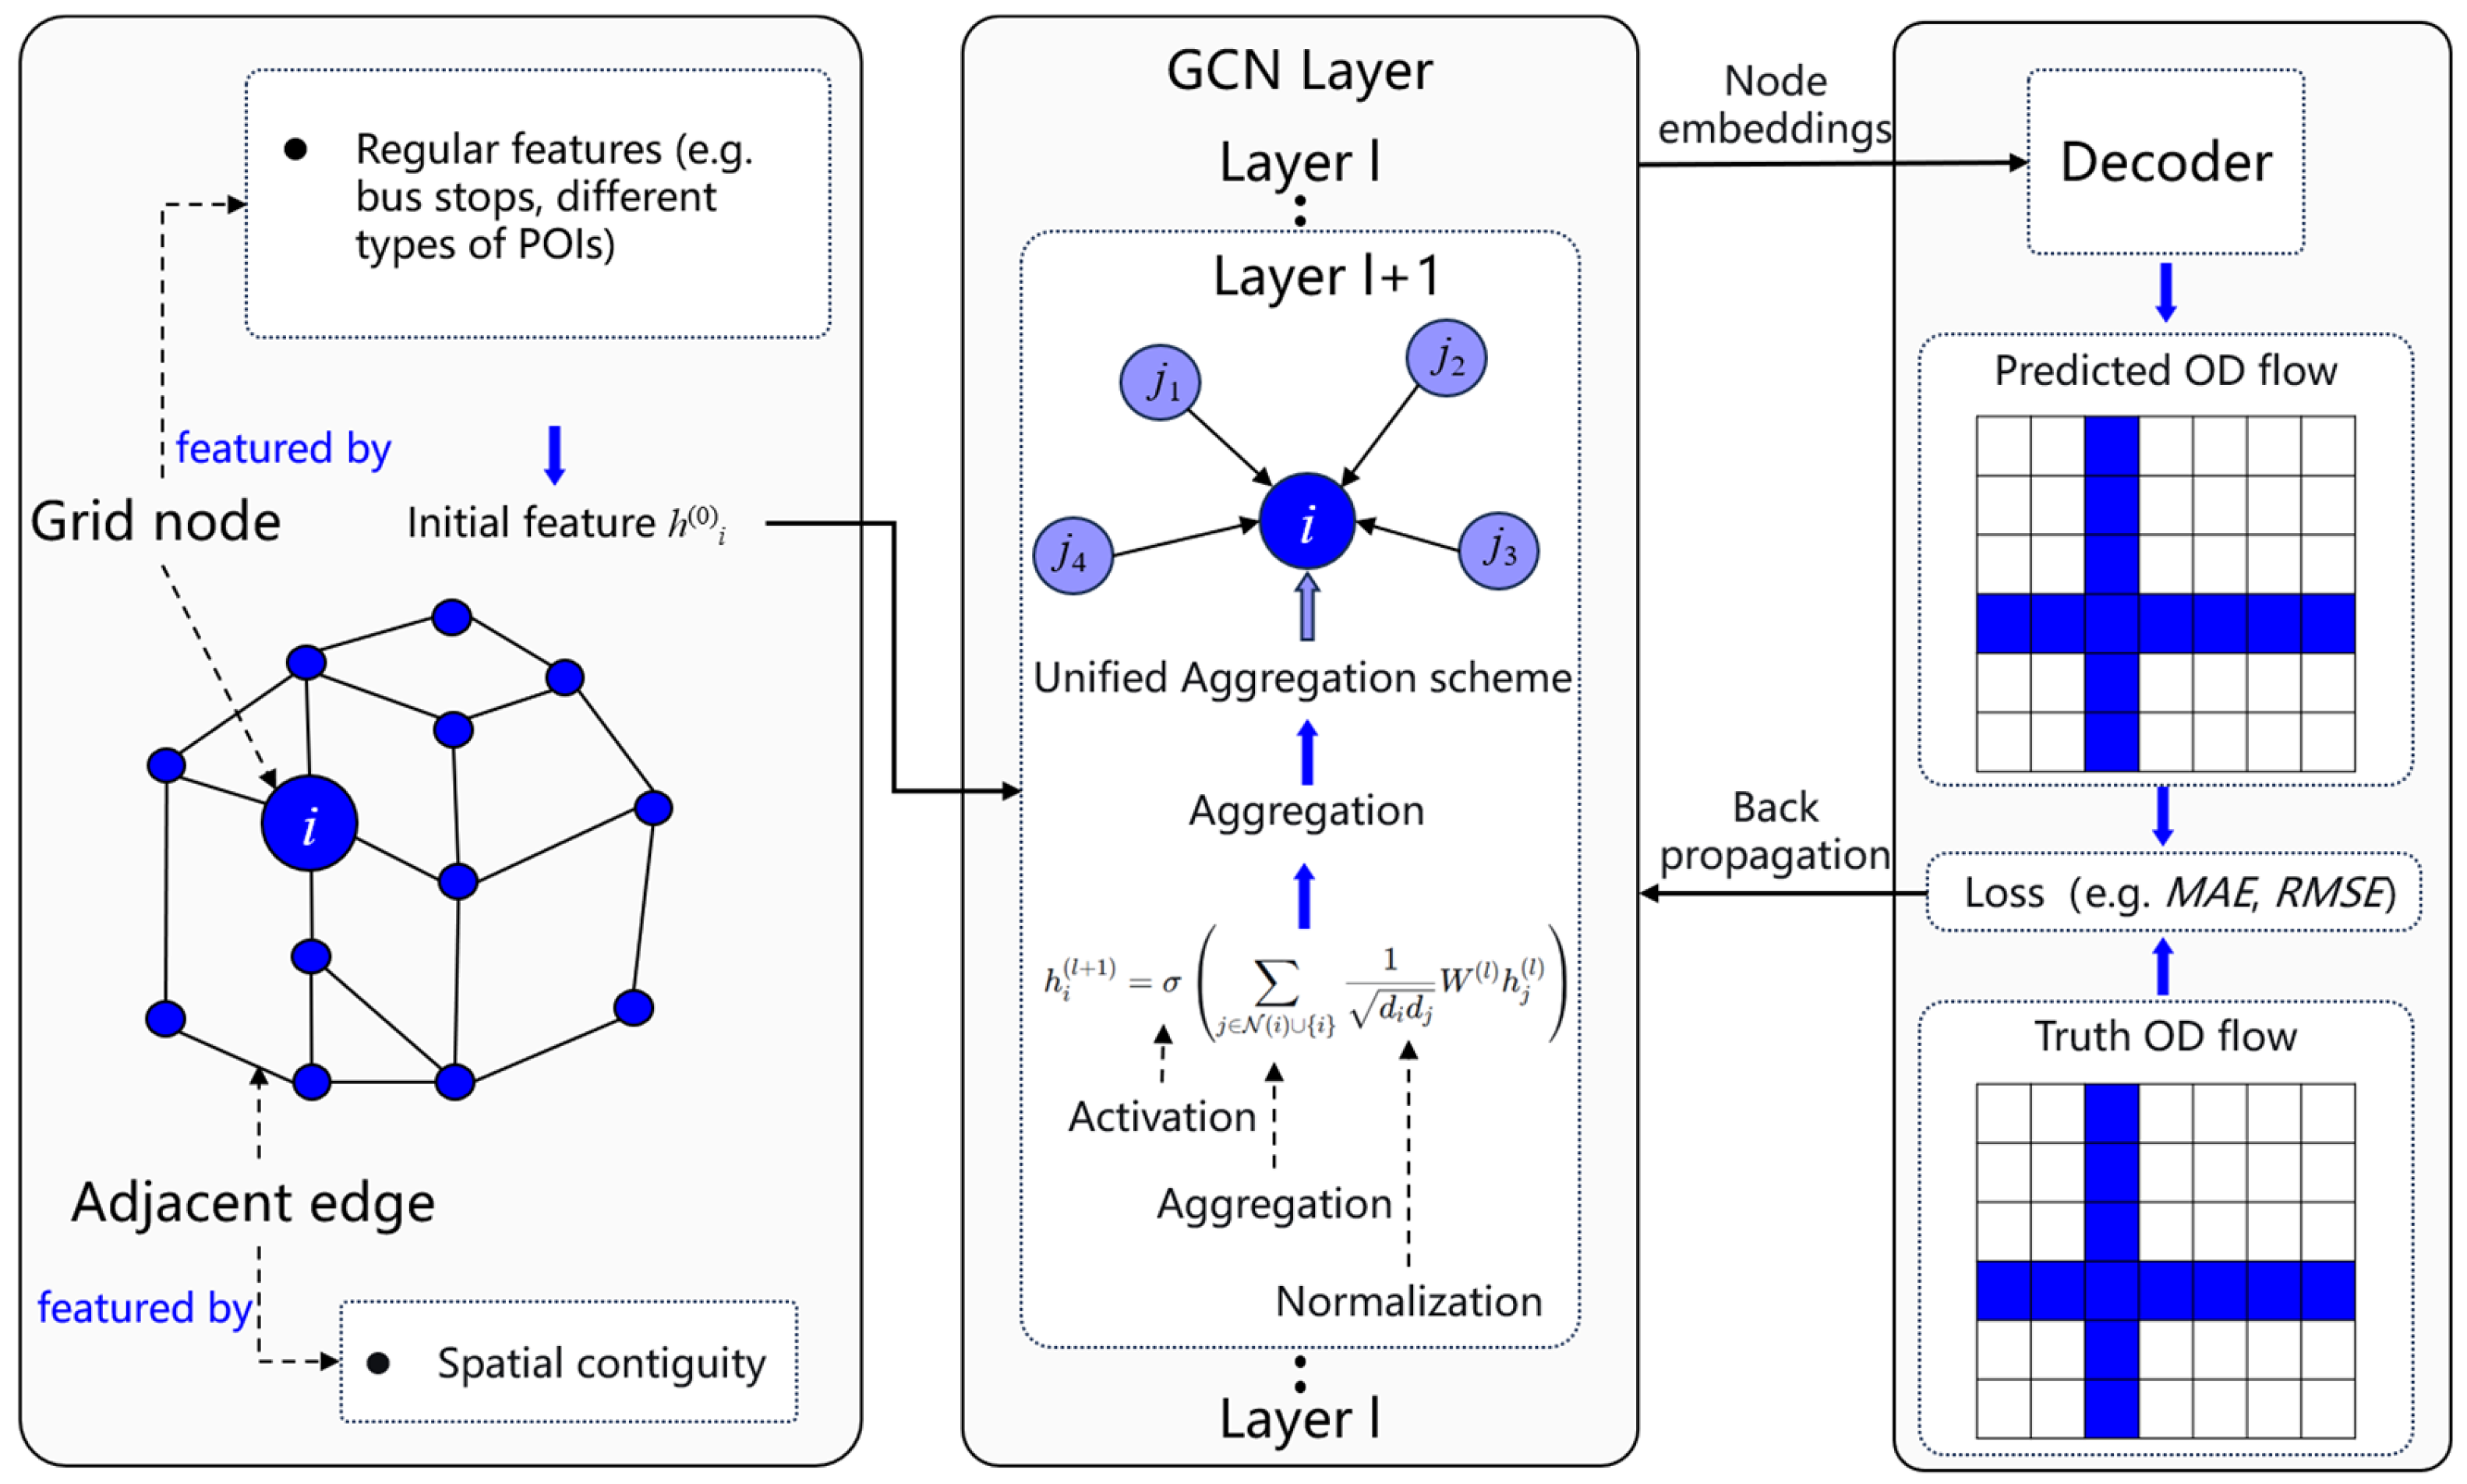
As shown in Figure 4, the model construction begins with two parallel inputs, spatial graph and node features. The spatial structure is represented as an undirected graph, where the 50 county-level units serve as nodes and edges connect geographically adjacent counties. Self-loops are added and the adjacency matrix is symmetrically normalized following standard practice, capturing the intuitive notion that adjacent counties are more likely to exhibit functional interactions than distant ones. The node features are constructed from the 14 POI categories through a three-stage preprocessing pipeline. The raw POI count for each category per county is first obtained, then a log-transformed total POI count is appended as an additional feature to capture city size and overall functional mass, and finally column-wise standardization is applied to ensure zero mean and unit variance, eliminating scale disparities and facilitating stable training convergence.
Figure 4.
Architecture of the GCN-based OD flow prediction framework.
These two inputs are then fed into the GCN encoder. The encoder consists of two graph convolutional layers, each applying the classical propagation rule, which performs weighted aggregation of a node’s own features and those of its first-order neighbors using a symmetrically normalized adjacency matrix. The first layer maps the 15-dimensional raw input features to a 64-dimensional hidden embedding followed by ReLU activation, and the second layer projects it to a 16-dimensional final node representation. This design balances the spatial receptive field with model parameter efficiency, and the configuration was selected by the validation Mean Absolute Error computed in logarithmic space (log-space MAE) from a screening of six candidate architectures, each trained with two random seeds, that varied the composition of pair-level exogenous features (none, distance only, distance plus origin/destination total-POI mass, or these features supplemented by a gravity-model-based term), the hidden width (64 or 128), and the number of graph convolutional layers. The final node embeddings encode both local functional profiles and broader spatial context. The decoder then concatenates the embeddings of the origin and destination counties, together with three pair-level exogenous features, namely the logarithms of the great-circle distance between county centroids and of the origin and destination total POI counts, all standardized with training-split statistics; this order-sensitive operation naturally captures directional asymmetries and passes them through a two-layer multi-layer perceptron with hidden dimensions of [64, 1], i.e., one hidden layer of 64 units and an output layer of 1 unit. The hidden layer uses ReLU activation, while the output layer employs linear activation to produce the predicted OD flow, which is subsequently evaluated against the ground-truth flow using the log-space MAE loss.
Once the model architecture is defined, the training proceeds. The model is optimized by minimizing the log-space MAE. The target is transformed as ln(T + 10−6) and then z-score standardized using statistics computed on the training split only, and predictions are recovered through the inverse exponential transform, with predicted log-values clipped to the observed log-flow range for numerical stability. The log-space MAE is preferred over standard MAE or MSE because OD flows span several orders of magnitude, and this transformation compresses the dynamic range, preventing the loss from being dominated by a small number of high-volume pairs.
The 2450 inter-county OD pairs are randomly divided into training, validation, and test sets in a 60/20/20 ratio; the validation set is monitored for early stopping with a patience of 1000 epochs up to a maximum of 10,000 epochs, and the untouched test set is used only for final evaluation. Training uses full-batch gradient descent over the training pairs, with gradients clipped at a maximum norm of 1.0. Because results are sensitive to random initialization and split composition, the model is trained with five random seeds (42, 123, 456, 789, and 1024), and performance is reported as the mean ± standard deviation across seeds on the test set. The model is implemented in PyTorch Geometric 2.8.0 and trained using the Adam optimizer with learning rate and weight decay set to 0.001 and 5 × 10⁻⁴, respectively.
Beyond predictive accuracy, the trained model enables systematic sensitivity analysis and policy scenario simulations. For global sensitivity analysis, the raw POI counts of each category are perturbed in both directions by ±10% across all counties while holding other categories constant; the log-transformed total POI count is recomputed and the features are re-standardized before prediction, and the resulting changes in predicted OD flows characterize which functional categories the model relies upon most heavily. Perturbations of ±5%, ±20%, and ±30% are additionally examined to test the robustness of the rankings, and ranking consistency across seeds is quantified with Spearman and Kendall correlations. For targeted policy simulations, a single-sided perturbation strategy is adopted, applying category-specific changes unilaterally to the targeted region of each corridor and evaluating the affected OD pairs connecting that region with its partner city to isolate the effect of unilateral policy interventions. Three specific scenarios are simulated accordingly: Guangzhou-Foshan integration, Guangzhou-Zhaoqing corporate development, and Shenzhen-Zhongshan cultural tourism. For each scenario, the mean change rate across affected pairs is computed and the distribution of individual pair responses is analyzed over the five seeds.
For benchmark comparison, four baseline models are implemented and evaluated under the same per-seed 60/20/20 splits with the log-transformed target. The gravity model takes the log-linear form with the coefficients fitted by ordinary least squares on the training pairs only; being deterministic, the gravity model is reported without seed dispersion, and its predicted log-flows are clipped to the observed log-flow range before exponentiation. The POI-based linear regression is an ordinary least-squares model on the concatenated origin and destination POI feature vectors. The gradient-boosting baseline is a histogram-based gradient-boosting regressor with up to 500 boosting iterations and early stopping on the 25% validation fraction. The GCN without POI retains the identical encoder–decoder architecture and training protocol as the proposed model but receives constant node features and no pair-level features, isolating the contribution of the graph structure alone. Input features of all baselines are standardized using statistics computed on the training split only.
4. Results and Discussion
4.1. Model Training and Convergence
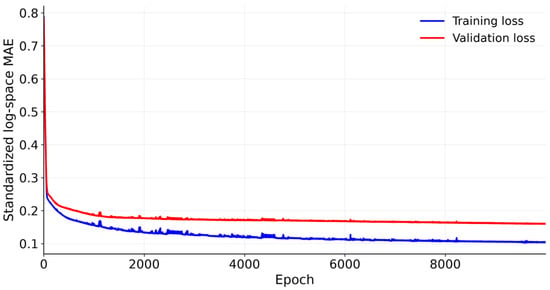
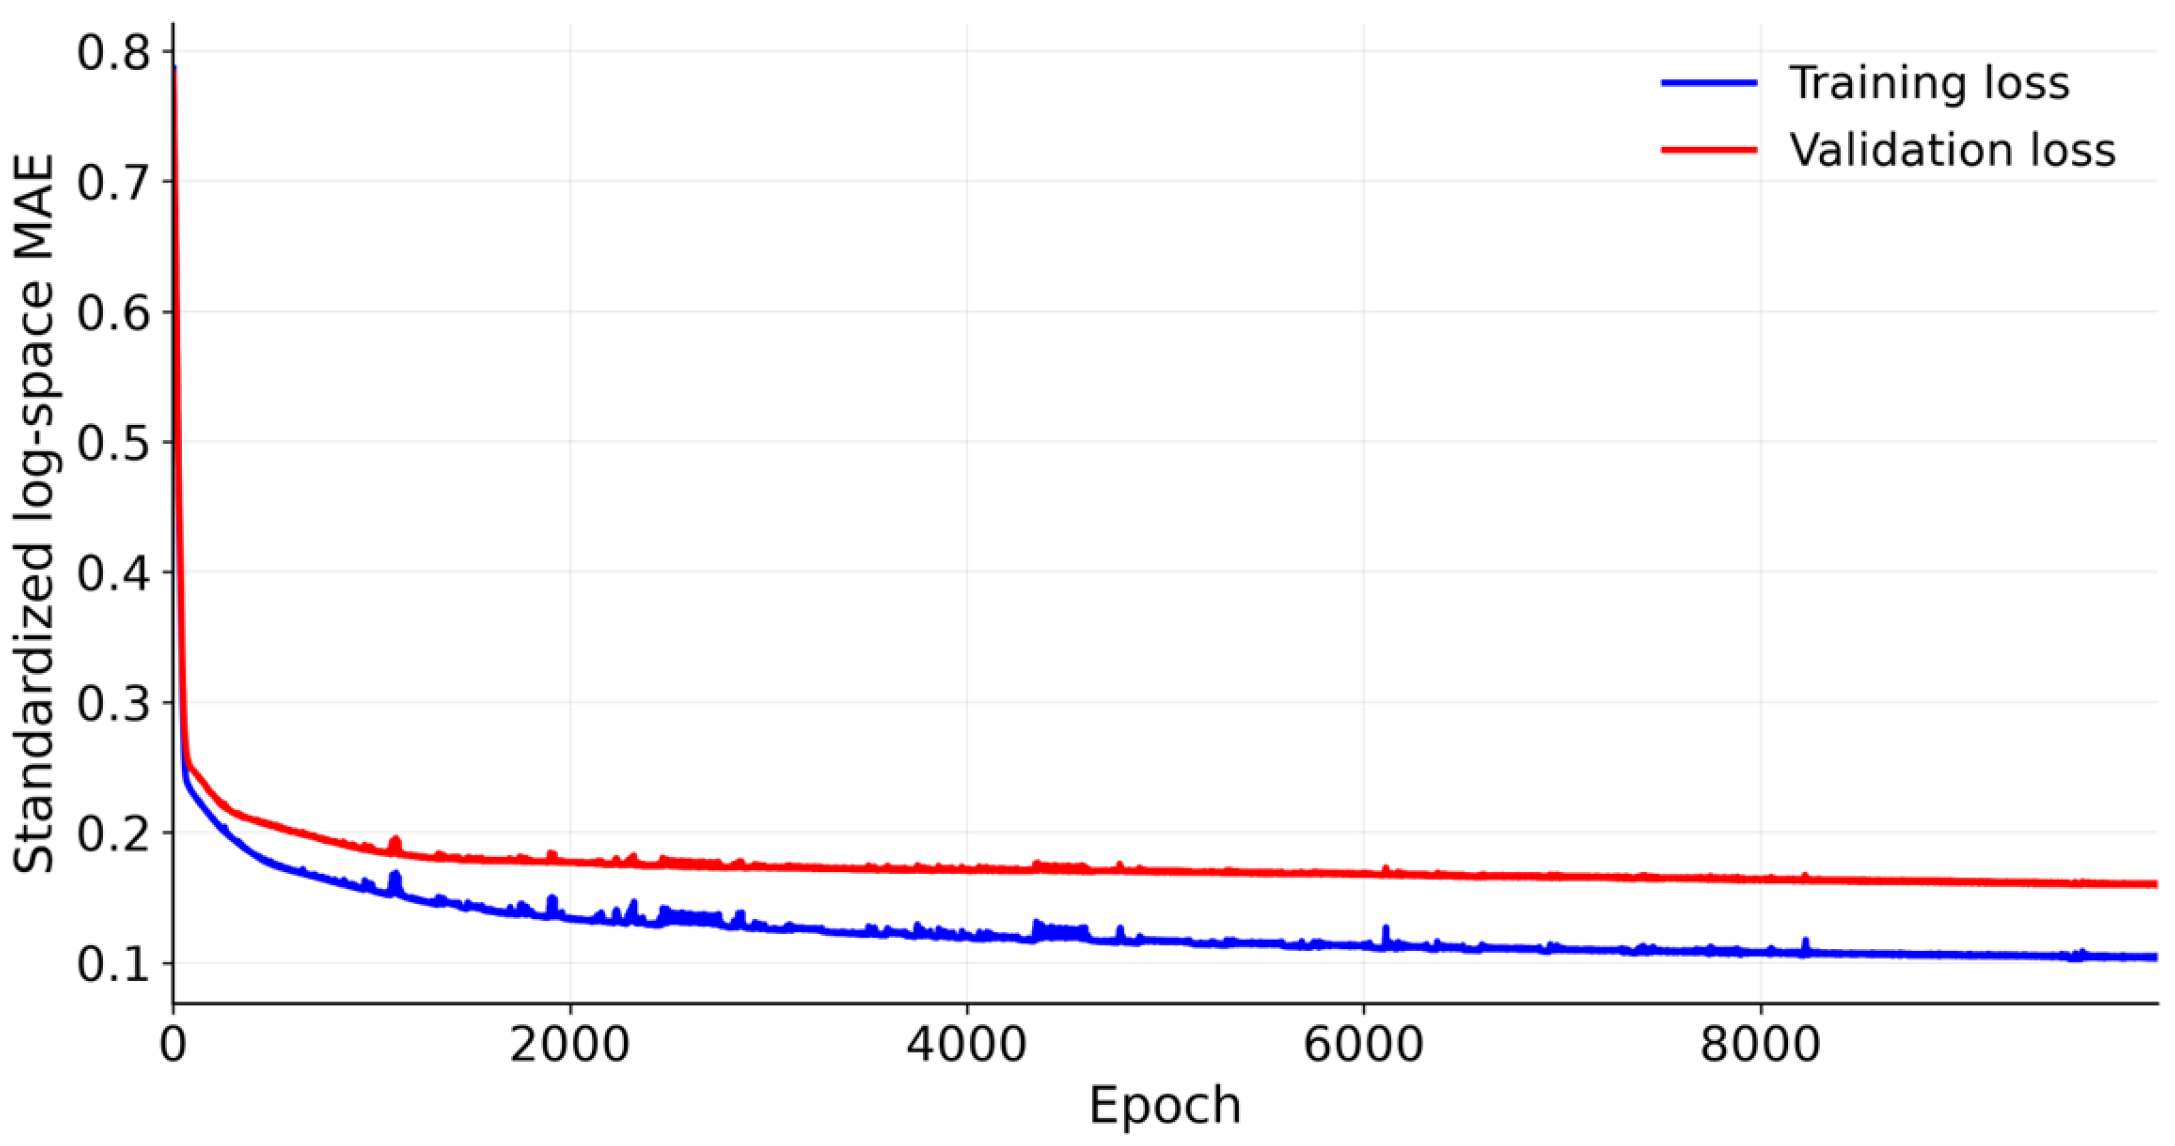
Figure 5 shows the training and validation loss curves for a representative seed (seed 42): both curves decline rapidly within the first 1000 epochs, after which the validation loss keeps decreasing slowly without any upward trend, so training for this seed runs to the 10,000-epoch cap; across the five seeds, early stopping terminates training at epoch 7535 on average. Both curves show the log-space MAE computed on standardized log flows for the training and validation splits, respectively, i.e., the quantity minimized during training, and are therefore not directly comparable to the MAE and RMSE reported for the test set, which are measured in the original flow space. The absence of a sustained validation-error increase indicates no severe overfitting. Across the five seeds, the model reaches a test-set R2 of 0.766 ± 0.077 in the original flow space, with an MAE of 783 ± 174 and an RMSE of 3440 ± 1021 persons per day. Because counties are shared between the training and test sets under the random OD-pair split, the reported accuracy characterizes within-region interpolation among the 50 study units rather than transfer to entirely unseen spatial contexts.
Figure 5.
Training and validation loss during GCN model training (representative seed 42).
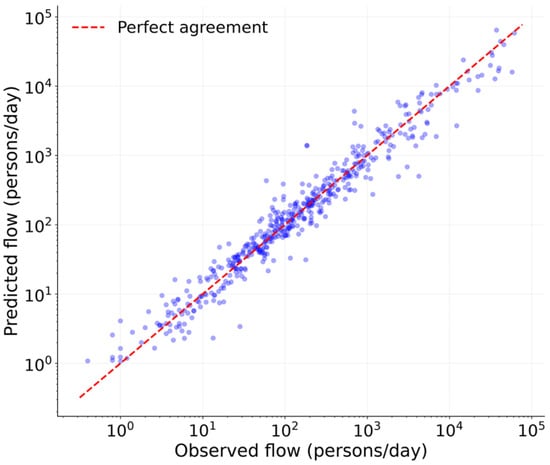
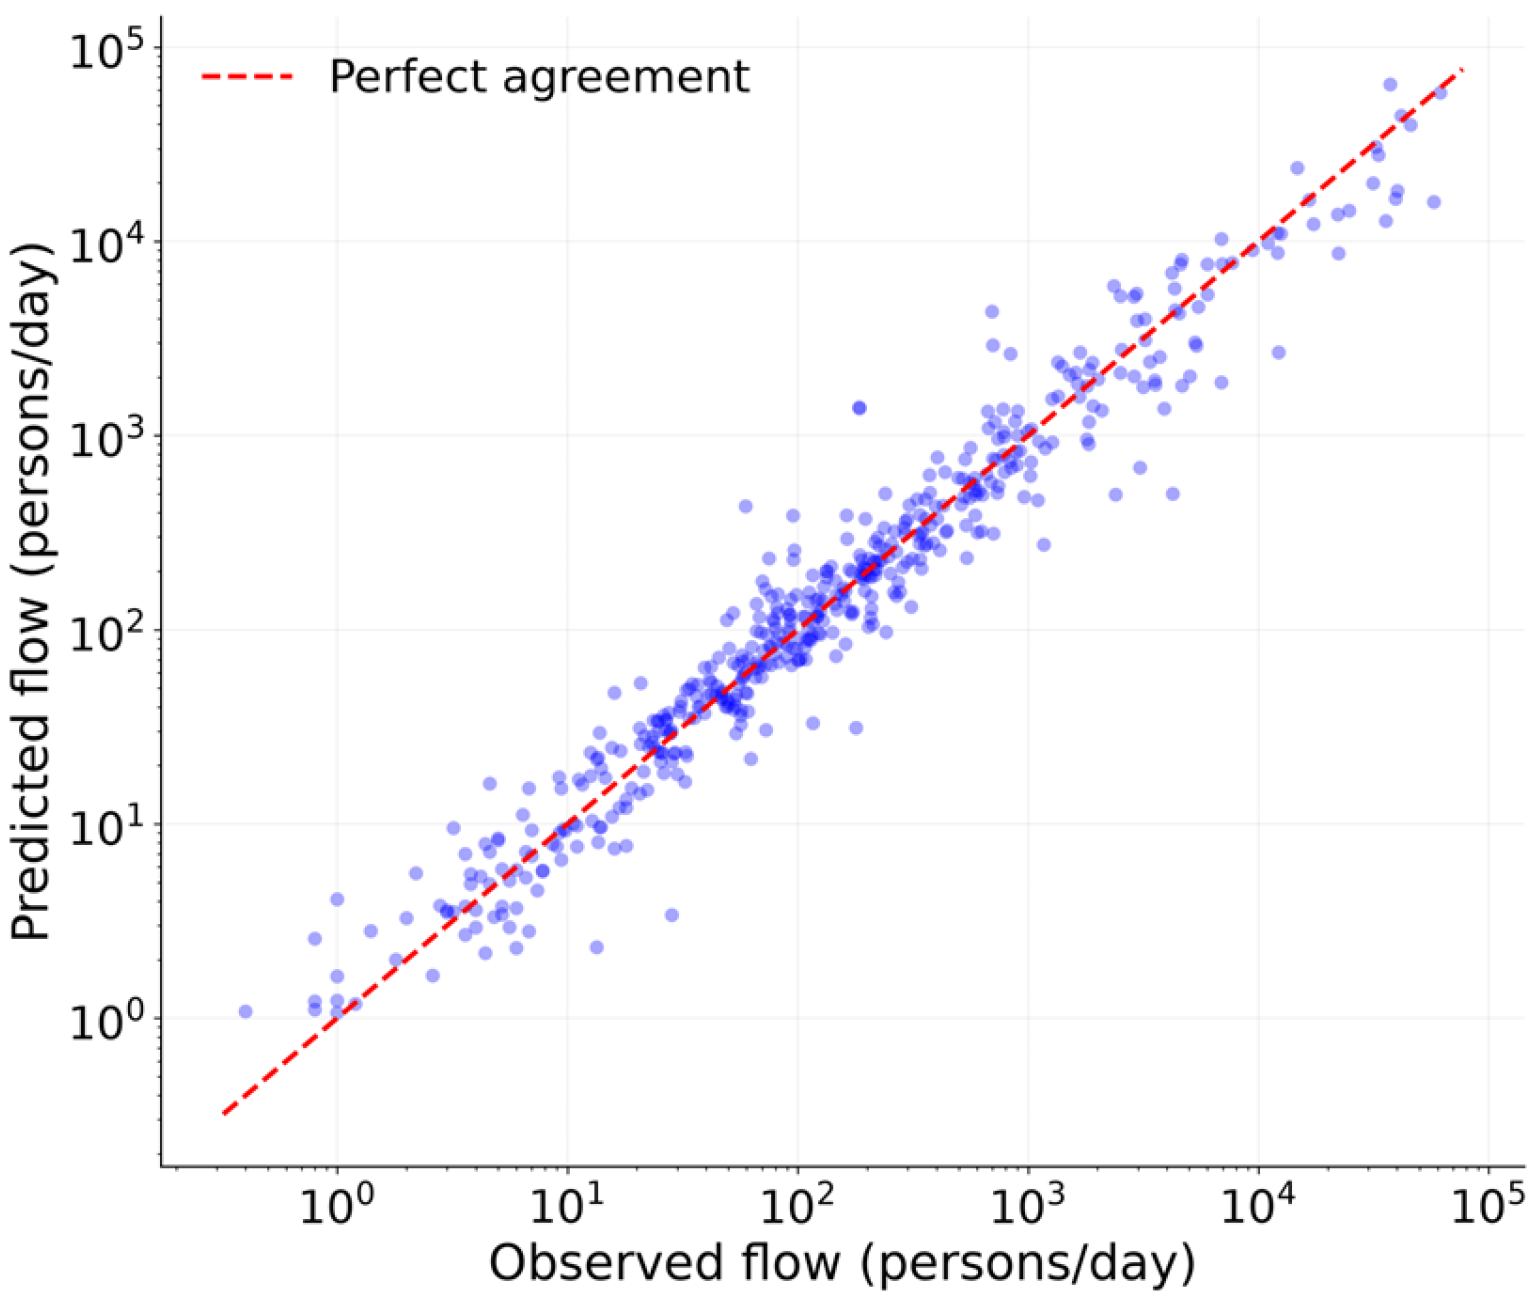
On the untouched test set, the model explains approximately 77% of the variance in inter-county daily mobility. The RMSE of 3440 is considerably larger than the MAE of 783, reflecting a small number of OD pairs with extremely high flow volumes, such as those along the Guangzhou-Foshan and Shenzhen-Dongguan corridors. The model captured these high-magnitude flows reasonably well while maintaining low absolute errors across the majority of OD pairs, as shown by the predicted-versus-observed scatter for the held-out test pairs in Figure 6, which clusters closely along the 45-degree line across the full range of flow magnitudes. The seed-to-seed variation, standard deviation of R2 of 0.077, reflects the modest sample size of 2450 OD pairs.
Figure 6.
Predicted versus observed daily flows for the held-out test pairs (representative seed 42).
4.2. Baseline Comparison, Graph Ablation, and Robustness Analysis
To verify that the graph-based architecture is necessary, the proposed model is compared against four baselines under the identical 60/20/20 split, logarithmic target, and five-seed protocol. Table 2 reports the results. The proposed GCN model attains a test R2 of 0.766 ± 0.077, clearly ahead of all baselines. The gravity model, the strongest alternative, reaches R2 = 0.633 with an MAE of 928 persons per day; the POI-based linear regression and the gradient-boosting regressor capture only weak pair-level feature effects; and the graph-only GCN, which shares the identical architecture but receives no POI information, fails to beat the mean predictor. The advantage of the proposed framework therefore stems from the combination of adjacency-based message passing and POI-derived functional features rather than from graph structure alone.
Table 2.
Baseline comparison under the identical split and five-seed protocol (mean ± standard deviation across seeds).
The choice of the spatial graph is examined by rebuilding the graph in two alternative ways: a distance-weighted graph, in which edge weights follow a Gaussian kernel of the inter-county centroid distances with the bandwidth σ set to their median, and a flow-derived graph, in which each county is connected to its top-five origin and destination partners in terms of observed flows. As shown in Table 3, the adjacency graph with R2 = 0.766 ± 0.077 outperforms the distance-weighted variant, and the flow-derived graph does not improve accuracy either despite using target-variable information, which would not be available at prediction time. The adjacency graph is therefore retained for the main model and all subsequent analyses. Non-adjacent county pairs with high flows, such as Shenzhen-Zhongshan, are not ignored by the model. Their predictions are informed by multi-hop message passing through intermediary counties and, more directly, by pair-level distance and mass features.
Table 3.
Graph structure ablation (mean ± standard deviation over five seeds).
As a temporal robustness check, separate models are trained on the weekday (5–7 June) and weekend (3–4 June) OD matrices under the same evaluation protocol, i.e., five random seeds with 60/20/20 splits and validation-based early stopping; up to 5000 epochs with a patience of 500. The weekday model attains a test R2 of 0.738 ± 0.074 and MAE of 828 persons per day, broadly comparable to the five-day-average model, whereas the weekend model, with R2 = 0.436 ± 0.375 and MAE = 853, is less stable, reflecting the greater behavioral heterogeneity of weekend travel. The comparison indicates that model performance is strongest for routine, commute-dominated travel contexts.
4.3. Sensitivity Analysis
Table 4 reports the model-implied sensitivity of each category under ±10% perturbations with mean ± standard deviation over the five seeds, and Table 5 summarizes the stability of the category ranking across perturbation magnitudes of ±5%, ±10%, ±20%, and ±30%. Responses are largely symmetric between upward and downward perturbations. Across all seed pairs, the between-seed Spearman rank correlation averages 0.996–0.998 and never falls below 0.991, and the Kendall tau ranges from 0.978 to 0.991; the hierarchy reported below is therefore robust to the choice of seed and perturbation size.
Table 4.
Sensitivity ranking of the 14 functional categories based on ±10% raw-count perturbation (persons per day).
Table 5.
Stability of the sensitivity ranking across perturbation magnitudes and seeds.
The ranking reveals a clear hierarchy. Shopping and consumption venues exhibit by far the strongest association, followed by catering services, corporate enterprises, daily life services, and transportation facilities. This ordering is consistent with the composition of inter-county daily mobility, which is dominated by shopping, business, and commuting-related trips: the prominence of consumption- and employment-related categories aligns with the GBA’s manufacturing and service base, while transportation facilities reflect the role of physical connectivity in enabling cross-county movement.
Tourist attractions, leisure and entertainment, sports and fitness facilities, and financial institutions rank lowest. Several non-exclusive explanations are plausible. Tourism POIs account for less than 1% of all records and are spatially concentrated in a small number of counties, so uniform count perturbations translate into small absolute flow changes; financial institutions cluster in a few core business districts whose mobility contributions may already be saturated in the model; healthcare and education-related services primarily serve local catchment areas and generate limited inter-county travel. These interpretations should be read as possible explanations consistent with the observed rankings rather than established mechanisms, because the model captures statistical associations among correlated functional features rather than isolated causal effects.
These results carry tentative planning implications. If the modeled associations are corroborated by independent evidence, investments in consumption-oriented and employment-related functions would be associated with the strongest marginal mobility responses, whereas decentralized provision of healthcare and daily services could improve spatial equity without significantly disrupting daily mobility networks. Overall, the sensitivity analysis characterizes which functional categories the trained model relies upon most heavily, providing a diagnostic ranking of functional influences on mobility patterns within polycentric urban agglomerations.
4.4. Policy Scenario Simulations
4.4.1. Transportation and Corporate POI Perturbations in Foshan Under the Guangzhou–Foshan Integration Scenario
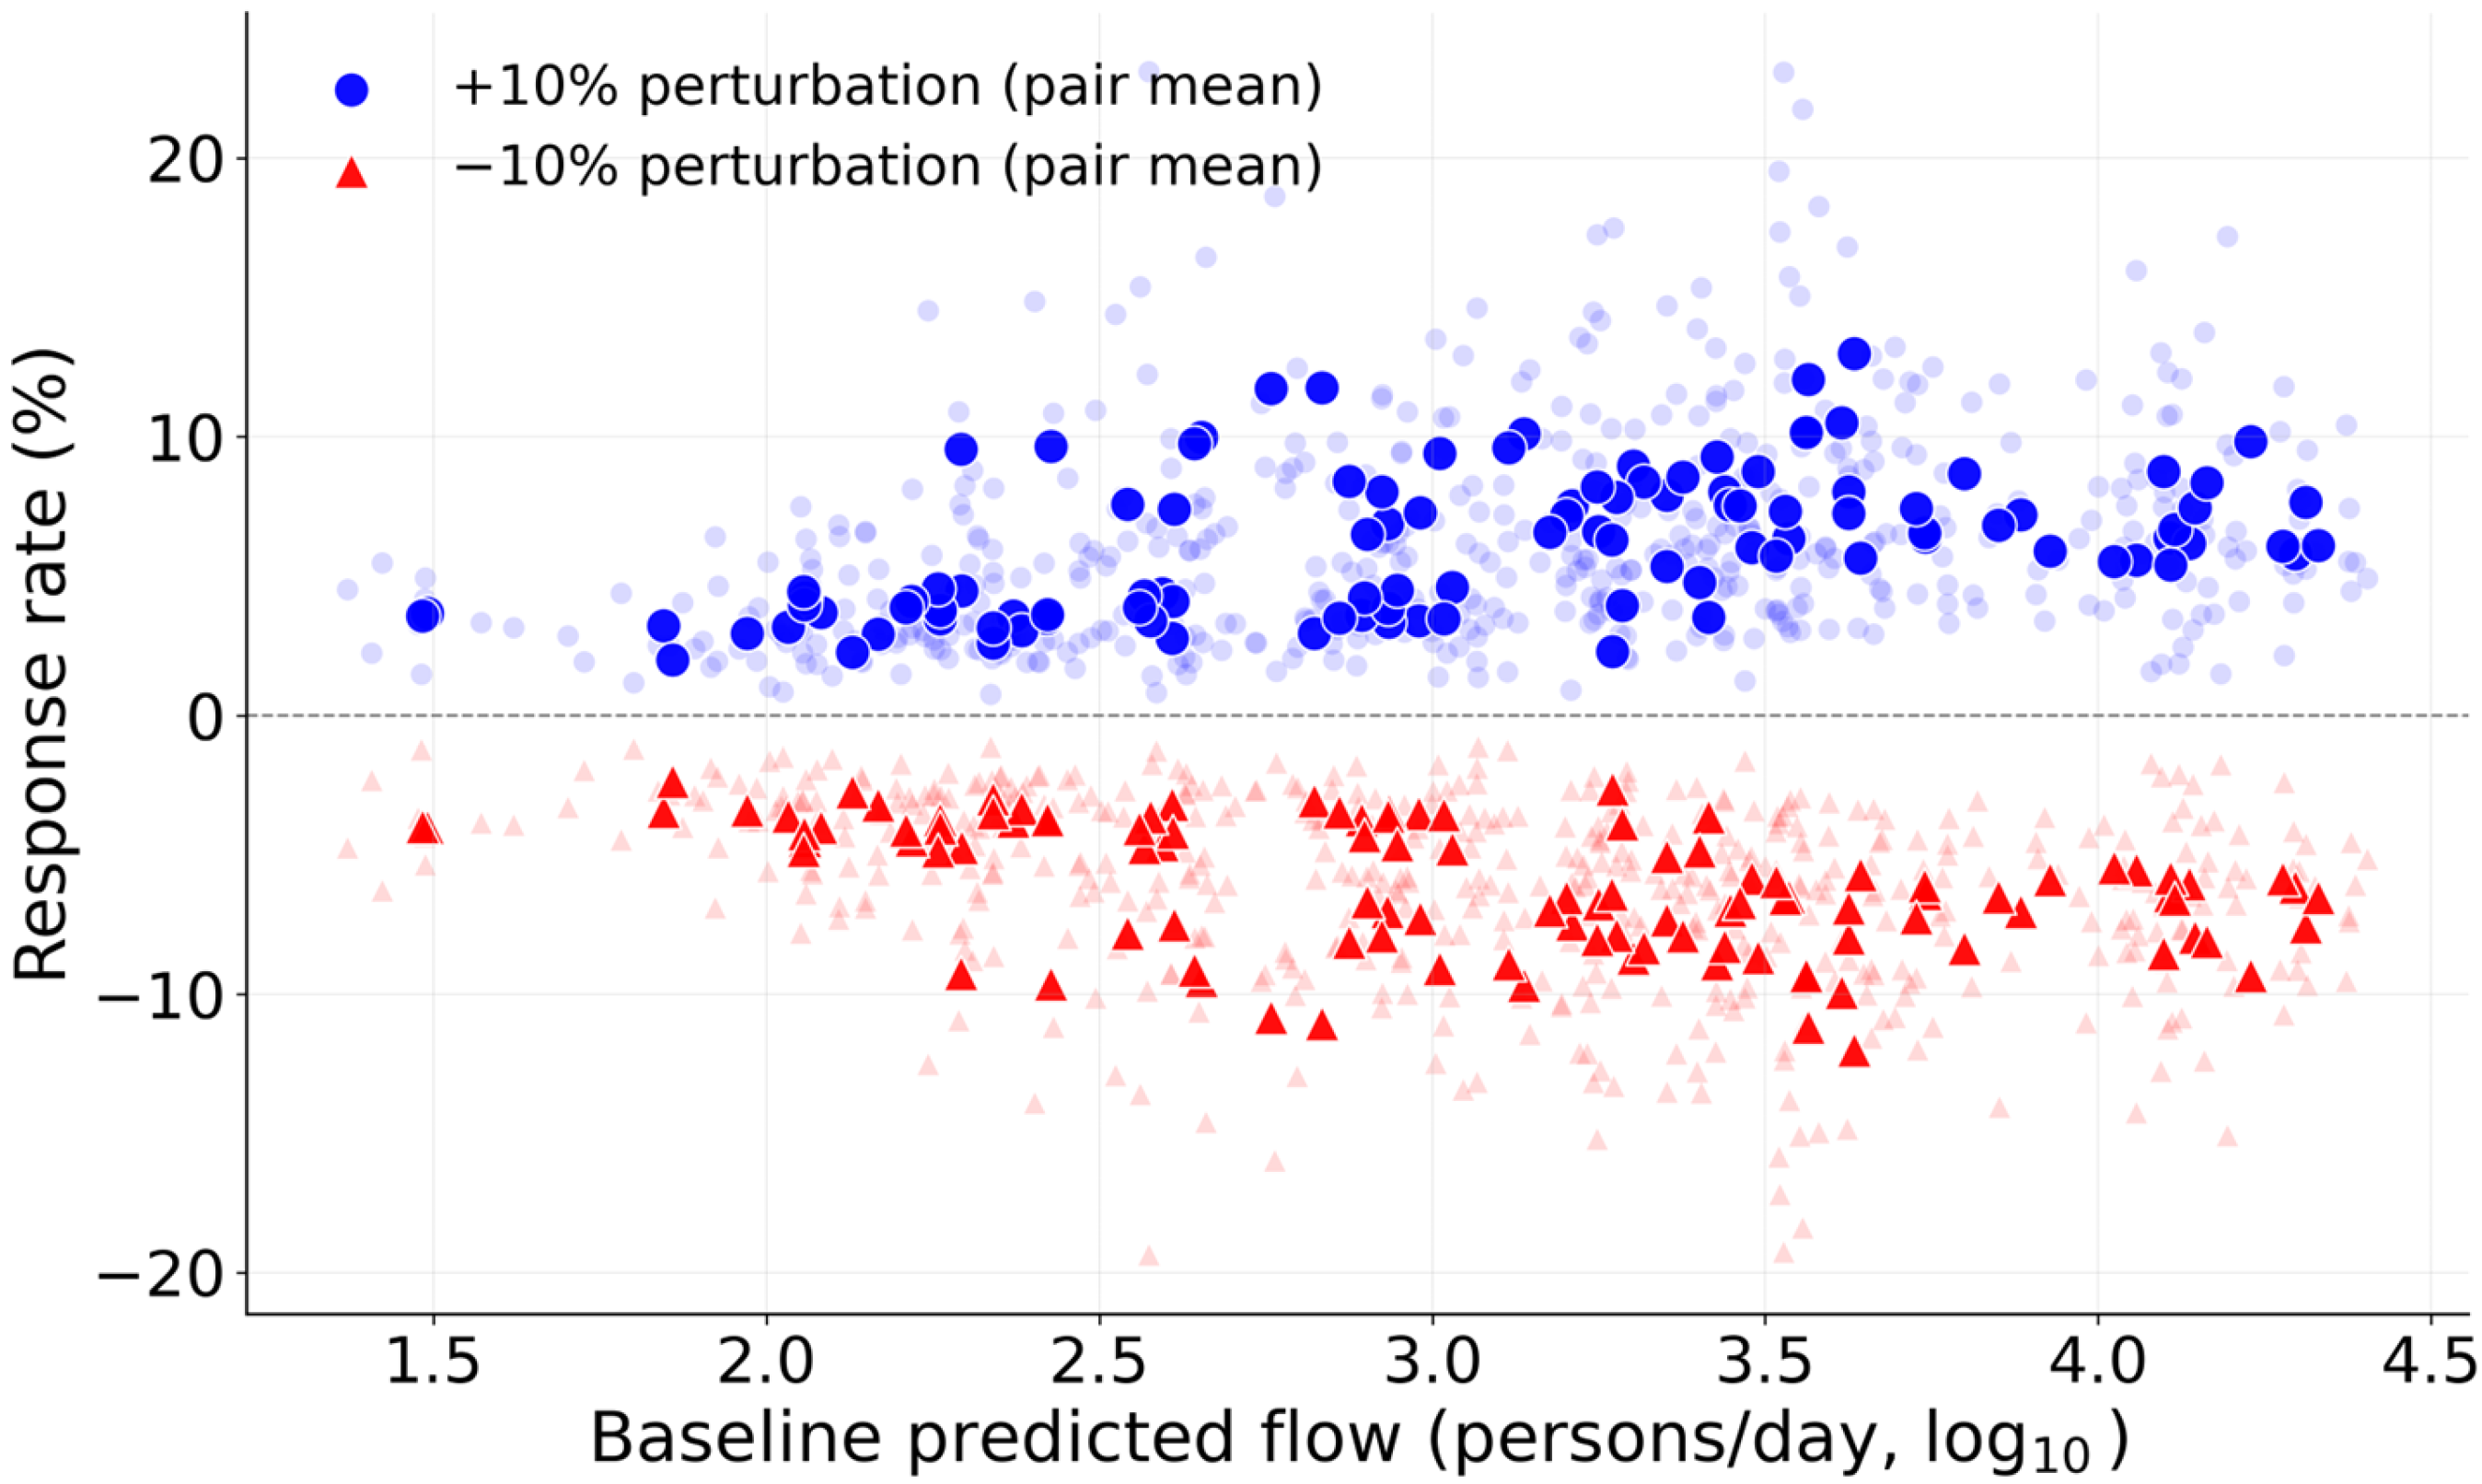
When transportation and corporate POI counts in all Foshan districts were perturbed by ±10%, the +10% perturbation increased predicted flows across all 110 Guangzhou-Foshan OD pairs in both directions, with a mean change rate of +6.18% ± 2.44%; the −10% perturbation decreased flows across all pairs, with a mean change rate of −6.13% ± 2.05%. The response is directionally unambiguous and corresponds to an elasticity of roughly 0.6 relative to the perturbation size: additional transportation and enterprise facilities in Foshan are associated with increased modeled cross-boundary flows, though the response is smaller than proportional.
Figure 7 shows the relationship between baseline flow volume and the per-pair response rate (averaged over the five seeds). Responses are positive for all 110 pairs under the +10% perturbation, ranging from about +2% to +13%, and show no systematic attenuation with baseline flow volume; if anything, the largest relative gains appear among high-volume corridor pairs. The positive corridor-wide response is therefore not driven by a subset of marginal pairs but reflects a broad-based modeled association.
Figure 7.
Relationship between baseline OD flow volume and response rate under transportation and corporate POI perturbations in Foshan (Guangzhou–Foshan scenario).
This uniformly positive response indicates that, at the current stage of Guangzhou-Foshan integration, upgrading Foshan’s transportation and enterprise functions is associated with stronger rather than weaker cross-boundary interaction. One plausible reading is that new facilities enlarge Foshan’s attractiveness for Guangzhou-origin trips—business, shopping, and services—faster than they substitute local demand, so net modeled flows rise. An alternative reading is that facility growth proxies overall functional intensification, which the model maps to higher interaction on both sides.
These model-implied responses are consistent with the expectation that enhancing Foshan’s transportation and enterprise infrastructure promotes Guangzhou-Foshan integration, and the direction of the response is uniform across pairs and seeds. The response is also consistent across activity contexts: models fitted separately to the weekday and weekend OD matrices yield mean changes of +6.06% ± 4.02% and +4.80% ± 3.93%, respectively, under the +10% perturbation. At the same time, the sub-proportional elasticity and the correlational nature of the model caution against reading the magnitude as a causal effect size; independent evidence, such as commuting surveys or purpose-resolved signaling data, would be required to separate genuinely new trips from reallocated existing ones.
This finding, however, is context-dependent. The Guangzhou-Foshan corridor is one of the most integrated and densely developed urban corridors in the GBA [39]. The same policy intervention may yield fundamentally different outcomes when applied to regions at different stages of urban integration. The following sub-section tests this hypothesis for a peripheral corridor.
4.4.2. Corporate POI Perturbations in Zhaoqing’s Recipient Counties Under the Guangzhou–Zhaoqing Corporate Development Scenario
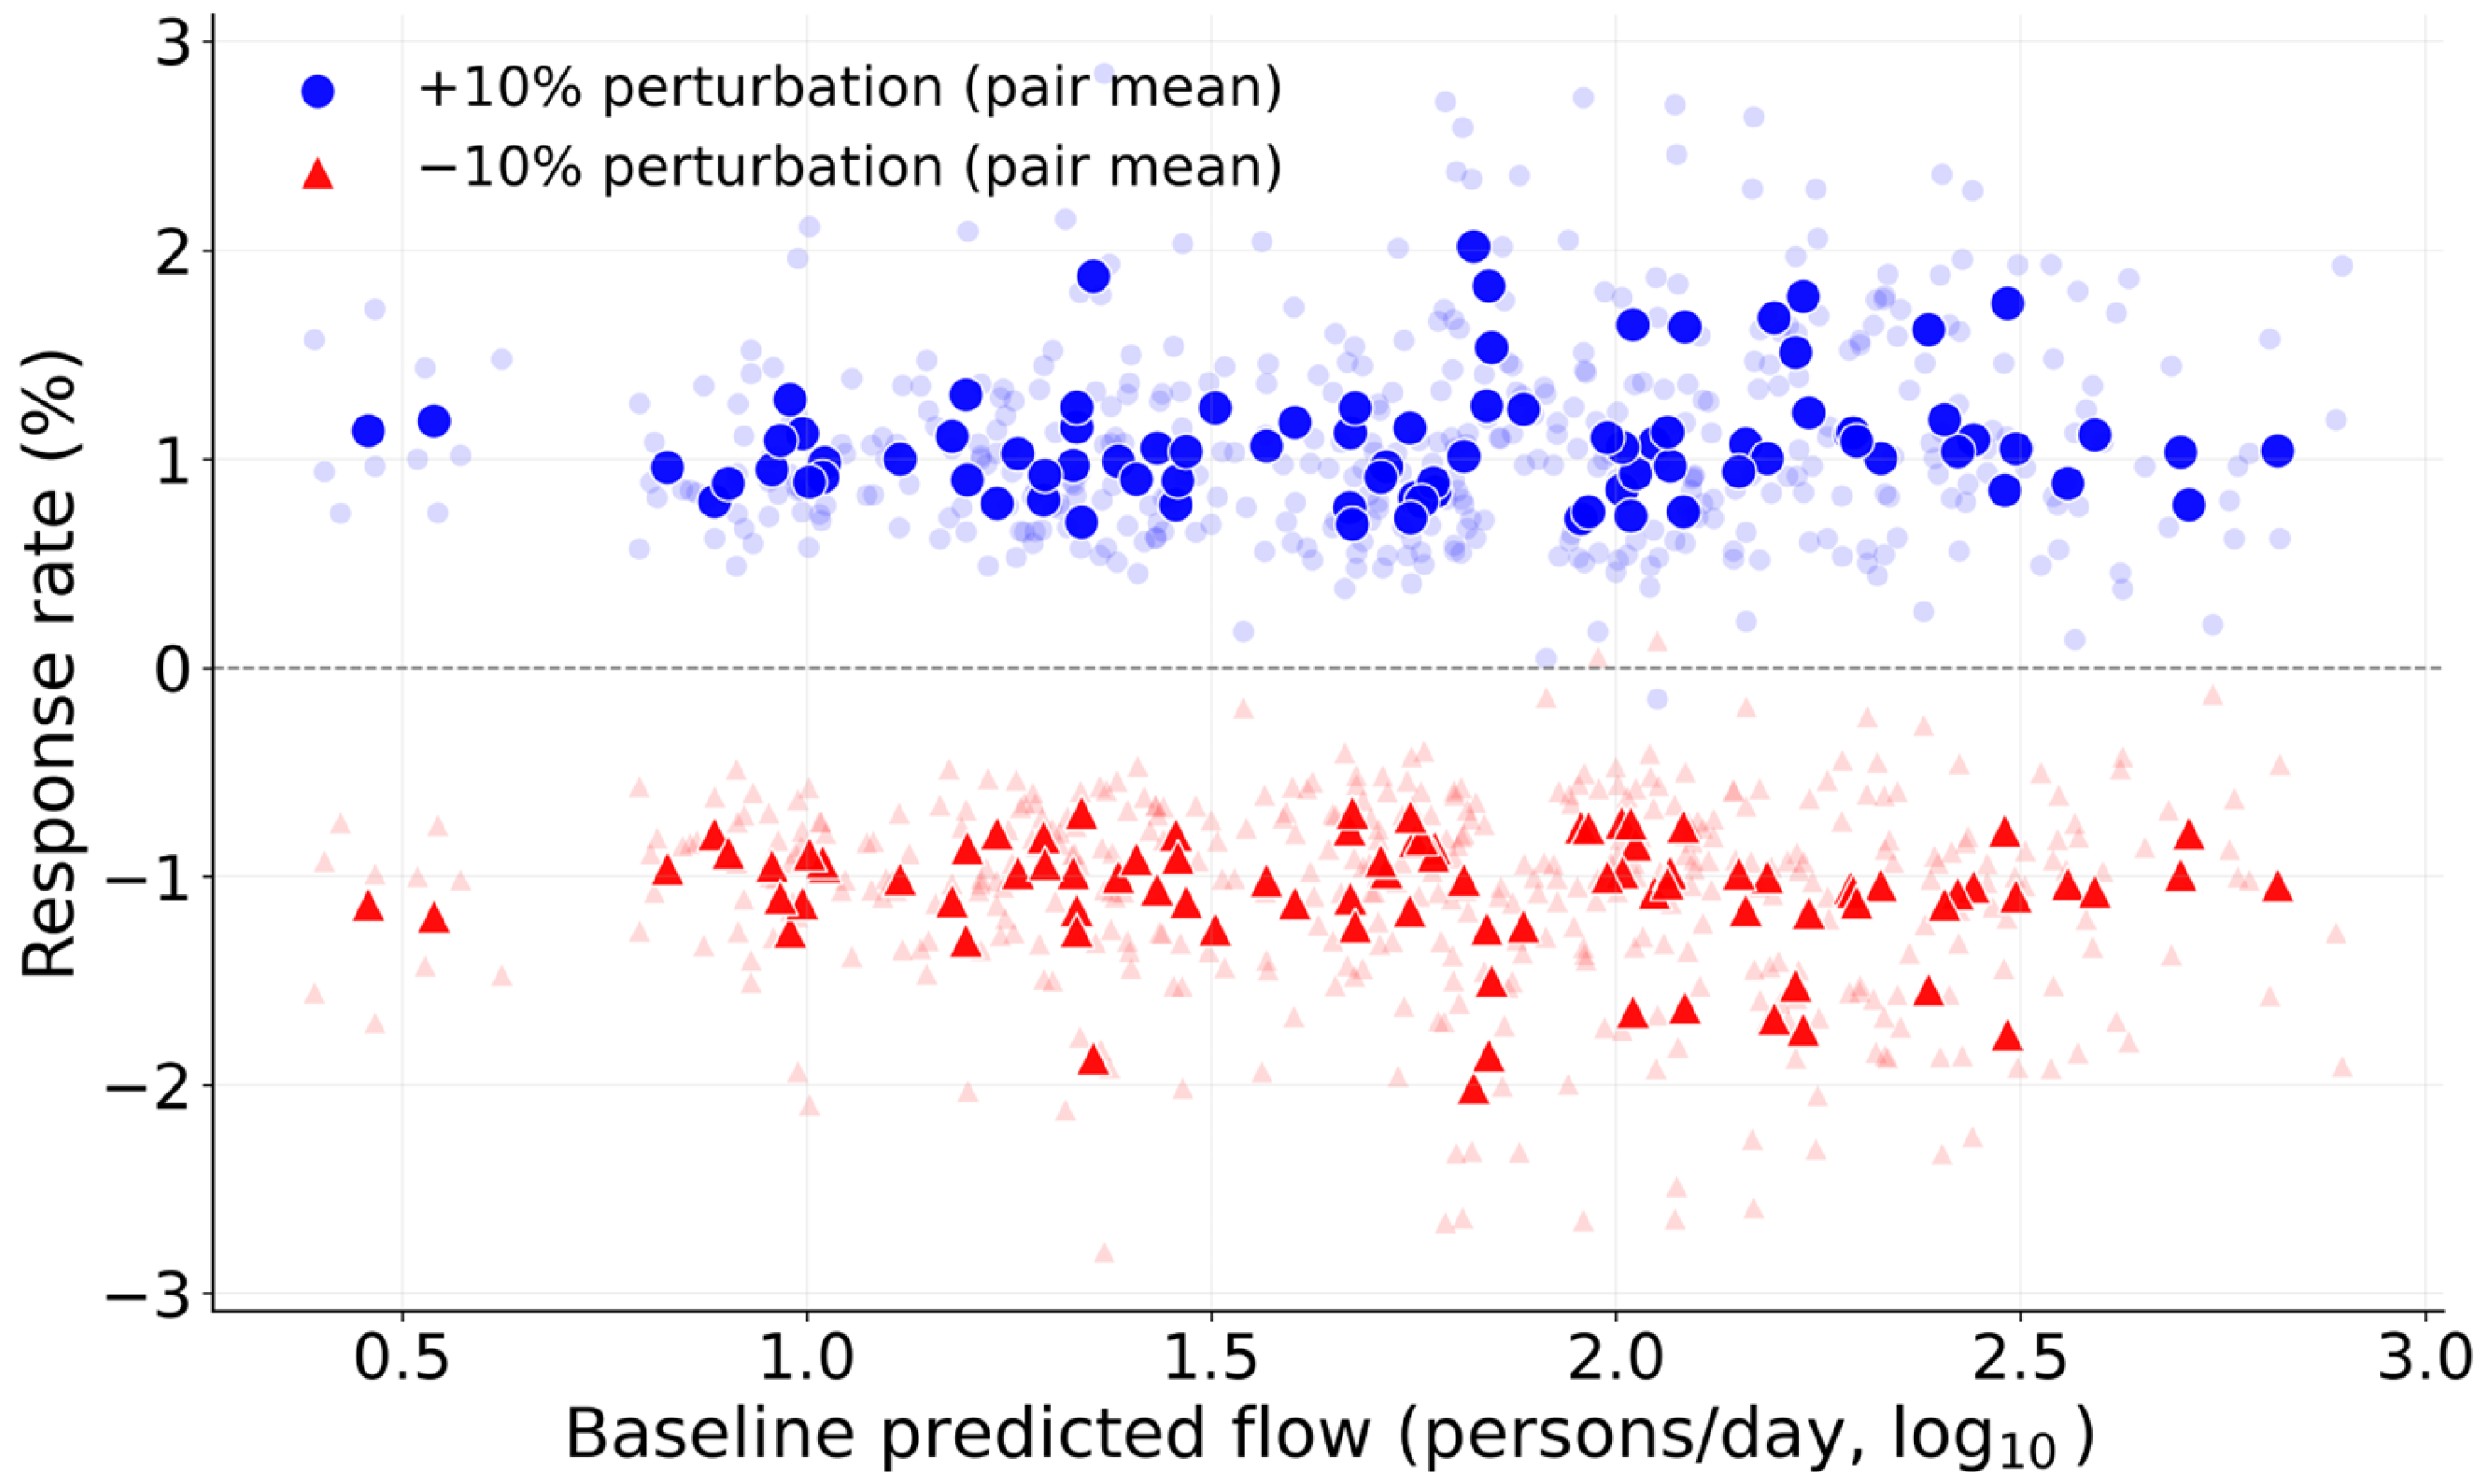
When corporate enterprise POI counts in all Zhaoqing counties were perturbed by ±10%, the +10% scenario produced a mean change rate of +1.08% ± 0.30% across the 88 Guangzhou-origin to Zhaoqing-destination OD pairs, with 99.77% of pairs showing positive responses on average across seeds; the −10% scenario produced a mirror-image mean change rate of −1.08% ± 0.28%, with 99.55% of pairs responding negatively. The response is thus directionally consistent and broadly distributed, although modest in magnitude.
Figure 8 shows the relationship between baseline flow volume and the per-pair response rate. Responses are tightly distributed (about +0.7% to +2.0% under the +10% perturbation) and largely independent of baseline flow volume, indicating a uniform, corridor-wide modest positive association rather than an amplification concentrated on particular flow segments.
Figure 8.
Relationship between baseline OD flow volume and response rate under corporate POI perturbations in Zhaoqing (Guangzhou–Zhaoqing scenario).
The overall pattern indicates that corporate POI increases in Zhaoqing are associated with daily mobility growth across the Guangzhou-Zhaoqing corridor, with 99.77% of pairs responding positively on average. The effect is broadly distributed across pairs, with no evidence of concentration in any particular subset of OD relationships. This pattern is consistent with a diffuse, corridor-wide association between enterprise expansion and cross-county mobility [40], although the magnitude remains modest and the interpretation is correlational.
4.4.3. Tourism POI Perturbations in Zhongshan Under the Shenzhen–Zhongshan Cultural Tourism Corridor Scenario
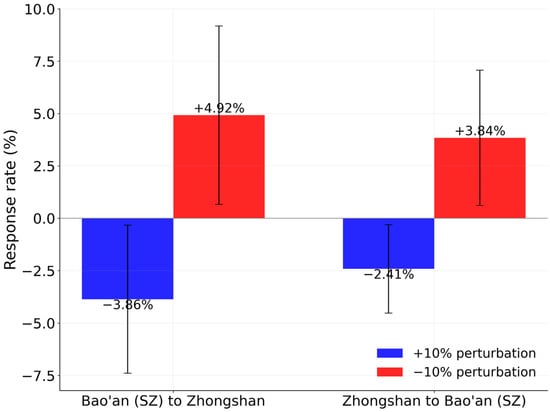
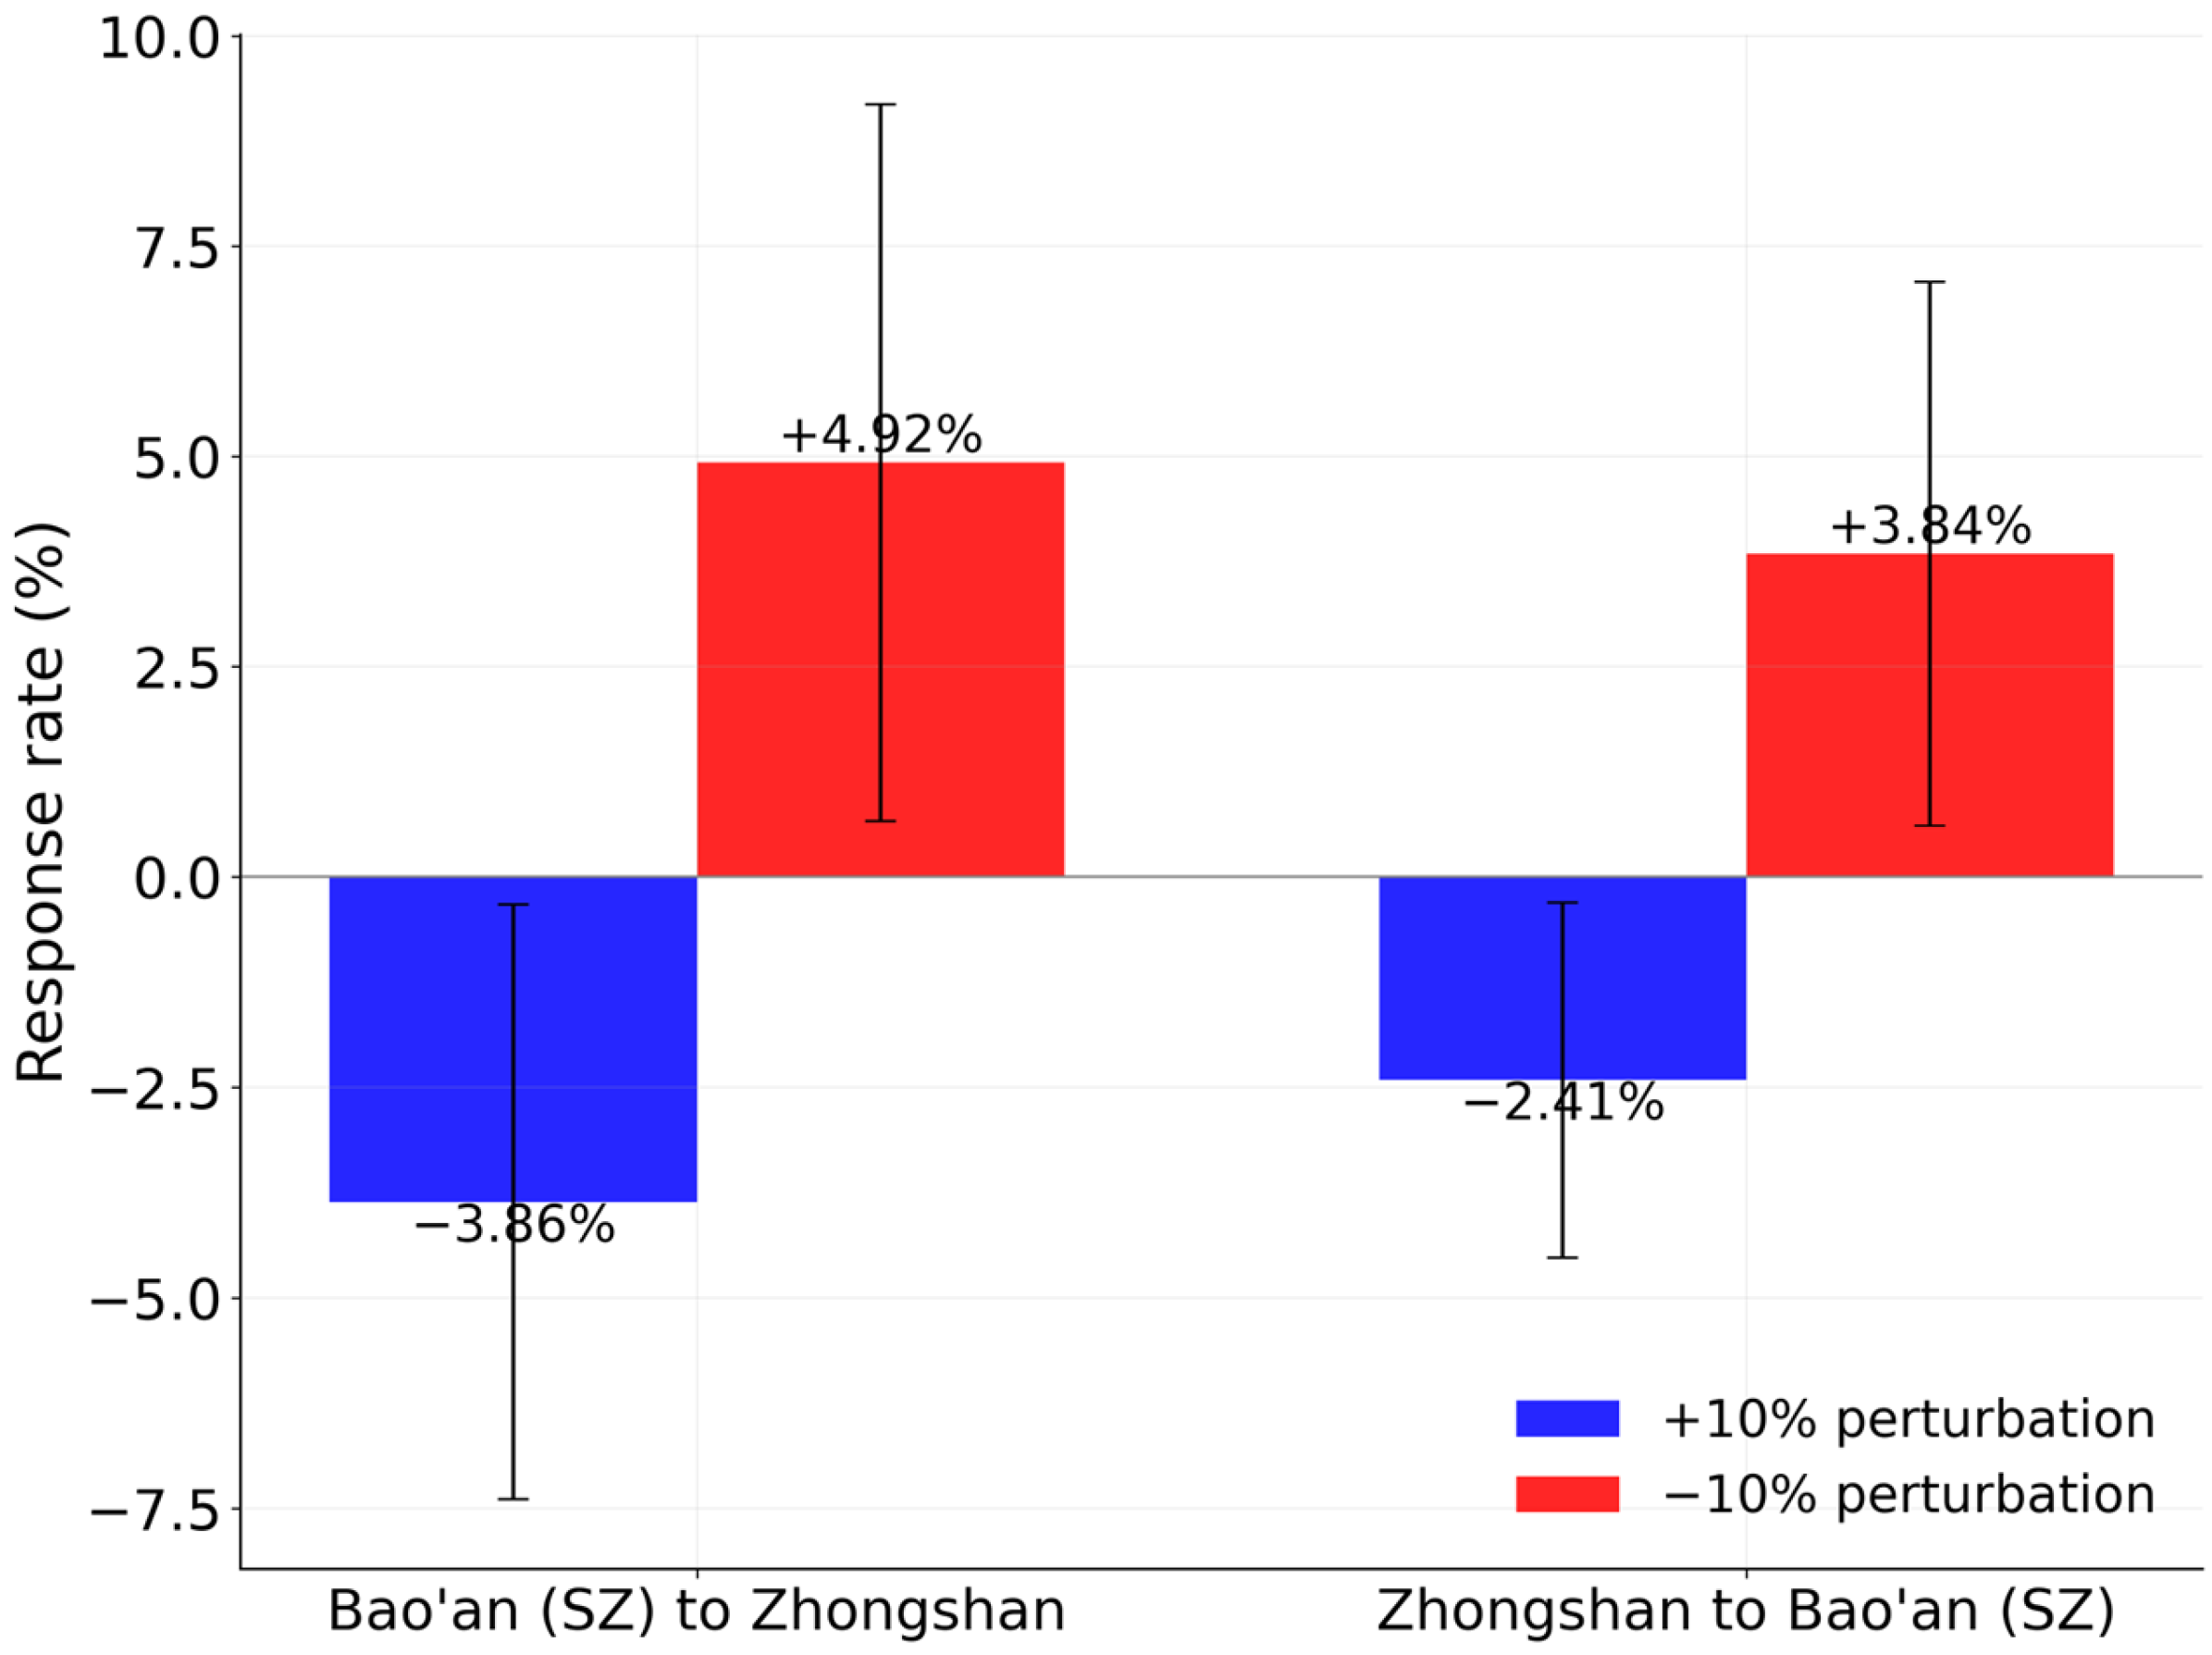
When tourism-related POI counts in Zhongshan were perturbed by ±10%, the model produced weak, roughly symmetric responses in the two directions of the single Shenzhen (Bao’an)-Zhongshan OD pair, as shown in Figure 9. Under the +10% scenario, the Bao’an-to-Zhongshan flow changed by −3.86% ± 3.53% across the five seeds (negative in four of five), and the reverse direction by −2.41% ± 2.11% (likewise negative in four of five). Under the −10% scenario, the responses flipped sign (+4.92% and +3.84% on average, positive in four of five seeds). Both directions thus move together with comparable magnitude, and the seed-level standard deviations are nearly as large as the means, so the signal is weak and should be regarded as indicative rather than conclusive.
Figure 9.
Mean response rates of the Shenzhen (Bao’an)–Zhongshan OD pair in both directions under ±10% tourism POI perturbations.
The two directions respond in the same direction and with similar magnitude, so the analysis provides little support for a strongly asymmetric attraction pattern or for a congestion- or commercialization-based deterrent effect: the weak negative sign is compatible with, but does not establish, a mild substitution-like response in which added local tourism capacity retains more activity on the Zhongshan side. The difference between the two directions (about 1.4 percentage points) lies well within the seed-level spread and rests on a single county pair per direction, which cannot sustain a directional conclusion.
This near-symmetric, weakly negative pattern carries a different implication for the Shenzhen-Zhongshan corridor prior to the opening of the Shenzhen-Zhongshan Link in June 2024. To the extent the model is informative, expanding Zhongshan’s tourism supply alone was not associated with increased modeled cross-river flows; the corridor’s pre-Link modeled mobility was not strongly coupled to Zhongshan’s tourism function. Post-2024 dynamics following the opening of the Link may differ substantially.
The “Shenzhen-Zhongshan cultural tourism corridor” hypothesis is therefore only partially supported: tourism expansion in Zhongshan is associated with weak, near-symmetric negative responses in modeled cross-river flows rather than the expected increases. The OD data capture all-purpose population flows rather than tourism trips specifically, and the observation period predates the Link’s operation. For current policy planning, tourism infrastructure expansion in Zhongshan should be coordinated with transportation capacity improvements and employment-linkage measures rather than relying on tourism supply alone.
5. Conclusions
This study addressed the challenge of modeling inter-county mobility flows and quantifying the associations between urban functional structure and regional mobility patterns in polycentric megacity regions. Using the Guangdong–Hong Kong–Macao Greater Bay Area as a case study, a Graph Convolutional Network-based framework was proposed that integrates 14 categories of POI data from 50 county-level units with a five-day average OD matrix. The framework offers methodological novelty in applying graph neural networks to OD-level spatial interaction modeling and practical value in guiding evidence-based functional and transportation planning for urban sustainability. The finding that modeled mobility responses to functional interventions vary systematically with regional development maturity underscores the need for place-based planning, as uniform facility expansion is unlikely to simultaneously deliver agglomeration efficiency, equitable job access across counties, or the reduction of carbon-intensive long-distance commuting.
The analysis yielded three main sets of findings. First, under a rigorous evaluation protocol, a 60/20/20 train-validation-test split, validation-based early stopping, and five random seeds, the proposed GCN model achieves a test R2 of 0.766 ± 0.077 and consistently outperforms four benchmarks, including a gravity model, POI-based linear regression, gradient boosting, and a graph-only GCN, confirming that both adjacency-based message passing and POI-derived functional features are necessary for accurate prediction.
Second, the policy scenario simulations reveal heterogeneous, stage-dependent response patterns. In the mature Guangzhou-Foshan corridor, a 10% increase in transport and corporate facilities in Foshan is associated with a mean response of +6.18% that is positive for all 110 county pairs, indicating that facility upgrading still strengthens cross-boundary interaction at this stage of integration. In the peripheral Guangzhou-Zhaoqing corridor, corporate expansion is associated with uniformly positive but smaller responses (mean +1.08%, positive for 99.77% of pairs). In the Shenzhen-Zhongshan corridor, tourism expansion elicits weak, near-symmetric negative responses in both directions (−3.86% and −2.41%), so the cultural-tourism-corridor hypothesis receives only partial support. These responses are model-implied sensitivity diagnostics rather than established causal mechanisms.
Third, the sensitivity analysis identifies shopping and consumption, catering services, corporate enterprises, and daily life services as the categories with the strongest model-implied marginal associations with mobility, followed by transportation facilities, while tourist attractions, leisure and entertainment, sports and fitness facilities, and financial institutions rank lowest. The ranking is stable across perturbation magnitudes and random seeds, suggesting that if these associations are corroborated by independent evidence, functional composition, in particular the supply of consumption and employment-related services, deserves a central place in land-use and transportation planning decisions.
Despite these findings, several limitations should be acknowledged, which can be grouped into three aspects. Regarding data scope, the analysis excludes Hong Kong and Macao due to data availability constraints regarding cross-border mobility statistics; the POI data are static cross-sectional snapshots that cannot capture the temporal dynamics of functional structure evolution; and the OD data represent a five-day average of all-purpose flows within a single observation window, so the conclusions are confined to routine daily mobility at that scale. Regarding generalization, the weekend-only model is less stable than the weekday model, and the current framework does not incorporate exogenous factors such as real-time traffic conditions or socio-demographic attributes. Regarding interpretation, collinearity among the 14 POI categories prevents the sensitivity and scenario responses from being read as isolated causal effects, and the absence of intra-county flows precludes verifying mechanisms such as job-housing reallocation; sustainability claims are accordingly framed in terms of mobility efficiency and accessibility rather than directly measured emissions or equity outcomes. Despite these limitations, this study provides a methodological foundation for graph-based deep learning in spatial interaction modeling and offers actionable insights for sustainable land-use and transportation planning in polycentric urban regions.
Author Contributions
Conceptualization, M.H.; methodology, M.H. and S.L.; data curation, M.H.; formal analysis, M.H., C.L. and H.S.; writing—original draft preparation, M.H. and S.L.; writing—review and editing, M.H. and H.S.; visualization, M.H. and C.L.; supervision, M.H. All authors have read and agreed to the published version of the manuscript.
Funding
This research received no external funding.
Institutional Review Board Statement
Not applicable.
Informed Consent Statement
Not applicable.
Data Availability Statement
The county-level OD flow data were derived from commercial mobile signaling data of China Unicom and cannot be publicly redistributed in accordance with the data licensing agreement; the weekday and weekend extracts are available from the corresponding author upon reasonable request. The POI data are sourced from Amap (https://www.amap.com) and are subject to the platform’s terms of use.
Conflicts of Interest
The authors declare no conflicts of interest.
References
- Lechtenberg, D. Modeling Out-Degree of Node in Commuter Networks: The Impact of Socioeconomic Profiles and Spatial Autocorrelation in Shaping Regional Connectivity. Ann. Am. Assoc. Geogr. 2024, 114, 1744–1756. [Google Scholar] [CrossRef] [Scilit]
- Mortaheb, R.; Jankowski, P.; Murray, A. A Planning Support Framework to Enable Smart Mobility: Integrating Multi-Objective Spatial Optimization and GIS to Enhance Commuting Efficiency. Comput. Environ. Urban Syst. 2025, 119, 102269. [Google Scholar] [CrossRef] [Scilit]
- Lee, S.; Seo, J.G.; Webster, C. The Decentralising Metropolis: Economic Diversity and Commuting in the US Suburbs. Urban Stud. 2006, 43, 2525–2549. [Google Scholar] [CrossRef] [Scilit]
- Lin, S.; Cao, Z.; Niu, X.; Yan, L. Impact of Industrial Dynamics on Changing Commuting Patterns in Megacities: A Case Study of Shanghai. Geogr. Sci. 2025, 45, 783–794. [Google Scholar] [CrossRef]
- Yu, Z.; Liu, X. Unveiling Industrial Functional Networks in Megacity Regions: A Spatial and Network-Based Analysis of Agglomeration Economies. Environ. Plan. B Urban Anal. City Sci. 2026. [Google Scholar] [CrossRef] [Scilit]
- Ramani, A.; Alcedo, J.; Bloom, N. How Working from Home Reshapes Cities. Proc. Natl. Acad. Sci. USA 2024, 121, 2017. [Google Scholar] [CrossRef] [Scilit]
- Tabuchi, T.; Thisse, J. Regional Specialization, Urban hierarchy, and Commuting Costs*. Int. Econ. Rev. 2006, 47, 1295–1317. [Google Scholar] [CrossRef] [Scilit]
- Tsutsumi, M.; Tamesue, K. Intraregional Flow Problem in Spatial Econometric Model for Origin-Destination Flows. Procedia-Soc. Behav. Sci. 2011, 21, 184–192. [Google Scholar] [CrossRef] [Scilit]
- Fischer, M.M.; LeSage, J.P. Network Dependence in Multi-Indexed Data on International Trade Flows. J. Spat. Econom. 2020, 1, 4. [Google Scholar] [CrossRef] [Scilit]
- Zhang, D.; Wang, X.C. Effects of Jobs–Residence Balance on Commuting Patterns. Transp. Res. Rec. J. Transp. Res. Board 2015, 2500, 80–92. [Google Scholar] [CrossRef] [Scilit]
- Niu, F.; Xuan, B. A Novel Approach to Modeling Urban Commuting Traffic Demands. Cities 2025, 156, 105583. [Google Scholar] [CrossRef] [Scilit]
- Liu, Z.; Liu, Z.; Fu, X. Dynamic Origin-Destination Flow Prediction Using Spatial-Temporal Graph Convolution Network With Mobile Phone Data. IEEE Intell. Transp. Syst. Mag. 2022, 14, 147–161. [Google Scholar] [CrossRef] [Scilit]
- Wang, Y.; Yao, X.; Liu, Y.; Li, X. Generating Population Migration Flow Data from Inter-Regional Relations Using Graph Convolutional Network. Int. J. Appl. Earth Obs. Geoinf. 2023, 118, 103238. [Google Scholar] [CrossRef] [Scilit]
- Zhang, Z.; Yang, J.; Chen, X.; Wu, Y. Graph Neural Networks with Flow Conservation Constraints for Real-Time Origin–Destination Matrix Completion. Pattern Recognit. 2026, 170, 112046. [Google Scholar] [CrossRef] [Scilit]
- Yeo, J.; Jang, K.; Kim, S. Scalable Origin-Destination Travel Demand Prediction Using Stratified Graph Convolutional Network. Int. J. Urban Sci. 2025, 30, 810–828. [Google Scholar] [CrossRef] [Scilit]
- Wang, Y.; Zhou, M. A Spatial—Temporal Graph Convolutional Network Enhanced by Geospatial Knowledge to Forecast Origin—Destination Flows. Int. J. Geogr. Inf. Syst. 2026, 40, 2216–2246. [Google Scholar] [CrossRef] [Scilit]
- Rong, C.; Ding, J.; Li, Y. An Interdisciplinary Survey on Origin-Destination Flows Modeling: Theory and Techniques. ACM Comput. Surv. 2024, 57, 1–49. [Google Scholar] [CrossRef] [Scilit]
- Zhao, M.; Zhang, D.; Shi, Z.; Wu, C. Theory-Informed and Interpretable Graph Learning for Urban Commuting Flows. Sustain. Cities Soc. 2026, 148, 107575. [Google Scholar] [CrossRef] [Scilit]
- Lenormand, M.; Bassolas, A.; Ramasco, J.J. Systematic Comparison of Trip Distribution Laws and Models. J. Transp. Geogr. 2016, 51, 158–169. [Google Scholar] [CrossRef] [Scilit]
- Hilton, B.; Sood, A.P.; Evans, T.S. Predictive Limitations of Spatial Interaction Models: A Non-Gaussian Analysis. Sci. Rep. 2020, 10, 17474. [Google Scholar] [CrossRef] [Scilit]
- Xue, J.; Tan, R.; Ma, J.; Ukkusuri, S.V. Data Science in Transportation Networks with Graph Neural Networks: A Review and Outlook. Data Sci. Transp. 2025, 7, 10. [Google Scholar] [CrossRef] [Scilit]
- Rahmani, S.; Baghbani, A.; Bouguila, N.; Patterson, Z. Graph Neural Networks for Intelligent Transportation Systems: A Survey. IEEE Trans. Intell. Transp. Syst. 2023, 24, 8846–8885. [Google Scholar] [CrossRef] [Scilit]
- Wu, Y.; Xie, X.; Yu, C.; Xiao, Z.; Zhang, J.; Xu, Z.; Mai, Z. A Survey on Origin-Destination Flow Prediction. In Proceedings of the 2024 11th International Conference on Soft Computing & Machine Intelligence (ISCMI), Melbourne, Australia, 22–23 November 2024; pp. 48–52. [Google Scholar] [CrossRef] [Scilit]
- Jiang, S.; Liu, Q.; Dai, X. Ricci-Curvature-Enhanced Temporal Graph Convolutional Networks for Traffic Speed Forecasting. IEEE Access 2026, 14, 20414–20426. [Google Scholar] [CrossRef] [Scilit]
- Ke, J.; Qin, X.; Yang, H.; Zheng, Z.; Zhu, Z.; Ye, J. Predicting Origin-Destination Ride-Sourcing Demand with a Spatio-Temporal Encoder-Decoder Residual Multi-Graph Convolutional Network. Transp. Res. Part C Emerg. Technol. 2021, 122, 102858. [Google Scholar] [CrossRef] [Scilit]
- Wang, X.; Zhang, Y.; Zhang, J. Large-Scale Origin–Destination Prediction for Urban Rail Transit Network Based on Graph Convolutional Neural Network. Sustainability 2024, 16, 10190. [Google Scholar] [CrossRef] [Scilit]
- Xing, X.; Wang, B.; Ning, X.; Wang, G.; Tiwari, P. Short-Term OD Flow Prediction for Urban Rail Transit Control: A Multi-Graph Spatiotemporal Fusion Approach. Inf. Fusion 2025, 118, 102950. [Google Scholar] [CrossRef] [Scilit]
- Jiao, X.; Zhang, X. Towards Sustainable Intelligent Transportation Systems: A Hierarchical Spatiotemporal Graph—Hypergraph Network for Urban Traffic Flow Prediction. Sustainability 2026, 18, 180. [Google Scholar] [CrossRef] [Scilit]
- Shi, Y.; Liu, Y.; Wang, D.; Deng, M.; Jin, R. Predicting Origin–Destination Travel Flow Based on a Spatiotemporal Relational Graph Learning Approach. Trans. GIS 2026, 30, e70274. [Google Scholar] [CrossRef] [Scilit]
- Ling, C.; Niu, X.; Yang, J.; Zhou, J.; Yang, T. Unravelling Heterogeneity and Dynamics of Commuting Efficiency: Industry-Level Insights into Evolving Efficiency Gaps Based on a Disaggregated Excess-Commuting Framework. J. Transp. Geogr. 2024, 115, 103820. [Google Scholar] [CrossRef] [Scilit]
- Nam, S.; Hong, S. The Effects of Employment Center Characteristics on Commuting Time: A Case Study of the Seoul Metropolitan Area. ISPRS Int. J. Geo-Inf. 2025, 14, 116. [Google Scholar] [CrossRef] [Scilit]
- Li, S.; Shen, J.; Gu, H. Industrial Structure Rationalisation, Upgrading, and the Geography of Intercity Migration in China. Popul. Space Place 2025, 31, e70113. [Google Scholar] [CrossRef] [Scilit]
- Li, M.; Kwan, M.P.; Wang, F.; Wang, J. Using Points-of-Interest Data to Estimate Commuting Patterns in Central Shanghai, China. J. Transp. Geogr. 2018, 72, 201–210. [Google Scholar] [CrossRef] [Scilit]
- Liu, S.; Zhou, C.; Rong, J.; Bian, Y.; Wang, Y. Concordance between Regional Functions and Mobility Features Using Bike-Sharing and Land-Use Data near Metro Stations. Sustain. Cities Soc. 2022, 84, 104010. [Google Scholar] [CrossRef] [Scilit]
- Liu, S.; Rong, J.; Zhou, C.; Gao, Y.; Xing, L. Temporal Heterogeneity in Land Use Effects on Urban Rail Transit Ridership—Case of Beijing, China. Land 2025, 14, 665. [Google Scholar] [CrossRef] [Scilit]
- Deng, J.; Deng, Y.; Liu, J.; Zhu, Y.; Yang, G.; Hu, Z. Building-Level Population Estimation Method Using a Bayesian-Informed Hierarchical Learning Model. ISPRS Int. J. Geo-Inf. 2026, 15, 264. [Google Scholar] [CrossRef] [Scilit]
- Hu, H.; Yan, J.; Wang, B.; Sun, X. Evaluation of Comprehensive Vitality of Shanghai’s Commercial Centers Using Multi-Dimensional Geospatial Big Data. Sci. Rep. 2025, 15, 22060. [Google Scholar] [CrossRef] [Scilit]
- Wu, T.; Lin, X.; Qin, J.; Deng, Q. Self-Supervised Graph Learning for OD Flow Semantic Awareness: Harnessing High-Order Relationships via Trajectory Chains and POI Contexts. Transp. Res. Part C Emerg. Technol. 2026, 183, 105433. [Google Scholar] [CrossRef] [Scilit]
- Huang, Y.; Lang, W.; Chen, T.; Wu, J. Regional Coordinated Development in the Megacity Regions: Spatial Pattern and Driving Forces of the Guangzhou-Foshan Cross-Border Area in China. Land 2023, 12, 753. [Google Scholar] [CrossRef] [Scilit]
- Liu, C.; Sun, W.; Wu, J. Synergistic Effects of Manufacturing Spatial Agglomeration and Carbon Emission Efficiency in Urban Hierarchies: Evidence from the Yangtze River Delta, China. Energy 2026, 359, 141130. [Google Scholar] [CrossRef] [Scilit]

Disclaimer/Publisher’s Note: The statements, opinions and data contained in all publications are solely those of the individual author(s) and contributor(s) and not of MDPI and/or the editor(s). MDPI and/or the editor(s) disclaim responsibility for any injury to people or property resulting from any ideas, methods, instructions or products referred to in the content. |
© 2026 by the authors. Licensee MDPI, Basel, Switzerland. This article is an open access article distributed under the terms and conditions of the Creative Commons Attribution (CC BY) license.