


Abstract
This paper mainly investigates the causal relationship between the spatial structure of urban agglomerations and carbon emission intensity, and clarifies the underlying mechanisms. We employ the rank-size rule to characterize the polycentric indices of 21 Chinese urban agglomerations from 2006 to 2022, representing their spatial structures, with carbon emission intensity measured as the ratio of total carbon emissions to GDP. Using a two-way fixed-effects model and employing topographic relief as an instrumental variable, our paper examines the impact of urban agglomeration spatial structures on carbon emission intensity and further investigates the underlying transmission mechanisms and heterogeneity effects. The findings reveal that polycentric spatial development in urban agglomerations leads to statistically significant reductions in carbon emission intensity. The robustness and endogeneity tests support the benchmark regression results. Mechanism tests reveal that polycentric spatial structures of urban agglomeration reduce carbon emission intensity by promoting technological progress, guiding industrial relocation, and alleviating traffic congestion. However, they also increase carbon emission intensity by reducing public transportation and promoting urban sprawl, indicating negative environmental externalities. Overall, the positive environmental externalities of polycentric structures outweigh the negative ones. Considering the considerable differences in internal integration across urban agglomerations in China, we perform a heterogeneity analysis. Heterogeneity analysis shows that internal integration moderates the effect of polycentric spatial structure on carbon emission intensity, with greater integration weakening the emission-reduction effect.
1. Introduction
China has continued to advance its efforts to curb carbon emissions. In 2025, carbon dioxide emissions per unit of GDP fell by 5.0%, and non-fossil energy accounted for 21.7% of total energy consumption. Nevertheless, substantial challenges remain in achieving further emission reductions, as China’s total energy consumption reached 6.17 billion tonnes of standard coal equivalent in 2025, with coal still accounting for 51.4% of total energy consumption. With China’s rapid economic growth and accelerating urbanization, cities are increasingly developing in coordination to form urban agglomerations. However, this has been accompanied by worsening traffic congestion, heightened travel intensity, and the large-scale commissioning of newly constructed transportation and building infrastructure, all of which are significantly increasing energy demand and carbon emissions [1]. These issues have garnered significant attention from government agencies and numerous scholars both domestically and internationally. In the Action Plan for Carbon Peaking Before 2030 [2], the Chinese Government explicitly incorporates “carbon peaking” and “carbon neutrality” into the overall framework of ecological civilization development, systematically deploying carbon reduction tasks across key sectors and regions. This policy framework underscores the strategic importance of carbon mitigation in promoting high-quality economic development. Related research has increasingly highlighted the adverse consequences of carbon emissions for human health and economic development. Carbon-emitting activities can increase air pollution and are associated with premature mortality, cardiovascular and respiratory diseases, reduced quality of life, and substantial economic costs [3,4,5,6,7]. Therefore, in the face of the threats and harms posed by carbon emissions, it is imperative to identify the influencing factors of carbon emissions and promptly implement effective governance measures.
In the relevant literature, spatial structures are primarily categorized into two models: monocentric and polycentric structures. Monocentric structures emphasize the economic dominance of core cities, which can easily generate a “siphon effect”, leading to excessive resource concentration. Polycentric structures are characterized by a balanced distribution of cities within urban agglomerations without a single dominant core, and enhance overall spatial efficiency by fostering inter-city division of labor through multiple functional nodes [8,9,10]. Polycentricity is commonly assessed using measures such as the city primacy index and the rank-size distribution [11,12,13]. Following [13], this study constructs a polycentricity index based on the rank-size rule, incorporating both population and economic indicators to characterize the spatial structure of urban agglomerations. A higher polycentric index indicates a more polycentric structure within the urban agglomeration.
Existing research on spatial structure and carbon emissions has largely concentrated on individual cities and the effects of their spatial configurations on emissions. It is widely recognized that a close relationship exists between the two [8,14]. With China’s sustained high-speed economic growth and accelerated urbanization, multiple cities have developed synergistically to form urban agglomerations, which represent a higher-level organizational form of urban development [14]. Existing studies generally hold that a rational urban spatial structure in China can reduce carbon emissions by promoting green technological progress while lowering energy use [13]. However, systematic analyses examining the link between spatial structure of urban agglomeration and carbon emissions remain scarce, with existing research primarily focused on cities, provinces, and a limited number of specific urban agglomerations, leading to inconsistent findings across different analytical scales [15,16,17,18]. Some scholars argue that polycentric development is generally considered to enhance CO2 emission efficiency [7,8,9]. Conversely, other studies indicate that polycentric structures may increase energy consumption during early development stages due to redundant infrastructure construction and industrial homogeneity, thereby elevating carbon emission levels. Consequently, assessing how agglomeration spatial patterns relate to carbon dioxide emissions has become a critical research topic for socioeconomic sustainable development [3].
Against this backdrop, this study investigates three questions concerning the spatial structure of urban agglomerations: (1) What relationship exists between urban agglomeration spatial structure and carbon emission intensity? (2) Through which channels does urban agglomeration spatial structure influence carbon emission intensity? (3) Given the varying degrees of integration within urban agglomerations, does the spatial structure of urban agglomerations exert heterogeneous effects on carbon emission intensity?
The main research contributions of this study are outlined below: First, based on the rank-size rule, we measure the polycentric index of urban agglomerations to quantify their spatial structure. Using a two-way fixed effects model and an instrumental variables approach, we analyze the impact of urban agglomeration spatial structure on carbon emission intensity. Second, we examine the mechanism through which urban agglomeration spatial structure influences carbon emission intensity and conduct corresponding tests on this relationship, providing robust empirical evidence for relevant theories. Finally, this study examines the heterogeneity of spatial structure’s impact on carbon emission intensity by focusing on the degree of internal integration within urban agglomerations and employing four distinct indicators.
The structure of this paper is outlined below: Section 2 proposes theoretical hypotheses based on a review of the literature; Section 3 outlines the research area, variable measurements, and benchmark model establishment; Section 4 presents benchmark regression results and conducts robustness and endogeneity analyses; Section 5 delves into the operational mechanisms and heterogeneity characteristics; Section 6 analyzes the research findings in relation to the hypotheses proposed in this study. Section 7 summarizes the main conclusions, discusses the limitations of the study, and proposes corresponding policy recommendations.
2. Literature Review and Research Hypotheses
2.1. Literature Review
With the rapid acceleration of urbanization, urban agglomerations have become important carriers of economic activity, while the carbon emissions associated with urbanization have emerged as a significant environmental concern [8,9,10]. Early research primarily focused on the links among urbanization, energy use, and carbon emissions at the macro level. Empirical evidence indicates that urbanization is often accompanied by rising energy demand and carbon emissions [19,20,21], though the direction and intensity of this relationship vary significantly across regions and developmental stages [22]. Theoretically, spatial agglomeration can enhance energy efficiency and accelerate technology diffusion through economies of scale and knowledge spillovers [23,24], yet may also diminish or even negate emission reduction potential due to negative externalities like traffic congestion, land scarcity, and redundant infrastructure development [25]. Overall, empirical research on the spatial structure of urban agglomerations and its relationship with carbon emissions remains insufficient, necessitating the establishment of an indicator system and further empirical studies.
In specific studies on the spatial structure of urban agglomerations, scholars typically categorize them into monocentric and polycentric patterns based on morphological or functional dimensions, emphasizing the differences between these two dimensions in terms of measurement and policy implications [26]. Monocentric structures highlight the economic dominance of core cities, often creating a “siphon effect” that leads to excessive resource concentration and traffic congestion. In contrast, polycentric structures promote inter-city division of labor and collaboration, as well as work-residence balance, by establishing multiple functional nodes, thereby enhancing overall spatial efficiency [27]. Currently, academia has yet to establish a unified methodological framework for measuring polycentric structures in urban agglomerations. Two prevalent quantitative approaches to polycentricity are the city primacy index and rank-size distribution [11,13].
Research on spatial structure and carbon emissions has primarily focused on the urban or regional level, with few empirical studies examining the relationship between settlement patterns and carbon emissions [14]. Some studies suggest that polycentric development models may lower transport-related energy use and emissions relative to output by shortening commuting distances, optimizing the match between transportation and work-residence locations, promoting service sector development, and facilitating innovation diffusion [9,17,28]. Conversely, other studies indicate that polycentric development may not necessarily achieve emission reductions under specific conditions, as high-carbon growth driven by industrial and infrastructure expansion could lead to overall emission increases. This divergence may stem from variation in polycentricity measures, spatial scales, and the emission sources considered.
Existing research indicates that polycentric patterns reduce emissions in the transportation sector by improving work-residence balance and optimizing transportation network distribution, thereby shortening commuting distances and lowering motor vehicle dependency [9,29]. They also curb the excessive concentration of energy-intensive industries in single core areas by promoting flexible industrial layouts and inter-center division of labor, while knowledge and talent flow between nodes accelerate the diffusion of low-carbon technologies [9]. Furthermore, previous research investigating heterogeneous effects of polycentric spatial structures predominantly analyzes heterogeneity at geographic and regional levels [30], with discussions often confined to single dimensions. Systematic exploration of multidimensional institutional-spatial coupling mechanisms remains insufficient. Figure 1 illustrates the positive and negative environmental externalities associated with polycentric spatial structures and summarizes their potential effects on carbon emissions.
Figure 1.
Positive and negative environmental externalities of polycentric spatial structure.
Overall, while existing research has revealed potential links between the spatial structure of urban agglomerations and carbon emissions, there remains further scope for more systematic and in-depth analysis. From a research perspective, most current literature focuses on individual urban agglomerations or regional levels, lacking nationwide comparative analyses and cross-regional empirical studies. In terms of mechanisms, existing studies predominantly explain carbon emission disparities through single pathways, failing to explore multidimensional mechanisms. Furthermore, the heterogeneity analyses in current research primarily focus on regional or scale-level differences, neglecting the influence of other factors on the emission reduction effects of agglomeration spatial structures.
Against this backdrop, this study takes China’s major urban agglomerations as the research object to examine the association between polycentric spatial structure and carbon emission intensity. Furthermore, it elucidates multiple underlying mechanisms and conducts a heterogeneity analysis from the perspective of internal integration of urban agglomerations.
2.2. Research Hypothesis
From the perspectives of urban economics and new economic geography, agglomeration economies serve as the core mechanism driving the emergence and evolution of urban agglomerations. Traditional agglomeration theory primarily emphasizes the productivity-enhancing spillover effects of the spatial concentration of population and economic activity [25], thereby boosting productivity, reducing transaction costs, and fostering technological innovation [31]. The positive externalities generated by such agglomeration typically enable cities in their early development stages to exhibit increasing returns to scale, improved factor allocation efficiency, and enhanced energy utilization rates, thereby exerting a certain restraining effect on carbon emissions.
However, when agglomeration becomes excessive, urban cores face issues such as traffic congestion, inflated land and housing prices, environmental pollution, and resource constraints—giving rise to so-called “agglomeration diseconomies.” Overly concentrated employment and residential patterns increase commuting distances and reliance on private transportation, resulting in high-carbon emissions within densely populated urban agglomerations [25]. These negative externalities not only undermine economic efficiency but also drive increases in energy demand and carbon intensity. Therefore, moderate urban and industrial agglomeration can promote intensive resource utilization and enhanced energy efficiency through efficient factor mobility and knowledge spillovers. This enables sustained economic growth while simultaneously reducing carbon intensity [9,32].
Within the aforementioned theoretical framework, polycentric spatial structures are regarded as a crucial spatial organization model that preserves the positive externalities of agglomeration economies while mitigating agglomeration diseconomies. By forming multiple functional sub-centers within urban agglomerations, polycentric spatial structures promote the rational spatial distribution of industries, populations, and factors of production. This approach maintains economies of scale and knowledge spillovers while reducing environmental pressures stemming from excessive concentration [9,13]. Existing research indicates that the development of polycentric spatial structures not only improves energy and transportation efficiency by alleviating traffic congestion and commuting distances, but also enhances regional technological capabilities and green innovation capacity by facilitating the inter-city diffusion of knowledge and innovation resources [9,29], and reduces residents’ reliance on public transportation, potentially increasing private vehicle use and transportation-related carbon emissions. In summary, polycentric spatial structures optimize spatial connectivity and functional division within urban agglomerations, preserving agglomeration benefits while mitigating the negative externalities of agglomeration diseconomies. Consequently, they may reduce overall carbon emission intensity in urban agglomerations. Based on this, this paper proposes the first research hypothesis:
Hypothesis 1.
The polycentric spatial structure of urban agglomerations is conducive to reducing carbon emissions intensity.
In the development of urban agglomerations, polycentric spatial structures can generate positive environmental externalities by optimizing the spatial distribution of industries and populations. Specifically, polycentric development can influence carbon emission intensity through technological progress, industrial relocation, and the alleviation of traffic congestion.
First, from the perspective of technological progress, a polycentric spatial structure facilitates the emergence of multiple innovation hubs, thereby promoting cross-city knowledge flows and technology diffusion [9,29]. This can facilitate the research, development, and application of green technologies, improve energy efficiency, and ultimately reduce carbon emissions [33]. Second, polycentric development can promote the relocation of industries across cities. Industrial relocation often occurs within industrial parks and industrial clusters, allowing firms to share energy resources and infrastructure more efficiently. Through economies of scale and resource pooling, such industrial agglomeration can improve resource utilization efficiency and reduce carbon emission intensity per unit of output [34,35]. Third, polycentric spatial structures can alleviate traffic congestion in core areas by dispersing employment and population. The resulting reduction in commuting pressure and commuting distances can improve traffic efficiency and energy efficiency, thereby reducing carbon emissions [9].
Therefore, polycentric spatial structures can generate positive environmental externalities through technological progress, industrial relocation, and the alleviation of traffic congestion, thereby reducing carbon emission intensity. Based on this, this paper proposes the following hypothesis:
Hypothesis 2a.
Polycentric spatial structures reduce carbon emission intensity by generating positive environmental externalities through technological progress, industrial relocation, and the alleviation of traffic congestion.
Although polycentric spatial structures can generate positive environmental externalities, they may also produce negative environmental externalities, particularly through changes in transportation patterns. The spatial dispersion of population and economic activities may, under certain conditions, weaken the efficiency and attractiveness of public transportation and increase reliance on private vehicles. Previous studies have shown that the relationship between polycentric urban structures and transportation energy consumption is context-dependent, and that poorly coordinated polycentric development may result in longer commuting distances and greater reliance on private vehicles, thereby increasing transportation energy consumption [36,37]. In contrast, well-developed public transportation systems can contribute to carbon emission reduction by encouraging residents to shift from private vehicles to public transport [38]. Therefore, when polycentric development is accompanied by insufficient public transportation provision, the resulting increase in private vehicle use may lead to higher transportation energy consumption and carbon emissions.
Therefore, polycentric spatial structures may generate negative environmental externalities through changes in transportation patterns, particularly when the development of public transportation does not keep pace with spatial decentralization. Based on this, this paper proposes the following hypothesis:
Hypothesis 2b.
Polycentric spatial structures may increase carbon emission intensity by generating negative environmental externalities through reduced reliance on public transportation and promoting urban sprawl.
Urban integration within metropolitan areas typically manifests as enhanced interconnectivity of regional infrastructure, coordinated industrial development, and increased resource sharing. This not only strengthens functional synergy within the metropolitan area but also optimizes the efficiency of factor mobility [39]. High-level integration promotes industrial division of labor and complementarity within polycentric structures, fostering efficient collaborative networks among centers. This amplifies technology spillover effects, elevating the region’s overall green innovation capacity and energy utilization efficiency [29]. Furthermore, internal integration within urban agglomerations facilitates the development of comprehensive regional transportation networks, reduces commuting costs and distances across centers, alleviates traffic congestion, and promotes the growth of public transportation and low-carbon mobility options.
However, once the level of integrated development within a city agglomeration reaches a certain threshold, the mechanism of diminishing marginal emissions reduction effects may quietly emerge. This is because, as regional integration deepens, the benefits generated by improved inter-city connectivity, resource sharing, and functional coordination may gradually approach their upper limits. Consequently, the additional carbon reduction benefits generated by further adjustments to the spatial structure may become increasingly limited. In highly integrated urban agglomerations, infrastructure connectivity, industrial synergy, and public service networks may already be nearing saturation. Further promoting a multi-center structure could yield diminishing carbon reduction benefits. For instance, if redundant industrial development, increased transportation demand, and resource flow friction have already been significantly reduced, the additional emission reduction potential from further decentralization may be limited. In other words, the higher the level of internal integration within an urban agglomeration and the more refined its existing regional carbon reduction mechanisms, the smaller the additional contribution from a polycentric structure and the lower its marginal utility. This implies that in urban agglomerations with lower integration levels, optimizing a polycentric spatial structure holds greater potential for emissions reduction and exerts a more pronounced effect in curbing carbon emission intensity. Existing studies have also begun to examine the relationship between polycentric spatial structure, regional integration, and carbon emissions. For example, Chen et al. (2021) find that market integration interacts with polycentric spatial structure in affecting carbon emissions, suggesting that the environmental effects of spatial structure may depend on the degree of regional integration [40]. However, the moderating role of the internal integration level of urban agglomerations in the carbon emission effects of polycentric spatial structures remains insufficiently explored. Based on this, this paper proposes a third research hypothesis:
Hypothesis 3.
In urban agglomerations with lower levels of internal urban integration, the polycentric spatial structure exerts a more pronounced moderating effect on carbon emission intensity.
3. Research Design
3.1. Research Area
This study encompasses 21 urban agglomerations nationwide, covering major economic and population clusters in eastern, central, and western China. As the core vehicles for the national strategy of new-type urbanization and coordinated regional development, urban agglomerations form the key support structure for China’s urbanization pattern. However, existing research often focuses on individual or localized areas, lacking systematic analysis at the national scale and frequently constrained by insufficient sample representativeness or narrow thematic scope. To address this, this paper integrates macro-level data from all 21 urban agglomerations, transcending geographical limitations to reveal their overall development patterns and differentiation characteristics. This provides more universally applicable empirical support for national-level regional policies. To visually illustrate the spatial distribution of the study area, this paper has mapped the geographical distribution of 21 urban agglomerations, as shown in Figure 2.
Figure 2.
Twenty-one urban agglomerations in China. Note: The review number for this map is GS (2022)4305. Due to space limitations, the full names of the urban agglomerations abbreviated in the figure are provided in Appendix A.
3.2. Variable Measurement
3.2.1. Carbon Emission Intensity Measurement
This paper references the energy section of the 2006 IPCC [41] National Greenhouse Gas Inventory Guidelines to establish the following formula for estimating carbon emissions:
In Equation (1), CEit denotes the carbon emissions of city i in year t, k represents the energy type, E represents energy consumption, SC is the standard coal conversion factor, and CF is the carbon emission factor. The energy types included in this study are raw coal, coke, crude oil, gasoline, kerosene, diesel, fuel oil, natural gas, liquefied petroleum gas, and electricity, selected based on the methodology of relevant literature [13].
Especially for electricity consumption, electricity is treated as a form of final energy consumption and is converted into standard coal using the coefficient of 0.1229 kgce/kWh. The corresponding carbon emission factor is then applied to calculate the carbon emissions associated with electricity consumption. Electricity-related emissions are counted only once based on the electricity consumed by each city, and emissions from the electricity-generation stage are not separately added to city-level emissions, thereby avoiding double counting. For data preprocessing, missing observations were handled using interpolation based on the available data, while abnormal observations were replaced by the city-specific mean calculated from the available observations. The carbon emission intensity measurement formula is then:
In Equation (2), intensityit represents the carbon emission intensity of the ith prefecture-level city in year t, while GDPit denotes the regional GDP of the ith prefecture-level city in year t. Based on the aforementioned calculation formula, this paper visualizes the results from four years—2006, 2011, 2016, and 2022—as shown in Figure 3.
Figure 3.
Distribution of carbon emission intensity in Chinese cities. Note: The review number for this map is GS (2022)4305. The regional trends in emission intensity are further illustrated in Appendix B.
As shown in Figure 3, China’s urban carbon emission intensity exhibits a spatial distribution pattern that generally increases from southeast to northwest. This trend primarily stems from the comprehensive advantages of the southeastern coastal regions in industrial structure, energy efficiency, and technological innovation. These areas feature a higher proportion of service industries and high-tech sectors, higher energy utilization efficiency, and more widespread application of green and low-carbon technologies. From a temporal perspective, China’s urban carbon emission intensity has demonstrated a sustained downward trend. This decline is primarily attributable to the combined effects of nationwide industrial restructuring and upgrading, advancements in energy-saving and emission-reduction technologies, the transition toward cleaner energy sources, and the continuous strengthening of environmental regulations.
3.2.2. Measuring the Spatial Structure of Urban Agglomerations
The spatial structure of urban agglomerations exhibits both polycentric and monocentric characteristics. The centrality of urban agglomerations is typically measured across two dimensions: morphological and functional. Among these, morphological centrality provides the most intuitive reflection. In assessing morphological polycentricity, economic indicators, population, and employment are commonly used to gauge the degree of agglomeration within the urban agglomeration [13]. Using the rank-size rule, the polycentric index of urban agglomerations is measured from the perspective of population and economic distribution within the region [12]. Therefore, this study employs the urban agglomeration polycentric index as the core explanatory variable to quantify and characterize the spatial structure of urban agglomerations. Both population and economic indicators are incorporated into the calculation of the urban agglomeration polycentric index, yielding the following calculation formula:
In Equation (3), Ni and Mi represent the population size and economic scale of the i-th city within the urban agglomeration, respectively. Population size is expressed as the city’s permanent resident population, while economic scale is represented by the city’s GDP. N1 and Mi denote the values of the city with the largest population and economic scale within the urban agglomeration, while RNi and RMi indicate the rank of the i-th city’s population and economic scale within the urban agglomeration. qN and qM are the Zipf indices to be estimated. Taking logarithms of both sides of Equation (3) yields:
In Equation (4), qN represents the centrality of the agglomeration’s spatial structure based on population distribution, while qM denotes the centrality of the agglomeration’s spatial structure based on economic distribution.
Multiplying the centrality index (qN) of the spatial structure of population distribution in an urban agglomeration by the centrality (qM) of the spatial structure of economic distribution yields the polycentric index of the urban agglomeration’s population and economic distribution:
qUASS = qN × qM
In Equation (5), qUASS represents the polycentric index of the urban agglomeration. When qUASS > 1, the urban agglomeration exhibits a relatively concentrated scale distribution and a monocentric spatial structure; when qUASS < 1, it exhibits a polycentric spatial structure.
Since the qUASS index measured earlier is a reverse indicator, where smaller values correspond to a more polycentric spatial structure and larger values reflect a more monocentric one, this study follows the methodology of relevant literature [42,43] by employing the range standardization method to convert qUASS into a positively oriented indicator. The transformation formula is presented as follows:
In Equation (6), Poly denotes the polycentric index of the urban agglomerations after positive transformation, ranging from 0 to 1. A larger value of this index indicates that the internal spatial structure of the urban agglomeration tends to be more polycentric, whereas a smaller value suggests a more monocentric configuration. The positively transformed polycentric index is subsequently visualized in Figure 4.
Figure 4.
Polycentric index of Chinese urban agglomerations.
As shown in Figure 4, HBOY consistently exhibits the highest values across all observed years, indicating a polycentric spatial structure with no dominant city within the urban agglomeration. In contrast, BBG consistently records the lowest values, suggesting a pronounced monocentric spatial structure. These findings are broadly consistent with real-world observations.
3.3. Control Variables
Following previous studies and considering potential confounding factors that may affect both the spatial structure of urban agglomerations and carbon emission intensity, we select several control variables, specifically as follows [9,28,29]: (1) Industrial Structure (Struct) is measured by the proportion of secondary industry output value to the city’s GDP. (2) Population Size (POP) is measured by the registered population at year-end, representing the city’s population scale. (3) Economic openness (Pfdi) is measured by the ratio of foreign direct investment (FDI) to GDP, indicating the city’s dependence on foreign investment for economic development. (4) Government intervention (Gov) is measured by the proportion of general budget expenditures within the fiscal budget relative to GDP.
The variable data above primarily originates from the China Urban Statistical Yearbook and provincial urban statistical yearbooks. Descriptive statistics for the variables are presented in Table 1.
Table 1.
Descriptive statistics of variables.
3.4. Benchmark Regression Model
Based on the preceding analysis, the benchmark model for this paper is set as follows:
lnintensityit = α0 + α1Polyit + αxcontrolsit + μi + γt + εit
In Equation (7), i represents the cross-sectional unit for cities, and t denotes the year. Intensity, measured as the ratio of carbon emissions to GDP, serves as the dependent variable in this study; Poly represents the polycentric index of the urban agglomeration, serving as the core independent variable in this study; controls denote a series of control variables, including industrial structure (Struct), population size (POP), level of economic openness (Pfdi), and government intervention (Gov). Additionally, μi and γt denote the city fixed effect and year fixed effect; α0, α1 and αx is the coefficient to be estimated; and εit is the random disturbance term. In the regression, intensity, POP and Pfdi are log-transformed.
3.5. Data Source
The data used in this paper primarily originate from the China Statistical Yearbook, China Urban Statistical Yearbook, China Labor Statistical Yearbook, and provincial/municipal statistical yearbooks, covering socio-economic indicators at the prefecture-level city level from 2006 to 2022. Geographical coordinates for the administrative centers of all prefecture-level cities nationwide were obtained from the National Center for Earth System Science Data, while carbon emissions-related data were sourced from the CEADs database (Carbon Emission Accounts and Datasets) [44].
4. Empirical Results Analysis
4.1. Benchmark Regression
This part uses ordinary least squares (OLS) to estimate how the polycentric index of urban agglomerations relates to carbon emission intensity. Table 2 reports the estimation results for the relationship between urban agglomeration polycentricity and carbon emission intensity, both controlling for city and year fixed effects and without controlling for these effects. Column (1) of Table 2 shows that without controlling for city and year fixed effects and without including control variables, the coefficient of the polycentric index is −1.520, significant at the 1% level. This indicates that a one-unit increase in the polycentric index reduces carbon emission intensity by 152.0%. Column (2) in Table 2 shows that, controlling for city and year fixed effects, the coefficient for the polycentric index is −0.611 and significant at the 1% level. This indicates that a one-unit increase in the polycentric index reduces carbon emission intensity by 61.1%. After sequentially incorporating a series of control variables in columns (3) and (4), the coefficients for the polycentric index of urban agglomerations were −0.452 and −0.298, respectively, both significantly negative at the 1% level. This indicates that for each unit increase in the polycentric index, carbon emission intensity decreases by 45.2% and 29.8%. Drawing on the descriptive statistics, we further discuss the economic significance of the estimation results. Column (4) shows that a one-standard-deviation rise in the polycentric index corresponds to a 3.3% (0.111 × 0.298) decrease in carbon emission intensity. The regression coefficient declines from −1.52 in Column (1) to −0.298 in Column (4), representing an approximate 80% reduction. This attenuation is attributable to the incorporation of fixed effects and additional covariates. Accordingly, we treat the estimate in Column (4) as our benchmark result.
Table 2.
Benchmark regression results.
Next, we examine how the control variables relate to carbon emission intensity. (1) In columns (3) and (4) of Table 2, the estimated coefficients for Struct are both significantly negative. This indicates that an increase in the secondary industry share reduces carbon emission intensity. This regression result runs counter to intuition, but the dependent variable in this paper is carbon emission intensity rather than total carbon emissions or carbon emission efficiency. This also reflects that, driven by technological progress and adjustments in the industrial composition, the secondary industry is transitioning from carbon-intensive production toward a more low-carbon and synergistic development model [45]. (2) The estimated coefficients for lnPOP in columns (3) and (4) are −0.157 and −0.131 respectively, with both estimates statistically significant at the 1% level. These estimates suggest that a 1% increase in population reduces carbon emission intensity by approximately 0.157% and 0.131%. This effect likely arises because expanding urban populations may enhance energy efficiency through agglomeration effects, thereby lowering carbon emission intensity. (3) The estimated coefficient for Gov in column (4) of Table 2 is 0.01, significant at the 1% level. This indicates that a one-unit rise in the fiscal expenditure-to-GDP ratio is associated with a 10% increase in carbon emission intensity. The rise in fiscal expenditure share may reflect expanded government investment in infrastructure and heavy industry sectors, where such expenditures often involve high energy consumption and emissions, thereby driving up carbon emission intensity [46]. (4) The estimated coefficient for lnPfdi in column (4) of Table 2 is significantly negative, indicating that increased economic openness reduces carbon emission intensity. Greater economic openness facilitates the introduction of advanced clean technologies and management expertise, promotes industrial restructuring and energy efficiency improvements, thereby lowering carbon emission intensity [32,47].
Taken together, the estimation results indicate that the polycentric spatial structure of urban agglomerations exerts a restraining effect on carbon emission intensity, thereby validating Hypothesis 1 of this study.
4.2. Robustness Test
1. Replace the core explanatory variable with alternative measures. This paper draws upon relevant research on the spatial structure of urban agglomerations and measures the polycentric index of urban agglomerations by selecting indicators across three dimensions: scale, position, and accessibility [48]. (1) Scale Indicator (size) Measurement. The scale index is measured by calculating the Gini coefficient for population (permanent residents of prefecture-level cities) and economic indicators (per capita GDP). (2) Position Indicator (position) Measurement. Tyson polygons can partition urban agglomerations based on city locations. Therefore, the Gini coefficient of Tyson polygon areas reflects the polycentric spatial structure, where a higher Gini coefficient indicates lower polycentricity. (3) Accessibility (trans) measurement. This study measures accessibility by calculating the Gini coefficients of urban agglomeration freight and passenger volumes. A smaller Gini coefficient indicates a higher degree of polycentricity within the urban agglomeration. After measuring the above three indicators separately, each is assigned a weight of 1/3 to obtain the final urban agglomeration polycentric index:
In Equation (8), i represents the cross-sectional unit of a city, and t denotes the year. Mid is the polycentric index of the urban agglomeration, while size, pos, and trans correspond to the scale indicator, position indicator, and accessibility indicator, respectively.
This study replaces Poly with mid and log(mid) to conduct robustness tests on the conclusion that the polycentric index of urban agglomerations influences carbon emission intensity. Columns (1) and (2) in Table 3 control for city and year fixed effects while incorporating a series of control variables. Results indicate that the coefficients for Mid and log(Mid) are both significantly negative at the 1% level. This confirms a significant negative association between urban agglomeration polycentric spatial structure and carbon emission intensity, suggesting that polycentric spatial structures are associated with lower carbon emission intensity, thereby further supporting the earlier conclusion.
Table 3.
Robustness tests of regression results.
In addition, this study employs an alternative measurement method to construct the weighted polycentric index (Poly_weighted) and replaces the original Poly variable with Poly_weighted for robustness testing. Specifically, the polycentricity index is measured as the average of qN and qM in Equation (5). As shown in Column (3) of Table 3, the coefficient of Poly_weighted is −0.173 and is statistically significant. The coefficient remains negative and is consistent with the benchmark regression results, indicating that the negative effect of polycentric spatial structure on carbon emission intensity remains robust when an alternative measurement method is adopted.
2. Replace the dependent variable. The baseline regression specification is designed to assess how the polycentric index of urban agglomerations affects carbon emission intensity. While carbon emission intensity can partially reflect the evolving relationship between economic expansion and carbon emissions, this may limit the model’s ability to reflect changes in actual urban carbon emissions. Therefore, it is necessary to introduce total carbon emissions as a supplementary indicator. Total carbon emissions directly represent the absolute level of regional emissions and serve as a crucial metric for assessing environmental carrying capacity and progress toward carbon peak and carbon neutrality goals. To assess whether the baseline findings are robust, we further replace the original dependent variable, carbon emission intensity, with total carbon emissions in the benchmark regression model to re-estimate the impact of the polycentric index on carbon emissions. Column (4) in Table 3 presents the estimation results with total carbon emissions as the dependent variable. The regression controls for city and year fixed effects and incorporates a series of control variables. The results show that the coefficient for the polycentric index is significantly negative, indicating its significant role in reducing carbon emission intensity and further supporting the conclusions of the benchmark regression. Furthermore, compared with the coefficient in the baseline regression, the effect is attenuated and statistically significant only at the 10% level. This suggests that the primary role of polycentric spatial structure lies in reducing carbon emission intensity, whereas its effect on total carbon emissions is relatively weaker.
3. Lag the core explanatory variable by one period. The evolution of polycentric spatial structures in urban agglomerations typically exhibits strong path dependency and adjustment inertia, potentially introducing time lags in their impact on carbon emissions. To more accurately identify long-term effects and mitigate potential co-temporal endogeneity issues, this study further employs the first-order lagged term (L1.Poly) of the core explanatory variable in place of its current value for regression estimation. By introducing lagged terms, the bidirectional causal effects of the current period can be partially separated, yielding estimates that more closely reflect the true causal direction. Column (5) of Table 3 shows that the estimated coefficient for the first-order lagged term of the core explanatory variable is significantly negative, in line with the baseline estimates. This indicates that the core findings of this study are robust and do not depend on the co-period specification of the explanatory variables.
4. Difference GMM estimation. To further address the potential endogeneity arising from the dynamic changes in carbon emission intensity, this study employs the Difference GMM approach as an additional robustness check. By taking first differences and using lagged variables as instruments, the Difference GMM approach can alleviate potential endogeneity and unobserved individual-specific effects to some extent, thereby providing more reliable estimates [49]. Column (6) of Table 3 shows that the estimated coefficient of the core explanatory variable (Poly) is significantly negative at the 5% level, with a coefficient of −1.996, which is consistent with the direction of the baseline regression results. The Arellano–Bond test indicates statistically significant first-order autocorrelation but no evidence of second-order serial correlation (AR(1) = 0.000; AR(2) = 0.489), satisfying the basic requirements of the dynamic panel model. In addition, the Hansen test produces a p-value of 0.121, suggesting that the null hypothesis concerning instrument validity cannot be rejected. Overall, these results further confirm that the core findings of this study remain robust after accounting for potential endogeneity and dynamic effects.
4.3. Endogeneity Treatment
When examining the association between polycentricity indices and carbon emission intensity within urban agglomerations, unobservable confounding factors often introduce interference. These factors may simultaneously influence both the polycentric index and carbon emission intensity, thereby generating endogeneity issues. Conventional OLS methods typically fail to effectively control for biases arising from such omitted variables, potentially yielding estimates that inaccurately reflect the causal relationship between the two variables. The instrumental variables method serves as a classical approach to addressing endogeneity issues. By selecting appropriate instrumental variables, it enables the identification of the potential causal link between the polycentric index and carbon emission intensity.
We select topographic relief (Rugg) as the instrumental variable for the polycentric index of urban agglomerations, following the approach adopted in previous studies [50,51]. Topographic relief data for 300 Chinese cities were extracted using ArcGIS software in conjunction with vector maps of the administrative divisions of China. Topographic relief satisfies two conditions for serving as an instrumental variable: First, terrain undulation profoundly influences urban spatial expansion patterns and transportation network layouts. In flat regions, urban agglomerations tend to spread in multiple directions, forming numerous functional centers that facilitate polycentric development. Conversely, in rugged terrain with abundant mountains and hills, agglomeration growth faces natural geographic constraints, often concentrating along limited corridors and tending toward monocentric or weakly polycentric structures. Thus, as a long-term stable natural geographic feature, surface relief can systematically influence the spatial organization within urban agglomerations, satisfying the correlation requirement between the instrumental variable and the core explanatory variable (the polycentric index of urban agglomerations). Second, topographic relief is a natural geographic variable formed by geological evolution, exhibiting high temporal stability and exogeneity. It remains unaffected by contemporary socioeconomic factors such as industrial policies, energy transitions, or environmental regulations. After controlling for year fixed effects and a series of covariates, surface topography itself has limited alternative pathways to directly influence carbon emission intensity beyond spatial structure, thereby satisfying the exogeneity requirement for instrumental variables. Consequently, topographic relief serves as a suitable instrumental variable for the polycentric index of urban agglomerations.
This paper conducts an endogeneity test by taking the natural logarithm of urban topographic relief. Table 4 reports the results of a two-stage least squares (2SLS) specification using an instrumental variable, identifying a causal relationship between the polycentric index of urban agglomerations and carbon emission intensity. A series of control variables and fixed effects for year are included in both the first and second stages of the regression. The first-stage estimates are reported in Column (1) of Table 4. The coefficient for topographic relief is negative and statistically significant at the 1% level, with an F-statistic of 12.43, which exceeds the conventional threshold of 10. This indicates a strong negative correlation between surface elevation and the polycentric index, ruling out the “weak instrument” problem [52]. Column (2) shows the polycentric index coefficient at −4.164, significant at the 1% level. This indicates that a one-unit increase in the polycentric index reduces carbon emission intensity by 416.4%. From an economic perspective, a one-standard-deviation increase in the polycentric index is associated with a 46.22% decrease in carbon emission intensity. Comparative analysis reveals that the absolute values of coefficients obtained through instrumental variables regression are larger than those from benchmark regression, indicating that the effect of polycentric indices in OLS regression on reducing carbon emission intensity is underestimated. It is worth noting that, since topographic relief does not vary over time, we do not control for city fixed effects. Although this model specification differs from the baseline model, our primary focus is on the sign and statistical significance of the coefficient for polycentric spatial structure in the second-stage regression. The results show that both are consistent with the baseline findings, providing evidence that the instrumental variable approach helps mitigate endogeneity concerns.
Table 4.
Regression results using instrumental variables method.
5. Further Analysis
5.1. Mechanism Analysis
The theoretical analysis above indicates that the polycentric spatial structure of urban agglomerations may influence carbon emission intensity through multiple pathways. To explore the underlying mechanisms between these two factors, this study examines several potential channels including technological progress, industrial relocation, traffic congestion alleviation, public transportation and urban sprawl. The resulting mechanism testing model is as follows:
Mit = β0 + β1Polyit + βxZit + μi + γt + εit
In Equation (9), i represents the cross-sectional unit of a city, and t denotes the year.M represents the mechanism variables, including technology (Tech), industrial relocation (IGC), traffic congestion (CDI), all-day traffic congestion (Alldaytj), public transportation (Pbus) and urban sprawl(lnArea and Density); The polycentric index (Poly) serves as the core explanatory variable; Z is a vector set comprising a series of control variables; additionally, city and year fixed effects μi and γt are controlled for; β0, β1, and βx are the coefficients to be estimated; εit is the random disturbance term. In the regression, the logarithmic forms of technology, industrial relocation, traffic congestion, all-day traffic congestion, public transportation, and some control variables are estimated separately.
First, this paper employs the Amap Congestion Delay Index (CDI) to measure urban traffic congestion. The CDI, provided by Amap, is derived from big data analytics based on extensive traffic data collected through the Amap navigation platform. Its universal algorithms and theoretical foundations maintain the validity and methodological rigor of the empirical data. Second, due to data availability and the fact that urban public transportation primarily consists of urban rail transit and public buses, this study uses the citywide per capita public bus ridership to measure urban public transportation passenger volume (Pbus). Data is sourced from the China Urban Statistical Yearbook. Following the relevant literature [8,9] and based on the STIRPAT model, this study measures technological advancement (Tech) using the number of patents filed in prefecture-level cities. In addition, following the relevant literature, we use population density (Density) to measure the vertical dimension of urban sprawl [53]. Given that polycentric spatial development may lead to redundant urban construction, we further consider the urban expansion associated with such redundant construction and use the urban built-up area (lnArea) to measure the horizontal dimension of urban sprawl. Finally, to characterize the indicator of industrial transfer, this study introduces the concept of the industrial gradient coefficient (IGC). This measure originates from gradient promotion theory, reflecting a region’s relative comparative advantage and technological efficiency within a specific industry. It serves as a common metric for assessing regional industrial transfer levels. Its core principle posits that industrial gradients emerge among regions due to differences in resource endowments, technological levels, and industrial division of labor, thereby driving the spatial transfer and diffusion of industries. Following the measurement methodology of relevant literature [54], the Industrial Gradient Coefficient is calculated as the product of location entropy (LQri) and comparative labor productivity (LPri), with the specific formula as follows:
IGCri = LQri × LPri
Among them:
In Equations (10) and (11), IGCri is the industrial gradient coefficient for sector i in region r. Yri and Lri represent the output and employment of sector i in region r, respectively. LQri represents the locational entropy of sector i in region r, measuring the relative size of the industrial share of sector i in region r compared to the overall average. If LQri > 1, it indicates that the industrial share of sector i in region r exceeds the overall average, signifying that sector i possesses a comparative advantage in region r. LPri denotes the comparative labor productivity of sector i in region r, measuring the relative labor productivity of sector i in region r compared to the overall average. If LPri > 1, it indicates that the labor productivity of sector i in region r exceeds the overall average, signifying that sector i possesses a productivity advantage in region r. All data used in the above calculations are sourced from the China Statistical Yearbook, China Urban Statistical Yearbook, China Labor Statistical Yearbook, and the CEADs database.
Columns (1) to (7) in Table 5 summarize the corresponding estimation results for the five mechanisms, respectively. Column (1) presents the estimation results for the polycentric index of urban agglomerations (Poly) on technological development (lnTech). The estimates show that the coefficient associated with the polycentric index is positive and statistically significant, suggesting that the polycentric spatial structure of urban agglomerations promotes technological development through knowledge diffusion and technological spillovers [9]. Related studies have confirmed that enhanced technological levels reduce carbon emission intensity [55,56]. Thus, polycentric spatial structures in urban agglomerations lower carbon emission intensity by advancing technology. Column (2) reports the impact of Poly on industrial relocation (lnIGC). The estimated coefficient for Poly is 0.977 and is statistically significant at the 1% level, indicating that polycentric spatial structures promote inter-city industrial relocation. Related studies suggest that inter-city industrial relocation often concentrates in industrial parks and industrial agglomerations, enabling industries to share energy and infrastructure. This enhances resource utilization efficiency through economies of scale and resource sharing, consequently lowering carbon emissions relative to economic output [34,57]. Thus, the polycentric spatial structure of urban agglomerations further reduces carbon emission intensity by facilitating inter-city industrial relocation. Columns (3) and (4) present the estimated effects of Poly on traffic congestion (lnCDI) and all-day traffic congestion (lnAlldaytj), respectively. The coefficients for Poly are −1.786 and −1.329, respectively, both significant at the 1% level. Evidently, polycentric spatial structures of urban agglomerations alleviate intra-urban traffic congestion. As prior research confirms, traffic congestion exacerbates carbon emission intensity [58,59]. Thus, polycentric spatial structures reduce carbon emission intensity by mitigating traffic congestion. Column (5) presents the estimated results of Poly impact on public transportation (lnPbus). The coefficient for Poly is −0.959, significant at the 5% level, indicating that a polycentric spatial structure increases private vehicle travel while reducing public transportation use. Related studies confirm that public transportation contributes to pollution reduction and emission mitigation [1]. Consequently, the polycentric spatial structure of urban agglomerations exacerbates carbon emission intensity by diminishing public transportation usage. Columns (6) and (7) present the estimation results for the urban sprawl mechanism, measured by built-up area (lnArea) and population density (Density), respectively. The coefficients of the polycentric spatial structure are 0.640 and −1.686, respectively, and both are statistically significant at the 1% level. These results indicate that a polycentric spatial structure expands the urban built-up area and reduces urban population density, thereby contributing to urban sprawl. Existing studies have shown that urban sprawl leads to increased carbon emissions [60]. Therefore, the spatial structure of urban agglomerations may exacerbate urban carbon emissions through urban sprawl, generating negative environmental externalities.
Table 5.
Mechanism analysis regression results.
Drawing on the preceding results, the development of polycentric spatial structures in urban agglomerations exerts a suppressing effect on carbon emission intensity by driving technological progress, guiding industrial relocation, and alleviating traffic congestion. However, it simultaneously exacerbates carbon emissions by reducing public transportation usage. Overall, the positive environmental externalities of polycentric spatial structures in urban agglomerations outweigh the negative ones. This also validates Hypothesis 2 of this study.
5.2. Heterogeneity Analysis
Given the varying degrees of internal integration across different urban agglomerations, the moderating effect of polycentric spatial structures on carbon emission intensity may exhibit heterogeneity. To thoroughly examine this heterogeneity and its implications, this study analyzes four dimensions: whether integrated into national-level integrated planning, number of provincial administrative regions crossed by the urban agglomeration, average linguistic distance between cities belonging to the same urban agglomeration, together with the mean distance among cities within the urban agglomeration.
1. Whether integrated into national-level integrated planning. This paper uses the criterion of whether it is a national-level urban agglomeration to measure this. Based on the data of nationally approved urban agglomerations as outlined in the State Council’s 2018 “Opinions on Establishing a More Effective New Mechanism for Coordinated Regional Development,” urban agglomerations that have received State Council approval are considered to have national-level integration; conversely, those without approval are deemed to lack national-level integration. Column (1) in Table 6 includes the interaction term (Poly×National) between the polycentric index of urban agglomerations (Poly) and whether integrated into national-level integrated planning (National). After controlling for year fixed effects and a series of control variables, the estimated coefficient on Poly is significantly negative at the 1% level, while the Poly×National coefficient is 1.091 and also significant at the 1% level. This result indicates that polycentric spatial development within urban agglomerations has a significant dampening effect on carbon emission intensity, with this effect being more pronounced in agglomerations not included in national-level integration planning. This occurs because national-level urban agglomerations exhibit more dynamic internal economies, larger central cities with broader influence, higher integration levels, and closer transportation links. Moreover, these agglomerations may already have relatively high levels of polycentricity, leaving less room for further improvement and thus limiting the additional emission-reduction benefits of polycentric development. Compared to non-national-level agglomerations, their polycentric spatial structure yields relatively smaller reductions in carbon emissions.
Table 6.
Regression results for heterogeneity analysis.
2. Number of provincial administrative regions crossed by the urban agglomeration. This indicator reflects the complexity of its administrative boundaries. As the number of cross-provincial regions increases, coordination mechanisms among cities and environmental governance standards tend to diversify, potentially influencing the direction and intensity of polycentric structure. Column (2) in Table 6 incorporates an interaction variable (Poly×Province) combining the polycentric index with urban agglomerations (Poly) and the number of provincial administrative regions crossed (Province). After accounting for year fixed effects and the specified control variables, the coefficient on Poly×Province is −1.112 and is statistically significant at the 1% level. These findings indicate that the greater the number of provincial administrative regions an urban agglomeration spans, the stronger its polycentric spatial structure becomes in mitigating carbon emission intensity. This primarily stems from the fact that the more provincial administrative boundaries are crossed, the more severe the administrative fragmentation becomes, and the lower the level of integration. The polycentric spatial structure of urban agglomerations better mitigates the negative externalities of population and economic agglomeration.
3. Average linguistic distance between cities within urban agglomeration. This study references methods for measuring average linguistic distance between cities from the relevant literature on linguistic distance [61]. Column (3) in Table 6 incorporates the interaction variable (Poly×lnLanguage), constructed from the polycentric index of urban agglomerations (Poly) and the logarithm of average linguistic distance (lnLanguage). After controlling for the fixed effects of the year and a series of control variables, the coefficient of Poly*lnLanguage is −1.379 and is statistically significant at the 1% level. This result indicates that the greater the average linguistic distance between cities within an agglomeration, the stronger the inhibitory effect of the polycentric spatial structure on carbon emission intensity. This occurs because greater linguistic distance reduces inter-city communication and lowers integration levels, thereby enhancing the role of the polycentric spatial structure in reducing carbon emissions.
4. Average geographic distance between cities within urban agglomeration. The geographical distance between cities determines the ease of factor mobility and regional connectivity levels. This study obtained the geographic coordinates of each city’s administrative center from the National Earth System Science Data Center to represent the city’s absolute location. The distance between cities within each urban agglomeration was calculated using the Haversine formula. The calculation formula is as follows:
In Equation (12), d represents the great circle distance between two locations. ∅i and λi denote the latitude and longitude of a given position, respectively. Δϕ and Δλ denote the latitude difference and longitude difference between the two locations, respectively. R is the mean radius of the Earth (taken as 6371 km).
We include the interaction term (Poly×lnDistance) between the logarithmic form of the average great circle distance between cities within urban agglomerations and the polycentric index of the agglomeration in the regression. Column (4) in Table 6 shows that after controlling for the fixed effect of year and a series of control variables, the coefficient of Poly×lnDistance is −1.374 and is statistically significant at the 1% level. These findings indicate that greater geographic distances between cities within an urban agglomeration enhance the emission-reduction effect associated with its polycentric spatial structure on carbon emission intensity. This may be because greater geographic distances weaken spatial integration among cities, allowing the polycentric structure to better promote the decentralized distribution of population and industries and enhance its emission-reduction effect. Consequently, lower integration levels amplify the mitigating impact of the agglomeration’s polycentric spatial structure on carbon emission intensity.
The above analysis indicates that the degree of integration within an urban agglomeration weakens the inhibitory effect of its polycentric spatial structure on carbon emission intensity. Specifically, national-level integration planning diminishes this inhibitory effect, while number of provincial administrative regions crossed by the urban agglomeration, coupled with the average linguistic distance and geographic distance within the urban agglomeration, further enhances the polycentric spatial structure’s ability to reduce carbon emission intensity. This also provides additional support for Hypothesis 3 of this study.
6. Discussion
With the continuous advancement of urbanization, the spatial organization of urban agglomerations and its environmental implications have attracted increasing attention. We investigate how the spatial structure of urban agglomerations is associated with carbon emission intensity and explore the mechanisms underlying this relationship and the heterogeneity of this relationship under different conditions. The following sections present the empirical results corresponding to the research hypotheses proposed in this study.
6.1. Polycentric Spatial Structure of Urban Agglomerations Reduces Carbon Emission Intensity
This study employs a two-way fixed-effects specification to assess how urban agglomeration spatial structure relates to carbon emission intensity. The baseline regression results in Table 2 show that the polycentric spatial structure of urban agglomerations significantly reduces carbon emission intensity, a finding consistent with previous studies [62]. Specifically, compared with an urban structure in which economic activity is concentrated in one dominant city, a polycentric spatial structure within urban agglomerations may promote functional complementarity and coordinated development among cities, improve regional spatial organization, and create favorable conditions for synergies between economic growth and carbon emission reduction [63,64]. Furthermore, to validate the baseline findings and address potential endogeneity concerns, we conduct a range of robustness assessments and endogeneity tests. The results reported in Table 3 and Table 4 further support the baseline findings. In summary, Hypothesis 1 is supported by the empirical evidence.
6.2. Potential Mechanisms Underlying the Relationship Between the Spatial Structure of Urban Agglomerations and Carbon Emission Intensity
To identify the potential mechanisms underlying the relationship between urban agglomeration spatial structure and carbon emission intensity, we consider both the beneficial and adverse environmental externalities associated with polycentric development. The results reported in Table 5 and the corresponding analysis suggest that the development of a polycentric spatial structure in urban agglomerations may reduce carbon emission intensity by promoting technological progress, facilitating industrial relocation, and alleviating traffic congestion. However, it may also increase carbon emissions by reducing public transportation use and exacerbating urban sprawl. Overall, the beneficial environmental effects of polycentric spatial development outweigh its adverse environmental externalities. Taken together, the results are consistent with Hypothesis 2 proposed in this study.
6.3. Heterogeneity in Emission Reduction Effects Across Different Levels of Internal Integration Within Urban Agglomerations
Considering the potential influence of internal integration within urban agglomerations on the relationship between spatial structure and carbon emission intensity, this study measures internal integration from four perspectives: national-level integration planning, the number of provincial-level administrative regions within an urban agglomeration, and the average linguistic and geographic distances among cities within the urban agglomeration.
The results in Table 6 and the associated analysis indicate that the degree of internal integration within urban agglomerations moderates the carbon-reduction effects of polycentric spatial structures. Specifically, national-level integration planning weakens the emission-reduction effect of polycentric spatial structures, whereas the number of provincial-level administrative regions, average linguistic distance, and average geographic distance within an urban agglomeration significantly strengthen this effect. Therefore, Hypothesis 3 is supported by the empirical evidence.
7. Conclusions
7.1. Summary of Main Findings
This study systematically examines the relationship between the spatial structure of Chinese urban agglomerations and carbon emission intensity, and further investigates the underlying mechanisms. In particular, it examines how differences in the internal integration of urban agglomerations shape the heterogeneous effects of spatial structure on carbon emission intensity.
The main findings of this paper are as follows: First, the polycentric spatial structure of urban agglomerations is conducive to reducing carbon emission intensity. A series of robustness tests and the results of endogeneity treatment using the instrumental variables method provide additional evidence in favor of the baseline finding. Second, polycentric spatial development within urban agglomerations is associated with lower carbon emission intensity by promoting technological progress, guiding industrial relocation, and alleviating traffic congestion. However, it simultaneously exacerbates carbon emissions due to reduced public transportation usage and promoted urban sprawl. Overall, the positive environmental externalities of urban agglomeration spatial structures outweigh the negative ones. Finally, this study finds that the degree of internal integration within urban agglomerations modulates the emission-reduction benefits associated with polycentric spatial structures. Specifically, national-level integration planning weakens the suppression effect of polycentric structures on carbon emission intensity, while the number of inter-provincial administrative regions within an urban agglomeration, average linguistic distance, and geographic distance significantly enhance the emission reduction effects of polycentric spatial structures. These findings suggest that polycentric development does not generate the same environmental consequences under all circumstances; rather, its carbon-reduction effect depends on the administrative, geographic, and cultural integration conditions of urban agglomerations. This finding also provides a possible perspective for understanding the mixed evidence in previous studies on the relationship between polycentric development and environmental sustainability: differences in the internal integration conditions and characteristics of the urban agglomerations examined may be one reason for the divergent findings in the existing literature.
7.2. Limitations and Future Research
Although this study examines the impact of polycentric spatial structure on carbon emission intensity in urban agglomerations from the perspectives of spatial structure, underlying mechanisms, and internal integration, it still has several limitations. First, the polycentric index constructed using the rank-size rule primarily captures the morphological characteristics of polycentric development within urban agglomerations but does not fully capture the actual functional linkages and interactions among cities. Second, due to the availability of data for some variables, some empirical analyses are conducted using relatively smaller samples, which may affect the statistical power of the corresponding mechanism tests. Third, the empirical analysis mainly assumes a linear relationship between polycentric spatial structure and carbon emission intensity and does not further examine potential nonlinear effects. In addition, this study focuses on Chinese urban agglomerations, and the institutional environment, spatial development patterns, and regional governance characteristics specific to China may influence the environmental effects of polycentric spatial structure. Therefore, caution is warranted when extending these findings to countries or regions characterized by different institutional contexts. Finally, although this study examines the environmental effects of polycentric spatial structures through several mechanisms, it does not explicitly account for potential carbon rebound effects or the spatial displacement of carbon emissions across cities. Future research could further investigate these issues using a broader spatial system perspective.
These limitations also provide directions for further research. Future studies could incorporate data on population mobility, commuting linkages, economic linkages, and transportation networks to construct more comprehensive measures of polycentricity from the perspective of functional polycentricity, and use richer data to further examine the pathways by which polycentric spatial structure influences carbon emissions. Future research could further investigate the mechanisms underlying this finding by considering factors such as destination dispersion, car-oriented planning of subcenters, and the time lag between subcenter development and transportation network expansion. Meanwhile, future research could further investigate potential nonlinear effects between polycentric spatial structure and carbon emission intensity and evaluate the overall effects of polycentric spatial development policies from a cost–benefit perspective. In addition, future studies could pay greater attention to the distributional effects of spatial restructuring by examining whether the benefits and costs of polycentric development differ across regions, cities, and population groups. Finally, cross-regional or cross-country comparative studies could further examine the applicability of the findings under different institutional and developmental contexts.
7.3. Policy Recommendations
Considering the findings of this study, we offer the following policy recommendations to reduce carbon emission intensity by optimizing the spatial structure of urban agglomerations: First, given the differences in natural environments, regional cultures, and developmental foundations across urban agglomerations, the empirical evidence indicates that spatial development policies ought to be differentiated according to the internal integration levels of urban agglomerations. For urban agglomerations with relatively lower levels of internal integration, polycentric development can be appropriately promoted by fostering secondary centers, strengthening functional division and cooperation among cities, and improving regional connectivity. In contrast, for highly integrated urban agglomerations where the carbon-reduction effect of polycentricity is relatively weaker, expanding the polycentric spatial structure should not be regarded as the primary means of achieving carbon reduction. Instead, greater attention should be paid to coordination among existing urban centers, optimizing resource allocation, and improving the efficiency of the existing spatial structure. Second, governments should strengthen cross-provincial coordination and carbon emission target management within urban agglomerations. For urban agglomerations spanning multiple provincial administrative regions, governments should establish interprovincial coordination mechanisms for carbon reduction, strengthen joint planning and information sharing, promote coordinated division of labor and industrial cooperation, and improve the cross-regional allocation of resources. Such coordination can help reduce the potential barriers created by administrative fragmentation and support integrated low-carbon development across urban agglomerations. Finally, governments can further enhance the carbon reduction effects of polycentric urban agglomeration structures through transportation and technology spillover. On one hand, industrial enterprises should pursue green, low-consumption, high-efficiency pathways through transformation and upgrading, while continuously developing new technologies. On the other hand, residents should be encouraged to use public transportation, while cities should expand public transportation coverage and increase the number of transit stations to improve accessibility and reduce reliance on private vehicles.
Author Contributions
Conceptualization, C.L.; data curation: P.G.; formal analysis: J.L.; funding acquisition: C.L.; investigation: P.G.; methodology: J.L. and Y.G.; project administration: C.L.; resources: C.L.; software: J.L. and Y.G.; supervision: C.L.; validation: P.G.; visualization: J.L.; writing—original draft: C.L. and J.L.; writing—review & editing: C.L., J.L. and Y.G. All authors have read and agreed to the published version of the manuscript.
Funding
Key Project of Humanities and Social Sciences Research in Anhui Province’s Universities (Grant No. 2024AH052283).
Institutional Review Board Statement
Not applicable.
Informed Consent Statement
Not applicable.
Data Availability Statement
The raw data supporting the conclusions of this article will be made available by the authors on request.
Conflicts of Interest
The authors declare no conflicts of interest.
Appendix A
Table A1.
Abbreviations and Full Names of Urban Agglomerations.
Appendix B
Figure A1.
Temporal Trends in Polycentric Spatial Structure across Regions.
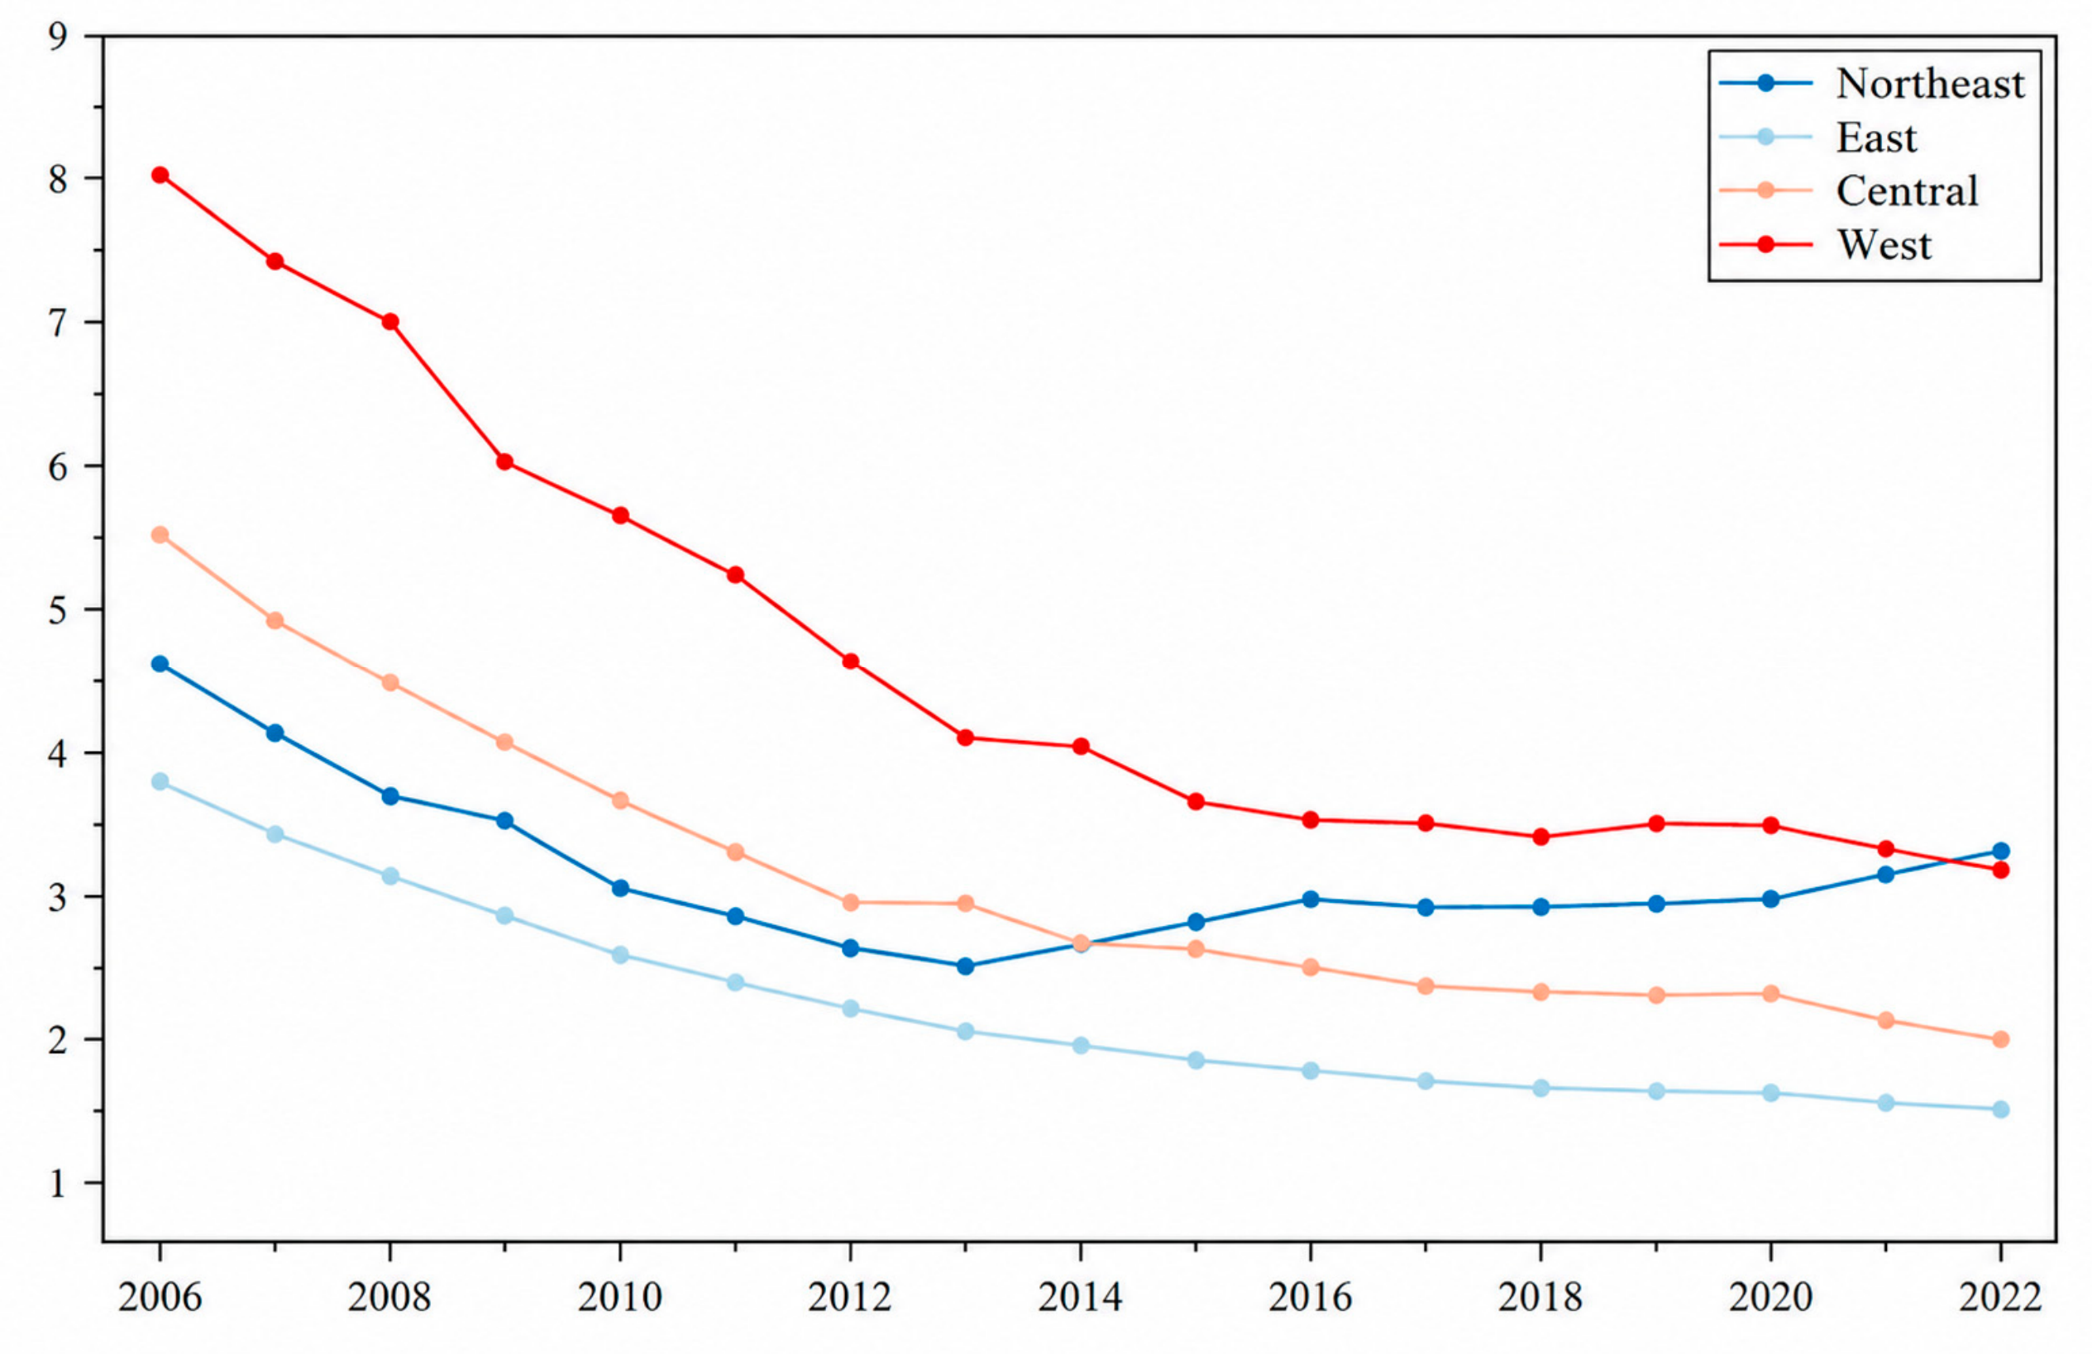
References
- Jing, Q.-L.; Liu, H.-Z.; Yu, W.-Q.; He, X. The Impact of Public Transportation on Carbon Emissions—From the Perspective of Energy Consumption. Sustainability 2022, 14, 6248. [Google Scholar] [CrossRef] [Scilit]
- Department of Resource Conservation and Environmental Protection. Action Plan for Carbon Dioxide Peaking before 2030. National Development and Reform Commission (NDRC). Available online: https://en.ndrc.gov.cn/policies/202110/t20211027_1301020.html (accessed on 10 June 2026).
- Chen, Y.; Shen, H.; Shen, G.; Ma, J.; Cheng, Y.; Russell, A.G.; Zhao, S.; Hakami, A.; Tao, S. Substantial differences in source contributions to carbon emissions and health damage necessitate balanced synergistic control plans in China. Nat. Commun. 2024, 15, 5880. [Google Scholar] [CrossRef] [Scilit] [PubMed]
- Hu, W.; Zheng, B.; Henze, D.K.; Lu, N.; Wang, X.; Zhang, L.; Fu, T.-M.; Zhao, Y. Health burdens related to emission sources and cross-provincial air pollution in China. npj Clim. Atmos. Sci. 2024, 7, 312. [Google Scholar] [CrossRef] [Scilit]
- Khomenko, S.; Pisoni, E.; Thunis, P.; Bessagnet, B.; Cirach, M.; Iungman, T.; Pereira Barboza, E.; Khreis, H.; Mueller, N.; Tonne, C.; et al. Spatial and sector-specific contributions of emissions to ambient air pollution and mortality in European cities: A health impact assessment. Lancet Public Health 2023, 8, e546–e558. [Google Scholar] [CrossRef] [Scilit] [PubMed]
- Paisi, N.; Kushta, J.; Pozzer, A.; Violaris, A.; Lelieveld, J. Health effects of carbonaceous PM2.5 compounds from residential fuel combustion and road transport in Europe. Sci. Rep. 2024, 14, 1530. [Google Scholar] [CrossRef] [Scilit] [PubMed]
- Chen-Xu, J.; Corda, M.O.; Varga, O.; Viegas, S. Health burden and costs attributable to the carbon footprint of the health sector in the European Union. Environ. Int. 2024, 190, 108828. [Google Scholar] [CrossRef] [Scilit] [PubMed]
- Fang, C.; Wang, S.; Li, G. Changing urban forms and carbon dioxide emissions in China: A case study of 30 provincial capital cities. Appl. Energy 2015, 158, 519–531. [Google Scholar] [CrossRef] [Scilit]
- Wen, J.; Zhang, X.; Du, W.; Ouyang, X.; Sun, Z. The Impact of Polycentric Structure on CO2 Emissions: Evidence from China. Appl. Sci. 2023, 13, 5928. [Google Scholar] [CrossRef] [Scilit]
- Wu, Y.; Shi, K.; Cui, Y.; Liu, S.; Liu, L. Differentiated effects of morphological and functional polycentric urban spatial structure on carbon emissions in China: An empirical analysis from remotely sensed nighttime light approach. Int. J. Digit. Earth 2023, 16, 532–551. [Google Scholar] [CrossRef] [Scilit]
- Meijers, E. Measuring polycentricity and its promises. Eur. Plan. Stud. 2008, 16, 1313–1323. [Google Scholar] [CrossRef] [Scilit]
- Meijers, E.J.; Burger, M.J. Spatial structure and productivity in US metropolitan areas. Environ. Plan. A 2010, 42, 1383–1402. [Google Scholar] [CrossRef] [Scilit]
- Wang, Y.; Niu, Y.; Li, M.; Yu, Q.; Chen, W. Spatial structure and carbon emission of urban agglomerations: Spatio-temporal characteristics and driving forces. Sustain. Cities Soc. 2022, 78, 103600. [Google Scholar] [CrossRef] [Scilit]
- Hong, S.; Hui, E.C.-M.; Lin, Y. Relationship between urban spatial structure and carbon emissions: A literature review. Ecol. Indic. 2022, 144, 109456. [Google Scholar] [CrossRef] [Scilit]
- Dai, L.; Luo, J. Effects of spatial structure on carbon emissions of urban agglomerations in China. Cities 2025, 163, 106021. [Google Scholar] [CrossRef] [Scilit]
- Sha, W.; Chen, Y.; Wu, J.; Wang, Z. Will polycentric cities cause more CO2 emissions? A case study of 232 Chinese cities. J. Environ. Sci. 2020, 96, 33–43. [Google Scholar] [CrossRef] [Scilit] [PubMed]
- Zhu, K.; Tu, M.; Li, Y. Did Polycentric and Compact Structure Reduce Carbon Emissions? A Spatial Panel Data Analysis of 286 Chinese Cities from 2002 to 2019. Land 2022, 11, 185. [Google Scholar] [CrossRef] [Scilit]
- Wang, C.; Zhang, Y.; Chen, J.; Li, D.; Zhu, M.; Gan, Z. The impact of urban polycentricity on carbon emissions: A case study of the Yangtze River Delta Region in China. J. Clean. Prod. 2024, 442, 141127. [Google Scholar] [CrossRef] [Scilit]
- Dhakal, S. Urban Energy Use and Carbon Emissions from Cities in China and Policy Implications. Energy Policy 2009, 37, 4208–4219. [Google Scholar] [CrossRef] [Scilit]
- Abbasi, M.A.; Parveen, S.; Khan, S.; Kamal, M.A. Urbanization and energy consumption effects on carbon dioxide emissions: Evidence from Asian-8 countries using panel data analysis. Environ. Sci. Pollut. Res. 2020, 27, 18029–18043. [Google Scholar] [CrossRef] [Scilit] [PubMed]
- Wang, Q.; Wu, S.-d.; Zeng, Y.-e.; Wu, B.-w. Exploring the relationship between urbanization, energy consumption, and CO2 emissions in different provinces of China. Renew. Sustain. Energy Rev. 2016, 54, 1563–1579. [Google Scholar] [CrossRef] [Scilit]
- Zhao, Z.; Yuan, T.; Shi, X.; Zhao, L. Heterogeneity in the relationship between carbon emission performance and urbanization: Evidence from China. Mitig. Adapt. Strateg. Glob. Change 2020, 25, 1363–1380. [Google Scholar] [CrossRef] [Scilit] [PubMed]
- Yu, X.; Wu, Z.; Zheng, H.; Li, M.; Tan, T. How urban agglomeration improve the emission efficiency? A spatial econometric analysis of the Yangtze River Delta urban agglomeration in China. J. Environ. Manag. 2020, 260, 110061. [Google Scholar] [CrossRef] [Scilit] [PubMed]
- Chen, X.; Qiu, B.; Sun, S. Polycentric spatial structure and energy efficiency: Evidence from China’s provincial panel data. Energy Policy 2021, 149, 112012. [Google Scholar] [CrossRef] [Scilit]
- Liang, C.; Zhao, J.; Li, J.; Zhang, R. Impact of urban spatial compactness on air pollution in China. Front. Environ. Sci. 2025, 13, 1491070. [Google Scholar] [CrossRef] [Scilit]
- Burger, M.; Meijers, E. Form follows function? Linking morphological and functional polycentricity. Urban Stud. 2012, 49, 1127–1149. [Google Scholar] [CrossRef] [Scilit]
- Burger, M.J.; Meijers, E.J. Agglomerations and the rise of urban network externalities. Pap. Reg. Sci. 2016, 95, 5–16. [Google Scholar] [CrossRef] [Scilit]
- Zhang, S.; Xue, Y.; Jin, S.; Chen, Z.; Cheng, S.; Wang, W. Does Urban Polycentric Structure Improve Carbon Emission Efficiency? A Spatial Panel Data Analysis of 279 Cities in China from 2012 to 2020. ISPRS Int. J. Geo-Inf. 2024, 13, 462. [Google Scholar] [CrossRef] [Scilit]
- Yang, X.; Zou, X.; Li, M.; Wang, Z. The Decarbonization Effect of the Urban Polycentric Structure: Empirical Evidence from China. Land 2024, 13, 173. [Google Scholar] [CrossRef] [Scilit]
- Guo, R.; Zhao, J.; Liu, X.; Zhang, J. Impacts of urban scale on low-carbon development: Evidence from 265 cities in China. Front. Environ. Sci. 2024, 12, 1347146. [Google Scholar] [CrossRef] [Scilit]
- Marshall, A. Principles of Economics; Macmillan: London, UK, 1920; pp. 1–627. (original work published 1890). [Google Scholar]
- Sun, J.; Qamruzzaman, M. Technological innovation, trade openness, natural resources, clean energy on environ-mental sustainably: A competitive assessment between CO2 emission, ecological footprint, load capacity factor and inverted load capacity factor in BRICS+ T. Front. Environ. Sci. 2025, 12, 1520562. [Google Scholar] [CrossRef] [Scilit]
- Ding, Y.; Luo, Q. Polycentric spatial Structure, digital economy and urban green sustainable development. J. Clean. Prod. 2024, 468, 143080. [Google Scholar] [CrossRef] [Scilit]
- Perrucci, D.V.; Aktaş, C.B.; Sorentino, J.; Akanbi, H.; Curabba, J. A review of international eco-industrial parks for implementation success in the United States. City Environ. Interact. 2022, 16, 100086. [Google Scholar] [CrossRef] [Scilit]
- Zhang, Y.; Li, W.; Sun, J.; Zhao, H.; Lin, H. A Research Paradigm for Industrial Spatial Layout Optimization and High-Quality Development in The Context of Carbon Peaking. Sustainability 2023, 15, 3105. [Google Scholar] [CrossRef] [Scilit]
- Zhao, P.; Diao, J.; Li, S. The influence of urban structure on individual transport energy consumption in China’s growing cities. Habitat Int. 2017, 66, 95–105. [Google Scholar] [CrossRef] [Scilit]
- Zhang, B.; Xin, Q.; Chen, S.; Yang, Z.; Wang, Z. Urban spatial structure and commuting-related carbon emissions in China: Do monocentric cities emit more? Energy Policy 2024, 186, 113990. [Google Scholar] [CrossRef] [Scilit]
- Li, J.; Huang, Y.; Zhang, C.; Yao, D. How does public transport development contribute to carbon emission reduction? Transp. Res. Part A Policy Pract. 2025, 191, 104327. [Google Scholar] [CrossRef] [Scilit]
- Neuman, M. The compact city fallacy. J. Plan. Educ. Res. 2005, 25, 11–26. [Google Scholar] [CrossRef] [Scilit]
- Chen, X.; Zhang, S.; Ruan, S. Polycentric structure and carbon dioxide emissions: Empirical analysis from provincial data in China. J. Clean. Prod. 2021, 278, 123411. [Google Scholar] [CrossRef] [Scilit]
- IPCC. 2006 IPCC Guidelines for National Greenhouse Gas Inventories, Vol. 2: Energy; IGES: Hayama, Japan, 2006; Available online: https://www.ipcc-nggip.iges.or.jp/public/2006gl/ (accessed on 15 June 2026).
- Li, G.; Liu, M. Spatiotemporal Evolution and Influencing Factors of Economic Resilience: Evidence from Resource-Based Cities in China. Sustainability 2022, 14, 10434. [Google Scholar] [CrossRef] [Scilit]
- Yang, Y.; Ren, L.; Du, Z.; Tong, G. Measurement and spatiotemporal analysis of high-quality development of China’s industry. PLoS ONE 2021, 16, e0259845. [Google Scholar] [CrossRef] [Scilit] [PubMed]
- Shan, Y.; Guan, Y.; Hang, Y.; Zheng, H.; Li, Y.; Guan, D.; Li, J.; Zhou, Y.; Li, L.; Hubacek, K. City-level emission peak and drivers in China. Sci. Bull. 2022, 67, 1910–1920. [Google Scholar] [CrossRef] [Scilit] [PubMed]
- You, J.; Zhang, W. How heterogeneous technological progress promotes industrial structure upgrading and industrial carbon efficiency? Evidence from China’s industries. Energy 2022, 247, 123386. [Google Scholar] [CrossRef] [Scilit]
- Ağazade, S. The effect of government investments on the environment: An empirical investigation of OECD countries. J. Clean. Prod. 2024, 477, 143822. [Google Scholar] [CrossRef] [Scilit]
- Chhabra, M.; Giri, A.K.; Kumar, A. Do trade openness and institutional quality contribute to carbon emission reduction? Evidence from BRICS countries. Environ. Sci. Pollut. Res. Int. 2023, 30, 50986–51002. [Google Scholar] [CrossRef] [Scilit] [PubMed]
- Wegener, M. Competitiveness or cohesion? A phase strategy of European spatial development. Europa XXI 2008, 18, 23–38. [Google Scholar]
- Arellano, M.; Bond, S. Some tests of specification for panel data: Monte Carlo evidence and an application to employment equations. Rev. Econ. Stud. 1991, 58, 277–297. [Google Scholar] [CrossRef] [Scilit]
- Nunn, N.; Puga, D. Ruggedness: The blessing of bad geography in Africa. Rev. Econ. Stat. 2012, 94, 20–36. [Google Scholar] [CrossRef] [Scilit]
- Peng, J.; Zheng, Y.; Liu, C. The Impact of Urban Construction Land Use Change on Carbon Emissions: Evidence from the China Land Market in 2000–2019. Land 2022, 11, 1440. [Google Scholar] [CrossRef] [Scilit]
- Staiger, D.; Stock, J.H. Instrumental variables regression with weak instruments. Econometrica 1997, 65, 557–586. [Google Scholar] [CrossRef] [Scilit]
- Fallah, B.N.; Partridge, M.D.; Olfert, M.R. Urban sprawl and productivity: Evidence from US metropolitan areas. Pap. Reg. Sci. 2011, 90, 451–472. [Google Scholar] [CrossRef] [Scilit]
- Liu, W. Research on Gradient Transfer of China’s Processing Trades Industries. J. Financ. Risk Manag. 2015, 4, 216–226. [Google Scholar] [CrossRef]
- Xie, Z.; Wu, R.; Wang, S. How technological progress affects the carbon emission efficiency? Evidence from national panel quantile regression. J. Clean. Prod. 2021, 307, 127133. [Google Scholar] [CrossRef] [Scilit]
- Liu, Y.; Tang, L.; Liu, G. Carbon Dioxide Emissions Reduction through Technological Innovation: Empirical Evidence from Chinese Provinces. Int. J. Environ. Res. Public Health 2022, 19, 9543. [Google Scholar] [CrossRef] [Scilit] [PubMed]
- Xu, X. Identifying the impact of industrial agglomeration on China’s carbon emissions based on the spatial econometric analysis. J. Environ. Public Health 2023, 2023, 4354068. [Google Scholar] [CrossRef] [Scilit] [PubMed]
- Barth, M.; Boriboonsomsin, K. Real-world carbon dioxide impacts of traffic congestion. Transp. Res. Rec. 2008, 2058, 163–171. [Google Scholar] [CrossRef] [Scilit]
- Shang, W.-L.; Song, X.; Chen, Y.; Yang, X.; Liang, L.; Deveci, M.; Cao, M.; Xiang, Q.; Yu, Q. Congestion and pollutant emission analysis of urban road networks based on floating vehicle data. Urban Clim. 2024, 53, 101794. [Google Scholar] [CrossRef] [Scilit]
- Lyu, S.; Huang, Y.; Sun, T. Urban sprawl, public transportation efficiency and carbon emissions. J. Clean. Prod. 2025, 489, 144652. [Google Scholar] [CrossRef] [Scilit]
- Liu, Y.; Jiao, Y.; Xu, X. Promoting or preventing labor migration? Revisiting the role of language. China Econ. Rev. 2020, 60, 101407. [Google Scholar] [CrossRef] [Scilit]
- Li, Q.; Yang, X.; Lin, T. Polycentric urban development and carbon emission intensity—An examination of 268 Chinese cities. J. Clean. Prod. 2025, 510, 145599. [Google Scholar] [CrossRef] [Scilit]
- Wang, Y.; Sun, B.; Zhang, T. Do polycentric urban regions promote functional spillovers and economic performance? Evidence from China. Reg. Stud. 2022, 56, 63–74. [Google Scholar] [CrossRef] [Scilit]
- Xiao, Y.; Yang, H.; Kong, Q.; Chen, Y. Can the polycentric spatial structure achieve pollution and carbon emission reduction in China’s urban agglomerations? J. Environ. Manag. 2025, 392, 126732. [Google Scholar] [CrossRef] [Scilit] [PubMed]
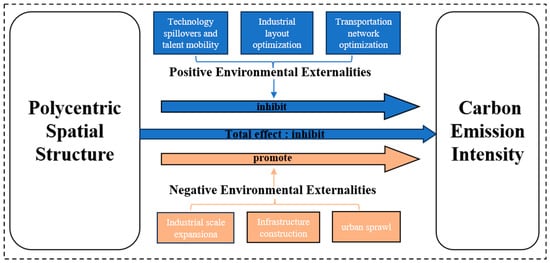
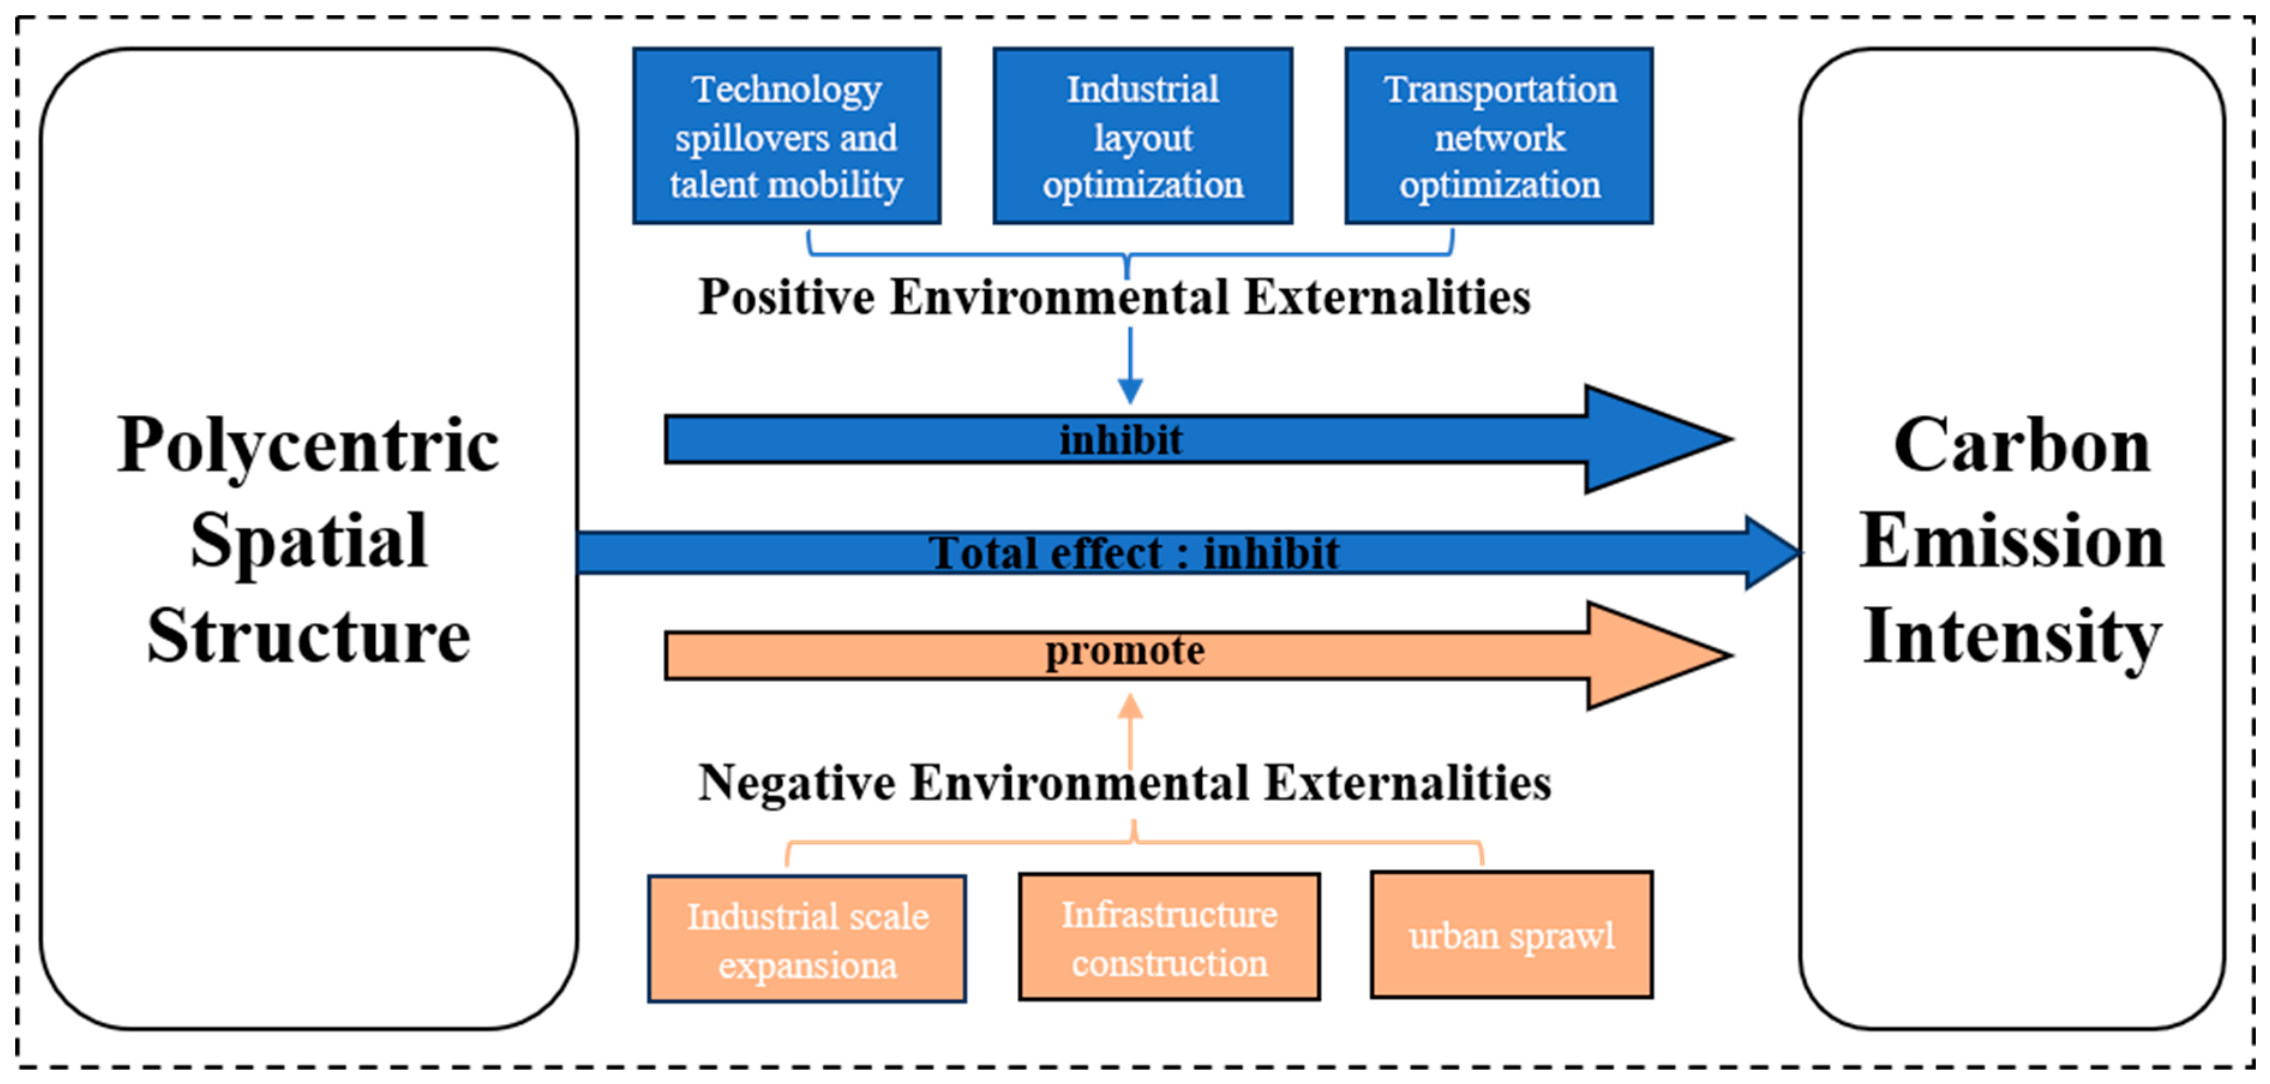
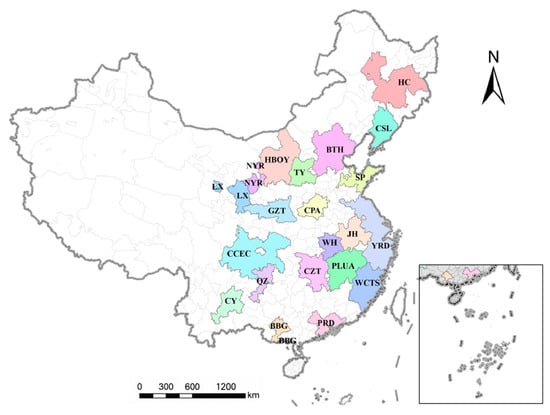
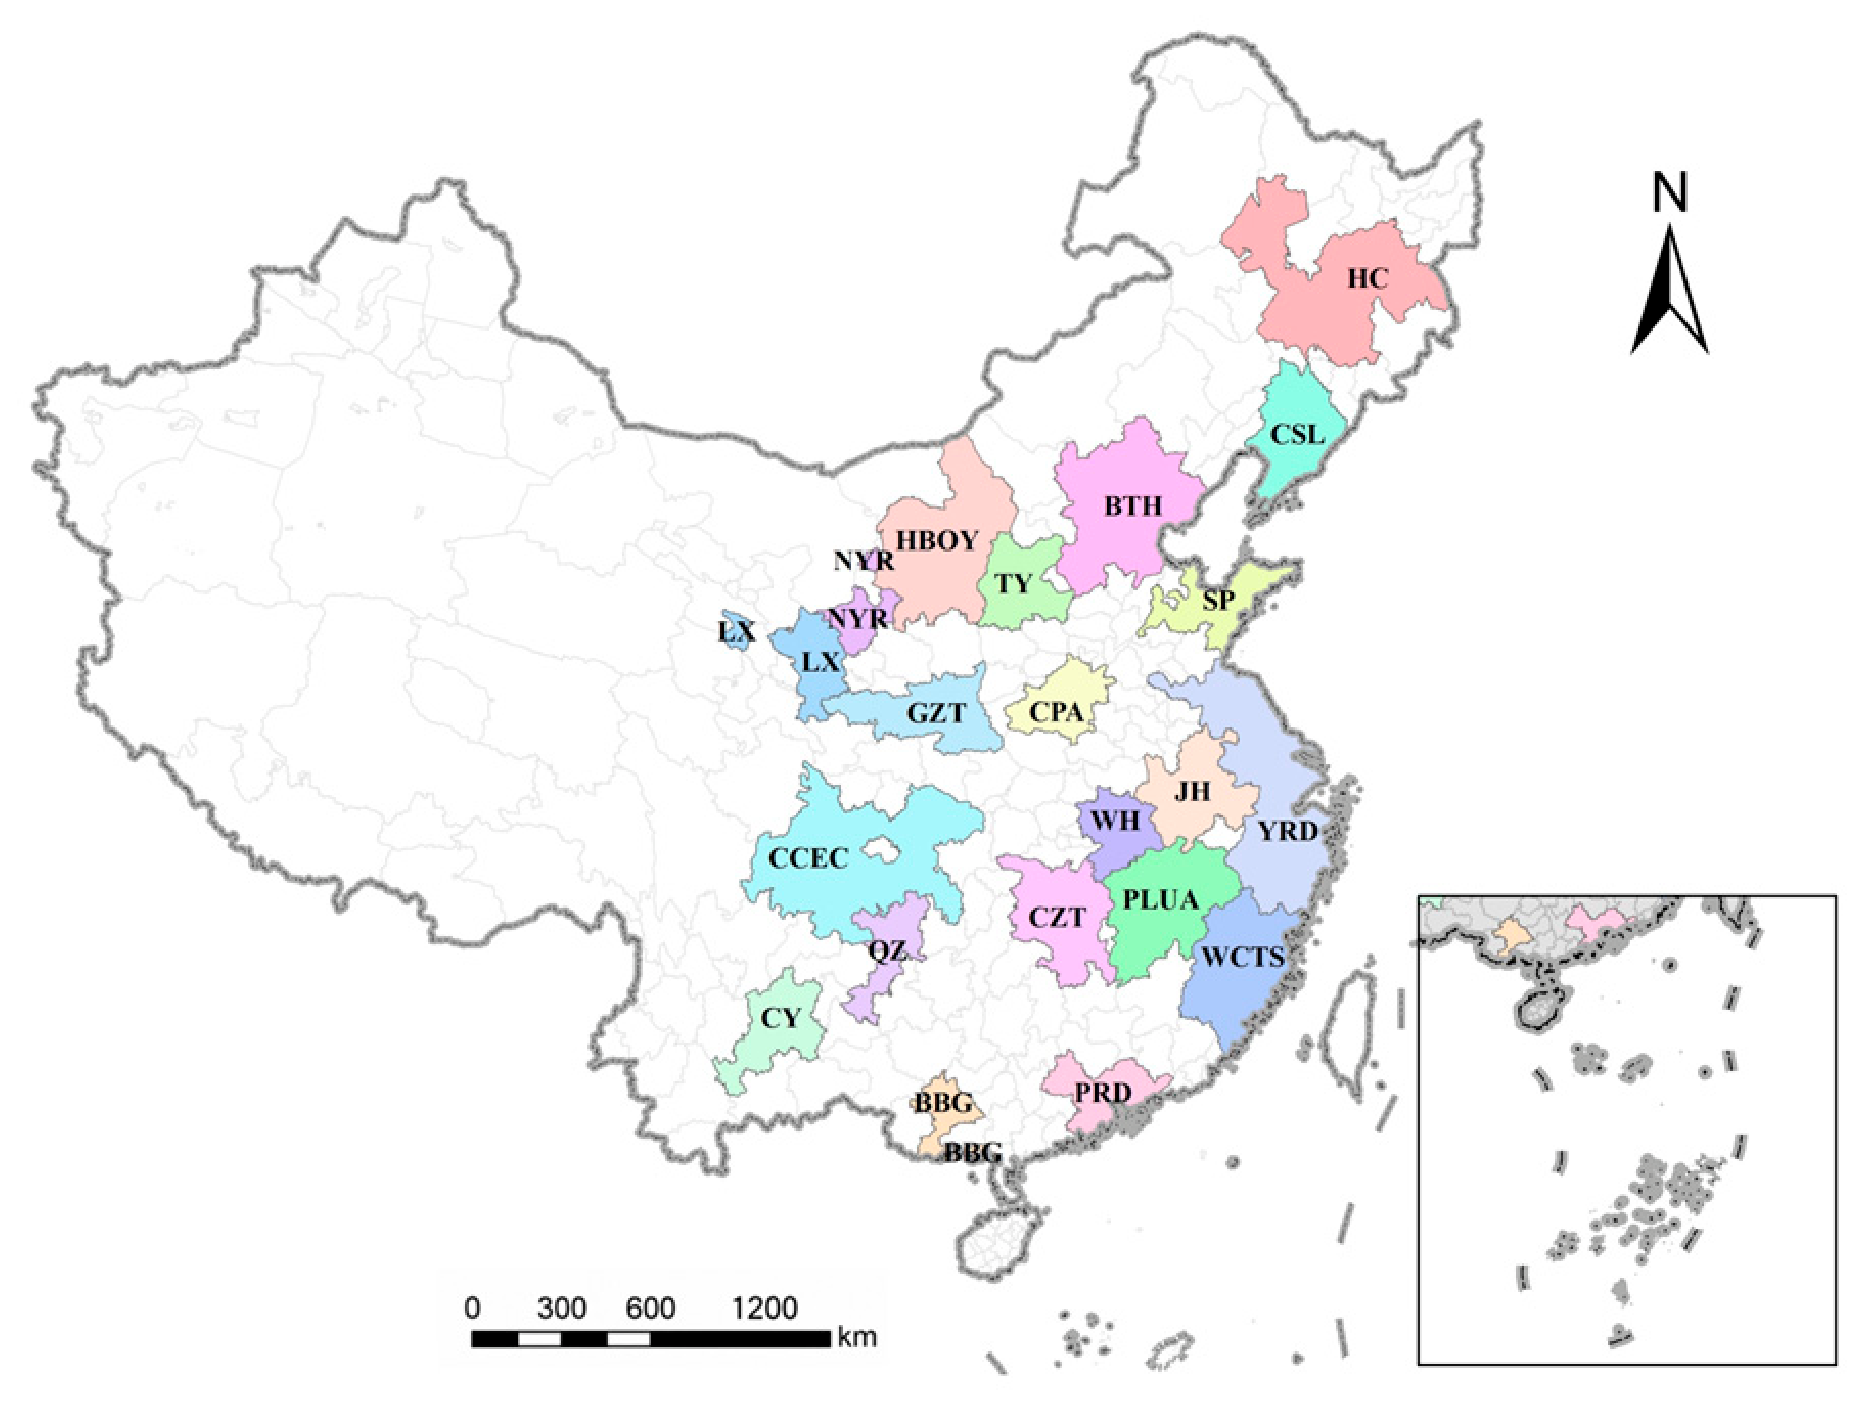
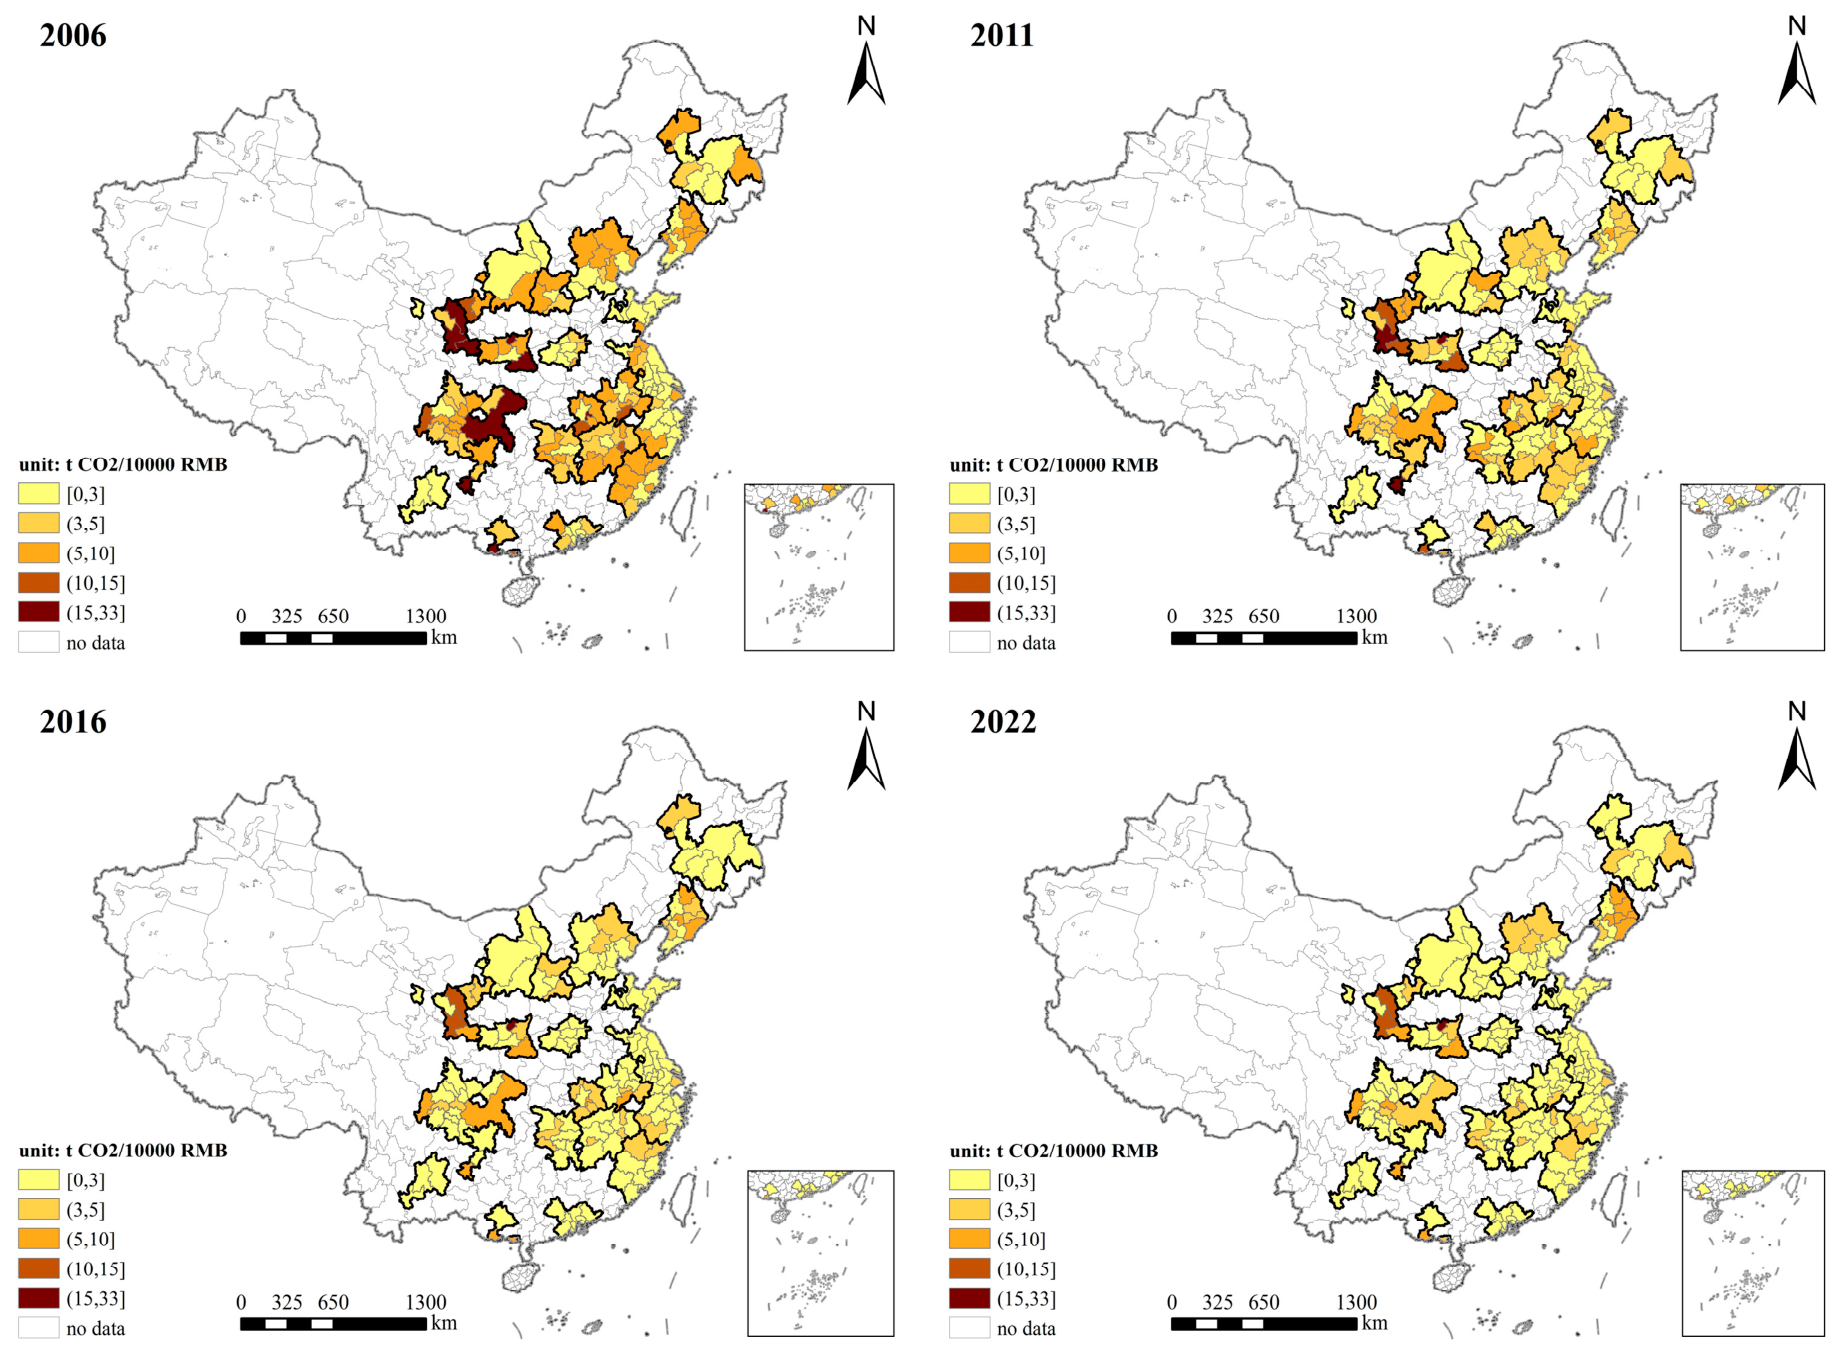
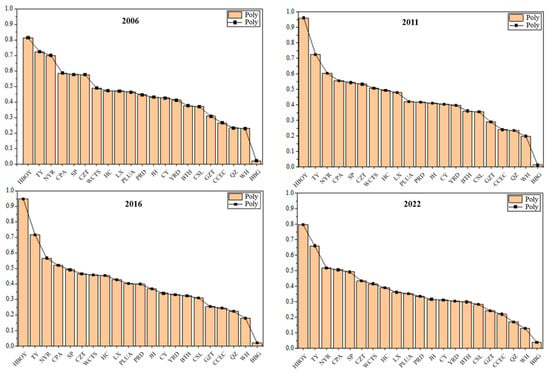
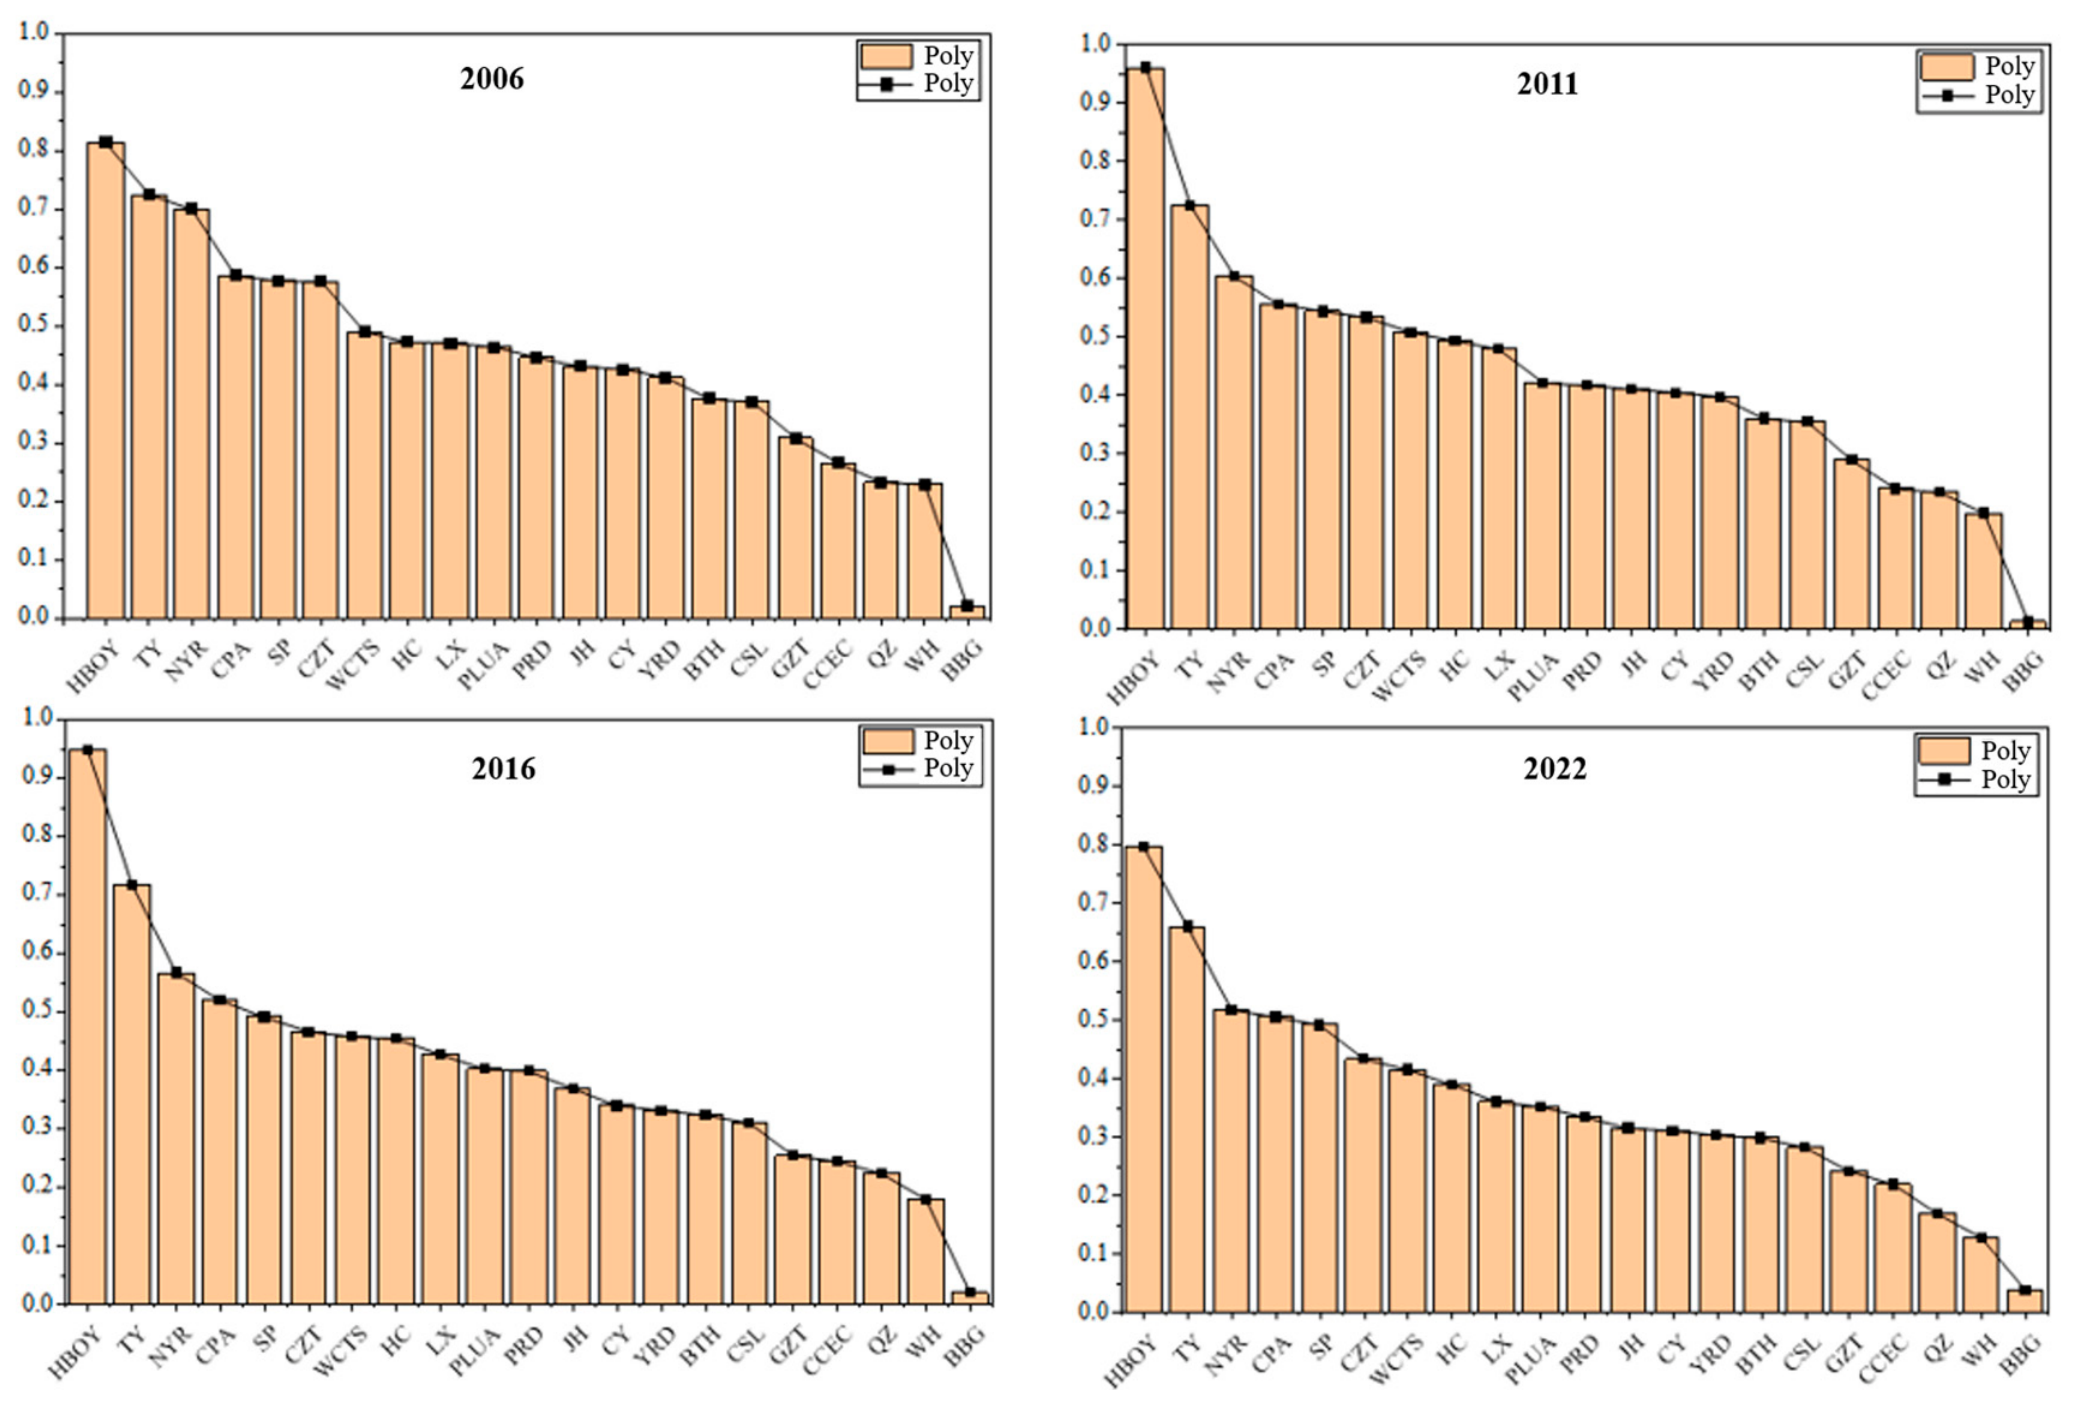

Disclaimer/Publisher’s Note: The statements, opinions and data contained in all publications are solely those of the individual author(s) and contributor(s) and not of MDPI and/or the editor(s). MDPI and/or the editor(s) disclaim responsibility for any injury to people or property resulting from any ideas, methods, instructions or products referred to in the content. |
© 2026 by the authors. Licensee MDPI, Basel, Switzerland. This article is an open access article distributed under the terms and conditions of the Creative Commons Attribution (CC BY) license.