


Abstract
Cross-country EV-battery indicators require scrutiny before they can support physical or policy conclusions. We examine the proposed demand-condition gap (DCG) through a methodological stress test and measurement admissibility assessment for 30 countries in 2022–2024. Fixed national-reference scaling changes 11 positive country means under the annual-reference scale to eight. Five of these eight lack all three archived condition-record indicators, and all eight lack charging entries. Fixed 95th- and 99th-percentile upper anchors yield 20 and 16 positives; one-field contrasts identify demand-scale normalization as the largest sign-changing contrast. All ten tested settings retain positive weights on every condition and demand term, preserving eight positives, whereas 66 term-exclusion stresses yield eight to 29. Replacing annual mineral-score completion by one retrospective reference-period median leaves four positives and changes the historical pattern. Conditional support bounds expose partial identification rather than calibrated measurement uncertainty. The analysis identifies properties of the constructed statistic that the data support. It also specifies the evidence required for subsequent material-flow and closed-loop supply chain models. Mathematical stability in selected scenarios does not validate national shortage, supply security or decision benefits.
1. Introduction
Electric vehicles (EVs) are central to transport decarbonization, but their lifecycle sustainability extends beyond tailpipe emissions and adoption rates. Rapid battery deployment redistributes environmental and resource pressures upstream to mineral extraction, refining, and cell production, and downstream to future collection, treatment, and material recovery. If battery value chains retain a linear throughput structure, burdens avoided during vehicle use can reappear as primary-resource dependence, production bottlenecks, and poorly managed end-of-life batteries. Sustainability gains therefore depend on waste prevention, resource-efficient production, and the return of secondary materials to battery value chains [1,2].
This transition creates a sequencing problem for sustainable EV ecosystems. Automotive batteries remain in use for years before becoming available for reuse, remanufacturing, or recycling. Decisions about sourcing, manufacturing, collection, reverse logistics, and treatment must therefore precede large retirement flows. Detailed material-flow accounts and closed-loop network models, however, require verified data that are unevenly available across countries. A proposed cross-country screen must be examined before it can be used to prioritize physical accounting or operational optimization. Its scores, missing inputs and dependence on the reference scale need to be explicit.
This study evaluates the demand–condition screening framework through three questions: (RQ1) how does a fixed national reference change the annual-reference DCG results; (RQ2) which denominator, threshold and completion choices change their magnitudes or signs; and (RQ3) what can source reconciliation and conditional bounds establish before physical or operational analysis? The framework follows a deployment–conditions–verification sequence. The principal analysis examines the behavior and applicability of the constructed statistic. Its sign is not interpreted as evidence of national shortage.
The empirical analysis centers on fixed-reference DCG estimates for the study countries, reported alongside record coverage. Shared input, missing data and historical analyses examine the dependence of those estimates on modeling choices. National charts, facility accounts, product-coded trade and charging records are used to assess the interpretation of each component. The focus is on the screening model’s identification limits; predictive accuracy and recovery-composite estimates do not resolve those limits.
2. Literature Review
2.1. EV Battery Lifecycle Sustainability and Anticipatory Circularity
Battery-system sustainability spans mineral sourcing, cell production, vehicle use, collection, treatment, and the reintegration of secondary materials. Circular-economy research accordingly treats value retention and reduced virgin-resource throughput as system properties rather than recycling outcomes alone [3,4]. The timing problem is therefore not confined to end-of-life waste management. Dynamic material-flow studies show that retirement volumes emerge with a lag after vehicle deployment [5,6,7,8]. Meanwhile, lithium, cobalt, nickel, graphite, and associated processing stages remain geographically concentrated, creating exposure to supply disruption, price volatility, and uneven environmental burdens [9,10,11,12,13,14].
Recovery can reduce primary-resource requirements and cradle-to-gate impacts, but its contribution depends on collection, chemistry, recovery yield, refining quality, economic viability, and successful reintegration into battery production [15,16,17,18,19]. Reuse and repurposing may extend service life before material recovery, although their benefits depend on battery condition, application, and displaced production [20,21,22]. Process-focused reviews likewise show that recycling routes differ in recovery efficiency, energy use, product quality, and industrial maturity [23,24,25]. These relationships motivate anticipatory circularity: reverse-system and secondary-material arrangements should be developed while batteries accumulate in use before they enter the waste stream at scale.
2.2. Material-Flow Accounting and Closed-Loop Supply-Chain Decision Models
Material-flow analysis (MFA) establishes a physical system boundary and traces products, materials, losses, and recovered outputs through that boundary. Recent EV-battery MFA in the Republic of Korea; for example, connects manufacturing waste, vehicle exports, collection, treatment, metal recovery, and recycled-content utilization to specific technical and policy bottlenecks [26]. Dynamic and scenario-based MFA likewise estimates when retired batteries and secondary materials may become available [5,7,8]. These studies provide physical quantities and process-specific evidence, but their data requirements usually limit them to a defined country, region, chemistry, or scenario.
Closed-loop supply-chain research addresses the subsequent design problem. It evaluates facility location, forward and reverse transport, capacity allocation, cost, emissions, collection, reuse, and recycling under operational constraints [27,28,29]. A recent multi-objective EV-battery model, for instance, jointly minimizes cost and emissions while maximizing recycling and reuse under uncertain demand and returns [30]. Such models are useful once system boundaries, flows, costs, capacities, and return assumptions are sufficiently specified. They do not identify where incomplete cross-country evidence first warrants a detailed operational study.
2.3. Sustainability Assessment, Preparedness, and Data Observability
Sustainable supply chain assessment extends environmental evaluation beyond individual facilities to the coordination of sourcing, production, use, and end-of-life activities [1,2,31]. Resilience and preparedness studies similarly examine whether supply systems can absorb disruption and maintain viable operations [32,33,34]. In the EV-battery context, however, national preparedness cannot be inferred from deployment, production, or mineral indicators considered separately. A system may occupy a strong recorded manufacturing position while remaining exposed to imported minerals, or it may have extensive EV uptake without observable evidence on collection and recovery.
Comparative assessment also depends on data observability. Battery passports, traceability systems, and interoperable lifecycle records are increasingly proposed to connect product identity, material composition, ownership, collection, and recovery outcomes [35,36,37]. These initiatives address more than reporting convenience: the absence of compatible records limits both physical material-flow accounting and operational closed-loop design. A cross-country screen must therefore distinguish low recorded conditions from conditions that are unobserved in the available sources.
2.4. Research Gaps and Study Positioning
The DCG framework addresses the gap between aggregate comparison and physical modeling. A screening statistic needs an explicit reference, component directions, weights, missing-data rules and decision boundary. Its results should reveal their dependence on these choices. The contribution has two connected parts: a methodological stress test of the proposed DCG and a measurement admissibility assessment of its inputs. The former identifies which score conclusions follow under declared normalization, weighting and completion choices; the latter states which compatible observations are still required for a physical interpretation. Country-level coverage, shared-input analysis and conditional partial identification connect these assessments. The decision table specifies the minimum data and validation required for subsequent MFA and CLSC. Source reconciliation supplies evidence about the limits of the components; it is not proposed as a new national index or an independent physical validation standard.
3. Analytical Model and Measurement Framework
3.1. System Boundary and Decision Sequence
The unit of analysis is a country-year in the archived panel. The principal comparison uses country means over 2022–2024 for the 30 active systems in the study cohort. The framework separates sales-derived deployment pressure from three recorded-condition components. All are dimensionless constructed quantities after normalization; subtraction does not make them physically interchangeable. A positive point score means only that the chosen pressure score exceeds the chosen mean condition score.
The proposed sequence is screening, source verification, physical material-flow analysis (MFA), and closed-loop supply-chain (CLSC) analysis. Here, “screening” means examining the construction and evidence requirements of the indicator. No automatic intervention or priority is assigned from a positive sign. The effectiveness of prioritization, environmental benefits and managerial decisions has not been externally validated. Recovery is outside the condition composite, and neither binary recovery pairing nor a recovery-adjusted score is included.
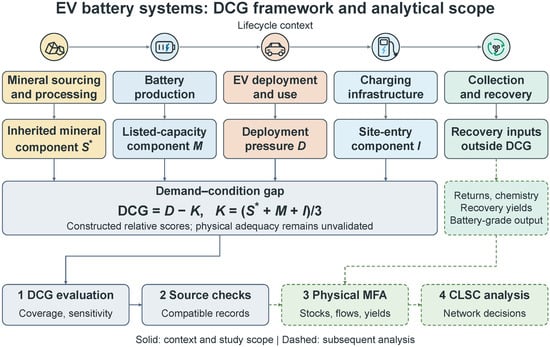
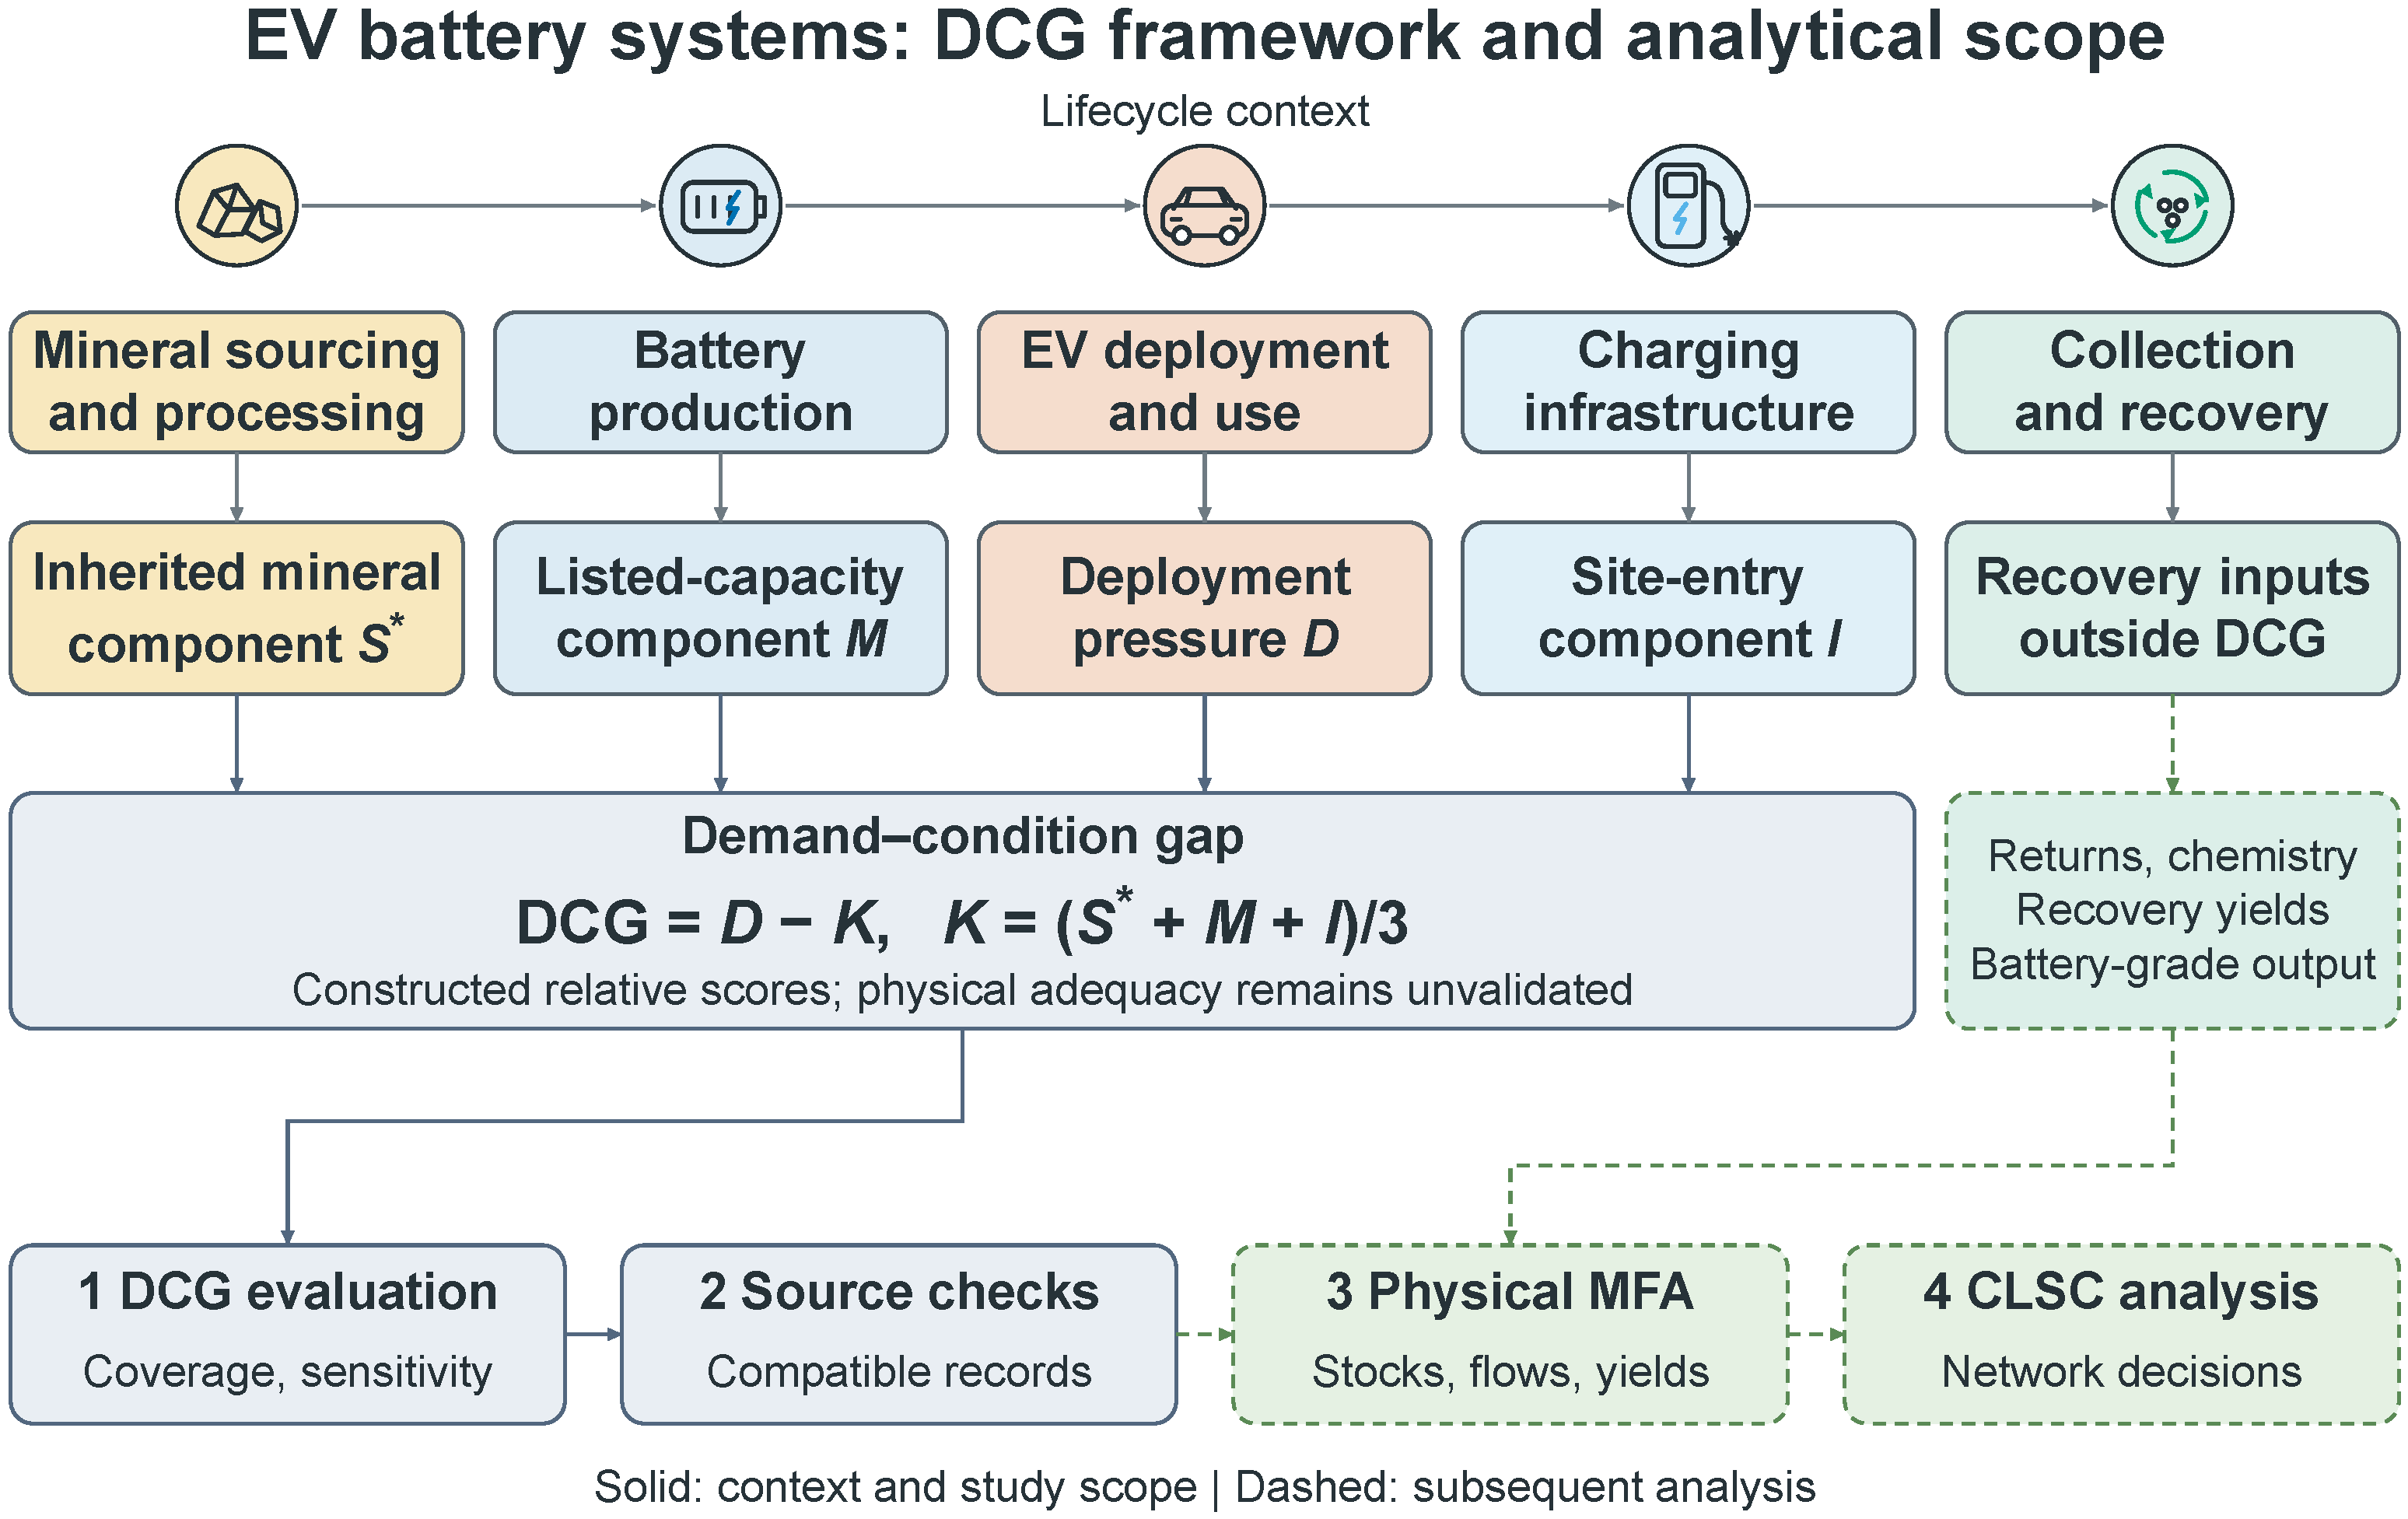
Figure 1 summarizes the lifecycle context, the DCG construction and the boundary between the present model evaluation and subsequent physical analysis.
Figure 1.
Lifecycle context, DCG construction and subsequent analysis. The upper links indicate lifecycle relationships, not measured material flows. Recovery evidence remains outside the DCG composite. Solid elements show context and the scope of the present evaluation; dashed elements denote subsequent physical and operational analysis requiring compatible system-specific data. The asterisk in denotes the mineral score after the stated missing-record completion rule: flagged unobserved values use the annual observed-row median, while other rows retain the archived score. A positive DCG does not by itself establish physical shortage or an intervention priority.
3.2. Demand Pressure and Recorded-Condition Measures
3.2.1. Fixed-Reference Normalization
For a nonnegative input x, we use
The national reference is frozen over 2017–2024: 43 national codes and 342 available country years, excluding regional aggregates. India lacks 2017–2018 rows in this archive. A degenerate reference range gives 0.5; missing inputs follow the explicit archival rules below, not an assumed physical zero. Exact fields and bounds are in Table S17. The annual-reference comparator uses year-specific normalization with its source-defined reference population. It is evaluated as a sensitivity analysis.
3.2.2. Deployment Pressure and Shared Demand Input
The archived battery quantity is MWh, where V is the recorded EV sales field. No independently verifiable source or documented calibration was recovered for the assumed 60 kWh per sale. It is a conversion assumption, not measured national battery demand. For the principal specification, only when the archive contains the actual preceding calendar year and its quantity is positive. Otherwise, its computational input is set to zero. This is a completion rule rather than an observation of zero growth. We audit preceding-available-row spans separately and do not mix their annualized changes into year-on-year growth (Table S35). The pressure score is
The constant term is excluded because it supplies no independent cross-country information. A heterogeneous physical demand model would require vehicle/powertrain-specific sales and battery energy, , and chemistry-specific material requirements. Later IEA energy/sales ratios do not retrospectively justify this constant.
- Scale-invariance property.
For any common , linear Min-Max normalization with consistently rescaled reference bounds gives
The numerator and denominator of the first normalization both multiply by a; those of the second both multiply by . Positive scaling preserves ordering, zeros, clipping and degenerate ranges; the same 0.5 rule applies if a range is degenerate. The ratio is assigned zero for zero sales in both expressions. With a valid positive adjacent lag, ; the same missing-lag rule is retained. Thus the principal normalized DCG can equivalently be written using V, its adjacent growth, and , with unchanged. The common 60 kWh convention does not identify a distinct ranking parameter. This property requires rescaled anchors: changing units while retaining old numerical bounds is a different operation. It does not extend to heterogeneous , an unrescaled saturated ratio, or automatically to . It does not validate a physical battery balance. Table S42 numerically checks the linear model at 50, 60 and 70 kWh per sale and at the sales-unit representation.
3.2.3. Inherited Mineral Component
The retained archival arithmetic is for lithium, cobalt, nickel and graphite, followed by . Missing source imports and production were encoded as zero, production clipped below at zero, and a zero denominator assigned . Exports enter the any-selected-trade observability flag, not the ratio. If that flag is zero, is the observed-row median for that year; otherwise, the frozen S field is retained. The HS/product-stage and mass/metal-content source lineage could not be recovered. The numerical use of the processed field is reproducible, but its interpretation as a measure of physical dependence or supply security cannot be authenticated. Record presence does not establish complete coverage of all four materials. The equal material weights are an inherited rule under evaluation, not chemistry- or material-stage-calibrated requirements. Varying the weights of the three condition dimensions does not test or validate weights inside this four-material component. Without chemistry- and product-stage calibration, this analysis cannot establish how internal material weights affect physically defined mineral dependence.
This component is retained to evaluate the DCG construction and examine the consequences of varying it. Product-coded imports and exports and official commodity accounts remain separate evidence checks. Mineral completion remains year-specific. Fixing the normalization of other terms therefore does not remove the effect of changing the observed-country composition on the completion value. A separate retrospective scenario pools flagged-observed processed mineral scores over the national reference, without presenting them as independently verified physical observations (Tables S45 and S46). The separate source comparisons do not provide a replacement security score or validate the physical interpretation of the national index.
3.2.4. Listed-Capacity and Infrastructure Components
The recorded manufacturing component is , with a zero ratio when archived B is zero. C is cumulative listed capacity, not a complete annual national operating census. Non-listing was encoded as zero in the inherited panel; the sensitivity analyses treat that encoding as an assumption. The fixed ratio’s upper reference bound is 905.7971 (Table S17). A large reference maximum can compress other M values. Substantial capacity discrepancies may then have only a small effect on the normalized score.
The infrastructure component is , where the archived charging quantities are site-entry records and E is EV stock. Missing records, zero denominators and completion follow Tables S17 and S20. These records do not establish annual charger stocks, service quality, utilization or spatial access. IEA, EAFO and Eurostat stock and category records are analyzed within their respective source frames and are not inserted into this historical construction.
3.3. Recorded-Condition Aggregation, Gap and Conditional Bounds
The model under evaluation is
Equal weights reproduce a transparent reference specification; they are not empirically calibrated substitution rates between physical conditions. The strict threshold operator is . Zero is equality of constructed scores, with no natural shortage or policy meaning. Testing alternative thresholds assesses numerical membership, not the validity of a national risk boundary.
Conditional bounds propagate explicitly stated component supports:
Completion-only bounds vary only for flagged completed terms over , retaining other inputs and D. A separate mineral-support exercise varies every S over , holding fixed. Full-condition support varies all three and gives . Country-mean lower and upper bounds are calculated by averaging the corresponding annual lower and upper endpoints, respectively. These rectangular supports are assumptions, not probabilities, calibrated confidence intervals or joint measurement-error coverage. Unknown errors in demand, recorded values and their covariation remain outside them. In particular, a physical demand change affects both D and and cannot be represented by independent marginal perturbations.
4. Methodology
4.1. Data Sources, Information Windows and Provenance
The principal model analysis contains 30 study countries and 90 endpoint rows. These are complete numerical model rows after the inherited completion rules, not 30 complete national-system accounts. Historical IEA deployment context covers 2010–2024, but the fixed-model historical comparison is restricted to the available 2017–2024 reference window. Manufacturing chart observations for selected countries in 2022 and 2023 and the September 2022 JRC inventory do not provide a harmonized 2010–2024 operating-capacity history.
The additional ten markets create a 40-country, 120-country-year evidence-availability grid, not a larger complete DCG validation sample. Thirteen observations pair sales with source capacity: six national IEA chart cases and seven dated JRC inventory cases. Only the six chart cases also pair capacity with separately reported car-battery deployment. The primary model sample, these external comparison subsets, and the separate historical source cohorts have different requirements and are not pooled. Supplementary Tables summarize the available dates, units, flags, quantities and source qualifications. They do not provide an observation-level URL register for every record. The retained analytical data and scripts are available as specified in the Data Availability Statement.
Each candidate external observation is checked against the intended geography, time, unit, product/activity stage, operating state and source frame. A value may support a project description but not annual national output. Missing categories remain missing; targets and source intervals retain their states. This rule protects the interpretation of the DCG components rather than supplying a separate overall data-quality score. The supplementary material documents the source distinctions and assumptions used in these comparisons.
Data processing, DCG calculations and sensitivity analyses were implemented in Python 3.12.10 (Python Software Foundation, Beaverton, OR, USA), using NumPy 2.4.6 (NumPy Developers), pandas 3.0.3 (pandas Development Team) and SciPy 1.18.0 (SciPy Developers). Quantitative plots were generated with Matplotlib 3.11.0 (Matplotlib Development Team).
4.2. Reference, Denominator and Joint-Input Sensitivities
The annual scale is first compared with the frozen national scale. Alternative M definitions then use normalized absolute C, normalized and , while and the reference remain fixed. Their country-mean gap difference is . Additional fixed-anchor specifications use the reference minimum and its 95th or 99th percentile as bounds, with clipping, for all five normalized fields; separate variants change only the manufacturing upper bound. Quantiles use linear interpolation over the same 342 reference rows. A normalized variant changes only M. These five sensitivity contrasts are reported in Table S37. We additionally replace only one of the five upper anchors at a time by its fixed P95 value, holding all other bounds and weights unchanged (Table S44). Because aggregation is linear, the country score changes sum to the all-field score change. Threshold-crossing counts need not be additive. These contrasts isolate changes in the formula; they do not estimate causal demand or investment effects. Thresholds are examined separately at −0.05, −0.025, 0, 0.025, and 0.05.
The joint-input scenario transfers IEA source-derived effective car-energy factors to archived B. Available factors cover five countries and 15 endpoint country years, with 2016–2024 source values used where archived lag calculations require them; all other countries retain factor one. Growth and are recomputed together on frozen anchors. Transferring factors between the IEA car population and the archive’s sales population is a scenario assumption. It is not a measured correction. IEA itself derives deployment from sales and weighted battery size, so the ratio is not an independent pack-level validation [38]. Pressure-only, manufacturing-only and joint changes remain distinct.
4.3. Completion, Historical and Reference-Sample Checks
We report per-country record years and completion fractions. The arbitrary mid-support stress scenario sets nonlisted country-mean M to 0.5; it is not empirical imputation. Conditional replacements separately use the 25th, 50th and 75th percentiles of the nine listed-country mean M scores, with linear interpolation. These are selected-source score scenarios, not estimates of missing physical capacity (Table S38). Separate annual mineral completions at 0, 0.5 and 1 test the flagged rows. The pooled-mineral scenario replaces only flagged unobserved annual values by the median of 109 flagged-observed processed S rows from 14 countries in the 342-row national reference. Observed-flag values, and all anchors remain fixed. Its common median is 0.1628. Pooling 2017–2024 is retrospective because it uses later-period information in earlier comparisons. It is neither a forecasting procedure nor a calibrated imputation model. The selected record-present subset requires all three archival record types and is not a physical complete-case national sample. No missingness mechanism is identified from these flags.
Historical model comparisons use the same fixed anchors and the 29 endpoint countries with every year between 2017 and 2024, excluding India. Period means give equal weight to countries, with within-period annual means; the 30- and 43-country available-row alternatives remain separate. For systematic leave-one-country-out (LOCO) analysis, each of the 30 study countries is deleted in turn from the 43-country reference pool; the other 13 reference countries remain. All five normalization bounds are refitted, while inherited values and completion rules stay fixed. Each refit is compared with the baseline on exactly the common 29 endpoint countries, excluding the deleted country from every sign-change count (Table S39). This reference-anchor influence analysis isolates the normalization response to deletion. Annual mineral medians, missing-data rules and the other model components remain unchanged. Removing a country is distinct from adding markets. A pressure-only expansion from 33 to 43 available countries does not evaluate full DCG stability. No complete 40-country DCG was computed, because compatible condition inputs for the ten added markets remain unavailable.
We also vary , with non-negative weights summing to one. The declared condition grid has all 15 quarter-step simplex combinations, including zero-weight vertices; crossing these with level weights 0, 0.25, 0.5, 0.75, 1 in D gives 75 stress settings. The equal-weight primary is added as the 76th distinct setting. Separate demand-weight changes retain equal condition weights. We report sign changes, ranks and per-country minimum/maximum scores; grid frequencies are counts of chosen settings, not probabilities. Vertices are deliberate exclusion stresses rather than proposed calibrated weights (Tables S40 and S41). We partition the existing grid into ten illustrative interior settings with every condition weight positive and the level weight strictly between zero and one, and 66 settings excluding at least one condition or demand term. This partition describes the experimental design; it does not distinguish empirically established plausible weights from implausible ones.
4.4. External Source Reconciliation and Uncertainty Limits
Manufacturing checks retain national IEA estimates separately from JRC snapshot totals and facility targets. Headquarters location is not substituted for factory location, construction is not operational, and output is not nameplate. JRC matching supplies a named-inventory unmatched fraction rather than a national false-negative rate. Same-year substitution changes only five overlapping 2022 country quantities, without carrying a snapshot into later years.
Nine HS6 mineral products retain imports, exports, values, net weights, stages and estimated flags. and describe paired-product trade direction. BGS natural-graphite quantities and USGS commodity-wide apparent-consumption accounts have different scope and denominators. Neither identifies battery-grade supplier access nor authenticates the inherited mineral field. USGS lithium inequalities and withheld quantities remain intact; edition differences are revisions, not error distributions [39,40,41,42].
IEA, EAFO and Eurostat charging categories, stock denominators and release vintages are preserved. These comparisons reconcile source records. They do not provide independent validation because the sources may share upstream data. Historical cohorts in reported units contain five battery countries and six charging countries over 2017–2024; they complement the model history but cannot establish that reporting definitions remained invariant. The shorter 22-country charging cohort is kept separate.
We did not locate verifiable measurement-error distributions, covariance estimates or compatible physical benchmarks sufficient for joint error calibration. Three exercises are therefore distinguished: score-support bounds conditional on fixed demand, a joint shared-input scenario, and propagation of a single reported site interval. None supplies complete uncertainty for a national physical model. Searches did not recover the mineral-source lineage, nationwide operating-facility history, battery-grade flows or actual EV-battery recovery needed for stronger interpretations.
5. Empirical Results
5.1. Fixed-Reference DCG and Country-Level Evidence Coverage
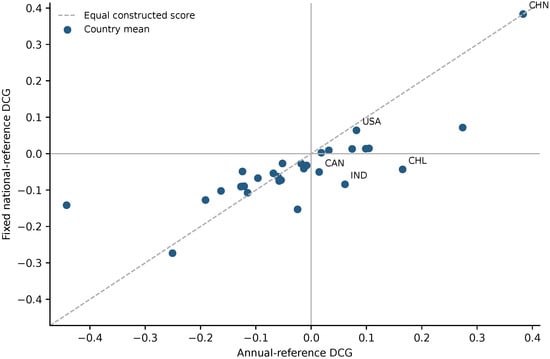
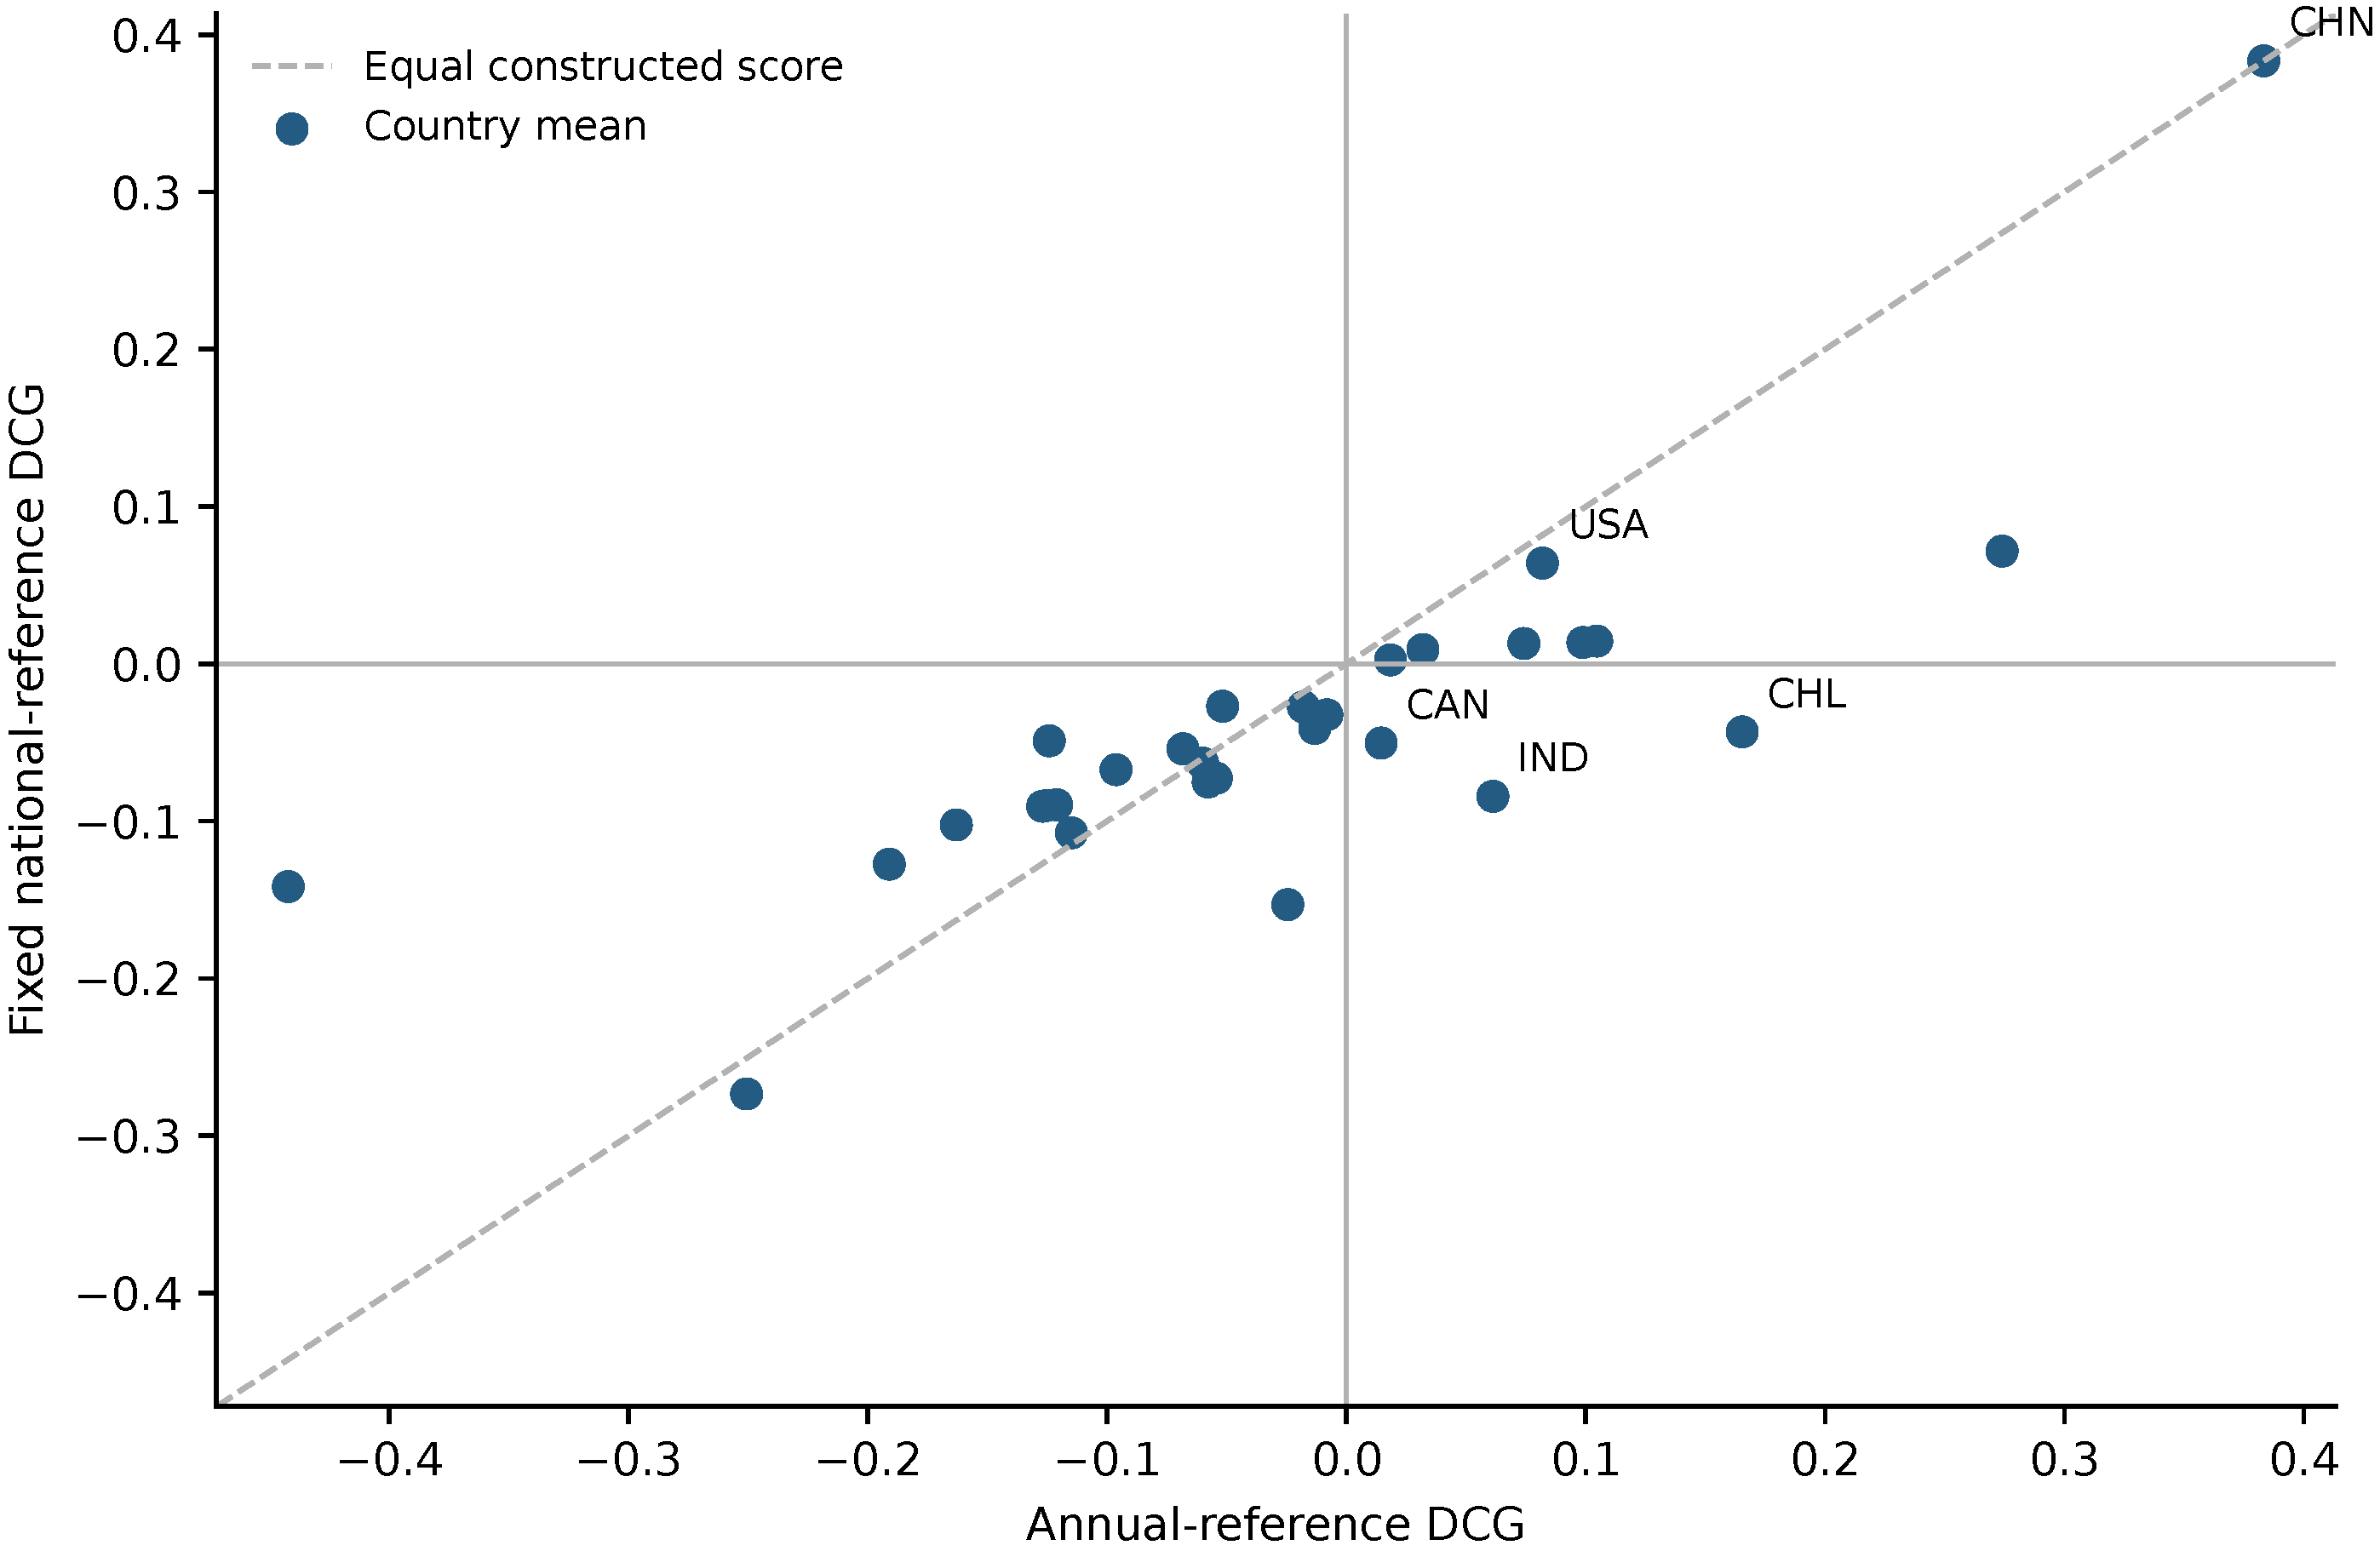
Among the eight positive point means, Greece, Iceland, Israel, New Zealand and Türkiye have not archived any trade flag, positive capacity listing or charging entry in any endpoint year: five of eight lack all three record indicators, and all eight lack charging entries (Table S43). Zero record counts are not physical zeros, and an any-trade flag is not complete four-mineral observation. Positive DCG therefore first signals a need to inspect source coverage and completion assumptions. The fixed-reference analysis yields eight above-zero country means, compared with 11 under the annual reference. Mean fixed DCG is . China, Greece, Iceland, Israel, Mexico, New Zealand, Türkiye and the United States have positive point estimates under this particular specification. These identities describe arithmetic membership, not a calibrated priority or a national shortage finding. Canada, Chile and India change from above zero under the annual comparison to at/below zero on the fixed scale. Rank correlation is 0.836, and sign agreement is 90 percent. Figure 2 compares the country-mean scores under the two reference choices. The calendar-lag audit confirms valid adjacent positive lags for all 90 endpoint rows; recomputing growth leaves all signs unchanged and changes scores by less than . In the 342-row reference, 237 lags are valid adjacent comparisons, 103 have nonpositive predecessors, and two have no predecessor. The single positive-predecessor multi-year span in the national archive is Poland 2010–2012, outside the reference window. The growth maximum, 22.9706, is Israel 2017 versus 2016: 97.8 versus 4.08 MWh. It is a small-base adjacent increase, not a multi-year change. The strict reconstruction also leaves reference growth inputs unchanged within (Table S35).
Figure 2.
Country-mean DCG under the annual reference and frozen national reference. The diagonal marks equal constructed scores; axis zero lines are arithmetic boundaries. Labels identify changed memberships and selected reference cases. Neither axis is a physical shortage measurement.
Table 1 reports every study country together with record presence and conditional bounds. The 90 endpoint rows contain 57 median-completed mineral scores, 65 capacity non-listings encoded as zero and 37 zero-completed charging years. An any-trade flag is weaker than complete four-material observation. Likewise, a positive listed capacity and a raw site entry do not establish annual national manufacturing or charger stock. These qualifications are necessary to interpret how the point scores were constructed.
Table 1.
Fixed-reference DCG results with record presence and conditional bounds, study countries in 2022–2024. Counts range from zero to three. The sign uses a strict mean DCG greater than zero and is not a national risk class. Supplementary Table S33 provides the detailed score display and definitions of completion fractions.
5.2. Shared Demand Input and Alternative Manufacturing Definitions
On the fixed country means, the D–M Pearson correlation is and the Spearman correlation is 0.202 (Table S10). Weak marginal association does not remove the algebraic shared input. Each of the absolute-capacity, log-capacity and saturated-ratio alternatives reduces eight positive point means to seven; the United States changes sign in each case (Table S18). This is distinct from the annual-to-fixed change from 11 to eight.
The five-country joint energy-factor scenario retains the same eight positive means, while its largest absolute country-mean change is 0.0927. Joint changes satisfy because the other inputs and weights are held fixed (Tables S28 and S29). Stable signs under this specified scenario do not validate the common energy coefficient or robustness in the 25 untested countries. The source-derived endpoint ratios range from 33.33 to 70.77 kWh per car. They do not represent independently measured battery packs. Table 2 summarizes these and the other specification and sensitivity checks.
Table 2.
Grouped sensitivity overview. N/base reports compared countries/baseline positives. Ranges summarize settings; shifts are maximum absolute changes. Bounds are Max/P95/P99, one-field P95, definition-specific (Variant), frozen or refitted. Annual scaling uses its source-defined pool; LOCO freezes mineral scores and completion. Different comparison sets preclude interpreting counts as comparable effect sizes.
The manufacturing reference maximum comes from Poland 2018: listed MWh and sales-derived MWh, giving . Under that scale, M has a mean of 0.0023, a median of zero and 70 percent zero country means. Its SD is 0.0088, much smaller than (0.1012) and I (0.1510). The equal-weighted component SDs are 0.0029, 0.0337 and 0.0503, respectively (Table S36). Table 3 summarizes the country-mean component distributions. These describe effective spread, not causal variance shares; covariance prevents adding SDs into a variance decomposition.
Table 3.
Distribution of country-mean condition scores, 30 countries in 2022–2024. SD uses denominator 29; all minima are zero. The mineral row reports the adjusted score. Nominal equal weights do not imply equal realized dispersion.
Using fixed 95th- or 99th-percentile upper anchors for all normalized fields gives 20 or 16 positive means, changing 12 or eight signs, with rank correlations 0.666 and 0.863. Changing only the manufacturing upper bound gives seven (USA changes) or eight positive means, with maximum shifts of 0.3261 and 0.2049; log-ratio normalization retains eight but shifts a score by up to 0.1696 (Table S37). Thus fixed reference bounds provide a common time scale but do not ensure insensitivity to the upper-bound rule. The one-field P95 contrasts yield 22, 16, seven, eight and eight positives for level, growth, manufacturing ratio, charging density and fast share, respectively, with 14, eight, one, zero and zero sign changes (Table S44). Level-only P95 has the largest sign-changing contrast; growth also raises pressure, while the condition-score changes partly offset these increases in the all-field result of 20. Per-country gap changes add within ; sign-change counts do not. This is an arithmetic decomposition, not a causal attribution to physical conditions.
5.3. Threshold Sensitivity and Conditional Sign Identification
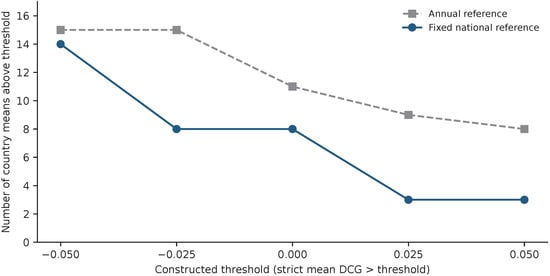
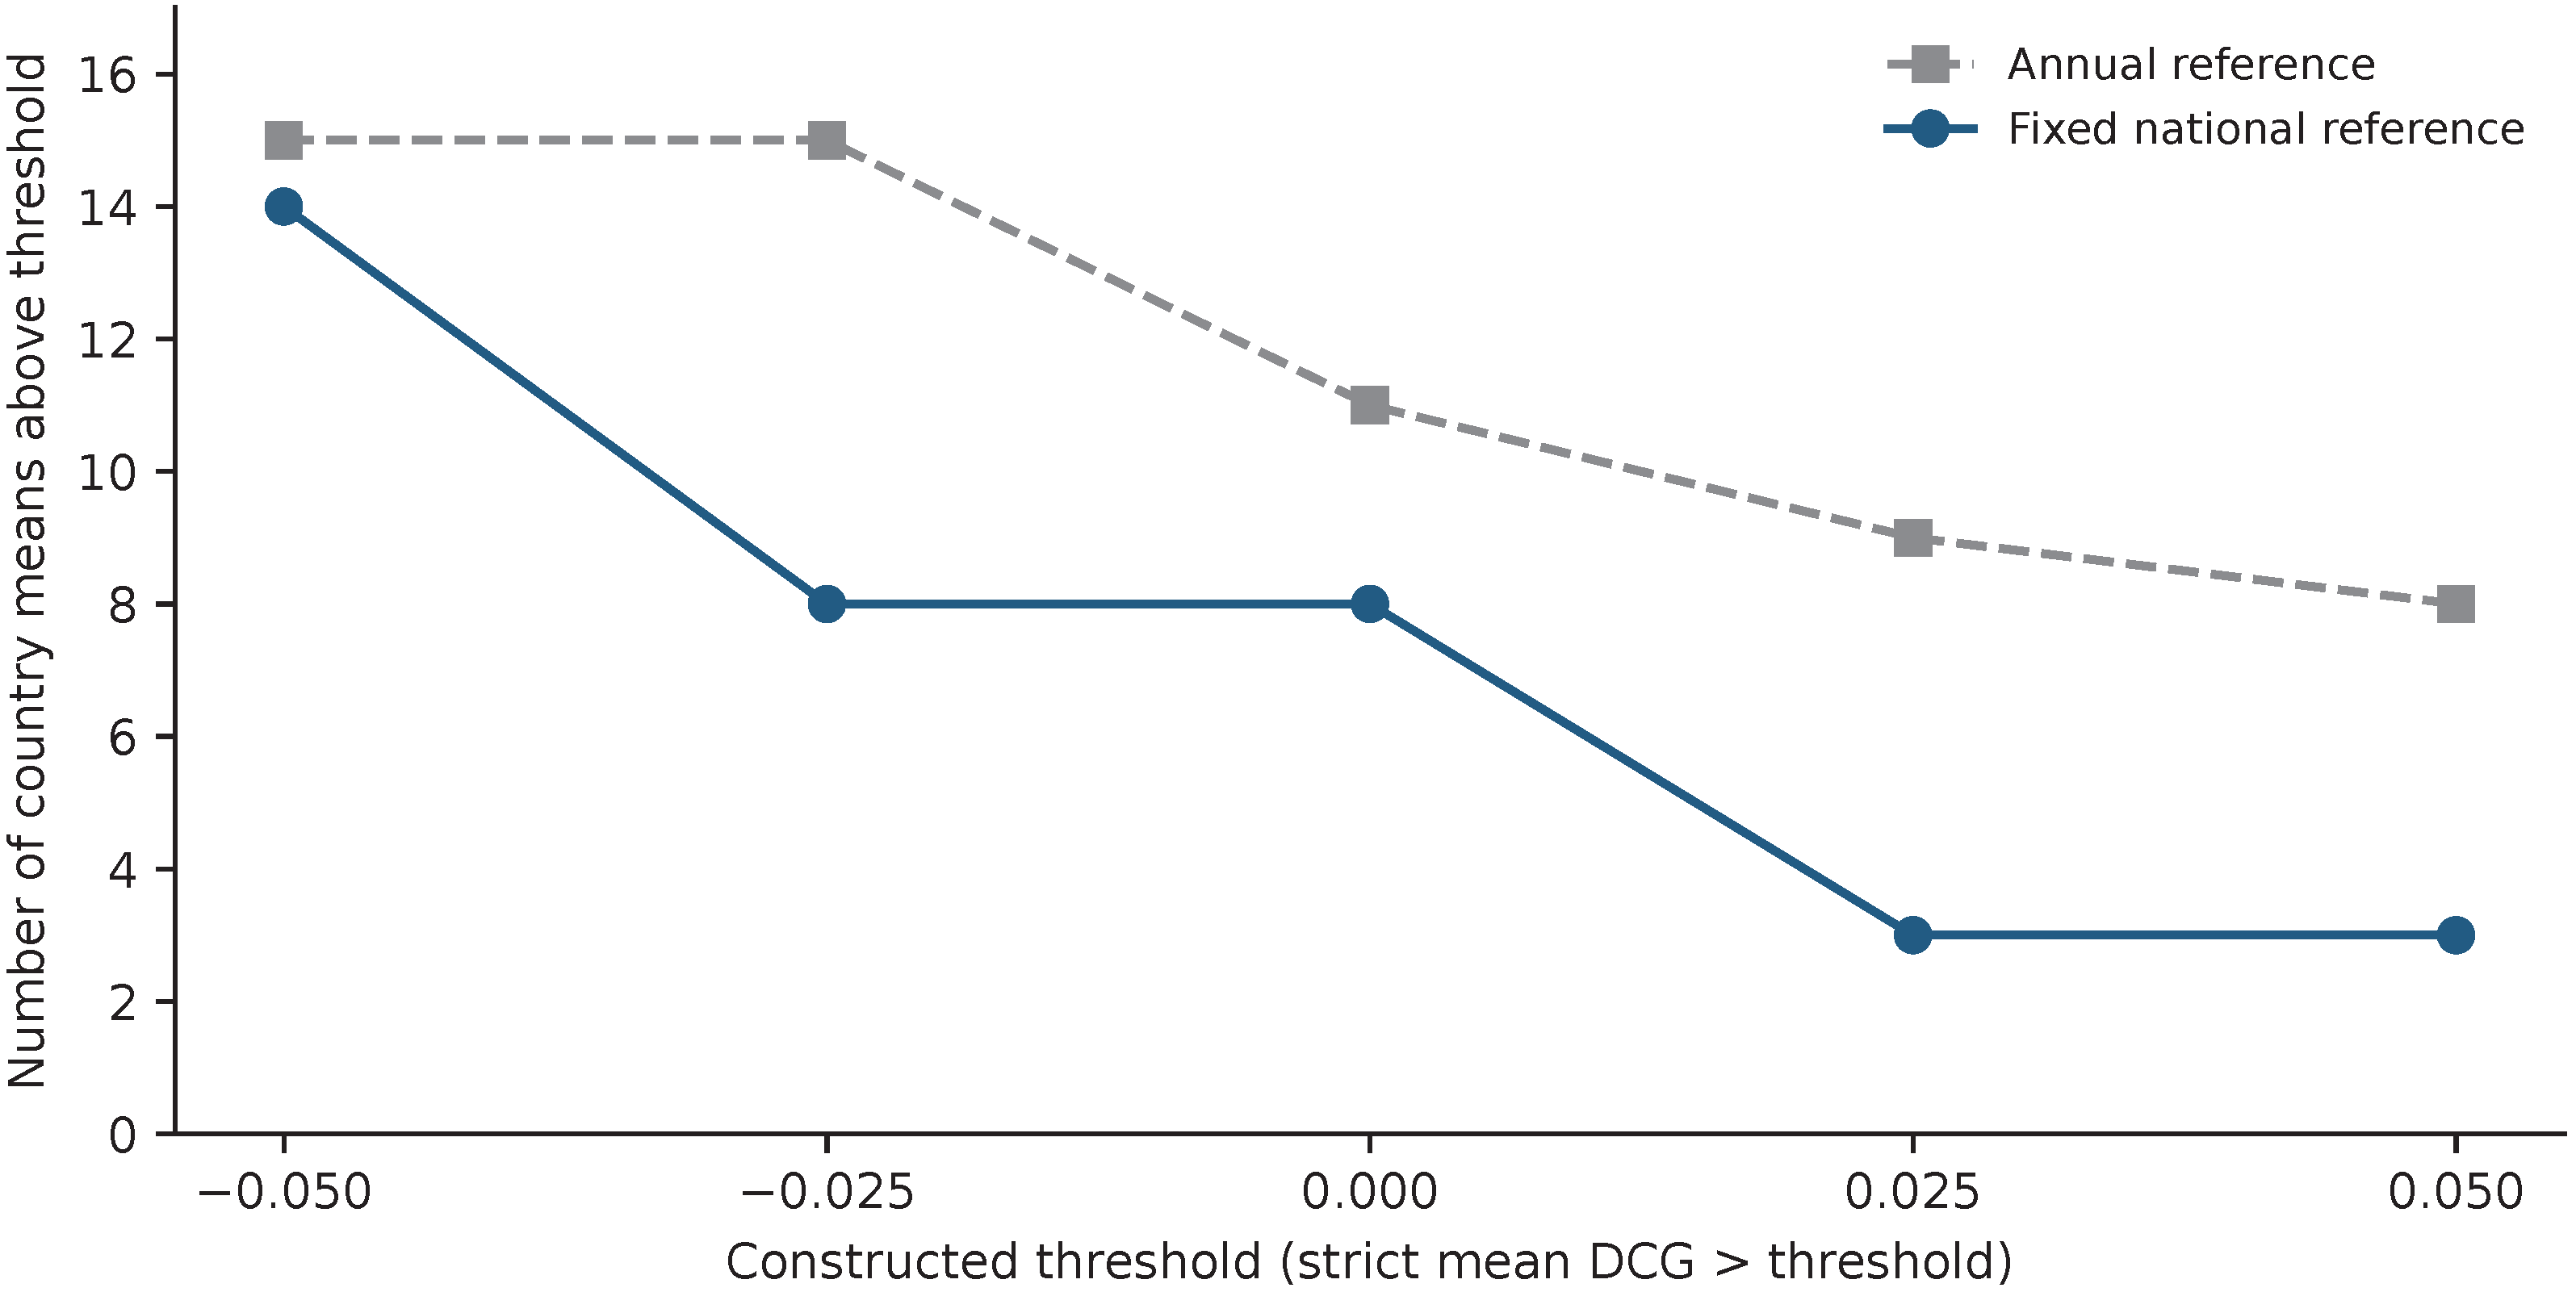
For thresholds , fixed-reference above-threshold counts are fourteen, eight, eight, three and three. China, Türkiye and the United States exceed every tested threshold; 16 countries are at/below all five, and 11 cross the grid (Table S19). Figure 3 compares threshold sensitivity under the annual and fixed references. These are memberships under selected numerical thresholds, not externally validated risk groups.
Figure 3.
Threshold sensitivity of country-mean constructed DCG under two reference choices. Counts use strict inequality. The five tested thresholds have no calibrated policy or physical interpretation.
Completion-only bounds leave 22 means negative throughout, one positive throughout and seven including zero. When every mineral component is allowed its full support, the corresponding counts are 20, one and nine (Table S22). China is the positive-throughout case under these two conditional exercises; this does not validate its mineral data or establish physical shortage. When all three condition components vary over their full supports, every interval includes zero by construction because . The result demonstrates loss of sign identification under that assumption, not equal empirical uncertainty across countries.
5.4. Completion Assumptions and Source-Record Subsets
Replacing nonlisted country-mean M by 0.5 in the arbitrary mid-support stress scenario reduces eight positive means to two; Greece, Iceland, Israel, Mexico, New Zealand and Türkiye change membership. The imposed shift is exactly for each of the 21 nonlisted country means. On the frozen linear ratio scale, implies ; no evidence makes that a plausible missing national capacity. Conditional replacement by listed-country quartiles 0.0017, 0.0018 and 0.0047 retains eight positive means in all three cases, with maximum shifts of 0.0006, 0.0006 and 0.0016 (Table S38). Their small effects reflect the compressed score distribution and do not validate a missing-capacity model. Completing an unobserved annual S at 0.5 or 1 also leaves two positive means, whereas completing it at zero leaves eight (Table S21). These are explicit alternative assumptions rather than estimates of the missing physical quantities. Using the pooled processed-mineral median instead of annual completion leaves four positive means; GRC, ISL, ISR and NZL cross zero, with maximum gap shift 0.0538 and rank correlation 0.9248 (Table S45). This checks dependence on the completion time frame without authenticating the inherited mineral construct.
The positive-listing subset contains nine country means. Requiring all three archive record types simultaneously leaves seven annual rows from Germany, Japan and Sweden, with unequal selected years; all three resulting country means are negative. This selected subset does not validate an imputation model or establish complete national-system coverage. The effects differ across completion rules, indicating dependence on those rules rather than a stable national classification.
5.5. Historical Patterns and Reference-Sample Dependence
For a balanced historical model comparison, the same 29 countries are retained in every year from 2017 through 2024. India is excluded because its early archived rows are missing, even though newly retrieved IEA source observations exist for those years. Across 2017–2019, 2020–2021 and 2022–2024, mean D is 0.0234, 0.0314 and 0.0302; mean K is 0.0978, 0.1007 and 0.0718. The corresponding gaps are (Table S23). The increase toward zero combines nonmonotonic pressure with lower recorded/completed conditions. This movement toward zero is specific to the annual-completion baseline. With the retrospective pooled mineral completion, the same balanced cohort has period mean gaps of (Table S46), changing the direction of the early-to-late comparison. Thus a common normalization scale does not remove time-varying completion effects. Neither trajectory identifies harmonized physical deterioration or improvement.
The systematic 30-deletion LOCO analysis identifies four countries that affect anchors: Austria (density), China (level), Israel (growth) and Poland (manufacturing). Only deleting China changes signs, for six common countries: Belgium, Canada, Germany, Spain, France and the United Kingdom. On the common 29-country set, its positive count changes from seven to 13, rank correlation is 0.8335 and maximum shift is 0.3701. Deleting Poland or Israel changes no signs but shifts scores by up to 0.1288 or 0.1272; their rank correlations are 0.8764 and 0.9793. Austria changes scores by at most 0.0075 without changing signs. All 30 refits, anchor bounds and common-country results are retained (Table S39). These are reference-anchor influence results with frozen mineral scores and completion, not a full resampling reconstruction of the model. This reference-sample test differs from the separate pressure-only expansion from 33 to 43 available countries. Adding ten real markets extends source evidence, but no complete 40-country DCG classification-stability experiment was performed. Neither deletion nor pressure-only expansion establishes full-model stability in the enlarged country set.
The three condition-heavy interior settings (0.5, 0.25, and 0.25) and their permutations, retaining equal demand weights, each keep the same eight positive means. Equal condition weights with level weights 0, 0.25, 0.5, 0.75, and 1 also keep those signs. The ten interior settings all retain eight positive means with no sign changes. Sign agreement in these finite settings does not ensure stable score magnitudes or relative distances between countries: the largest country-mean score movement is 0.1812. It also does not establish stability over all positive-weight combinations. The other 66 settings exclude at least one condition or one demand term and yield eight to 29 positives; their union contains 24 countries that change sign somewhere. The broad range therefore describes term-exclusion stress and should not be read as the effect of small local weight perturbations. China, Israel, Mexico, New Zealand, Türkiye and the United States remain positive across this finite grid (Tables S40 and S41). This stability is conditional on the finite grid, archived inputs and fixed bounds. It does not establish physical validity or stability under all possible errors or weights. The record limitations also apply to those six countries.
5.6. External Evidence on Component Interpretation
The source comparisons show the limits of interpreting model stability as physical adequacy. In four 2023 IEA country cases, absolute capacity and capacity divided by domestic car-battery deployment have a rank correlation of (Table S2). Korea has zero archived listed capacity but a positive source-reported national nameplate estimate of 53 GWh/year. This contradicts interpreting non-listing as physical zero, although it does not establish realized output or supply access. Future project targets and commissioning milestones likewise cannot supply historical annual operating capacity.
Within the JRC frame, nine of 12 operating/expansion rows are unmatched to the archive; excluding pilot/R&D labels gives six of nine unmatched (Table S24). These are source-frame fractions, not national false-negative rates. Replacing only the five overlapping 2022 country quantities leaves positive membership unchanged and changes a country mean by at most 0.0035 (Table S25). The normalization can attenuate an appreciable source discrepancy so that stability does not authenticate the archived inventory.
Mineral source reconciliation distinguishes trade direction from the retained mineral component. The natural-graphite check contains 22 exploratory endpoint rows and 16 after calendar/quantity exclusions; only two of those 16 lack estimated trade weights (Tables S7 and S8). USGS commodity accounts preserve lithium censoring and edition revisions. For US 2024, cobalt changes from 76 to 74 percent and nickel from 48 to 43 percent between the two retained report editions, while natural graphite remains 100 percent and lithium remains >50 percent (Table S31). Those broader accounts cannot recover the archived mineral field’s stage/unit lineage or calibrate DCG error.
Additional stock and charging sources recover 29 of 30 added-market country-year totals in at least one retained source. Latvia 2022 remains a six-bin subtotal rather than a complete total. EAFO and Eurostat differ in 46 of 53 overlapping values, which signals source-definition or vintage differences without proving which is more accurate. Five-country battery and six-country charging histories in reported units provide source-qualified context (Tables S26 and S27), not external validation of DCG.
The single-site interval example propagates Nevada’s approximate 38–39 GWh/year range as of March 2024 against a fixed US annual car-battery denominator of 110 GWh, giving 0.3455–0.3545 (Table S30). It is neither a national capacity nor a confidence interval and is not substituted into the main DCG. Cross-source records and reported revisions therefore qualify the components without supplying a calibrated joint measurement-error distribution.
6. Discussion
6.1. Interpretation of the Fixed-Reference Screen
The fixed-reference analysis changes the empirical interpretation of DCG. Fixed-reference scoring yields eight positive point means, compared with the annual-reference comparison’s 11; denominator and completion choices change selected memberships. Conditional supports sometimes leave a sign determined and sometimes do not. These findings characterize the proposed indicator and clarify the evidence needed to interpret it. They do not establish that the underlying national battery systems have the corresponding physical gaps.
Accordingly, a country should not be prioritized for investment or intervention because its model mean is positive. The model can be used to inspect which assumptions and missing records drive an apparent contrast, provided the assumptions are reported with the result. Whether that inspection improves real planning remains an external validation question. The analysis therefore evaluates the framework’s applicability within the limits of the available evidence.
6.2. Manufacturing Position and Material Exposure Under Incomplete Data
The manufacturing position is especially sensitive to the denominator, reference maximum and inventory scope. A large can describe an export-oriented producer or a small domestic market, while a small normalized M can reflect a large reference maximum. A sizable listed numerator can therefore receive a near-zero normalized manufacturing score. This can result from the interaction of the domestic-demand denominator and an extreme reference maximum, rather than near-zero physical manufacturing conditions. Neither identifies qualified supply nor utilization. The source examples and formula alternatives show why additional capacity alone need not translate into an informative DCG change.
Mineral direction has no universal favorable interpretation. Domestic production, transformation, re-export, reporting gaps and grade requirements can produce similar selected-product trade values. Without compatible stages, stock changes, metal contents and destination flows, these mechanisms and their DCG consequences are not identified. Retaining the inherited for model evaluation does not validate it as a national material-security measure. A defensible physical replacement remains a data requirement rather than a completed result.
6.3. Anticipatory Circularity and Secondary-Material Pathways
Secondary materials can reconnect end-of-life management with upstream production only when collection, safe transport, preprocessing, refining, quality assurance and reintegration are specified [16,17,18]. Battery lifecycle planning must also distinguish life extension, reuse and remanufacturing from material recycling. The present DCG components do not compare these pathways, quantify their benefits or establish a circular-performance ranking.
Recovery pairing and tonnes-to-energy conversion are excluded because the data do not support their physical interpretation. Battery-category-specific flows, chemistry, recovery yields and battery-grade outputs are needed before a reverse-system condition can enter a physical model. Battery passports and interoperable lifecycle information may help supply this foundation [35,36,37]. Anticipatory circularity remains the motivation for further analysis, but the present model excludes unsupported recovery scores.
6.4. Decision Relevance and Staged Evidence Requirements
Table 4 links the constructed-score diagnostics to the minimum evidence required for subsequent analysis. The proposed sequence is DCG specification, inspection of coverage and sensitivity, source verification, and then system-specific MFA or CLSC modeling. The first stages reveal which input definitions require attention; they do not replace the later physical model. For manufacturing, the required evidence includes dated operating status, realized output, chemistry and qualified cross-border supply. For minerals it includes compatible material stages, refining transformations, stocks and supplier/destination flows. For charging, it includes annual stock, uptime, utilization and spatial access.
Table 4.
From constructed-score diagnostics to minimum evidence for subsequent physical or operational analysis. A diagnostic initiates verification; it does not authorize capacity expansion or establish decision effectiveness.
Only after those inputs are established can operational models evaluate facilities, transport, costs, emissions, demand/return uncertainty and service requirements [27,28,29,30]. This conceptual sequence does not provide evidence of actual decision effectiveness. Negative and positive DCG values alike require this distinction between a constructed contrast and an operational conclusion.
6.5. Limitations and Research Priorities
Construct validity is the main limitation, alongside missing observations. The mineral-source lineage is unrecovered, listed facilities are not a national sampling frame, site-entry timestamps are not annual infrastructure stocks, and B is sales-derived. Four-mineral internal weights and year-specific median completion remain distinct limitations from condition-dimension weights and fixed normalization. The pooled-completion comparison changes both point membership and the historical pattern; it is not a preferred physical correction. Fixed scaling makes the numerical reference explicit but does not repair these measurement limits. The distribution, quantile-anchor and LOCO results show how extreme reference observations limit effective discrimination. Conditional stability under selected interior weights does not remove the wider grid sensitivity. Equal condition weights and zero are uncalibrated. Conditional bounds omit joint demand error, observed-field errors and unknown covariance; source revisions and a site range do not replace them.
The historical analysis covers the balanced 2017–2024 subset rather than the full 2010–2024 source window. The added ten markets do not validate full-model expansion. The source comparisons use small, selected samples. They may share upstream data and differ in scope. Searches of the documented official sources did not yield the scope-matched physical records needed to remove these limitations; this does not establish that such records cannot exist elsewhere. A future physical classifier or operational triage tool requires compatible measurements and external validation before stronger claims can be made.
7. Conclusions
This study evaluates the fixed-reference behavior and applicability of the DCG framework for the study-country panel. Eight country-mean point estimates exceed zero, but five have none of the three condition-record indicators. The adjacent-growth audit preserves the baseline, while quantile anchors, country deletion and the wider weight grid expose substantial dependence on construction choices. Uniform energy conversion cancels under consistent linear normalization; heterogeneity remains a measurement question. Coverage and conditional supports must therefore be reported with each result. Stable signs under the specified joint-input or JRC scenario do not establish national physical validity.
The study provides an explicit, uncertainty-aware assessment of the demand–condition screen and its applicability limits. It links source verification to material-flow accounting and closed-loop supply chain analysis. National-risk classification, a recovery composite and predictive-model validation fall outside the supported conclusions. A reliable physical shortage or supply-security interpretation remains unsupported by the available data.
Supplementary Materials
The following supporting information can be downloaded at https://www.mdpi.com/article/10.3390/su182111081/s1. Supplementary Tables S1–S46 provide source records, full model definitions, detailed scenarios and external comparisons.
Author Contributions
Conceptualization, Y.G. and H.W.; methodology, Y.G., H.W., H.A. and Y.B.; software, H.W.; validation, H.A., Y.B. and W.L.; formal analysis, Y.G., H.A. and Y.B.; investigation, H.W.; resources, H.A.; data curation, H.W.; writing (original draft preparation), Y.G., H.W. and W.L.; writing (review and editing), Y.G., H.A. and Y.B.; visualization, H.W. and W.L.; supervision, Y.G.; project administration, Y.G.; funding acquisition, Y.G. and H.A. All authors have read and agreed to the published version of the manuscript.
Funding
This research was funded by the RITMEA (Research and Innovation on Ecological Responsibility and Autonomous Transport and Mobility) project, co-financed by the European Union through the European Regional Development Fund, the French State, and the Hauts-de-France Regional Council; the National Natural Science Foundation of China (Grant No. 12271484); the Natural Science Foundation of Zhejiang Province (Grant No. LMS25G010003); and the Scientific Research Project of the Zhejiang Provincial Department of Education (Grant No. Y202454572).
Institutional Review Board Statement
Not applicable.
Informed Consent Statement
Not applicable.
Data Availability Statement
The processed analytical datasets and computational scripts supporting the findings of this study are available from the corresponding author upon reasonable request. Access to and redistribution of third-party source data are subject to the terms and conditions of the respective data providers.
Acknowledgments
World Mineral Statistics contributed by permission of the British Geological Survey. The authors gratefully acknowledge the financial support provided through the RITMEA project and by the National Natural Science Foundation of China, the Natural Science Foundation of Zhejiang Province, and the Zhejiang Provincial Department of Education.
Conflicts of Interest
The authors declare no conflicts of interest.
Abbreviations
| BGS | British Geological Survey |
| CLSC | Closed-loop supply chain |
| DCG | Demand–condition gap |
| EAFO | European Alternative Fuels Observatory |
| EV | Electric vehicle |
| GBA | Global Battery Alliance |
| HS | Harmonized System |
| IEA | International Energy Agency |
| JRC | Joint Research Centre |
| LOCO | Leave-one-country-out |
| MFA | Material-flow analysis |
| P95/P99 | 95th/99th percentile |
| R&D | Research and development |
| RQ | Research question |
| SD | Standard deviation |
| USGS | U.S. Geological Survey |
References
- Rajaeifar, M.A.; Ghadimi, P.; Raugei, M.; Wu, Y.; Heidrich, O. Challenges and recent developments in supply and value chains of electric vehicle batteries: A sustainability perspective. Resour. Conserv. Recycl. 2022, 180, 106144. [Google Scholar] [CrossRef] [Scilit]
- Kumar, P.; Singh, R.K.; Paul, J.; Sinha, O. Analyzing challenges for sustainable supply chain of electric vehicle batteries using a hybrid approach of Delphi and Best-Worst Method. Resour. Conserv. Recycl. 2021, 175, 105879. [Google Scholar] [CrossRef] [Scilit]
- Geissdoerfer, M.; Savaget, P.; Bocken, N.M.P.; Hultink, E.J. The circular economy: A new sustainability paradigm? J. Clean. Prod. 2017, 143, 757–768. [Google Scholar] [CrossRef] [Scilit]
- Kirchherr, J.; Reike, D.; Hekkert, M. Conceptualizing the circular economy: An analysis of 114 definitions. Resour. Conserv. Recycl. 2017, 127, 221–232. [Google Scholar] [CrossRef] [Scilit]
- Richa, K.; Babbitt, C.W.; Gaustad, G.; Wang, X. A future perspective on lithium-ion battery waste flows from electric vehicles. Resour. Conserv. Recycl. 2014, 83, 63–76. [Google Scholar] [CrossRef] [Scilit]
- Ai, N.; Zheng, J.; Chen, W.Q. U.S. end-of-life electric vehicle batteries: Dynamic inventory modeling and spatial analysis for regional solutions. Resour. Conserv. Recycl. 2019, 145, 208–219. [Google Scholar] [CrossRef] [Scilit]
- Xu, C.; Dai, Q.; Gaines, L.; Hu, M.; Tukker, A.; Steubing, B. Future material demand for automotive lithium-based batteries. Commun. Mater. 2020, 1, 99. [Google Scholar] [CrossRef] [Scilit]
- Isilti, A.; Marsden, G.; Tate, J.E. Battery recycling and critical material demand in electric vehicle scenarios to 2050. J. Clean. Prod. 2026, 552, 147983. [Google Scholar] [CrossRef] [Scilit]
- Habib, K.; Hansdóttir, S.T.; Habib, H. Critical metals for electromobility: Global demand scenarios for passenger vehicles, 2015–2050. Resour. Conserv. Recycl. 2020, 154, 104603, Corrigendum in Resour. Conserv. Recycl. 2020, 160, 104932. https://doi.org/10.1016/j.resconrec.2020.104932. [Google Scholar] [CrossRef] [Scilit]
- Olivetti, E.A.; Ceder, G.; Gaustad, G.G.; Fu, X. Lithium-ion battery supply chain considerations: Analysis of potential bottlenecks in critical metals. Joule 2017, 1, 229–243. [Google Scholar] [CrossRef] [Scilit]
- Helbig, C.; Bradshaw, A.M.; Wietschel, L.; Thorenz, A.; Tuma, A. Supply risks associated with lithium-ion battery materials. J. Clean. Prod. 2018, 172, 274–286, Corrigendum in J. Clean. Prod. 2019, 221, 899–903. https://doi.org/10.1016/j.jclepro.2019.03.062. [Google Scholar] [CrossRef] [Scilit]
- Sovacool, B.K.; Ali, S.H.; Bazilian, M.; Radley, B.; Nemery, B.; Okatz, J.; Mulvaney, D. Sustainable minerals and metals for a low-carbon future. Science 2020, 367, 30–33. [Google Scholar] [CrossRef] [Scilit] [PubMed]
- International Energy Agency. The Role of Critical Minerals in Clean Energy Transitions; International Energy Agency: Paris, France, 2021. [Google Scholar]
- International Energy Agency. Global Critical Minerals Outlook 2024; International Energy Agency: Paris, France, 2024. [Google Scholar]
- Dunn, J.B.; Gaines, L.; Sullivan, J.; Wang, M.Q. Impact of recycling on cradle-to-gate energy consumption and greenhouse gas emissions of automotive lithium-ion batteries. Environ. Sci. Technol. 2012, 46, 12704–12710. [Google Scholar] [CrossRef] [Scilit] [PubMed]
- Gaines, L. The future of automotive lithium-ion battery recycling: Charting a sustainable course. Sustain. Mater. Technol. 2014, 1–2, 2–7. [Google Scholar] [CrossRef] [Scilit]
- Harper, G.; Sommerville, R.; Kendrick, E.; Driscoll, L.; Slater, P.; Stolkin, R.; Walton, A.; Christensen, P.; Heidrich, O.; Lambert, S.; et al. Recycling lithium-ion batteries from electric vehicles. Nature 2019, 575, 75–86, Correction in Nature 2020, 578, E20. https://doi.org/10.1038/s41586-019-1862-3. [Google Scholar] [CrossRef] [Scilit] [PubMed]
- Thompson, D.L.; Hartley, J.M.; Lambert, S.M.; Shiref, M.; Harper, G.D.J.; Kendrick, E.; Anderson, P.; Ryder, K.S.; Gaines, L.; Abbott, A.P. The importance of design in lithium ion battery recycling: A critical review. Green Chem. 2020, 22, 7585–7603. [Google Scholar] [CrossRef] [Scilit]
- Lander, L.; Cleaver, T.; Rajaeifar, M.A.; Nguyen-Tien, V.; Elliott, R.J.R.; Heidrich, O.; Kendrick, E.; Edge, J.S.; Offer, G. Financial viability of electric vehicle lithium-ion battery recycling. iScience 2021, 24, 102787. [Google Scholar] [CrossRef] [Scilit] [PubMed]
- Ahmadi, L.; Yip, A.; Fowler, M.; Young, S.B.; Fraser, R.A. Environmental feasibility of re-use of electric vehicle batteries. Sustain. Energy Technol. Assess. 2014, 6, 64–74. [Google Scholar] [CrossRef] [Scilit]
- Bobba, S.; Mathieux, F.; Ardente, F.; Blengini, G.A.; Cusenza, M.A.; Podias, A.; Pfrang, A. Life Cycle Assessment of repurposed electric vehicle batteries: An adapted method based on modelling energy flows. J. Energy Storage 2018, 19, 213–225. [Google Scholar] [CrossRef] [Scilit]
- Hua, Y.; Liu, X.; Zhou, S.; Huang, Y.; Ling, H.; Yang, S. Toward sustainable reuse of retired lithium-ion batteries from electric vehicles. Resour. Conserv. Recycl. 2021, 168, 105249. [Google Scholar] [CrossRef] [Scilit]
- Zeng, X.; Li, J.; Singh, N. Recycling of spent lithium-ion battery: A critical review. Crit. Rev. Environ. Sci. Technol. 2014, 44, 1129–1165. [Google Scholar] [CrossRef] [Scilit]
- Velazquez-Martinez, O.; Valio, J.; Santasalo-Aarnio, A.; Reuter, M.; Serna-Guerrero, R. A critical review of lithium-ion battery recycling processes from a circular economy perspective. Batteries 2019, 5, 68. [Google Scholar] [CrossRef] [Scilit]
- Mossali, E.; Picone, N.; Gentilini, L.; Rodriguez, O.; Perez, J.M.; Colledani, M. Lithium-ion batteries towards circular economy: A literature review of opportunities and issues of recycling treatments. J. Environ. Manag. 2020, 264, 110500. [Google Scholar] [CrossRef] [Scilit] [PubMed]
- Choi, H.J.; Kim, M.; Roh, H.J.; Hwang, D.; Yoon, Y.S.; Kang, Y.Y.; Jeon, T.W. A Material Flow Analysis of Electric Vehicle Lithium-ion Batteries: Sustainable Supply Chain Management Strategies. Sustainability 2025, 17, 4560. [Google Scholar] [CrossRef] [Scilit]
- Guide, V.D.R.; Van Wassenhove, L.N. The evolution of closed-loop supply chain research. Oper. Res. 2009, 57, 10–18. [Google Scholar] [CrossRef] [Scilit]
- Govindan, K.; Soleimani, H.; Kannan, D. Reverse logistics and closed-loop supply chain: A comprehensive review to explore the future. Eur. J. Oper. Res. 2015, 240, 603–626. [Google Scholar] [CrossRef] [Scilit]
- Çakır, M.S.; Serdarasan, S. A multi-objective approach for designing a circular supply chain for electric vehicle batteries. J. Clean. Prod. 2025, 504, 145438. [Google Scholar] [CrossRef] [Scilit]
- Alsanie, G.; Unnisa, S.T.; Al Hamad, N.H. Transforming the Supply Chain Operations of Electric Vehicles’ Batteries Using an Optimization Approach. Sustainability 2026, 18, 367. [Google Scholar] [CrossRef] [Scilit]
- Carter, C.R.; Rogers, D.S. A framework of sustainable supply chain management: Moving toward new theory. Int. J. Phys. Distrib. Logist. Manag. 2008, 38, 360–387. [Google Scholar] [CrossRef] [Scilit]
- Christopher, M.; Peck, H. Building the resilient supply chain. Int. J. Logist. Manag. 2004, 15, 1–14. [Google Scholar] [CrossRef] [Scilit]
- Ivanov, D.; Dolgui, A. Viability of intertwined supply networks: Extending the supply chain resilience angles towards survivability. A position paper motivated by COVID-19 outbreak. Int. J. Prod. Res. 2020, 58, 2904–2915. [Google Scholar] [CrossRef] [Scilit]
- Lou, G.; Wang, H.; Tu, X.; Lai, Z.; Ma, H.; Ying, S. Resilience assessment of the electric vehicle lithium-ion battery supply chain under supply shortages of upstream mineral enterprises. Resour. Conserv. Recycl. 2025, 215, 108161. [Google Scholar] [CrossRef] [Scilit]
- Ribeiro da Silva, E.; Lohmer, J.; Rohla, M.; Angelis, J. Unleashing the circular economy in the electric vehicle battery supply chain: A case study on data sharing and blockchain potential. Resour. Conserv. Recycl. 2023, 193, 106969. [Google Scholar] [CrossRef] [Scilit]
- Global Battery Alliance. GBA Battery Passport Proof of Concept Pilots: Setup. Learning. Next Steps; Technical Report; Global Battery Alliance: Brussels, Belgium, 2023; Available online: https://www.globalbattery.org/media/pilot/documents/gba-bp-pilot-master.pdf (accessed on 26 October 2026).
- European Parliament and the Council of the European Union. Regulation (EU) 2023/1542 of the European Parliament and of the Council of 12 July 2023 Concerning Batteries and Waste Batteries, Amending Directive 2008/98/EC and Regulation (EU) 2019/1020 and Repealing Directive 2006/66/EC (Text with EEA Relevance). Official Journal of the European Union, L 191, 28 July 2023; pp. 1–117. Available online: https://eur-lex.europa.eu/eli/reg/2023/1542/oj/eng (accessed on 26 October 2026).
- International Energy Agency. Global EV Outlook 2026: Electric Vehicle Batteries. Available online: https://www.iea.org/reports/global-ev-outlook-2026/electric-vehicle-batteries (accessed on 15 October 2026).
- British Geological Survey. World Mineral Statistics: Data Download. Available online: https://www.bgs.ac.uk/mineralsuk/statistics/world-mineral-statistics/world-mineral-statistics-data-download/ (accessed on 14 October 2026).
- United Nations Statistics Division. UN Comtrade API Documentation. Available online: https://uncomtrade.org/docs/un-comtrade-api/ (accessed on 14 October 2026).
- U.S. Geological Survey. Mineral Commodity Summaries 2025. Version 1.2. March 2025. Available online: https://pubs.usgs.gov/periodicals/mcs2025/mcs2025.pdf (accessed on 15 October 2026).
- U.S. Geological Survey. Mineral Commodity Summaries 2026. Version 1.3. May 2026. Available online: https://pubs.usgs.gov/periodicals/mcs2026/mcs2026.pdf (accessed on 15 October 2026).

Disclaimer/Publisher’s Note: The statements, opinions and data contained in all publications are solely those of the individual author(s) and contributor(s) and not of MDPI and/or the editor(s). MDPI and/or the editor(s) disclaim responsibility for any injury to people or property resulting from any ideas, methods, instructions or products referred to in the content. |
© 2026 by the authors. Licensee MDPI, Basel, Switzerland. This article is an open access article distributed under the terms and conditions of the Creative Commons Attribution (CC BY) license.