


Abstract
Mix design of engineered cementitious composites (ECC) and ultra-high-performance concrete (UHPC) requires accounting for nonlinear relationships between constituent proportions and mechanical properties. This study develops a literature-based framework combining strength prediction, model interpretation, and constrained mix design optimization. A database of 553 records, comprising 247 ECC and 306 UHPC records, was assembled with 14 input features and three strength responses. Interquartile-range screening retained 222 ECC and 292 UHPC records. Categorical features were one-hot encoded, and seven regression algorithms were evaluated using 50 repeated Monte Carlo cross-validation splits. XGBoost achieved reported mean R2 values of 0.971 and 0.900 for compressive and tensile strength, respectively, with corresponding mean absolute percentage errors of 7.560% and 9.424%. CatBoost achieved a mean R2 of 0.951 and a mean absolute percentage error of 15.636% for flexural strength. SHapley Additive exPlanations identified material-dependent associations between mix parameters and predicted strength, particularly for silica fume, cement, and fiber characteristics. The selected predictors were incorporated into a graphical interface and coupled with the nondominated sorting genetic algorithm II to search for mixtures satisfying strength targets and database-derived constraints. In addition to predictive accuracy, the framework contributes to sustainable construction: it predicts the strength of candidate mixtures and optimizes their proportions against strength targets, so that the combinations most worth casting are identified first; this can reduce the number of trial batches required and thereby lower raw-material consumption and cement demand. The better-performing, more durable mixtures it identifies also help to extend service life and reduce the embodied carbon of ECC and UHPC production. The framework supports preliminary screening within the investigated domain; independent experimental validation of the optimized mixtures remains necessary.
1. Introduction
1.1. Background
Engineered cementitious composites (ECC) and ultra-high-performance concrete (UHPC) offer opportunities to improve the mechanical performance and service life of infrastructure [1]. Their development requires balancing matrix composition and fiber reinforcement. However, mixture selection commonly relies on previous formulations followed by repeated experimental trials. This process can be time-consuming when several strength requirements must be met simultaneously.
For UHPC, mix design requires the coordinated selection of cementitious constituents, fine aggregates, silica fume, water, superplasticizer, and fibers [2]. Huang et al. [3] investigated superplasticizer and steel-fiber effects on UHPC rheology and mechanical properties, reporting a dosage-dependent response.
ECC is commonly designed to achieve tensile strain hardening through micromechanics-based control of the fiber–matrix system [4]. Gao et al. [5] examined age and constituent effects on ECC cube compressive strength; decreasing the water-to-cement ratio increased strength, whereas the water-to-binder ratio had no clear effect on 28 d strength within their investigated conditions. Such findings illustrate the limitations of a universal linear description of composition–property relationships.
Orthogonal experimental designs can identify favorable combinations within prescribed factor levels, but their conclusions depend on the selected levels and experimental domain. Continuous optimization across several targets requires a representation of composition–property relationships and explicit limits on the admissible search space.
Machine learning can capture nonlinear composition-property relationships from published observations. For UHPC, Kewalramani et al. [6] compared nine algorithms for predicting residual flexural strength after elevated-temperature exposure. Broader reviews identify neural networks, support-vector methods, and tree ensembles as recurring tools in concrete-property prediction while emphasizing data quality, validation design, and model interpretability [7,8]. Subsequent UHPC studies have used feature-selection-assisted neural networks [9], hybrid ensembles with SHAP and partial-dependence analyses [10], multi-fiber datasets for joint compressive- and flexural-strength prediction [11], explicit semi-empirical equations [12], and adaptive feature selection with SHAP [13]. Explainable machine learning has also been applied to the axial-strength assessment of FRP tube-confined UHPC members [14], indicating that the same methodological family can address both material and component responses. Recent comparative studies likewise report that ensemble learning methods give the most accurate predictions of concrete strength [15,16].
For ECC, Chen et al. [17] predicted compressive strength, tensile strength, and tensile strain capacity, while Lu and Liu [18] used 149 literature records to predict tensile strength with three models and sparrow-search hyperparameter optimization. CatBoost performed best in their comparison, and SHAP identified the water-to-binder ratio and fiber dosage as influential variables. These findings reinforce that model selection and interpretation must be tied to the response variable, material system, and data domain.
Predictors have also been deployed through graphical user interfaces (GUIs). Abdulrahman et al. [19] combined ensemble learning and optimization to predict the compressive strength of fly ash and slag concrete. Ly [20] coupled optimized boosting models with SHAP and a GUI for concrete compressive strength at elevated temperatures. Such tools improve accessibility, although prediction accuracy alone does not establish the feasibility of a mixture obtained through inverse design.
These applications show that data-driven methods are well established in concrete engineering and motivate their assessment in ECC and UHPC mix-design workflows.
1.2. Study Scope and Objectives
This study combines three strength responses in one workflow for ECC and UHPC. Seven regression models are compared using repeated random train–test splits. Distance correlation examines feature–response dependence, and SHAP interprets the selected predictors. The models are then integrated with a GUI and constrained multiobjective optimization. The intended application is preliminary strength assessment and candidate mixture selection within the literature database, followed by laboratory verification. Relative to existing studies, which typically address a single material or a single response, the contribution of this work is the integration of three strength responses for two material systems within one workflow, combining distance-correlation screening, SHAP interpretation, and database-constrained NSGA-II optimization, together with an explicit statement of the domain in which the predictions hold.
2. Construction of the ECC and UHPC Performance Dataset
2.1. Dataset Overview
The database contains 553 literature records, comprising 247 ECC and 306 UHPC records. Fourteen input features were considered: cement content, gravel content, fly ash content, quartz sand content, silica fume content, water content, superplasticizer content, fiber dosage, fiber length, age, fiber type, compression test method, tension test method, and flexural test method. The responses are compressive, tensile, and flexural strength. Fiber dosage is a volume percentage; the other constituent contents are expressed as mass per unit volume. Table 1 and Table 2 summarize the unfiltered data.
Table 1.
Descriptive statistics of the original ECC dataset.
Table 2.
Descriptive statistics of the original UHPC dataset.
The reported numbers of available strength measurements are 163, 126, and 138 for ECC compressive, tensile, and flexural strength, respectively, and 298, 121, and 169 for the corresponding UHPC responses. These are property-specific counts, because a record may contain multiple responses.
The source studies used different specimen dimensions, standards, and curing conditions. Restriction to identical conditions would substantially reduce the database. Specimens close to commonly used dimensions were therefore prioritized, and test method was included as a categorical predictor. This represents test categories but does not eliminate all heterogeneity from geometry or curing. In the compiled studies, specimen dimensions follow the test configuration rather than being varied systematically for a given mix, so the test-method category carries the geometry information, and the dimensions used within each category are listed below. Once the database contains several specimen sizes for otherwise comparable mixes, size effects can be resolved as an explicit predictor, which is a natural extension of the present dataset.
Compression tests include axial and cube compression; tension tests include uniaxial and splitting tension; flexural tests include three-point and four-point bending. Cube compression generally used 100 mm cubes for both materials. Splitting tests typically used 150 mm cubes for ECC and 100 mm cubes for UHPC. Common flexural specimens were 160 mm × 40 mm × 40 mm prisms for ECC and 400 mm × 100 mm × 100 mm prisms for UHPC. Most compression results came from cube tests. All UHPC tensile results came from splitting tests, whereas ECC contained comparable numbers of uniaxial and splitting results. Four-point bending predominated in both datasets.
2.2. Data Preprocessing
Outliers were screened using the interquartile range (IQR). The first and third quartiles, Q1 and Q3, define the IQR; observations outside the limits in Equations (1) and (2) were flagged. Screening was applied to the three strength responses, and a flagged observation led to removal of the entire corresponding record. Here, O denotes the set of outliers, and x denotes an observation.
IQR = Q3 − Q1
O = {x|x > Q3 + 1.5IQR ∪ x < Q1 − 1.5IQR}
Among 247 ECC records, 13 compressive, 9 tensile, and 4 flexural observations were flagged. Accounting for overlap, 25 records were removed and 222 were retained. Among 306 UHPC records, no compressive or flexural observations were flagged, while 14 tensile observations were flagged. Removing these records retained 292 UHPC records. Thus, 39 records were removed in total. Table 3 and Table 4 give the post-screening statistics. Zero-fiber records were retained because their matrix compositions were treated as belonging to the ECC/UHPC formulation domain in the source compilation.
Table 3.
ECC strength statistics after outlier screening.
Table 4.
UHPC strength statistics after outlier screening.
The same categorical encoding was used for all algorithms. Fiber type and the three test-method categories were one-hot encoded. PVA and steel were represented as (1, 0) and (0, 1), respectively. Table 5 reports category counts and binary codes. This uniform representation provided consistent inputs for the model comparison.
Table 5.
Categorical features and one-hot codes.
Z-score standardization was applied before fitting multiple linear regression (MLR), k-nearest neighbors (KNN), and support vector regression (SVR), as expressed in Equation (3), where x is the original value, uthe mean, and σ the standard deviation. Decision tree, random forest, XGBoost, and CatBoost used unstandardized numerical features after other preprocessing. Standardization is particularly relevant to distance- and kernel-based models.
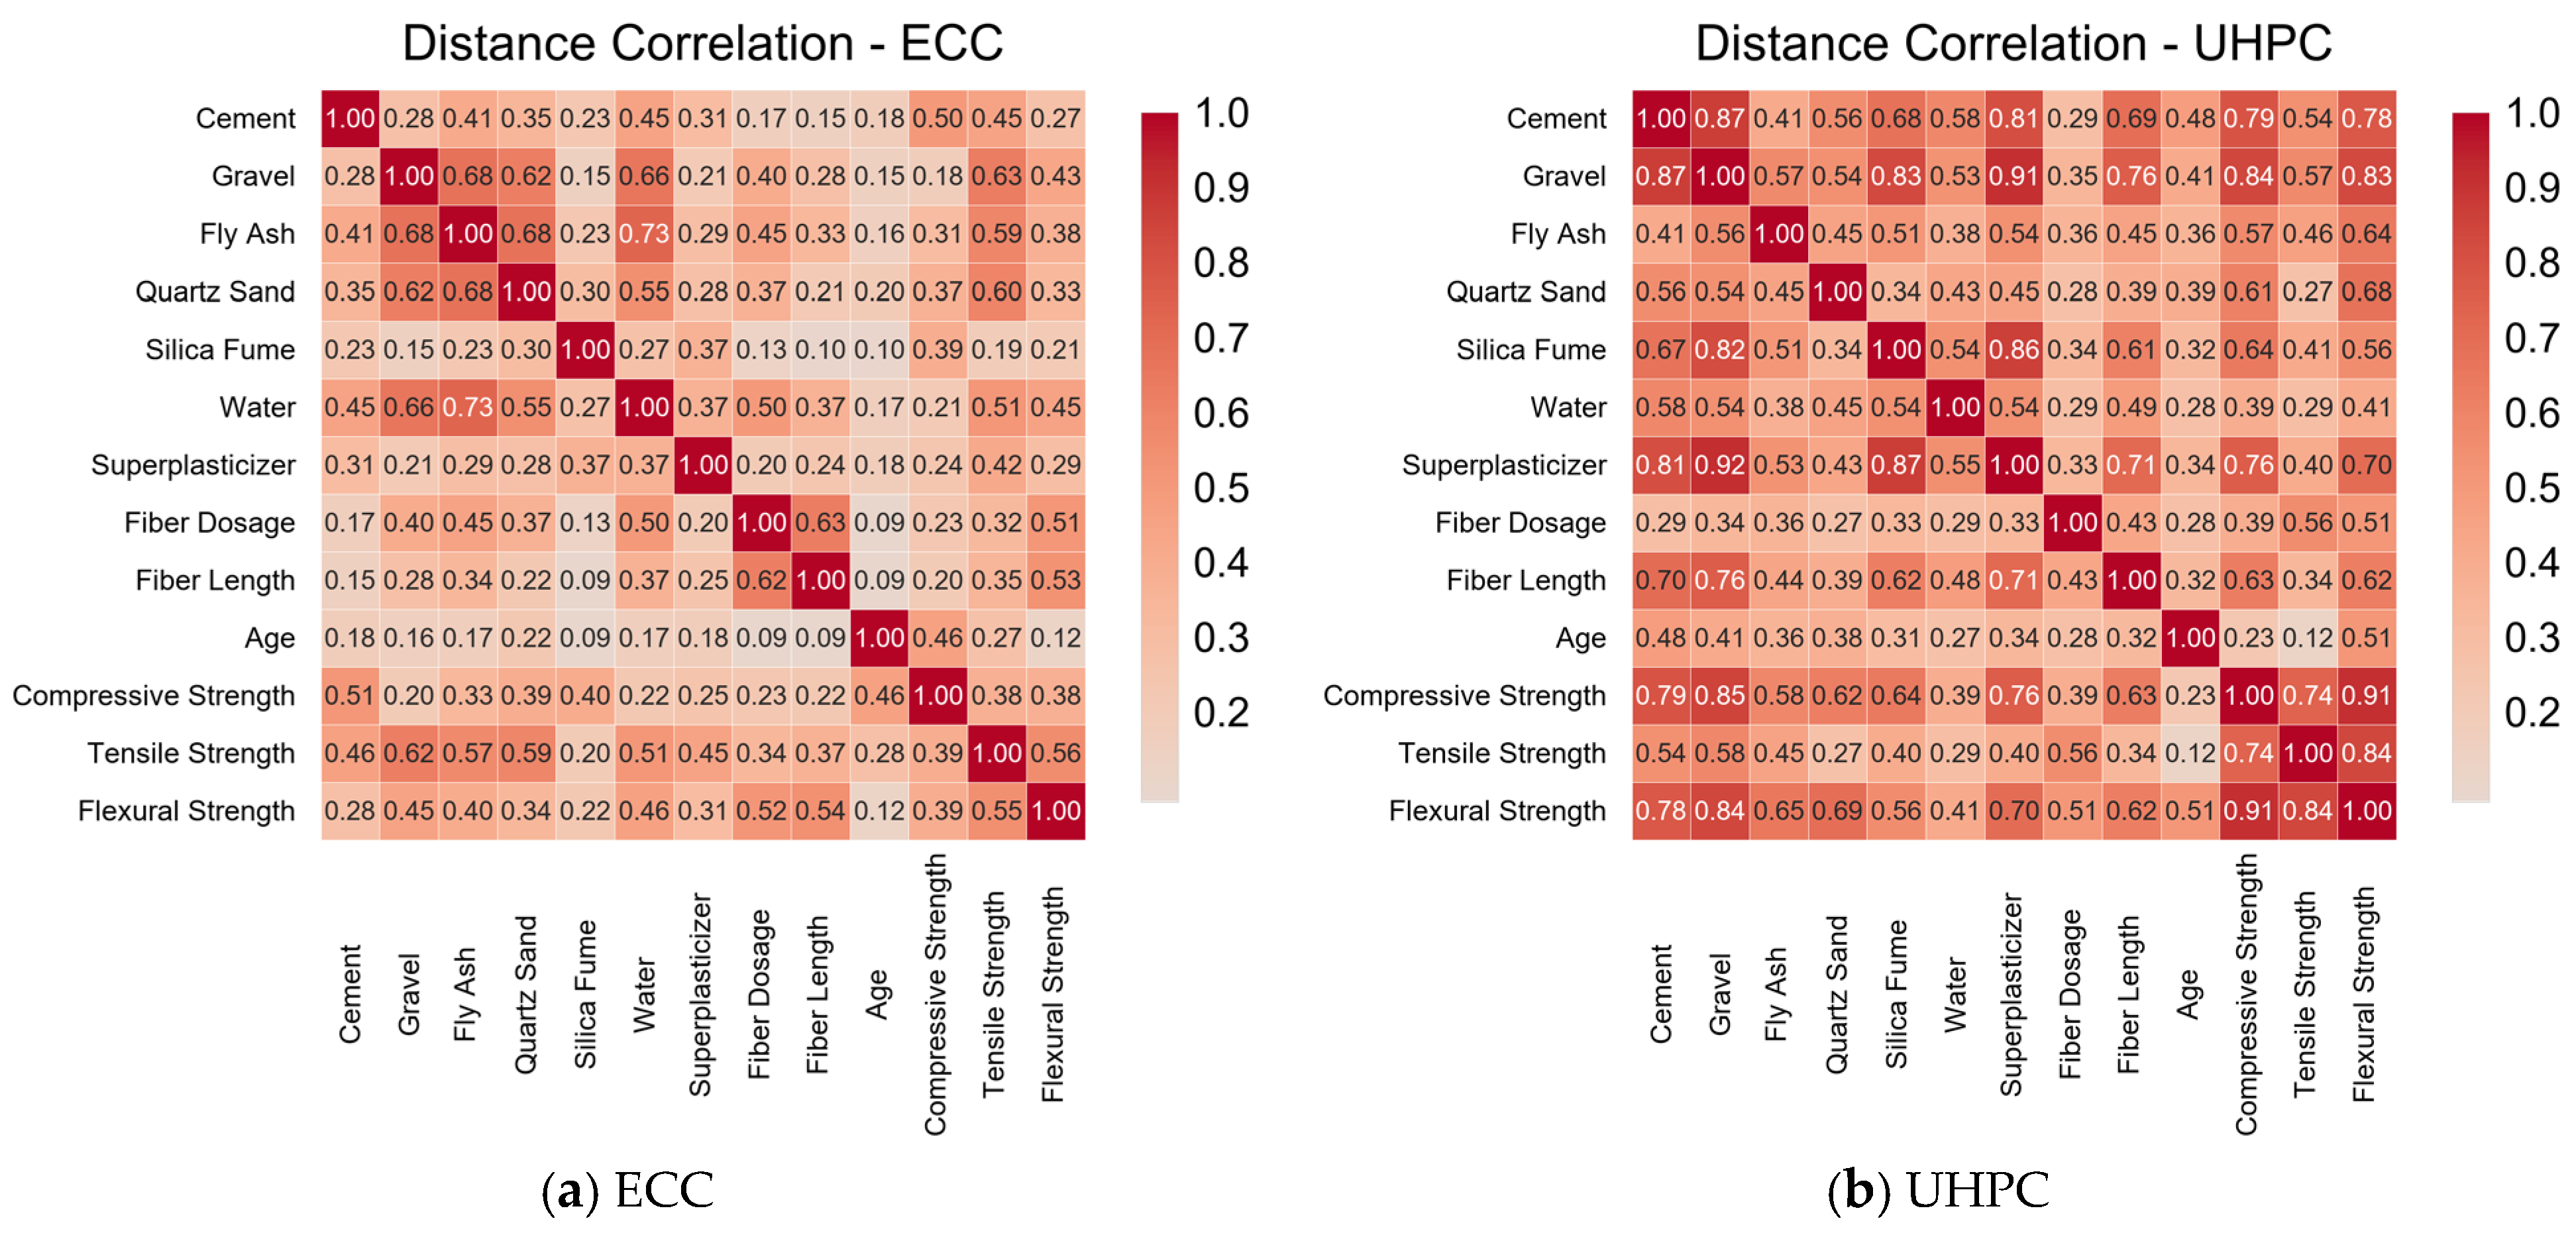
Distance correlation characterizes dependence between continuous features and responses [21]. Its calculation involves pairwise distances, double centering, distance covariance, and normalization, as expressed in Equations (4)–(7). Variables x and y denote the quantities considered; i, j, and l index observations; a and b denote pairwise distances; n is the number of valid paired observations.
The centering terms are defined as follows:
dcorr2(u,v) = S1 + S2 − 2S3S1S2S3
ECC and UHPC were analyzed separately. Pairwise deletion was used for this analysis: observations missing either variable were excluded only from the corresponding variable-pair calculation. Consequently, different pairs could involve different numbers of observations.
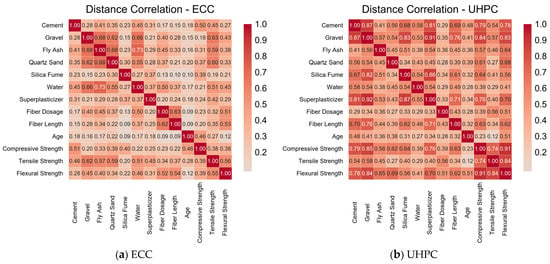
Figure 1 presents the distance-correlation heatmaps. Reported distance-correlation values between UHPC mixture parameters and strengths range from 0.11 to 0.85. Overall dependence appeared stronger for UHPC than for ECC; none of the evaluated mixture variables had zero distance correlation with every response. Several features showed appreciable dependence on at least one response, supporting examination of the candidate feature set. This is not a formal demonstration of causal importance or statistical significance.
Figure 1.
Distance-correlation heatmaps for the two material datasets.
3. Machine-Learning Model Development and Comparison
3.1. Monte Carlo Cross-Validation
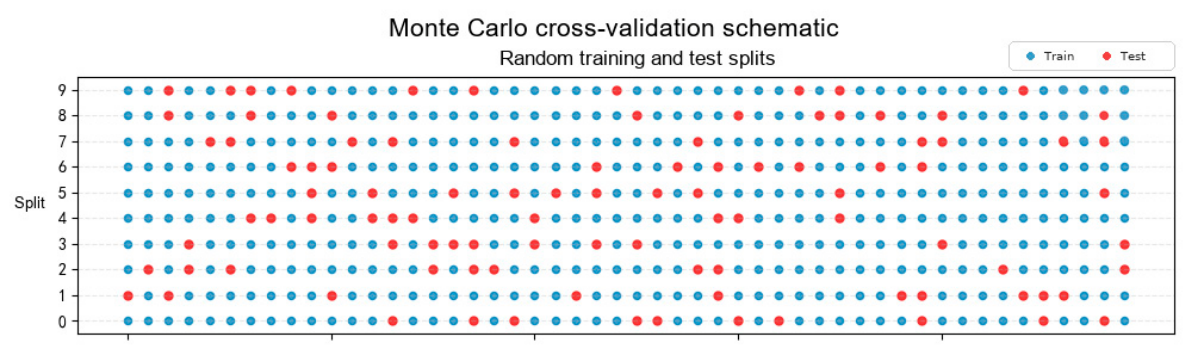
Performance was evaluated with 50 repeated Monte Carlo cross-validation (MCCV) splits. Python (version 3.9) ShuffleSplit shuffled observations without replacement within each repetition and divided them into training and test subsets. Repeated splitting reduces dependence on one partition, although observations can recur across repetitions and the resulting estimates are not statistically independent. Figure 2 illustrates the procedure; its lower-panel scores are schematic rather than the reported regression results.
Figure 2.
Schematic illustration of Monte Carlo cross-validation.
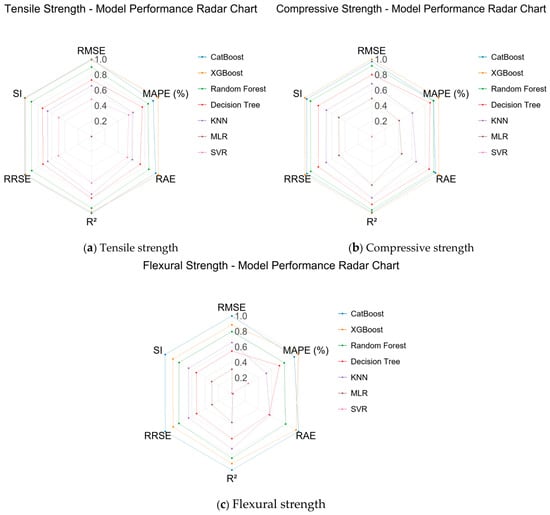
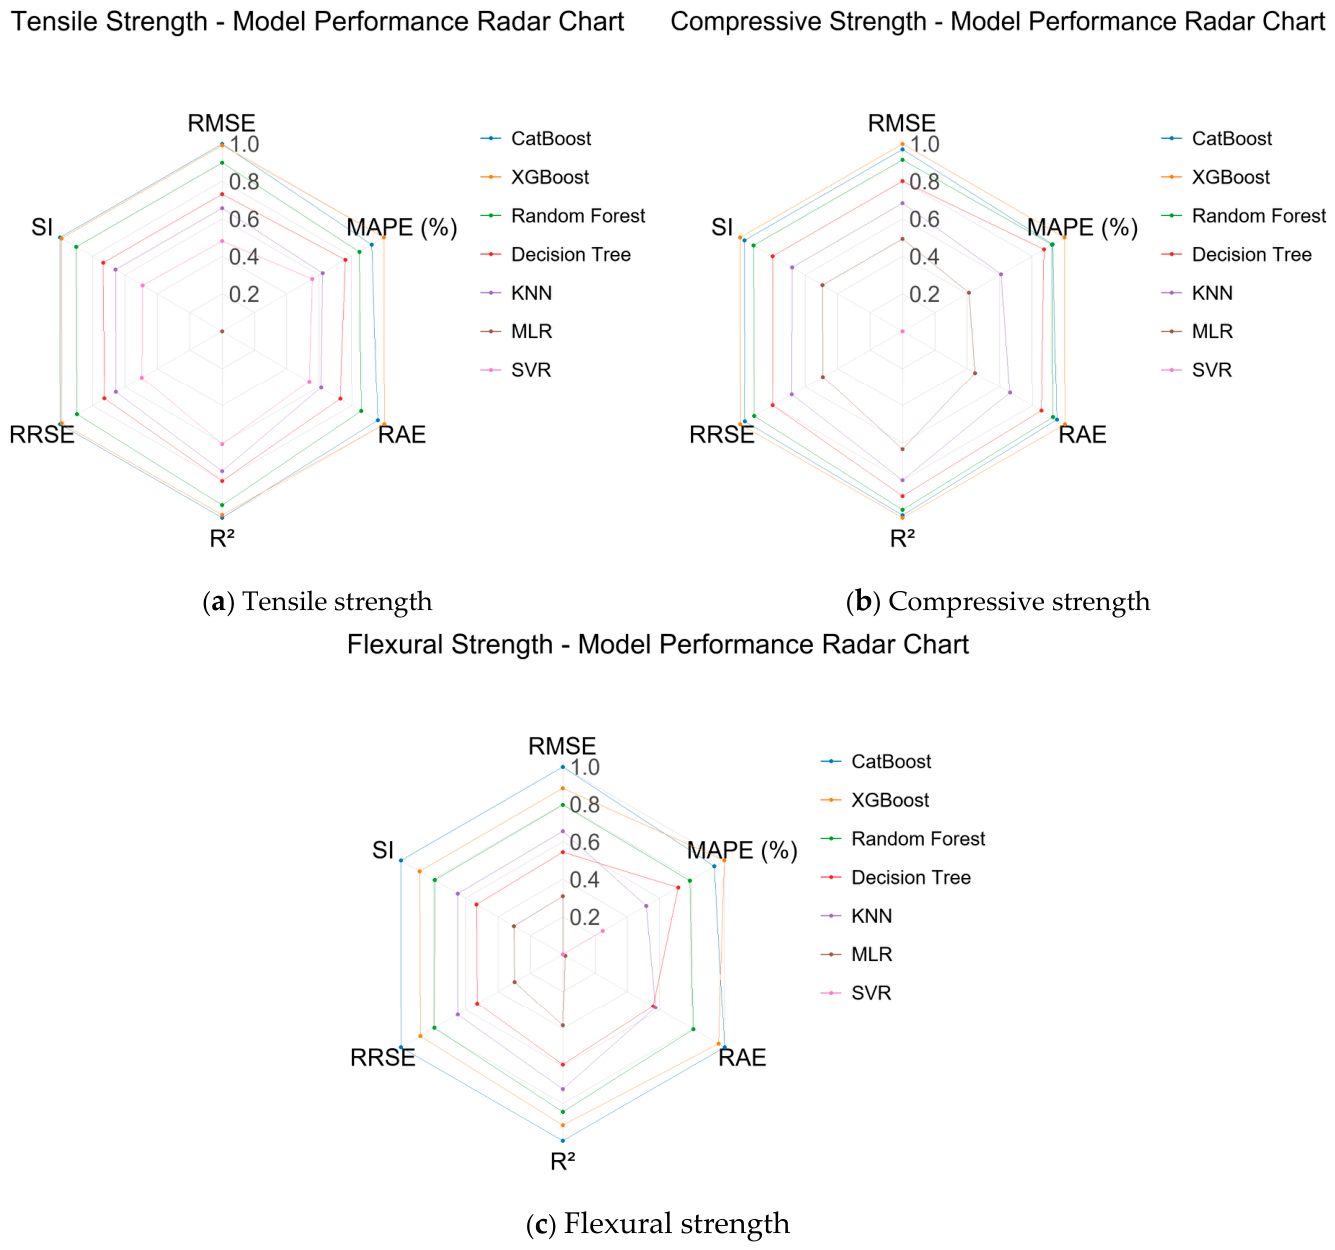
Six metrics were considered: coefficient of determination (R2), root mean square error (RMSE), mean absolute percentage error (MAPE), root relative squared error (RRSE), relative absolute error (RAE), and scatter index (SI). The mean across 50 repetitions was used for each reported metric. Figure 3 provides the radar-chart comparison. A separate fixed-seed analysis used random seed 0 for regression scatter plots and SHAP interpretation.
Figure 3.
Radar charts comparing the seven models. Metric labels and plotted values are retained from the source.
3.2. Prediction Model Development and Comparison
The algorithms were CatBoost, XGBoost, random forest, decision tree, KNN, MLR, and SVR. XGBoost [22] and CatBoost [23] provide nonlinear tree-boosting representations. Single-tree, bagging, local-neighbor, linear, and kernel-based models were included as alternatives. Hyperparameters were selected empirically from commonly adopted ranges and preliminary tuning. Tree depth, number of iterations or estimators, and learning rate received particular attention. KNN, MLR, and SVR used default settings or limited adjustments after standardization. Table 6 gives the reported settings.
Table 6.
Regression model settings.
Tree ensembles generally outperformed linear and distance-sensitive alternatives (Figure 3). Random forest achieved R2 values of 0.876–0.956 across responses, with compressive-strength RMSE = 7.748 MPa and MAPE = 9.422%. Decision tree regression gave compressive-strength R2 = 0.930 and RMSE = 9.674 MPa.
KNN performed comparatively well for flexural strength (R2 = 0.905), but its tensile-strength R2 was 0.790. MLR produced tensile-strength R2 = 0.436, MAPE = 28.270%, and RMSE = 1.495 MPa, consistent with limitations of a linear representation. SVR yielded R2 values below 0.784 for all responses and flexural-strength RMSE = 4.927 MPa.
XGBoost and CatBoost provided the strongest overall results. XGBoost was selected for compressive and tensile strength, with mean R2 values of 0.971 and 0.900 and MAPE values of 7.560% and 9.424%, respectively. CatBoost was selected for flexural strength, with a mean R2 of 0.951 and a mean MAPE of 15.636%. These rankings apply to this database and evaluation protocol. Because model performance depends on the response variable and on the underlying data structure, each response was modeled separately; the small but consistent differences between the two boosting implementations in handling categorical and continuous features explain why CatBoost was preferred for flexural strength and XGBoost for the other two.
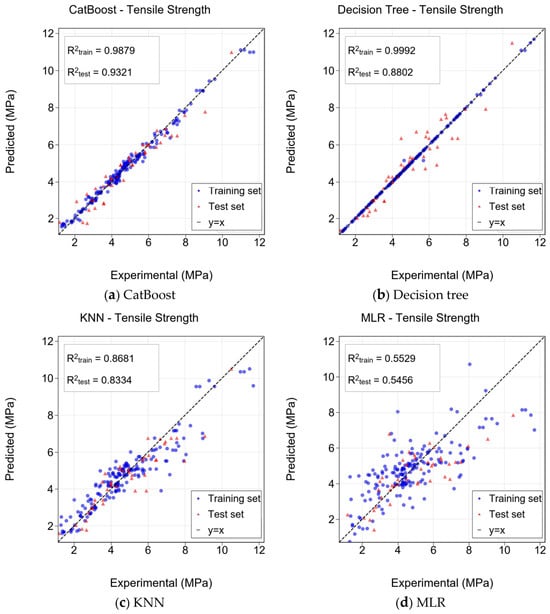
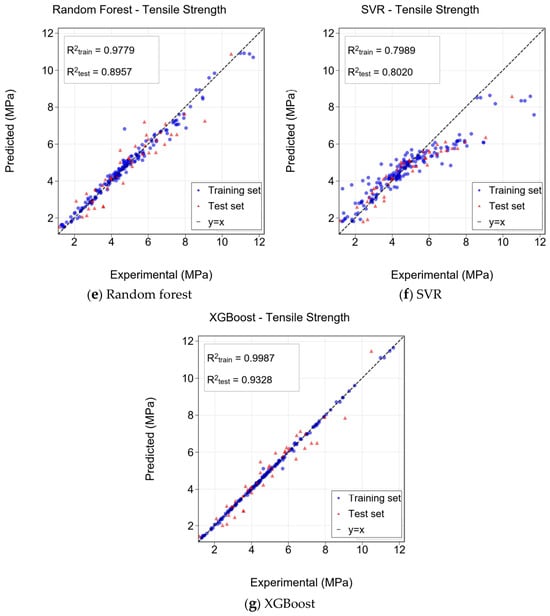
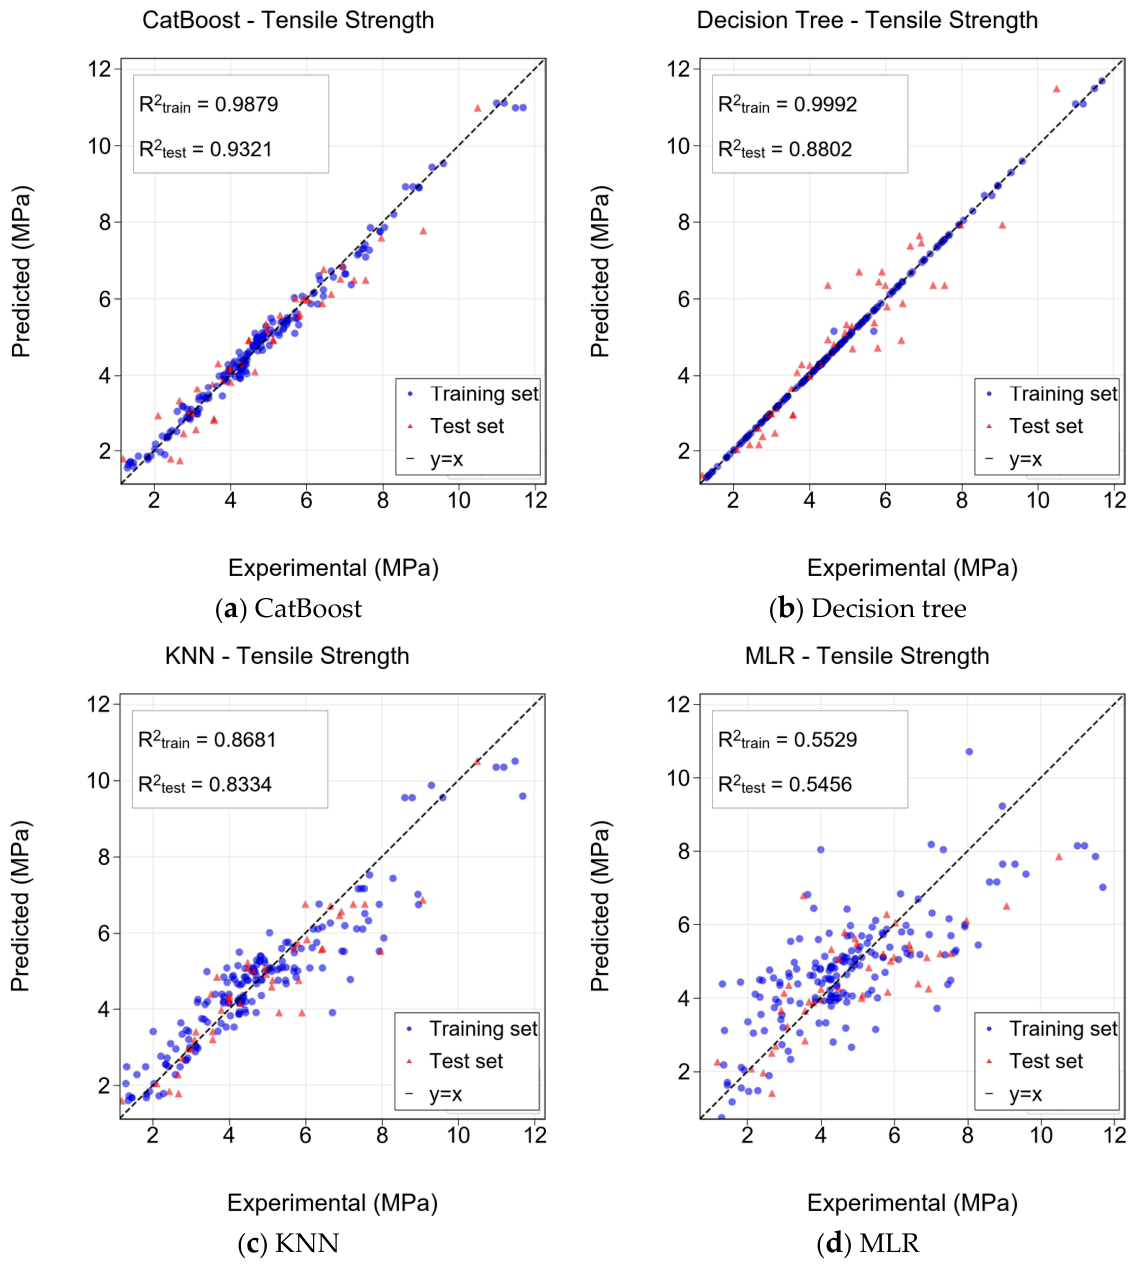
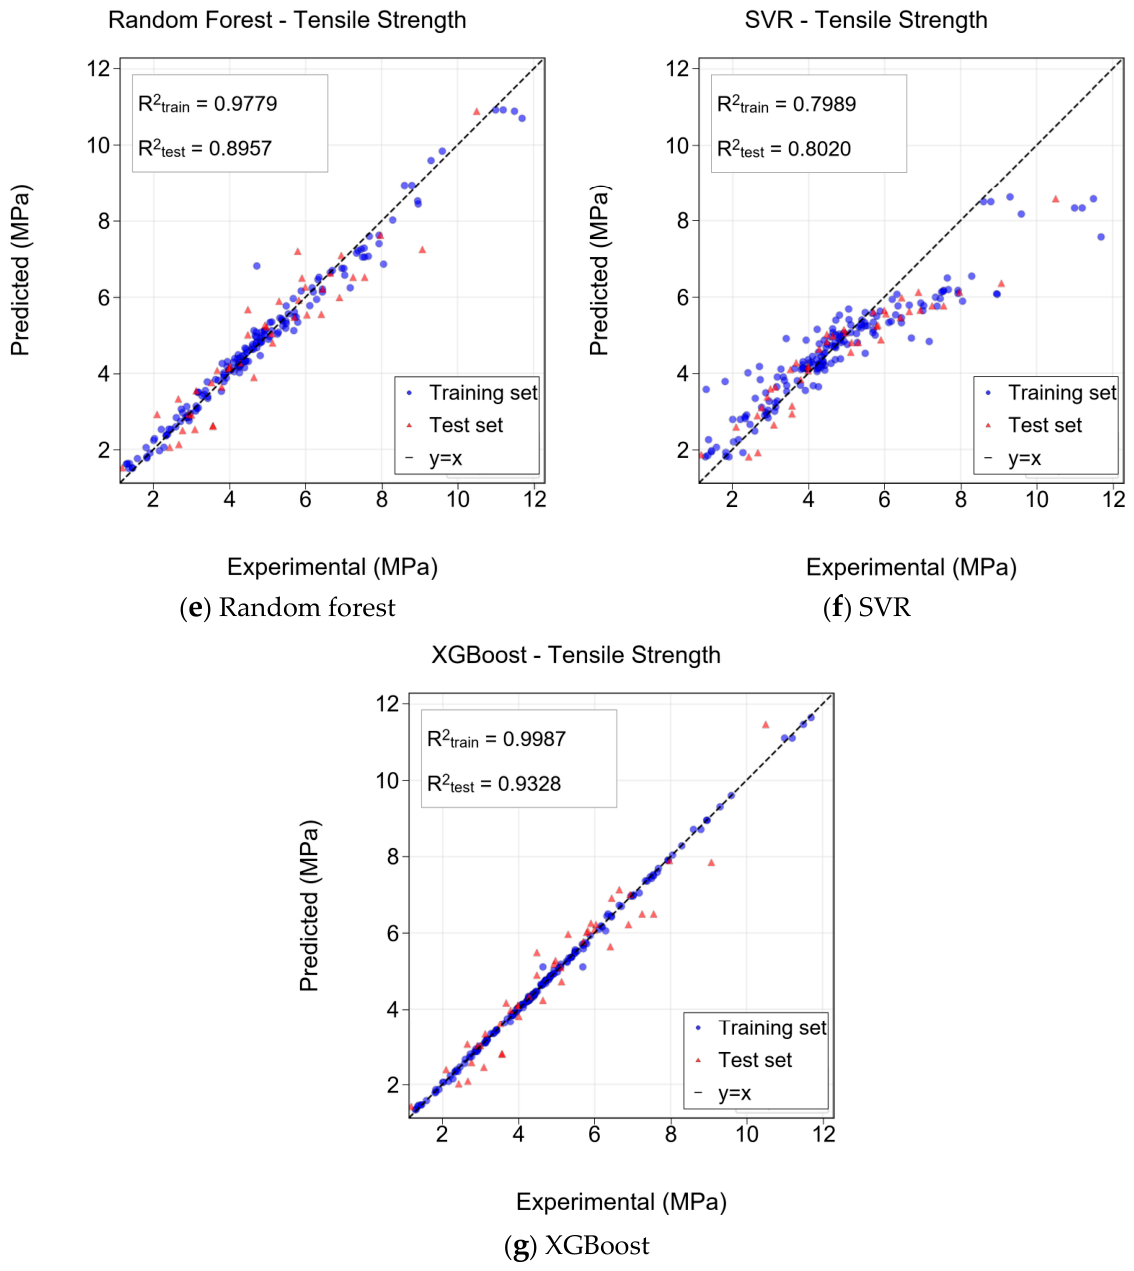
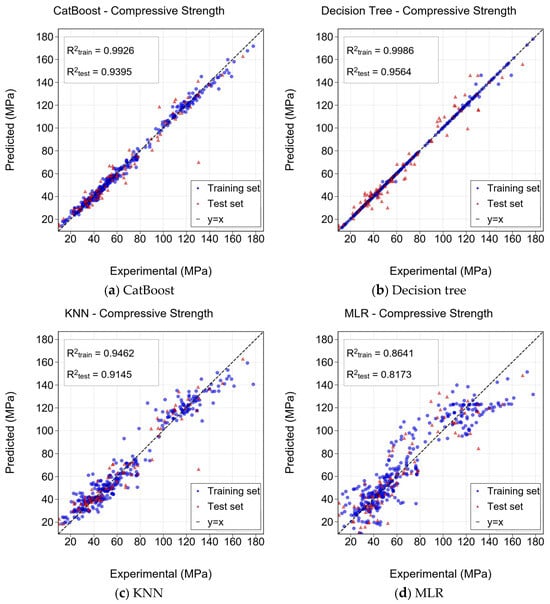
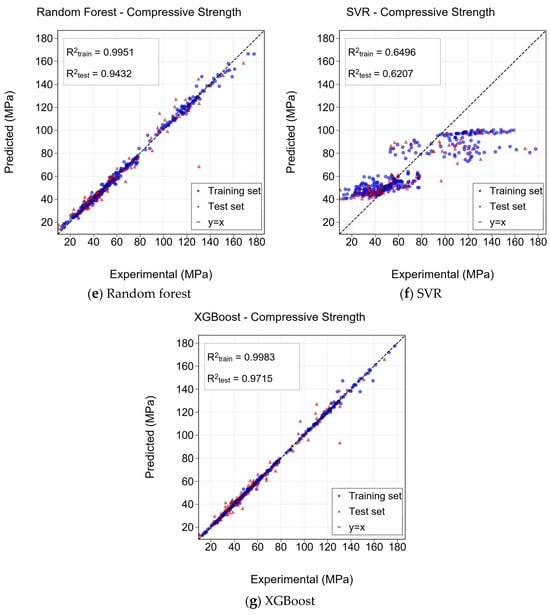
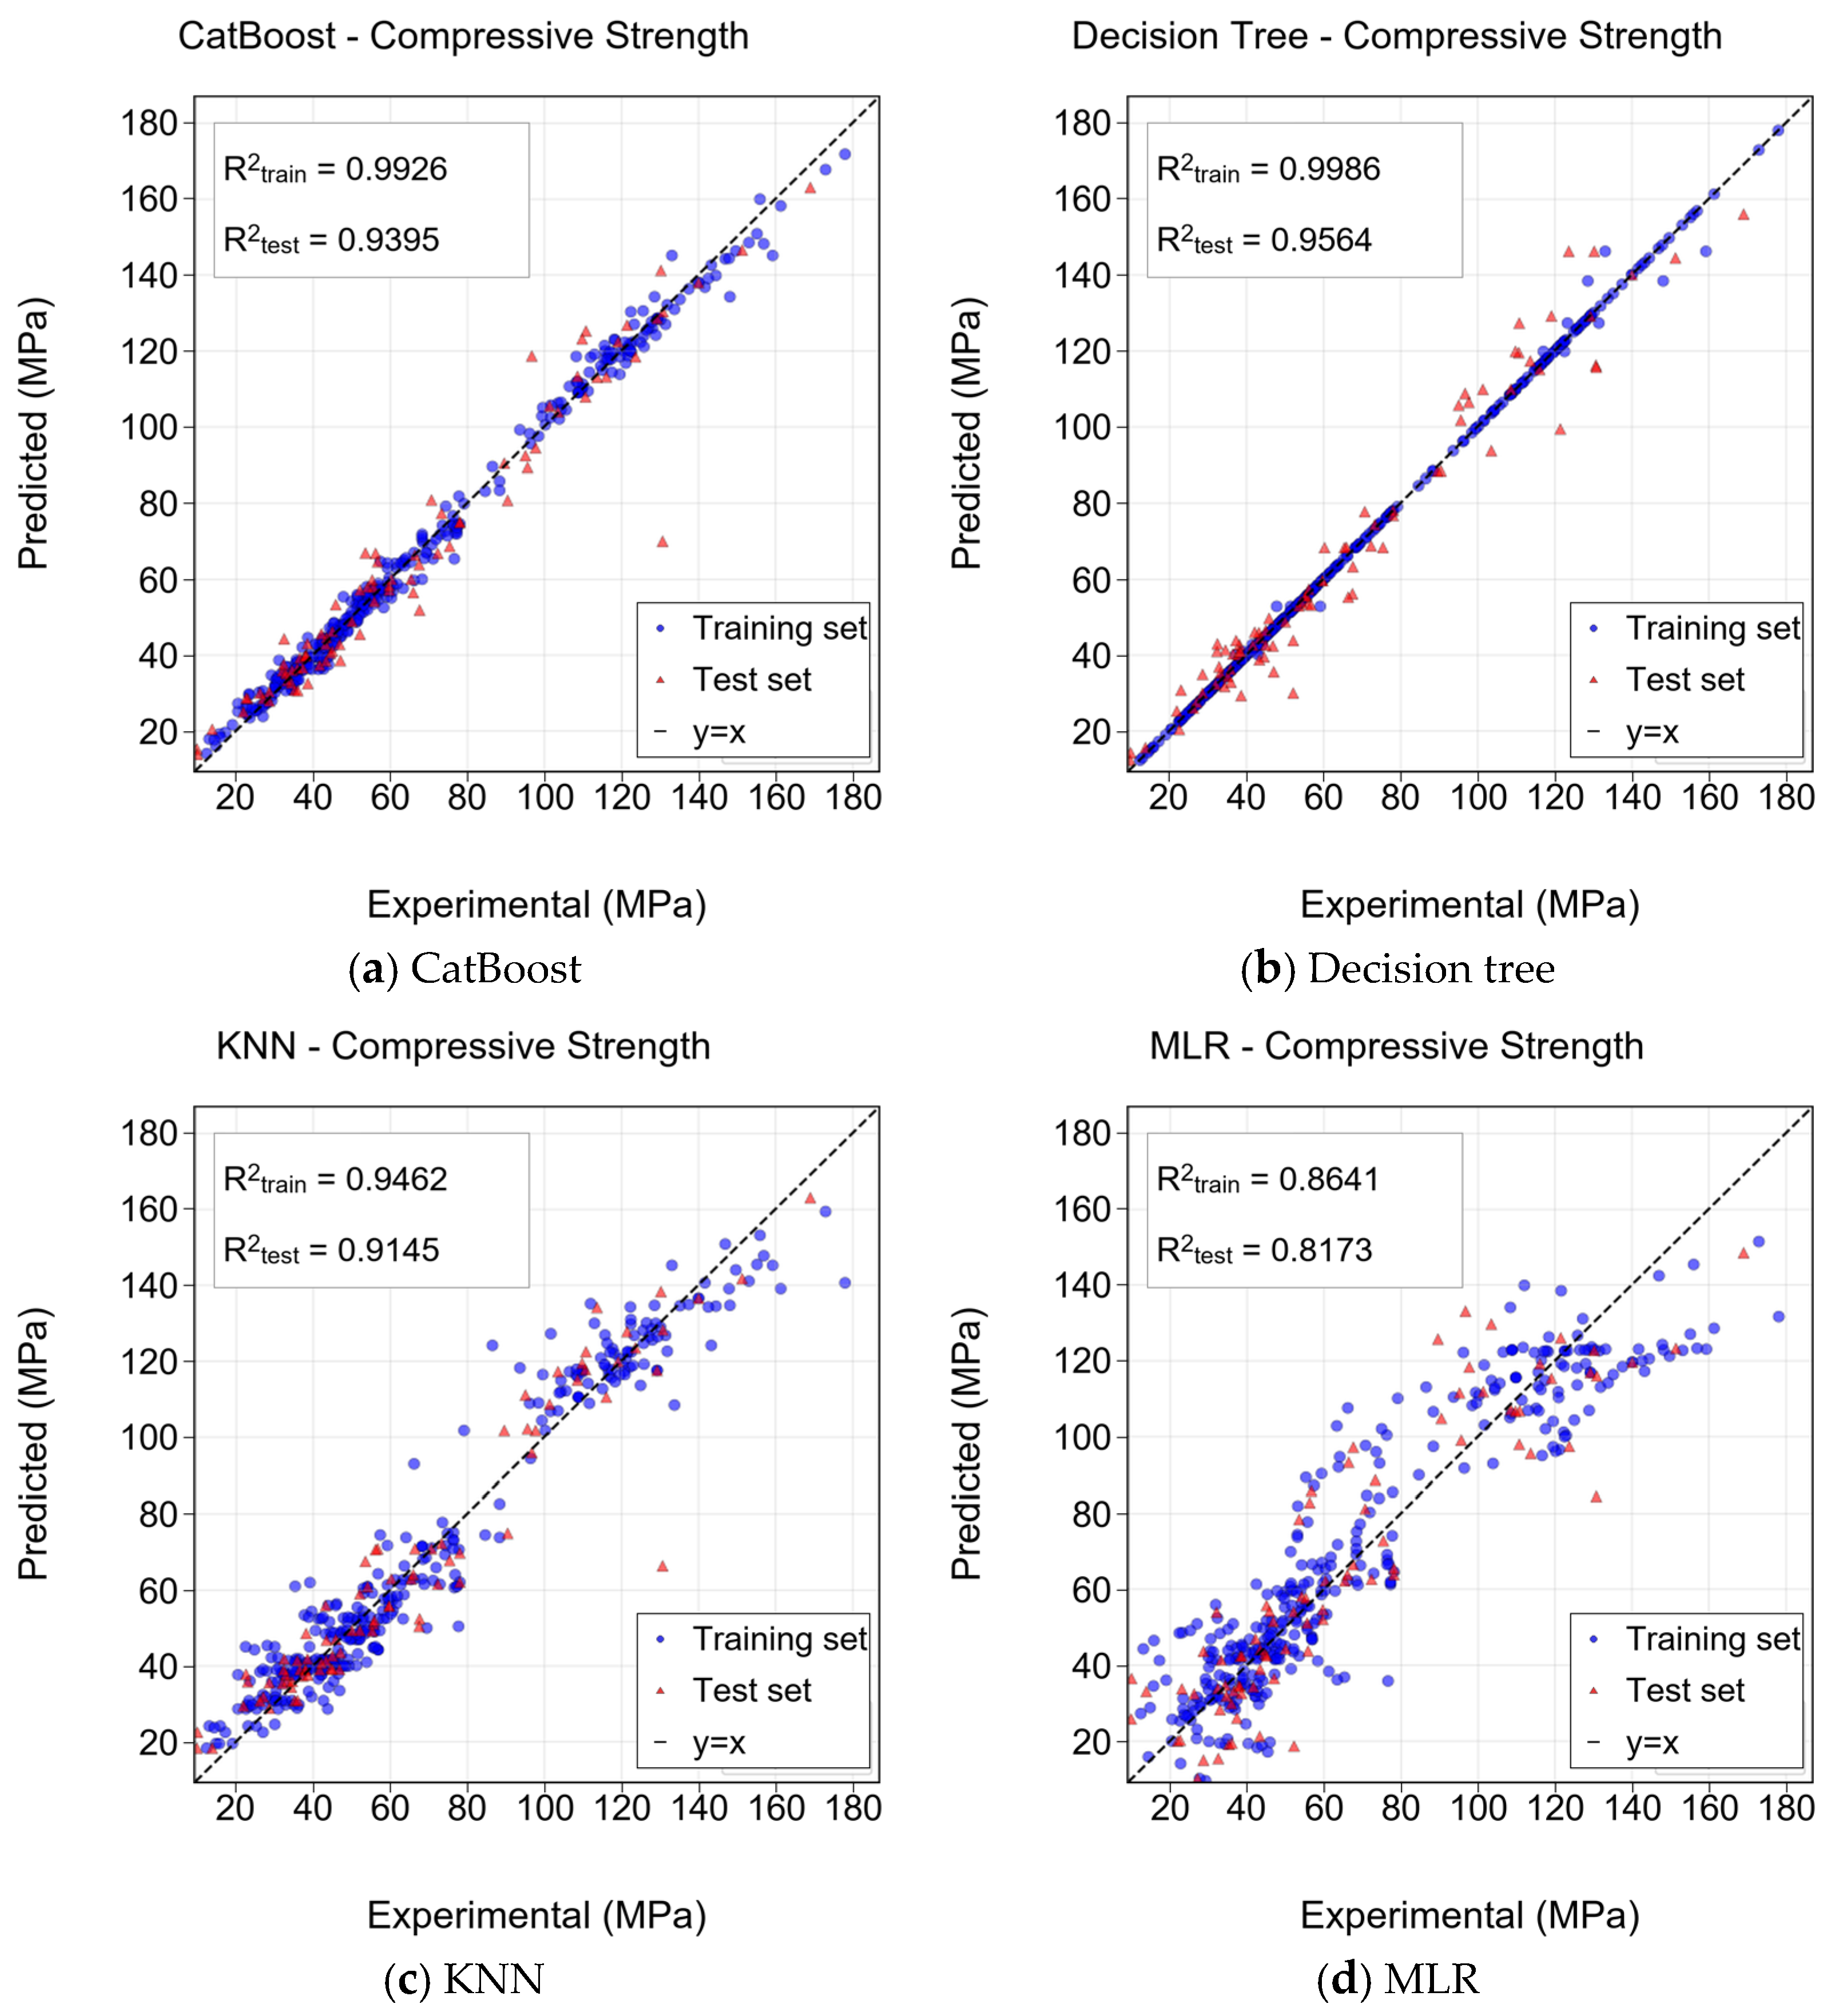
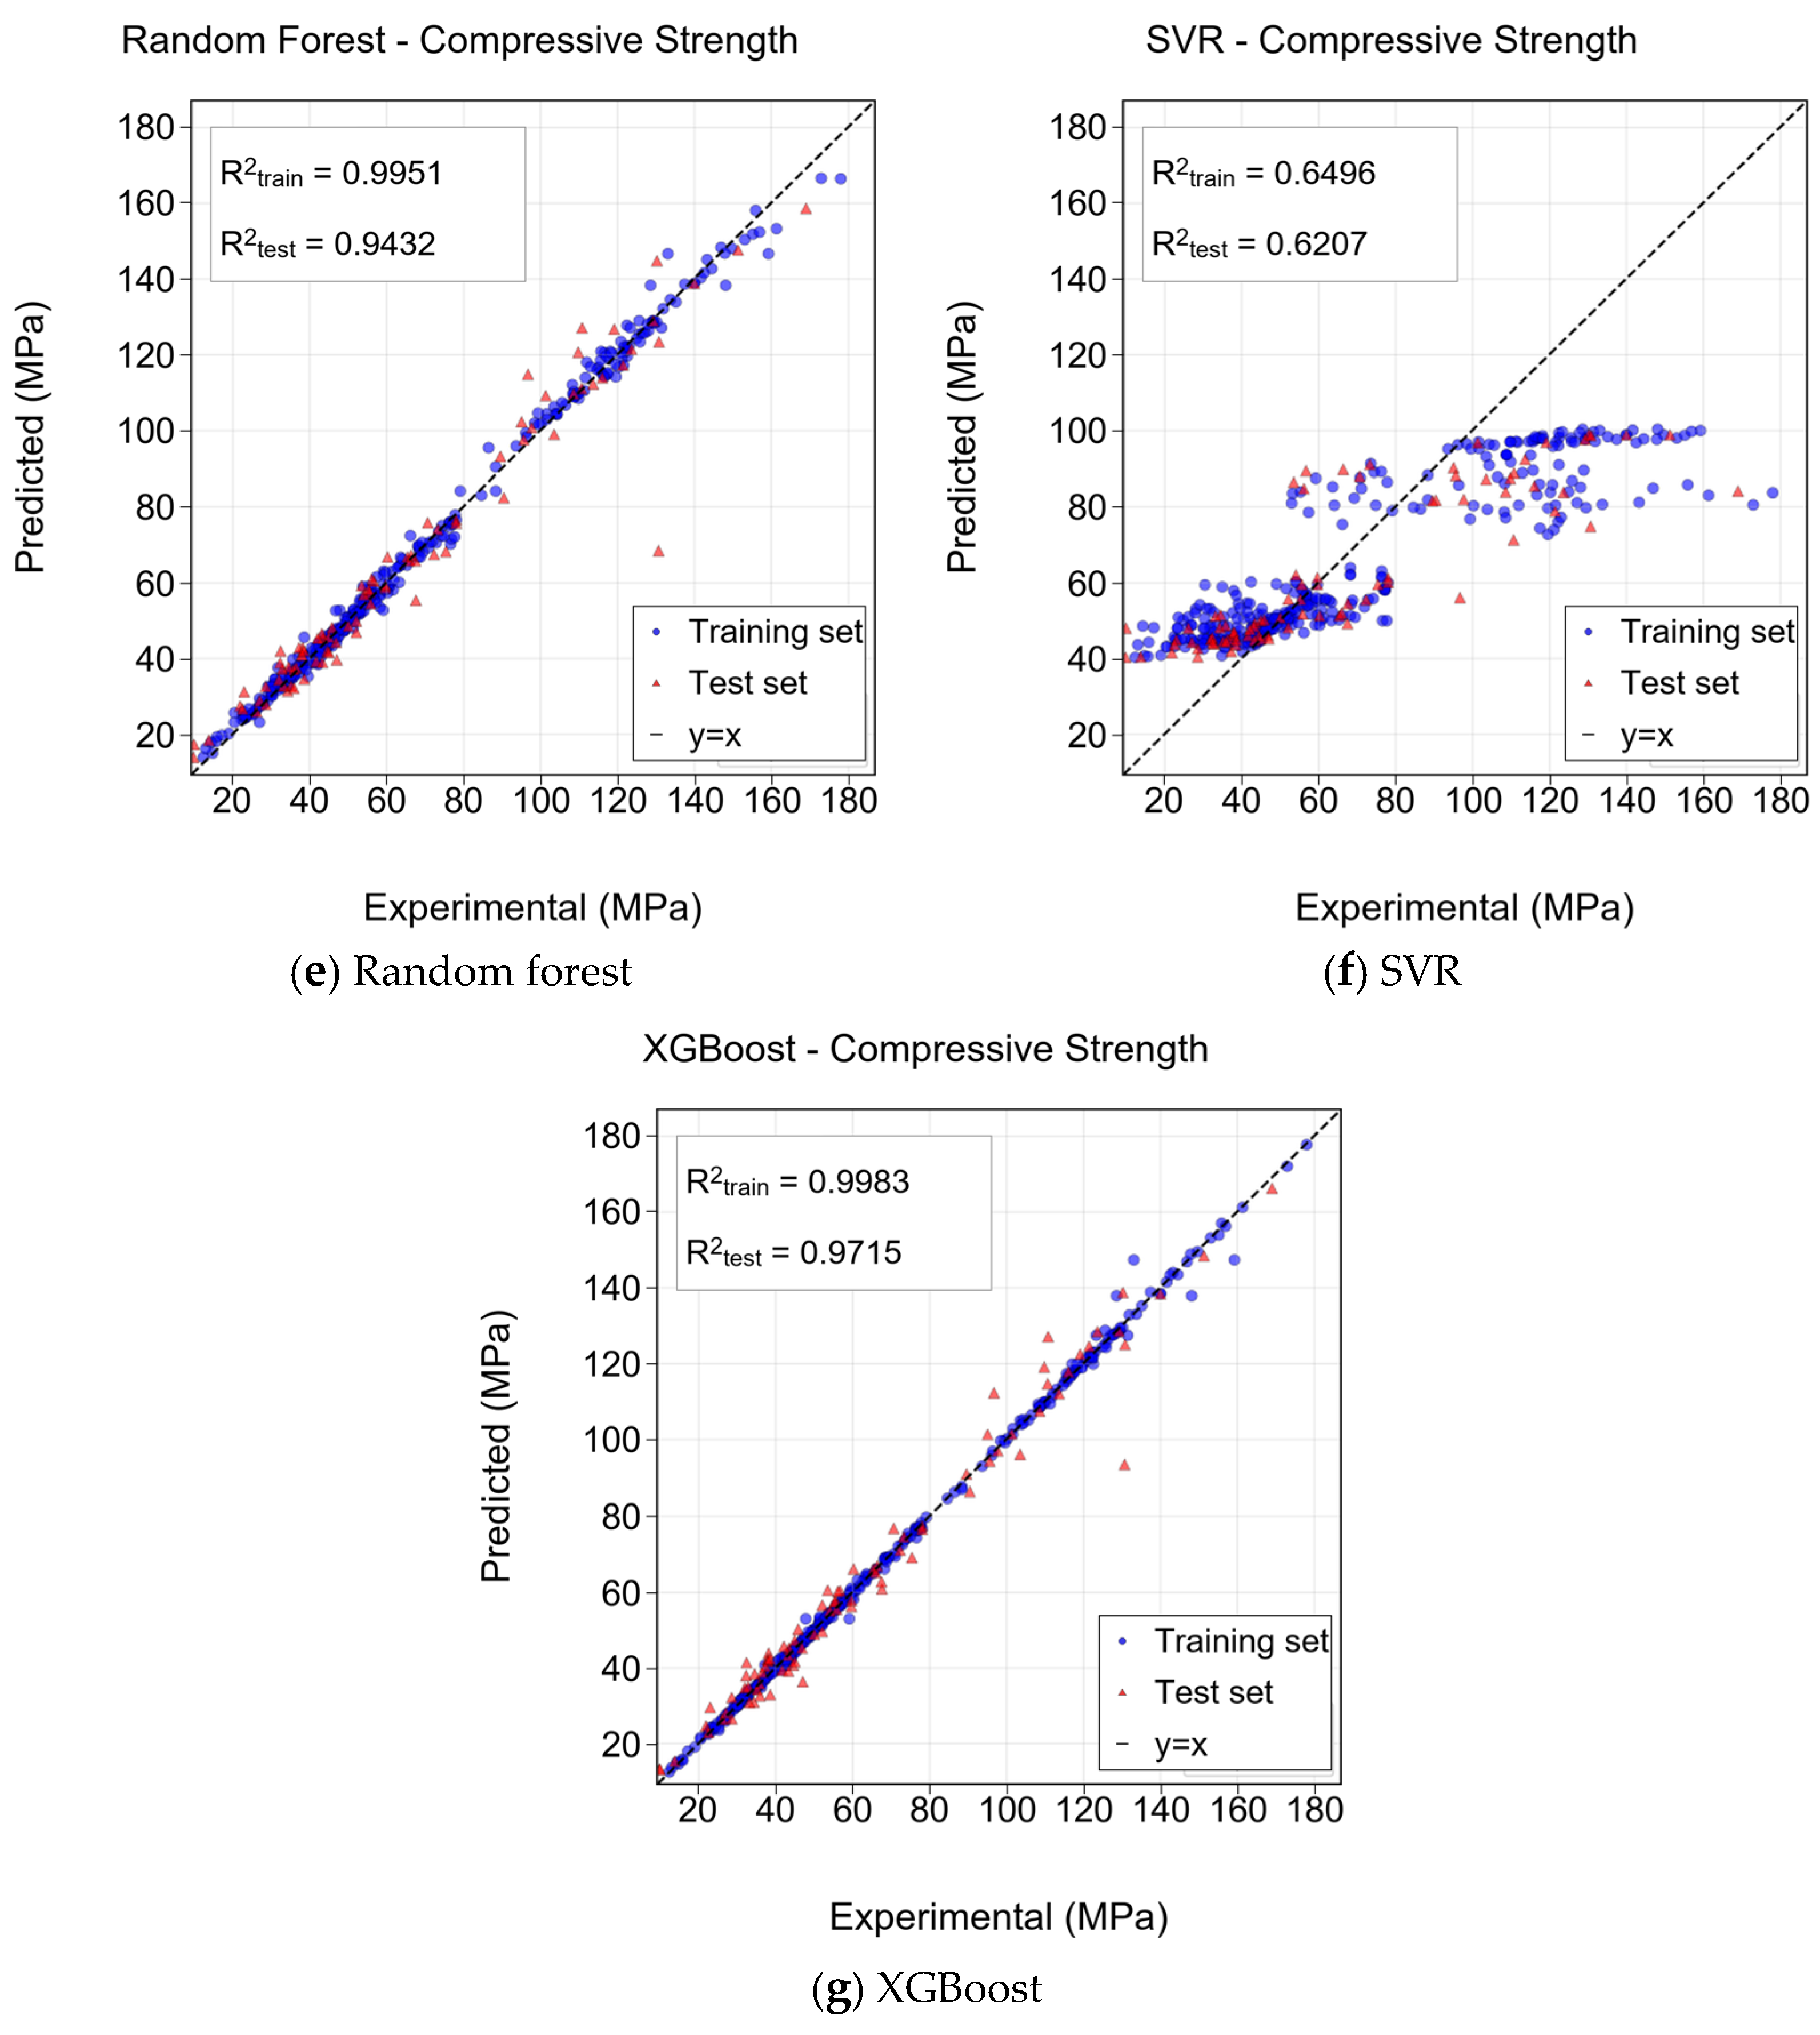
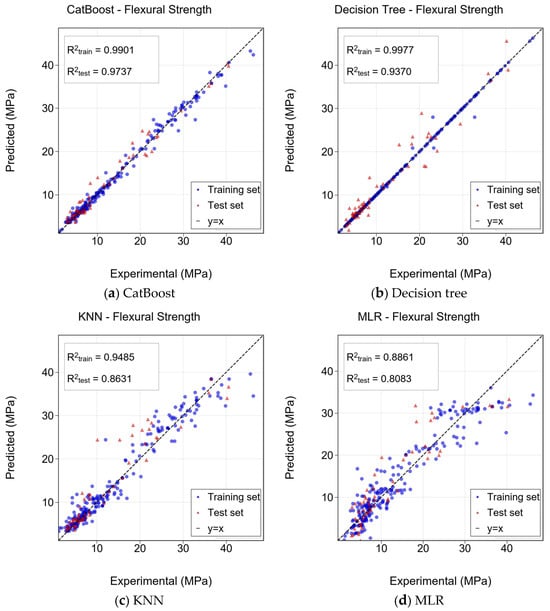
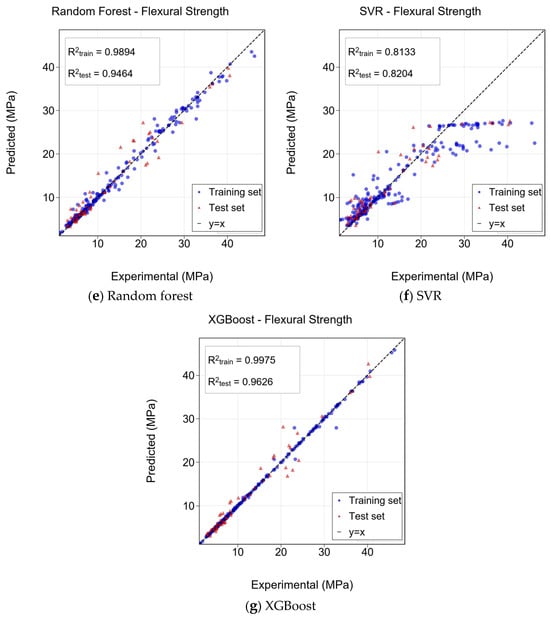
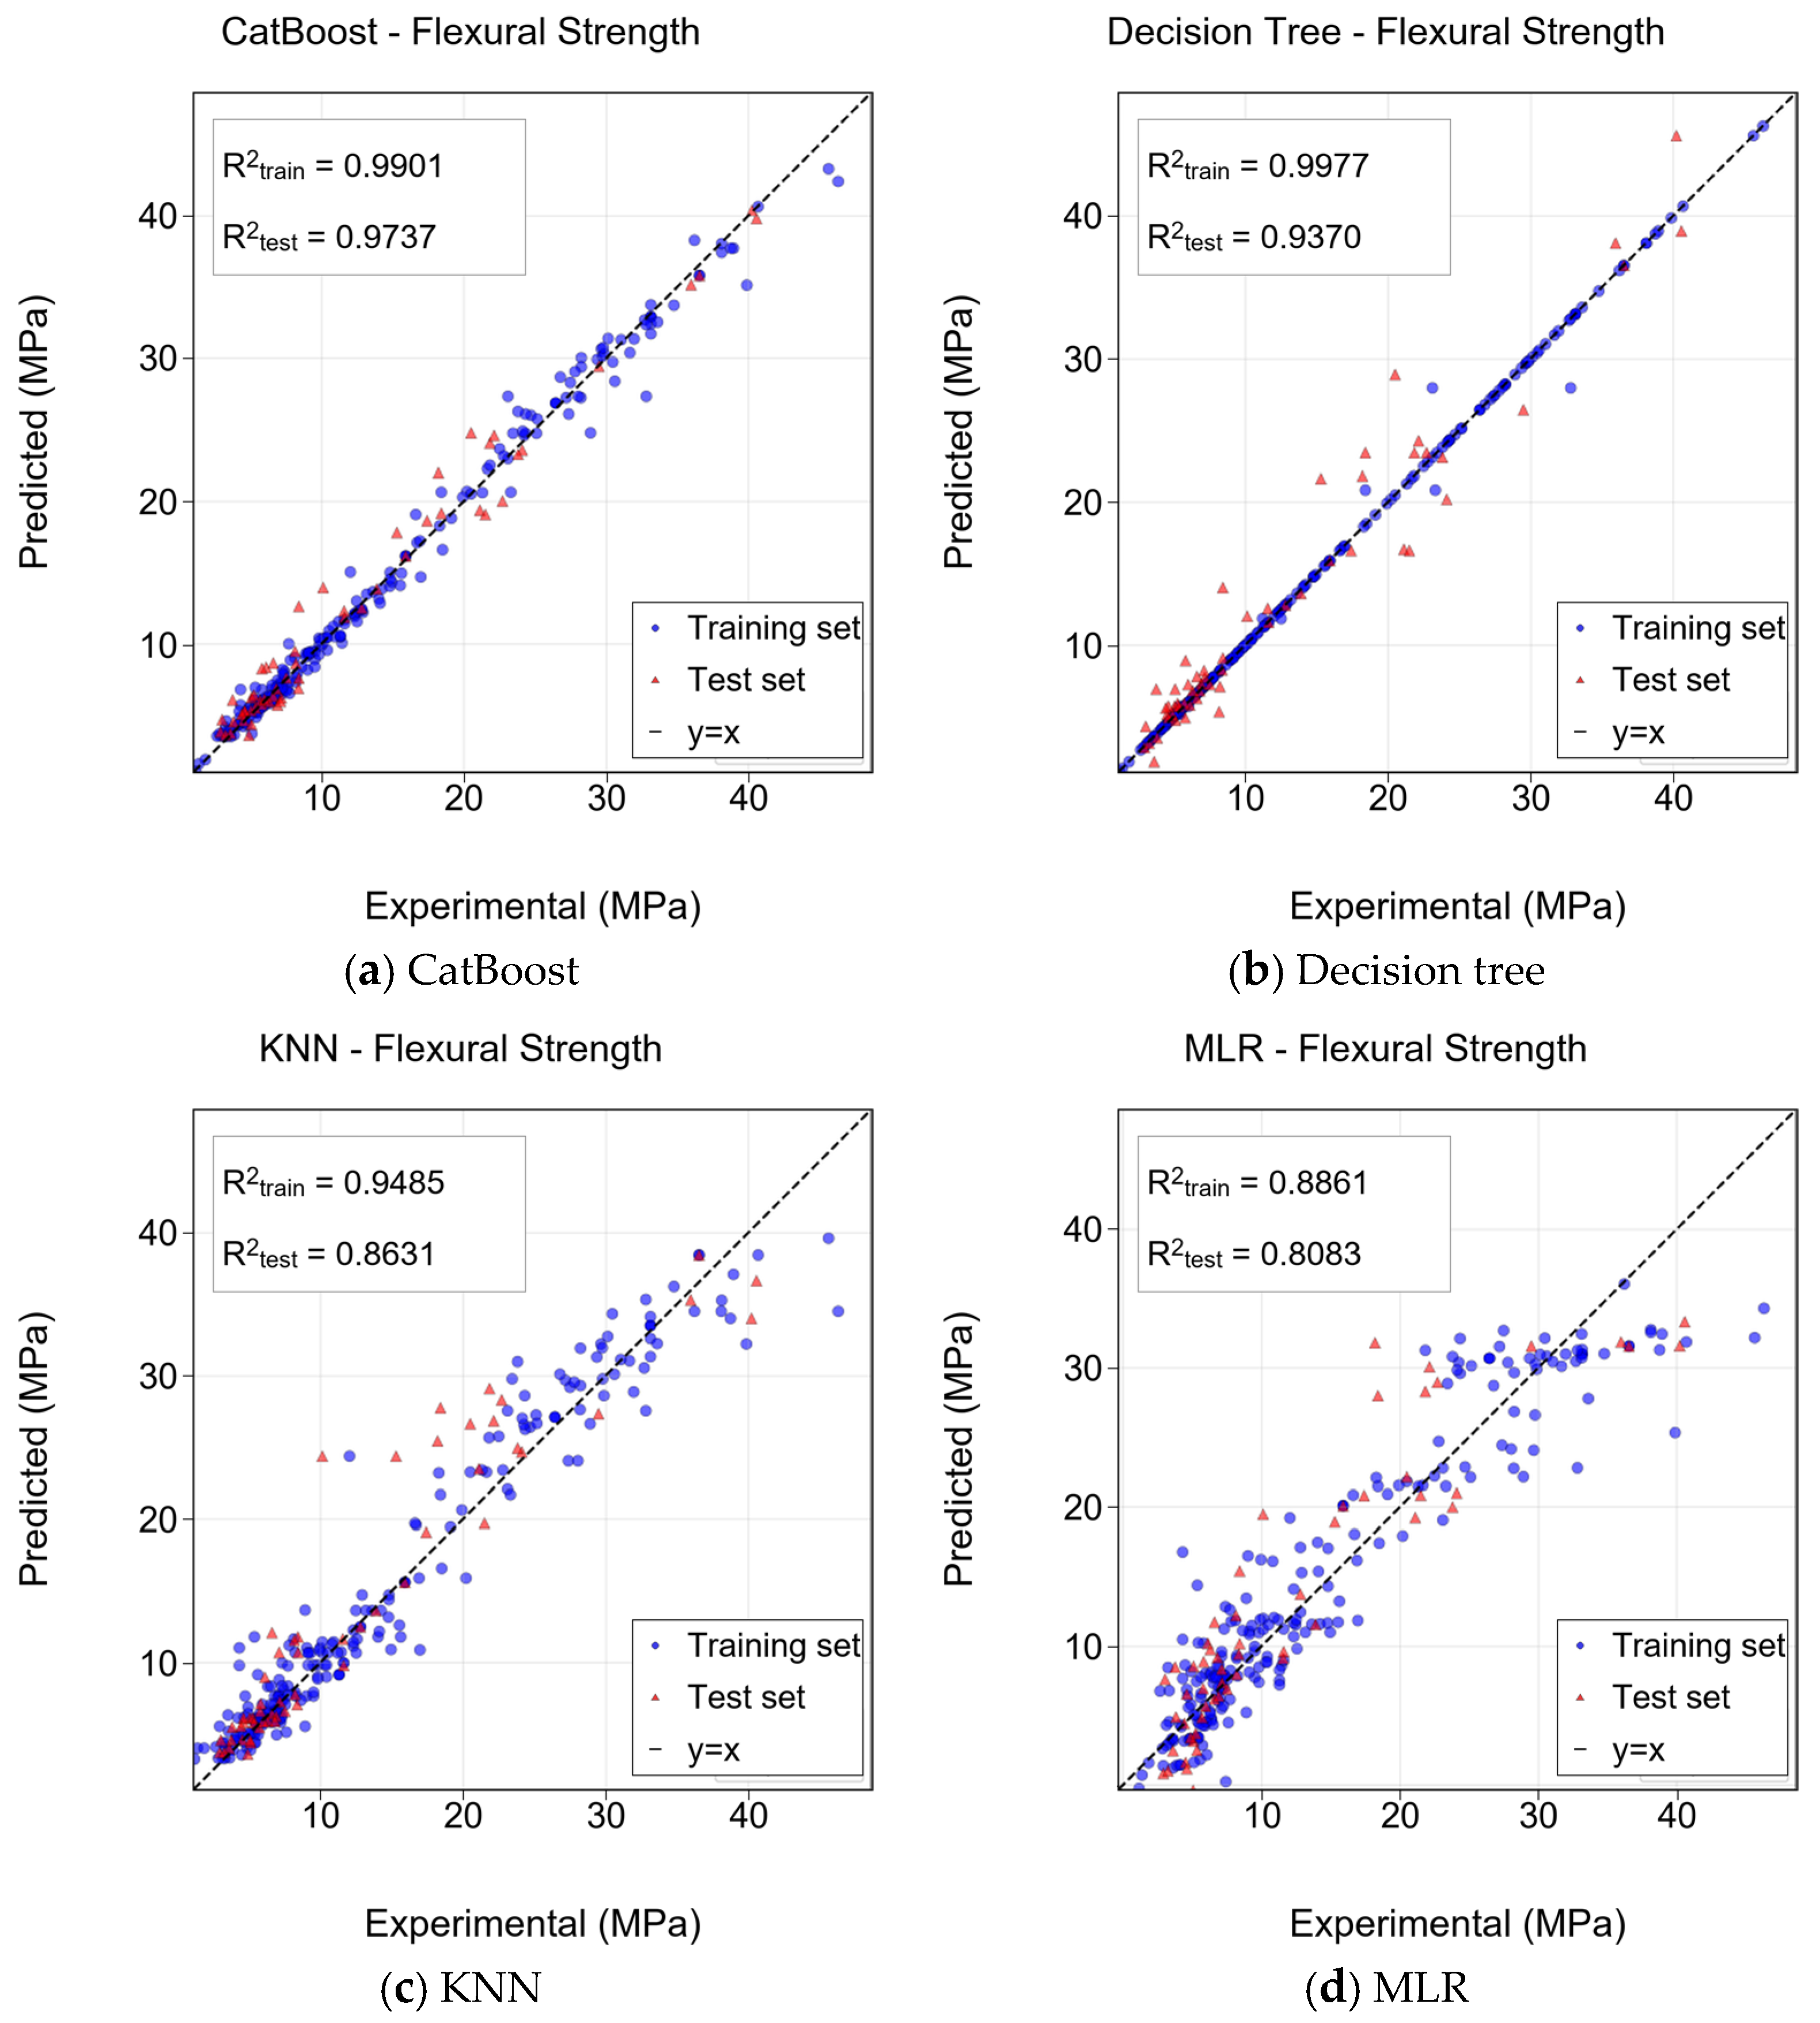
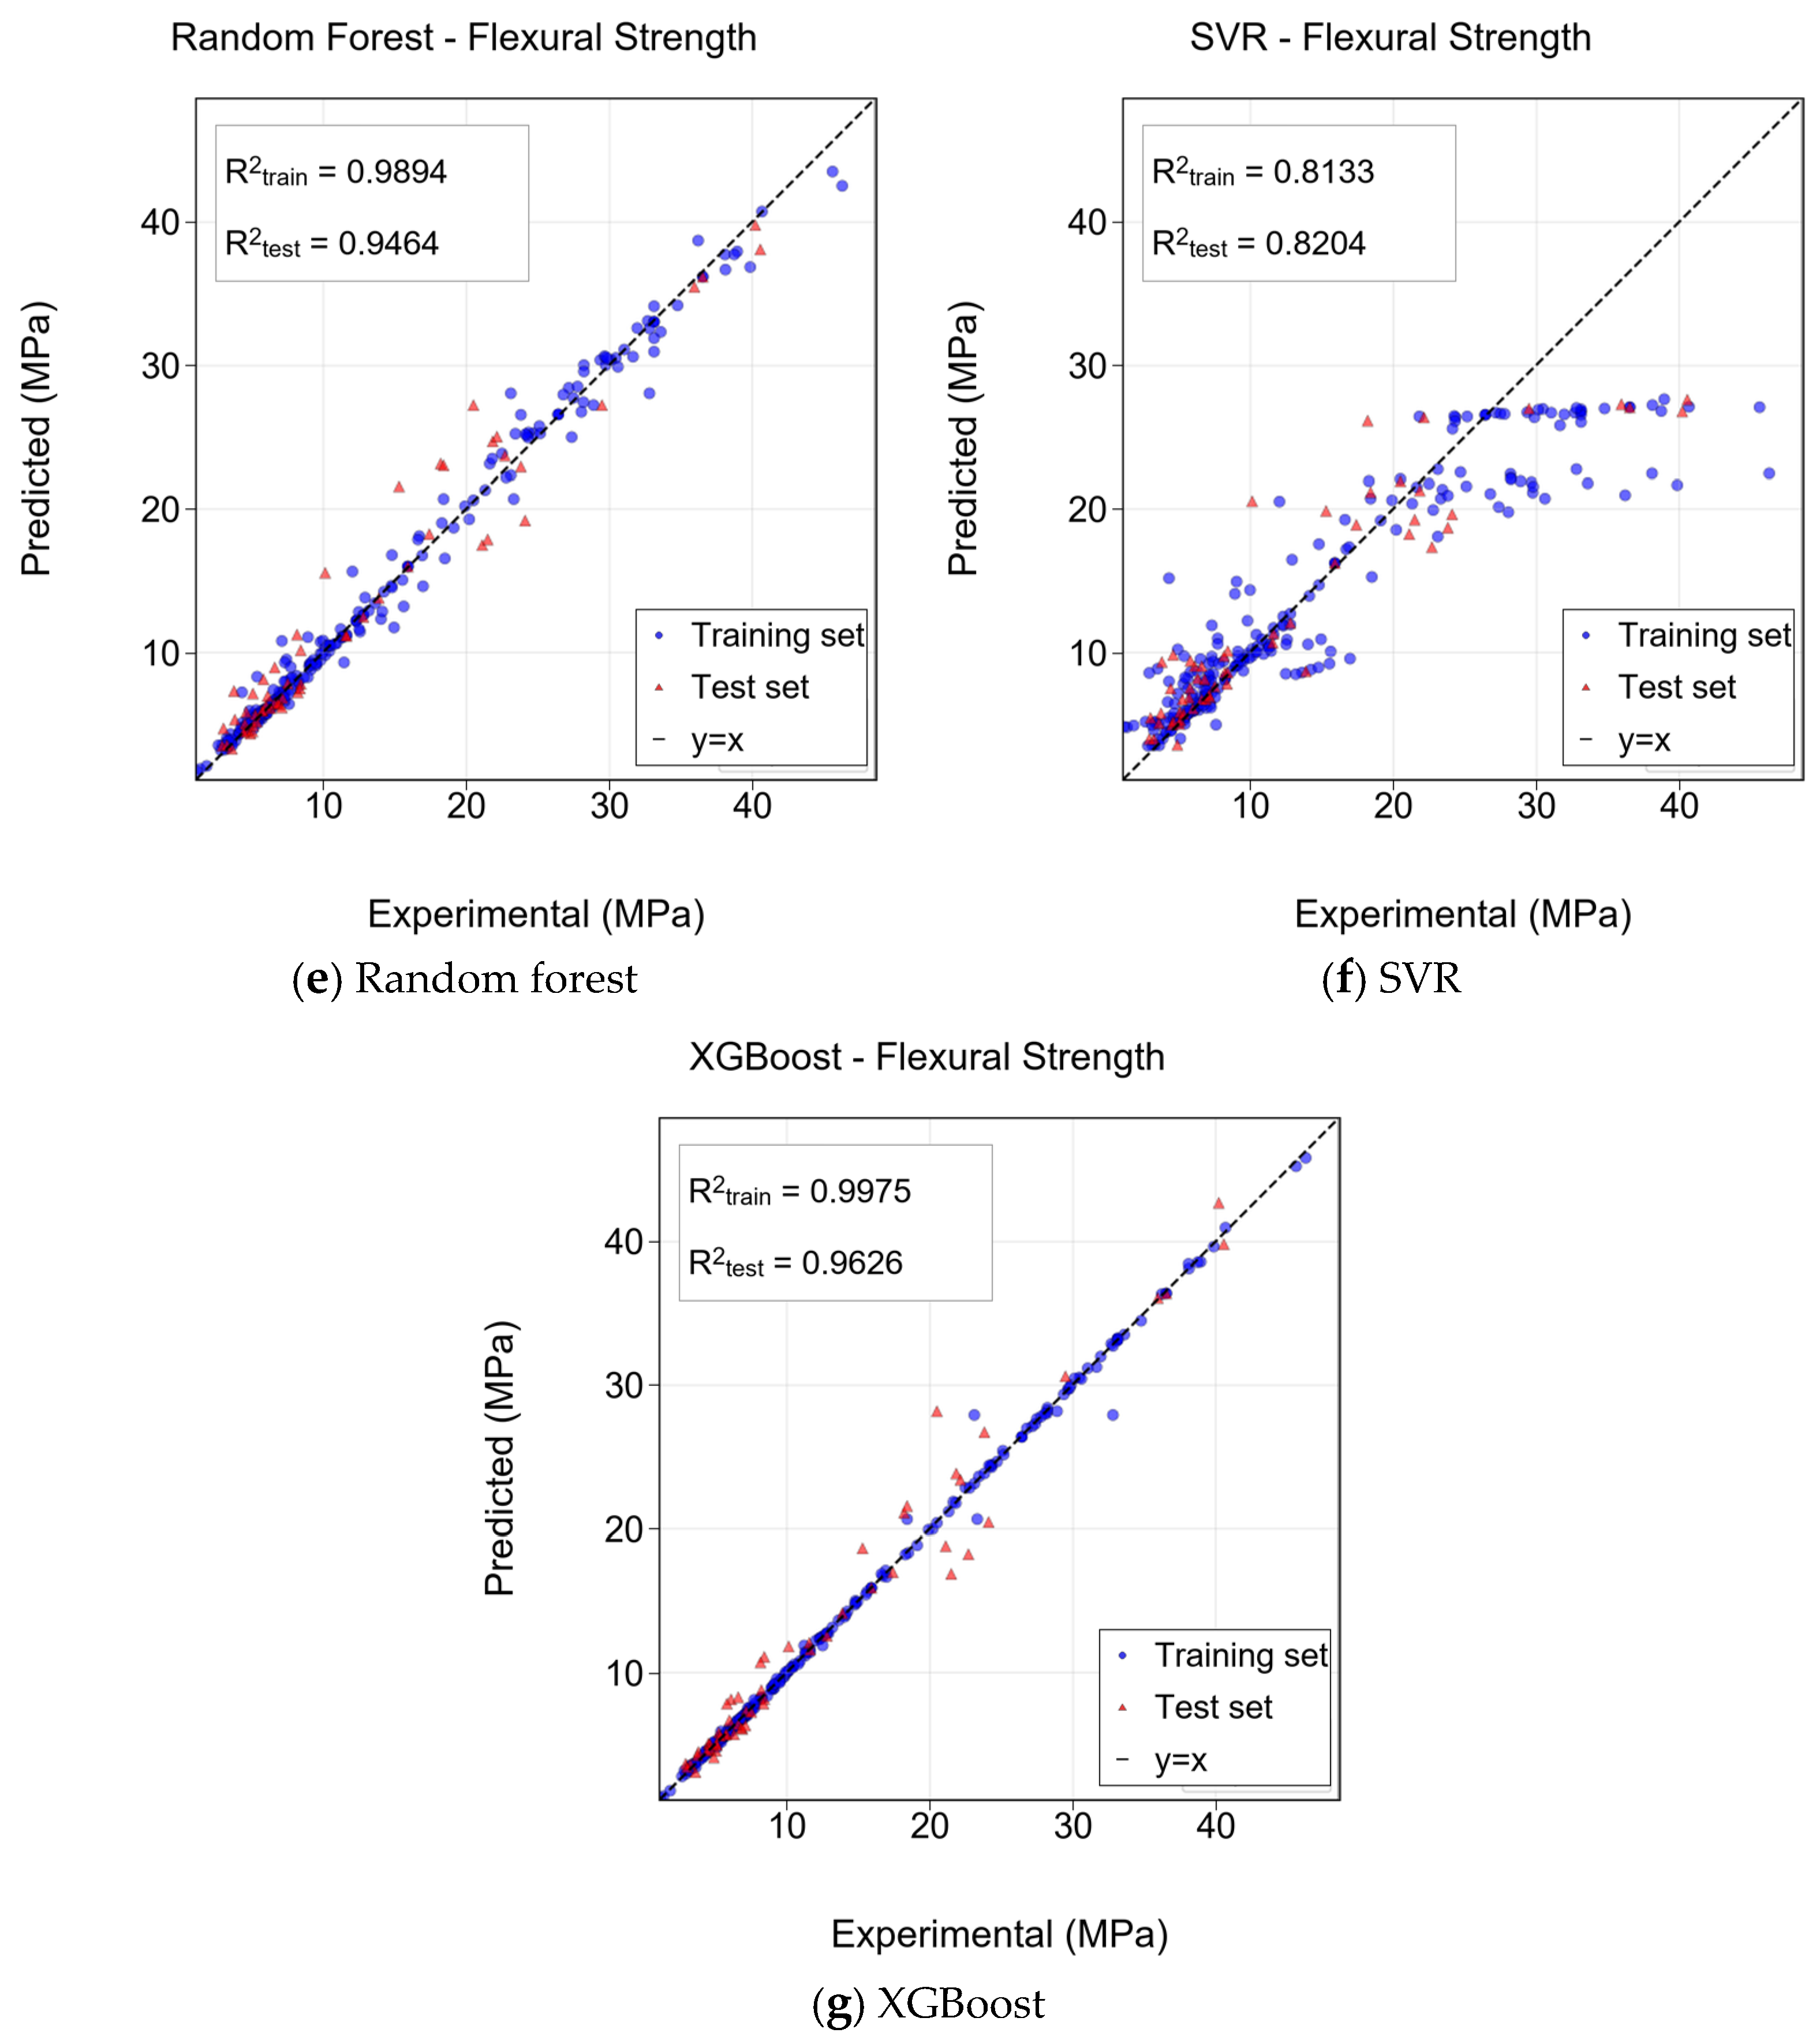
Figure 4, Figure 5 and Figure 6 compare measured and predicted tensile, compressive, and flexural strengths for seed 0. Blue circles and red triangles denote training and test observations; the dashed line denotes equality. Tree ensembles generally agree more closely with this line than MLR or SVR, whose deviations are greater near the strength extremes.
Figure 4.
Measured versus predicted tensile strength for random seed 0.
Figure 5.
Measured versus predicted compressive strength for random seed 0.
Figure 6.
Measured versus predicted flexural strength for random seed 0.
XGBoost test R2 values were 0.9715 and 0.9328 for compressive and tensile strength. Corresponding RMSE values were 6.12 MPa and 0.50 MPa, and MAPE values were 7.53% and 8.84%. CatBoost gave flexural-strength test R2 = 0.9737 and RMSE = 1.59 MPa. Random forest gave test R2 above 0.89 for all responses. Small train–test differences for the leading models did not reveal severe overfitting within this split, but cannot establish performance on independent literature sources.
KNN was the strongest scale-sensitive alternative in the fixed-seed comparison, although errors increased at high strengths. MLR and SVR generally produced test R2 below 0.85. Tensile strength was harder to predict, potentially reflecting sample size, test-method differences, and material behavior; the relative contributions of these factors were not isolated.
4. Model Interpretation, Strength-Prediction Interface, and Mix Design Optimization
4.1. SHAP-Based Model Interpretation
SHapley Additive exPlanations (SHAP) attributes predictions to individual feature contributions [24]. In concrete-strength prediction, SHAP has also been used to make model attributions more transparent for domain users [25]. The selected seed-0 models were used to examine 10 continuous predictors. Mean absolute SHAP values quantify model-level importance; summary and dependence plots relate feature values to prediction contributions. These describe fitted models and do not independently establish causal material mechanisms. Comparable studies have used SHAP to interpret the failure modes of reinforced-concrete members [26], and explainable machine learning is increasingly recommended where model predictions inform engineering decisions [27,28].
For fiber length–dosage analysis, the mean SHAP value of the zero-fiber group in each material system was the reference. Positive and negative relative effects therefore refer to deviations from that reference, not simply to the sign of the unadjusted SHAP value.
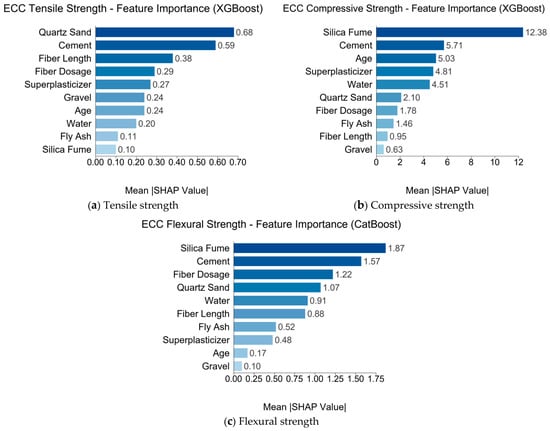
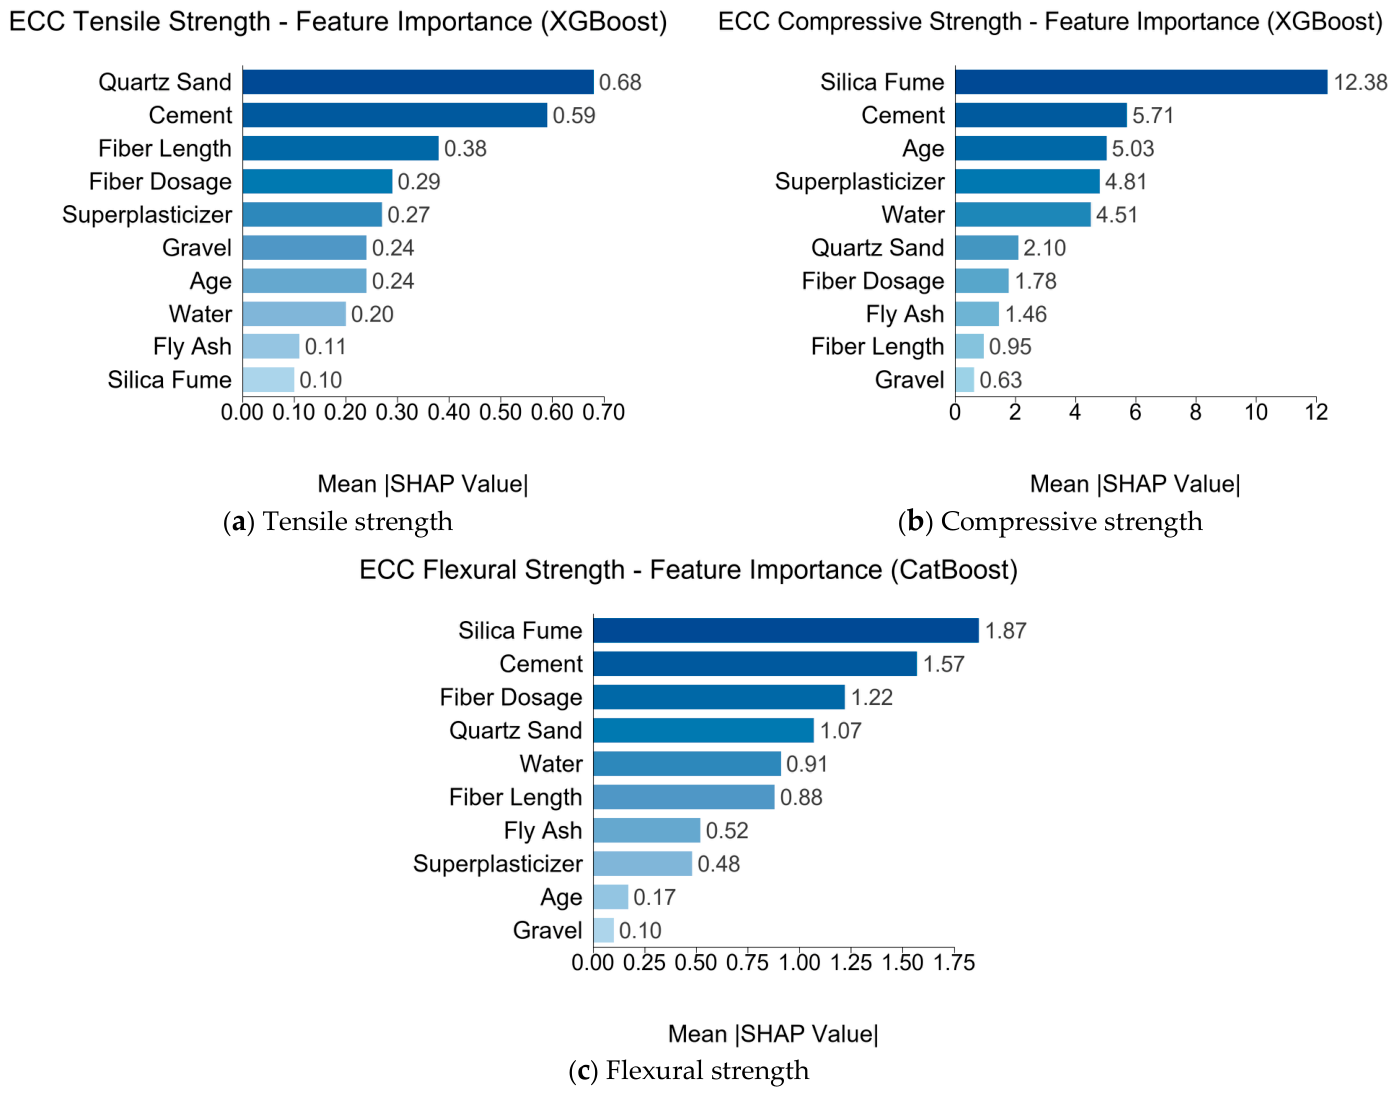
Figure 7 compares the 10 continuous predictors for ECC. Silica fume dominated compressive-strength importance, with a mean absolute SHAP value of 12.38, more than twice that of cement. Cement, age, superplasticizer, and water ranked second to fifth. Fiber dosage and length ranked lower. This is consistent with a substantial role for matrix-related variables, although SHAP does not measure hydration or pore structure directly.
Figure 7.
Mean absolute SHAP feature importance for ECC.
For tensile strength, quartz sand ranked first (a mean absolute SHAP value of 0.68), followed by cement (0.59), fiber length, and fiber dosage. Both matrix composition and fiber characteristics therefore contribute to the model. Interface conditions and dispersion are possible physical interpretations, but were not directly measured.
For flexural strength, silica fume ranked first (a mean absolute SHAP value of 1.87), followed by cement and fiber dosage. This is compatible with contributions from matrix resistance and fiber bridging, without establishing their separate causal effects.
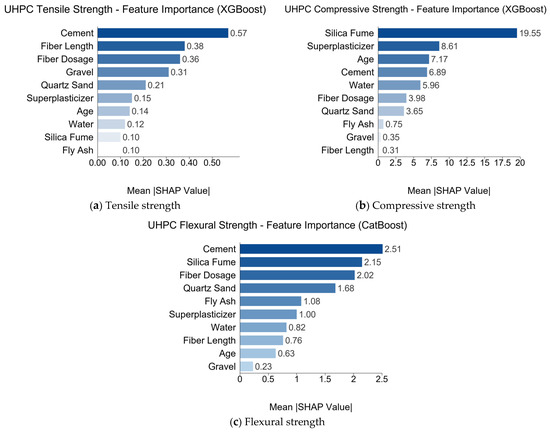
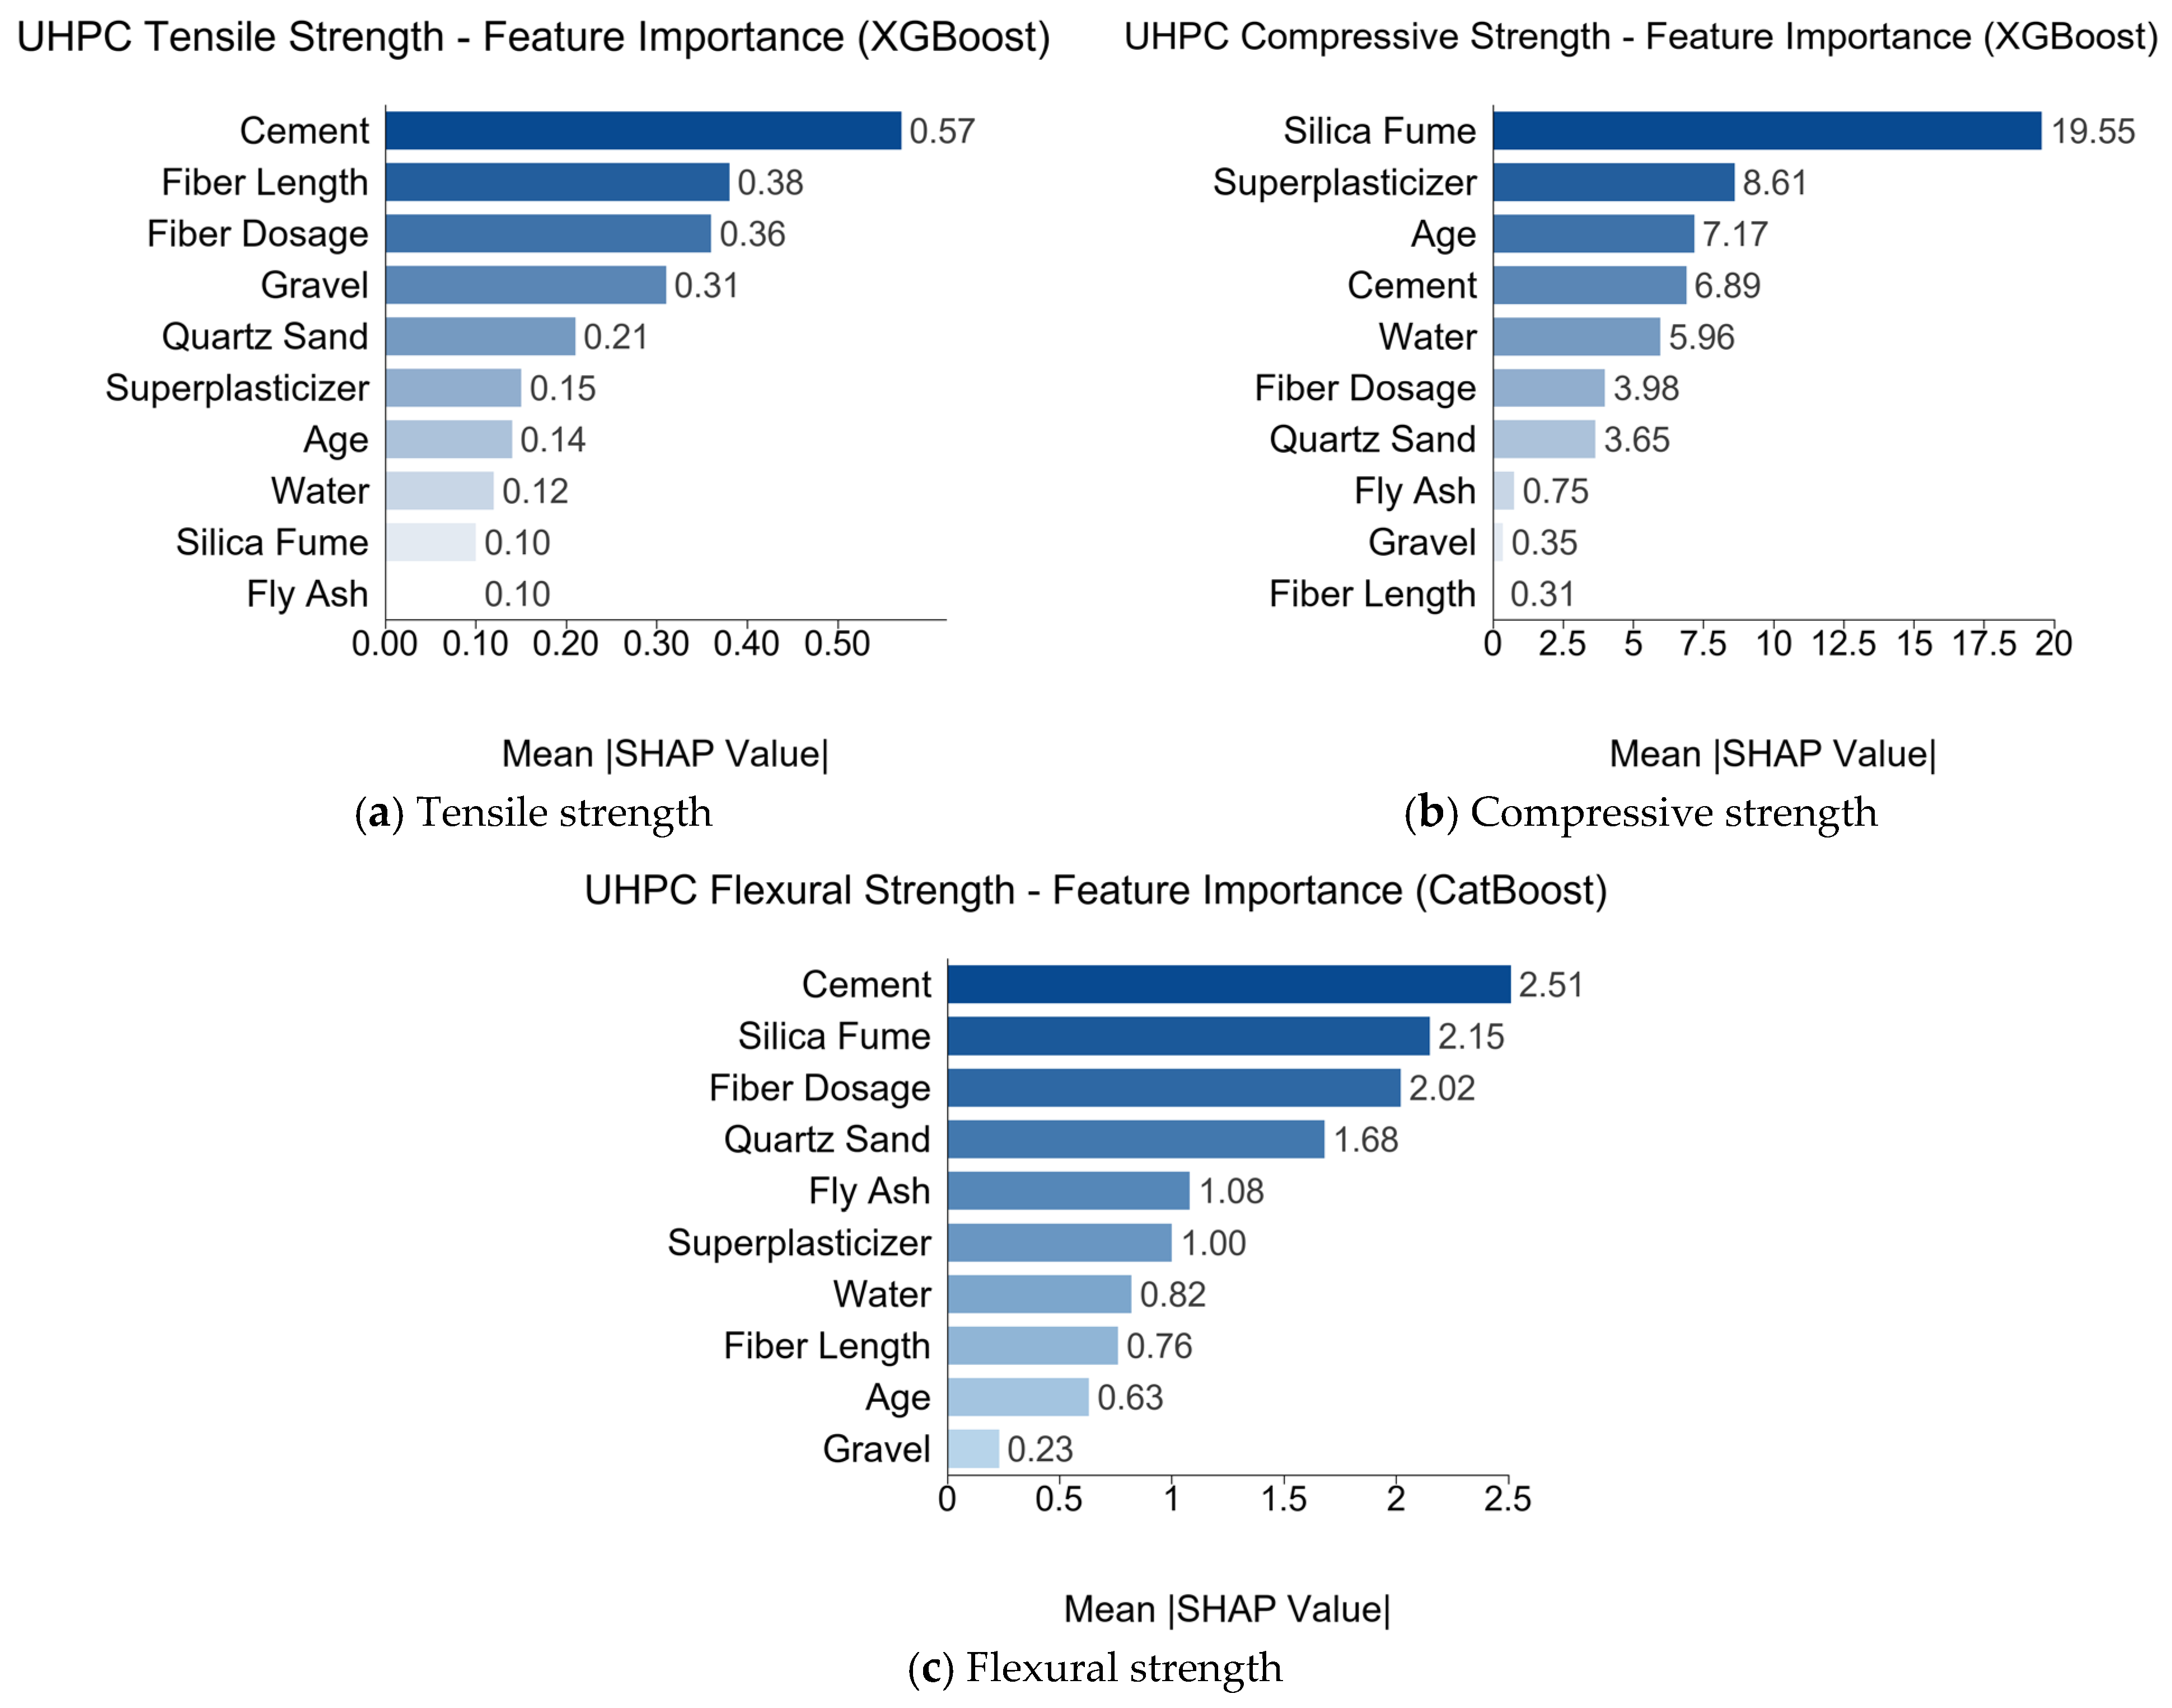
UHPC rankings differed from ECC (Figure 8). For compressive strength, silica fume had a mean absolute SHAP value of 19.55, more than twice that of the second-ranked superplasticizer. Age, cement, and water followed. Fiber dosage ranked sixth (3.98), indicating greater importance in this model than in the ECC model.
Figure 8.
Mean absolute SHAP feature importance for UHPC.
For tensile strength, cement ranked first (a mean absolute SHAP value of 0.57), followed by fiber length, gravel, and fiber dosage. Matrix composition and steel-fiber characteristics both contributed. Longer fibers may improve anchorage and bridging, but attributions from observational data cannot separate these mechanisms from correlated composition changes.
For flexural strength, cement ranked first (a mean absolute SHAP value of 2.51), followed by silica fume and fiber dosage. This differs from ECC and cautions against assuming a common ranking across materials. Feature importance does not quantify flexural toughness or a direct physical effect.
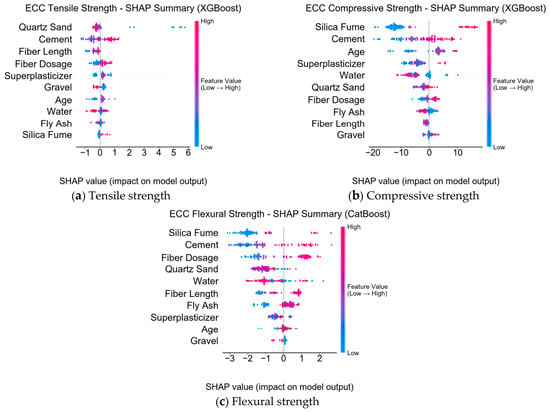
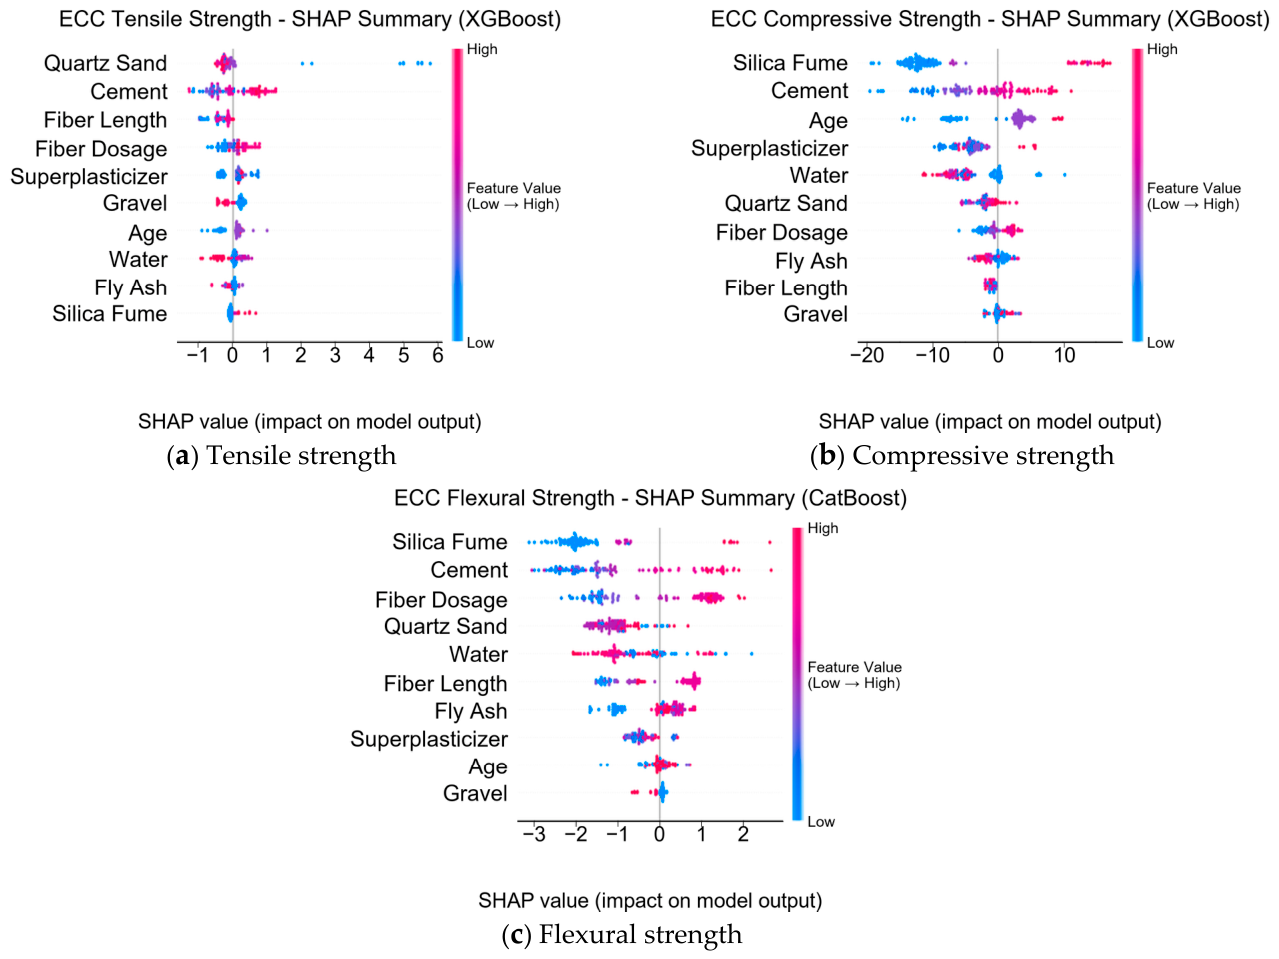
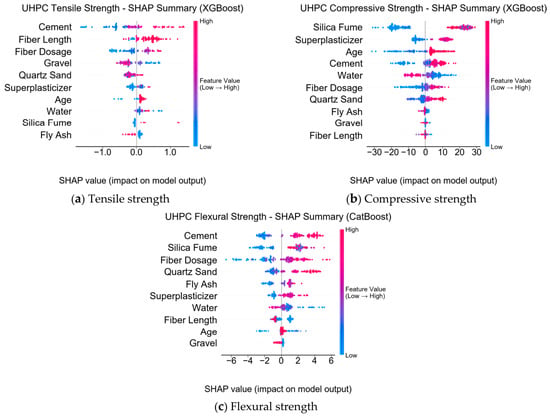
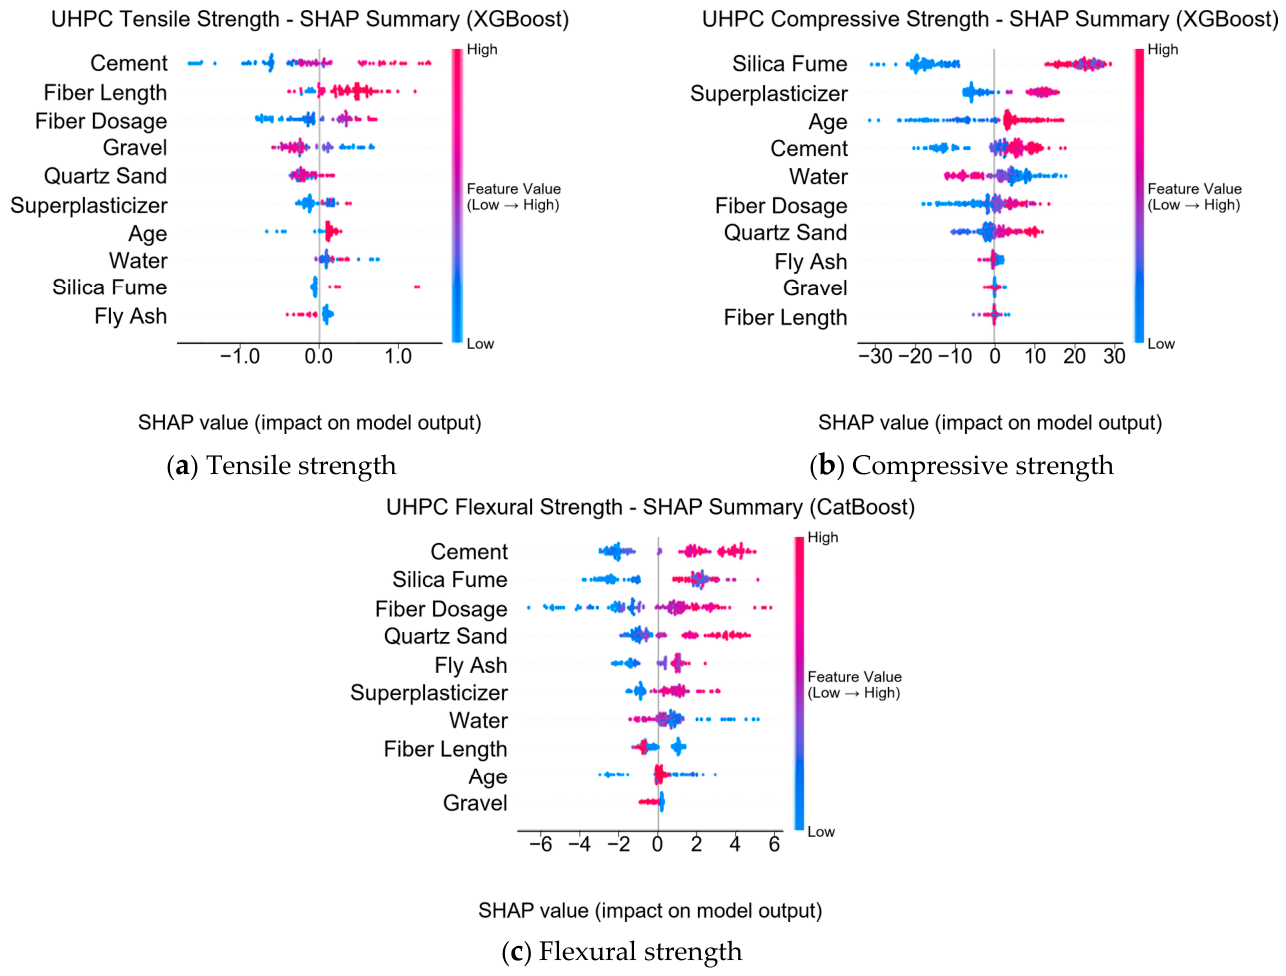
Figure 9 and Figure 10 present ECC and UHPC summary plots. Contributions are nonlinear, with several predictors showing changes in direction or magnitude across their ranges. Favorable ranges are conditional on the sampled domain and are not experimentally established optima.
Figure 9.
SHAP summary plots for ECC.
Figure 10.
SHAP summary plots for UHPC.
For ECC, cement showed a negative–positive–negative tensile pattern and increasingly positive compressive and flexural contributions. Increasing silica fume shifted compressive and flexural contributions from negative to strongly positive, with a small tensile effect. Fiber length and dosage showed initially negative, then positive, and subsequently weakening flexural associations; their compressive and tensile patterns were less pronounced globally. Quartz sand was weakly positive for compression and negative for tension and flexure at high content. Fly ash was weakly negative for compression and tension and changed from positive to negative for flexure. Age primarily increased compressive predictions. Water and superplasticizer had no clear standalone trends, suggesting that ratios and interactions warrant examination. Gravel had limited influence in the global patterns.
All associations reported below are conditional on the ranges covered by the compiled data. For UHPC, cement was increasingly positive for all responses. Quartz sand was strongly positive for compression and flexure and weakly negative for tension. Fiber length shifted from negative to strongly positive for tension, with smaller effects on other responses. Silica fume content and fiber dosage had positive contributions that first increased and then decreased for compression and flexure. The tensile dosage contribution changed from negative to positive before weakening. Superplasticizer contributions to compression and flexure became positive as content increased within the investigated range. Fly ash, age, water, and gravel broadly followed the ECC patterns.
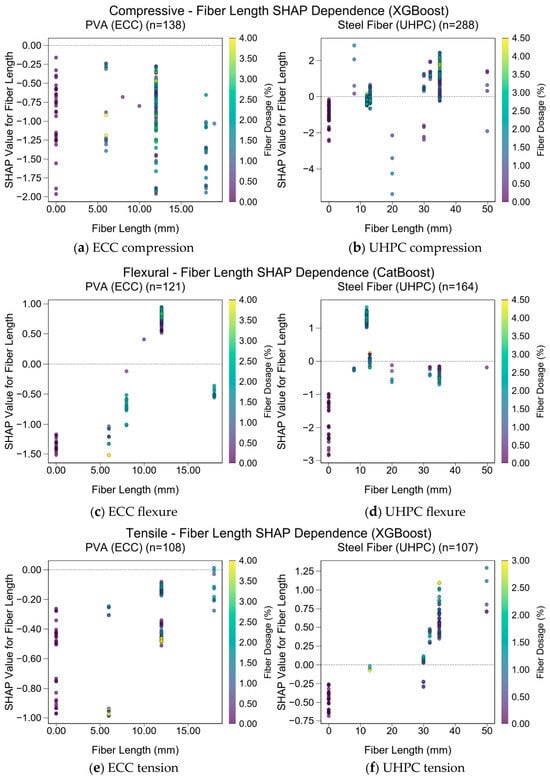
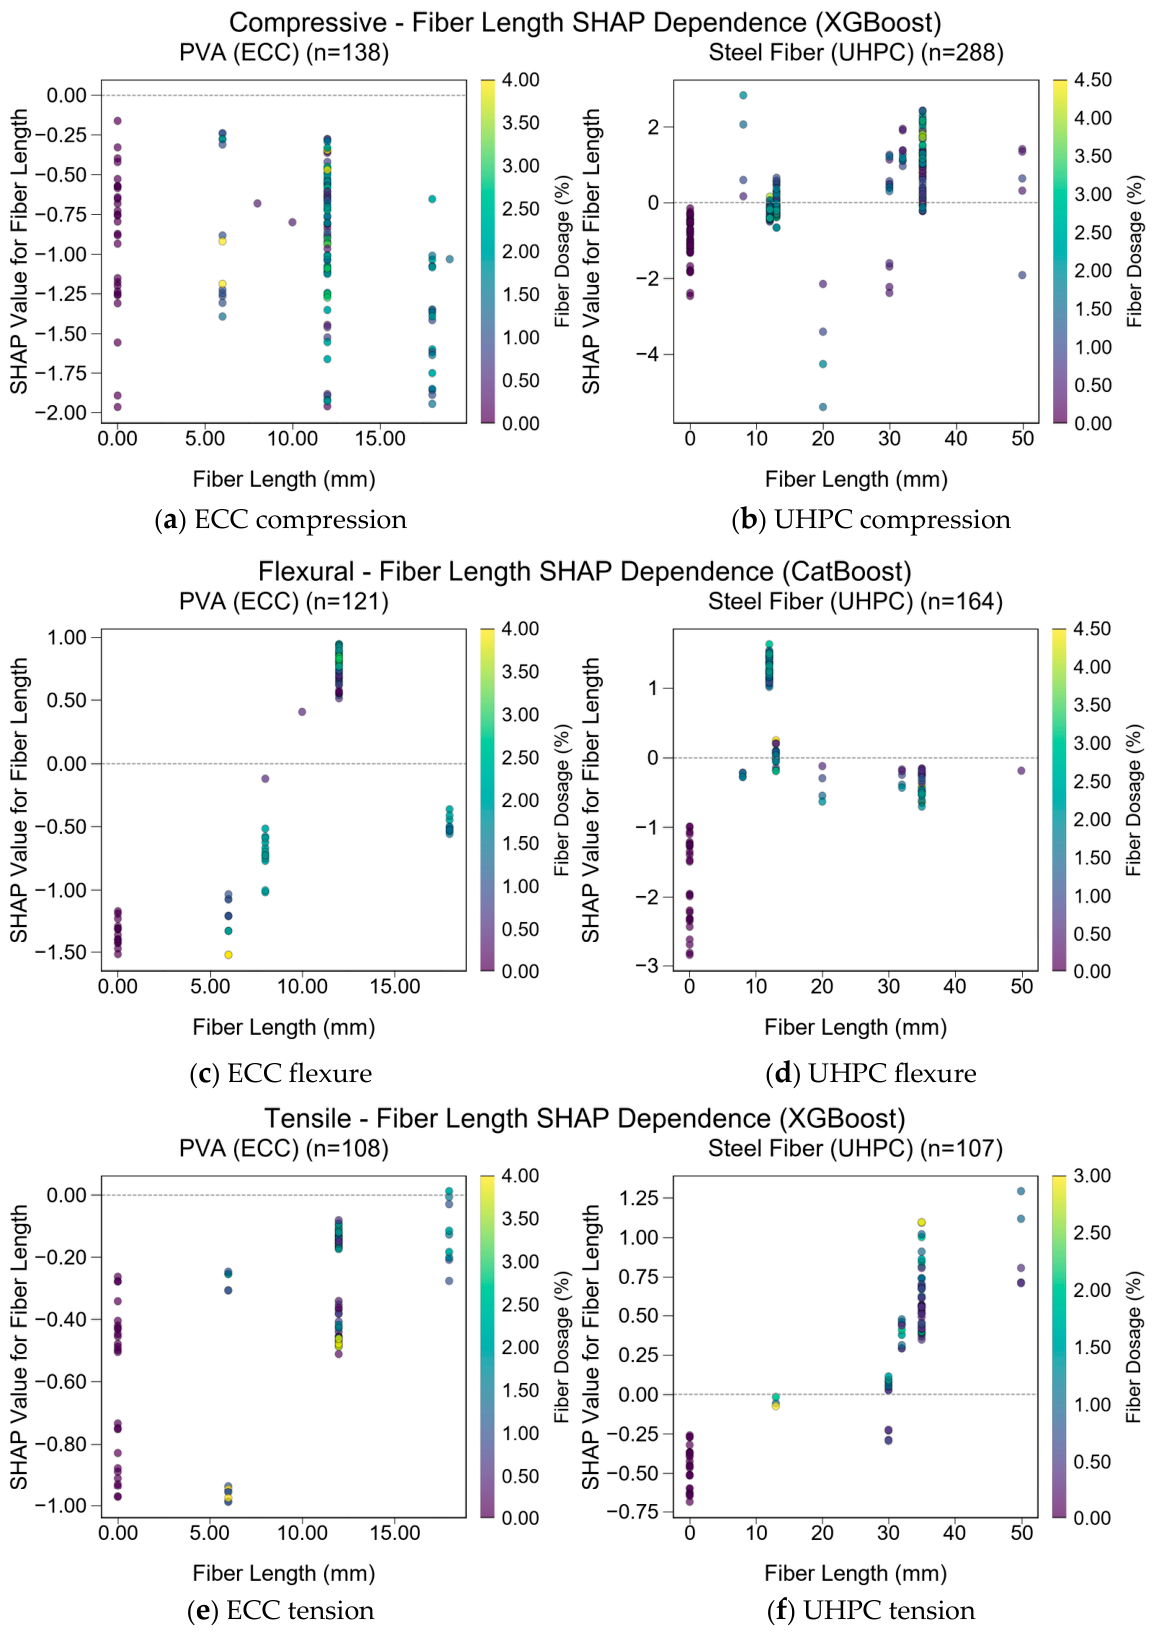
Figure 11 uses the zero-fiber reference defined earlier in this section. For ECC compression, short PVA fibers (≤8 mm) and intermediate fibers (8–15 mm) had mixed relative contributions at most dosages, averaging near zero. Long fibers (15–25 mm) had negative relative means of −0.64 to −0.36 across dosage intervals. The negative association initially increased and then weakened slightly with dosage. Steel fibers predominantly showed positive relative means of 0.75–2.46. For intermediate steel fibers (15–40 mm), the positive association increased with dosage within the investigated range; this trend is not extrapolated beyond the sampled data.
Figure 11.
Fiber length dependence plots colored by fiber dosage. Relative effects discussed in the text use the zero-fiber mean as a reference.
For ECC flexure, intermediate PVA fibers (8–15 mm, predominantly 12 mm) had positive relative means of 1.71–2.17 at approximately 1.5–2% fiber dosage. Short fibers were weakly positive only at low dosage and negative above 3%; long fibers were less positive than intermediate fibers. Short steel fibers (0–15 mm) had positive means of 1.85–2.84, peaking at 1.5–2%, whereas intermediate and long steel-fiber contributions declined with dosage. Thus, 12 mm PVA fibers at 1.5–2% and short steel fibers at 1.5–2% are candidate ranges for flexural-oriented screening within these data.
For tension, positive SHAP associations for PVA fibers increased with length. Short-fiber effects were inconsistent. Intermediate fibers (8–15 mm) were positive and generally improved with dosage, with positive associations at 2–3% fiber dosage; longer fibers were more positive. Intermediate steel fibers (15–40 mm) and long steel fibers (40–100 mm) had positive contributions increasing with dosage within the investigated range. The reported analysis suggests examining PVA fibers of 12 mm or longer at 2–3% for ECC and intermediate-to-long steel fibers for UHPC tensile targets. These descriptions retain the reported bin limits; unsupported or sparsely represented intervals require verification before guiding selection.
4.2. Strength-Prediction Interface
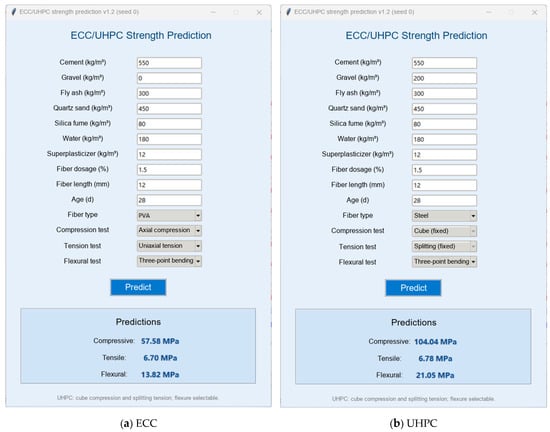
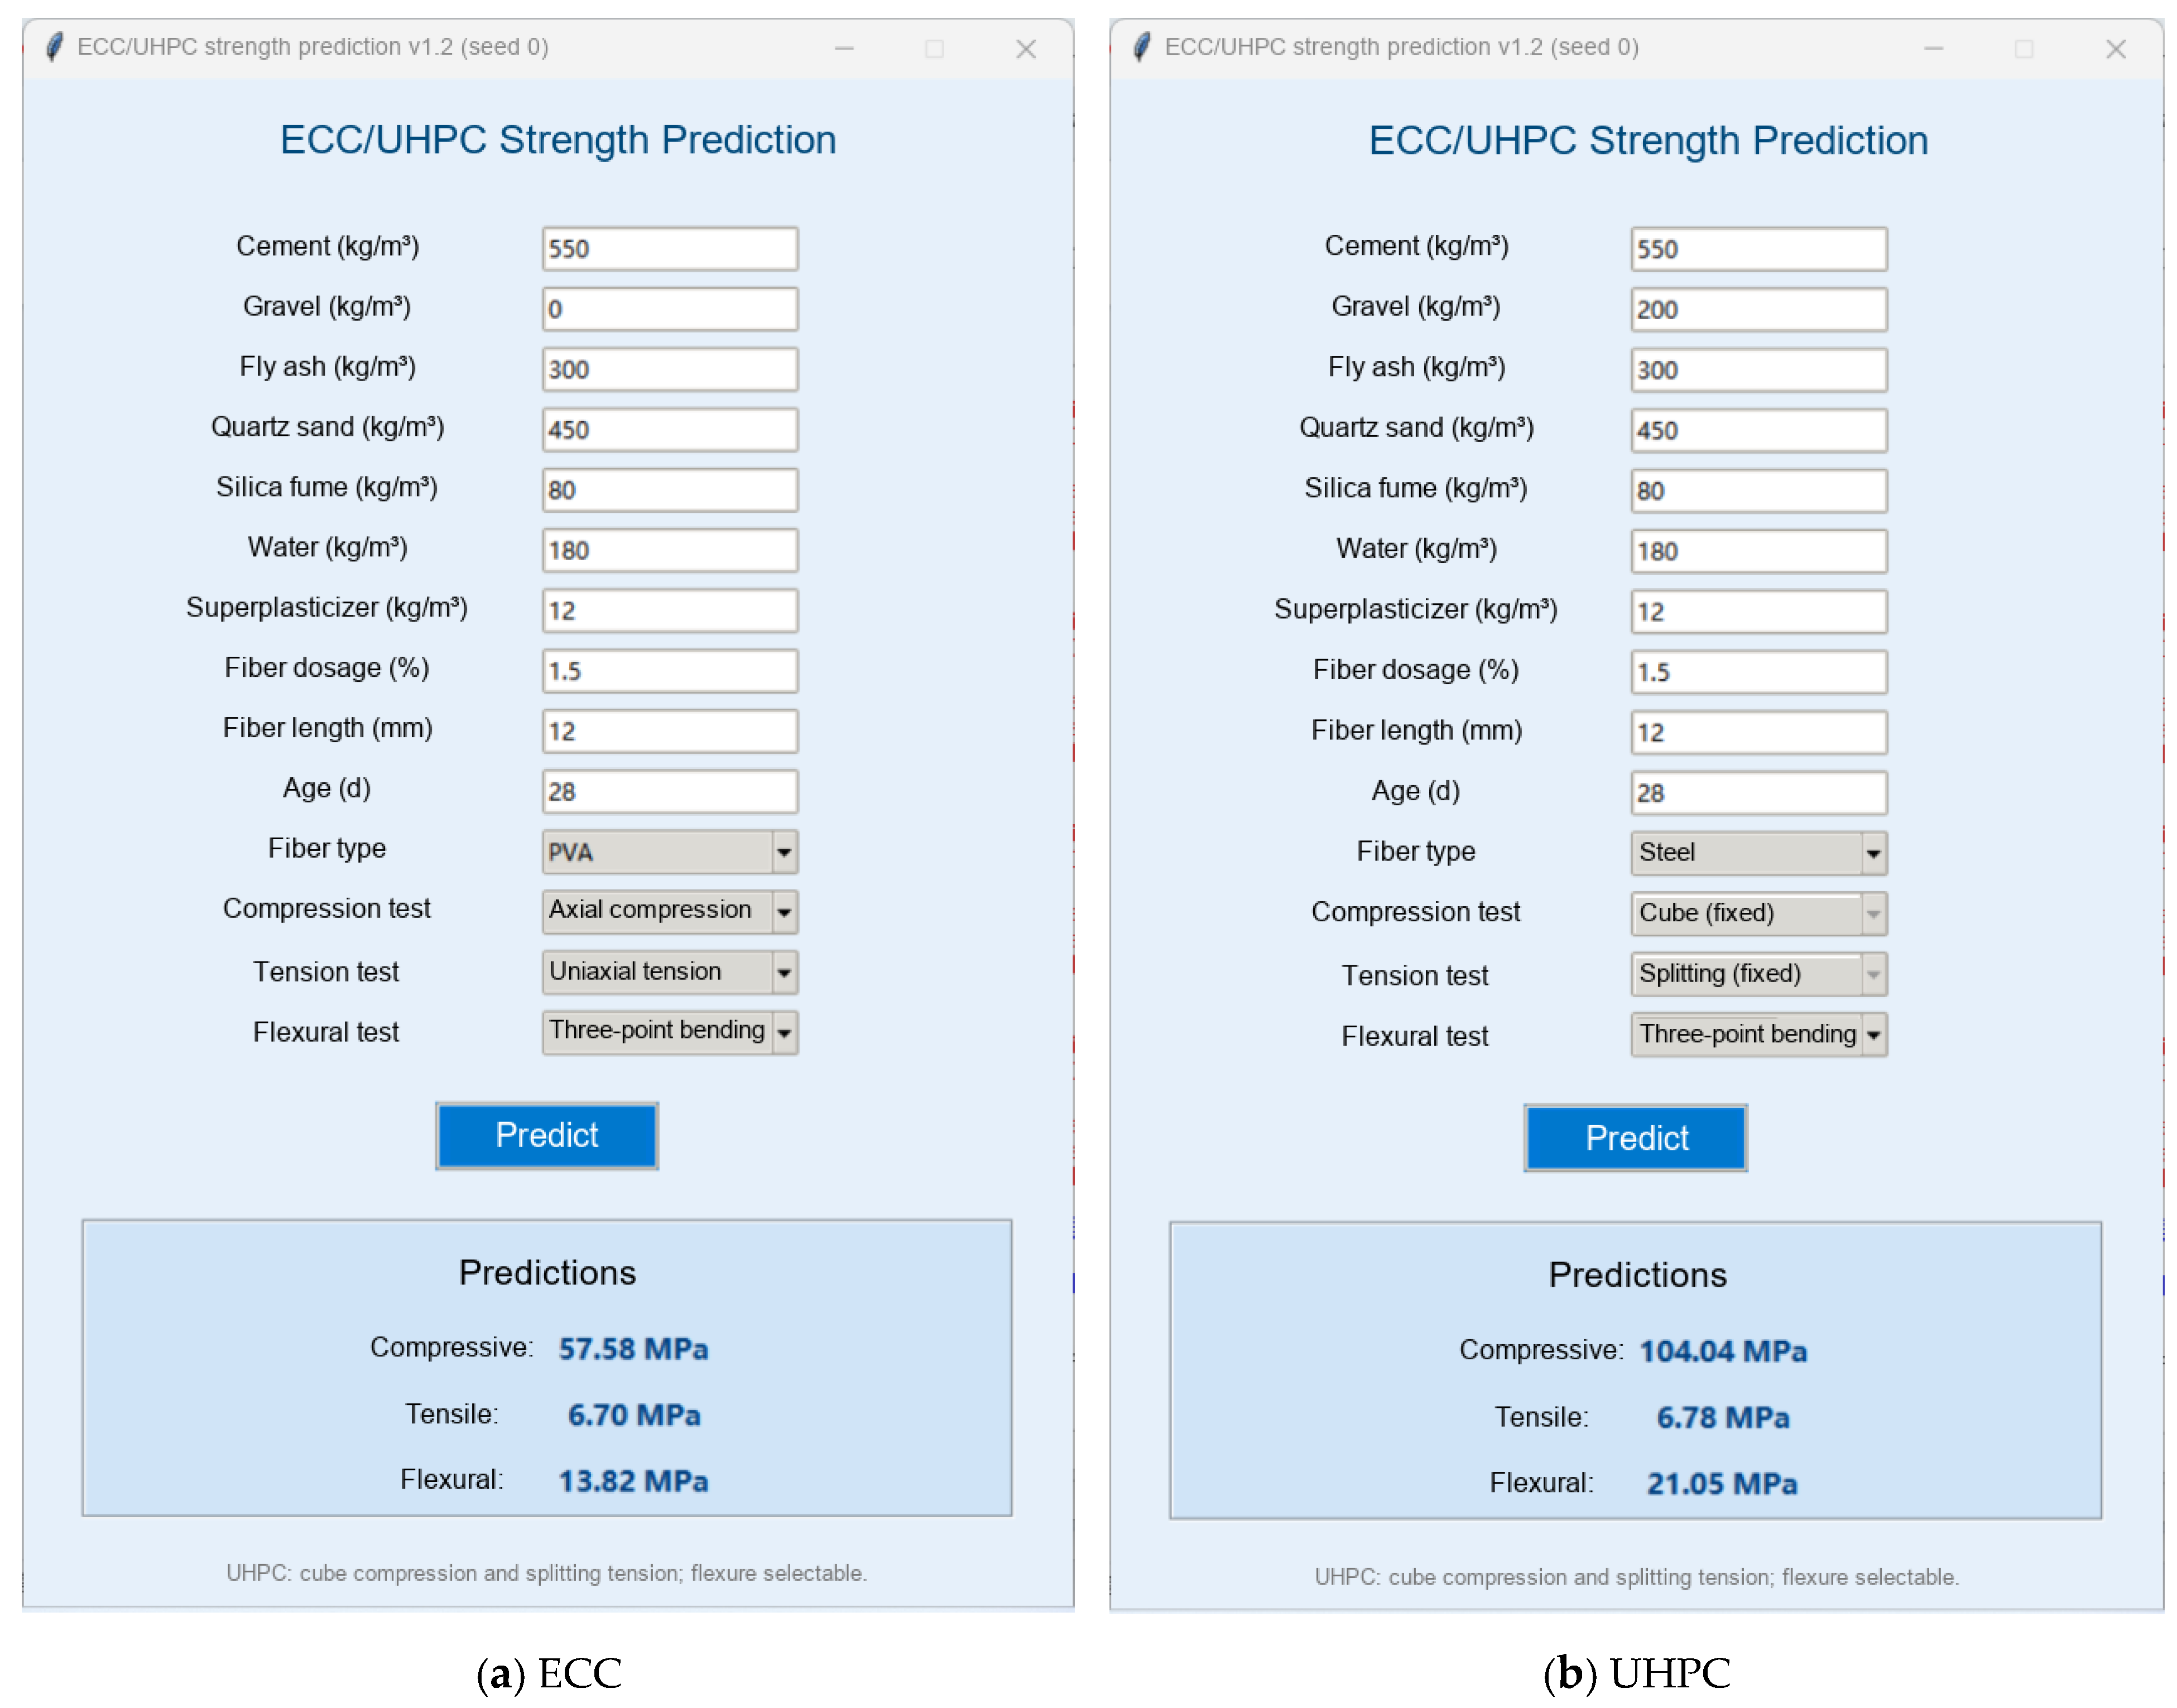
The trained models were serialized using joblib and integrated into a Python Tkinter GUI (Figure 12). The fiber-type selection switches between the compiled ECC/PVA and UHPC/steel groups. Ten numerical inputs are supplied: cement, gravel, fly ash, quartz sand, silica fume, water, superplasticizer, fiber dosage, fiber length, and age. The interface returns the three predicted strengths.
Figure 12.
Strength prediction interface. Displayed strengths are model predictions.
The ECC interface permits axial or cube compression, uniaxial or splitting tension, and three-point or four-point bending. In the UHPC interface, the compression test is fixed to cube testing and the tension test to splitting because training data from axial-compression and uniaxial-tension tests are absent; the flexural-test selection remains available. The GUI supports preliminary assessment, but an available input field does not establish training-data coverage for every combination.
4.3. Mix Design Optimization
The strength predictors were coupled with the nondominated sorting genetic algorithm II (NSGA-II) [29]. Optimization seeks mixtures whose predicted compressive, tensile, and flexural strengths approach user-defined targets. Weights adjust the priority of the three deviations. Nine mixture variables, including cement, fly ash, and fiber dosage, were optimized; age and test configuration were specified through the interface. Material-specific bounds were derived from collected data, with total mass and water-to-cement ratio constraints. Comparable concrete-mixture studies have coupled machine-learning predictors with metaheuristic multiobjective optimization to balance strength with workability, cost, or material-efficiency criteria [27,30,31].
NSGA-II uses nondominated sorting and elitist evolution to search for candidate trade-offs. Crossover and mutation expressions are given in Equations (9)–(14). Here, p1,k and p2,k are selected generation-k individuals; p1,k + 1 and p2,k + 1 are offspring; β is the crossover factor; u is random in [0, 1); η is the crossover distribution index; upper and lower bounds define the variable domain; r is uniform in [0, 1]; and ηm is the mutation distribution index.
A candidate nearest to the ideal reference point in Euclidean distance was selected from the computed trade-off set. This search does not guarantee a global optimum. Table 7 lists the optimization bounds. The ECC maximum water-to-cement ratio excludes two extreme records with ratios greater than 1. Minimum fiber dosages exclude zero-fiber groups for both materials, although those records remain in the prediction database. UHPC optimization uses its own bounds and constraints.
Table 7.
Lower and upper bounds used for mix design optimization.
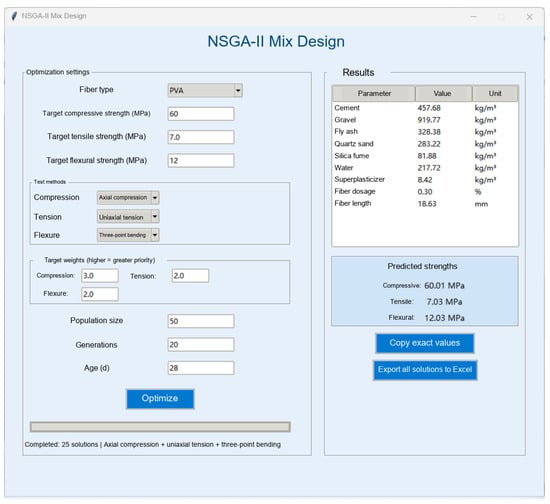
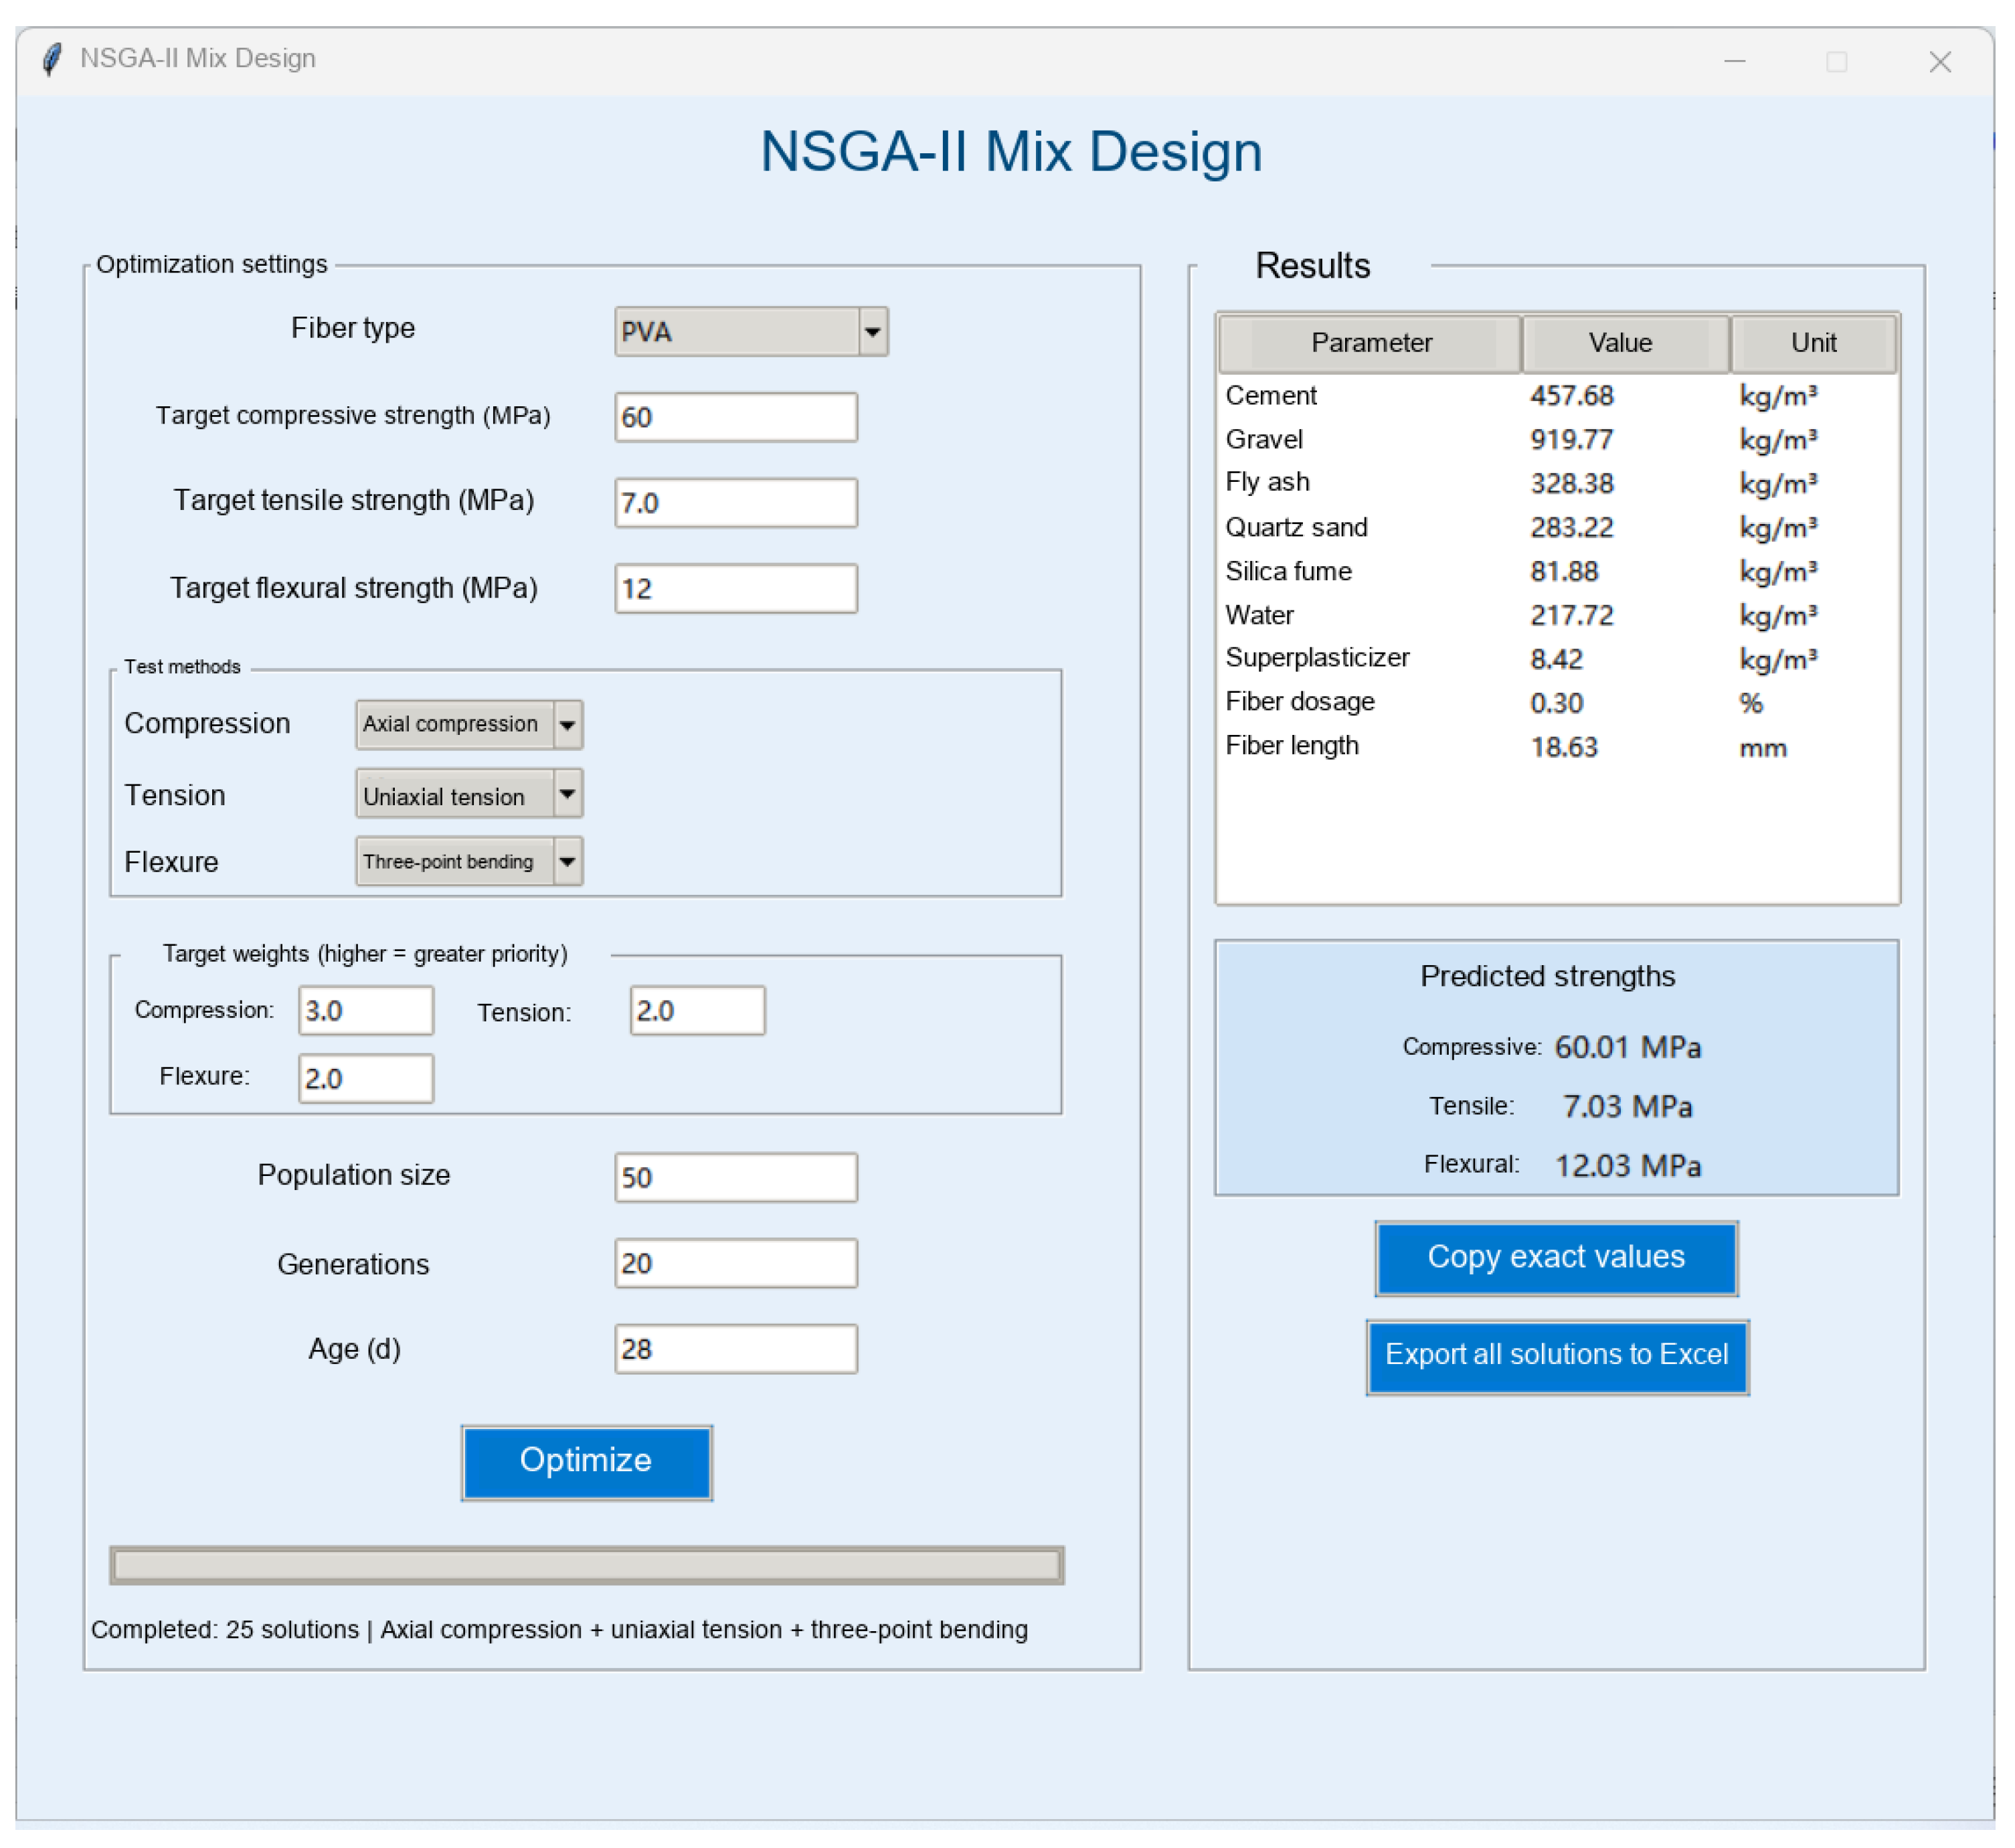
The optimization interface accepts age, fiber type, strength targets, weights, and test methods (Figure 13). The search for each material applies the corresponding bounds and constraints. The interface displays a selected candidate and its predicted strengths and permits export of computed solutions. These outputs are predictions, not measurements of newly manufactured specimens. Reduced trial effort is a potential benefit that was not quantified prospectively here. The candidate shown in Figure 13 is a model prediction rather than a measured strength, so the accuracy of its predicted values is best characterized by the measured-versus-predicted agreement of the underlying models (test R2 of 0.97, 0.93 and 0.97 for compressive, tensile and flexural strength) and by the scatter of the source database. The recommended mixture is therefore a screening outcome rather than a verified strength value, and confirming it by casting and testing specimens is the natural next step in this line of work.
Figure 13.
NSGA-II mix design interface and an illustrative model-predicted candidate.
5. Conclusions and Future Work
5.1. Conclusions
A literature-based workflow combines ECC/UHPC strength prediction, SHAP interpretation, and constrained NSGA-II mix design. The following findings apply within the investigated domain.
The database contains 553 records: 247 ECC and 306 UHPC. IQR screening retained 222 ECC and 292 UHPC records. Fourteen inputs and three responses were considered, with one-hot encoding of fiber and test categories.
Seven algorithms were compared using six metrics averaged over 50 MCCV repetitions. Tree-boosting models gave the most accurate predictions, and the selected algorithm differed by response: XGBoost for compressive and tensile strength and CatBoost for flexural strength, as detailed in Section 3.2.
Seed-0 SHAP analysis showed material- and response-dependent rankings and nonlinear associations. Silica fume, cement, and fiber characteristics were prominent. These provide model-based screening guidance, not proven causal effects or universal dosage optima.
The predictors were deployed in a Tkinter GUI and coupled to NSGA-II under database-derived bounds and constraints. The system generates candidate formulations against three strength targets. Independent experiments and complete data and implementation documentation remain necessary before these candidates can be treated as verified engineering designs. The framework also offers a sustainability benefit: it can reduce the number of trial batches needed during mix design, thereby lowering material consumption and the associated embodied emissions. Realizing this benefit, however, still requires experimental verification of the optimized candidates.
5.2. Future Work
The database contains heterogeneous literature measurements. Encoding test methods cannot fully account for curing, geometry, raw-material chemistry, or mixing. Grouping by fiber type and retaining zero-fiber formulations means ECC/UHPC labels describe the compiled formulation groups; they do not independently verify ECC strain-hardening behavior or compliance with a specific UHPC strength criterion. The database is built on mono-fiber formulations by design: training on single-fiber systems gives a focused, well-defined input space, which makes the reported dependencies more targeted and more interpretable, and extending the schema to hybrid systems, with a descriptor for each fiber component and its combination ratio, is the natural next stage of this work. Predicted strengths are conditional on the test method selected, since the tension and flexural configurations enter as categorical inputs, and they reproduce the mean trends reported in the source studies, so batch-to-batch scatter is a question for repeated casting rather than for this dataset.
Random-split evaluation should be supplemented by study-level validation that separates entire source studies between training and test sets, with preprocessing fitted within each training split. This would address source dependence and possible leakage. Full reproducibility also requires the train–test fraction, model-fitting treatment of missing values, software versions, metric definitions, and complete optimization settings.
SHAP captures learned associations, and correlated constituent quantities can share attribution. Observed ranges should not be extrapolated to unrepresented mixtures. Individual variable bounds do not ensure coverage of every joint composition; candidate mixtures require feasibility checks and experimental testing.
Further work should include freeze–thaw resistance, permeability, chloride resistance, slump, and flow spread, alongside strength. Additional raw-material, curing, and processing variables would improve coverage. Cost and embodied carbon could be added as objectives. Representative optimized mixtures should be manufactured and tested in compression, tension, and flexure to compare predicted and measured results. Extending the database to hybrid fiber systems and to explicit specimen sizes are the most valuable directions for follow-up work.
Author Contributions
Conceptualization, W.-W.W.; methodology, W.-W.W.; software, X.Y. and X.W.; investigation, J.L., X.Y., X.W.; resources, W.-W.W.; data curation., J.L., X.W., X.Y.; writing—original draft preparation, W.-W.W.; writing—review and editing, W.-W.W. and J.L.; supervision, W.-W.W.; project administration, W.-W.W.; funding acquisition, W.-W.W. All authors have read and agreed to the published version of the manuscript.
Funding
This research received no external funding.
Institutional Review Board Statement
Not applicable.
Informed Consent Statement
Not applicable.
Data Availability Statement
The datasets analyzed during the current study are available from the corresponding authors on reasonable request.
Conflicts of Interest
The authors declare no conflicts of interest.
Abbreviations
ECC, engineered cementitious composite; UHPC, ultra-high-performance concrete; PVA, polyvinyl alcohol; FRP, fiber-reinforced polymer; ML, machine learning; MLR, multiple linear regression; KNN, k-nearest neighbors; SVR, support vector regression; XGBoost, extreme gradient boosting; SHAP, SHapley additive exPlanations; MCCV, Monte Carlo cross-validation; NSGA-II, non-dominated sorting genetic algorithm II; GUI, graphical user interface; IQR, interquartile range; R2, coefficient of determination; RMSE, root mean square error; MAPE, mean absolute percentage error; RRSE, root relative squared error; RAE, relative absolute error; SI, scatter index.
References
- Li, V.C. High-performance and multifunctional cement-based composite material. Engineering 2019, 5, 250–260. [Google Scholar] [CrossRef] [Scilit]
- Shi, C.; Wu, Z.; Xiao, J.; Wang, D.; Huang, Z.; Fang, Z. A review on ultra high performance concrete: Part I. Raw materials and mixture design. Constr. Build. Mater. 2015, 101, 741–751. [Google Scholar] [CrossRef] [Scilit]
- Huang, B.; Gong, M.Z.; Pan, A.X.; Rao, X.; Wang, T.; Chen, C. Influences of water reducing agent and steel fiber on rheological and mechanical properties of ultra-high performance concrete. Bull. Chin. Ceram. Soc. 2024, 43, 3214–3223. (In Chinese) [Google Scholar]
- Li, V.C. On engineered cementitious composites (ECC): A review of the material and its applications. J. Adv. Concr. Technol. 2003, 1, 215–230. [Google Scholar] [CrossRef] [Scilit]
- Gao, S.L.; Shi, H.F.; Wang, H.C.; Liu, L.L.; Zhang, Y.W.; Dong, J.L. Effects of age and material constituents on the cube compressive strength of ECC. China Concr. Cem. Prod. 2014, 6, 46–49. (In Chinese) [Google Scholar]
- Kewalramani, M.; Mahmoodzadeh, A.; El Ouni, M.H.; Alghamdi, A.; Ahmed, A.; Albaijan, I.; Palani, S.; Hassan, R. Machine learning-based prediction of residual flexural strength in fiber-reinforced ultra-high-performance concrete under elevated temperatures. Sci. Rep. 2026, 16, 16559. [Google Scholar] [CrossRef] [Scilit] [PubMed]
- Ben Chaabene, W.; Flah, M.; Nehdi, M.L. Machine learning prediction of mechanical properties of concrete: Critical review. Constr. Build. Mater. 2020, 260, 119889. [Google Scholar] [CrossRef] [Scilit]
- Gamil, Y. Machine learning in concrete technology: A review of current researches, trends, and applications. Front. Built Environ. 2023, 9, 1145591. [Google Scholar] [CrossRef] [Scilit]
- Abuodeh, O.R.; Abdalla, J.A.; Hawileh, R.A. Assessment of compressive strength of Ultra-high Performance Concrete using deep machine learning techniques. Appl. Soft Comput. 2020, 95, 106552. [Google Scholar] [CrossRef] [Scilit]
- Kashem, A.; Karim, R.; Malo, S.C.; Das, P.; Datta, S.D.; Alharthai, M. Hybrid data-driven approaches to predicting the compressive strength of ultra-high-performance concrete using SHAP and PDP analyses. Case Stud. Constr. Mater. 2024, 20, e02991. [Google Scholar] [CrossRef] [Scilit]
- Bolbolvand, M.; Tavakkoli, S.M.; Alaee, F.J. Prediction of compressive and flexural strengths of ultra-high-performance concrete (UHPC) using machine learning for various fiber types. Constr. Build. Mater. 2025, 493, 143135. [Google Scholar] [CrossRef] [Scilit]
- Nguyen, N.-H.; Abellán-García, J.; Lee, S.; Vo, T.P. From machine learning to semi-empirical formulas for estimating compressive strength of Ultra-High Performance Concrete. Expert Syst. Appl. 2024, 237, 121456. [Google Scholar] [CrossRef] [Scilit]
- He, Y.; Gao, S.; Li, Y.; Guan, Y.; Zhang, J.; Hu, D. Adaptive machine learning framework: Predicting UHPC performance from data to modelling. Results Eng. 2025, 27, 106724. [Google Scholar] [CrossRef] [Scilit]
- Liu, X.; Wang, W.-W.; Tang, Y.-X.; Guo, K.; Zhou, C. Explainable machine learning driven axial strength investigation of FRP tube infilled with UHPC. Structures 2026, 85, 111126. [Google Scholar] [CrossRef] [Scilit]
- Ahmad, A.; Ostrowski, K.A.; Maslak, M.; Farooq, F.; Mehmood, I.; Nafees, A. Comparative study of supervised machine learning algorithms for predicting the compressive strength of concrete at high temperature. Materials 2021, 14, 4222. [Google Scholar] [CrossRef] [Scilit] [PubMed]
- Song, H.; Ahmad, A.; Farooq, F.; Ostrowski, K.A.; Maslak, M.; Czarnecki, S.; Aslam, F. Predicting the compressive strength of concrete with fly ash admixture using machine learning algorithms. Constr. Build. Mater. 2021, 308, 125021. [Google Scholar] [CrossRef] [Scilit]
- Chen, W.; Fediuk, R.; Yu, J.; Nikolayevich, K.; Vatin, N.; Bazarov, D.; Yu, K. Performance prediction and analysis of engineered cementitious composites based on machine learning. Dev. Built Environ. 2024, 18, 100459. [Google Scholar] [CrossRef] [Scilit]
- Lu, T.; Liu, X. Prediction and interpretability analysis of ECC tensile strength based on boosting algorithms. Technol. Mark. 2026, 33, 7–12. (In Chinese) [Google Scholar]
- Abdulrahman, S.; Bashir, A.; Farouk, A.I.B.; Haruna, S.I.; Haruna, A.; Abba, S.I. Hybrid-optimized ensemble learning models and GUI for predicting compressive strength of fly ash and slag concrete. Mater. Today Commun. 2025, 49, 113762. [Google Scholar] [CrossRef] [Scilit]
- Ly, H.-B. An interpretable machine learning-based measurement system for predicting the compressive strength of concrete at elevated temperatures. Measurement 2026, 264, 120273. [Google Scholar] [CrossRef] [Scilit]
- Székely, G.J.; Rizzo, M.L.; Bakirov, N.K. Measuring and testing dependence by correlation of distances. Ann. Stat. 2007, 35, 2769–2794. [Google Scholar] [CrossRef] [Scilit]
- Chen, T.; Guestrin, C. XGBoost: A scalable tree boosting system. In Proceedings of the 22nd ACM SIGKDD International Conference on Knowledge Discovery and Data Mining, San Francisco, CA, USA, 13–17 August 2016; pp. 785–794. [Google Scholar] [CrossRef] [Scilit]
- Prokhorenkova, L.; Gusev, G.; Vorobev, A.; Dorogush, A.V.; Gulin, A. CatBoost: Unbiased boosting with categorical features. In Advances in Neural Information Processing Systems 31; Curran Associates Inc.: Red Hook, NY, USA, 2018; pp. 6638–6648. [Google Scholar]
- Lundberg, S.M.; Lee, S.-I. A unified approach to interpreting model predictions. In Advances in Neural Information Processing Systems 30; Curran Associates Inc.: Red Hook, NY, USA, 2017; pp. 4765–4774. [Google Scholar]
- Ekanayake, I.U.; Meddage, D.P.P.; Rathnayake, U. A novel approach to explain the black-box nature of machine learning in compressive strength predictions of concrete using Shapley additive explanations (SHAP). Case Stud. Constr. Mater. 2022, 16, e01059. [Google Scholar] [CrossRef] [Scilit]
- Mangalathu, S.; Hwang, S.-H.; Jeon, J.-S. Failure mode and effects analysis of RC members based on machine-learning-based SHapley Additive exPlanations (SHAP) approach. Eng. Struct. 2020, 219, 110927. [Google Scholar] [CrossRef] [Scilit]
- Huang, Q.; Tang, Y.; Wang, W.-W.; He, C.; Wu, Z.; Cheng, Y. Design of aerogel-incorporated concrete based on machine learning and multi-objective optimization. Eng. Appl. Artif. Intell. 2026, 183, 116246. [Google Scholar] [CrossRef] [Scilit]
- Lundberg, S.M.; Erion, G.; Chen, H.; DeGrave, A.; Prutkin, J.M.; Nair, B.; Katz, R.; Himmelfarb, J.; Bansal, N.; Lee, S.-I. From local explanations to global understanding with explainable AI for trees. Nat. Mach. Intell. 2020, 2, 56–67. [Google Scholar] [CrossRef] [Scilit] [PubMed]
- Deb, K.; Pratap, A.; Agarwal, S.; Meyarivan, T. A fast and elitist multiobjective genetic algorithm: NSGA-II. IEEE Trans. Evol. Comput. 2002, 6, 182–197. [Google Scholar] [CrossRef] [Scilit]
- Zhang, J.; Huang, Y.; Wang, Y.; Ma, G. Multi-objective optimization of concrete mixture proportions using machine learning and metaheuristic algorithms. Constr. Build. Mater. 2020, 253, 119208. [Google Scholar] [CrossRef] [Scilit]
- Zheng, W.; Shui, Z.; Xu, Z.; Gao, X.; Zhang, S. Multi-objective optimization of concrete mix design based on machine learning. J. Build. Eng. 2023, 76, 107396. [Google Scholar] [CrossRef] [Scilit]

Disclaimer/Publisher’s Note: The statements, opinions and data contained in all publications are solely those of the individual author(s) and contributor(s) and not of MDPI and/or the editor(s). MDPI and/or the editor(s) disclaim responsibility for any injury to people or property resulting from any ideas, methods, instructions or products referred to in the content. |
© 2026 by the authors. Licensee MDPI, Basel, Switzerland. This article is an open access article distributed under the terms and conditions of the Creative Commons Attribution (CC BY) license.