


Abstract
Railways are the backbone of low-carbon tourism mobility, yet in peripheral European destinations, the condition and safety record of the network often lag behind visitors’ expectations. This study examines how the perceived quality and safety of railway infrastructure shape sustainable tourism development in Montenegro, whose railway network comprises 250 km of open-line track—dominated by the mountainous Vrbnica–Bar section of the Belgrade–Bar line—and is the only corridor linking the saturated Adriatic coast with the under-visited north. Drawing on the transport–tourism nexus, service-quality theory and the expectancy–disconfirmation paradigm, we model infrastructure quality, perceived safety, service reliability and rail-based accessibility as antecedents of satisfaction with the rail experience, which in turn is related to sustainable tourism behavioural intentions directly and, through the perceived contribution of rail, to sustainable destination development. The model was tested with covariance-based structural equation modelling on an intercept survey of 487 rail travellers (summer 2025), complemented by an importance–performance analysis of twelve attributes and by a multigroup comparison of regional and other international visitors for which measurement invariance was established. All ten hypothesised paths were supported: infrastructure quality was the strongest correlate of perceived safety (β = 0.58; R2 = 0.34); reliability, quality, safety and accessibility explained 58% of the variance in satisfaction; and satisfaction, safety and the perceived sustainability contribution explained 59% of the variance in intentions, with the entirely indirect effect of infrastructure quality on intentions (0.45) estimated within the latent model by bootstrap. In a metric-invariant two-group model, perceived safety weighed more heavily on the intentions of visitors from outside the region and satisfaction on those of regional visitors. Because the design is cross-sectional and based on self-reports, the results describe associations consistent with the hypothesised ordering rather than demonstrated causal effects. Track condition, punctuality and journey time fall in the “concentrate here” quadrant. The findings link the EU-accession agenda on railway safety and interoperability to the destination goal of dispersing tourism flows, and offer prioritisation guidance for the rehabilitation of the Vrbnica–Bar line and the renewal of the passenger fleet.
1. Introduction
Transport is not merely the means by which tourists reach a destination; it is a constitutive element of the destination product and a pre-condition for the spatial and seasonal distribution of tourism benefits [1,2,3]. The empirical literature on the transport–tourism nexus consistently shows that transport infrastructure is a significant determinant of international tourism demand, with elasticities comparable to those of income and relative prices [4,5].
At the same time, tourism-related transport accounts for the largest share of the sector’s carbon footprint [6,7,8], which has moved rail—by far the least carbon-intensive motorised mode per passenger-kilometre [9]—to the centre of European sustainable mobility and tourism policy [10,11,12]. The revised guidelines for the trans-European transport network (TEN-T) explicitly extend the core and extended core networks to the Western Balkans, and the Treaty establishing the Transport Community obliges the region’s economies to converge on the EU railway acquis in matters of safety, interoperability and market opening [13,14].
Montenegro offers an unusually sharp case for studying this relationship. It is a small, tourism-dependent economy in which 2.73 million tourist arrivals and 15.4 million overnight stays were recorded in 2025, of which 95.8% were generated by foreign visitors and 92.6% were concentrated in seaside resorts [15]. The extreme spatial and seasonal concentration of demand on a narrow Adriatic strip has long been identified as the principal sustainability challenge of Montenegrin tourism [16,17,18]. The country’s railway network, by contrast, runs perpendicular to the coast: the 167 km Vrbnica–Bar section of the Belgrade–Bar line climbs from sea level at the Port of Bar to 1032 m at Kolašin before reaching the northern towns of Mojkovac and Bijelo Polje and the Serbian border [19,20]. Together with the 56 km Podgorica–Nikšić branch, it is the only transport corridor that links the coast, the capital and the mountainous north—the very regions the national tourism strategy seeks to activate in order to relieve pressure on the littoral [17].
Yet the network is also a textbook example of a legacy infrastructure whose quality and safety have eroded: decades of underinvestment have reduced permitted speeds to about 70 km/h on much of the route, the 2006 Bioče derailment remains a durable anchor of public risk perception, and annual ridership is among the lowest in Europe [19,20,21,22,23,24]. The sector is nevertheless entering a period of visible change, with the rehabilitation of the Vrbnica–Bar line under way, a new railway safety and interoperability framework in force since 2026 and the first new passenger fleet in decades on order [19,25,26,27,28,29]. Section 3 describes this context in detail.
Despite the salience of these issues, the academic literature on railways and tourism is dominated by studies of high-speed rail in Spain, France, Italy, China and Japan [30,31,32,33,34] and by heritage and scenic railway tourism in mature markets [35,36,37], while the literature on tourism and public transport at destinations has concentrated on urban and rural bus, tram and metro systems rather than on interregional rail [38,39]. Very little is known about how the perceived quality and safety of conventional, low-speed, mountainous railway infrastructure in a transition economy influence tourists’ satisfaction, their willingness to travel by rail again and their assessment of rail as a contributor to sustainable destination development. This is a substantive gap, because the policy case for railway rehabilitation in peripheral destinations rests on the assumption that investment in track, rolling stock and safety systems will translate into modal shift, spatial dispersal of visitors and extension of the season [40,41]—an assumption that has rarely been tested at the level of tourist behaviour.
This paper addresses the gap by developing and testing a structural model of the relationships between the perceived quality and safety of railway infrastructure and the sustainable tourism intentions of rail travellers in Montenegro. Specifically, the study pursues four objectives: (1) to conceptualise and measure railway infrastructure quality, perceived safety, service reliability and rail-based accessibility as distinct antecedents of the tourist rail experience; (2) to estimate their direct and indirect effects on satisfaction, on the perceived contribution of rail to sustainable destination development and on sustainable tourism behavioural intentions; (3) to test whether these effects differ between visitors from the immediate region and other international visitors; and (4) to translate the results into prioritisation guidance for infrastructure managers and destination management organisations through an importance–performance analysis (IPA) of twelve concrete attributes.
The empirical basis is an intercept survey of 487 rail travellers conducted at Bar, Podgorica, Bijelo Polje and Kolašin stations and on board Bar–Bijelo Polje and Belgrade–Bar trains during the 2025 summer season.
The remainder of the paper is organised as follows. Section 2 reviews the literature on the transport–tourism nexus, sustainable mobility, railway service quality, perceived safety and sustainable behavioural intentions. Section 3 describes the research context: the Montenegrin railway system, its safety record and regulatory reform, and the structure of tourism demand. Section 4 presents the conceptual model and hypotheses, the research design, the instrument, sampling and the analytical procedures. Section 5 reports the measurement and structural model results, the mediation, measurement-invariance and multigroup analyses and the IPA. Section 6 discusses the findings, their managerial and policy implications, limitations and directions for future research, and Section 7 concludes.
2. Literature Review
2.1. The Transport–Tourism Nexus and Infrastructure as a Development Driver
The proposition that transport shapes destination development has a long lineage in tourism geography and transport economics. Prideaux [1] argued that the capacity, cost and quality of the transport system set an upper bound on the growth trajectory of a destination, while Hall [42] drew attention to the distributional and externality issues that arise when tourism transport is planned without regard to residents. Subsequent syntheses have treated transport as inseparable from tourism—as a source of experience in its own right and as a lever for sustainability [2,3,43]. Macro-econometric evidence corroborates the micro-level argument: using gravity models for Mauritius and for a panel of countries, Khadaroo and Seetanah [4,5] showed that transport infrastructure is a robust determinant of tourist arrivals, with land-transport infrastructure mattering most for intra-regional flows. A recent global panel analysis of 132 countries confirms that railway development continues to shape the spatial distribution of international tourists and strengthens the convergence of tourism flows across destinations [44].
This literature connects to the broader debate on infrastructure and economic performance, in which public capital is found to be productive [45] but in which the wider economic benefits of transport investment materialise only under specific conditions of accessibility, agglomeration and complementary policy [46,47,48]. Accessibility—the ease with which destinations can be reached [49]—is the mechanism that links the two debates, and a series of studies on high-speed rail (HSR) has examined whether improved accessibility translates into tourism growth. Evidence from Spain suggests modest increases in arrivals and stronger effects on day trips and on the distribution rather than the volume of demand [30,31,50,51]; French and Italian studies emphasise the role of destination attractiveness and of complementary local policies [33,52,53,54]; and Chinese studies document positive but heterogeneous effects across provinces and market segments [32,34,55,56]; tree-based models have also been used to identify which tourist profiles are most responsive to HSR access [57]. Recent work also shows that rail connectivity can moderate seasonality by lowering the cost of short off-peak trips [58]. Reviews of HSR caution, however, that the conditions under which such investments are justified are demanding [59,60], and the transferability of HSR findings to conventional networks in small economies is limited.
For destinations in which the railway is a conventional, single-track, mixed-traffic line, three other strands are more directly relevant. First, the research on tourists’ use of public transport at destinations shows that visitors are more sensitive than residents to information, legibility, integration and perceived reliability, and that public transport performance affects overall destination satisfaction [38,61,62,63,64]. Second, studies of scheduled bus and branch-line rail services in rural areas show that well-designed services can meet tourism objectives, particularly for car-free and “slow travel” segments [37,65,66,67,68]; slow tourism, which values the journey as part of the experience, has recently been conceptualised as a distinct market in small European countries [69]. Third, the railway can itself be an attraction: scenic and heritage railways, station architecture and rail journeys feature prominently in tourism products from Tibet to Singapore and France [35,36,70,71], and a systematic review of 56 studies on railways and tourism concludes that the environmental-sustainability dimension of rail tourism remains under-researched [72]. Regional evidence from the Western Balkans, although sparse, points in the same direction: improvements in service quality along the Danube corridor have been shown to enlarge cooperation and demand [73,74], the prioritisation and risk assessment of rail projects in Serbia have been approached with multi-criteria tools that weigh tourism and regional-development effects [75,76], and the safety of railway sections in the region has been evaluated with multi-criteria models precisely because the condition of the infrastructure is so heterogeneous [77].
2.2. Railways, Sustainable Mobility and Tourism
The concept of sustainable tourism descends from the Brundtland definition [78] and has been elaborated in tourism studies since the early 1990s [79,80,81,82,83]. Beyond a narrow environmental reading, it embraces the economic viability of the destination, the equitable distribution of benefits across communities and regions, and the temporal spread of activity across the year [84,85,86]. Critical reviews note that research on sustainable tourism has rarely been matched by measurable outcomes, and that the transport component of the tourist trip is the domain in which the gap between rhetoric and impact is widest [8,87,88]. The Sustainable Development Goals give this agenda formal expression through Targets 8.9, 9.1, 11.2 and 12.b, which link resilient infrastructure, sustainable transport and sustainable tourism [89]. The COVID-19 pandemic exposed the vulnerability of transport-dependent destinations and reinforced the case for a transformation of tourism mobility towards lower-carbon modes [90].
Within the sustainable mobility paradigm, rail occupies a privileged position because of its low emissions per passenger-kilometre, its land-use efficiency and its capacity to structure development around stations [9,12,91,92]. The European Green Deal and the Sustainable and Smart Mobility Strategy set explicit targets for shifting traffic to rail, and the TEN-T regulation defines the technical standards—electrification, line speed, ERTMS, interoperability—that a modern passenger railway should meet [10,11,13,93]. For tourism destinations, the sustainability contribution of rail operates through at least four channels: (i) substitution of car and air travel and thus lower emissions and congestion [7,88]; (ii) spatial dispersal of visitors from saturated hubs to peripheral areas, an antidote to overtourism [94,95,96]; (iii) extension of the season through affordable, weather-independent access [58,97,98]; and (iv) support for community wellbeing and resident attitudes, since transport externalities are a frequent source of resident opposition to tourism [42,99,100].
2.3. Infrastructure Quality and Railway Service Quality
Service-quality theory provides the conceptual link between the physical state of the railway and the tourist’s evaluation of it. Perceived quality is defined in the SERVQUAL tradition as the gap between expectations and perceptions across a set of quality dimensions [101,102], whereas the performance-only (SERVPERF) view argues that perceptions alone predict satisfaction and behaviour better [103]. In public transport, this framework has been operationalised in a mature body of research on customer-satisfaction surveys [104,105,106,107], in service-quality indices for contract monitoring [108], in studies of the attributes that attract car users [109,110,111], and in normative standards such as EN 13816, which distinguishes quality dimensions such as availability, accessibility, information, time, customer care, comfort, security and environmental impact [112,113]. Applications to railways have measured quality on the Hellenic railways [114], on Indian station platforms [115] and on New Zealand commuter services using zones of tolerance [116], and have repeatedly identified reliability, comfort, cleanliness and information as the most influential attributes. A recent cross-country analysis confirms that satisfaction mediates the effect of service quality on behavioural intentions across heterogeneous public transport systems [117], IPA has been applied to bus service attributes to set priorities under budget constraints [118], and the pandemic has raised the weight that passengers attach to cleanliness, crowding and hygiene [119]. A recurring finding is the “quality paradox”: supply-side quality improvements are not always reflected in satisfaction because expectations move as well [120].
Two features of this literature are important for the present model. First, infrastructure quality—the condition of track, structures, stations and rolling stock—is analytically distinct from service-quality dimensions such as punctuality and frequency, even though the former constrains the latter: the permitted speed, ride comfort and the probability of temporary speed restrictions on a line are direct functions of track geometry and asset degradation [121,122,123,124,125]. Second, on lines exposed to mountainous terrain and extreme weather, infrastructure quality is also a resilience issue, since landslides, floods and heat all translate into disruption and, ultimately, into the traveller’s experience [126,127,128]. We therefore model perceived infrastructure quality (IQ) and service reliability (SR) as separate constructs, together with rail-based accessibility (AC), which captures whether the railway makes the desired destinations reachable and integrates with buses, airports and the Port of Bar [38,49].
Satisfaction is conceptualised in the expectancy–disconfirmation tradition as a post-consumption evaluation [129] and is a well-established consequence of perceived quality in tourism settings [130,131,132,133]. Applied to the rail journey, satisfaction with the rail experience (SAT) is expected to depend on infrastructure quality, on service reliability and on accessibility; these expectations are formalised as hypotheses H2, H4 and H5 in Section 4.2.
2.4. Railway Safety, Perceived Safety and Tourist Behaviour
Railway safety is governed in the EU by a comprehensive regulatory architecture—the Railway Safety Directive, the Interoperability Directive and the common safety methods and targets administered by the European Union Agency for Railways—which candidate countries are required to transpose [134,135,136]. Fatal train accidents in Europe have declined markedly over the past four decades, and derailments and collisions are increasingly attributable to interactions between degraded infrastructure, rolling stock and organisational factors rather than to single-point failures [22,137,138]. Systems-theoretic and organisational accident models emphasise that safety is an emergent property of the socio-technical system as a whole, including maintenance regimes, regulatory oversight and human factors [139,140,141]. From the tourist’s perspective, however, what matters is perceived safety, and risk perception is known to be driven less by statistical frequencies than by dread, catastrophic potential, memorability and lack of control [142]. A single high-profile disaster such as the Bioče derailment can therefore shape perceptions long after objective safety has improved.
The tourism literature has established that perceived risk and safety are decisive for destination choice, satisfaction and revisit intentions [143,144,145,146,147,148,149,150,151]. Transport safety is one of the salient risk dimensions, and its effect is stronger for unfamiliar, long-haul and first-time visitors than for those who know the destination [146,151]. Research conducted during and after the COVID-19 pandemic has confirmed that perceived risk remains a central predictor of travel behaviour and that it varies systematically with familiarity and market of origin [152,153], and a systematic review of five decades of research shows that personal security at stations and on board—as distinct from technical safety—shapes the willingness to use public transport [154]. We expect perceived safety (PS) on Montenegrin trains to be shaped by the visible condition of infrastructure and rolling stock—the tangible cues from which laypersons infer technical safety—and, in turn, to influence both satisfaction and sustainable behavioural intentions directly, since tourists are unlikely to commit to rail as their future mode of transport if they doubt its safety, regardless of how satisfying a given trip was (hypotheses H1, H3 and H7 in Section 4.2).
2.5. Satisfaction, Perceived Sustainability Contribution and Sustainable Behavioural Intentions
The link from satisfaction to behavioural intentions—revisit, recommendation and willingness to pay—is one of the most replicated relationships in tourism and services marketing [130,131,132,133,155,156]. In the present context, the intentions of interest are sustainable tourism behavioural intentions (SBI): the intention to travel by rail again in Montenegro, to choose rail over car for intra-country trips, to recommend rail travel, to visit inland and northern destinations reachable by rail, and to accept a price premium for low-carbon transport. Such intentions are consistent with attitude–behaviour models in which attitudes formed through experience shape intentions [157,158] and with the literature on pro-environmental consumer behaviour in tourism, which has expanded rapidly since 2020 [159,160]. The satisfaction–intention link is formalised as hypothesis H6.
A further mechanism runs through the tourist’s assessment of the railway’s contribution to sustainable destination development (SDP). Tourists who experience a well-maintained railway are more likely to perceive it as a credible alternative to the car and as a means of opening the interior of the country; and those who are satisfied with their journey are more likely to generalise from their own experience to the destination-level benefits of rail. Destination-image research shows that such cognitive evaluations are formed from direct experience and, in turn, influence behavioural intentions [156,161]; and destination-competitiveness frameworks treat infrastructure as a core resource whose perceived quality feeds into the destination’s sustainable competitive position [162,163,164,165,166]. These mechanisms correspond to hypotheses H8–H10.
Visitor origin (regional vs. other international) is also examined as a moderator of the structural paths in a multigroup analysis, because the tourism literature suggests that the weight of safety relative to satisfaction differs between familiar and unfamiliar visitors [146,150,151], and because visitors from Serbia, Bosnia and Herzegovina and neighbouring economies account for a large share of Montenegrin tourism and of cross-border rail traffic [15]. Because origin is at best an imperfect proxy for familiarity, the interpretation of any difference between the two groups is checked against visit history (first-time vs. repeat visitors) in Section 5.6.
2.6. Tourism and Public Transport at Destinations
The research question of this paper is also embedded in the literature on tourism and public transport at destinations, which has developed into a distinct field over the past two decades [38,39]. Three findings of that literature inform the present model. First, tourists’ use of public transport at a destination is shaped by a combination of personal characteristics (age, income, car availability, travel party), trip characteristics (arrival mode, length of stay, trip organisation) and supply characteristics (network coverage, frequency, information and ticketing), and tourists are consistently more sensitive than residents to the legibility, integration and reliability of the system [38,61,167,168]; users and non-users differ systematically in their perceptions, so that improving the experience of users does not automatically convert non-users [61,169]. Second, public transport performance feeds into the evaluation of the destination as a whole—Thompson and Schofield [62] showed that the ease of use and the safety of public transport predict overall destination satisfaction—and the quality of the transport experience determines which areas of a destination are visited and how far tourists disperse from their accommodation [167,170,171]. Third, public transport provision for tourism faces specific supply-side constraints: seasonal peaks that overload systems designed for residents [64], the difficulty of serving dispersed rural attractions [63,65,66], the tension between car access and the conservation role of protected landscapes [172], and the need to plan tourism and mobility together rather than sequentially [173]. Recent work extends this agenda to the environmental dimension, showing that visitors’ modal choices at destinations are linked to their mobility habits at home and to the type of destination, with coastal destinations associated with less sustainable choices [174], and that smart-card data can be used to profile tourists’ public transport use at scale [170].
The Montenegrin railway is a public transport system in exactly this sense: it is used by tourists alongside residents, it competes with coaches and the private car on the coast–north axis, its attractiveness depends on frequency, information, ticketing and connections as much as on the track, and its intended role is to disperse visitors from the coast to the interior. The model developed in Section 4 therefore borrows from this literature the distinction between accessibility (whether the railway makes destinations reachable and integrates with other modes), reliability (frequency, punctuality, journey time and connections) and the infrastructure that underpins both, and it adopts the destination-level outcome variables—satisfaction, revisit and recommendation intentions and the perceived contribution to destination development—that the tourism–public transport literature has shown to be sensitive to transport performance. Conversely, the study contributes to that literature a case in which the public transport mode is a conventional interregional railway rather than the urban buses, trams and metros that dominate the field, and in which safety perceptions, which that literature has rarely examined [154], play a central role.
3. Research Context: Railways and Tourism in Montenegro
Montenegro’s railway system comprises 250 km of standard-gauge, single-track open line, of which 225 km are electrified at 25 kV 50 Hz [20,175]. The backbone is the Vrbnica–Bar section (167 km) of the 476 km Belgrade–Bar line, built in phases between 1952 and 1976, which links the Port of Bar—the country’s principal seaport—with Podgorica and, via the Morača canyon, Kolašin, Mojkovac and Bijelo Polje to the Serbian border [19]. The line is described by the infrastructure manager as unique in Europe in climbing roughly 1000 m between Podgorica and Kolašin over little more than 50 km, with gradients of up to 25‰ and minimum curve radii of 300 m; the Vrbnica–Bar section alone includes 106 tunnels—among them the 6.2 km Sozina tunnel between Bar and the Skadar Lake basin—and 96 bridges, including the Mala Rijeka viaduct [19,20]. A 56 km electrified branch connects Podgorica with Nikšić across the Bjelopavlići plain, and a 24 km non-electrified line runs from Podgorica through Tuzi to the Albanian border, currently used for freight only [20]. Figure 1 shows a schematic layout of the network—with the four survey stations, the two airports and the main coastal, lake and mountain tourist areas marked—together with an indicative longitudinal profile of the main line.
Figure 1.
(a) Schematic layout of the Montenegrin railway network with the survey stations, airports and the main tourist areas (not to scale; the dashed line is the non-electrified Podgorica–Tuzi line to the Albanian border, used for freight only; the dotted line indicates the road connection from Mojkovac to Durmitor National Park; shaded areas mark the coastal resort areas, the mountain and national park areas and Skadar Lake National Park); (b) indicative longitudinal profile of the Vrbnica–Bar line, from the Port of Bar (≈3 m a.s.l.) to Kolašin (≈1032 m a.s.l.) and the Serbian border at Vrbnica. Source: authors, based on [15,19,20].
Institutionally, the former Railways of Montenegro were unbundled in 2008 into four joint-stock companies—Železnička infrastruktura Crne Gore (ŽICG, infrastructure manager), Železnički prevoz Crne Gore (ŽPCG, passenger operator), Montecargo (freight) and a rolling-stock maintenance company—in line with the first EU railway packages [20,176]. Passenger services are limited: in the second quarter of 2025 rail carried 225 thousand passengers, 7% fewer than a year earlier, against 1.58 million by intercity road transport and 0.89 million passengers handled at the two airports [24]. Eurostat lists Montenegro among the candidate countries recording fewer than one million rail passengers and fewer than 70 million passenger-kilometres in 2024 [23]. Nonetheless, the Belgrade–Bar line is Montenegro’s only international passenger rail connection and the sole rail link between the coast and the north, and it is served in summer by day and night trains that are heavily used by visitors from Serbia and by international “rail-tourists” attracted by the scenic route. Passenger information is provided primarily in Montenegrin: station announcements and printed timetables are in Montenegrin, the operator’s website and online ticketing are available in Montenegrin and English, and announcements on the international trains are made in Montenegrin and English; information in Russian, German or the other languages of the main source markets is not provided systematically.
The network’s safety and quality profile has been shaped by the 2006 Bioče derailment, in which a four-coach train from Bijelo Polje to Bar left the track above the Morača river after a brake failure, killing at least 44 and injuring about 200 people [21]. The accident triggered a multi-year programme of superstructure renewal, signalling upgrades and tunnel and bridge rehabilitation on the Vrbnica–Bar line financed by the EBRD, the EIB and EU IPA/WBIF grants, with the explicit objectives of raising safety, restoring design speeds and meeting interoperability requirements [19,41]. According to the infrastructure manager, around EUR 70 million of EBRD, EIB, IPA and WBIF financing has been absorbed on the line over the past decade and roughly 40% of the superstructure has been renewed; nevertheless, permitted speeds remain at about 70 km/h on much of a line that was engineered in the 1950s–1970s as one of the most ambitious railway projects in Europe, and its maintenance is among the most complex and expensive on the continent [19,20]. The Vrbnica–Bar line is designated as Route 4 of the South-East Europe core network and lies on the indicative extension of the TEN-T network to the Western Balkans, and its continued rehabilitation is listed as a long-term national priority in the Reform and Growth Facility framework [13,41]. Successive European Commission progress reports had long noted that the railway regulatory body and the national safety authority lacked full operational independence and adequate staffing, and had called for a new law on railway safety and interoperability aligned with Directives (EU) 2016/798 and 2016/797 [134,135,176,177]. The 2025 Commission report concluded that Montenegro was between a moderate and a good level of preparation in transport policy, welcomed the new Law on Railways and called for a law on railway safety and interoperability and for an operationally independent and adequately staffed regulator and safety authority [176]. Both requests were met within months: the Law on Railway Safety and Interoperability was adopted by Parliament on 27 December 2025 and, together with the Law on Railways, has applied since the beginning of 2026, while the Railway Agency was established on 7 January 2026 and became operational in June 2026 [25,26,27]. The survey reported below was thus conducted in the final months of the previous regulatory regime, which makes it a useful baseline against which the effects of the new safety and interoperability framework can later be assessed. On the operator side, the fleet-renewal contract signed in May 2026—a EUR 30 million, EBRD-financed order for three four-car electric multiple units interoperable with the Serbian fleet, expressly motivated by the goal of making rail “more attractive for both residents and tourists”—will add the first new passenger rolling stock in decades within three years [28,29].
The tourism side of the equation is well documented. Tourism is the largest export sector of the Montenegrin economy; the 2025 figures of 2.73 million arrivals and 15.4 million overnight stays were generated primarily by visitors from Serbia (23.4% of foreign overnights), the Russian Federation (16.4%) and Bosnia and Herzegovina (8.1%), and 92.6% of overnights were spent in seaside resorts, compared with 2.8% in mountain resorts and 2.7% in the capital [15]. As Figure 1 shows, the railway serves the coast directly only at Bar: the Budva riviera, Boka Kotorska and the Ulcinj riviera, where most overnight stays are concentrated, depend on road connections from Bar or Podgorica stations and on Tivat airport, whereas the mountain destinations of the north—Kolašin with Biogradska Gora National Park and the Bjelasica ski resorts, and, some 70 km by road from Mojkovac, Durmitor National Park—are reached directly from stations on the line.
Seasonality is among the most pronounced in the Mediterranean [16]. Both the Tourism Development Strategy 2022–2025 and the National Strategy for Sustainable Development identify the dispersal of demand to the north and the extension of the season as strategic goals, and both name transport accessibility as a limiting factor [17,18], while the Transport Development Strategy 2019–2035 assigns the railway a role in sustainable mobility and in linking the coast with the mountainous hinterland [40]. Whether tourists perceive the railway as a credible vehicle for these goals is the empirical question that this study addresses.
4. Research Methodology
4.1. Research Design
The study adopts a quantitative, cross-sectional design with a two-stage analytical strategy. In the first stage, the hypothesised relationships in Figure 2 were tested with covariance-based structural equation modelling (CB-SEM), following the two-step approach of Anderson and Gerbing [178]: a confirmatory measurement model was validated before the structural model was estimated [179,180]. Mediation was assessed with bootstrap confidence intervals [181], and the moderating role of visitor origin was examined through a multigroup comparison preceded by tests of measurement invariance [182,183,184]. In the second stage, an importance–performance analysis [185,186] of twelve concrete infrastructure and service attributes was carried out on the same sample to translate the structural findings into actionable priorities. The population of interest was defined as adult tourists—non-residents of Montenegro, or residents travelling away from their usual environment with at least one overnight stay—who had completed at least one rail journey within Montenegro during their current trip. Because the design is cross-sectional, the structural model tests whether the pattern of associations in the data is consistent with the hypothesised ordering of the constructs; it cannot establish temporal precedence, and the hypotheses are therefore formulated and interpreted as directional associations rather than as demonstrated causal effects.
Figure 2.
Conceptual model of the study with the hypothesised paths H1–H10. Arrows indicate the hypothesised positive relationships; infrastructure quality, service reliability and rail-based accessibility are exogenous constructs (blue), and perceived safety, satisfaction, the perceived sustainability contribution and behavioural intentions are endogenous constructs (green).
4.2. Conceptual Model and Hypotheses
Figure 2 integrates the constructs derived from the literature into a single conceptual model. Infrastructure quality (IQ), service reliability (SR) and rail-based accessibility (AC) are exogenous constructs, allowed to covary. IQ is hypothesised to influence perceived safety (PS), satisfaction with the rail experience (SAT) and the perceived contribution of rail to sustainable destination development (SDP); PS, SR and AC influence SAT; PS also influences sustainable tourism behavioural intentions (SBI) directly; SAT influences SDP and SBI; and SDP influences SBI. SAT is thus a mediator of the effects of IQ, PS, SR and AC on SBI, and SDP a mediator of the effect of SAT on SBI. Visitor origin is examined as a moderator. The ten hypotheses are numbered in the order in which they appear in the model, from the exogenous constructs to the outcome construct; their theoretical grounding is given in Section 2.3, Section 2.4 and Section 2.5.
H1.
Perceived railway infrastructure quality has a positive effect on perceived safety.
H2.
Perceived railway infrastructure quality has a positive effect on satisfaction with the rail experience.
H3.
Perceived safety has a positive effect on satisfaction with the rail experience.
H4.
Perceived service reliability has a positive effect on satisfaction with the rail experience.
H5.
Perceived rail-based accessibility has a positive effect on satisfaction with the rail experience.
H6.
Satisfaction with the rail experience has a positive effect on sustainable tourism behavioural intentions.
H7.
Perceived safety has a positive effect on sustainable tourism behavioural intentions.
H8.
Perceived railway infrastructure quality has a positive effect on the perceived contribution of rail to sustainable destination development.
H9.
Satisfaction with the rail experience has a positive effect on the perceived contribution of rail to sustainable destination development.
H10.
The perceived contribution of rail to sustainable destination development has a positive effect on sustainable tourism behavioural intentions.
4.3. Research Instrument
The questionnaire was developed in three steps. First, an item pool of 36 candidate items was assembled from validated scales in the public transport quality literature [102,106,107,112,114], the tourist risk and safety literature [145,147,148], the satisfaction and behavioural-intention literature [129,131,132,155] and the sustainable tourism literature [84,159], and adapted to the railway and Montenegrin context. Second, content validity was assessed by a panel of six experts—two academics in transport engineering, two in tourism management, one manager from the infrastructure manager (ŽICG) and one from the passenger operator (ŽPCG)—using a two-round modified Delphi procedure with structured scoring sheets [187]. In the first round, each expert independently rated the relevance and the clarity of every item on a four-point scale (1 = not relevant/unclear, 4 = highly relevant/very clear) and proposed rewording where necessary; the item-level content validity index (I-CVI, the proportion of experts rating an item 3 or 4) and the scale-level index (S-CVI/Ave) were computed following Polit and Beck [188]. Items with an I-CVI below 0.78 were reworded or removed, and the revised list was returned to the panel in a second round together with the anonymised first-round ratings; after this round all retained items reached an I-CVI of at least 0.83 and the S-CVI/Ave was 0.94, while six items were dropped as redundant or inappropriate to the Montenegrin context. Third, the instrument was pre-tested with 32 rail travellers at Podgorica station in May 2025, which led to the simplification of three items and the removal of one redundant accessibility item.
The final instrument measured seven latent constructs with 29 reflective items, all rated on seven-point Likert scales (7 = strongly agree): perceived infrastructure quality (IQ, five items), perceived safety (PS, four items), service reliability (SR, four items), rail-based accessibility (AC, three items), satisfaction with the rail experience (SAT, four items), perceived contribution of rail to sustainable destination development (SDP, four items) and sustainable tourism behavioural intentions (SBI, five items). The full wording is given in Appendix A. The questionnaire was administered in three language versions—Montenegrin (readable also by speakers of Serbian, Bosnian and Croatian), English and Russian—selected to cover the main source markets [15]; the English and Russian versions were produced by translation and back-translation by bilingual academics, discrepancies were resolved by the research team, and respondents chose the version they preferred. In a separate part of the instrument, respondents were asked to rate the importance of the twelve attributes of rail travel in Montenegro (1 = not at all important, 7 = extremely important) and, subsequently, the performance of the railway on the same attributes (1 = very poor, 7 = excellent), following standard IPA practice [185,186]. The attributes—track condition and ride smoothness, punctuality, technical safety of rolling stock, personal security at stations and on board, journey time, train frequency, cleanliness and comfort of coaches, station facilities, passenger information and digital ticketing, connections with buses, airports and the Port of Bar, scenic value of the route, and ticket price/value for money—were selected to cover the quality dimensions of EN 13816 [112] and the specific characteristics of the Montenegrin network. A final block recorded gender, age, education, country of residence, purpose of trip, route travelled, first or repeat visit, length of stay and survey location.
The seven constructs were specified as reflective and unidimensional, and because several of them combine facets that could in principle be separated, the reasoning deserves to be made explicit. Infrastructure quality is conceived, in the servicescape and EN 13816 traditions [112,113], as the passenger’s evaluation of the tangible state of the railway’s assets—track, stations, rolling stock, coach interiors and information systems—which share a common cause in the level of investment and maintenance; the items therefore reflect one underlying evaluation of the physical system, whereas the service outputs of that system (punctuality, frequency, journey time, connections) belong to the reliability construct. Perceived safety combines technical safety and personal security because, from the traveller’s perspective, both are facets of the same judgement—whether the railway is a safe way to travel—and because the tourism risk literature treats transport safety as a single risk dimension [145,147]. Sustainable tourism behavioural intentions are specified as a single disposition to use, recommend and favour the railway in future, of which revisit, recommendation, modal preference, inland visitation and willingness to pay a premium are observable manifestations, following the treatment of behavioural intention as a reflective construct in the tourism literature [130,155]. Because these decisions are contestable, the unidimensionality of each construct and the distinctness of the constructs were tested against alternative measurement models (Section 5.3; Appendix A, Table A3).
4.4. Data Collection
Data were collected between June and September 2025 through an intercept survey at the four principal passenger stations on the Vrbnica–Bar line—Bar, Podgorica, Kolašin and Bijelo Polje—and on board Bar–Bijelo Polje regional trains and the Belgrade–Bar international day and night trains within Montenegrin territory. Ten trained enumerators, students of the two faculties of the Adriatic University involved in the study, worked on a rotating schedule that covered weekdays and weekends and morning, afternoon and evening departures. A systematic sampling procedure was applied whereby every third arriving or waiting passenger who met the eligibility criteria was invited to participate; on board, enumerators started from a randomly selected coach and approached every third occupied seat block; only one member of a travelling party was interviewed. Of 541 questionnaires distributed, 512 were returned (94.6%). Twenty-five were excluded because more than 10% of the items were missing, because of straight-lining across all scale items, or because the respondent proved to be a commuting resident, leaving 487 usable responses (90.0% of those distributed). The sample size exceeds the conventional minimum of ten observations per estimated indicator for CB-SEM [179,189] and provides power above 0.80 to reject a hypothesis of poor fit (RMSEA ≥ 0.08) at 364 degrees of freedom [190].
Systematic intercept sampling of this kind does not yield a probability sample of all rail tourists, and several potential sources of selection bias were considered [191]. First, the fixed selection interval removes enumerator discretion in choosing respondents, and the rotation of enumerators across stations, days and times of day limits the over-representation of particular services; nevertheless, passengers with longer waiting times at stations had a higher chance of being approached, which is why on-board interviews covering both regional and international trains were added. Second, non-response (5.4%) and the exclusion of incomplete questionnaires were low and did not differ noticeably by station or language version. Third, because the survey was conducted in summer, at four stations and on the main line only, the sample cannot represent off-season travellers or users of the Podgorica–Nikšić branch, who are under-represented (8.2%). Fourth, the sample is restricted to rail users: tourists who travelled by road or air are not covered, so the results describe the perceptions of those who have experienced the railway rather than the modal-choice potential of all visitors. A comparison with official statistics suggests that the sample is broadly consistent with the structure of demand—the shares of visitors from Serbia and Bosnia and Herzegovina, of repeat visitors and of stays of four to seven nights are close to those reported by MONSTAT for the 2025 summer season [15]—although visitors from the Russian Federation are under-represented, consistent with their lower propensity to travel by rail. These limitations are taken up in Section 6.3.
4.5. Data Analysis
Common method variance was assessed in three ways, following Podsakoff et al. [192,193]: with Harman’s single-factor test, by comparing the measurement model with a single-factor confirmatory model, and with an unmeasured latent method construct (ULMC), i.e., a method factor with equal loadings on all 29 items and orthogonal to the substantive factors added to the measurement model [194]. Reliability and validity were evaluated with Cronbach’s alpha, composite reliability, average variance extracted, the Fornell–Larcker criterion and heterotrait–monotrait (HTMT) ratios [195,196,197,198,199], and the unidimensional specification of the constructs was tested against six alternative measurement models. Measurement and structural models were estimated by maximum likelihood with the semopy package (version 2.3.11) for Python 3.13 [200]; the complete model syntax and estimation settings are given in Appendix B, and model fit was judged against the chi-square test, CFI, TLI, RMSEA, GFI and the standardised root mean square residual [179,180]. Structural paths are reported both as unstandardised coefficients (B, with the first indicator of each construct fixed to 1 for scaling), to which the standard errors and z-tests refer, and as fully standardised coefficients (β); the explained variance of each endogenous construct is computed within the latent model as one minus its standardised disturbance variance. Specific indirect, total indirect and total effects—including the serial pathways—were computed from the standardised latent path coefficients, and their uncertainty was assessed with 5000 bootstrap resamples of the complete latent model and percentile confidence intervals [181]. Because omitting a direct path by specification does not by itself demonstrate full mediation, the hypothesised model was compared with an augmented model in which direct paths from infrastructure quality, service reliability and accessibility to intentions were freed, and mediation was classified following Zhao et al. [201]. For the multigroup analysis, domestic respondents (n = 76) were excluded because the group was too small for the stable estimation of a 29-indicator model, and the robustness of the pooled estimates to their exclusion was checked by re-estimating the full model on the 411 non-domestic respondents. Measurement invariance between regional visitors (residents of the successor states of the former Yugoslavia and of Albania; n = 231) and other international visitors (n = 180) was tested in the sequence configural, metric (equal factor loadings) and scalar (equal loadings and item intercepts) invariance [182,183,184], using the ΔCFI ≤ 0.010 and ΔRMSEA ≤ 0.015 criteria in addition to the chi-square difference test [183]. Group differences in the structural paths were then tested in a two-group structural model with factor loadings constrained to equality and all other parameters free, by comparing, for each path, a model in which its unstandardised coefficient is constrained to be equal across groups with the unconstrained model (Δχ2 with one degree of freedom) [202]; unstandardised coefficients were compared because differences between standardised coefficients can reflect differences in construct variances between groups. The same procedure was applied to first-time versus repeat visitors as a check on the interpretation of origin. Differences in construct means across routes and across origin groups were tested with one-way ANOVA. For the IPA, the quadrant classification was based on the grand means of importance and performance [185]; because this classification is sensitive to the placement of the cross-hairs [186,203], its stability was checked against the scale midpoint, the medians of the attribute means and the gap-based (diagonal) approach.
5. Research Results
5.1. Sample Profile
Table 1 presents the profile of the 487 respondents. Women slightly outnumbered men, and the sample was young: 46.2% of respondents were aged 18–34 and a further 24.4% were aged 35–44. Three-quarters held a university degree. Regional visitors from neighbouring economies formed the largest group (47.4%), followed by other international visitors (37.0%) and domestic tourists (15.6%). Leisure was the dominant purpose of travel (69.4%). The largest share of respondents (42.9%) had travelled on the international Belgrade–Bar service, 28.5% on the Bar–Podgorica section, 20.3% on the mountainous Podgorica–Bijelo Polje section and 8.2% on the Podgorica–Nikšić branch; 55.9% were repeat visitors to Montenegro, and the modal length of stay was four to seven nights, consistent with official statistics on occupancy in the summer season [15].
Table 1.
Sample descriptive statistics (n = 487).
5.2. Descriptive Statistics and Common Method Variance
Construct means (Table 2) reveal a clear pattern. Respondents rated the perceived contribution of rail to sustainable destination development highly (SDP, M = 5.19) and expressed fairly strong sustainable behavioural intentions (SBI, M = 4.88) and a moderate-to-high sense of safety (PS, M = 4.84), but evaluated infrastructure quality (IQ, M = 3.94) and, especially, service reliability (SR, M = 3.72) below the scale midpoint. Satisfaction with the rail experience was moderate (SAT, M = 4.38), as was accessibility (AC, M = 4.34). Item-level skewness ranged from −0.39 to 0.17 and kurtosis from −0.48 to 0.01, well within the |2| and |7| thresholds for maximum-likelihood estimation [179].
Table 2.
Measurement model: items, descriptive statistics, standardised loadings, reliability and convergent validity.
One-way ANOVA detected no significant differences in construct means across the four routes (IQ: F = 1.17, p = 0.320; PS: F = 0.67, p = 0.572; SR: F = 2.13, p = 0.095; SAT: F = 1.63, p = 0.180; SBI: F = 0.71, p = 0.548), although reliability was rated lowest on the Podgorica–Nikšić branch (M = 3.39). Nor did construct means differ significantly across the three origin groups (domestic, regional and other international; F between 0.38 and 2.10, all p > 0.12), which indicates that the domestic respondents excluded from the multigroup analysis do not form a distinct population in terms of their evaluations. Three tests addressed common method variance. In Harman’s single-factor test the first unrotated factor accounted for 36.1% of the variance in the 29 items, below the 50% threshold; a single-factor confirmatory model fitted the data very poorly (χ2(377) = 3695.10; CFI = 0.583; RMSEA = 0.135; SRMR = 0.114; Appendix A, Table A3); and adding an unmeasured latent method construct to the seven-factor model did not improve fit (Δχ2(1) = 1.06, p = 0.303), the method factor accounted on average for 11.7% of item variance (mean standardised method loading 0.34), and the substantive loadings changed by 0.08 on average and by 0.10 at most, all remaining significant. These results indicate that a single method factor cannot account for the covariances among the items; they cannot exclude common method variance entirely, a limitation noted in Section 6.3 [192,193,194].
5.3. Measurement Model
The confirmatory factor analysis of the seven-factor measurement model showed excellent fit: χ2(356) = 391.10, p = 0.097; CFI = 0.996; TLI = 0.995; RMSEA = 0.014 (90% CI 0.000–0.022); SRMR = 0.028; GFI = 0.953.
All standardised loadings exceeded 0.69 and were significant at p < 0.001 (Table 2). Cronbach’s alpha ranged from 0.826 (AC) to 0.890 (SBI), composite reliability from 0.827 to 0.890 and AVE from 0.578 (IQ) to 0.646 (SAT), exceeding the recommended thresholds of 0.70, 0.70 and 0.50, respectively [195,196,197,199]. Discriminant validity was supported: the square root of the AVE of every construct (0.760–0.803) exceeded its correlations with all other constructs (maximum 0.694), and all HTMT ratios were below the conservative 0.85 threshold, the highest being 0.696 for SAT–SBI [196,198]; the full matrix is given in Appendix A, Table A2. The unidimensional specification of the constructs was then examined against alternative measurement models (Appendix A, Table A3). Splitting perceived safety into technical safety (PS1–PS2) and personal security (PS3–PS4), infrastructure quality into physical assets (IQ1–IQ3) and amenities and information (IQ4–IQ5), or behavioural intentions into reuse, recommendation and modal preference (SBI1–SBI3) and inland visitation and willingness to pay (SBI4–SBI5) did not improve fit significantly (Δχ2(7) = 9.13, 5.79 and 9.36; p = 0.24, 0.56 and 0.23) and produced correlations between the split factors of 0.99–1.04, i.e., factors that are empirically indistinguishable; the single-factor specification of each construct was therefore retained. Conversely, merging service reliability with accessibility worsened fit markedly (Δχ2(6) = 459.21, p < 0.001), and a three-factor model that collapses all evaluative constructs into one fitted poorly (CFI = 0.726; RMSEA = 0.110), confirming that the constructs are distinct rather than facets of a general favourable evaluation.
5.4. Structural Model and Hypothesis Testing
The structural model fitted the data very well: χ2(364) = 394.44, p = 0.131; CFI = 0.996; TLI = 0.996; RMSEA = 0.013 (90% CI 0.000–0.022); SRMR = 0.029; GFI = 0.953 (Table 3). The difference in chi-square between the measurement and the structural model (Δχ2 = 3.34, Δdf = 8) was not significant, indicating that the hypothesised structure reproduces the latent covariances without loss of fit.
Table 3.
Goodness-of-fit indices of the measurement and structural models.
All ten hypothesised paths were supported (Table 4, Figure 3). Table 4 reports the unstandardised coefficients, to which the standard errors and z-tests refer, alongside the fully standardised coefficients, and the explained variances are those of the latent model. Infrastructure quality was by far the strongest correlate of perceived safety (H1: β = 0.579, p < 0.001), accounting for 34% of its variance—a result consistent with the reliance of lay travellers on tangible cues when judging the technical safety of a railway. Satisfaction with the rail experience was jointly predicted by service reliability (H4: β = 0.295), infrastructure quality (H2: β = 0.282), perceived safety (H3: β = 0.281) and, more weakly, accessibility (H5: β = 0.150, p = 0.002), with an R2 of 0.58. Infrastructure quality (H8: β = 0.284) and satisfaction (H9: β = 0.316) explained 30% of the variance in the perceived contribution of rail to sustainable destination development. Finally, sustainable tourism behavioural intentions were predicted primarily by satisfaction (H6: β = 0.414), followed by perceived safety (H7: β = 0.282) and the perceived sustainability contribution (H10: β = 0.240), with an R2 of 0.59. All standardised paths exceed the threshold for a medium effect except AC → SAT, which is small [190].
Table 4.
Unstandardised (B) and standardised (β) path coefficients and hypothesis tests (n = 487).
Figure 3.
Results of the structural model. Arrows show the hypothesised paths with their fully standardised maximum-likelihood coefficients (β; *** p < 0.001, ** p < 0.01); exogenous constructs are shaded blue and endogenous constructs green, with their explained variance (R2) from the latent model (n = 487).
As a robustness check related to the multigroup analysis reported below, the pooled model was re-estimated without the 76 domestic respondents (n = 411). The fit was unchanged (χ2(364) = 394.74; CFI = 0.995; TLI = 0.995; RMSEA = 0.014), all ten paths remained significant at p < 0.001, and all standardised coefficients lay within ±0.035 of the full-sample estimates, the largest differences being SDP → SBI (0.206 vs. 0.240) and AC → SAT (0.182 vs. 0.150). The exclusion of the domestic group from the multigroup analysis therefore does not affect the pooled conclusions.
To test whether the absence of direct paths from infrastructure quality, reliability and accessibility to intentions is warranted rather than merely assumed, the model was re-estimated with these three direct paths freed. None of them was significant (IQ → SBI: B = 0.040, SE = 0.061, p = 0.51; SR → SBI: B = −0.016, SE = 0.045, p = 0.72; AC → SBI: B = −0.057, SE = 0.048, p = 0.23), the improvement in fit was negligible (Δχ2(3) = 1.85, p = 0.60), and the remaining coefficients changed by less than 0.03. The more parsimonious hypothesised model was therefore retained, and the effects of these three constructs on intentions are classified as indirect-only mediation in the typology of Zhao et al. [201].
5.5. Mediation Analysis
Table 5 reports the specific indirect, total indirect and total effects computed within the latent model, with bootstrap standard errors and percentile confidence intervals from 5000 resamples of the complete SEM. All fourteen specific indirect effects were significant. Infrastructure quality was related to satisfaction indirectly through perceived safety (0.163; total effect on satisfaction 0.444), and to intentions through five pathways: via perceived safety (0.164), via satisfaction (0.117), via perceived safety and satisfaction in series (0.067), via the perceived sustainability contribution (0.068) and via the longer serial routes through satisfaction and the sustainability contribution (0.021 and 0.012). Its total effect on intentions (0.450; 95% CI 0.381–0.515) is entirely indirect and of the same magnitude as the total effect of perceived safety (0.420; 95% CI 0.325–0.511), of which roughly two-thirds is direct and one-third runs through satisfaction and the sustainability contribution (0.138). Service reliability and accessibility reach intentions only through satisfaction (total effects 0.144 and 0.073), and satisfaction, besides its direct effect, has a further indirect effect through the perceived sustainability contribution (0.076; total effect 0.490). Together with the augmented-model test in Section 5.4, these results support indirect-only mediation for infrastructure quality, reliability and accessibility and complementary (partial) mediation for perceived safety and satisfaction [201].
Table 5.
Specific indirect, total indirect and total effects in the latent model (standardised estimates; bootstrap standard errors and percentile 95% confidence intervals from 5000 resamples).
5.6. Measurement Invariance and Multigroup Analysis by Visitor Origin
Because a comparison of structural coefficients is meaningful only if the constructs are measured equivalently in both groups, measurement invariance was tested before the multigroup comparison (Table 6). The configural model, in which the same seven-factor structure was specified in both groups with all parameters free, fitted well (χ2(712) = 732.39, p = 0.290; CFI = 0.997; RMSEA = 0.012; SRMR = 0.042), confirming that the factor structure holds for regional and other international visitors alike. Constraining the factor loadings to equality (metric invariance) produced a statistically significant chi-square difference (Δχ2(22) = 35.80, p = 0.032), but the change in the practical fit indices was negligible (ΔCFI = −0.002; ΔRMSEA = 0.003), well within the ΔCFI ≤ 0.010 and ΔRMSEA ≤ 0.015 criteria recommended for samples of this size [182,183]; given the known sensitivity of the chi-square difference test to minor and substantively trivial deviations [184], metric invariance was accepted. Adding equality constraints on the item intercepts (scalar invariance) did not worsen the fit (Δχ2(22) = 19.36, p = 0.623; ΔCFI = 0.000; ΔRMSEA = −0.001). Full metric and scalar invariance therefore hold, so that differences in structural paths between the two groups can be interpreted as substantive rather than as measurement artefacts.
Table 6.
Measurement invariance of the seven-factor measurement model across regional (n = 231) and other international (n = 180) visitors.
With metric and scalar invariance established, the structural paths were compared in a two-group model in which the factor loadings were constrained to equality and all other parameters were free to differ between groups (χ2(750) = 780.54, p = 0.213; CFI = 0.995; RMSEA = 0.014). Table 7 reports the unstandardised coefficients of the two groups, on which the equality tests are based, together with the standardised coefficients for interpretation. An omnibus test rejected the equality of all ten paths (Δχ2(10) = 19.24, p = 0.037), and three paths differed individually. The effect of satisfaction on sustainable behavioural intentions was almost twice as strong among regional visitors (B = 0.525; β = 0.532) as among other international visitors (B = 0.269; β = 0.282; Δχ2(1) = 5.73, p = 0.017), whereas the direct effect of perceived safety was far stronger among other international visitors (B = 0.482; β = 0.458) than among regional visitors (B = 0.183; β = 0.196; Δχ2(1) = 9.52, p = 0.002), and the effect of infrastructure quality on satisfaction was larger among international visitors (B = 0.471 vs. 0.187; Δχ2(1) = 4.46, p = 0.035). The remaining seven paths did not differ (all p > 0.18). The overall picture is that visitors from the region form their intentions on the basis of how satisfying the journey was, whereas visitors from farther afield condition their future rail use above all on whether they perceived the system to be safe and read the condition of the infrastructure more directly into their satisfaction.
Table 7.
Multigroup comparison of structural paths between regional (n = 231) and other international (n = 180) visitors: unstandardised coefficients (standardised in parentheses) from the metric-invariant two-group model and chi-square difference tests of path equality.
Whether this contrast reflects familiarity with the railway, as the tourism literature would suggest, or other characteristics of the two markets was examined with the information available in the survey. Visitor origin was not associated with visit history (55.8% of regional and 58.9% of other international visitors were repeat visitors to Montenegro; χ2(2) = 2.26, p = 0.32), and re-estimating the two-group model for first-time (n = 215) versus repeat visitors (n = 272) revealed no significant difference in any path (omnibus Δχ2(10) = 10.19, p = 0.42; SAT → SBI: β = 0.465 vs. 0.371, p = 0.29; PS → SBI: β = 0.264 vs. 0.298, p = 1.00). The regional–international contrast therefore cannot be attributed to familiarity with the destination as measured here; it is more plausibly a market-of-origin effect that bundles cultural and linguistic proximity, the use of the Belgrade–Bar line as everyday transport rather than as a tourist experience, and market-specific expectations of railway safety, and it is interpreted in these terms in Section 6.
5.7. Importance–Performance Analysis
The IPA (Table 8, Figure 4) sharpens the structural results at the attribute level. Respondents attached the highest importance to technical safety of rolling stock (6.45), punctuality (6.25), track condition and ride smoothness (6.23) and personal security (6.19). Performance was rated highest for scenic value (6.07), value for money (5.37), personal security (4.94) and technical safety (4.48), and lowest for station facilities (3.18), train frequency (3.29), passenger information and digital ticketing (3.39), journey time (3.42), intermodal connections (3.50) and punctuality (3.53). With the exception of scenic value, where performance exceeded importance, all gaps were negative and statistically significant, and the largest gaps—between 2.4 and 2.7 scale points—concerned punctuality, track condition, journey time, train frequency and station facilities.
Table 8.
Importance–performance analysis of twelve attributes of rail travel in Montenegro (n = 487).
Figure 4.
Importance–performance grid for twelve attributes of rail travel in Montenegro (cross-hairs at grand means). Dots represent the twelve attributes, labelled with the codes of Table 8; the dashed lines are the cross-hairs at the grand means of importance (5.84) and performance (4.06), which define the four quadrants.
Using the grand means (importance 5.84, performance 4.06) as cross-hairs, three attributes fall in Quadrant I (“concentrate here”): track condition and ride smoothness, punctuality of trains and journey time; intermodal connections (importance 5.83, performance 3.50) lie on the boundary of this quadrant. Their importance is only 0.01 scale points below the grand mean of 5.84, whereas their performance is the fifth lowest of the twelve attributes and their gap (−2.33) the sixth largest; the quadrant assignment of this attribute is therefore an artefact of the cross-hair placement rather than a substantive finding [186,203]. With the cross-hairs at the scale midpoint (4.0/4.0) or at the medians of the attribute means (5.81/3.63), connections fall unambiguously in Quadrant I, and under the gap-based (diagonal) approach they rank sixth among the twelve priorities. For policy purposes we therefore treat intermodal connections as a Quadrant I priority—a reading that is consistent with the structural results, in which connections form part of the reliability construct that is the strongest driver of satisfaction, and with the evidence that integration is among the attributes to which visitors, as opposed to residents, are most sensitive [38,62]. Technical safety of rolling stock and personal security fall in Quadrant II (“keep up the good work”), which indicates that the post-2006 safety investments are recognised by travellers, although the gaps of 2.0 and 1.3 points show that expectations are still not fully met. Train frequency, cleanliness and comfort, station facilities and information and ticketing fall in Quadrant III (“low priority”)—but only because their importance ratings are marginally below the grand mean; their performance scores are among the lowest in the set, and several of them (frequency, journey time, connections) are direct correlates of the reliability construct that was the strongest driver of satisfaction. Scenic value and value for money fall in Quadrant IV (“possible overkill”), a label that should not be read literally: the scenic value of the route is an inherent asset rather than an investment, and the low ticket price reflects public-service compensation.
6. Discussion
6.1. Principal Findings
This research assessed whether, and through which mechanisms, the perceived quality and safety of railway infrastructure are related to the sustainable behavioural intentions of rail travellers in Montenegro and to their perception of the railway’s contribution to destination development. Four principal findings emerge.
First, infrastructure quality is the root of the hypothesised chain. It is the dominant antecedent of perceived safety, a direct antecedent of satisfaction and of the perceived sustainability contribution of rail, and—although it has no direct link to intentions—its total effect on sustainable behavioural intentions (0.45), estimated within the latent model, is of the same order as that of perceived safety (0.42). This extends the transport–tourism nexus literature [1,5], which has typically treated infrastructure as an aggregate stock in econometric models, by showing at the individual level how the physical condition of track, stations and rolling stock is associated, through perceived safety and satisfaction, with destination-relevant intentions. It also corroborates the engineering literature’s observation that the state of the permanent way determines ride quality, permitted speed and disruption risk [121,122,123], and adds that these outcomes are legible to lay passengers, who read them as cues for safety.
Second, perceived safety matters both as a component of satisfaction and, independently, as a condition for future rail use. The direct effect of safety on intentions, over and above satisfaction, is consistent with the risk-perception literature in tourism [145,147,150] and with Slovic’s insight that dread and catastrophic potential shape lay risk judgements [142]. In a network whose worst accident is still within living memory [21], the finding that safety is rated moderately high (M = 4.84) and that technical safety and personal security fall in the “keep up the good work” quadrant is encouraging, and suggests that the rehabilitation programme of the past two decades [19] has been noticed by users.
Third, reliability—punctuality, frequency, journey time and connections—is the single strongest driver of satisfaction and the attribute cluster with the largest importance–performance gaps. This replicates the consensus of the public transport quality literature [104,106,109,114] and the “quality paradox” that improvements in supply are judged against rising expectations [120]; it also confirms, for an interregional railway, the finding of the tourism–public transport literature that frequency, information and integration are the attributes to which visitors are most sensitive [38,62,167]. On a single-track mountain line with permitted speeds of about 70 km/h, journey times of roughly three hours between Bar and Bijelo Polje and a handful of daily services, reliability is bounded by infrastructure and fleet; the structural and the IPA results together therefore point to the same conclusion, namely that track renewal and rolling-stock replacement are not only safety measures but also the main levers of satisfaction.
Fourth, tourists themselves perceive the railway as an instrument of sustainable destination development—this construct received the highest mean rating of all—and that perception feeds into their intentions to use rail again, to visit the north and to accept a price premium for low-carbon transport. The mediation results show that this perception is not free-floating: it is associated with good infrastructure and with satisfying journeys. The multigroup analysis adds nuance by revealing that regional visitors, who account for the largest share of both overnight stays and cross-border rail traffic [15], respond primarily to satisfaction, while other international visitors respond primarily to safety; because metric and scalar invariance were established and the comparison rests on unstandardised coefficients, this contrast reflects a genuine difference in the weight of the two predictors rather than a measurement artefact or a difference in construct variances. The tourism literature would attribute such a contrast to familiarity, since unfamiliar and first-time visitors are known to weigh risk more heavily [146,151]; in this sample, however, origin was unrelated to visit history and first-time and repeat visitors did not differ in any path (Section 5.6), so the contrast is better understood as a market-of-origin effect: visitors from Serbia and the neighbouring economies use the Belgrade–Bar line as ordinary transport and judge it by the journey, whereas visitors from more distant markets approach an unfamiliar railway system through the lens of safety. Either way, the result has direct implications for how the railway should be communicated to different markets.
6.2. Managerial and Policy Implications
For the infrastructure manager and the passenger operator, the IPA provides an immediate prioritisation: track condition, punctuality and journey time are the attributes on which investment will yield the largest gains in satisfaction and, through it, in intentions. This aligns with the sequencing of the Vrbnica–Bar rehabilitation—superstructure renewal to restore design speeds, followed by signalling and telecommunications—and with the fleet-renewal contract of May 2026, which will deliver new electric multiple units designed for reliable cross-border operation with the Serbian fleet [19,28,29]. The results also warn against treating the “low priority” quadrant literally: station facilities, information and digital ticketing and intermodal connections—the last of which belongs in the priority quadrant under any reasonable cross-hair rule (Section 5.7)—have very low performance scores, are inexpensive to improve relative to civil works, and are precisely the attributes to which tourists, as opposed to residents, are most sensitive [38,62,167,168]. Integrated ticketing with coastal buses and with the airports at Podgorica and Tivat, real-time passenger information in English and in the languages of the main source markets—at present provided systematically only in Montenegrin and, on the international trains, in English (Section 3)—and step-free access at Bar, Podgorica and Bijelo Polje stations are therefore low-cost complements to the capital programme. Regulation (EU) 2021/782 on rail passengers’ rights, whose transposition the European Commission has requested [176,204], would in addition give visitors enforceable guarantees on information, assistance and compensation for delays—an institutional contribution to perceived reliability.
For destination management, the finding that safety dominates the intentions of non-regional international visitors implies that the safety improvements achieved since 2006 must be communicated, not merely delivered. Independent safety certification under the newly established Railway Agency, whose competences as national safety authority under the 2025 Law on Railway Safety and Interoperability mirror those required by the EU acquis [26,134,136], and visible cues such as modern rolling stock, well-lit stations and multilingual safety information are likely to be more persuasive to these markets than tariff incentives. For regional visitors, the emphasis should be on the quality of the journey itself—comfort, catering, punctuality—since satisfaction is what converts them into repeat rail users. The strong endorsement of the railway’s sustainability role suggests, moreover, that the line can be marketed as a product in its own right, in the manner of scenic and heritage railways elsewhere [35,36,70], with the Morača canyon, the Mala Rijeka viaduct and the ascent to Kolašin as attractions that combine the “slow travel” appeal [68] with access to the national parks of the north. Such positioning would serve the strategic objectives of demand dispersal and season extension set out in the national tourism and sustainable-development strategies [17,18] and would draw on the same logic that has been applied to alternative destination products elsewhere in the region [73,205].
For national policy, the results support the case for maintaining railway rehabilitation among the long-term priorities of national reforms and investment strategies [41] and for turning the formal alignment with the Railway Safety and Interoperability Directives achieved through the laws of 2025 and the Railway Agency of 2026 into an operational reality—staffing, safety certification of operators and infrastructure, and accident investigation capacity—since the 2025 Commission report had identified precisely these as the outstanding closing benchmarks in transport policy [26,27,134,135,176]. Beyond compliance, the potential sustainability dividend is clear in principle, although this study measures intentions rather than realised behaviour: every tourist who shifts from car to rail on the coast–north axis would reduce emissions and congestion on the Adriatic road and on the Bar–Boljare motorway corridor, and the geographic and seasonal redistribution of visitors that the railway could enable is the most direct available response to the concentration of 92.6% of overnight stays on the coast [15,94,95]. Whether stated intentions translate into modal shift and dispersal is an empirical question that only monitoring can answer. Monitoring of rail-tourist volumes, satisfaction and safety perceptions could be institutionalised through the sustainable transport indicator frameworks recommended in the literature [92] and through the harmonised passenger statistics of the UIC and Eurostat [23,206], in line with OECD guidance on evidence-based tourism policy [207].
6.3. Limitations
The cross-sectional design permits a test of whether the data are consistent with a theoretically grounded ordering of the constructs, but it cannot establish temporal precedence or causal mediation: satisfaction may colour the evaluation of quality and safety as much as the reverse, equivalent models can reproduce the same covariances, and unobserved respondent characteristics or shared response tendencies may influence several constructs at once; the hypotheses should therefore be read as directional associations and the mediation results as decompositions of those associations rather than as demonstrated causal processes. The design also does not permit the observation of change over time; a panel or repeated cross-section spanning the completion of the current rehabilitation phase and the entry into service of the new fleet would allow the “quality paradox” [120] to be tested directly. The survey covered the summer season only, and rail travellers only; non-users—tourists who chose car or bus, or who did not visit the north at all—may hold systematically different perceptions of railway safety and quality, and their inclusion would be necessary to estimate the modal-shift potential of investment. The constructs are perceptual; linking them to objective measures of track quality, delay minutes and safety indicators, in the manner of the subjective–objective methodology of Eboli and Mazzulla [106], would strengthen the managerial inferences. The multigroup analysis compared two broad groups; although configural, metric and scalar invariance were established, residual (strict) invariance and the invariance of the structural covariances were not tested [182,184], and finer segmentation by market and by prior rail experience is warranted. Visitor origin, moreover, bundles several characteristics—familiarity, cultural and linguistic proximity, trip purpose and expectations—and the survey measured only visit history, not prior experience of the Montenegrin railway, so that the market-of-origin interpretation offered in Section 6.1 should be tested with direct measures of familiarity. Domestic tourists (n = 76) were too few to be included in the multigroup analysis as a separate group, so the moderating role of origin was tested only for the regional–international contrast; although the pooled estimates proved robust to the exclusion of this group (Section 5.4) and its construct means did not differ from those of the other groups (Section 5.2), the structural weights of safety and satisfaction among domestic tourists—who are the most familiar with the network—remain untested and may differ from both of the patterns identified here. The systematic intercept procedure, while limiting enumerator discretion, favoured passengers with longer dwell times at stations, covered only the summer season, the main line and rail users, and relied on three language versions, so that visitors who do not read Montenegrin, English or Russian were less likely to participate (Section 4.4); the sample is therefore best read as representative of summer rail travellers on the Vrbnica–Bar line rather than of all visitors to Montenegro. Finally, although the single-factor and unmeasured-method-construct tests give no indication that common method variance drives the results, all data are self-reported and no statistical remedy can rule it out completely; moreover, the outcome variables are stated intentions, not observed modal choice, visitor dispersal, emissions or destination outcomes, and the well-documented gap between intention and behaviour applies. Replication with alternative estimators such as PLS-SEM [189], with objective behavioural data and, ideally, with a longitudinal design would be valuable. Because the data were collected shortly before the new Law on Railway Safety and Interoperability and the Railway Agency took effect, a repeat survey after the new safety regime has been operating for two or three seasons would allow a before–after assessment of whether institutional change is reflected in tourists’ safety perceptions.
6.4. Future Research
Future research could extend the model to residents of the northern municipalities, whose support is critical to sustainable tourism [99,100]; compare the perceptions of rail users with those of non-users travelling by car or coach, following the users-versus-non-users designs of the tourism–public transport literature [61,169], in order to estimate the modal-shift potential of investment; include domestic tourists as a third group once a sufficient sample is available; test experimentally whether multilingual information and integrated ticketing change the evaluations of international visitors; and apply comparable designs to other Western Balkan railways where accession-driven modernisation and tourism dispersal objectives coincide [75,208].
7. Conclusions
Railway infrastructure is often discussed in Montenegro as a matter of freight logistics for the Port of Bar or of EU-accession compliance. This study shows that it is also a matter of tourism sustainability. Using a structural model estimated on a cross-sectional survey of 487 rail travellers, it shows that the perceived quality of track, stations and rolling stock is associated—through perceived safety and satisfaction, in a pattern consistent with the hypothesised chain—with the intentions of tourists to travel by rail again, to visit the inland and northern regions and to support low-carbon transport, and with their perception of the railway as a driver of sustainable destination development. Reliability is the strongest immediate correlate of satisfaction; safety is independently associated with intended future use—particularly among visitors from outside the region—and tourists strongly endorse the sustainability role of rail. Importance–performance analysis identifies track condition, punctuality and journey time as the priorities for investment, while pointing to inexpensive gains in information, ticketing, station facilities and intermodal integration. The practical message for the infrastructure manager, the operator, the national tourism organisation and the Government is that the rehabilitation of the Vrbnica–Bar line and the renewal of the passenger fleet should be planned, financed and communicated as a tourism-development programme, not only as a transport project; and that closing the benchmarks on railway safety and interoperability in the EU accession process would deliver a benefit measurable in the behaviour of the very visitors on whom the Montenegrin economy depends.
Three contributions follow from these findings. Theoretically, the study separates infrastructure quality from service reliability and from accessibility and shows that each has a distinct route to intentions: infrastructure quality works through perceived safety and satisfaction, reliability through satisfaction alone, and accessibility only weakly and indirectly. It also shows that perceived safety and the perceived sustainability contribution of rail are partially independent predictors of sustainable behavioural intentions rather than mere facets of satisfaction, and that the balance between them shifts with market of origin—a moderating effect that the measurement-invariance tests and the comparison of unstandardised coefficients allow us to interpret as substantive, although not as an effect of familiarity. In doing so, the paper moves the rail–tourism debate from the high-speed corridors of large economies, where most of the evidence has been produced, to the conventional, single-track mountain railway of a small transition economy—a setting that is far more common across the Western Balkans, Eastern Europe and other peripheral regions than the high-speed cases that dominate the literature—and it brings the perspective of the tourism–public transport literature, hitherto focused on urban and rural bus, tram and metro systems, to an interregional railway.
Empirically, the study provides the first quantitative evidence on how rail travellers in Montenegro perceive the quality, safety and sustainability role of the railway, collected in the last season before the new Law on Railway Safety and Interoperability and the Railway Agency took effect. The dataset therefore establishes a baseline against which the effects of the new institutional framework, of the rehabilitation of the Vrbnica–Bar line and of the new fleet can be measured. Methodologically, the combination of a structural model with an importance–performance analysis, together with the checks on cross-hair sensitivity, construct dimensionality, measurement invariance, direct-path tests of mediation and the robustness of the pooled estimates to the composition of the sample, offers a transferable template for destinations that wish to evaluate transport investment from the user’s perspective rather than from engineering or accounting indicators alone.
In practical terms, the results order the agenda. The physical rehabilitation of the Vrbnica–Bar line—track renewal, structures and signalling—remains the first priority, because it is at once a safety measure, the main lever of satisfaction and the precondition for shorter journey times. The second priority is reliability in the narrow sense—punctuality, frequency and connections—which the new fleet will improve only if timetable planning and intermodal coordination improve with it. The third is communication: for visitors from outside the region, who condition their future use of rail on perceived safety, the achievements of the past two decades and the new institutional safeguards must be made visible through modern rolling stock, well-maintained stations and multilingual information, which at present is provided systematically only in Montenegrin and English. The fourth is inexpensive but neglected: passenger information, digital ticketing, station facilities and connections with buses and airports score lowest of all twelve attributes and can be improved within a single season. Taken together, these priorities turn a transport project into a tourism-development programme that addresses the central sustainability problem of Montenegrin tourism—the concentration of more than nine out of ten overnight stays on a narrow coastal strip in a few summer months.
Finally, the findings carry a message beyond Montenegro. Across the Western Balkans and the wider European periphery, legacy railways are being rehabilitated with EU and international finance primarily to meet freight, connectivity and accession benchmarks. This study shows that the same investments are reflected in how visitors evaluate a destination and in their stated willingness to reward a safe and reliable railway with repeat use, with visits to less-developed regions and with a premium for low-carbon travel. Measuring those perceptions before, during and after rehabilitation—as this paper has begun to do—would allow governments and funders to count the tourism dividend of railway investment alongside its transport benefits.
Author Contributions
Conceptualisation, D.L. and V.N.; methodology, D.L. and A.R.; software, D.L. and M.A.; validation, V.N., D.J. and A.R.; formal analysis, D.L. and M.A.; investigation, D.L., A.R. and M.A.; resources, V.N. and D.J.; data curation, M.A.; writing—original draft preparation, D.L.; writing—review and editing, V.N., A.R., D.J. and M.A.; visualisation, D.L. and M.A.; supervision, V.N. and D.J.; project administration, A.R.; funding acquisition, V.N. All authors have read and agreed to the published version of the manuscript.
Funding
This research received no external funding.
Institutional Review Board Statement
Ethical review and approval were waived for this study by the Ethics Committee of the Faculty of Transport, Communications and Logistics, Budva (Adriatic University) as per Articles 9 and 16 of the Law on Academic Integrity (Official Gazette of Montenegro, No. 17/2019), Article 39 of the Code of Ethics of Adriatic University–Faculty of Transport, Communications and Logistics, Budva (No. 135-2/22, 21 March 2022), and Article 86 of the Statute of the Faculty.
Informed Consent Statement
Informed consent was obtained from all subjects involved in the study.
Data Availability Statement
The data presented in this study are available on request from the corresponding author.
Conflicts of Interest
The authors declare no conflicts of interest.
Abbreviations
The following abbreviations are used in this manuscript:
| AC | Rail-based accessibility |
| AIC/BIC | Akaike/Bayesian information criterion |
| ANOVA | Analysis of variance |
| AVE | Average variance extracted |
| CB-SEM | Covariance-based structural equation modelling |
| CFA | Confirmatory factor analysis |
| CFI | Comparative fit index |
| CI | Confidence interval |
| CR | Composite reliability |
| EBRD | European Bank for Reconstruction and Development |
| EIB | European Investment Bank |
| ERTMS | European Rail Traffic Management System |
| GFI | Goodness-of-fit index |
| HSR | High-speed rail |
| IPA | Importance–performance analysis; also Instrument for Pre-Accession Assistance (EU funding) |
| IQ | Perceived railway infrastructure quality |
| PLS-SEM | Partial least squares structural equation modelling |
| PS | Perceived safety |
| RMSEA | Root mean square error of approximation |
| SAT | Satisfaction with the rail experience |
| SBI | Sustainable tourism behavioural intentions |
| SDP | Perceived contribution of rail to sustainable destination development |
| SEM | Structural equation modelling |
| SR | Service reliability |
| SRMR | Standardised root mean square residual |
| TEN-T | Trans-European Transport Network |
| TLI | Tucker–Lewis index |
| WBIF | Western Balkans Investment Framework |
| ŽICG | Željeznička infrastruktura Crne Gore (infrastructure manager) |
| ŽPCG | Železnički prevoz Crne Gore (passenger operator) |
Appendix A. Measurement Items
Table A1.
Constructs, items and sources.
Table A2.
Discriminant validity: square root of the AVE (diagonal, bold), latent correlations from the CFA (below the diagonal) and HTMT ratios (above the diagonal, italics).
Table A3.
Alternative measurement models (maximum likelihood, n = 487).
Appendix B. Model Syntax and Estimation Settings
Models were estimated with semopy 2.3.11 [200] in Python 3.13 by maximum likelihood (objective MLW, default optimiser), with the first indicator of each construct fixed to 1. The measurement model (CFA) consists of the seven measurement equations below with all factor covariances free; the structural model replaces the free covariances among the endogenous constructs with the regression equations listed. Bootstrap resamples (5000, with replacement, n = 487) re-estimated the complete structural model; the ULMC, the measurement-invariance models and the two-group structural model with equality constraints were estimated with the same maximum-likelihood fit function implemented in NumPy/SciPy and verified to reproduce the semopy solution for the pooled sample.
- IQ =~ IQ1 + IQ2 + IQ3 + IQ4 + IQ5
- PS =~ PS1 + PS2 + PS3 + PS4
- SR =~ SR1 + SR2 + SR3 + SR4
- AC =~ AC1 + AC2 + AC3
- SAT =~ SAT1 + SAT2 + SAT3 + SAT4
- SDP =~ SDP1 + SDP2 + SDP3 + SDP4
- SBI =~ SBI1 + SBI2 + SBI3 + SBI4 + SBI5
- PS ~ IQ
- SAT ~ IQ + PS + SR + AC
- SDP ~ IQ + SAT
- SBI ~ SAT + PS + SDP
- IQ ~~ SR
- IQ ~~ AC
- SR ~~ AC
- Augmented model (Section 5.4): SBI ~ SAT + PS + SDP + IQ + SR + AC
- ULMC (Section 5.2): CMV =~ a*IQ1 + a*IQ2 + … + a*SBI5; CMV ~~ 0*IQ, 0*PS, 0*SR, 0*AC, 0*SAT, 0*SDP, 0*SBI
References
- Prideaux, B. The role of the transport system in destination development. Tour. Manag. 2000, 21, 53–63. [Google Scholar] [CrossRef] [Scilit]
- Page, S.J. Transport and Tourism: Global Perspectives, 3rd ed.; Pearson Education: Harlow, UK, 2009. [Google Scholar]
- Lumsdon, L.; Page, S.J. (Eds.) Tourism and Transport: Issues and Agenda for the New Millennium; Elsevier: Oxford, UK, 2004. [Google Scholar]
- Khadaroo, J.; Seetanah, B. Transport infrastructure and tourism development. Ann. Tour. Res. 2007, 34, 1021–1032. [Google Scholar] [CrossRef] [Scilit]
- Khadaroo, J.; Seetanah, B. The role of transport infrastructure in international tourism development: A gravity model approach. Tour. Manag. 2008, 29, 831–840. [Google Scholar] [CrossRef] [Scilit]
- Lenzen, M.; Sun, Y.-Y.; Faturay, F.; Ting, Y.-P.; Geschke, A.; Malik, A. The carbon footprint of global tourism. Nat. Clim. Change 2018, 8, 522–528. [Google Scholar] [CrossRef] [Scilit]
- Gössling, S.; Peeters, P. Assessing tourism’s global environmental impact 1900–2050. J. Sustain. Tour. 2015, 23, 639–659. [Google Scholar] [CrossRef] [Scilit]
- Scott, D.; Gössling, S.; Hall, C.M. International tourism and climate change. WIREs Clim. Change 2012, 3, 213–232. [Google Scholar] [CrossRef] [Scilit]
- European Environment Agency. Transport and Environment Report 2020: Train or Plane? EEA Report No. 19/2020; Publications Office of the European Union: Luxembourg, 2021. [Google Scholar]
- European Commission. The European Green Deal; COM(2019) 640 Final; European Commission: Brussels, Belgium, 2019. [Google Scholar]
- European Commission. Sustainable and Smart Mobility Strategy—Putting European Transport on Track for the Future; COM(2020) 789 Final; European Commission: Brussels, Belgium, 2020. [Google Scholar]
- Banister, D. The sustainable mobility paradigm. Transp. Policy 2008, 15, 73–80. [Google Scholar] [CrossRef] [Scilit]
- European Union. Regulation (EU) 2024/1679 of the European Parliament and of the Council of 13 June 2024 on Union Guidelines for the Development of the Trans-European Transport Network. Off. J. Eur. Union 2024, 2024/1679. Available online: https://eur-lex.europa.eu/eli/reg/2024/1679/oj/eng (accessed on 7 September 2026).
- European Union. Treaty establishing the Transport Community. Off. J. Eur. Union 2017, L 278, 3–53. [Google Scholar]
- Statistical Office of Montenegro (MONSTAT). Arrivals and Overnight Stays of Tourists, Total—2025; Release No. 27-2/2026; MONSTAT: Podgorica, Montenegro, 2026; Available online: https://www.monstat.org/uploads/files/TURIZAM/ukupno/2025k/Arrivals%20and%20overnights%20of%20tourists%20total%202025.pdf (accessed on 7 September 2026).
- Bigović, M. Quantifying seasonality in tourism: A case study of Montenegro. Acad. Turist. 2011, 4, 15–32. [Google Scholar]
- Government of Montenegro, Ministry of Economic Development and Tourism. Strategija Razvoja Turizma Crne Gore 2022–2025 sa Akcionim Planom [Tourism Development Strategy of Montenegro 2022–2025 with Action Plan]; Government of Montenegro: Podgorica, Montenegro, 2022. (In Montenegrin)
- Government of Montenegro, Ministry of Sustainable Development and Tourism. Nacionalna Strategija Održivog Razvoja do 2030. Godine [National Strategy for Sustainable Development until 2030]; Government of Montenegro: Podgorica, Montenegro, 2016. (In Montenegrin)
- Željeznička Infrastruktura Crne Gore AD (ŽICG). Project of Reconstruction of the Railway Line Vrbnica–Bar. Available online: https://www.old.zicg.me/piu/eng/opsteopruzi.html (accessed on 7 September 2026).
- Railway Gazette International. Željeznička Infrastruktura Crne Gore AD—Knowledge Hub. Available online: https://www.railwaygazette.com/data/knowledge-hub/organisation-categories/organisation-countries/montenegro/zeleznicka-infrastruktura-crne-gore-ad/ (accessed on 7 September 2026).
- The Washington Post. Montenegro Train Crash Leaves at Least 39 Dead. 2006. Available online: https://www.washingtonpost.com/archive/politics/2006/01/24/montenegro-train-crash-leaves-at-least-39-dead/654cc645-72ad-4fd9-9c0b-47386b6be517/ (accessed on 7 September 2026).
- Evans, A.W. Fatal train accidents on Europe’s railways: 1980–2009. Accid. Anal. Prev. 2011, 43, 391–401. [Google Scholar] [CrossRef] [Scilit] [PubMed]
- Eurostat. Railway Passenger Transport Statistics—Quarterly and Annual Data. Statistics Explained. Available online: https://ec.europa.eu/eurostat/statistics-explained/index.php?title=Railway_passenger_transport_statistics_-_quarterly_and_annual_data (accessed on 7 September 2026).
- Statistical Office of Montenegro (MONSTAT). Transport—II Quarter 2025; MONSTAT: Podgorica, Montenegro, 2025; Available online: https://monstat.org/uploads/files/Saobracaj/2025/2k/SAOBRACAJ_EN_IIQ_2025.pdf (accessed on 7 September 2026).
- Official Gazette of Montenegro. Zakon o Željeznici [Law on Railways]; No. 89/2025; Official Gazette of Montenegro: Podgorica, Montenegro, 2025. (In Montenegrin) [Google Scholar]
- Official Gazette of Montenegro. Zakon o Bezbjednosti i Interoperabilnosti Željeznice [Law on Railway Safety and Interoperability]; No. 160/2025; Official Gazette of Montenegro: Podgorica, Montenegro, 2025. (In Montenegrin) [Google Scholar]
- Government of Montenegro. Odluka o Osnivanju Agencije za Željeznice [Decision on the Establishment of the Railway Agency], Adopted 31 December 2025, with Effect from 7 January 2026; Government of Montenegro: Podgorica, Montenegro, 2026. (In Montenegrin)
- Railway Gazette International. Montenegro Orders Stadler Trains for ‘Progress, European Integration and Regional Connectivity’. 2026. Available online: https://www.railwaygazette.com/emu/2026/05/28/montenegro-orders-stadler-trains-for-progress-european-integration-and-regional-connectivity/ (accessed on 7 September 2026).
- Stadler Rail AG. Stadler Delivers FLIRT Trains to Montenegro for the First Time. Media Release. 2026. Available online: https://www.stadlerrail.com/en/media/media-releases/stadler-delivers-flirt-trains-to-montenegro-for-the-first-time (accessed on 7 September 2026).
- Albalate, D.; Fageda, X. High speed rail and tourism: Empirical evidence from Spain. Transp. Res. Part A Policy Pract. 2016, 85, 174–185. [Google Scholar] [CrossRef] [Scilit]
- Pagliara, F.; La Pietra, A.; Gomez, J.; Vassallo, J.M. High Speed Rail and the tourism market: Evidence from the Madrid case study. Transp. Policy 2015, 37, 187–194. [Google Scholar] [CrossRef] [Scilit]
- Gao, Y.; Su, W.; Wang, K. Does high-speed rail boost tourism growth? New evidence from China. Tour. Manag. 2019, 72, 220–231. [Google Scholar] [CrossRef] [Scilit]
- Masson, S.; Petiot, R. Can the high speed rail reinforce tourism attractiveness? The case of the high speed rail between Perpignan (France) and Barcelona (Spain). Technovation 2009, 29, 611–617. [Google Scholar] [CrossRef] [Scilit]
- Yin, P.; Pagliara, F.; Wilson, A. How does high-speed rail affect tourism? A case study of the capital region of China. Sustainability 2019, 11, 472. [Google Scholar] [CrossRef] [Scilit]
- Conlin, M.V.; Bird, G.R. (Eds.) Railway Heritage and Tourism: Global Perspectives; Channel View Publications: Bristol, UK, 2014. [Google Scholar]
- Blancheton, B.; Marchi, J.-J. The three systems of rail tourism: French case. Tour. Manag. Perspect. 2013, 5, 31–40. [Google Scholar] [CrossRef] [Scilit]
- Dallen, J. Sustainable transport, market segmentation and tourism: The Looe Valley branch line railway, Cornwall, UK. J. Sustain. Tour. 2007, 15, 180–199. [Google Scholar] [CrossRef] [Scilit]
- Le-Klähn, D.-T.; Hall, C.M. Tourist use of public transport at destinations—A review. Curr. Issues Tour. 2015, 18, 785–803. [Google Scholar] [CrossRef] [Scilit]
- Hall, C.M.; Le-Klähn, D.-T.; Ram, Y. Tourism, Public Transport and Sustainable Mobility; Channel View Publications: Bristol, UK, 2017. [Google Scholar]
- Government of Montenegro, Ministry of Transport and Maritime Affairs. Strategija Razvoja Saobraćaja Crne Gore 2019–2035 [Transport Development Strategy of Montenegro 2019–2035]; Government of Montenegro: Podgorica, Montenegro, 2019. (In Montenegrin)
- European Commission. An Economic and Investment Plan for the Western Balkans; COM(2020) 641 Final; European Commission: Brussels, Belgium, 2020. [Google Scholar]
- Hall, D.R. Conceptualising tourism transport: Inequality and externality issues. J. Transp. Geogr. 1999, 7, 181–188. [Google Scholar] [CrossRef] [Scilit]
- Duval, D.T. Tourism and Transport: Modes, Networks and Flows; Channel View Publications: Clevedon, UK, 2007. [Google Scholar]
- Ren, X.; Xiao, Y.; Dong, K.; Wang, K. Adding fuel to the flames? Spatial convergence effects of railway development on global tourism industry. Transp. Policy 2025, 162, 545–558. [Google Scholar] [CrossRef] [Scilit]
- Aschauer, D.A. Is public expenditure productive? J. Monet. Econ. 1989, 23, 177–200. [Google Scholar] [CrossRef] [Scilit]
- Banister, D.; Berechman, Y. Transport investment and the promotion of economic growth. J. Transp. Geogr. 2001, 9, 209–218. [Google Scholar] [CrossRef] [Scilit]
- Vickerman, R.; Spiekermann, K.; Wegener, M. Accessibility and economic development in Europe. Reg. Stud. 1999, 33, 1–15. [Google Scholar] [CrossRef] [Scilit]
- Laird, J.J.; Venables, A.J. Transport investment and economic performance: A framework for project appraisal. Transp. Policy 2017, 56, 1–11. [Google Scholar] [CrossRef] [Scilit]
- Geurs, K.T.; van Wee, B. Accessibility evaluation of land-use and transport strategies: Review and research directions. J. Transp. Geogr. 2004, 12, 127–140. [Google Scholar] [CrossRef] [Scilit]
- Campa, J.L.; López-Lambas, M.E.; Guirao, B. High speed rail effects on tourism: Spanish empirical evidence derived from China’s modelling experience. J. Transp. Geogr. 2016, 57, 44–54. [Google Scholar] [CrossRef] [Scilit] [PubMed]
- Guirao, B.; Campa, J.L. The effects of tourism on HSR: Spanish empirical evidence derived from a multi-criteria corridor selection methodology. J. Transp. Geogr. 2015, 47, 37–46. [Google Scholar] [CrossRef] [Scilit]
- Delaplace, M.; Pagliara, F.; Perrin, J.; Mermet, S. Can High Speed Rail foster the choice of destination for tourism purpose? Procedia Soc. Behav. Sci. 2014, 111, 166–175. [Google Scholar] [CrossRef] [Scilit]
- Pagliara, F.; Mauriello, F.; Garofalo, A. Exploring the interdependences between High Speed Rail systems and tourism: Some evidence from Italy. Transp. Res. Part A Policy Pract. 2017, 106, 300–308. [Google Scholar] [CrossRef] [Scilit]
- Cascetta, E.; Cartenì, A.; Henke, I.; Pagliara, F. Economic growth, transport accessibility and regional equity impacts of high-speed railways in Italy: Ten years ex post evaluation and future perspectives. Transp. Res. Part A Policy Pract. 2020, 139, 412–428. [Google Scholar] [CrossRef] [Scilit] [PubMed]
- Wang, X.; Huang, S.; Zou, T.; Yan, H. Effects of the high speed rail network on China’s regional tourism development. Tour. Manag. Perspect. 2012, 1, 34–38. [Google Scholar] [CrossRef] [Scilit]
- Chen, Z.; Haynes, K.E. Impact of high-speed rail on international tourism demand in China. Appl. Econ. Lett. 2015, 22, 57–60. [Google Scholar] [CrossRef] [Scilit]
- Pagliara, F.; Mauriello, F.; Russo, L. A regression tree approach for investigating the impact of high speed rail on tourists’ choices. Sustainability 2020, 12, 910. [Google Scholar] [CrossRef] [Scilit]
- Boto-García, D.; Pérez, L. The effect of high-speed rail connectivity and accessibility on tourism seasonality. J. Transp. Geogr. 2023, 107, 103546. [Google Scholar] [CrossRef] [Scilit]
- Givoni, M. Development and impact of the modern high-speed train: A review. Transp. Rev. 2006, 26, 593–611. [Google Scholar] [CrossRef] [Scilit]
- Nash, C. When to invest in high-speed rail. J. Rail Transp. Plan. Manag. 2015, 5, 12–22. [Google Scholar] [CrossRef] [Scilit]
- Le-Klähn, D.-T.; Gerike, R.; Hall, C.M. Visitor users vs. non-users of public transport: The case of Munich, Germany. J. Destin. Mark. Manag. 2014, 3, 152–161. [Google Scholar] [CrossRef] [Scilit]
- Thompson, K.; Schofield, P. An investigation of the relationship between public transport performance and destination satisfaction. J. Transp. Geogr. 2007, 15, 136–144. [Google Scholar] [CrossRef] [Scilit]
- Gronau, W.; Kagermeier, A. Key factors for successful leisure and tourism public transport provision. J. Transp. Geogr. 2007, 15, 127–135. [Google Scholar] [CrossRef] [Scilit]
- Albalate, D.; Bel, G. Tourism and urban public transport: Holding demand pressure under supply constraints. Tour. Manag. 2010, 31, 425–433. [Google Scholar] [CrossRef] [Scilit]
- Guiver, J.; Lumsdon, L.; Weston, R.; Ferguson, M. Do buses help meet tourism objectives? The contribution and potential of scheduled buses in rural destination areas. Transp. Policy 2007, 14, 275–282. [Google Scholar] [CrossRef] [Scilit]
- Lumsdon, L.M. Factors affecting the design of tourism bus services. Ann. Tour. Res. 2006, 33, 748–766. [Google Scholar] [CrossRef] [Scilit]
- Dickinson, J.E.; Lumsdon, L. Slow Travel and Tourism; Earthscan: London, UK, 2010. [Google Scholar]
- Dickinson, J.E.; Lumsdon, L.M.; Robbins, D. Slow travel: Issues for tourism and climate change. J. Sustain. Tour. 2011, 19, 281–300. [Google Scholar] [CrossRef] [Scilit]
- Serdane, Z.; Maccarrone-Eaglen, A.; Sharifi, S. Conceptualising slow tourism: A perspective from Latvia. Tour. Recreat. Res. 2020, 45, 337–350. [Google Scholar] [CrossRef] [Scilit]
- Su, M.M.; Wall, G. The Qinghai–Tibet railway and Tibetan tourism: Travelers’ perspectives. Tour. Manag. 2009, 30, 650–657. [Google Scholar] [CrossRef] [Scilit]
- Henderson, J.C. Railways as heritage attractions: Singapore’s Tanjong Pagar station. J. Herit. Tour. 2011, 6, 73–79. [Google Scholar] [CrossRef] [Scilit]
- Peira, G.; Lo Giudice, A.; Miraglia, S. Railway and tourism: A systematic literature review. Tour. Hosp. 2022, 3, 69–79. [Google Scholar] [CrossRef] [Scilit]
- Vujko, A.; Gajić, T. Opportunities for tourism development and cooperation in the region by improving the quality of tourism services—The ‘Danube Cycle Route’ case study. Econ. Res.-Ekon. Istraž. 2014, 27, 847–860. [Google Scholar] [CrossRef] [Scilit]
- Dragin, A.S.; Jovičić, D.; Lukić, T. Cruising along the river Danube: Contemporary tourism trend in Serbia. Geogr. Pannonica 2010, 14, 98–108. [Google Scholar] [CrossRef] [Scilit]
- Macura, D.; Bošković, B.; Bojović, N.; Milenković, M. A model for prioritization of rail infrastructure projects using ANP. Int. J. Transp. Econ. 2011, 38, 285–309. [Google Scholar]
- Macura, D.; Laketić, M.; Pamučar, D.; Marinković, D. Risk analysis model with interval type-2 fuzzy FMEA—Case study of railway infrastructure projects in the Republic of Serbia. Acta Polytech. Hung. 2022, 19, 103–118. [Google Scholar] [CrossRef] [Scilit]
- Blagojević, A.; Stević, Ž.; Marinković, D.; Kasalica, S.; Rajilić, S. A novel entropy-fuzzy PIPRECIA-DEA model for safety evaluation of railway traffic. Symmetry 2020, 12, 1479. [Google Scholar] [CrossRef] [Scilit]
- World Commission on Environment and Development. Our Common Future; Oxford University Press: Oxford, UK, 1987. [Google Scholar]
- Bramwell, B.; Lane, B. Sustainable tourism: An evolving global approach. J. Sustain. Tour. 1993, 1, 1–5. [Google Scholar] [CrossRef] [Scilit]
- Hunter, C. Sustainable tourism as an adaptive paradigm. Ann. Tour. Res. 1997, 24, 850–867. [Google Scholar] [CrossRef] [Scilit]
- Butler, R.W. Sustainable tourism: A state-of-the-art review. Tour. Geogr. 1999, 1, 7–25. [Google Scholar] [CrossRef] [Scilit]
- Sharpley, R. Tourism and sustainable development: Exploring the theoretical divide. J. Sustain. Tour. 2000, 8, 1–19. [Google Scholar] [CrossRef] [Scilit]
- Saarinen, J. Traditions of sustainability in tourism studies. Ann. Tour. Res. 2006, 33, 1121–1140. [Google Scholar] [CrossRef] [Scilit]
- UNEP; UNWTO. Making Tourism More Sustainable: A Guide for Policy Makers; United Nations Environment Programme and World Tourism Organization: Paris, France; Madrid, Spain, 2005. [Google Scholar]
- Weaver, D.B. Sustainable Tourism: Theory and Practice; Elsevier Butterworth-Heinemann: Oxford, UK, 2006. [Google Scholar]
- Hall, C.M. Policy learning and policy failure in sustainable tourism governance: From first- and second-order to third-order change? J. Sustain. Tour. 2011, 19, 649–671. [Google Scholar] [CrossRef] [Scilit]
- Buckley, R. Sustainable tourism: Research and reality. Ann. Tour. Res. 2012, 39, 528–546. [Google Scholar] [CrossRef] [Scilit]
- Peeters, P.; Dubois, G. Tourism travel under climate change mitigation constraints. J. Transp. Geogr. 2010, 18, 447–457. [Google Scholar] [CrossRef] [Scilit]
- United Nations. Transforming Our World: The 2030 Agenda for Sustainable Development; A/RES/70/1; United Nations: New York, NY, USA, 2015. [Google Scholar]
- Gössling, S.; Scott, D.; Hall, C.M. Pandemics, tourism and global change: A rapid assessment of COVID-19. J. Sustain. Tour. 2021, 29, 1–20. [Google Scholar] [CrossRef] [Scilit]
- Holden, E.; Banister, D.; Gössling, S.; Gilpin, G.; Linnerud, K. Grand narratives for sustainable mobility: A conceptual review. Energy Res. Soc. Sci. 2020, 65, 101454. [Google Scholar] [CrossRef] [Scilit]
- Litman, T. Developing indicators for comprehensive and sustainable transport planning. Transp. Res. Rec. 2007, 2017, 10–15. [Google Scholar] [CrossRef] [Scilit] [PubMed]
- European Union. Regulation (EU) No 1315/2013 of the European Parliament and of the Council of 11 December 2013 on Union guidelines for the development of the trans-European transport network. Off. J. Eur. Union 2013, L 348, 1–128. [Google Scholar]
- Koens, K.; Postma, A.; Papp, B. Is overtourism overused? Understanding the impact of tourism in a city context. Sustainability 2018, 10, 4384. [Google Scholar] [CrossRef] [Scilit]
- Peeters, P.; Gössling, S.; Klijs, J.; Milano, C.; Novelli, M.; Dijkmans, C.; Eijgelaar, E.; Hartman, S.; Heslinga, J.; Isaac, R.; et al. Research for TRAN Committee—Overtourism: Impact and Possible Policy Responses; European Parliament, Policy Department for Structural and Cohesion Policies: Brussels, Belgium, 2018. [Google Scholar]
- Mihalic, T. Conceptualising overtourism: A sustainability approach. Ann. Tour. Res. 2020, 84, 103025. [Google Scholar] [CrossRef] [Scilit]
- Butler, R.W. Seasonality in tourism: Issues and implications. In Seasonality in Tourism; Baum, T., Lundtorp, S., Eds.; Pergamon: Oxford, UK, 2001; pp. 5–21. [Google Scholar]
- Koenig-Lewis, N.; Bischoff, E.E. Seasonality research: The state of the art. Int. J. Tour. Res. 2005, 7, 201–219. [Google Scholar] [CrossRef] [Scilit]
- Gursoy, D.; Jurowski, C.; Uysal, M. Resident attitudes: A structural modeling approach. Ann. Tour. Res. 2002, 29, 79–105. [Google Scholar] [CrossRef] [Scilit]
- Nunkoo, R.; Ramkissoon, H. Developing a community support model for tourism. Ann. Tour. Res. 2011, 38, 964–988. [Google Scholar] [CrossRef] [Scilit]
- Parasuraman, A.; Zeithaml, V.A.; Berry, L.L. A conceptual model of service quality and its implications for future research. J. Mark. 1985, 49, 41–50. [Google Scholar] [CrossRef] [Scilit]
- Parasuraman, A.; Zeithaml, V.A.; Berry, L.L. SERVQUAL: A multiple-item scale for measuring consumer perceptions of service quality. J. Retail. 1988, 64, 12–40. [Google Scholar]
- Cronin, J.J.; Taylor, S.A. Measuring service quality: A reexamination and extension. J. Mark. 1992, 56, 55–68. [Google Scholar] [CrossRef] [Scilit]
- de Oña, J.; de Oña, R. Quality of service in public transport based on customer satisfaction surveys: A review and assessment of methodological approaches. Transp. Sci. 2015, 49, 605–622. [Google Scholar] [CrossRef] [Scilit]
- Eboli, L.; Mazzulla, G. Service quality attributes affecting customer satisfaction for bus transit. J. Public Transp. 2007, 10, 21–34. [Google Scholar] [CrossRef] [Scilit]
- Eboli, L.; Mazzulla, G. A methodology for evaluating transit service quality based on subjective and objective measures from the passenger’s point of view. Transp. Policy 2011, 18, 172–181. [Google Scholar] [CrossRef] [Scilit]
- de Oña, J.; de Oña, R.; Eboli, L.; Mazzulla, G. Perceived service quality in bus transit service: A structural equation approach. Transp. Policy 2013, 29, 219–226. [Google Scholar] [CrossRef] [Scilit]
- Hensher, D.A.; Stopher, P.; Bullock, P. Service quality—Developing a service quality index in the provision of commercial bus contracts. Transp. Res. Part A Policy Pract. 2003, 37, 499–517. [Google Scholar] [CrossRef] [Scilit]
- Redman, L.; Friman, M.; Gärling, T.; Hartig, T. Quality attributes of public transport that attract car users: A research review. Transp. Policy 2013, 25, 119–127. [Google Scholar] [CrossRef] [Scilit]
- Dell’Olio, L.; Ibeas, A.; Cecín, P. The quality of service desired by public transport users. Transp. Policy 2011, 18, 217–227. [Google Scholar] [CrossRef] [Scilit]
- de Oña, J. Service quality, satisfaction and behavioral intentions towards public transport from the point of view of private vehicle users. Transportation 2022, 49, 237–269. [Google Scholar] [CrossRef] [Scilit]
- EN 13816:2002; Transportation—Logistics and Services—Public Passenger Transport—Service Quality Definition, Targeting and Measurement. CEN: Brussels, Belgium, 2002.
- Transportation Research Board. Transit Capacity and Quality of Service Manual, 3rd ed.; TCRP Report 165; The National Academies Press: Washington, DC, USA, 2013. [Google Scholar]
- Nathanail, E. Measuring the quality of service for passengers on the Hellenic railways. Transp. Res. Part A Policy Pract. 2008, 42, 48–66. [Google Scholar] [CrossRef] [Scilit]
- Geetika; Nandan, S. Determinants of customer satisfaction on service quality: A study of railway platforms in India. J. Public Transp. 2010, 13, 97–113. [Google Scholar] [CrossRef] [Scilit]
- Cavana, R.Y.; Corbett, L.M.; Lo, Y.L. Developing zones of tolerance for managing passenger rail service quality. Int. J. Qual. Reliab. Manag. 2007, 24, 7–31. [Google Scholar] [CrossRef] [Scilit]
- de Oña, J. Understanding the mediator role of satisfaction in public transport: A cross-country analysis. Transp. Policy 2021, 100, 129–149. [Google Scholar] [CrossRef] [Scilit]
- Esmailpour, J.; Aghabayk, K.; Abrari Vajari, M.; De Gruyter, C. Importance–performance analysis (IPA) of bus service attributes: A case study in a developing country. Transp. Res. Part A Policy Pract. 2020, 142, 129–150. [Google Scholar] [CrossRef] [Scilit]
- Tirachini, A.; Cats, O. COVID-19 and public transportation: Current assessment, prospects, and research needs. J. Public Transp. 2020, 22, 1–21. [Google Scholar] [CrossRef] [Scilit] [PubMed]
- Friman, M.; Fellesson, M. Service supply and customer satisfaction in public transportation: The quality paradox. J. Public Transp. 2009, 12, 57–69. [Google Scholar] [CrossRef] [Scilit]
- Esveld, C. Modern Railway Track, 2nd ed.; MRT-Productions: Zaltbommel, The Netherlands, 2001. [Google Scholar]
- Sadeghi, J.; Askarinejad, H. Development of improved railway track degradation models. Struct. Infrastruct. Eng. 2010, 6, 675–688. [Google Scholar] [CrossRef] [Scilit]
- Andrews, J.; Prescott, D.; De Rozières, F. A stochastic model for railway track asset management. Reliab. Eng. Syst. Saf. 2014, 130, 76–84. [Google Scholar] [CrossRef] [Scilit]
- Guler, H. Decision support system for railway track maintenance and renewal management. J. Comput. Civ. Eng. 2013, 27, 292–306. [Google Scholar] [CrossRef] [Scilit]
- Zoeteman, A. Life cycle cost analysis for managing rail infrastructure. Eur. J. Transp. Infrastruct. Res. 2001, 1, 391–413. [Google Scholar] [CrossRef] [Scilit]
- Koetse, M.J.; Rietveld, P. The impact of climate change and weather on transport: An overview of empirical findings. Transp. Res. Part D Transp. Environ. 2009, 14, 205–221. [Google Scholar] [CrossRef] [Scilit]
- Dawson, D.; Shaw, J.; Gehrels, W.R. Sea-level rise impacts on transport infrastructure: The notorious case of the coastal railway line at Dawlish, England. J. Transp. Geogr. 2016, 51, 97–109. [Google Scholar] [CrossRef] [Scilit]
- Nemry, F.; Demirel, H. Impacts of Climate Change on Transport: A Focus on Road and Rail Transport Infrastructures; JRC Scientific and Policy Reports; Publications Office of the European Union: Luxembourg, 2012. [Google Scholar]
- Oliver, R.L. A cognitive model of the antecedents and consequences of satisfaction decisions. J. Mark. Res. 1980, 17, 460–469. [Google Scholar] [CrossRef] [Scilit]
- Baker, D.A.; Crompton, J.L. Quality, satisfaction and behavioral intentions. Ann. Tour. Res. 2000, 27, 785–804. [Google Scholar] [CrossRef] [Scilit]
- Žabkar, V.; Brenčič, M.M.; Dmitrović, T. Modelling perceived quality, visitor satisfaction and behavioural intentions at the destination level. Tour. Manag. 2010, 31, 537–546. [Google Scholar] [CrossRef] [Scilit]
- Chi, C.G.-Q.; Qu, H. Examining the structural relationships of destination image, tourist satisfaction and destination loyalty: An integrated approach. Tour. Manag. 2008, 29, 624–636. [Google Scholar] [CrossRef] [Scilit]
- Yoon, Y.; Uysal, M. An examination of the effects of motivation and satisfaction on destination loyalty: A structural model. Tour. Manag. 2005, 26, 45–56. [Google Scholar] [CrossRef] [Scilit]
- European Union. Directive (EU) 2016/798 of the European Parliament and of the Council of 11 May 2016 on railway safety. Off. J. Eur. Union 2016, L 138, 102–149. [Google Scholar]
- European Union. Directive (EU) 2016/797 of the European Parliament and of the Council of 11 May 2016 on the interoperability of the rail system within the European Union. Off. J. Eur. Union 2016, L 138, 44–101. [Google Scholar]
- European Union Agency for Railways. Report on Railway Safety and Interoperability in the EU 2024; Publications Office of the European Union: Luxembourg, 2024. [Google Scholar]
- Liu, X.; Saat, M.R.; Barkan, C.P.L. Analysis of causes of major train derailment and their effect on accident rates. Transp. Res. Rec. 2012, 2289, 154–163. [Google Scholar] [CrossRef] [Scilit]
- Kyriakidis, M.; Hirsch, R.; Majumdar, A. Metro railway safety: An analysis of accident precursors. Saf. Sci. 2012, 50, 1535–1548. [Google Scholar] [CrossRef] [Scilit]
- Leveson, N. A new accident model for engineering safer systems. Saf. Sci. 2004, 42, 237–270. [Google Scholar] [CrossRef] [Scilit]
- Reason, J. Managing the Risks of Organizational Accidents; Ashgate: Aldershot, UK, 1997. [Google Scholar]
- Wilson, J.R.; Norris, B.J. Rail human factors: Past, present and future. Appl. Ergon. 2005, 36, 649–660. [Google Scholar] [CrossRef] [Scilit] [PubMed]
- Slovic, P. Perception of risk. Science 1987, 236, 280–285. [Google Scholar] [CrossRef] [Scilit] [PubMed]
- Roehl, W.S.; Fesenmaier, D.R. Risk perceptions and pleasure travel: An exploratory analysis. J. Travel Res. 1992, 30, 17–26. [Google Scholar] [CrossRef] [Scilit]
- Sönmez, S.F.; Graefe, A.R. Influence of terrorism risk on foreign tourism decisions. Ann. Tour. Res. 1998, 25, 112–144. [Google Scholar] [CrossRef] [Scilit]
- Sönmez, S.F.; Graefe, A.R. Determining future travel behavior from past travel experience and perceptions of risk and safety. J. Travel Res. 1998, 37, 171–177. [Google Scholar] [CrossRef] [Scilit]
- Lepp, A.; Gibson, H. Tourist roles, perceived risk and international tourism. Ann. Tour. Res. 2003, 30, 606–624. [Google Scholar] [CrossRef] [Scilit]
- Reisinger, Y.; Mavondo, F. Travel anxiety and intentions to travel internationally: Implications of travel risk perception. J. Travel Res. 2005, 43, 212–225. [Google Scholar] [CrossRef] [Scilit]
- George, R. Tourist’s perceptions of safety and security while visiting Cape Town. Tour. Manag. 2003, 24, 575–585. [Google Scholar] [CrossRef] [Scilit]
- Pizam, A.; Mansfeld, Y. (Eds.) Tourism, Security and Safety: From Theory to Practice; Elsevier Butterworth-Heinemann: Oxford, UK, 2006. [Google Scholar]
- Kozak, M.; Crotts, J.C.; Law, R. The impact of the perception of risk on international travellers. Int. J. Tour. Res. 2007, 9, 233–242. [Google Scholar] [CrossRef] [Scilit]
- Fuchs, G.; Reichel, A. An exploratory inquiry into destination risk perceptions and risk reduction strategies of first time vs. repeat visitors to a highly volatile destination. Tour. Manag. 2011, 32, 266–276. [Google Scholar] [CrossRef] [Scilit]
- Zenker, S.; Kock, F. The coronavirus pandemic—A critical discussion of a tourism research agenda. Tour. Manag. 2020, 81, 104164. [Google Scholar] [CrossRef] [Scilit] [PubMed]
- Neuburger, L.; Egger, R. Travel risk perception and travel behaviour during the COVID-19 pandemic 2020: A case study of the DACH region. Curr. Issues Tour. 2021, 24, 1003–1016. [Google Scholar] [CrossRef] [Scilit]
- Ceccato, V.; Gaudelet, N.; Graf, G. Crime and safety in transit environments: A systematic review of the English and the French literature, 1970–2020. Public Transp. 2022, 14, 105–153. [Google Scholar] [CrossRef] [Scilit]
- Zeithaml, V.A.; Berry, L.L.; Parasuraman, A. The behavioral consequences of service quality. J. Mark. 1996, 60, 31–46. [Google Scholar] [CrossRef] [Scilit]
- Bigné, J.E.; Sánchez, M.I.; Sánchez, J. Tourism image, evaluation variables and after purchase behaviour: Inter-relationship. Tour. Manag. 2001, 22, 607–616. [Google Scholar] [CrossRef] [Scilit]
- Ajzen, I. The theory of planned behavior. Organ. Behav. Hum. Decis. Process. 1991, 50, 179–211. [Google Scholar] [CrossRef] [Scilit]
- Lam, T.; Hsu, C.H.C. Predicting behavioral intention of choosing a travel destination. Tour. Manag. 2006, 27, 589–599. [Google Scholar] [CrossRef] [Scilit]
- Han, H. Consumer behavior and environmental sustainability in tourism and hospitality: A review of theories, concepts, and latest research. J. Sustain. Tour. 2021, 29, 1021–1042. [Google Scholar] [CrossRef] [Scilit]
- Loureiro, S.M.C.; Guerreiro, J.; Han, H. Past, present, and future of pro-environmental behavior in tourism and hospitality: A text-mining approach. J. Sustain. Tour. 2022, 30, 258–278. [Google Scholar] [CrossRef] [Scilit]
- Baloglu, S.; McCleary, K.W. A model of destination image formation. Ann. Tour. Res. 1999, 26, 868–897. [Google Scholar] [CrossRef] [Scilit]
- Ritchie, J.R.B.; Crouch, G.I. The Competitive Destination: A Sustainable Tourism Perspective; CABI Publishing: Wallingford, UK, 2003. [Google Scholar]
- Crouch, G.I.; Ritchie, J.R.B. Tourism, competitiveness, and societal prosperity. J. Bus. Res. 1999, 44, 137–152. [Google Scholar] [CrossRef] [Scilit]
- Dwyer, L.; Kim, C. Destination competitiveness: Determinants and indicators. Curr. Issues Tour. 2003, 6, 369–414. [Google Scholar] [CrossRef] [Scilit]
- Enright, M.J.; Newton, J. Tourism destination competitiveness: A quantitative approach. Tour. Manag. 2004, 25, 777–788. [Google Scholar] [CrossRef] [Scilit]
- World Economic Forum. Travel & Tourism Development Index 2024: Insight Report; World Economic Forum: Geneva, Switzerland, 2024. [Google Scholar]
- Le-Klähn, D.-T.; Roosen, J.; Gerike, R.; Hall, C.M. Factors affecting tourists’ public transport use and areas visited at destinations. Tour. Geogr. 2015, 17, 738–757. [Google Scholar] [CrossRef] [Scilit]
- Gross, S.; Grimm, B. Sustainable mode of transport choices at the destination—Public transport at German destinations. Tour. Rev. 2018, 73, 401–420. [Google Scholar] [CrossRef] [Scilit]
- Gutiérrez, A.; Miravet, D. The determinants of tourist use of public transport at the destination. Sustainability 2016, 8, 908. [Google Scholar] [CrossRef] [Scilit]
- Gutiérrez, A.; Domènech, A.; Zaragozí, B.; Miravet, D. Profiling tourists’ use of public transport through smart travel card data. J. Transp. Geogr. 2020, 88, 102820. [Google Scholar] [CrossRef] [Scilit]
- Masiero, L.; Zoltan, J. Tourists intra-destination visits and transport mode: A bivariate probit model. Ann. Tour. Res. 2013, 43, 529–546. [Google Scholar] [CrossRef] [Scilit]
- Dickinson, J.E.; Robbins, D. Representations of tourism transport problems in a rural destination. Tour. Manag. 2008, 29, 1110–1121. [Google Scholar] [CrossRef] [Scilit]
- Scuttari, A.; Della Lucia, M.; Martini, U. Integrated planning for sustainable tourism and mobility. A tourism traffic analysis in Italy’s South Tyrol region. J. Sustain. Tour. 2013, 21, 614–637. [Google Scholar] [CrossRef] [Scilit]
- Zamparini, L.; Domènech, A.; Miravet, D.; Gutiérrez, A. Green mobility at home, green mobility at tourism destinations: A cross-country study of transport modal choices of educated young adults. J. Transp. Geogr. 2022, 103, 103412. [Google Scholar] [CrossRef] [Scilit]
- Statistical Office of Montenegro (MONSTAT). Statistical Yearbook of Montenegro 2024; MONSTAT: Podgorica, Montenegro, 2024. [Google Scholar]
- European Commission. Montenegro 2025 Report; SWD(2025) 754 Final; European Commission: Brussels, Belgium, 2025. [Google Scholar]
- European Commission. Montenegro 2024 Report; SWD(2024) 694 Final; European Commission: Brussels, Belgium, 2024. [Google Scholar]
- Anderson, J.C.; Gerbing, D.W. Structural equation modeling in practice: A review and recommended two-step approach. Psychol. Bull. 1988, 103, 411–423. [Google Scholar] [CrossRef]
- Kline, R.B. Principles and Practice of Structural Equation Modeling, 4th ed.; The Guilford Press: New York, NY, USA, 2016. [Google Scholar]
- Hu, L.; Bentler, P.M. Cutoff criteria for fit indexes in covariance structure analysis: Conventional criteria versus new alternatives. Struct. Equ. Model. 1999, 6, 1–55. [Google Scholar] [CrossRef] [Scilit]
- Preacher, K.J.; Hayes, A.F. Asymptotic and resampling strategies for assessing and comparing indirect effects in multiple mediator models. Behav. Res. Methods 2008, 40, 879–891. [Google Scholar] [CrossRef] [Scilit] [PubMed]
- Cheung, G.W.; Rensvold, R.B. Evaluating goodness-of-fit indexes for testing measurement invariance. Struct. Equ. Model. 2002, 9, 233–255. [Google Scholar] [CrossRef] [Scilit] [PubMed]
- Chen, F.F. Sensitivity of goodness of fit indexes to lack of measurement invariance. Struct. Equ. Model. 2007, 14, 464–504. [Google Scholar] [CrossRef] [Scilit]
- Putnick, D.L.; Bornstein, M.H. Measurement invariance conventions and reporting: The state of the art and future directions for psychological research. Dev. Rev. 2016, 41, 71–90. [Google Scholar] [CrossRef] [Scilit] [PubMed]
- Martilla, J.A.; James, J.C. Importance–performance analysis. J. Mark. 1977, 41, 77–79. [Google Scholar] [CrossRef] [Scilit]
- Oh, H. Revisiting importance–performance analysis. Tour. Manag. 2001, 22, 617–627. [Google Scholar] [CrossRef] [Scilit]
- Hasson, F.; Keeney, S.; McKenna, H. Research guidelines for the Delphi survey technique. J. Adv. Nurs. 2000, 32, 1008–1015. [Google Scholar] [CrossRef] [Scilit]
- Polit, D.F.; Beck, C.T. The content validity index: Are you sure you know what’s being reported? Critique and recommendations. Res. Nurs. Health 2006, 29, 489–497. [Google Scholar] [CrossRef] [Scilit] [PubMed]
- Hair, J.F.; Hult, G.T.M.; Ringle, C.M.; Sarstedt, M. A Primer on Partial Least Squares Structural Equation Modeling (PLS-SEM), 3rd ed.; Sage: Thousand Oaks, CA, USA, 2022. [Google Scholar]
- Cohen, J. Statistical Power Analysis for the Behavioral Sciences, 2nd ed.; Lawrence Erlbaum Associates: Hillsdale, NJ, USA, 1988. [Google Scholar]
- Groves, R.M.; Fowler, F.J., Jr.; Couper, M.P.; Lepkowski, J.M.; Singer, E.; Tourangeau, R. Survey Methodology, 2nd ed.; Wiley: Hoboken, NJ, USA, 2009. [Google Scholar]
- Podsakoff, P.M.; MacKenzie, S.B.; Lee, J.-Y.; Podsakoff, N.P. Common method biases in behavioral research: A critical review of the literature and recommended remedies. J. Appl. Psychol. 2003, 88, 879–903. [Google Scholar] [CrossRef] [Scilit] [PubMed]
- Podsakoff, P.M.; MacKenzie, S.B.; Podsakoff, N.P. Sources of method bias in social science research and recommendations on how to control it. Annu. Rev. Psychol. 2012, 63, 539–569. [Google Scholar] [CrossRef] [Scilit] [PubMed]
- Williams, L.J.; Hartman, N.; Cavazotte, F. Method variance and marker variables: A review and comprehensive CFA marker technique. Organ. Res. Methods 2010, 13, 477–514. [Google Scholar] [CrossRef] [Scilit]
- Nunnally, J.C.; Bernstein, I.H. Psychometric Theory, 3rd ed.; McGraw-Hill: New York, NY, USA, 1994. [Google Scholar]
- Fornell, C.; Larcker, D.F. Evaluating structural equation models with unobservable variables and measurement error. J. Mark. Res. 1981, 18, 39–50. [Google Scholar] [CrossRef] [Scilit]
- Bagozzi, R.P.; Yi, Y. On the evaluation of structural equation models. J. Acad. Mark. Sci. 1988, 16, 74–94. [Google Scholar] [CrossRef]
- Henseler, J.; Ringle, C.M.; Sarstedt, M. A new criterion for assessing discriminant validity in variance-based structural equation modeling. J. Acad. Mark. Sci. 2015, 43, 115–135. [Google Scholar] [CrossRef] [Scilit]
- Hair, J.F.; Risher, J.J.; Sarstedt, M.; Ringle, C.M. When to use and how to report the results of PLS-SEM. Eur. Bus. Rev. 2019, 31, 2–24. [Google Scholar] [CrossRef] [Scilit]
- Igolkina, A.A.; Meshcheryakov, G. semopy: A Python package for structural equation modeling. Struct. Equ. Model. 2020, 27, 952–963. [Google Scholar] [CrossRef] [Scilit]
- Zhao, X.; Lynch, J.G., Jr.; Chen, Q. Reconsidering Baron and Kenny: Myths and truths about mediation analysis. J. Consum. Res. 2010, 37, 197–206. [Google Scholar] [CrossRef] [Scilit]
- Steenkamp, J.-B.E.M.; Baumgartner, H. Assessing measurement invariance in cross-national consumer research. J. Consum. Res. 1998, 25, 78–90. [Google Scholar] [CrossRef] [Scilit]
- Azzopardi, E.; Nash, R. A critical evaluation of importance–performance analysis. Tour. Manag. 2013, 35, 222–233. [Google Scholar] [CrossRef] [Scilit]
- European Union. Regulation (EU) 2021/782 of the European Parliament and of the Council of 29 April 2021 on rail passengers’ rights and obligations. Off. J. Eur. Union 2021, L 172, 1–52. [Google Scholar]
- Petrović, M.D.; Lukić, D.; Radovanović, M.; Vujko, A.; Gajić, T.; Vuković, D. ‘Urban geosites’ as an alternative geotourism destination—Evidence from Belgrade. Open Geosci. 2017, 9, 442–456. [Google Scholar] [CrossRef] [Scilit]
- International Union of Railways (UIC). Railway Statistics Synopsis 2024; UIC: Paris, France, 2024. [Google Scholar]
- OECD. OECD Tourism Trends and Policies 2024; OECD Publishing: Paris, France, 2024. [Google Scholar] [CrossRef] [Scilit]
- Blešić, I.; Ivkov-Džigurski, A.; Stankov, U.; Stamenković, I.; Bradić, M. Research of expected and perceived service quality in hotel management. J. Tour. 2011, 11, 5–13. [Google Scholar]
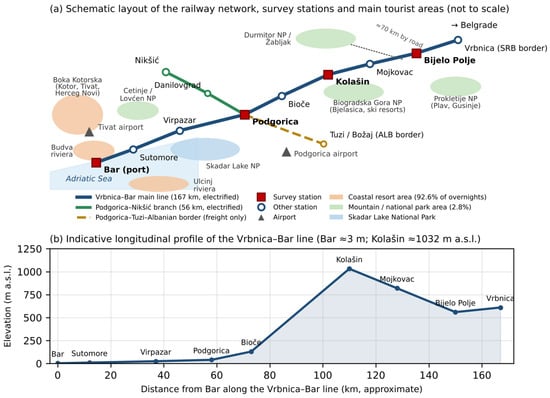
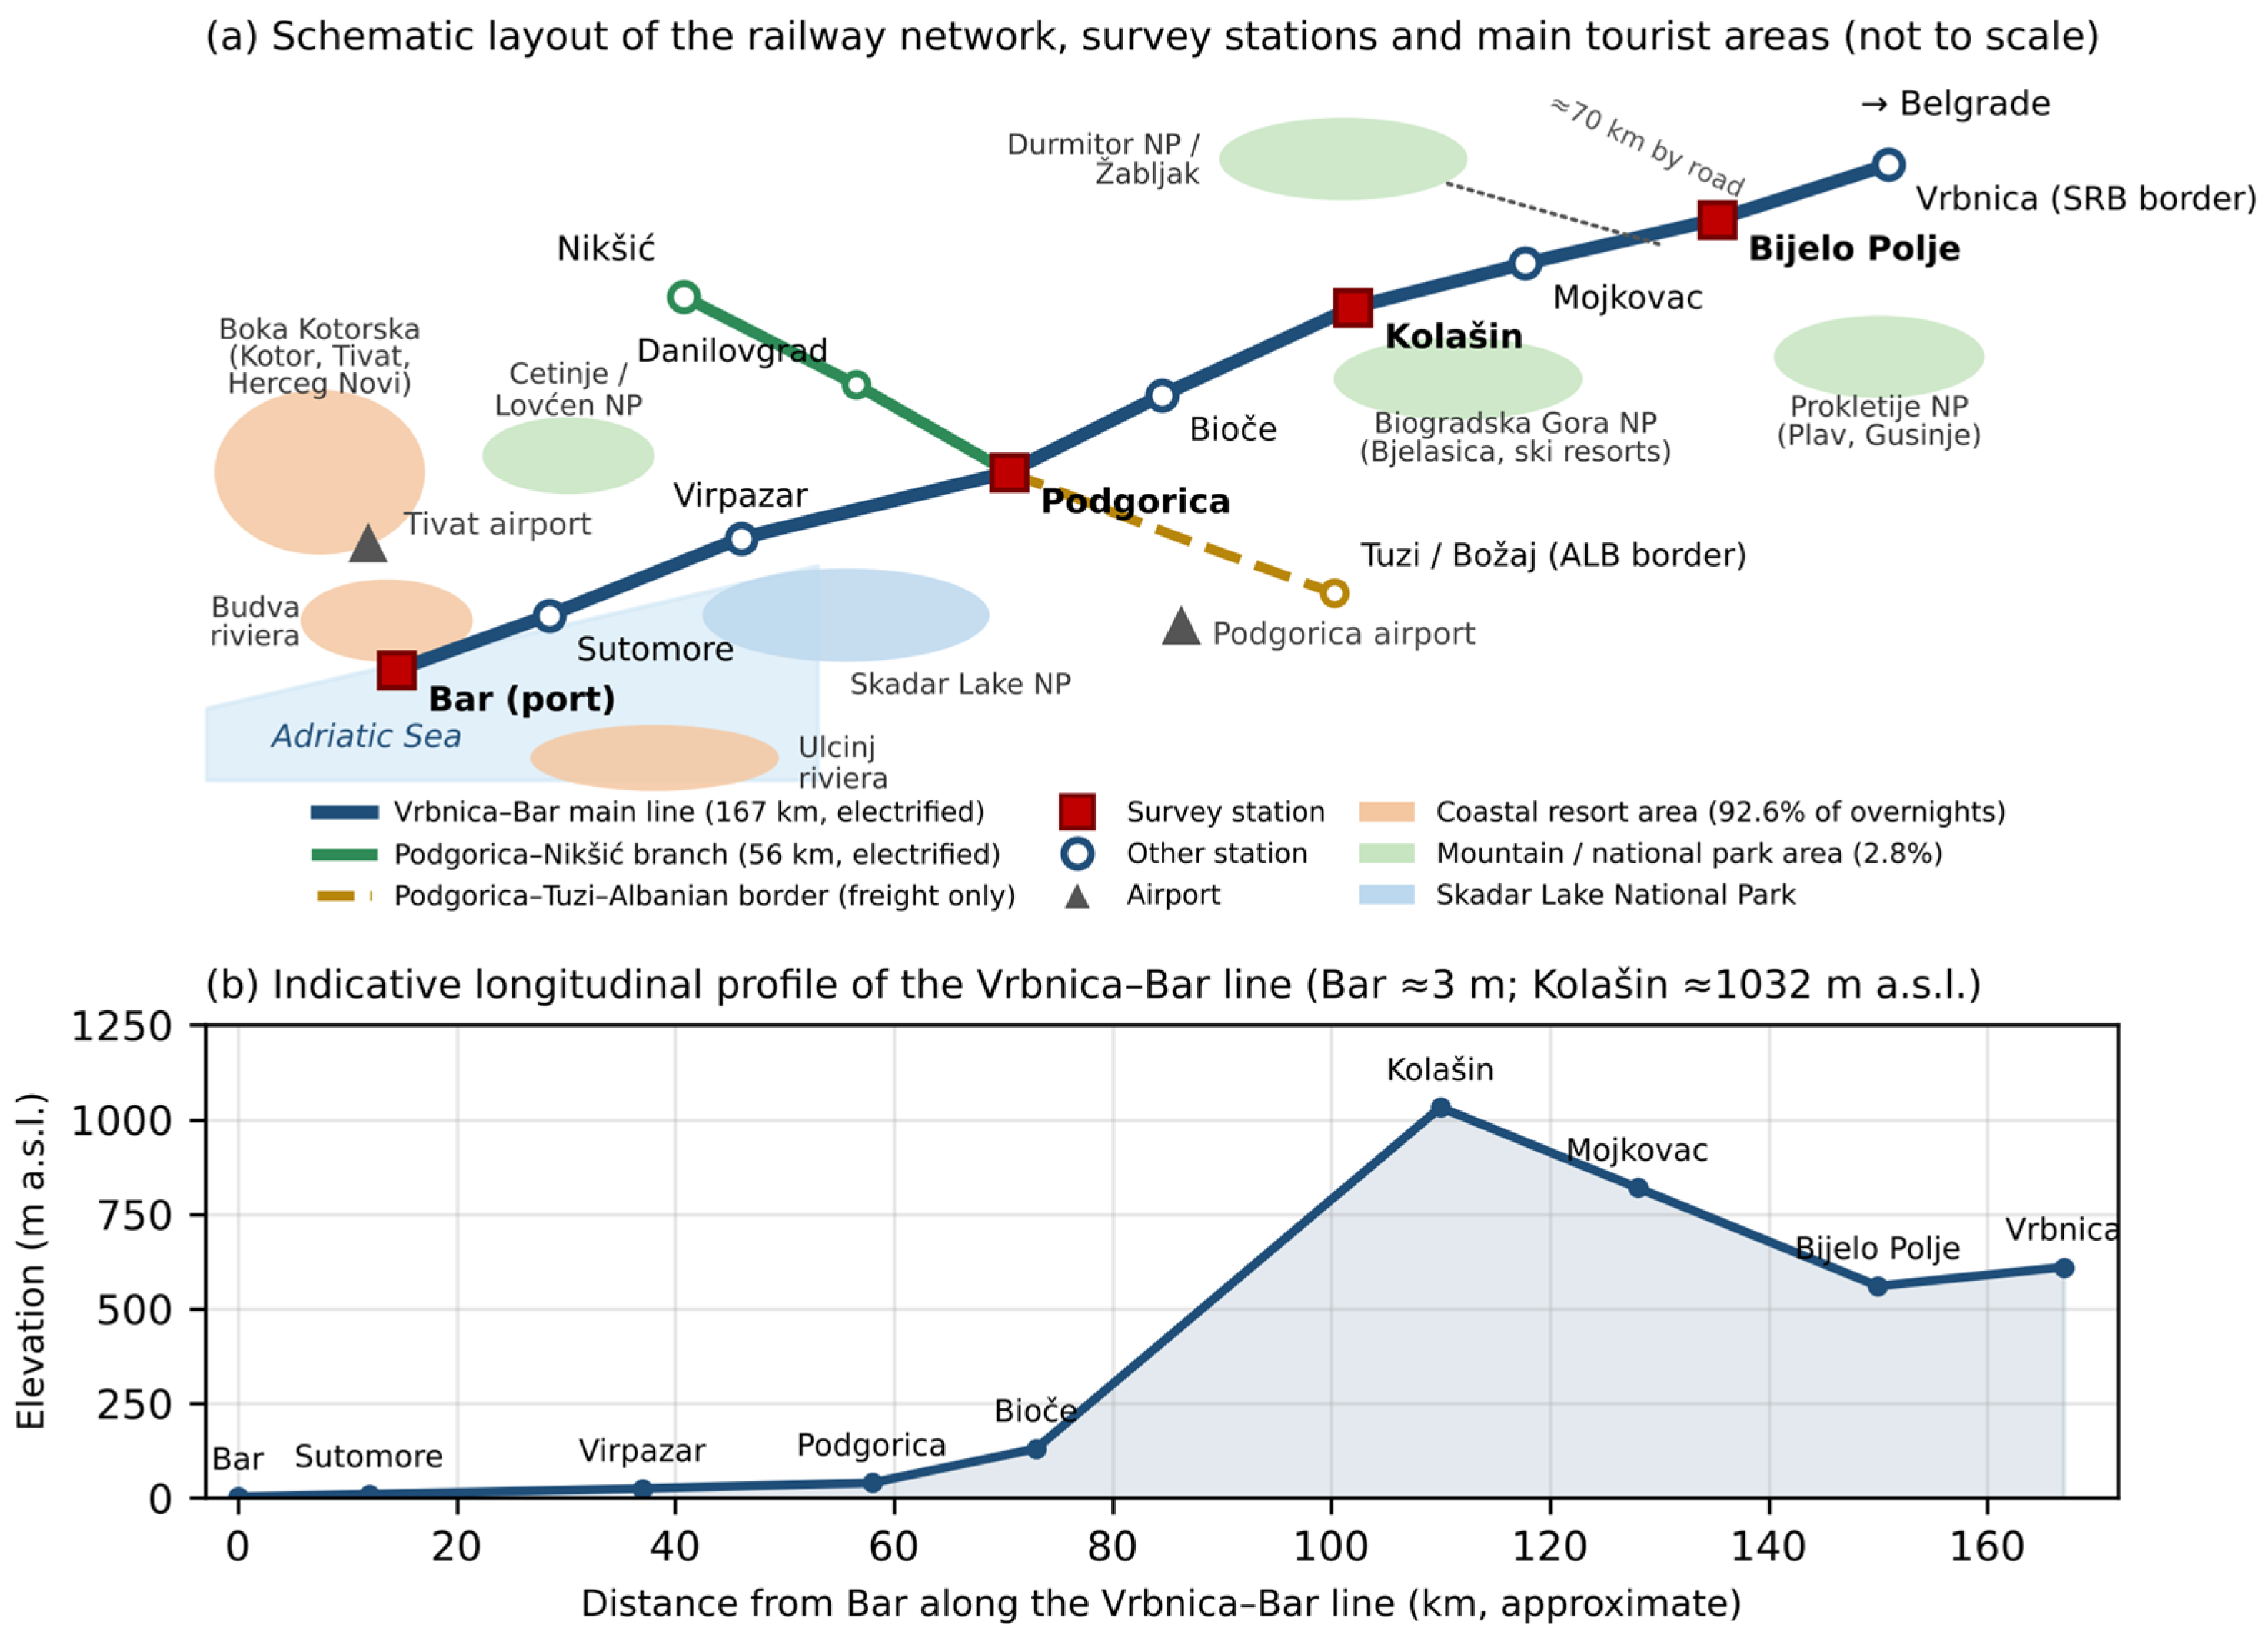
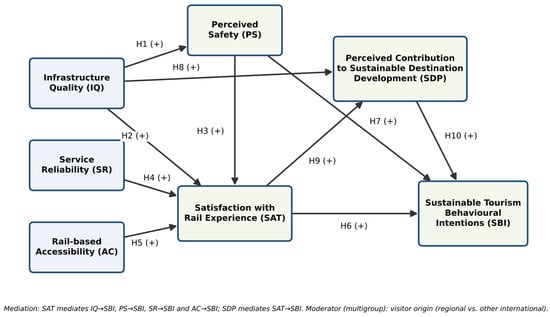
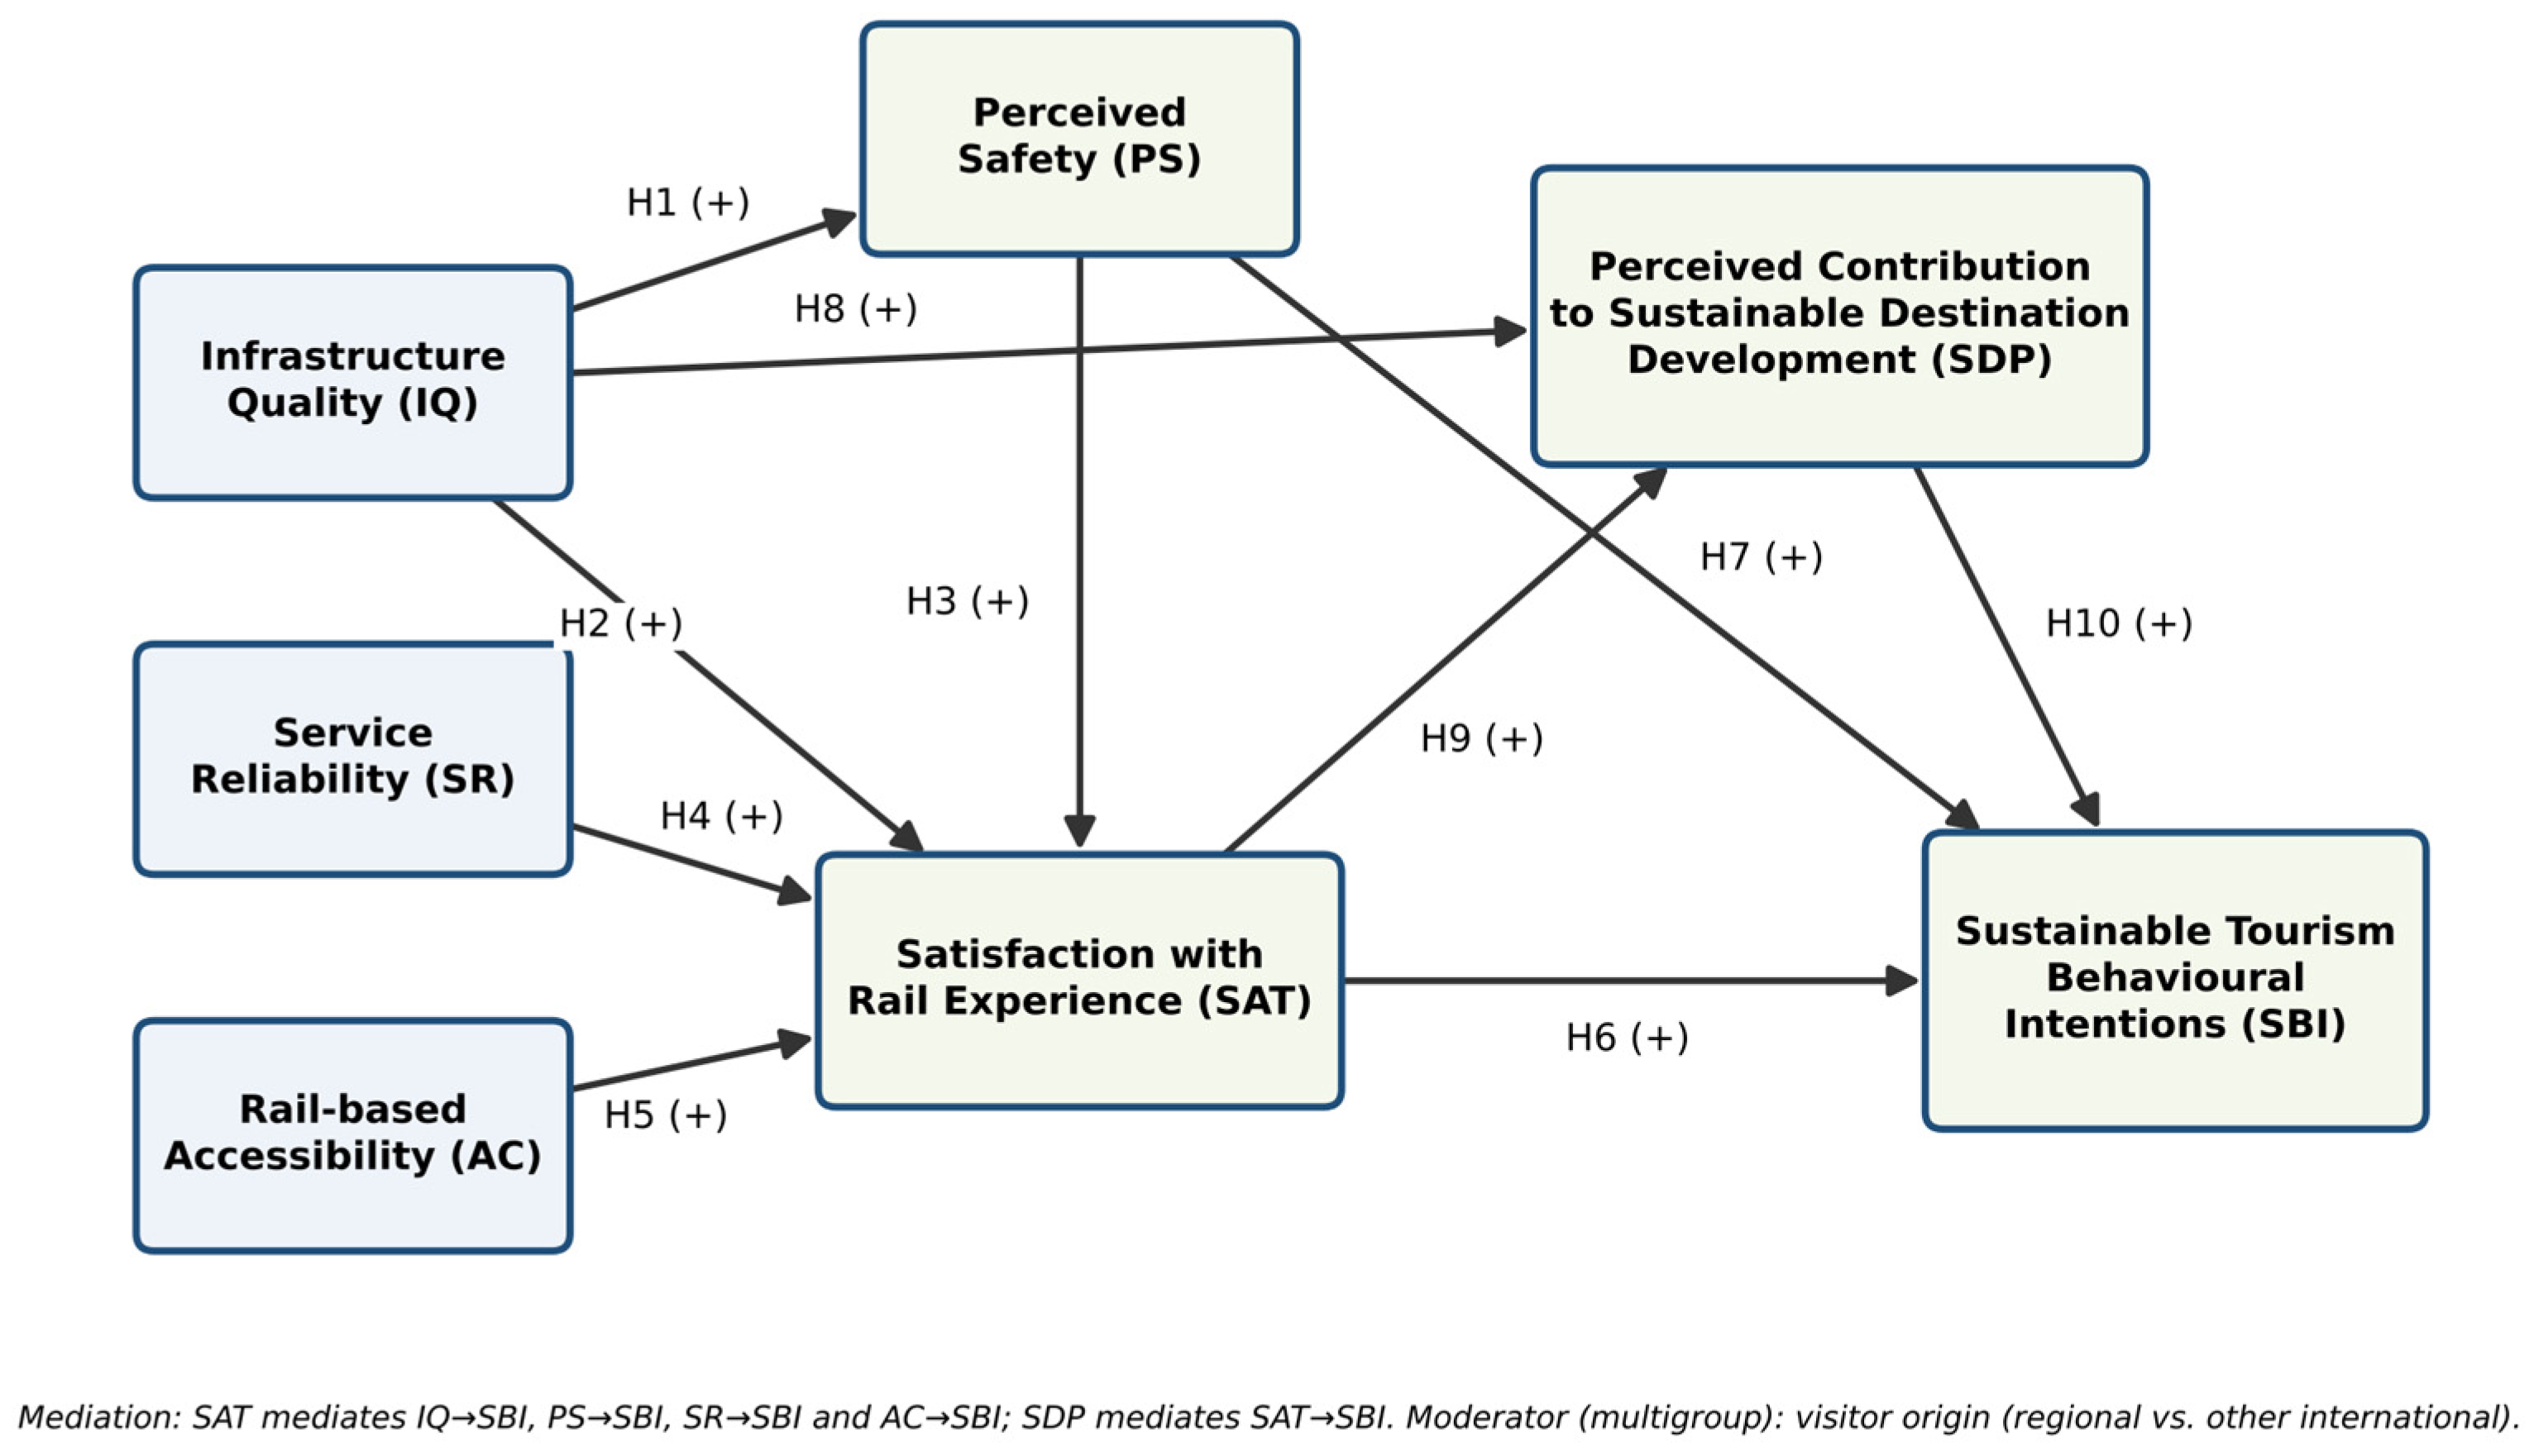
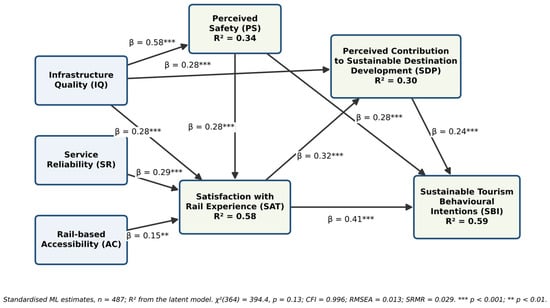
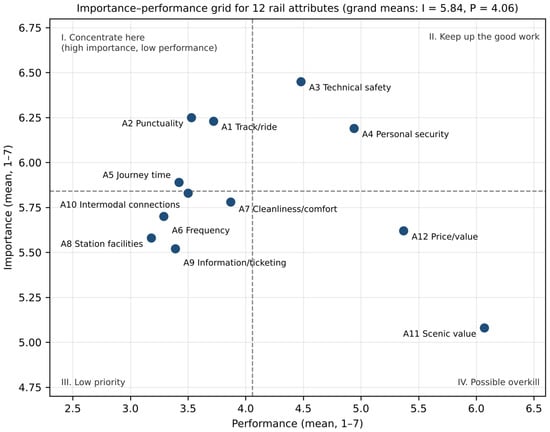

Disclaimer/Publisher’s Note: The statements, opinions and data contained in all publications are solely those of the individual author(s) and contributor(s) and not of MDPI and/or the editor(s). MDPI and/or the editor(s) disclaim responsibility for any injury to people or property resulting from any ideas, methods, instructions or products referred to in the content. |
© 2026 by the authors. Licensee MDPI, Basel, Switzerland. This article is an open access article distributed under the terms and conditions of the Creative Commons Attribution (CC BY) license.