


Abstract
Sustainable aviation fuels (SAFs) are critical for aviation decarbonization, yet feedstock supply-side trade-offs, including spatial variability and straw return to soil, are often overlooked. This study integrates energy and ecological assessments via lifecycle assessment to evaluate carbon mitigation and economic feasibility of corn-straw-based SAF in China using aqueous phase reforming (APR), hydrothermal liquefaction (HTL), and gasification–Fischer–Tropsch (FT) synthesis. HTL shows the highest mitigation efficiency (61.4%) and greatest potential, and is therefore optimal. Spatially, mitigation potential is highly heterogeneous, concentrated in northeastern and northern China, while some western and southern provinces show low or negative mitigation under FT synthesis. A 20%/80% straw allocation to SAF and soil retention yields 55.0 Mt CO2-eq annually, 29.6 Mt of additional mitigation from fuel substitution and 25.4 Mt of maintained soil carbon sequestration. Economically, with carbon credits, HTL is cost-competitive with fossil jet fuel in all provinces, saving 241–1730 yuan/t (≈36–260 USD/t), highest in Inner Mongolia, Xinjiang, Heilongjiang, Liaoning, and Ningxia (1510–1730 yuan/t). FT synthesis has reached cost parity in some provinces, whereas APR remains unviable, costing 1700–3210 yuan/t (≈255–482 USD/t) more than fossil jet fuel. These findings support regional SAF deployment and China’s carbon neutrality goals.
1. Introduction
Global greenhouse gas emissions have risen sharply, with aviation being a major contributor. The Carbon Offsetting and Reduction Scheme for International Aviation (CORSIA), launched by the International Civil Aviation Organization (ICAO), recognizes sustainable aviation fuel (SAF) as a key lever for aviation carbon neutrality [1,2,3]. China, as a major corn producer, generates approximately 300 million tonnes of corn straw annually [4], offering a significant feedstock for SAF production while promoting higher-value utilization of agricultural residues.
Three technical routes are widely studied for biomass-based SAF: aqueous phase reforming (APR), hydrothermal liquefaction (HTL), and gasification coupled with Fischer–Tropsch (FT) synthesis. These routes differ in feedstock adaptability, conversion efficiency, global warming potential (GWP), and production cost [5,6,7]. LCA studies show they can reduce GHG emissions by 30–70% relative to fossil jet fuel [8]. HTL performs well due to broad feedstock flexibility and no energy-intensive drying [6]; FT synthesis is mature but energy-intensive [9,10]; APR has mitigation potential but relies on green hydrogen [11,12]. Economically, SAF costs exceed fossil jet fuel, with gaps varying by technology, feedstock price, and electricity cost [13,14].
However, critical gaps remain. First, most studies use national-level estimates, ignoring provincial disparities in inputs, climate, soil, and grid factor [15,16,17,18]. Second, allocation scenarios often assume full straw conversion for energy, neglecting straw incorporation for soil organic matter and food security, contrary to China’s policy of “prioritizing agricultural use and focusing on straw incorporation” [19,20]. Third, evaluation frameworks rarely integrate spatial carbon footprints [21,22] with monetized carbon benefits [23], limiting the assessment of SAF competitiveness under carbon markets.
To address these gaps, this study develops a province-scale LCA framework [24,25] integrating energy substitution with ecological carbon sequestration. We adopt a policy-aligned allocation scenario, 20% of corn straw for SAF production and 80% for ecological utilization (straw incorporation) [19,26]. Carbon benefits are monetized to compare the economic performance of three pathways across provinces and identify region-specific priorities. Overall, this study reveals the spatial differentiation of carbon mitigation potential and production costs, providing a scientific basis for the differentiated layout of China’s SAF industry and coordinated straw management across energy and ecology under national Dual Carbon goals.
2. Research Methods and Data Sources
2.1. The Systematic Framework of Scenario
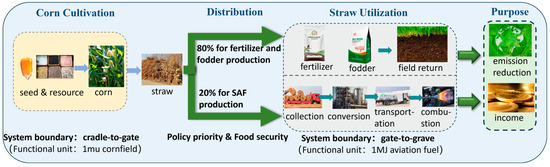
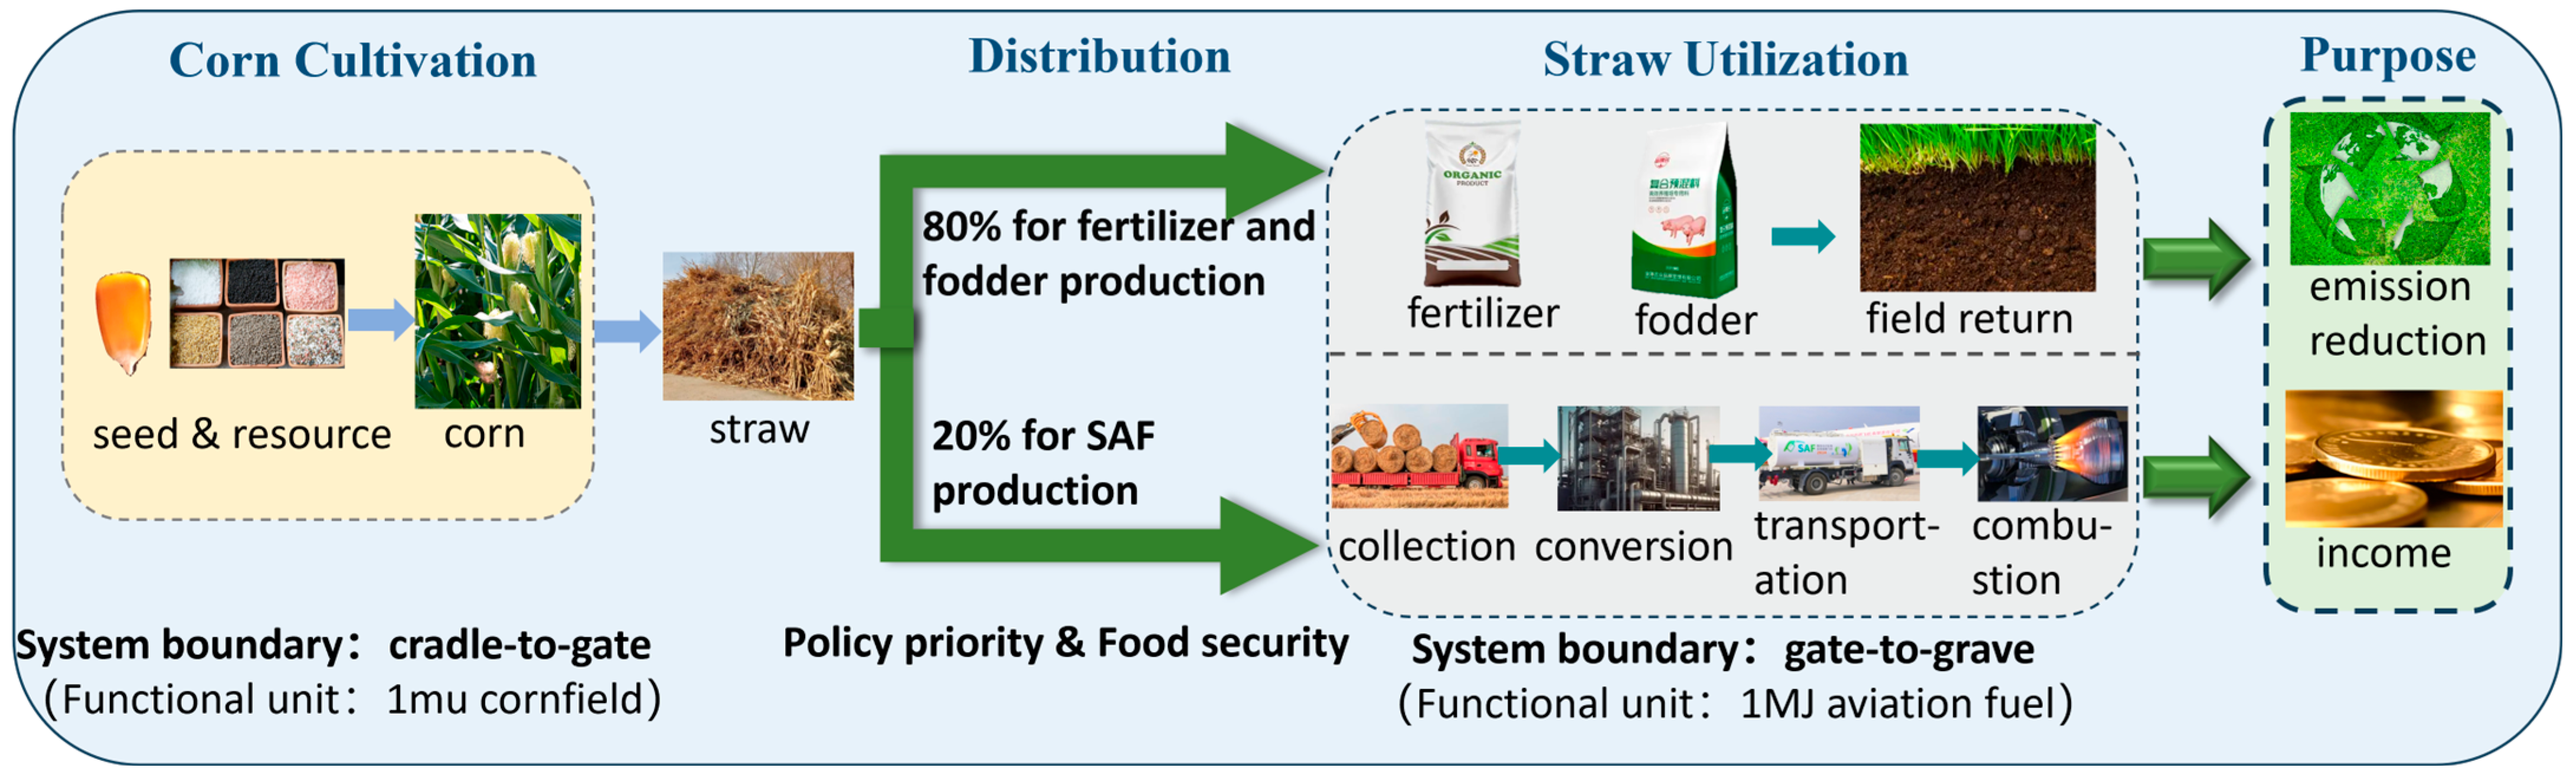
To quantify the overall carbon mitigation potential of straw-based SAF, an integrated framework comprising corn cultivation and straw utilization was developed, as illustrated in Figure 1. Corn grain from cultivation is used for food, while straw can be allocated to various uses, including fertilization, fodder, and SAF production. Following national policies on food security and agricultural ecological protection, SAF production from corn straw should be limited. Therefore, this study defines a consistent straw allocation scenario for SAF production and soil carbon sequestration. Based on official data from the Ministry of Agriculture and Rural Affairs, 57.6% of straw is used for fertilization and 20.7% for fodder [19]. On this basis, 20% of corn straw is designated for SAF production, and the remaining 80% is allocated to ecological utilization to maintain soil organic matter balance and soil carbon sequestration capacity. The straw allocation framework is presented in Figure 1.
Figure 1.
Integrated framework for straw-based SAF production.
2.2. Function Unit in System Framework
As shown in Figure 1, the overall SAF production system is classified into corn cultivation and straw utilization. For corn cultivation, a cradle-to-gate system is used with a functional unit of 1 mu of maize cropland (1 mu = 666.7 m2). For SAF production from straw utilization, a gate-to-grave subsystem, including feedstock collection and transport, conversion, fuel distribution and combustion, is formulated with a functional unit of 1 MJ of aviation fuel.
2.3. Calculation Methods of GWP and Economic Viability
2.3.1. GWP of Corn Cultivation
- (1)
- Lifecycle inventory of corn cultivation in different provinces
Provincial input–output inventories for corn cultivation were established with 1 mu of cornfield (1 mu = 666.7 m2) as the functional unit. Input items include seeds, nitrogen fertilizer, phosphate fertilizer, potassium fertilizer, irrigation water, diesel, electricity, mulch film, and pesticides; the output indicator is corn grain yield per mu. Tibet, Hainan, and Taiwan were excluded from the provincial assessment due to limited corn cultivation area or data availability.
Data on corn seed dosage were obtained from the National Compilation of Agricultural Product Cost–Benefit Data (2024) [27]. For eight provinces with missing data (Qinghai, Tianjin, Beijing, Zhejiang, Shanghai, Hunan, Guangdong, and Jiangxi), the average values of adjacent provinces were used.
Fertilizer application rates (N, P2O5, K2O) were taken directly as net nutrient consumption when available [27]. When only compound fertilizer data were reported, the physical amount was first calculated as net nutrient amount divided by the total nutrient content, and then N, P2O5, and K2O were derived using the following coefficients: diammonium phosphate (N 17%, P2O5 47%), ternary compound fertilizer (N 11%, P2O5 24%, K2O 13%), and mixed fertilizer (N 10%, P2O5 17%, K2O 3%). Unclassified compound fertilizer was assumed to have a balanced 15–15−15 composition (total nutrient 45%), consistent with the dominant specification in the Chinese compound fertilizer market.
Irrigation water consumption for corn planting in each province was obtained from the Agricultural Irrigation Water Quota: Corn [28], using the 50% hydrological year quota for each province.
For diesel consumption, data on machinery operation cost, irrigation and drainage cost, water charge, and fuel and power cost per mu were obtained from the indicator of seed consumption per mu in corn production cost and labor records of the National Compilation of Agricultural Product Cost–Benefit Data (2024) [27]. Diesel input was then calculated as [29]:
where diesel price was 7.87 yuan/L [30].
For mulch film consumption, data on mulch film cost per mu were obtained from the National Compilation of Agricultural Product Cost–Benefit Data (2024) [27]. Mulch film input was calculated as:
where a national average mulch film price of 12.99 yuan/kg was adopted [31].
Mulch film input = Mulch film cost/Mulch film price
Electricity consumption is mainly used for water supply and estimated via the following formula:
where Eelec refers to power consumption per unit area (kWh per mu); Wwater represents estimated irrigation water consumption (ton per mu); EFpum denotes power consumption coefficient for water lifting (kWh per ton). The coefficient EFpum varies by irrigation mode. For regions dominated by flood irrigation—including the northeast, Huang–Huai–Hai, southwest, and southern corn regions—a coefficient of 0.04 kWh per ton is applied. This value is derived from the theoretical framework of Li Lianlu et al. [32]. For the northwest spring corn region, where water scarcity necessitates pressurized systems such as drip and sprinkler irrigation, a coefficient of 0.22 kWh per ton is adopted. This value is empirically derived from field measurements of the “electricity-to-water” conversion coefficient for pressurized systems [33].
Eelec = Wwater × EFpum
Uniform pesticide application rates are specified for different agro-ecological zones. For the northeast spring corn region, the arithmetic mean measured value of Heilongjiang and Jilin is applied (0.40 kg per mu [21]). For the Huang–Huai–Hai summer corn region, the average value of Shandong, Beijing, and Anhui is set as 0.50 kg per mu [21]. Without field-measured data, the pesticide dosage of 0.45 kg per mu is adopted for the northwest spring corn region referring to the field investigation in Shanxi [34]. For the southwest and southern corn regions, referring to the standardized pure pesticide dosage of 125 grams per mu in Zhejiang province, combined with the ratio of pure pesticide to commercial pesticide of 1:5–1:6 and the local high temperature and humid climate with severe pest and disease risks, the value is determined as 0.70 kg per mu.
The finalized provincial lifecycle inventories for corn cultivation are presented in Table A1. Since most parameters contain uncertainties, sensitivity analysis is conducted in subsequent analysis to explore the influences of key parameter changes on evaluation results and ensure the robustness of research conclusions.
- (2)
- Provincial GWP intensity of corn straw cultivation
Spatial differences in GWP during corn planting across provinces are mainly derived from variable agricultural inputs and changeable power-related GWP [17,35]. This study adopts ReCiPe 2016 Midpoint (H) method and Ecoinvent 3.8 for assessing the GWP from the agriculture inputs in the lifecycle inventories of corn cultivation. In the calculation, the electricity is excluded; furthermore, the GWP from electricity is obtained manually by multiplying electricity and power emission factor (Fele,i). Provincial power emission factors (Fele,i) are obtained from China’s national lifecycle greenhouse gas emission factor database, with detailed values listed in Table A2 [36] in the unit of kg CO2-eq/kWh. Accordingly, the total GWP from corn cultivation per mu of cornfield in province i (Cplant,i, kg CO2 per mu) is calculated as the following equation.
where GWP is the GWP from agricultural inputs excluding electricity (kg CO2-eq/mu); Eelec,i is electricity consumption (kWh/mu), as shown in Table A1; Fele,i is the provincial power emission factor (kg CO2-eq/kWh), as shown in Table A2.
Cplant,i = GWP + Eelec,i × Fele,i
2.3.2. GWP of Corn Straw per Kilogram
The corn cultivation subsystem uses 1 mu of maize cropland (1 mu = 666.7 m2) as the functional unit and produces corn grain and corn straw, whereas the SAF production subsystem uses corn straw to produce SAF and 1 MJ of aviation fuel was set as the functional unit. These two functional units are linked through corn straw, and thus the GWP of straw per kilogram was firstly calculated as the straw-to-grain ratio was considered.
The carbon emission intensity of corn straw is further converted using the straw-to-grain ratio, and the relevant formulas are given below:
where Fstraw,i represents GWP for producing one kilogram of corn straw in province i (kg CO2 per kg straw); Si indicates the total corn planting area in province i (mu); Pi is total corn grain output in province i (kg); Rsg,i refers to the straw-to-grain mass ratio, as shown in Table A1 [37].
The per-unit-mass carbon footprints of grain and straw are equal [38]; thus
Fstraw,i = Fplant,i
The national average GWP of corn grain and straw was calculated as:
The calculated national average GWP of corn production is 0.22 kg CO2-eq/kg, which falls within the range of 0.172~0.231 kg CO2-eq/kg reported in an existing study [39], verifying the reliability of the established lifecycle inventories.
2.3.3. GWP of Different SAF Producing Routes
- (1)
- The systematic and technical details of SAF production route
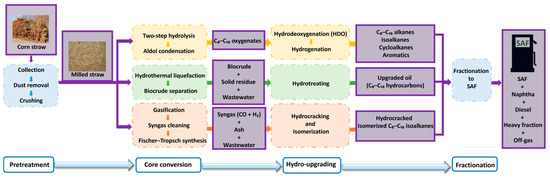
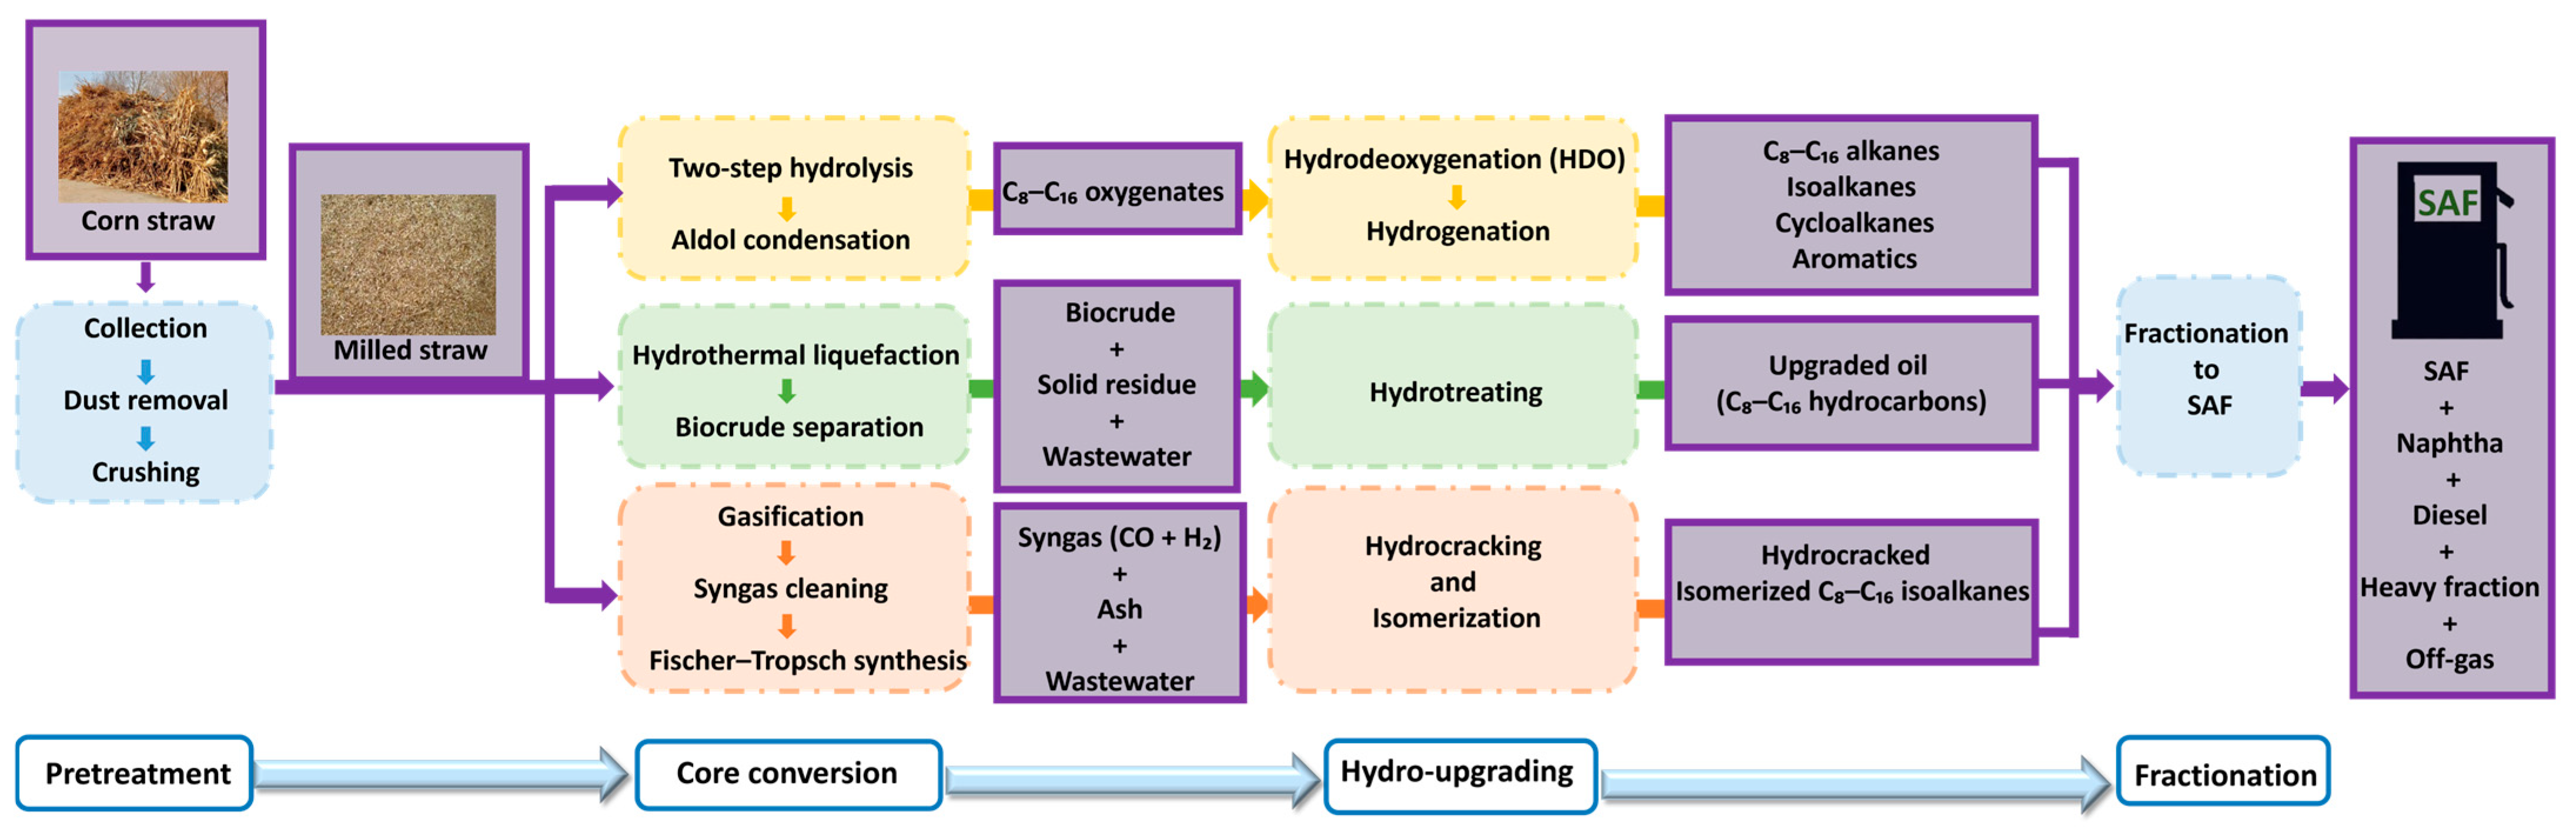
Three producing routes were investigated herein, which are catalytic aqueous phase reforming (APR), hydrothermal liquefaction (HTL) and gasification and Fischer–Tropsch (FT) synthesis. The detailed technological procedures of APR, HTL and FT synthesis routes are illustrated in Figure 2.
Figure 2.
Process flow diagrams for corn-straw-based SAF production via different routes.
For catalytic aqueous phase reforming (APR), corn straw is pretreated and hydrolyzed into soluble sugars firstly. With heavy metal catalysts, the obtained materials proceed through hydrodeoxygenation and aldol condensation to generate C8–C16 hydrocarbon precursors, which are further hydrogenated to prepare SAF. At present, this technology remains at the pilot stage. It involves complex procedures, and noble metal catalysts are expensive and have short service lives. Its economic efficiency and carbon mitigation effect are highly dependent on green hydrogen supply [11,12].
As for hydrothermal liquefaction (HTL), crushed corn straw is liquefied in water at around 20 MPa and 335 °C. After separation, biocrude is obtained and then upgraded by hydrotreating to produce SAF. This route is also under pilot research. Rigorous reaction conditions cause high equipment investment and frequent scaling and blockage. Due to the high oxygen content of biocrude, deep hydrogenation with external green hydrogen is necessary. Its economic performance is limited by the cost of green hydrogen and wastewater treatment [6].
In gasification and Fischer–Tropsch (FT) synthesis, dried corn straw is converted into syngas (CO+H2) via gasification. Long-chain hydrocarbons are synthesized from syngas over cobalt-based catalysts, and final SAF is obtained by subsequent hydrocracking and distillation. This process requires strict raw material pretreatment and consumes large amounts of energy in gasification and synthesis, leading to the highest GWP in the conversion process. Restricted by insufficient catalyst selectivity, the whole process still needs further improvement [10].
- (2)
- Lifecycle inventory and GWP for SAF production
The lifecycle inventory for SAF production is summarized in Table A3. The GWP calculation follows the same method as described in Section 2.3.1. The GWP intensity per megajoule of SAF via route j (Cj, kg CO2-eq/MJ) was calculated as:
where GWPj is the GWP from conversion inputs (kg CO2-eq/MJ) excluding electricity and corn straw; Eelec,j is electricity consumption (kWh/MJ); Fele,ave is the national average power emission factor (kg CO2-eq/kWh); Estrawc,j is straw consumption (kg/MJ). The electricity-related and straw-related emissions are thus calculated separately and added to GWPj to obtain the total GWP intensity per MJ of SAF.
Cj = GWPj + Eelec,j × Fele,ave + Estrawc,j × Fstraw,ave
- (3)
- Carbon mitigation efficiency of different routes
Carbon mitigation efficiency is defined to quantitatively compare the low-carbon performance of the three technical routes. To obtain universal technical characteristics, both straw-related and electricity-related GWP adopt national average levels in all routes. The efficiency calculation formula is expressed as:
where μj denotes the carbon mitigation efficiency of route j; Cj is the GWP intensity of SAF produced via route j (unit: kg CO2-eq/MJ); Cfos refers to the GWP intensity of traditional fossil-based aviation fuel, which is assigned as 0.093 kg CO2-eq/MJ (fossil jet fuel, EU-27-specific baseline [40]).
2.3.4. Provincial and Technical Variations in SAF GWP
- (1)
- Carbon emission intensity of SAF in each province under different routes
Provincial differences in the GWP per MJ of SAF (denoted Cj,i) mainly arise from disparities in the lifecycle inventories of corn cultivation across provinces, as well as provincial variations in the GWP of electricity and corn straw. For each province i and each production route j, the overall GWP of SAF production is calculated by summing the conversion-stage GWP (excluding electricity and corn straw), the electricity-related GWP, and the straw-related GWP, using the province-specific electricity emission factor (Fele,i) and the province-specific straw carbon intensity (Fstraw,i). The provincial electricity emission factors are listed in Table A2.
where Cj,i is the overall GWP intensity of SAF production in province i via route j (kg CO2-eq/MJ); GWPj is the GWP from conversion inputs excluding electricity and corn straw (kg CO2-eq/MJ).
Cj,i = GWPj + Eelec,j × Fele,i + Estrawc,j × Fstraw,i
- (2)
- Available corn straw from corn cultivation in different provinces
The accessible corn straw quantity in province i was calculated as:
where mi is the accessible corn straw quantity in province i (kg); Pi stands for the corn grain output of province i (kg) [4]. The sensitivity analysis in Section 3.4 confirms that this simplification does not affect the main conclusions; Rc represents the straw collection rate, namely the proportion of usable collected straw to total straw yield, with a fixed value of 0.80.
mi = Pi × Rsg,i × Rc
- (3)
- Provincial carbon mitigation potential of SAF production under different routes
It is essential to quantify the regional carbon mitigation potential of SAF production for promoting the application of SAF. This study applied equivalent traditional fossil aviation fuel as benchmark, and the provincial carbon mitigation potential of SAF production is calculated by the following equations.
where SAFj,i is achievable SAF output (MJ); Foil is the fraction of straw used for biofuel, set at 0.20; mj is straw consumption per unit SAF (kg/MJ), which is derived from Table A3; ΔCSAF,j,i is carbon mitigation potential (kg CO2-eq).
∆CSAF,j,i = SAFj,i × (Cfos − Cj,i)
2.3.5. Carbon Mitigation Calculation for Whole Lifecycle Utilization of Straw
- (1)
- Carbon mitigation potential from 20% straw utilization for SAF
The national total carbon mitigation potential is summed up from provincial values, and the formula is shown below:
where ΔCch,j refers to the national total carbon mitigation potential under route j (unit: kg CO2).
- (2)
- Carbon sequestration potential from 80% straw utilization for fodder and fertilization
Apart from carbon mitigation achieved by SAF production, straw incorporation enables carbon sequestration. In this study, 80% of straw is allocated to ecological utilization, mainly including fertilization and feed utilization [41,42]. These two approaches differ greatly in carbon sequestration mechanism and efficiency, so the overall carbon sequestration rate is calculated via weighted average. According to official statistical data, the current national utilization ratios of straw for fertilization and feed are 57.6% and 20.7% respectively [19]. Within the 80% ecologically utilized straw, fertilization accounts for approximately 73.5% and feed utilization accounts for 26.5%. Existing studies indicate the long-term carbon sequestration rate of straw incorporation is 15% [42], and the global average carbon retention rate of livestock manure is 12% [43]. The integrated carbon sequestration rate is calculated as follows:
where Fcs is the comprehensive carbon sequestration rate (based on elemental carbon), with a calculated value of 14% per kilogram of straw.
Fcs = 73.5% × 15% + 26.5% × 12% ≈ 14%
It should be noted that the sequestered substance here refers only to elemental carbon. Conversion calculation is required to obtain the mass of fixed carbon dioxide. On this basis, the annual soil carbon sequestration potential of 80% straw is estimated by the following formula:
where Cre represents total soil carbon sequestration via straw incorporation (unit: kg CO2); Cfrac denotes carbon content in straw, assigned as 0.45.
- (3)
- Total net carbon mitigation of the whole straw utilization system
The total net carbon mitigation of the whole straw utilization system is the sum of the direct mitigation from SAF production (Equation (14)) and the soil carbon sequestration from straw incorporation (Equation (18)):
where ΔCtotal,j represents the net climate benefit of the “20% energy + 80% ecological” allocation scenario. The calculation of this value under the optimal pathway is presented in Section 3.3.3.
ΔCtotal,j=ΔCch,j + Cre
2.3.6. Economic Cost Calculation of SAF Production
In this study, agricultural inputs are reported in mu (1 mu = 666.7 m2) because the statistical yearbooks for China are compiled in this unit. The economic assessment is conducted in Chinese yuan (CNY), as the study focuses on China. To facilitate international comparison, a conversion rate of 1 CNY ≈ 0.15 USD is adopted, and key cost values are also presented in USD equivalents where appropriate.
In the following economic assessment, the functional unit is 1 t SAF. The standard calorific value of jet fuel is 42,000 MJ/t SAF; therefore, 1 t SAF = 42,000 MJ. This conversion factor is used throughout to convert energy-based quantities (per MJ) into mass-based costs (per t SAF), and vice versa.
- (1)
- Planting cost of SAF production
Various agricultural inputs during corn planting are converted into per mu of planting cost according to market prices. Since this study focuses on straw cultivation cost, the cost ratio of corn to straw is set as 8:1 in line with their market purchase price ratio, namely 2134–2245 yuan per ton for corn and 278–280 yuan per ton for straw [44]. Combined with straw collection rate, the calculation formula is as follows:
In the formula, Pstraw,i represents the planting cost of straw in province i with the unit of yuan per kg.
The straw cost per tonne of SAF via route j in province i (Pfar,j,i, yuan/t SAF) was then calculated as:
Pfar,j,i = Pstraw,i × Estrawc,j × 42,000
- (2)
- Conversion cost for SAF production
The conversion cost includes electricity, hydrogen, catalysts, and other chemicals. For each route j, the consumption of each input per MJ of SAF was obtained from the lifecycle inventory (Table A3). The conversion cost per tonne of SAF in province i (Pconv,j,i, yuan/t SAF) was calculated as:
where Ex,j is the consumption of input x per MJ of SAF for route j (kg/MJ or kWh/MJ), excluding electricity and straw; Dx is the national average unit price of input x (yuan/kg or yuan/kWh). Because these inputs are traded nationally, their prices are assumed to be uniform across provinces, so Dx carries no province subscript; Eele,j is electricity consumption per MJ of SAF (kWh/MJ); Dele,i is the provincial industrial and commercial electricity price (yuan/kWh), obtained from the Energy Data Center (2026) [45].
Hydrogen is required for hydrodeoxygenation in all three routes. The hydrogen price was set at 55 yuan/kg H2, based on the green hydrogen production cost range of 4–12 USD/kg reported by Dhahri et al. [46]. A sensitivity analysis on hydrogen price is presented in Section 4.1.2.
Catalyst costs were calculated from the following sources: for APR, a ruthenium-based noble metal catalyst was used. The catalyst cost was obtained by multiplying the catalyst consumption from Table A3 (1.50 × 10⁻⁵ kg/MJ SAF) by a unit price of 25 USD/kg, following the techno-economic assessment of APR-based SAF production by Pipitone et al. [47]. This corresponds to approximately 0.63 kg/t SAF and a cost of about 15.75 USD/t SAF (≈113 yuan/t SAF at 1 USD ≈ 7.2 CNY); for HTL, the hydrotreating (HDO) catalyst cost was set at 24 USD per tonne of upgraded oil, as reported by Tews et al. [48]. Assuming 1 tonne of upgraded oil corresponds to 1 tonne of SAF, this gives 24 USD/t SAF (≈173 yuan/t SAF); for FT synthesis, the catalyst operating cost was reported as 3.6 €/t of C2+ products by Kern and Jess [49]. Assuming SAF accounts for 30–40% of the total C2+ product slate, the catalyst cost per tonne of SAF is 9–12 €/t (≈70–94 yuan/t SAF at 1 € ≈ 7.8 CNY). A sensitivity analysis on catalyst cost is presented in Section 4.1.2.
The consumption of other chemicals (e.g., sulfuric acid, sodium hydroxide, methanol, solvents) was taken from the lifecycle inventory (Table A3). Their unit prices were obtained from web pages [50,51], a national commodity price database. The resulting costs were calculated accordingly for each route.
- (3)
- Transportation cost for SAF production
The transportation distance (DSAF,i) for SAF delivery was estimated as the highway driving distance from the provincial capital city center to the selected airport. The city center was used as a representative origin point because the specific refinery locations are not defined at this assessment stage. For provinces with multiple airports (e.g., Beijing, Shanghai, Chengdu), the airport with the shortest driving distance from the city center was selected. The selected airport is the provincial capital airport, or the nearest airport to the city center if multiple airports exist in the province. Distances were measured using AutoNavi Map driving route recommendations (accessed in 2026) and are listed in Table A4. The transportation cost was calculated as:
where Ptrans,i is the jet fuel transportation cost (yuan/t); DSAF,i is the highway distance from the representative refinery location (provincial capital city center) to the selected airport (km); next, 0.46 is the basic freight rate (yuan/t·km) [52], 1.5 is the empty return coefficient [53]; and 40 is the loading/unloading fee (yuan/t) [52]. A sensitivity analysis on transportation cost is presented in Section 4.1.2.
Ptrans,i = DSAF,i × 0.46 × 1.5 + 40
- (4)
- Fixed cost for SAF production
Fixed costs (Pfixed,j,i) include equipment depreciation, labor wages, maintenance, and management. Following the techno-economic study on biomass gasification for jet fuel production, fixed costs are assumed to account for 20–25% of the total production cost [54]; therefore, the fixed cost ratio Rfix is set at 0.225 in this study. The economic evaluation focuses on the operating cost after stable production; other one-time construction investments such as land purchase and factory building are treated as sunk costs and are not included, as they do not affect the comparative analysis of core operational factors (raw material supply, technical routes, and carbon benefits). The fixed cost per tonne of SAF via route j in province i was calculated as:
where Pfar,j,i is the delivered straw cost (yuan/t SAF); Rfix is the fixed cost ratio, set at 0.225 in this study.
- (5)
- Carbon mitigation benefit for SAF production
Carbon mitigation benefit refers to the income obtained by SAF producers through selling greenhouse gas carbon mitigation in the carbon trading market. Such income is deducted from SAF production cost as a negative cost item to reduce overall production expenditure.
The carbon mitigation per ton of SAF compared with traditional fossil aviation fuel is calculated as:
where ERj,i is the carbon mitigation per tonne of SAF via route j in province i (t CO2-eq/t SAF).
The carbon benefit per ton of SAF is further calculated by the following formula:
where Pcarbon,j,i is the carbon benefit (yuan/t SAF), and Rcarbon represents carbon price assigned as 78 yuan per ton of CO2 [23].
Pcarbon,j,i = ERj,i × Rcarbon
- (6)
- Economic comparison with traditional fossil fuel
To intuitively analyze the economic competitiveness of SAF, this study compares the production cost of provincial SAF with that of traditional fossil aviation fuel, and the calculation formula is as follows:
where ∆P is the price difference between SAF and traditional fossil aviation fuel (yuan/t SAF), and Pfossil is the domestic ex-factory price of fossil jet fuel with a median value of 6000 yuan per ton [55].
3. GWP Analysis of SAF Production from Straw
3.1. GWP Variation in Corn Straw Production in Province
Corn straw is the feedstock for SAF production, and it is therefore necessary to quantify the GWP heterogeneity across provinces.
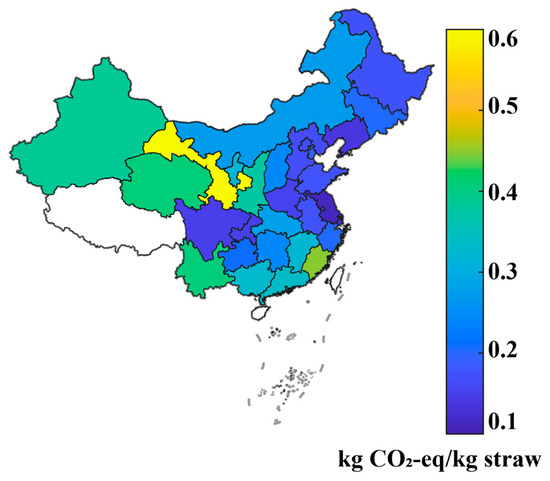
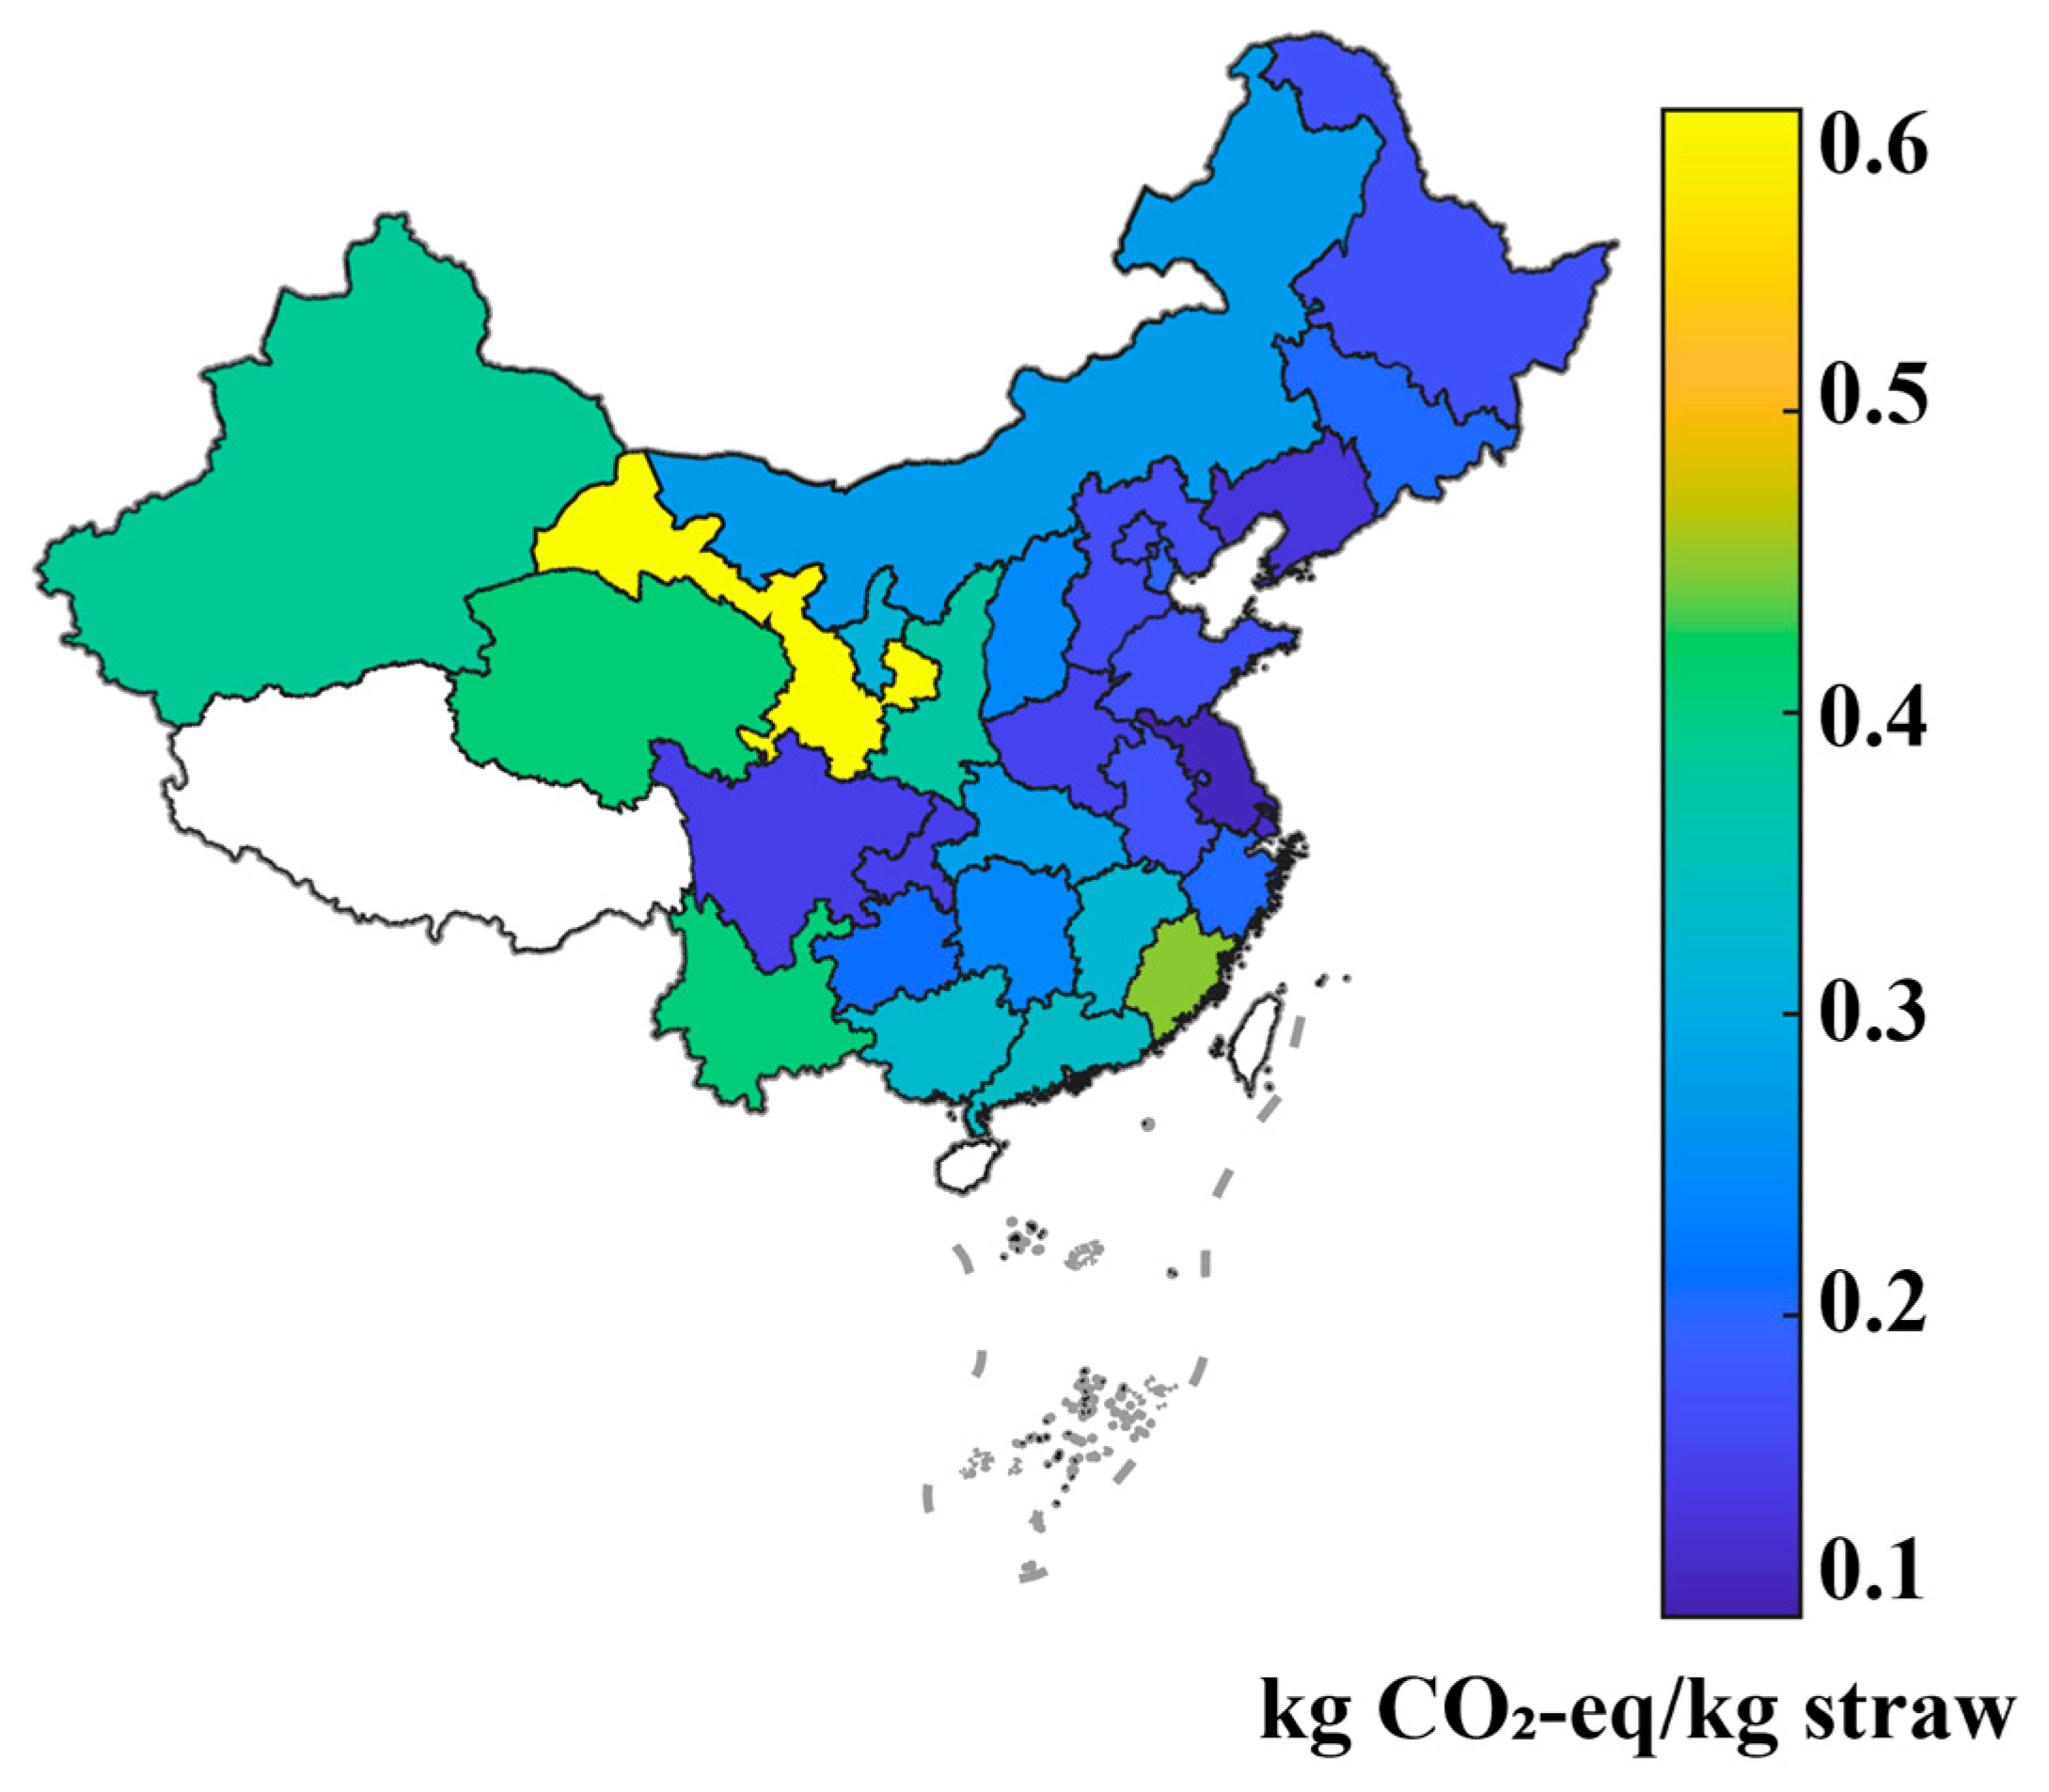
As shown in Figure 3, the GWP of corn straw production in China exhibits significant spatial heterogeneity. The heat map shows a clear spatial pattern: yellow-green regions (higher GWP intensity) are mainly concentrated in Gansu (0.62), Fujian (0.45), Yunnan (0.41), Qinghai (0.41), and Xinjiang (0.39), where lower yields and higher agricultural input intensities increase the carbon footprint per unit of straw. In contrast, blue regions (lower GWP intensity) appear in Jiangsu (0.11), Shanghai (0.12), Liaoning (0.14), Sichuan (0.15), and Chongqing (0.15), benefiting from high yields and, in the southwest, a clean electricity mix. These spatial differences in feedstock-level carbon intensity provide key input data for the subsequent evaluation of SAF production routes.
Figure 3.
Heat map of carbon emissions of per kilogram of corn straw from planting (for Tibet, Taiwan and Hainan, no data was provided).
3.2. GWP Variation Among Different SAF Producing Routes
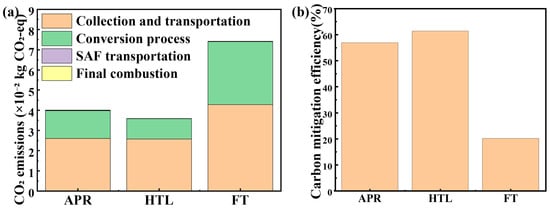
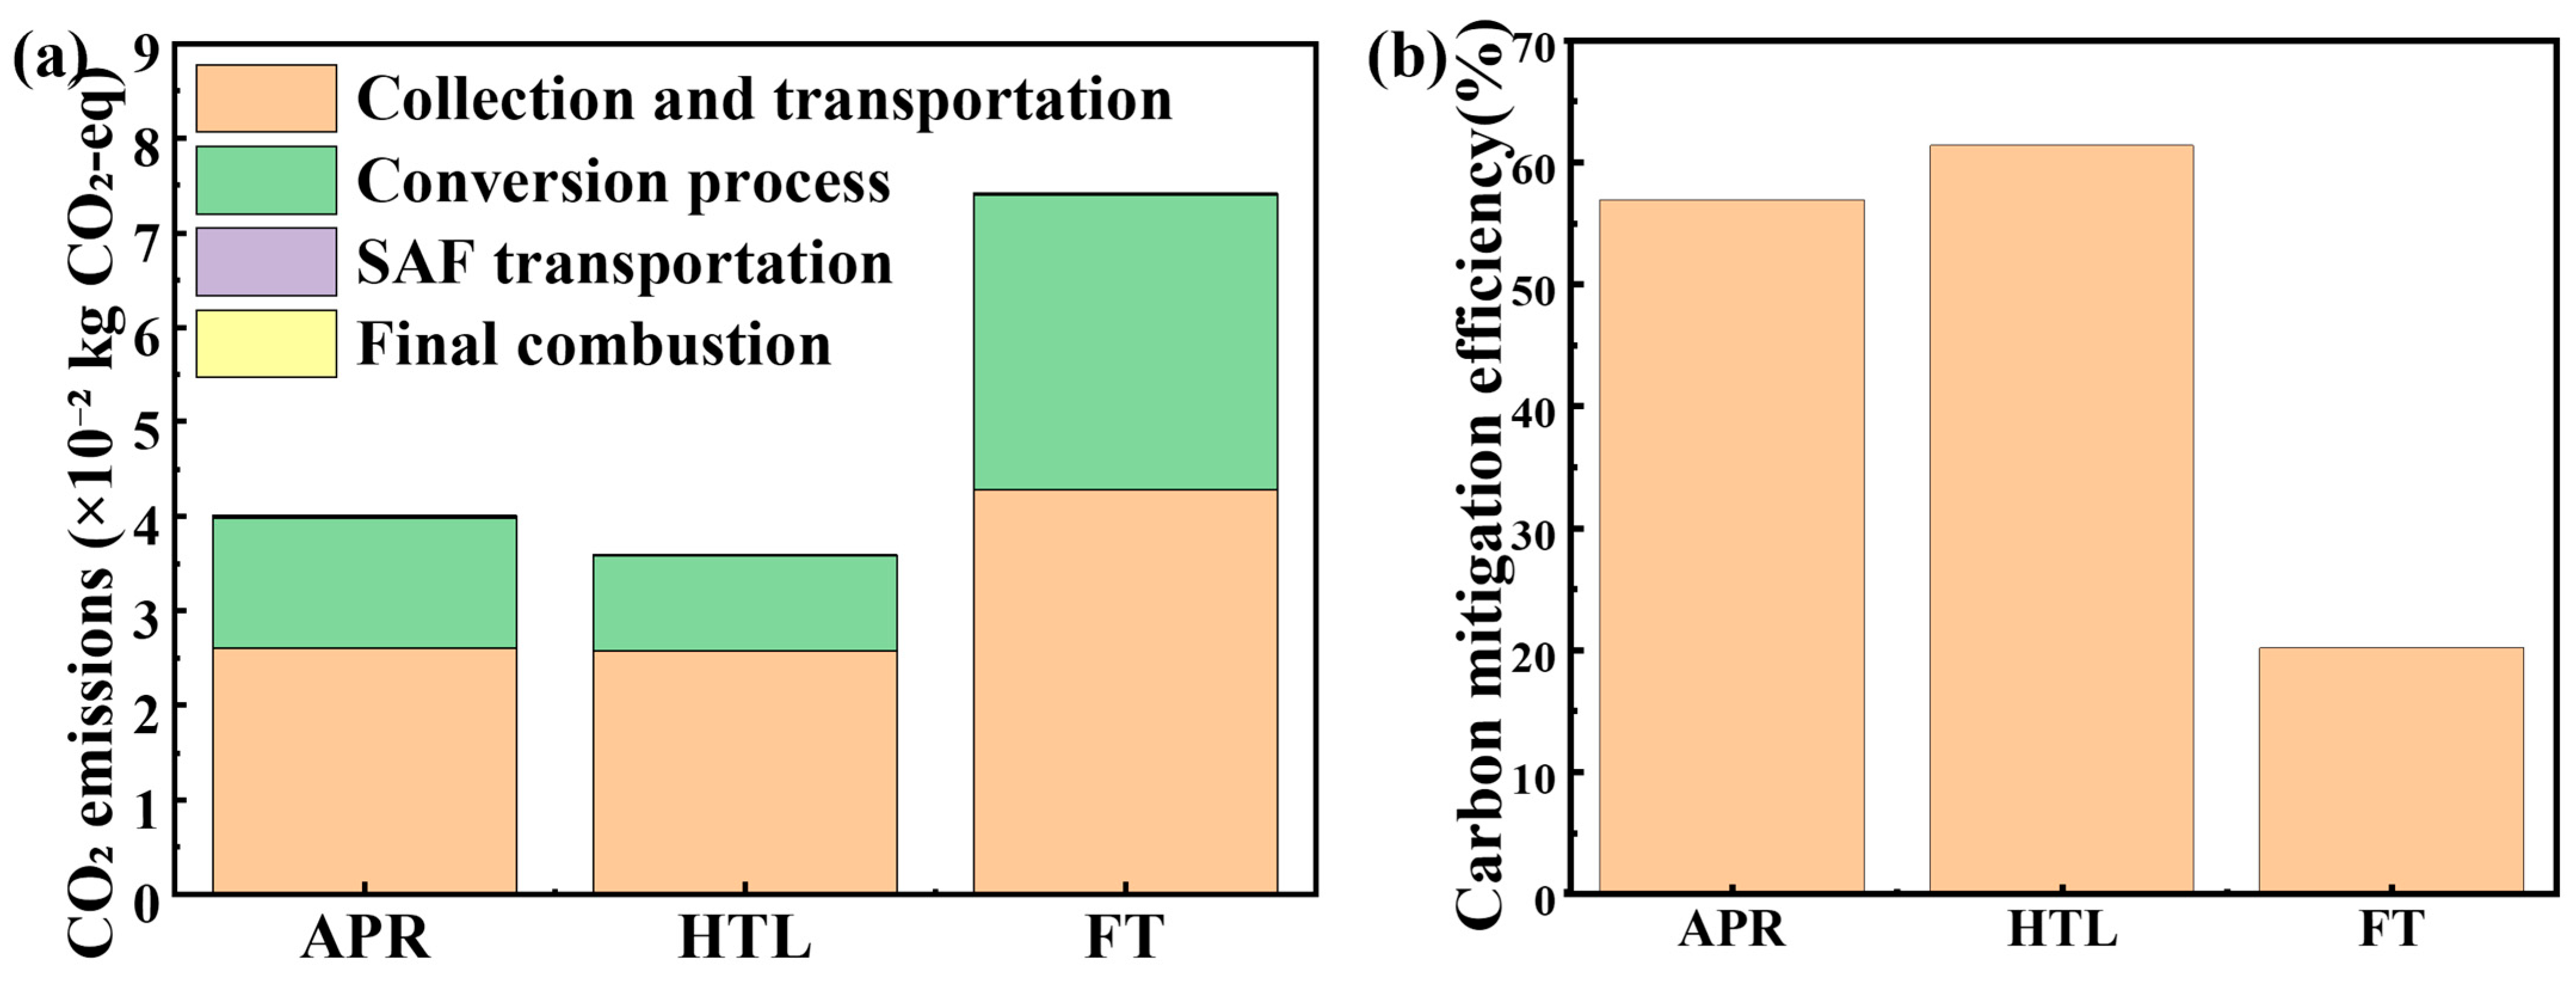
Taking 1 MJ of aviation fuel as the functional unit and using the national average GWP of corn straw and electricity, Figure 4a presents the lifecycle GWP of the three routes. In addition, Figure 4b shows the carbon mitigation efficiency of each route at the national scale.
Figure 4.
Carbon footprint and mitigation efficiency of SAF production: (a) lifecycle emission breakdown per MJ by route, and (b) carbon mitigation efficiency of SAF.
As shown in Figure 4a, the lifecycle GWP intensities are 0.040 kg CO2-eq/MJ for APR, 0.036 kg CO2-eq/MJ for HTL, and 0.074 kg CO2-eq/MJ for FT synthesis. The carbon intensity of each pathway is dominated by different stages. APR exhibits a larger contribution from the conversion stage, whereas HTL benefits from lower upstream processing burdens and simplified reaction steps. FT synthesis shows the highest conversion-stage emissions, primarily due to the energy-intensive gasification and multi-step upgrading requirements.
The results in Figure 4b indicate that the carbon mitigation efficiencies are 57.0% for APR, 61.4% for HTL, and 20.2% for FT synthesis. The relatively limited mitigation performance of FT synthesis is consistent with its lower overall oil yield, high-temperature operation, and energy-intensive upgrading steps.
Overall, HTL demonstrates the best environmental performance, followed by APR, while FT synthesis shows the least mitigation benefit among the three routes. APR’s performance remains sensitive to the carbon intensity of hydrogen supply, whereas FT synthesis competitiveness is expected to improve only through substantial process optimization or changes in upstream energy supply.
3.3. Spatial Differentiation of Carbon Mitigation Potential and Climate Benefit of SAF Production
3.3.1. Provincial GWP Intensity of SAF Production by Three Routes
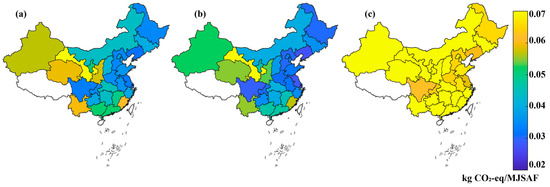
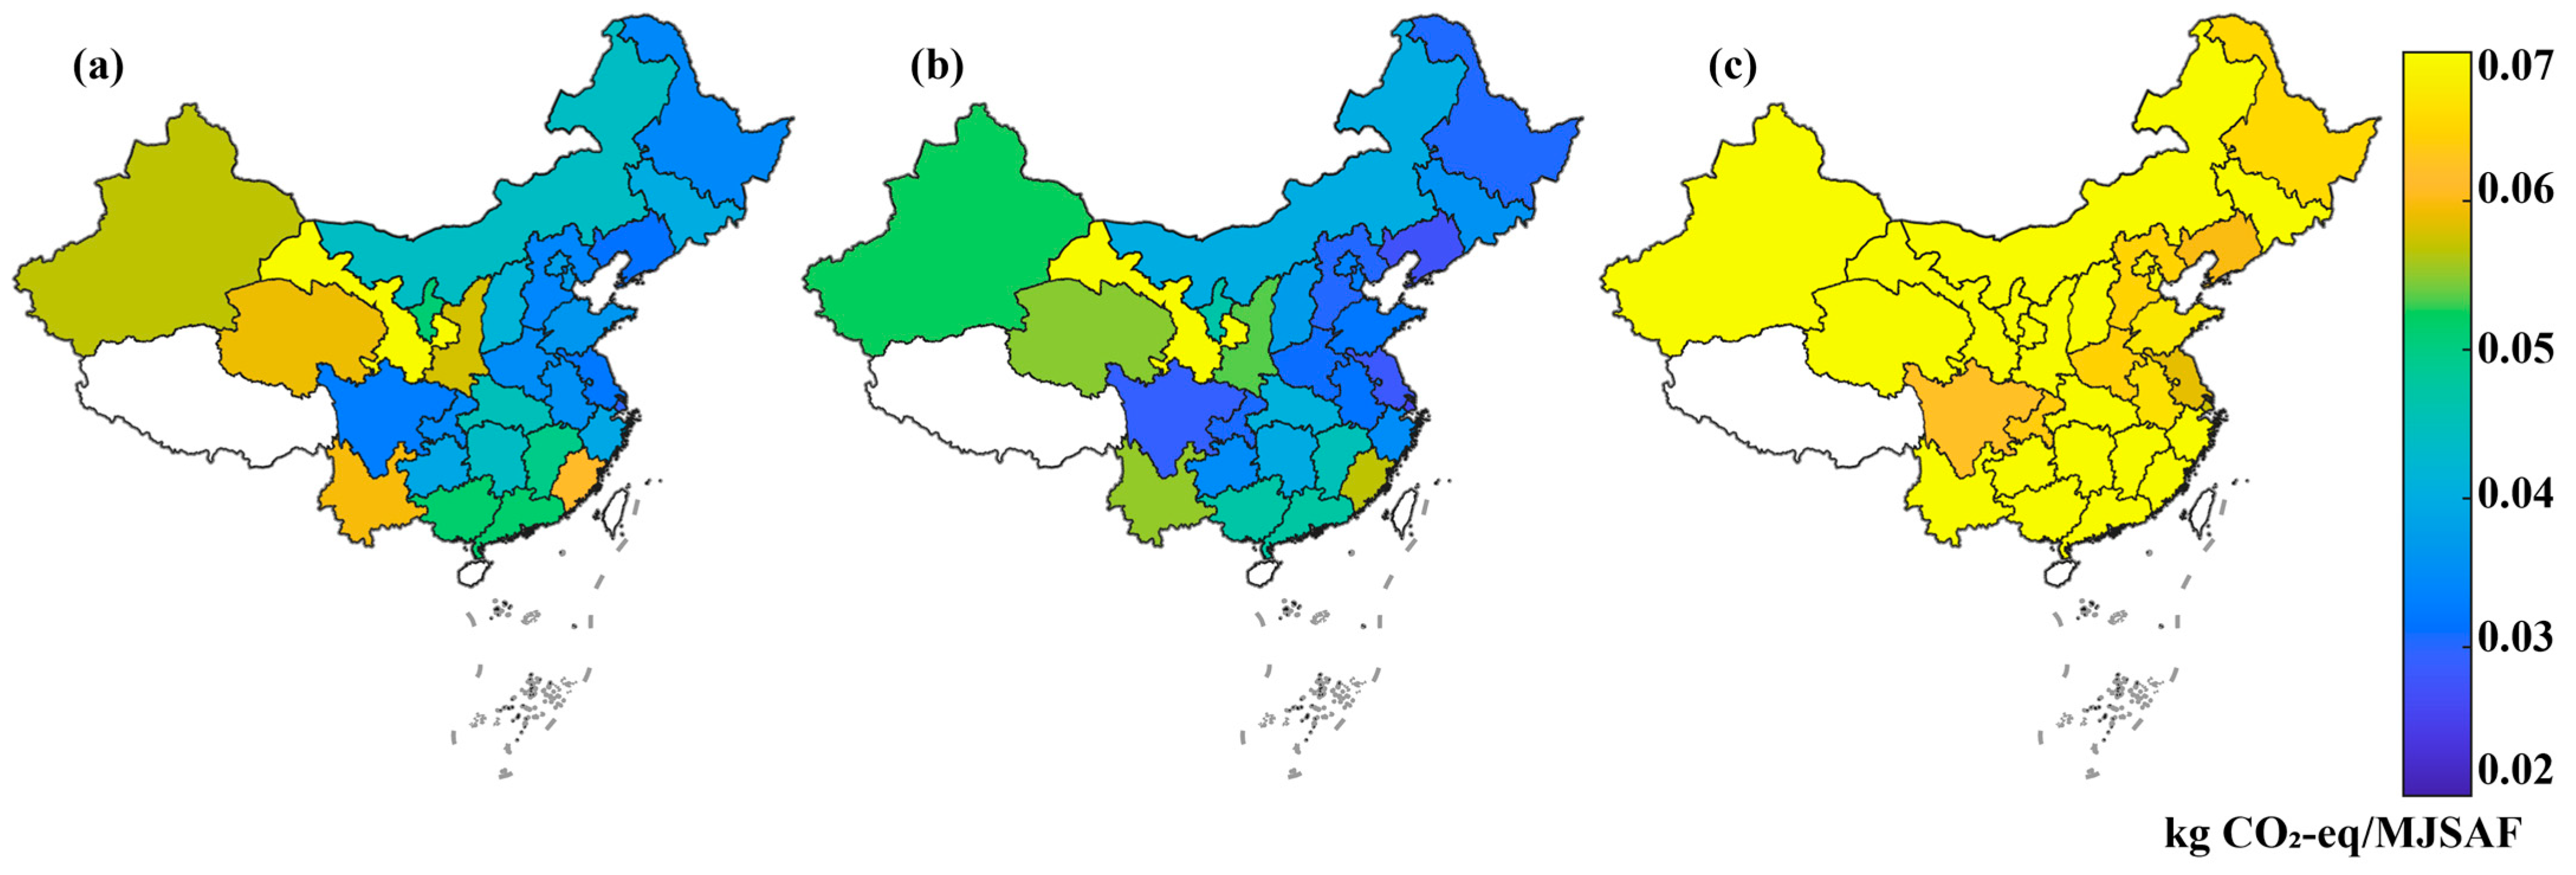
Figure 5 presents the provincial GWP intensity per MJ of SAF produced via the APR, HTL, and FT synthesis.
Figure 5.
Provincial carbon emission intensity of SAF production via (a) APR route, (b) HTL route, and (c) FT synthesis route (for Tibet, Taiwan and Hainan, no data was provided).
Across all three routes, HTL consistently exhibits the lowest carbon intensity, followed by APR, while FT synthesis shows the highest values. In the heat maps, both HTL and APR appear in blue-green tones, with HTL slightly darker and bluer than APR, indicating that APR emits somewhat more than HTL but the difference is small. In contrast, FT synthesis is dominated by orange to bright yellow, reflecting a substantially larger carbon footprint than the other two routes.
Spatially, the highest values occur in Gansu (APR: 0.078, HTL: 0.074, FT synthesis: 0.137 kg CO2-eq/MJ), Fujian (0.061, 0.057, 0.110), Qinghai (0.059, 0.055, 0.105), Yunnan (0.060, 0.055, 0.105), Shaanxi (0.058, 0.053, 0.101), and Xinjiang (0.057, 0.052, 0.101), driven by lower corn yields and higher agricultural input intensities. In contrast, the lowest values appear in Shanghai (APR: 0.030, HTL: 0.026, FT synthesis: 0.058), Sichuan (0.033, 0.029, 0.062), Liaoning (0.031, 0.027, 0.060), and Jiangsu (0.032, 0.028, 0.059), benefiting from high yields and cleaner electricity mixes. Provinces such as Heilongjiang, Hebei, and Henan show intermediate values, consistent with light blue-green tones in the heat maps. These spatial and technological differences provide critical input data for assessing provincial carbon mitigation potential.
3.3.2. Provincial Carbon Mitigation Potential by Route
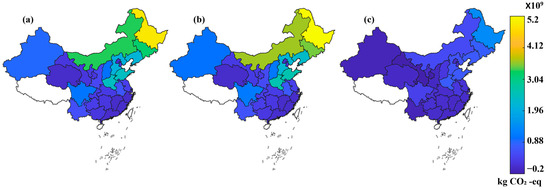
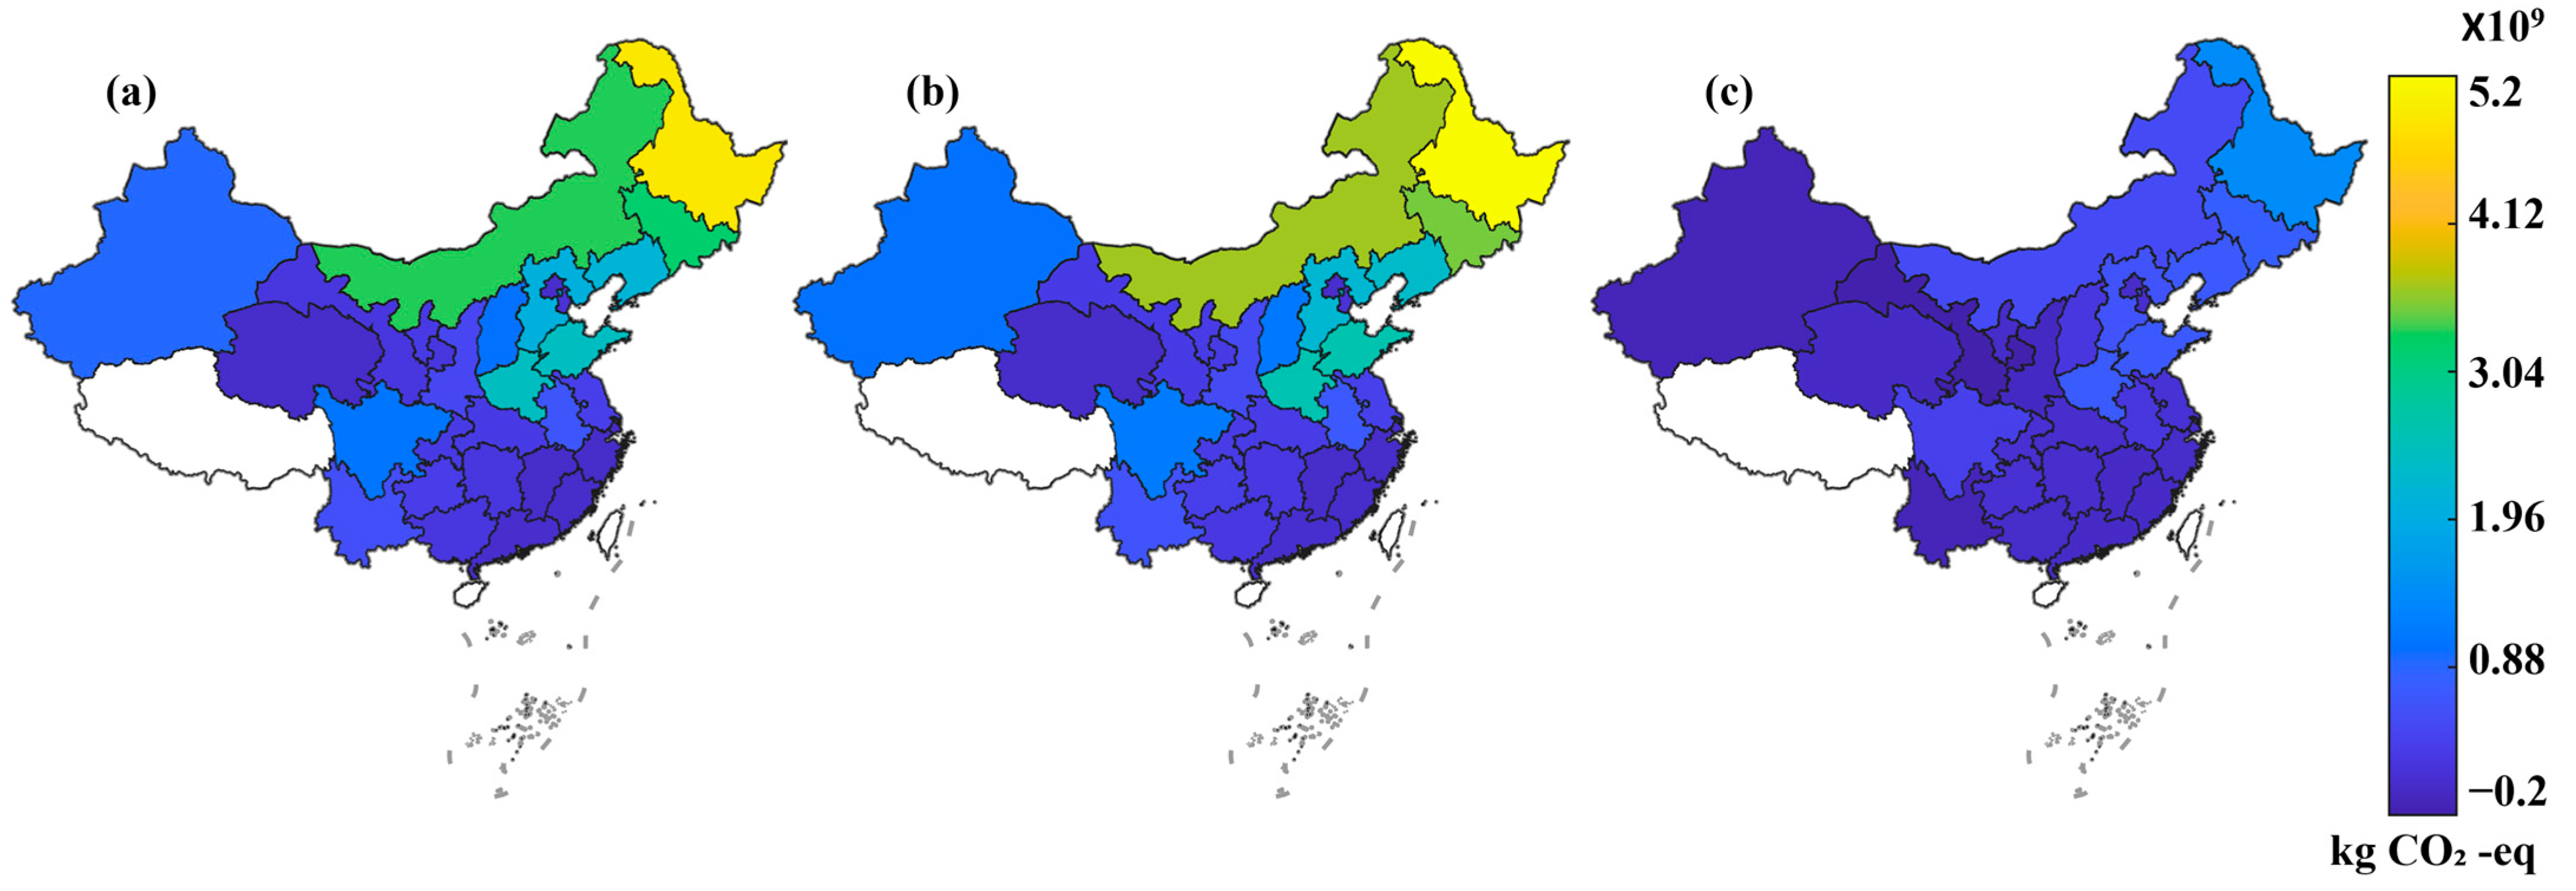
Figure 6 shows carbon mitigation potential of SAF production via different technical routes in each province. Based on the distribution of carbon mitigation potential, provinces in China can be divided into the following two categories, high-efficiency production areas and high-potential experimental areas.
Figure 6.
Provincial carbon mitigation potential of SAF production via (a) APR route, (b) HTL route, and (c) FT synthesis route (for Tibet, Taiwan and Hainan, no data was provided).
Figure 6 shows the provincial carbon mitigation potential (ΔC) of SAF production via the APR, HTL, and FT synthesis routes. The heat maps reveal a clear spatial pattern: yellow regions indicate high mitigation potential, while blue regions indicate low or negative values. Under the HTL route, ΔC in Heilongjiang reaches the highest value of approximately 5.30 × 10⁹ kg CO2-eq, followed by Inner Mongolia (3.65 × 10⁹ kg), Jilin (3.50 × 10⁹ kg), Shandong (2.63 × 10⁹ kg), and Henan (2.62 × 10⁹ kg). In contrast, the lowest values occur in Shanghai (4.89 × 10⁵ kg), Qinghai (1.07 × 10⁷ kg), and Beijing (3.19 × 10⁷ kg). A similar spatial pattern is observed for the APR route, with Heilongjiang again ranking highest (4.90 × 10⁹ kg) and Shanghai lowest (4.55 × 10⁵ kg). Notably, the FT synthesis route yields negative ΔC values in several provinces, including Gansu (−3.30 × 10⁸ kg), Xinjiang (−1.22 × 10⁸ kg), Yunnan (−1.18 × 10⁸ kg), Shaanxi (−5.80 × 10⁷ kg), Fujian (−2.54 × 10⁶ kg), Qinghai (−2.02 × 10⁶ kg), and Guangdong (−4.65 × 10⁴ kg), indicating that FT synthesis-based SAF would lead to net positive emissions in these regions. Based on the distribution of ΔC, provinces can be classified into high-efficiency production areas (yellow regions: Heilongjiang, Jilin, Inner Mongolia, Shandong, and Henan) and high-potential experimental areas (blue-green regions: Sichuan, Chongqing, and Guizhou, where clean electricity reduces the carbon intensity of APR and HTL). These spatial differences highlight the need for differentiated regional strategies for SAF deployment.
3.3.3. Total Climate Benefit Under the Optimal Pathway
Among the three routes, HTL exhibits the highest mitigation efficiency (Section 3.2). Under the “20% energy + 80% ecological” scenario, diverting 20% of national corn straw to HTL-based SAF production yields an annual SAF output of approximately 524.3 billion MJ. This directly avoids 29.6 Mt CO2-eq of emissions by substituting fossil jet fuel. The remaining 80% of straw is incorporated into soil and used as fodder, contributing an additional 25.4 Mt CO2-eq of soil carbon sequestration. The total climate benefit of the integrated system is therefore 55.0 Mt CO2-eq per year (29.6 Mt from fuel substitution + 25.4 Mt from soil carbon sequestration).
To clarify the additionality, the baseline scenario assumes that 80% of straw is returned to the field (consistent with current practice and policy) and the remaining 20% is abandoned or burned without energy recovery. Under the “20% energy + 80% ecological” scenario, the 20% of straw that would otherwise be wasted is diverted to SAF production, providing 29.6 Mt CO2-eq of additional mitigation. The 80% returned to the field maintains the same 25.4 Mt CO2-eq of soil carbon sequestration as in the baseline, so this portion is not additional. Therefore, the 55.0 Mt CO2-eq reported here represents the total climate benefit of the integrated system (25.4 Mt of maintained sequestration + 29.6 Mt of additional mitigation), while the additional mitigation relative to the baseline is 29.6 Mt CO2-eq.
3.4. GWP Sensitivity Analysis
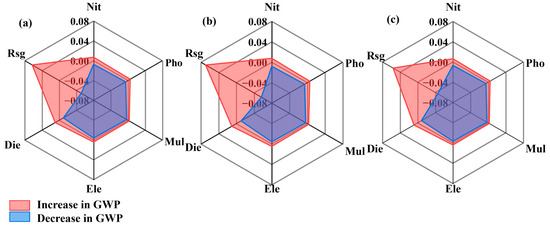
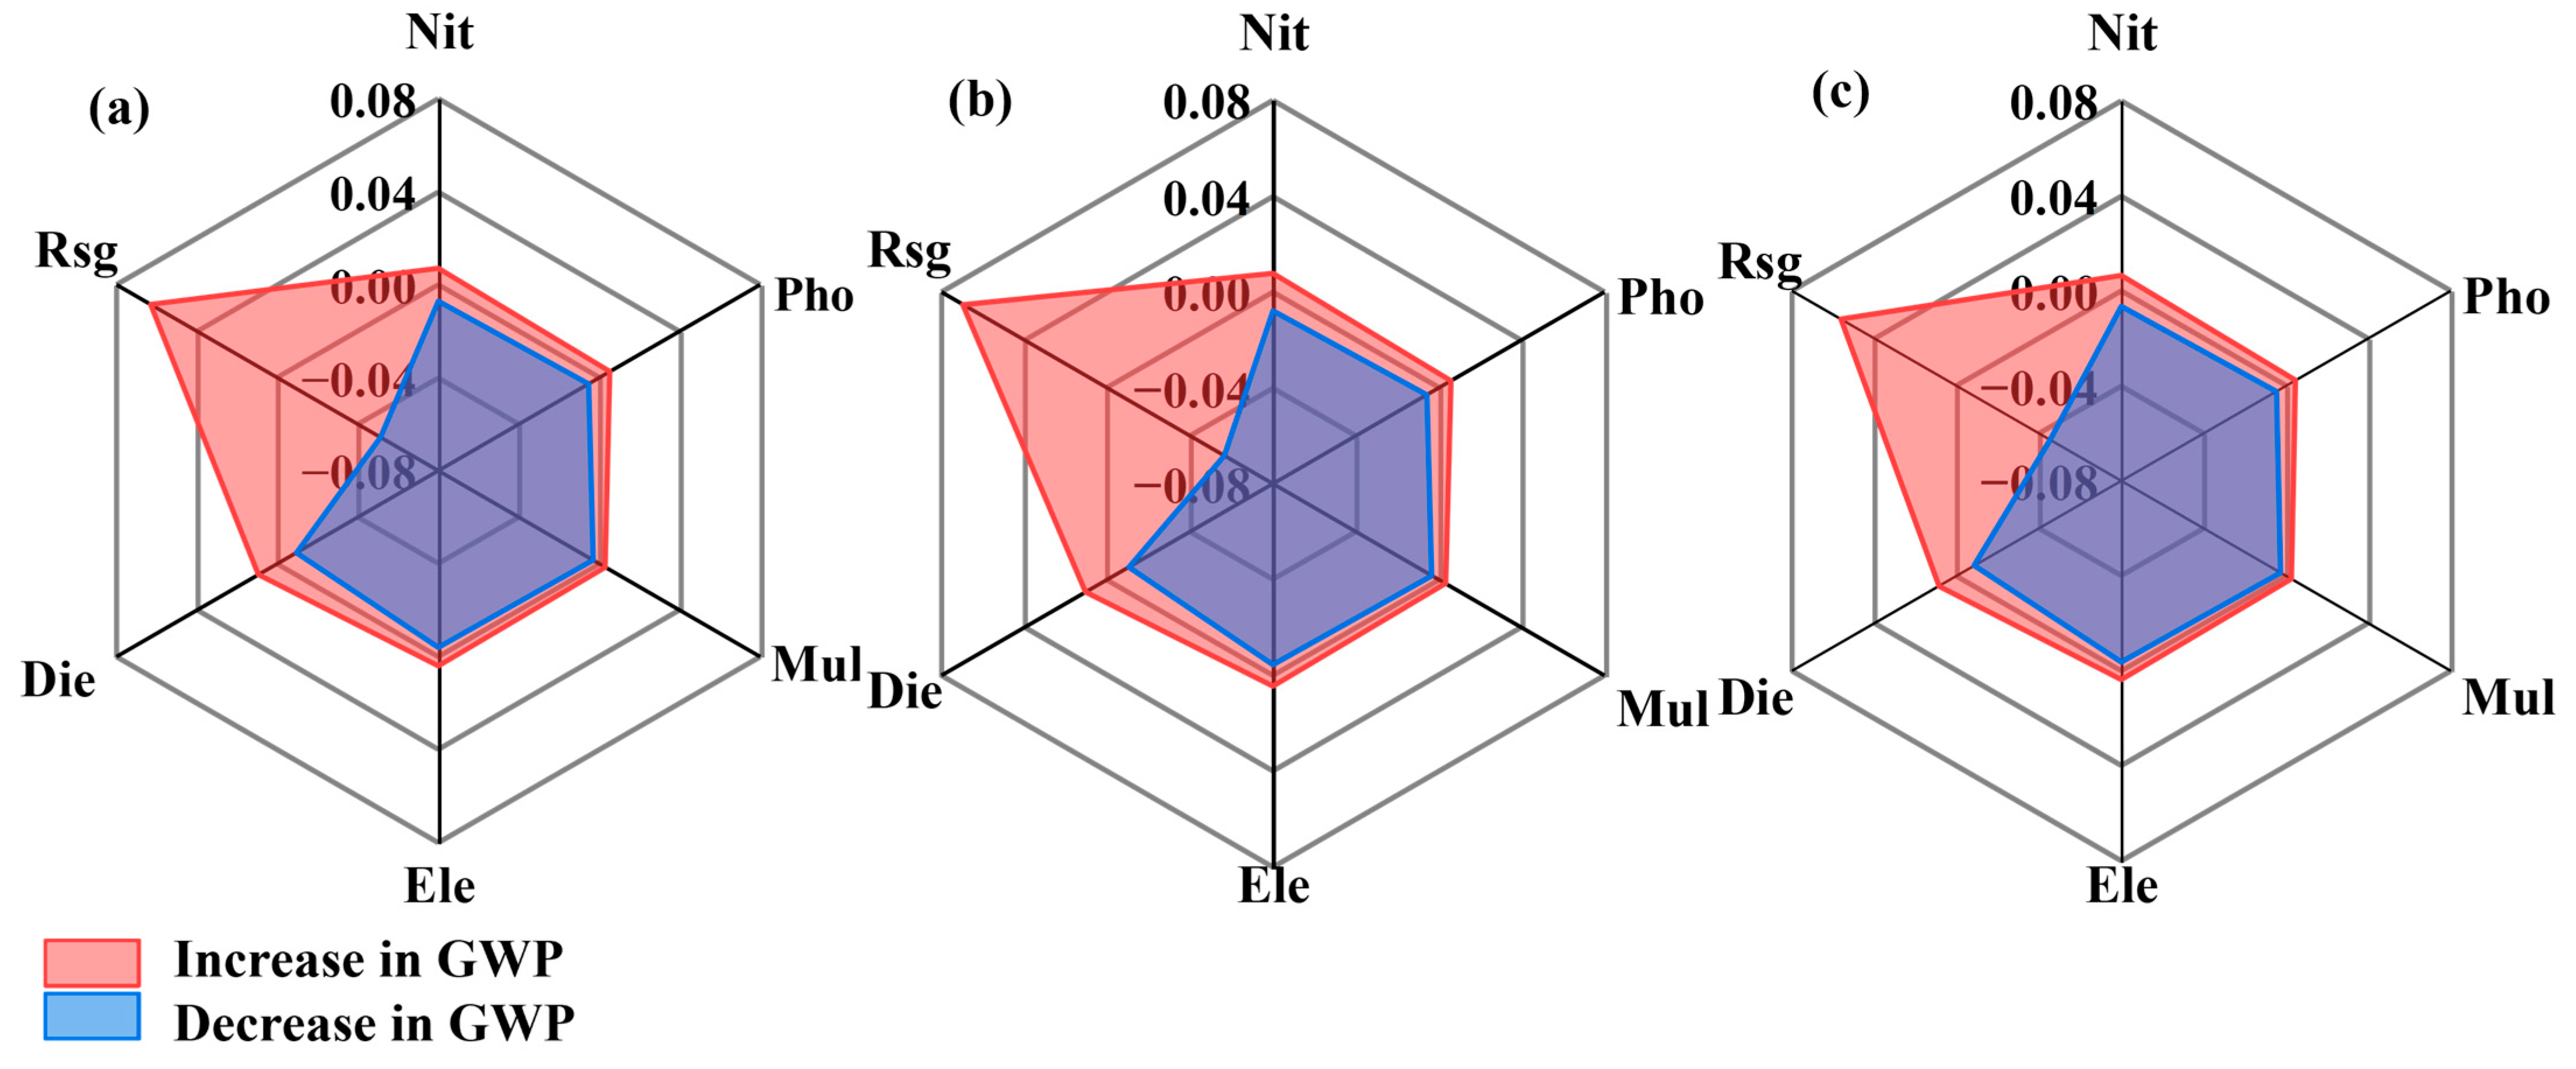
Based on their contribution to GWP, six core parameters are selected: nitrogen fertilizer, phosphorus fertilizer, mulch film, electricity consumption, diesel consumption, and the straw-to-grain ratio Rsg,i. Irrigation water is not treated as a separate parameter because its effect on GWP is mediated through electricity consumption for water lifting, which is already captured by the electricity parameter. Other inputs such as seeds, pesticides, and potassium fertilizer are excluded because their contributions to total GWP are negligible. The perturbation ranges were set according to parameter variability. Fertilizers and diesel vary relatively little across provinces and years, so ±10% was used. Electricity and the straw-to-grain ratio vary more widely due to differences in irrigation mode, grid mix, and regional biomass characteristics, so ±20% was applied. The parameter changes are propagated through the full lifecycle of SAF via the GWP intensity of straw production to calculate their relative impacts on net carbon mitigation. The calculation formula is as follows:
where R is the relative percentage change in the indicator value; C0 is the baseline lifecycle GWP intensity of SAF per MJ (0.036 kg CO2-eq/MJ for HTL, 0.040 kg CO2-eq/MJ for APR, and 0.074 kg CO2-eq/MJ for FT synthesis); and Cp is the recalculated value after perturbing a given parameter. For the same parameter, a larger difference between the R-values under positive and negative perturbations indicates higher sensitivity. The results are shown in Figure 7, where Nit, Pho, Mul, Ele, Die, and Rsg denote nitrogen fertilizer, phosphate fertilizer, mulch film, electricity, diesel, and the straw-to-grain ratio, respectively.
Figure 7.
GWP sensitivity radar charts for (a) APR, (b) HTL, and (c) FT synthesis routes. Nit, Pho, Mul, Ele, Die, and Rsg denote nitrogen fertilizer, phosphate fertilizer, mulch film, electricity, diesel, and the straw-to-grain ratio, respectively.
The sensitivity analysis shows that the straw-to-grain ratio Rsg is the most sensitive parameter, with relative changes of +6.31% to −5.12% for APR, +6.97% to −5.65% for HTL, and +5.61% to −4.55% for FT synthesis. The asymmetry between positive and negative perturbations arises because Rsg appears in the denominator of the allocation equation. Diesel consumption is the second-most sensitive parameter, changing GWP intensity by ±0.96% for APR, ±1.06% for HTL, and ±0.85% for FT synthesis. Nitrogen fertilizer follows, with ±0.72% for APR, ±0.79% for HTL, and ±0.64% for FT synthesis. The same ranking is observed for all three routes: Rsg, diesel, nitrogen fertilizer, phosphate fertilizer, electricity, and mulch film, with the last three changing GWP by less than 0.6%. Overall, even under the most extreme perturbations, the GWP ranking of the three routes (HTL < APR < FT synthesis) and the spatial pattern of GWP remain unchanged. Therefore, the sensitivity analysis confirms that the main conclusions—HTL’s superior environmental performance and the spatial differentiation of GWP—are robust to uncertainties in agricultural input parameters.
4. Economic Assessment of SAF from Corn Straw
The previous sections have verified the environmental feasibility of SAF production from corn straw. APR, HTL, and FT synthesis routes can reduce GWP, with HTL showing the highest carbon mitigation efficiency, followed by APR. This section further evaluates economic feasibility by calculating the total production cost of SAF and introducing carbon benefits for comparison with fossil jet fuel.
4.1. The Cost Variation in Corn Straw Cultivation and Transportation in Various Provinces
4.1.1. Economic Comparison of SAF and Fossil Jet Fuel
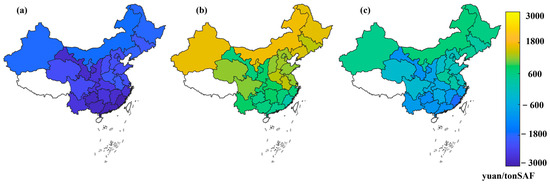
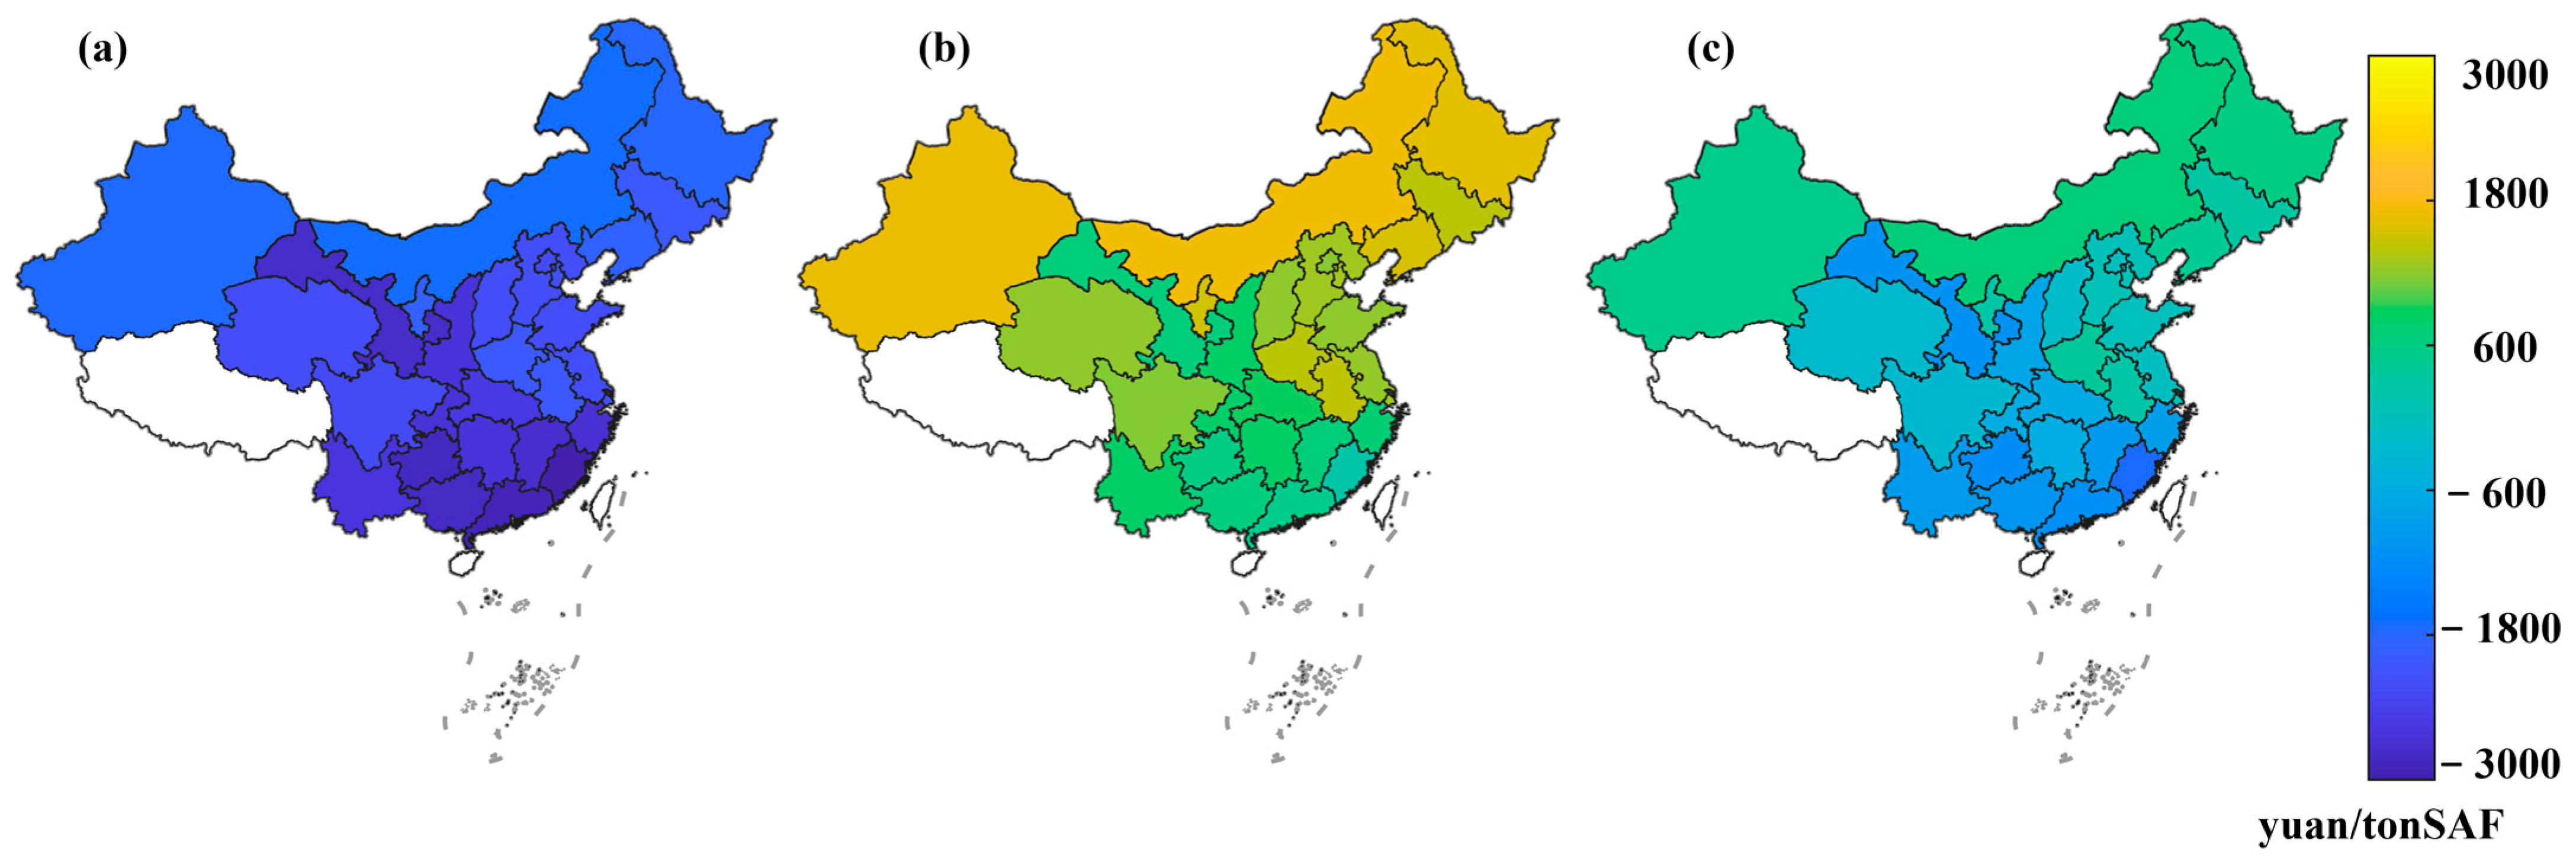
Based on the SAF production costs calculated above, carbon benefits are introduced to compare the net cost with conventional fossil jet fuel, and the results are shown in Figure 8.
Figure 8.
Price gap between SAF and conventional jet fuel by route: (a) APR route, (b) HTL route, and (c) FT synthesis route (for Tibet, Taiwan and Hainan, no data was provided).
Figure 8 presents the cost savings of SAF relative to conventional jet fuel for each province and route. Positive values indicate that SAF is cheaper than fossil jet fuel, while negative values indicate that SAF is more expensive. The heat maps show distinct patterns across the three routes. For the APR route, the subplot is entirely blue, with negative savings ranging from −1.70 × 10³ to −3.21 × 10³ yuan/t across all provinces, indicating that APR-based SAF is not economically viable anywhere under current assumptions. For the HTL route, the subplot is dominated by yellow and green, with all provinces showing positive savings ranging from 241 to 1730 yuan/t (≈36–260 USD/t). The highest savings appear in Inner Mongolia (1730 yuan/t), Xinjiang (1690 yuan/t), Heilongjiang (1630 yuan/t), Liaoning (1570 yuan/t), and Ningxia (1510 yuan/t), all of which exhibit yellow to dark yellow tones in the heat map, indicating strong economic competitiveness. For the FT synthesis route, the subplot is a mixture of green and blue, with savings ranging from −1730 to +695 yuan/t. Positive savings are observed in Heilongjiang (596 yuan/t), Liaoning (468 yuan/t), Henan (380 yuan/t), Jilin (283 yuan/t), Ningxia (280 yuan/t), and Anhui (251 yuan/t), while negative savings remain in Fujian (−1730 yuan/t), Guizhou (−1190 yuan/t), Guangdong (−1160 yuan/t), Gansu (−1090 yuan/t), Guangxi (−1040 yuan/t), Jiangxi (−966 yuan/t), Yunnan (−951 yuan/t), Zhejiang (−883 yuan/t), and Shaanxi (−744 yuan/t). As carbon prices rise, the competitiveness of FT synthesis is expected to improve in more provinces.
Overall, carbon benefits make HTL the most economically attractive route across all provinces, while FT synthesis is competitive only in selected provinces. APR remains unviable in the short term and is suitable only for R&D pilot zones.
4.1.2. Economic Sensitivity Analysis
A sensitivity analysis was performed on the key economic parameters using the formula:
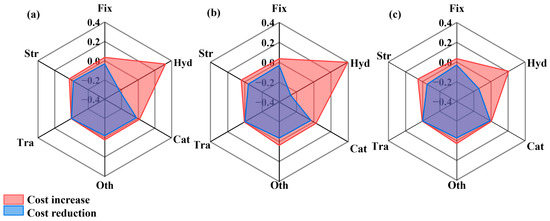
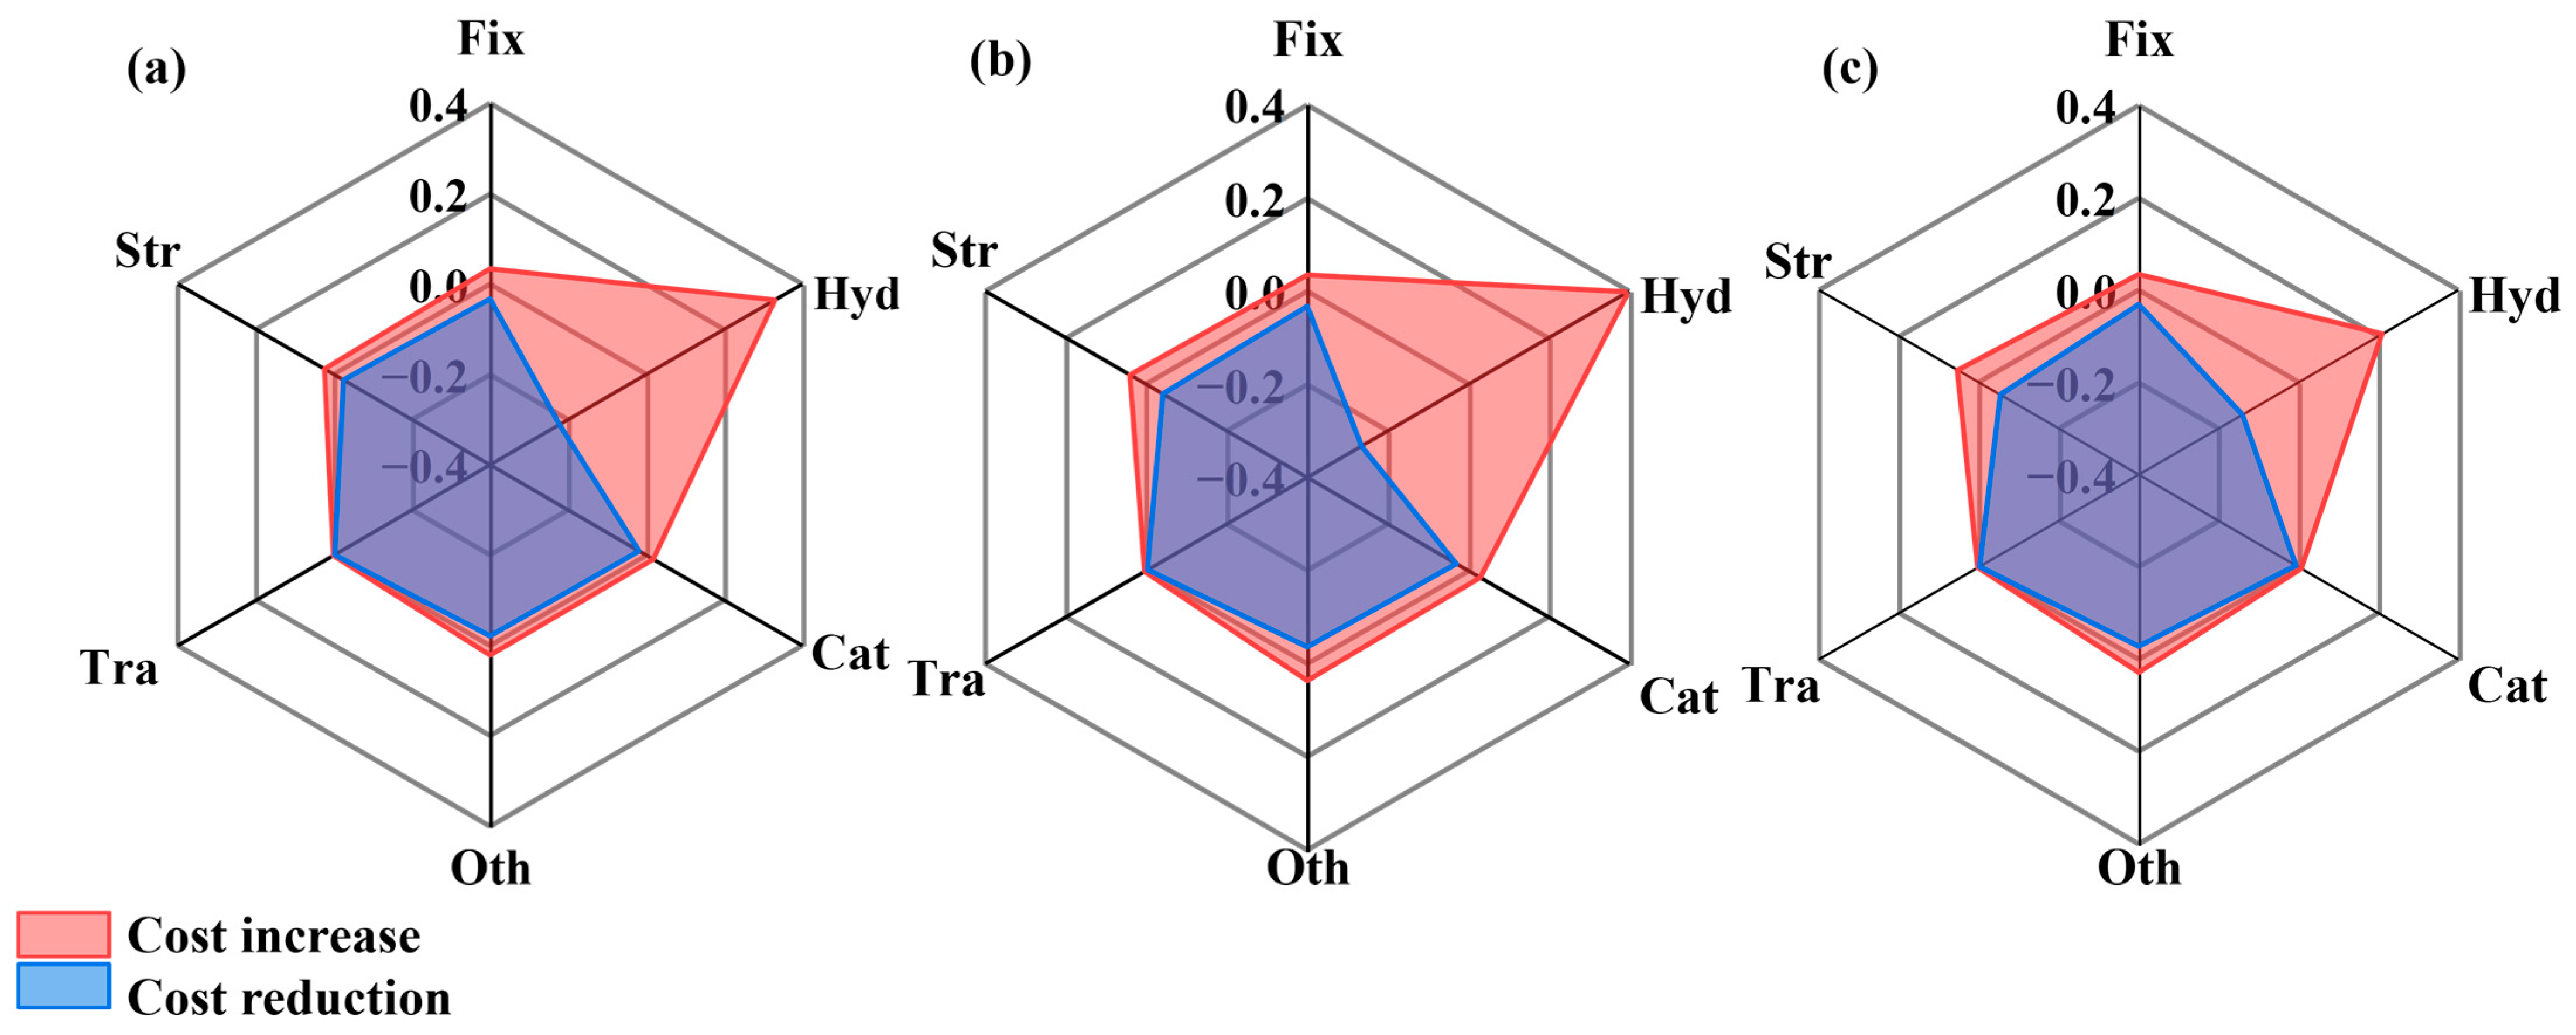
where E refers to the relative percentage change in the indicator value. P0 represents the average production cost for each route across all provinces, 8350 yuan/t for APR, 4900 yuan/t for HTL, and 6300 yuan/t for FT synthesis, and Pp is the recalculated cost after perturbing a specific parameter. The hydrogen price was varied from 30 to 80 yuan/kg (12 USD/kg), following the green hydrogen cost range reported by Dhahri et al. [46]. Rfix was assumed to be 20–25% [54]. Catalyst costs were varied by ±100%, reflecting the high uncertainty in noble metal and specialty catalyst prices. Other chemical costs were varied by ±30%, reflecting uncertain market prices for specialty chemicals. Transportation distance was varied by ±20%, reflecting uncertainty in the assumed refinery-to-airport distance. Straw cost was varied by ±20%, reflecting regional supply–demand fluctuations in straw availability and collection costs.
The results are shown in Figure 9. Hydrogen price is the most sensitive parameter, changing the total production cost by −26.5% to +39.8% for HTL, −22.2% to +32.9% for APR, and −14.0% to +21.0% for FT synthesis. Straw cost is the second-most sensitive parameter for FT synthesis (−5.3% to +5.3%) and for HTL (−4.1% to +4.1%), while its impact on APR is smaller (−2.4% to +2.4%). Fixed costs change total costs by approximately ±3.5% across all routes. Other chemical costs change total costs by −2.1% to +3.6% across routes. Catalyst costs change total costs by −3.0% to +3.0% across routes. Transportation distance has a negligible impact, changing total costs by less than ±0.4% across all routes. Despite these variations, the cost ranking (HTL < FT synthesis < APR) and the main economic conclusions remain unchanged, confirming that the economic assessment is robust to uncertainties in these parameters. Given that hydrogen price is the most sensitive parameter, reducing green hydrogen cost would substantially lower SAF production costs and improve economic competitiveness, particularly for the APR and HTL routes. This highlights the importance of continued cost reductions in green hydrogen production.
Figure 9.
Economic sensitivity radar charts for (a) APR, (b) HTL, and (c) FT synthesis routes. Hyd, Fix, Cat, Oth, Tra, and Str denote hydrogen price, fixed costs, catalyst costs, other chemical costs, transportation distance, and straw cost, respectively.
5. Discussion
5.1. Policy Recommendations
Based on these findings, this study proposes a spatially tailored industrial policy framework that provides a scientific foundation for China’s SAF industry while supporting national carbon peaking and carbon neutrality targets.
First, a spatial industrial layout prioritizing large-scale development in core regions and high-efficiency innovation in pilot zones should be established. Provinces should be selected based on both carbon mitigation potential and economic competitiveness. Heilongjiang and Inner Mongolia rank among the top in both dimensions and should be prioritized as core zones for large-scale HTL biorefineries. Xinjiang, Liaoning, and Ningxia show the highest cost savings under HTL and should be included as priority expansion zones. Jilin, Shandong, and Henan, which have high mitigation potential but moderate cost savings, can serve as reserve zones for future scale-up. Supported by modernized straw collection, storage, and logistics systems, these regions can form a “single-core, multi-node” industrial cluster benefiting from preferential policies in land use, energy consumption, and financing. Conversely, regions endowed with abundant clean electricity and available land, such as Guizhou, Yunnan, and Gansu, should serve as R&D pilot zones for integrated “green electricity–green hydrogen–biorefinery” demonstration projects. Furthermore, dedicated R&D funds should be allocated to foster industry–academia–research collaboration, alongside a cross-provincial technology transfer mechanism to scale up clean production practices.
Second, a robust straw resource management framework that balances energy utilization with ecological benefits must be implemented. The principle of prioritizing agricultural use and ensuring adequate straw incorporation into soils should be strictly enforced. An ecological compensation mechanism for straw return should be developed to provide subsidies for operators who meet standardized field-return criteria. This approach will economically incentivize agricultural stakeholders while simultaneously enhancing the natural carbon sequestration capacity of the soil.
Third, a comprehensive industrial incentive system should be optimized. Carbon mitigation benefits derived from SAF should be integrated into China’s Certified Emission Reduction (CCER) scheme, including a dedicated methodology that translates mitigation benefits into industrial competitiveness. Subsidies and carbon tax rebates should be granted to producers adopting advanced technologies such as HTL and FT synthesis, with priority given to regions that combine high mitigation potential with strong economic competitiveness, such as Heilongjiang and Inner Mongolia, to maximize both carbon reduction and industrial returns. A mechanism to subsidize the price gap between SAF and conventional jet fuel should be established to ensure viable profit margins during early industrialization. Finally, policies mandating or encouraging SAF blending should be formulated, and a national SAF technology innovation center should be established to reward research teams overcoming critical technological bottlenecks. Given that hydrogen price is the most sensitive parameter, dedicated policies should support green hydrogen cost reduction, such as subsidies for electrolyzer deployment, renewable electricity supply, and hydrogen infrastructure, to improve SAF competitiveness.
5.2. Future Research Directions
While this study provides a spatially explicit assessment of carbon mitigation and economic viability, two methodological dimensions remain outside its scope and merit future attention. The first concerns how we measure environmental performance. Our LCA-GWP framework captures the climate cost of emissions but does not reflect the quality of energy conversion. Exergy-based indicators, such as exergy efficiency and the renewability exergy index, can capture this dimension, as demonstrated by Silva Ortiz et al. (2024) [56] in their comparison of SAF biorefinery pathways. Integrating these exergy-based indicators could offer a more complete picture of resource efficiency across the APR, HTL, and FT synthesis routes.
Second, the present analysis restricts energy-oriented straw utilization to SAF production under our predefined 20-to-80% allocation scenario and does not account for alternative biogenic-carbon valorization routes. Lifecycle results from Wang et al. (2024) [57] indicate that corn-straw-derived bio-methanol achieves considerably lower carbon footprints than conventional coal-based methanol. Accordingly, further research can investigate multi-product biorefinery configurations and optimize carbon-allocation strategies for corn straw among SAF manufacturing, methanol synthesis, soil carbon sequestration, and other end-uses. Extending our spatial analytical framework in this direction will support holistic sustainability evaluation for agricultural residue biorefinery systems in China.
6. Conclusions
This study establishes a systematic framework integrating energy substitution and ecological carbon sequestration to evaluate the spatial mitigation potential and economic viability of corn-straw-based SAF in China. The results indicate that the lifecycle GWP associated with corn straw exhibits marked spatial heterogeneity across provinces. This spatial heterogeneity directly affects both environmental performance and the comparative advantages of different provinces. Among the three conversion pathways, hydrothermal liquefaction (HTL) shows the lowest GWP intensity (about 36 g CO2-eq/MJ) and the highest carbon mitigation efficiency (61.4%), followed by aqueous phase reforming (APR). Gasification and Fischer–Tropsch (FT) synthesis shows comparatively limited mitigation performance. Under the HTL pathway, converting 20% of corn straw can achieve an annual SAF output of about 524.3 billion MJ and a direct carbon mitigation of approximately 29.6 Mt CO2-eq. In addition, the remaining 80% straw incorporation yields about 25.4 Mt CO2-eq of soil carbon sequestration annually. Accordingly, this synergistic approach yields a total climate benefit of approximately 55.0 Mt CO2-eq per year, which verifies the feasibility of integrating energy substitution with ecological carbon sequestration. The economic assessment further clarifies practical deployment pathways. After accounting for carbon benefits, HTL is cost-competitive in all provinces, with savings ranging from 241 to 1730 yuan/t (≈36–260 USD/t). The highest savings occur in Inner Mongolia, Xinjiang, Heilongjiang, Liaoning, and Ningxia, where the range is 1510–1730 yuan/t (≈227–260 USD/t). FT synthesis has already reached cost parity with conventional jet fuel in several provinces, including Heilongjiang, Liaoning, Henan, Jilin, Ningxia, and Anhui, with positive savings of 251–596 yuan/t (≈38–89 USD/t), and its competitiveness may expand as carbon pricing strengthens. APR remains unviable in the short term, with production costs 1700–3210 yuan/t (≈255–482 USD/t) higher than conventional jet fuel, and is suitable only for R&D pilot zones. Sensitivity analysis further indicates that hydrogen price is the most sensitive parameter, suggesting that reducing green hydrogen cost would significantly enhance the economic competitiveness of SAF, particularly for the APR and HTL routes. Based on the spatial patterns of carbon mitigation potential and economic competitiveness, the study recommends prioritizing Heilongjiang, Inner Mongolia, Xinjiang, Liaoning, and Ningxia for HTL commercialization, as these provinces combine strong mitigation potential with superior economic performance after carbon-benefit monetization. Guizhou, Yunnan, and Gansu are suggested as R&D pilot zones for timely demonstrations, with a focus on technological progress and practical learning for promising pathways. Overall, this work provides a rigorous scientific basis for the differentiated layout of China’s bio-aviation fuel industry and for designing an energy–ecology synergy mechanism under national Dual Carbon goals. Future research should strengthen technological breakthroughs for leading routes, particularly under realistic energy and hydrogen supply conditions, and can be extended to other agricultural or solid-waste feedstocks.
Author Contributions
M.M.: Supervision, conceptualization, writing (original draft, review, and editing), and project administration. L.W.: Conceptualization, methodology, formal analysis, and writing (original draft, review, and editing). Y.H.: Validation and funding. S.K.: Writing (review and editing) and validation. S.W.: Validation, data curation, and supervision. All authors have read and agreed to the published version of the manuscript.
Funding
This project is funded by the China Postdoctoral Science Foundation (2025T180161).
Institutional Review Board Statement
Not applicable.
Informed Consent Statement
Not applicable.
Data Availability Statement
Data will be made available on request.
Conflicts of Interest
The authors declare that they have no known competing financial interests or personal relationships that could have appeared to influence the work reported in this paper.
Abbreviations
The following abbreviations are used in this manuscript:
| SAF | Sustainable aviation fuel |
| LCA | Lifecycle assessment |
| GWP | Global warming potential |
| APR | Aqueous phase reforming |
| HTL | Hydrothermal liquefaction |
| FT | Fischer–Tropsch |
| CORSIA | Carbon Offsetting and Reduction Scheme for International Aviation |
| ICAO | International Civil Aviation Organization |
| CCER | China Certified Emission Reduction |
Appendix A
Table A1.
Lifecycle inventory of provincial corn plantation [27,28,29,30,31,32,33,34,37].
Table A2.
Electricity emission factors of each province [36].
Table A3.
Lifecycle inventory for SAF production [24].
Table A3 shows the lifecycle inventories for SAF production via APR, HTL and FT synthesis pathways in order from left to right. The unit of electricity is kW·h, transportation capacity is t·km, sustainable aviation fuel is MJ, and all other materials are in kg. Based on the above data, the calculated CO2-equivalent emissions per megajoule of SAF are 0.036 kg CO2-eq/MJ for the HTL pathway, 0.040 kg CO2-eq/MJ for the APR pathway, and 0.074 kg CO2-eq/MJ for the FT synthesis pathway.
Table A4.
Transportation distance of aviation fuel in each province.
References
- Bardon, P.; Massol, O.; Thomas, A. Greening aviation with sustainable aviation fuels: Insights from decarbonization scenarios. J. Environ. Manag. 2025, 374, 123943. [Google Scholar] [CrossRef] [Scilit]
- Qasem, N.A.A.; Mourad, A.; Abderrahmane, A.; Said, Z.; Younis, O.; Guedri, K.; Kolsi, L. A recent review of aviation fuels and sustainable aviation fuels. J. Therm. Anal. Calorim. 2024, 149, 4287–4312. [Google Scholar] [CrossRef] [Scilit]
- Zhang, Z.; Bai, H.; Wu, P.; Shao, J.; She, D.; Zhou, Z.; An, F.; Yang, W.; Li, J.; Li, L.; et al. Strategic Layout of Sustainable Aviation Fuel of China National Aviation Fuel Group Under the Green “Dual-Carbon” Goal. In Proceedings of the 2023 China Enterprise Reform and Development Summit and Achievement Release Conference (2024), Beijing China, 28 February 2024. (In Chinese) [Google Scholar] [CrossRef]
- National Bureau of Statistics. Bulletin on the National Grain Production in 2024. Available online: https://www.stats.gov.cn/sj/zxfb/202412/t20241213_1957744.html (accessed on 13 December 2024). (In Chinese)
- Yang, Y.; Liang, S.; Yang, Y.; Xie, G.H.; Zhao, W. Spatial disparity of life-cycle greenhouse gas emissions from corn straw-based bioenergy production in China. Appl. Energy 2022, 305, 117854. [Google Scholar] [CrossRef] [Scilit]
- Kumar, J.M.S.; Prakash, R.; Panneerselvam, P. Hydrothermal liquefaction − A sustainable technique for present biofuel generation: Opportunities, challenges and future prospects. Fuel 2025, 385, 134141. [Google Scholar] [CrossRef] [Scilit]
- Jamil, F.; Inayat, A.; Hussain, M.; Ghenai, C.; Shanableh, A.; Sarwer, A.; Shah, N.; Park, Y. Green hydrogen production through a facile aqueous-phase reforming technique from waste biomass: A comprehensive review. Int. J. Hydrogen Energy 2024, 96, 126–146. [Google Scholar] [CrossRef] [Scilit]
- Sierk, D.J.; Kay, A.; Ric, H.; Laura, L.; Michael, W.; André, F.; Junginger, M. Life-cycle analysis of greenhouse gas emissions from renewable jet fuel production. Biotechnol. Biofuels 2017, 10, 64. [Google Scholar] [CrossRef] [Scilit]
- Martínez del Monte, D.; Vizcaíno, A.J.; Dufour, J.; Martos, C. Effect of K, Co and Mo addition in Fe-based catalysts for aviation biofuels production by Fischer-Tropsch synthesis. Fuel Process. Technol. 2019, 194, 106102. [Google Scholar] [CrossRef] [Scilit]
- Zhang, M.; Li, J.; Liu, Y.; Qin, S. Advances in jet fuel production from biomass gasification via Fischer-Tropsch synthesis. Chem. Ind. Eng. Prog. 2026, 46, 3952–3963. (In Chinese) [Google Scholar] [CrossRef]
- Zhang, Q.; Li, Y.; Chen, L.; Wang, T.; Liu, Q.; Zhang, X.; Tan, J.; Li, K.; Ma, L. Material and Energy Conversion of Integrated 100,t/a-Scale Bio-Jet Fuel-Range Hydrocarbon Production System via Aqueous Conversion of Biomass. J. Tianjin Univ. (Sci. Technol.) 2017, 50, 13–18. (In Chinese) [Google Scholar] [CrossRef]
- Zhang, A.; Liu, Z.; Liang, C.; Wang, S.; Wan, Z. Optimization of in-situ gasification & catalytic reforming process for hydrogen production from aqueous bio-oil. Chem. Ind. Eng. Prog. 2022, 41, 1340–1348. (In Chinese) [Google Scholar] [CrossRef]
- Fan, X.; Khanna, M.; Lee, Y.; Kent, J.; Shi, R.; Guest, J.S.; Lee, D. Spatially Varying Costs of GHG Abatement with Alternative Cellulosic Feedstocks for Sustainable Aviation Fuels. Environ. Sci. Technol. 2024, 58, 11352–11362. [Google Scholar] [CrossRef] [Scilit]
- Halimi, N.A.N.; Odunsi, A.; Sebastiani, A.; Kamel, D. Waste to Biofuel: Process Design and Optimisation for Sustainable Aviation Fuel Production from Corn Stover. Energies 2025, 18, 3418. [Google Scholar] [CrossRef] [Scilit]
- Zhang, C.; Guo, Y.; Zhang, C.; Shen, Y. Temporal and spatial changes in the green water deficit of grain production in the three provinces of Northeast China. Chin. J. Eco-Agric. Zhongguo Shengtai Nongye Xuebao (Zhong-Yingwen Ban) 2025, 33, 667–681. (In Chinese) [Google Scholar] [CrossRef]
- Zhao, J. The Potential Yield and Improvement of Maize in China Under Climate Change. Doctoral Dissertation, China Agricultural University, Beijing, China, 2015. (In Chinese) [Google Scholar]
- Liao, X.; Tan, Q.; Zhang, W.; Ma, X.; Li, J. Analysis of Life-Cycle Greenhouse Gas Emission Reduction Potential and Cost for China’s Power Generation Sector. Acta Sci. Nat. Univ. Pekin. 2013, 49, 885–891. (In Chinese) [Google Scholar] [CrossRef]
- Shang, M.; Zhao, J.; Han, T.; Li, S.; Wang, K.; Gao, Z.; Qin, Y.; Chu, Q. Temporal and spatial variation of maize water requirement and water surplus and deficit in China from 1961 to 2020. J. China Agric. Univ. 2022, 27, 22–30. (In Chinese) [Google Scholar] [CrossRef]
- Ministry of Agriculture and Rural Affairs. National On-site Promotion Meeting for Comprehensive Utilization of Crop Straw held in Xinxiang, Henan Province. 2024. Available online: http://www.reea.agri.cn/ststny/202406/t20240617_8643096.htm (accessed on 17 June 2024). (In Chinese)
- Sun, X. The Effect and Mechanism of Biochar-Based Fertilizer on Maize Growth and Soil Organic Carbon Fractions. Master’s Thesis, Shenyang Agricultural University, Shenyang, China, 2024. (In Chinese) [Google Scholar] [CrossRef]
- Huo, L.; Tian, Y.; Meng, H.; Zhao, L.; Yao, Z. Life Cycle Assessment of Biomass Solidified Fuel. Acta Energiae Solaris Sin. 2011, 32, 1875–1880. (In Chinese) [Google Scholar] [CrossRef]
- Wei, Y.; Zhang, X.; Song, W.; Ahmad, S. Spatiotemporal variations of wheat and maize grass-grain ratio and analysis of carbon sequestration and emission reduction effects of comprehensive straw utilization. Trans. Chin. Soc. Agric. Eng. 2025, 41, 271–279. (In Chinese) [Google Scholar] [CrossRef]
- Wang, Q.; Yu, C. Review on of Carbon Emission Trading in China: Price Fluctuations and Policy Effects. J. China Univ. Pet. 2026, 42, 50–66. (In Chinese) [Google Scholar] [CrossRef]
- Zhu, X. Study on Environmental Impact of Bio-Jet Fuel Preparation and Utilization Based on Life Cycle Assessment. Master’s Thesis, Zhejiang University, Hangzhou, China, 2022. (In Chinese) [Google Scholar] [CrossRef]
- Zhu, X.; Wang, S.; Wang, L. Life cycle analysis of greenhouse gas emissions of China’s power generation on spatial and temporal scale. Energy Sci. Eng. 2022, 10, 1083–1095. [Google Scholar] [CrossRef] [Scilit]
- Panji District People’s Government. Implementation Plan for the 2025 Central Fiscal Crop Straw Comprehensive Utilization Project in Panji District. 2025. Available online: https://www.panji.gov.cn/group1/M00/2A/88/rB406mlmDfOAB8j_AAi0HYR3Bzc221.pdf (accessed on 26 March 2025). (In Chinese)
- National Development and Reform Commission. National Compilation of Agricultural Product Cost-Benefit Data 2024; China Statistics Press: Beijing, China, 2024; (In Chinese). [Google Scholar] [CrossRef]
- Agricultural Irrigation Water Quota: Corn. 2022. Available online: https://www.zggqxh.com.cn/info/910 (accessed on 23 September 2022). (In Chinese)
- Haiyan, W.; Huanhuan, Q.; Qian, Z. Carbon Footprint Accounting and Spatiotemporal Analysis of Rapeseed in China Based on Life Cycle Assessment. J. South. Agric. 2025, 56, 1341–1350. (In Chinese) [Google Scholar] [CrossRef]
- China Price Information Network. Retail Prices of Diesel in Provinces Nationwide in September. 2023. Available online: https://www.chinaprice.cn/syny/50548.jhtml (accessed on 10 October 2023). (In Chinese)
- China Price Information Network. Prices of Agricultural Film Fin Provinces Nationwide in Early November. 2024. Available online: https://www.chinaprice.cn/synzsn/54535.jhtml (accessed on 15 November 2024). (In Chinese)
- Li, L.; Haung, Y.; Han, C. Energy Conversion Coefficients of Industrial Energy Inputs in Agricultural Ecosystems: An Exploration. J. Rural Eco-Environ. 1989, 32–36+76. Available online: https://www.ere.ac.cn/cn/article/pdf/preview/10099.pdf (accessed on 16 October 2026). (In Chinese)
- Qiao, Z. Experimental Analysis of “Electricity-to-Water” Conversion Coefficient Calibration in the Pure Well-Irrigated District of Ejin Horo Banner. Inn. Mong. Water Resour. 2026, 63–64. Available online: https://kns.cnki.net/reader/flowpdf?invoice=Mzt0FB50g1PK%2BIvwis664s68ldASum70H5H7ScWIS7lbMnzV37tcDoRoSBQbWIjwY0ud3%2BEt1zzpV1rXsy1DylEnTQyZvuTY%2F%2FAJrbrnJF2q9Gl9%2FGKADaVRvN5tjLd%2FTrBv%2BR6%2B3NLMr%2FApoMSpiCoEROGZ%2FGmhfkju62UqnLc%3D&platform=NZKPT&sourcetype=nxgp&product=CJFQ&filename=NMSL202602020&tablename=cjfdlast2026&type=JOURNAL&scope=trial&cflag=overlay&dflag=pdf&pages=&language=CHS&trial=&nonce=BB62DF82DA444239AC3D2C7055C65264 (accessed on 9 July 2025). (In Chinese)
- Lu, J.; Ren, M.; Li, D.; Zhao, J.; Yang, J.; Dong, J. Occurrence of Major Diseases, Insects and Weeds on Maize and Pesticide Usage for the Pests Control in Shanxi. J. Maize Sci. 2021, 29, 82–87. [Google Scholar] [CrossRef]
- Zhu, Y.; Li, Y.; Jiang, D.; Zhou, X. Life Cycle Assessment on Carbon Footprint of Winter Wheat-Summer Maize Cropping System Based on Survey Data of Gaomi in Shandong Province, China. J. Agric. Resour. Environ. 2017, 34, 473–482. (In Chinese) [Google Scholar] [CrossRef]
- Department of Climate Change; National Development and Reform Commission. 2016 Baseline Emission Factors for Regional Power Grids in China. 2017. Available online: https://www.ndrc.gov.cn/hdjl/yjzq/201704/t20170414_1165985_ext.html (accessed on 14 April 2017).
- Wang, X.; Xue, S.; Xie, G. Value-taking for residue factor as a parameter to assess the field residue of field crops. J. China Agric. Univ. 2012, 17, 1–8. (In Chinese) [Google Scholar] [CrossRef]
- Sawyer, J.E.; Mallarino, A.P. Nutrient Considerations with Corn Stover Harvest. 2014. Available online: https://store.extension.iastate.edu/Product/Nutrient-Considerations-with-Corn-Stover-Harvest (accessed on 16 October 2026).
- Ding, J.; Dong, L.; Liu, Y.; Sun, D. Application of life cycle assessment in maize planting and deep processing products. China Environ. Sci. 2021, 41, 5405–5415. (In Chinese) [Google Scholar] [CrossRef]
- Chiaramonti, D.; Talluri, G.; Vourliotakis, G.; Testa, L.; Prussi, M.; Scarlat, N. Can Lower Carbon Aviation Fuels (LCAF) Really Complement Sustainable Aviation Fuel (SAF) towards EU Aviation Decarbonization? Energies 2021, 14, 6430. [Google Scholar] [CrossRef] [Scilit]
- Chen, W. Effects of Straw Compost and Plant Rhizosphere Synthetic Community on Soil and Maize Growth. Doctoral Dissertation, Northeast Forestry University, Harbin, China, 2023. (In Chinese) [Google Scholar]
- Li, S.; Li, B.; Wang, C.; Sun, P. Effects of Maize Straw Returning on Soil Fertility Index and Carbon Sequestration Ability. Heilongjiang Agric. Sci. 2024, 32–38. (In Chinese) [Google Scholar] [CrossRef]
- Zhang, W.; Liu, K.; Wang, J.; Shao, X.; Xu, M.; Li, J.; Wang, X.; Murphy, D. Relative contribution of maize and external manure amendment to soil carbon sequestration in a long-term intensive maize cropping system. Sci. Rep. 2015, 5, 10791. [Google Scholar] [CrossRef] [Scilit]
- CNHNB. Corn Price Quotes and Market Trends. 2026. Available online: https://www.cnhnb.com/supply/search/?k= (accessed on 22 September 2026). (In Chinese)
- Energy Data Center. Anhui Industrial and Commercial Power Price. 2026. Available online: https://energydc.cn/query/2026-08-01/anhui/industrial-commercial-power/single-part-tariff/voltage-above-220kv (accessed on 1 August 2026).
- Dhahri, H.A.; Hussain, M.; Ghani, M.A.A.; Inayat, A.; Muhtaseb, A.A.H.A.; Haj, L.A.; Jamil, F. Green hydrogen production via electrolysis: Materials innovation, system integration, and global deployment pathways. Renew. Sustain. Energy Rev. 2026, 229, 116617. [Google Scholar] [CrossRef] [Scilit]
- Pipitone, G.; Zoppi, G.; Pirone, R.; Bensaid, S. Sustainable aviation fuel production using in-situ hydrogen supply via aqueous phase reforming: A techno-economic and life-cycle greenhouse gas emissions assessment. J. Clean. Prod. 2023, 418, 138141. [Google Scholar] [CrossRef] [Scilit]
- Tews, I.J.; Zhu, Y.; Drennan, C.; Elliott, D.C.; Snowden-Swan, L.J.; Onarheim, K.; Solantausta, Y.; Beckman, D. Biomass Direct Liquefaction Options: TechnoEconomic and Life Cycle Assessment; Pacific Northwest National Laboratory: Richland, WA, USA, 2014; PNNL-23579. [Google Scholar]
- Kern, C.; Jess, A. Design and Technoeconomic Analysis of Fischer–Tropsch Fixed-Bed Synthesis with Cobalt-Based Catalysts. Energy Technol. 2024, 12, 2301534. [Google Scholar] [CrossRef] [Scilit]
- China Commodity Data Group. Commodity Price List for Chemical Products. 2026. Available online: https://www.100ppi.com/mprice/plist-1-515-1.html (accessed on 25 September 2026). (In Chinese)
- Aicaigou, B. Wholesale Prices and Quality Supply Sources. 2026. Available online: https://b2b.baidu.com (accessed on 25 September 2026). (In Chinese)
- Chen, Y.N.; Xiao, R.; Huang, W.; Luo, Y.; Zhang, M. Railway and Highway Freight Rate Comparison for Modern Logistics Competition. Railw. Logist. 2025, 43, 19–24. (In Chinese) [Google Scholar] [CrossRef]
- International Logistics Laotie. What Is the Empty Running Fee Compensation Mechanism? 2025. Available online: https://wl37.com/Info-ku26689.html (accessed on 2 September 2025). (In Chinese)
- Wei, Q.; Luo, Z.; Sun, H.; Qian, Q.; Shi, J.; Song, C.; Naranov, E. Energy and techno-economic analysis of aviation fuel production via biomass gasification, olefins synthesis and oligomerization. Energy 2025, 329, 136736. [Google Scholar] [CrossRef] [Scilit]
- Huatai Securities. Transportation Industry Thematic Research: Optimistic on Oil Shipping, Layout Express Delivery, Allocate Dividend; Huatai Securities: Beijing, China, 2026; Available online: https://www.sgpjbg.com.cn/baogao/1333082.html (accessed on 13 September 2026).
- Silva Ortiz, P.; de Oliveira, S.; Mariano, A.P.; Jocher, A.; Posada, J. Exergy-Based Improvements of Sustainable Aviation Fuels: Comparing Biorefinery Pathways. Processes 2024, 12, 510. [Google Scholar] [CrossRef] [Scilit]
- Wang, S.; Li, C.; Hu, Y.-J.; Wang, H.; Xu, G.; Zhao, G.; Wang, S. Assessing the prospect of bio-methanol fuel in China from a life cycle perspective. Fuel 2024, 358, 130255. [Google Scholar] [CrossRef] [Scilit]
Disclaimer/Publisher’s Note: The statements, opinions and data contained in all publications are solely those of the individual author(s) and contributor(s) and not of MDPI and/or the editor(s). MDPI and/or the editor(s) disclaim responsibility for any injury to people or property resulting from any ideas, methods, instructions or products referred to in the content. |
© 2026 by the authors. Licensee MDPI, Basel, Switzerland. This article is an open access article distributed under the terms and conditions of the Creative Commons Attribution (CC BY) license.