


Abstract
Air pollution in the United States has decreased substantially, yet exposure remains unequal by race and ethnicity. Whether residential mobility narrows or widens this gap has been difficult to establish because nationwide mobility data have been limited. This study develops an exposure-reallocation estimand that measures, for households leaving each neighborhood, the flow-weighted difference between pollution at their destinations and origins. It applies the estimand to national block-group migration flows from 2011 to 2019 linked to eight pollutant surfaces. The aggregate decline in exposure reflected in-place cleanup rather than migration. Mobility nevertheless distributed those improvements unequally: conditional on origin pollution, movers from minority neighborhoods reached less clean destinations than comparable movers from white neighborhoods. The same qualitative pattern appears in individual census microdata. The disparity is little explained by destination housing values and exhibits a distinctive pollutant signature: largest for pollutants associated with fixed urban infrastructure, absent for wildfire smoke, and reversed for ozone. Over 2011 to 2019, these patterns are consistent with residential mobility reproducing environmental inequality.
1. Introduction
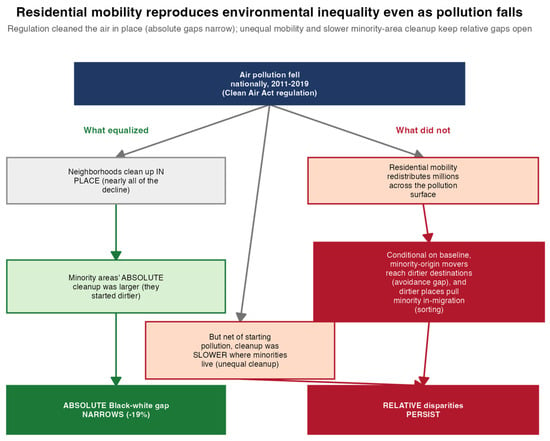
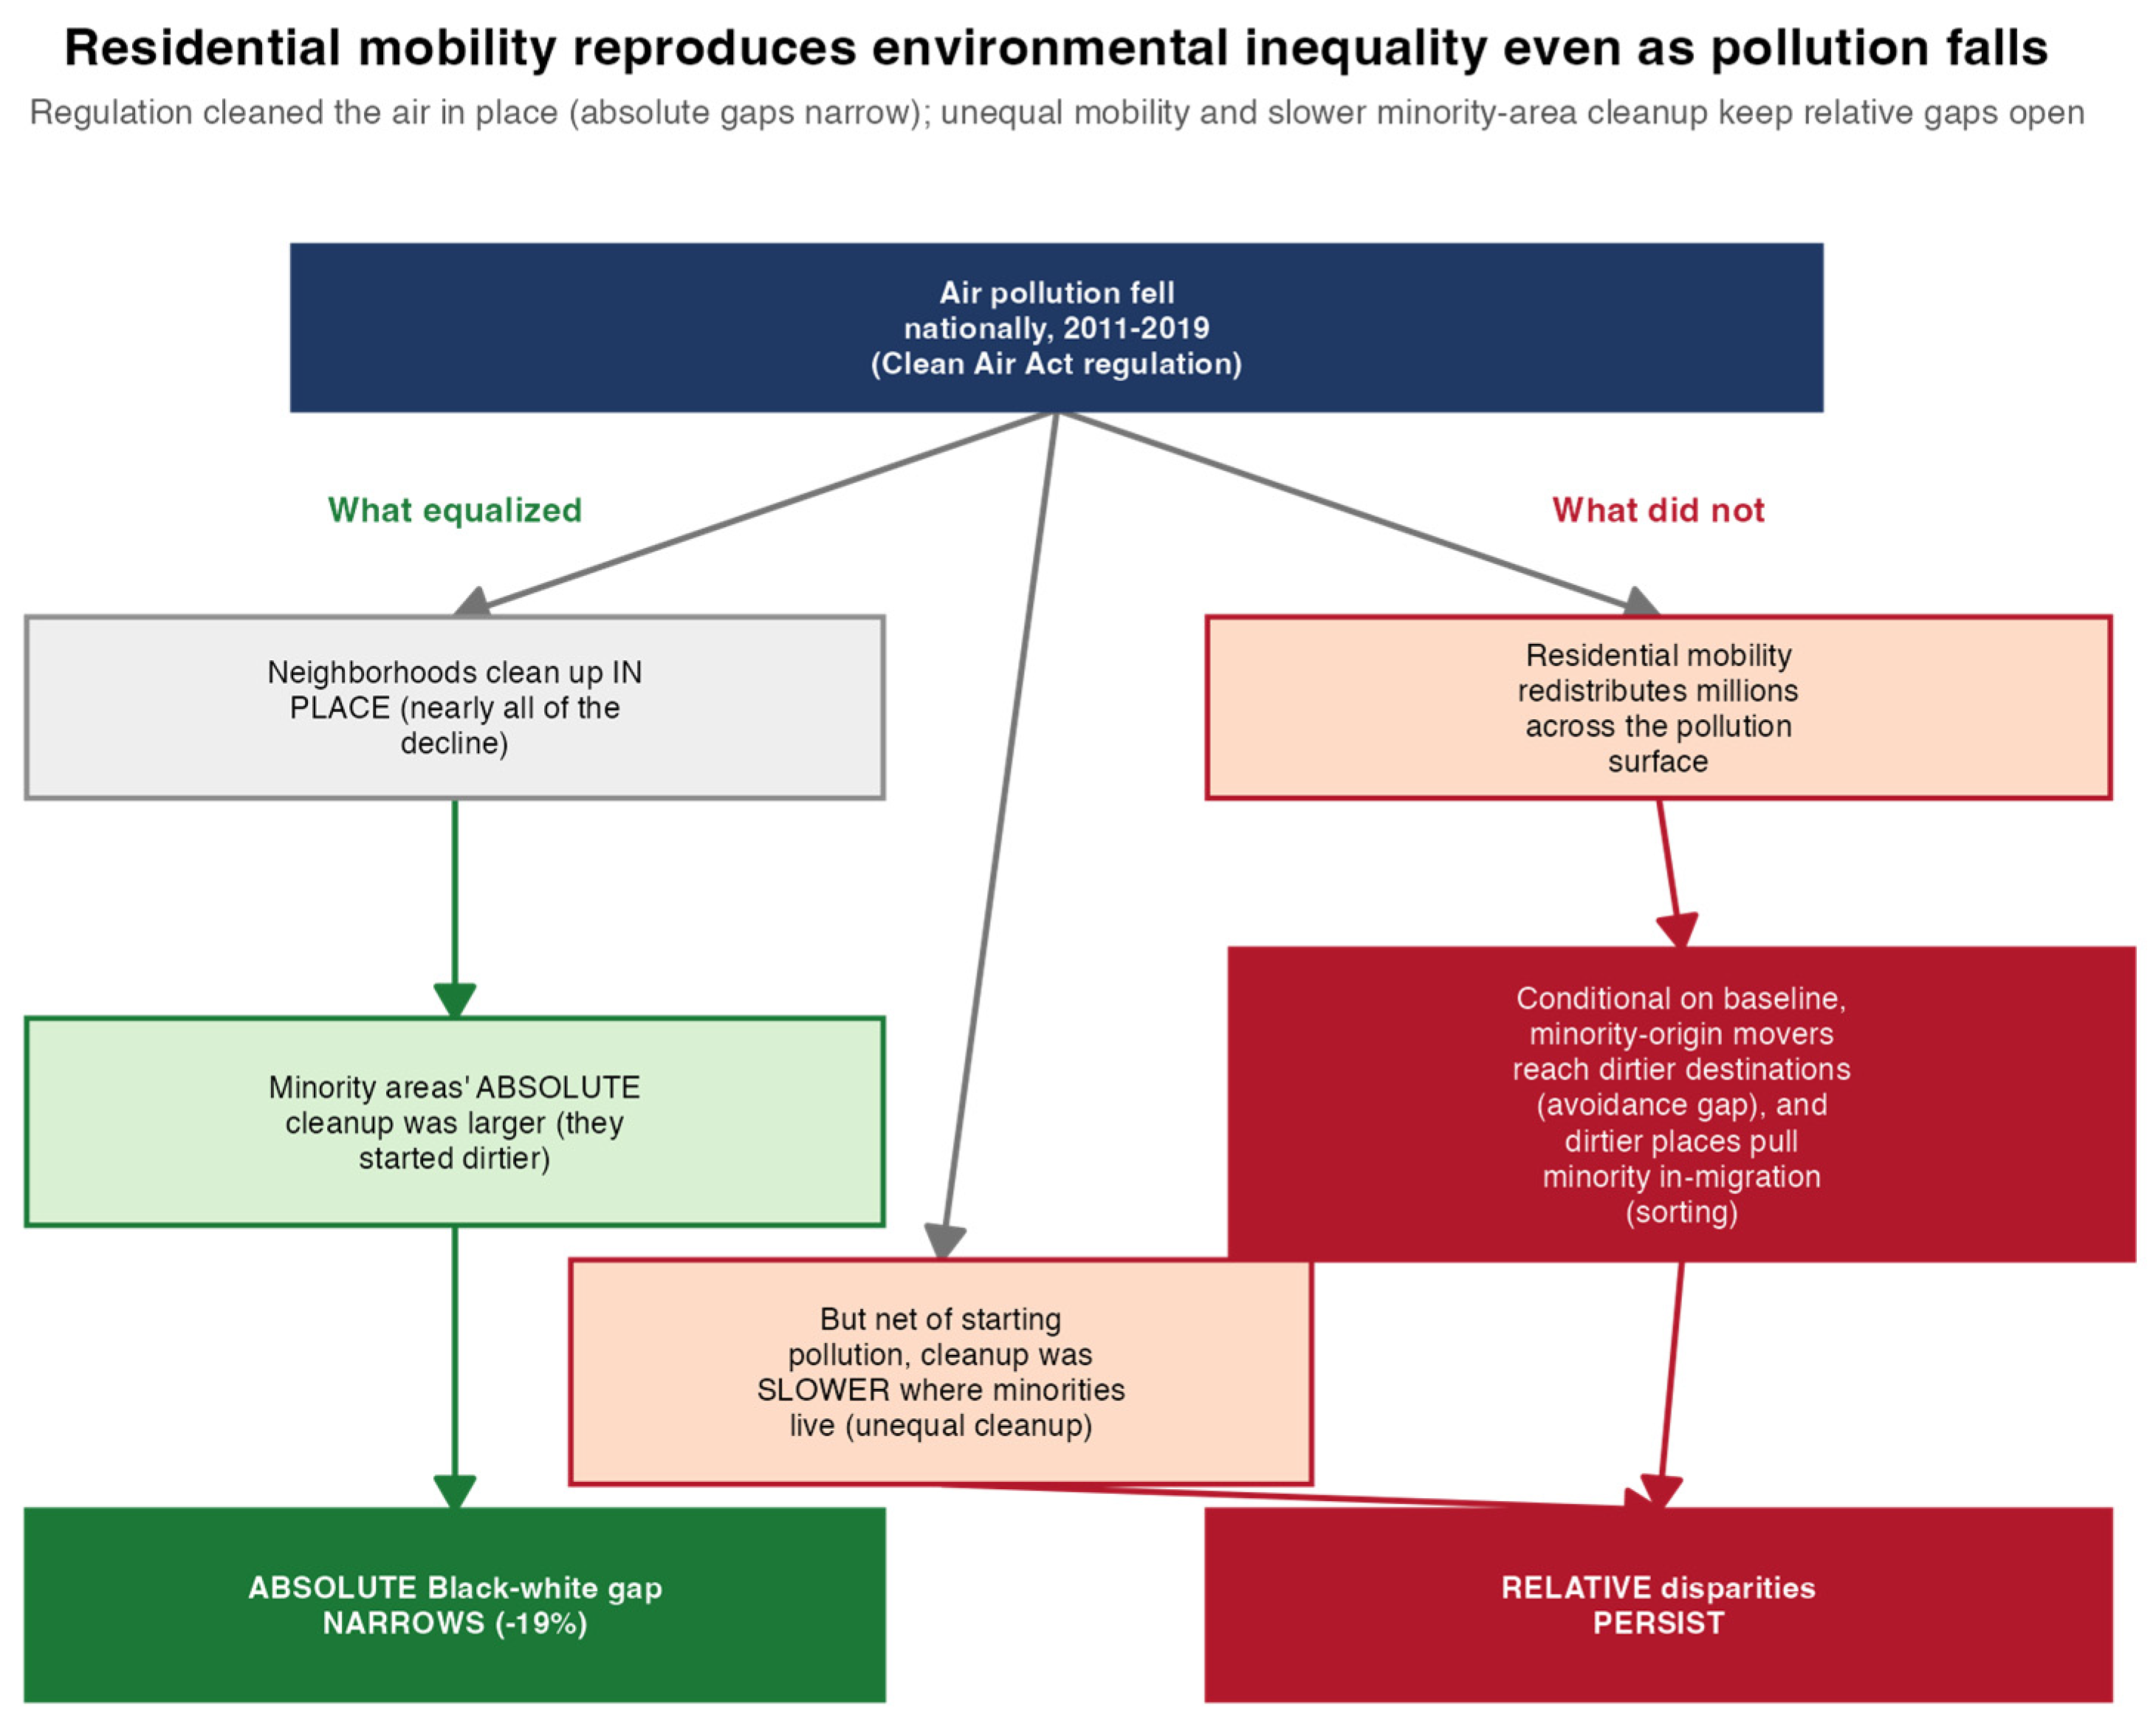
Ambient air pollution is a major environmental health risk in the United States, and its burden falls unequally: people of color and low-income Americans are exposed to systematically higher concentrations of pollution from nearly every emission source [1,2]. Although the absolute Black-white difference in PM2.5 exposure has narrowed [3], relative disparities have persisted [4,5,6,7]. This study examines why environmental inequality reproduces itself even as overall pollution concentrations have decreased (Figure 1). Mitigating air pollution equitably is a key objective of sustainability. This question bears directly on the social dimension of sustainability: the Sustainable Development Goals call for reducing deaths and illnesses from air pollution (target 3.9), improving urban air quality (target 11.6), and reducing inequality (Goal 10) [8], and a decline in average pollution that leaves relative disparities intact advances the first two aims while falling short of the third.
Figure 1.
Conceptual framework. Regulation cleaned the air in place, narrowing absolute racial and ethnic gaps (left), while unequal residential mobility and conditionally slower cleanup in minority neighborhoods, net of their dirtier starting points, kept relative gaps open (right).
A household’s exposure to pollution is not fixed. It changes when households move. Air quality capitalizes into housing values [9], and households reveal a willingness to pay for cleaner air when they relocate [10]. Cleaner neighborhoods have been shown to command higher prices and are rationed, at least in part, by their ability to pay [11,12]. For this reason, this paper frames environmental inequality in terms of environmental opportunity, which it defines as the ability to obtain cleaner environmental conditions through residential location.
Environmental opportunity is constrained by the set of neighborhoods that a household can both reach and afford. Moving is neither costless nor equally available: it carries financial, informational, and psychological costs, and can sever ties to employment, kin, schools, and community. Unequal environmental opportunity therefore reflects, in part, an unequal capacity to move. I distinguish three related concepts throughout the analysis. Attainable opportunity refers to the cleaner environmental conditions a household could potentially access by moving, which cannot be directly observed. Captured opportunity is the actual reduction in pollution exposure achieved through relocation, measured in the avoidance analysis. The opportunity set is the share of neighborhoods that are both clean and affordable to households at a given origin, providing a price-based proxy for attainable opportunity and measured in the opportunity-set analysis.
The classic account of environmental inequality is a debate about how this opportunity allocation arises, usually posed as the question of which came first, people or pollution [13,14]. Disparate siting places polluting activity where minority residents already live, whereas residential sorting results in those households being channeled into cheaper and dirtier neighborhoods after the fact [12,15]. This literature has largely treated the two explanations as competitors and has evaluated them within single metropolitan areas using net demographic change rather than observed moves [11,14]. Both processes, however, describe a single underlying phenomenon, namely an unequal distribution of environmental opportunity, and can operate simultaneously.
Research shows that households move away from pollution in settings ranging from China [16,17] to Europe [18] and the United States [19,20]. Pollution shocks also reshape the demographic composition and housing prices of nearby neighborhoods [12,21], producing patterns of residential sorting that can persist for a century [22]. Yet the potential for migration to reduce exposure must be understood against the long-run decline in internal migration within the United States [23,24]. More fundamentally, the broader neighborhood-attainment literature shows that residential mobility can reproduce racial and economic inequality because moves seldom carry households beyond the stratified structures in which they begin [25]. Whether residential mobility is similarly associated with the reproduction of inequality in environmental exposure has not been tested nationally.
Studying this pathway at a national scale has proven difficult. Prior work relies largely on net demographic change, a measure that conflates who arrives with who leaves and with change occurring in place. A second approach relates the population change of a single neighborhood to local pollution shocks, but the resulting coefficients are difficult to interpret, because every move is associated with an origin and a destination: a neighborhood’s population change reflects conditions at both ends of each flow and at all competing destinations, not just its own pollution [26]. Thus, this paper instead works directly with origin-to-destination flows, which permit an exposure-reallocation estimand: for the stream of households leaving each neighborhood, the flow-weighted difference between the pollution they moved to and the pollution they left. This makes the environmental consequence of moving observable at the origin, separates it cleanly from in-place pollution trends, and renders it comparable across neighborhood contexts and across pollutants. Similar measures have been computed for internal migration in other national settings [27], but not at national neighborhood scale, across multiple pollutants, or with an equity focus.
This paper accordingly links national block-group origin-destination flows to fine-resolution estimates of multiple pollutants, comprising PM2.5 [28] and its speciated components [29], NO2 [30], warm-season ozone [31], and wildfire smoke-specific PM2.5 [32], for the period 2011 to 2019, and addresses three questions:
- (1)
- How do sorting and unequal cleanup affect ambient pollution exposures at the national scale?
- (2)
- Is the sorting process equitable? That is, do flows leaving majority-Black and majority-Hispanic neighborhoods capture the same reduction in exposure as flows leaving majority-white neighborhoods that begin equally polluted?
- (3)
- Does any inequity reflect the affordability of the destinations reached, or does it reflect constraints that operate beyond price?
Taken together, these questions shift the focus from whether households move toward or away from pollution to why the mobility process produces systematically smaller exposure reductions for movers from otherwise comparable minority neighborhoods. The multi-pollutant analysis also provides a consistency check on the housing-market interpretation. This interpretation predicts a specific pattern across pollutants, and the absence of that pattern would weaken it. However, observing the pattern does not establish the housing-market mechanism, as other explanations related to the spatial distribution of pollution could produce similar results. Specifically, if unequal access to cleaner neighborhoods operates through the housing market, then urban infrastructure-related combustion pollutants such as NO2 and black carbon should exhibit the strongest inequity; wildfire smoke, which is spatially diffuse and only weakly capitalized into housing prices, should serve as contrast exposure; and ozone, a secondary pollutant, whose spatial pattern typically inverts that of primary pollutants [33], should display a reversal.
This is indeed the pattern the data reveal. Mobility altered aggregate exposure only slightly, but it reallocated exposure unequally: the disparity concentrates in combustion-related pollutants, disappears for wildfire smoke, reverses for ozone, and is little explained by the housing costs of the destinations reached. The findings withstand an extensive set of robustness checks, and the qualitative pattern appears at the individual level in census microdata.
2. Materials and Methods
2.1. Data
Annual block-group origin-destination migration flows for 2011 to 2019, covering approximately 217,000 origins per year, were obtained from the MIGRATE database [34]. These flows were linked to eight pollutant surfaces, each aggregated to coverage-weighted block-group annual means on 2019-vintage geographies: total PM2.5 and its speciated components, with paired uncertainty estimates, at approximately 1 km resolution in µg/m3 [29]; surface NO2 at approximately 1 km resolution in parts per billion [30]; warm-season maximum daily eight-hour average ozone in parts per billion [31]; and daily wildfire smoke PM2.5 on a 10 km grid, averaged to annual means in µg/m3 [32]. Because block-group boundaries do not align with the pollutant grids, each block-group value is an area-weighted mean: every grid cell intersecting the block group contributes in proportion to the share of its area that falls inside.
Neighborhood race and ethnicity were matched to each flow year. Income, poverty, education, and housing costs were drawn from the American Community Survey five-year series, and gentrification followed the standard two-stage transition definition [35,36,37,38]. This analysis pooled all nine flow years and verified the sensitivity of the results to endpoint choices (Table S1). Full details of exposure sources, extraction, and classification are provided in Section S1. Descriptive block-group maps and migration Sankey diagrams appear in Section S4.
2.2. Exposure Reallocation and the Conditional Avoidance Gap
For the stream of households leaving origin o in year t, with flows f(o→d, t) and pollutant concentrations P(·, t), the exposure reallocation is defined using Equation (1).
which is a contemporaneous destination-minus-origin difference, with negative values denoting movement toward cleaner air. The conditional avoidance gap βg is then estimated from Equation (2):
where s(·) is a natural spline with four degrees of freedom in origin pollution, which absorbs mean reversion because initially dirty places clean faster for mechanical reasons; X(o) contains log income, the poverty rate, and educational attainment; μ and δ denote CBSA and year fixed effects; observations are weighted by outflow; and standard errors are clustered on CBSA.
The unit of observation is the origin block-group-year, with each origin appearing up to nine times, once per flow year. Standard errors are clustered at the origin CBSA level, with each non-metropolitan county treated as a separate cluster (2228 clusters: 922 metropolitan and micropolitan statistical areas and 1306 non-metropolitan counties). This accounts for spatial correlation in pollution exposure, housing markets, and migration networks, as well as repeated observations of the same origin across years. Clustering also matches the geographic level at which the fixed effects and contrast of interest are defined. The alternative specification with county fixed effects and county-clustered standard errors produces narrower confidence intervals (Table S4).
Observations are weighted by the number of out-moves from each origin-year, so estimates represent the average move rather than the average origin; unweighted results are reported in Table S4. MIGRATE flows are model-based expected counts and may be fractional. Origin-destination pairs with zero expected flow and moves within the same block group are excluded, as are origin-years with no out-moves. Because R(o,t) is a flow-weighted mean, small flows contribute in proportion to their size and are not otherwise trimmed.
A positive value of βg indicates that origins in group g reached dirtier air than majority-white origins that began equally polluted. Because the MIGRATE flows are not disaggregated by the race or ethnicity of individual movers, this is an ecological estimand. This paper tests the robustness of this claim using individual-level analysis of census microdata described in Section S1.9. The assumed causal structure, including the confounding and selection paths addressed by the controls and robustness checks, is summarized in a directed acyclic graph (Figure S1).
2.3. Shift-Share Decomposition
To separate migration from change occurring in place, the exposure change of each group is decomposed exactly into a cleanup term, which holds the residential distribution fixed at its 2011 pattern, and a sorting term, which holds pollution fixed at its 2019 values:
In Equation (3), w(g,i,t) denotes the share of group g’s population living in block group i in year t, P(i,t) is the pollutant concentration in that block group and year, the subscripts 0 and 1 denote 2011 and 2019 respectively, and μ(g, t) = Σ w(g, i, t) P(i, t) is the population-weighted mean exposure of the group. The first summation is the in-place cleanup term and the second is the sorting term, and the two sum exactly to Δμ(g). Full term-by-term definitions are provided in Section S1.
2.4. Additional Analyses
Two further mechanisms were estimated for each pollutant. Destination sorting was assessed by regressing the pollutant concentration of each destination on the minority share of its in-migrant stream, depicted in Equation (4).
P(d, t) = α + λ m(d, t) + μ(c) + δ(t) + ε(d, t)
Here m(d, t) is the flow-weighted share of arriving movers whose origins were majority-Black or majority-Hispanic, μ(c) and δ(t) are destination-county and year fixed effects, observations are weighted by in-flow, and errors are clustered on destination county. A positive value of λ implies that destinations drawing more minority in-migration were themselves more polluted.
Unequal cleanup was assessed by regressing the 2011 to 2019 change in each block group’s pollutant concentration on its baseline minority composition, displayed in Equation (5).
where bB(i) and bH(i) are the Black and Hispanic population shares of block group i in 2011, s(.) is a natural spline with four degrees of freedom in baseline pollution that absorbs mean reversion, μ(c) denotes county fixed effects, observations are weighted by baseline population, and errors are clustered at the county level. Positive values of φB and φH mean that pollution declined more slowly where minority shares were higher, conditional on the same starting level.
ΔP(i) = α + φB bB(i) + φH bH(i) + s(P(i, 0)) + μ(c) + ε(i)
The role of affordability was assessed using a Gelbach decomposition (Section S1.6), which quantifies the share of βg accounted for when destination home value and gross rent enter Equation (2). Both models are estimated on the common sample of origin-years for which home value and rent are observed, and the total change in the coefficient is apportioned to each covariate through the omitted-variable identity, so that the resulting shares are order-invariant and sum exactly to the total. Because destination housing cost is a quantity chosen after the move, this exercise is descriptive rather than a causal mediation analysis.
Selection into moving was probed with the following additional specifications: (1) moves occurring within the same CBSA, (2) short distance moves of 50 km or less, and (3) models that control directly for move distance. Flows were also reweighted by inverse PM2.5 uncertainty as a sensitivity check; this is not a formal measurement-error correction because the uncertainty product is not an ordinary independent sampling error. The environmental opportunity set is defined as the share of all neighborhoods in a metropolitan area that are simultaneously clean (below the metropolitan median PM2.5 concentration) and affordable to the origin (median home value no greater than three times the origin median household income, a simple affordability proxy). Segregation is measured by the metropolitan Black-white dissimilarity index [39]. I conducted two additional analyses. First, I estimated the conditional gap within four move-distance bands (0–10, 10–50, 50–200, and >200 km). Second, I classified origins and destinations by their position within the metropolitan area (urban core, inner suburb, or periphery; Section S1.13) and re-estimated Equation (2) within each origin-destination type.
The individual-level analysis evaluated the same contrast using American Community Survey microdata for 2012 to 2019 at the level of migration PUMAs (MIGPUMAs, the Census units of at least 100,000 residents in which public-use ACS microdata report each respondent’s residence one year earlier), conditioning on a spline in origin PM2.5 and on year fixed effects. This analysis is a coarser test of the same qualitative contrast rather than a re-estimation of Equation (2), whose block-group covariates and metropolitan fixed effects have no counterpart in the microdata.
Statistical significance was assessed using two-sided tests at the 5% level with cluster-robust standard errors, clustered on CBSA for the avoidance models, on county for the sorting and cleanup models, and on destination migration PUMA for the microdata analysis. I report coefficients, standard errors, and exact p-values.
The primary analysis consists of three prespecified components: the shift-share decomposition (Section 3.2), the conditional PM2.5 avoidance gap across origin groups (Section 3.3), and the Gelbach decomposition of the contribution of affordability to that gap (Section 3.5). Secondary analyses examine cross-pollutant mechanisms (Section 3.4), selection and urban form (Section 3.5), the opportunity set and segregation gradient (Section 3.6), and household microdata (Section 3.7) to clarify the mechanisms underlying the primary findings and assess their robustness. The nonattainment analysis (Section S1.11) and alternative opportunity-set specifications are exploratory and do not form the basis of the main conclusions.
3. Results
3.1. Absolute Gaps Narrowed While Relative Gaps Persisted
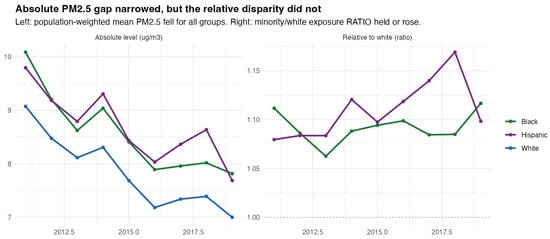
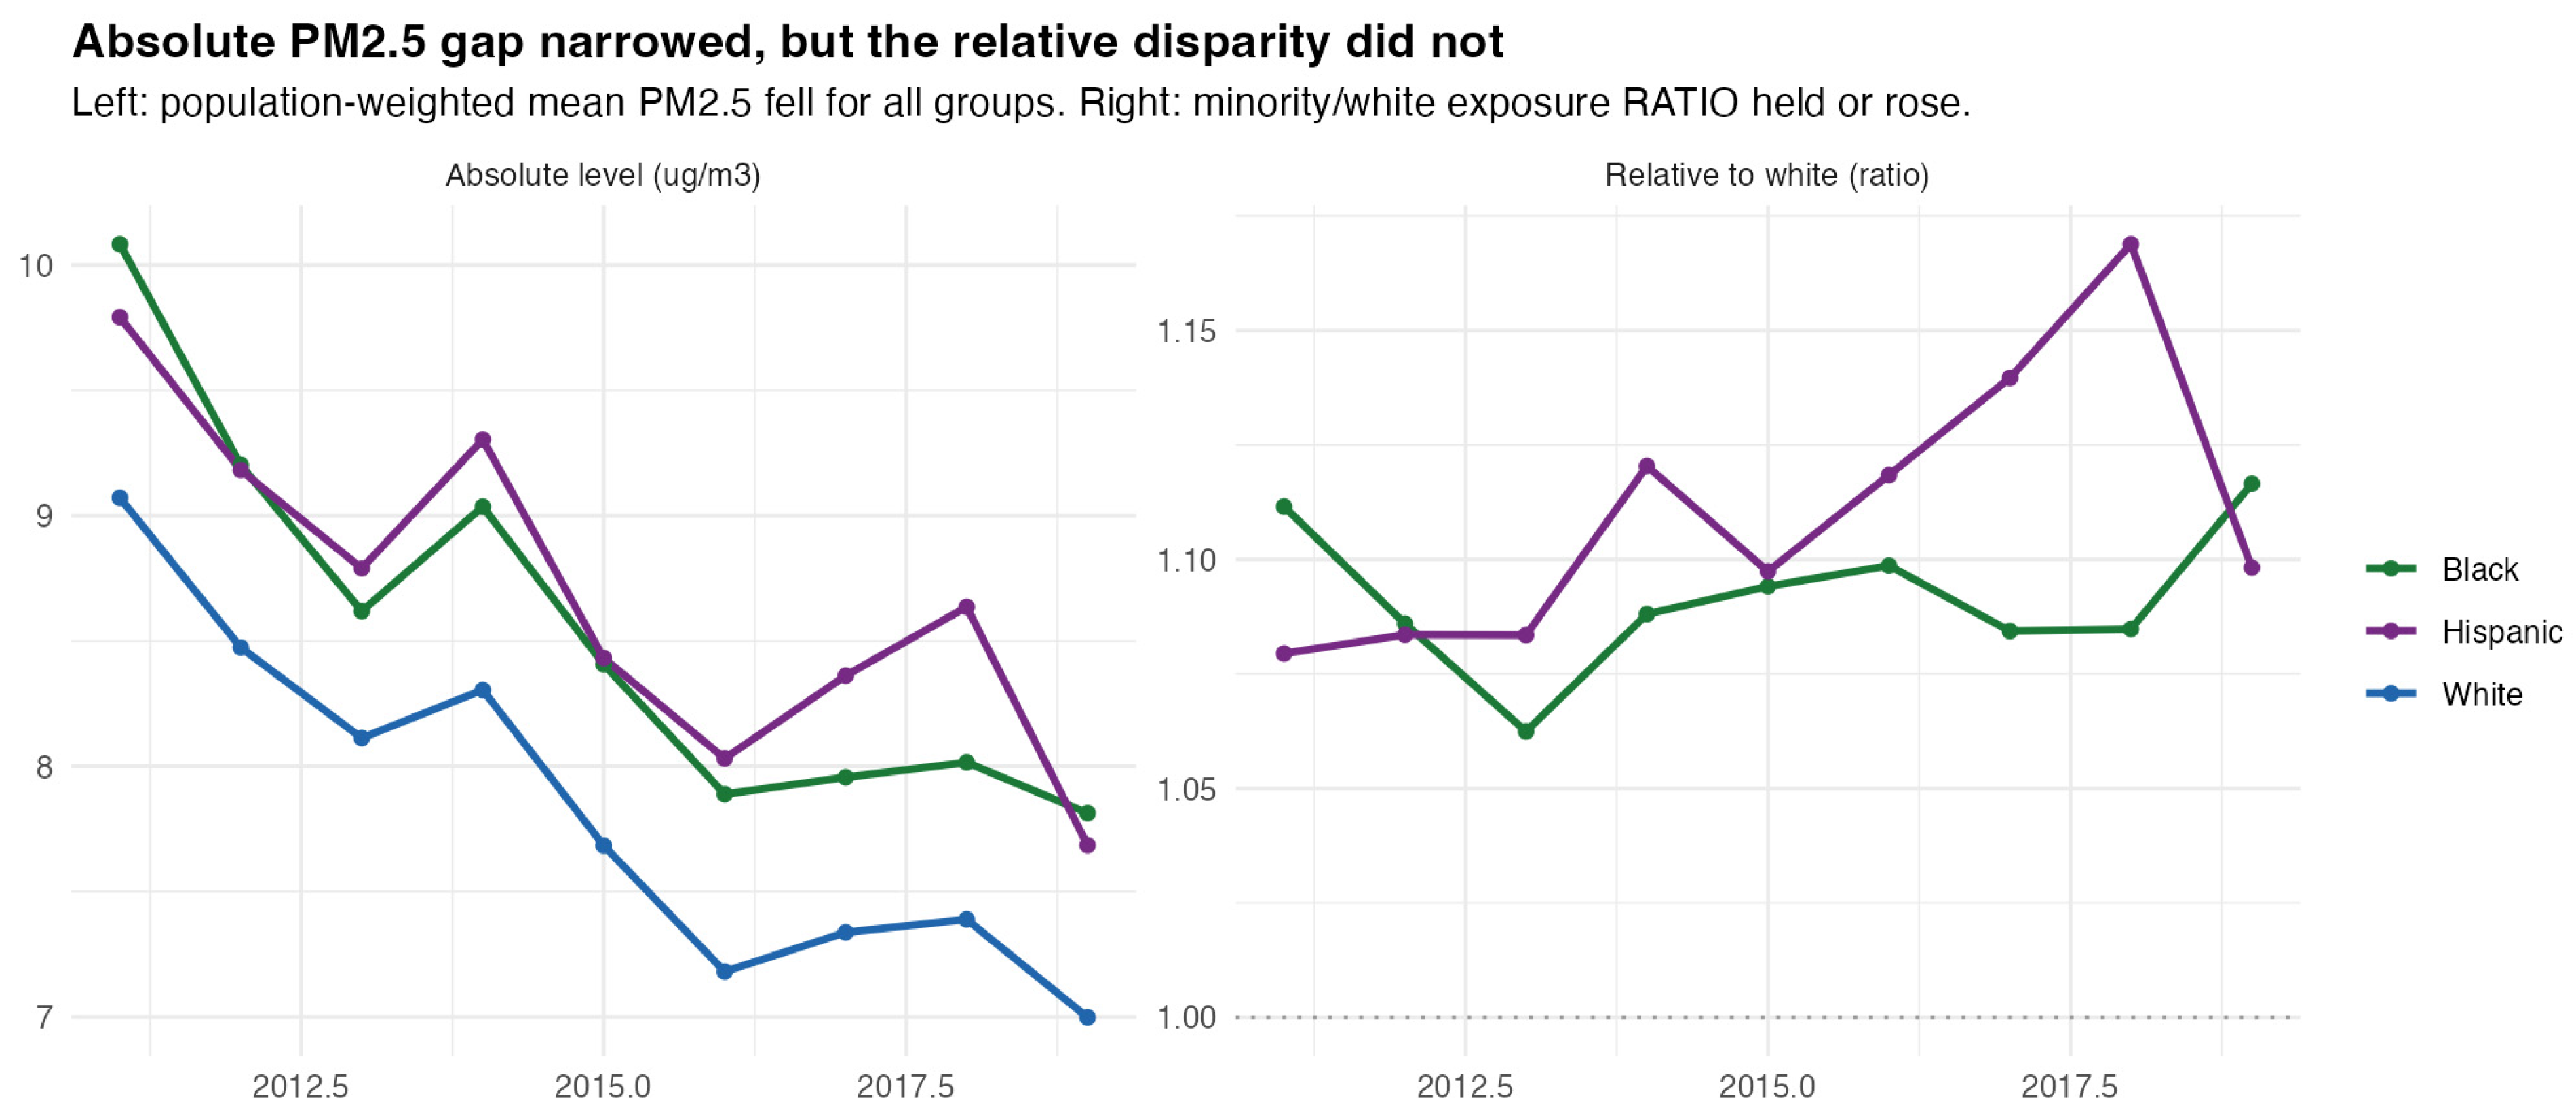
Population-weighted mean PM2.5 fell for every group between 2011 and 2019 (Figure 2). Exposure in Black-majority neighborhoods decreased from 10.1 to 7.8 µg/m3, in Hispanic-majority neighborhoods from 9.8 to 7.7 µg/m3, and in white-majority neighborhoods from 9.1 to 7.0 µg/m3. The absolute Black-white gap narrowed by 19 percent, but the relative gap did not: exposure in Black-majority neighborhoods stood 11.2 percent above the white-majority level in 2011 and 11.7 percent above it in 2019, while the Hispanic-white excess rose from 7.9 to 9.8 percent (Table S2).
Figure 2.
Absolute PM2.5 gaps narrowed while relative disparities did not, 2011 to 2019.
The persistence of relative disparity was not specific to PM2.5. For NO2, a marker of traffic-related pollution, relative gaps were larger still and similarly persistent. Exposure in Black-majority neighborhoods exceeded that in white-majority neighborhoods by roughly 29 percent in 2011 and 25 percent in 2019, and exposure in Hispanic-majority neighborhoods exceeded it by 48 and 34 percent, respectively. Ozone, which is elevated in whiter exurban areas, showed near-parity or a slight reversal (Figure S2).
3.2. Decomposing Exposure Change into Cleanup and Redistribution
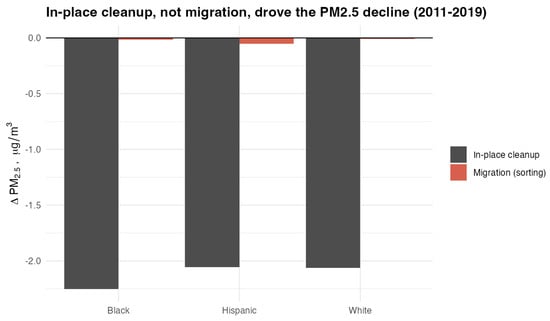
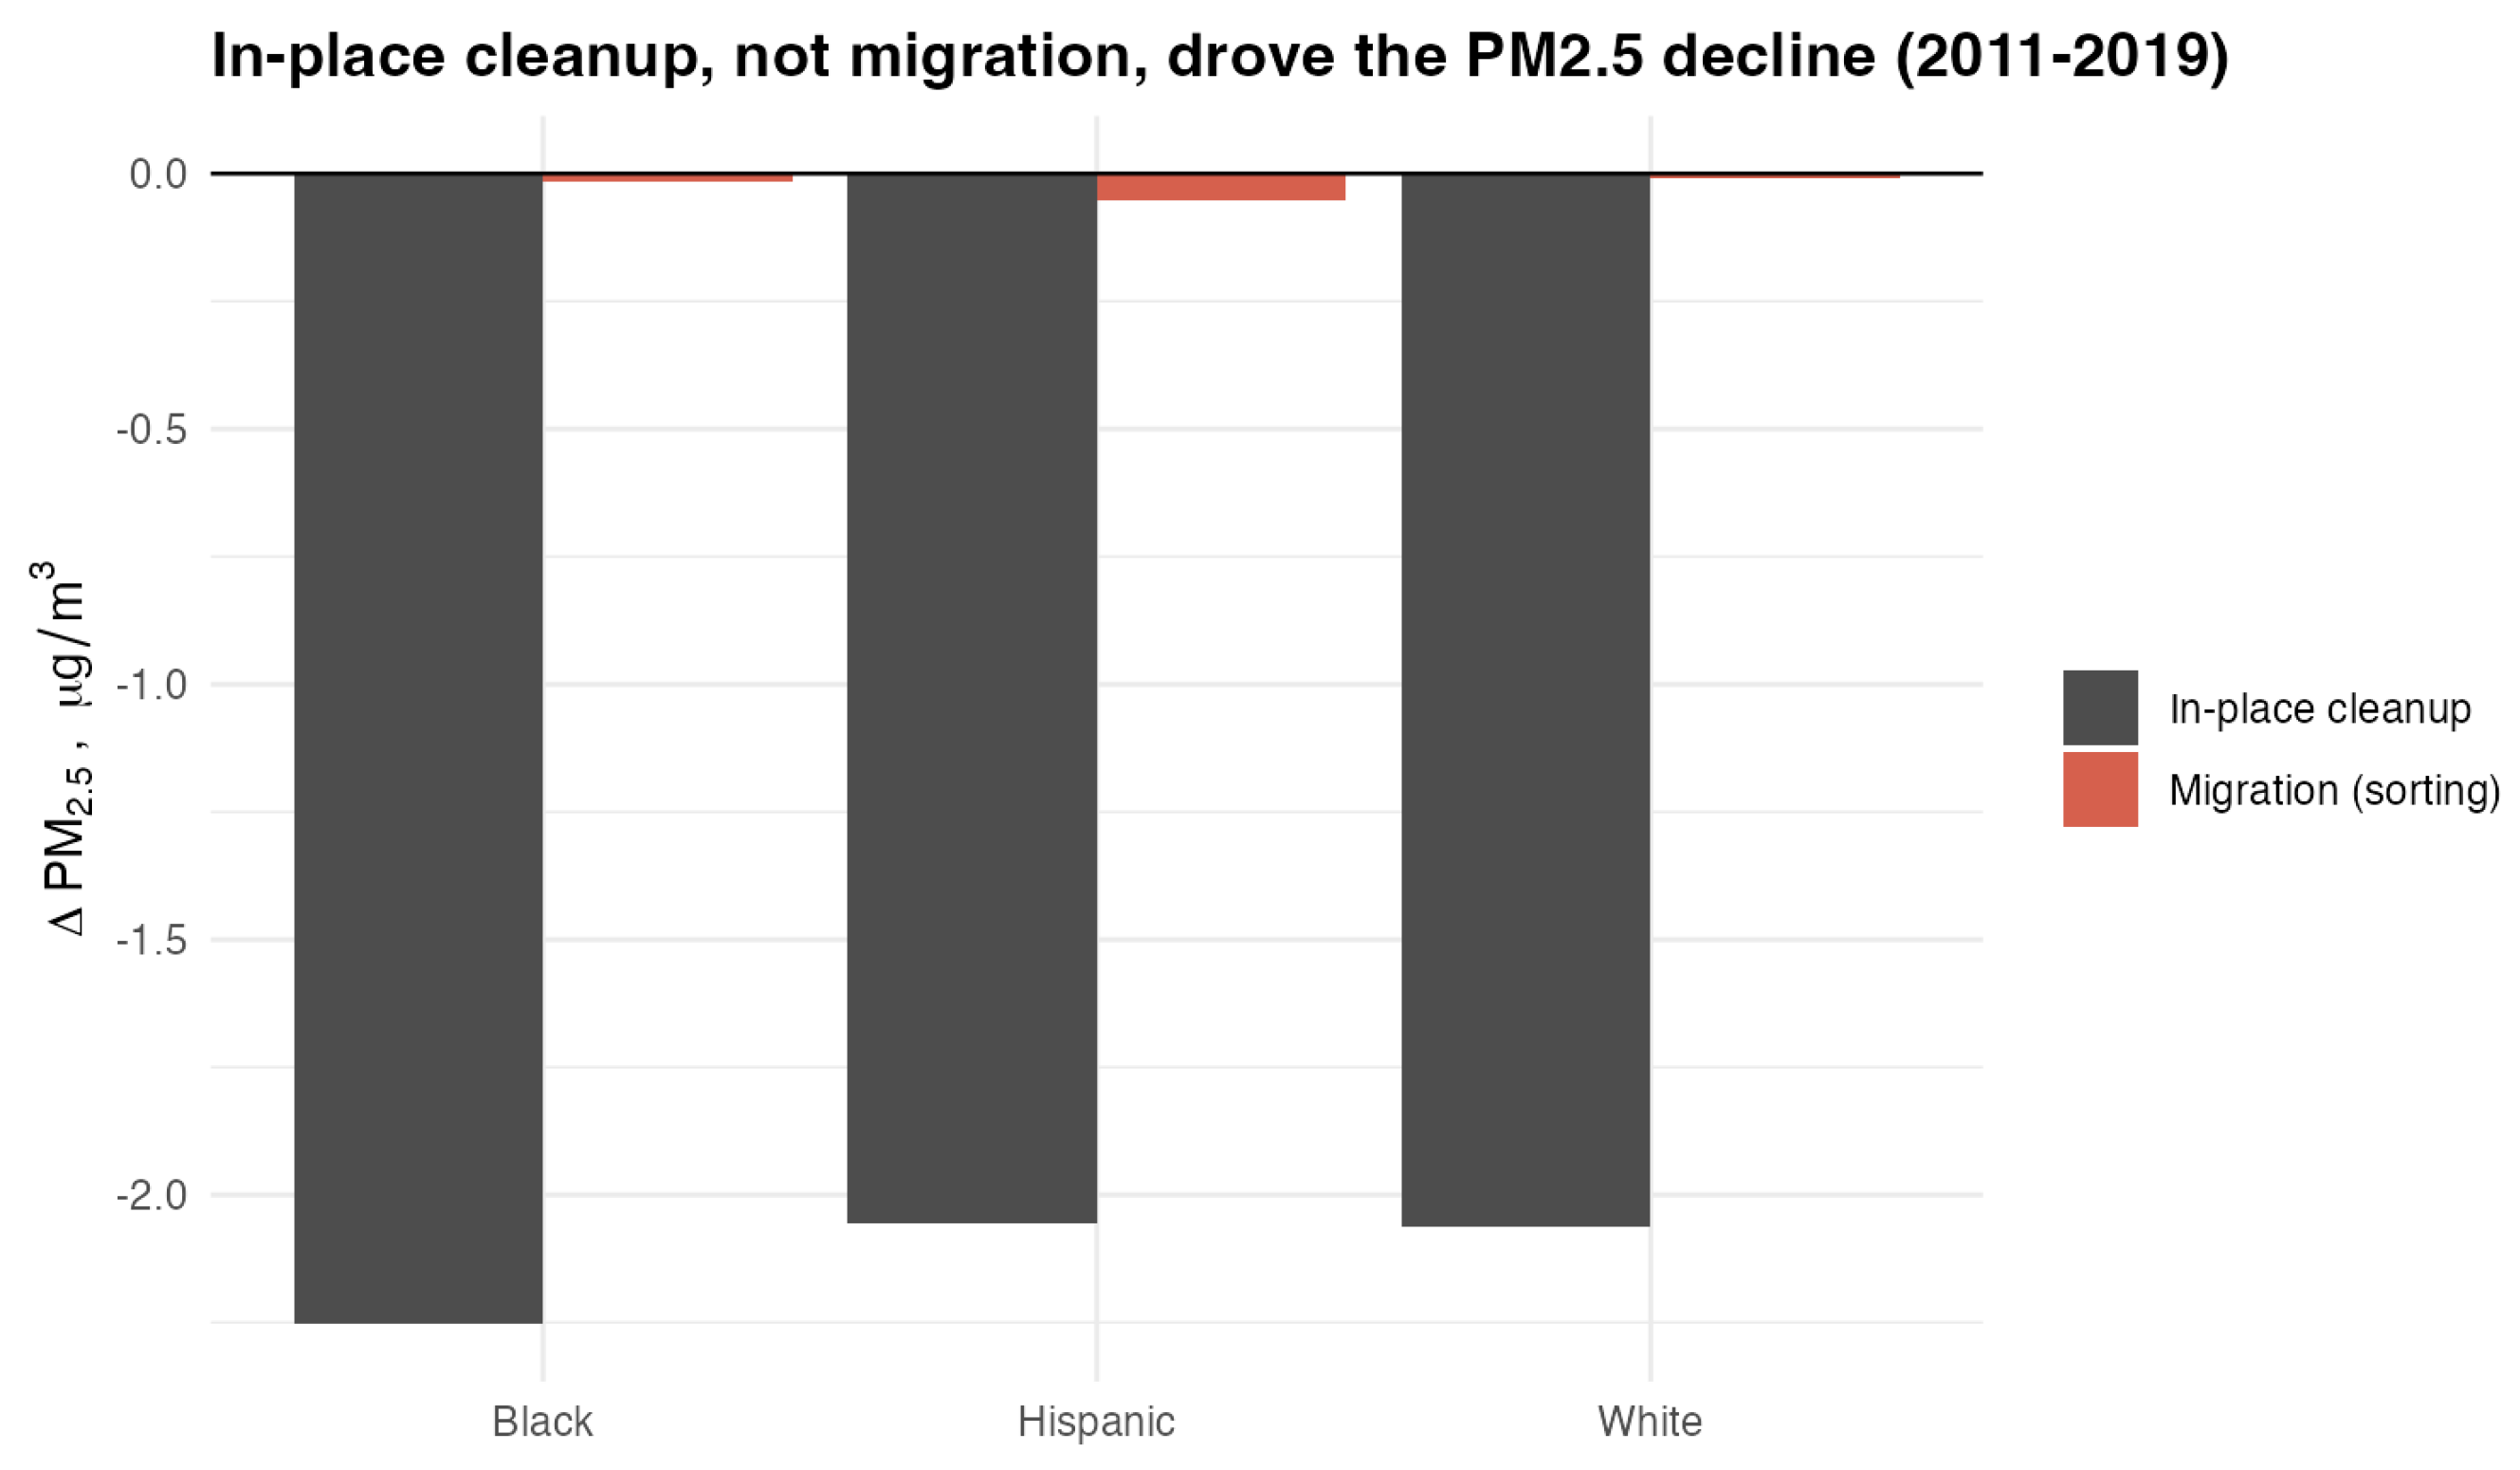
The shift-share decomposition is an accounting identity that splits the exposure change of each group into the portion arising from pollution falling where the group already lived, termed in-place cleanup, and the portion arising from the group redistributing across neighborhoods, termed sorting (Methods, Equation (3)). The decomposition shows that the decline was almost entirely attributable to change in place (Figure 3): cleanup accounted for essentially all of the 2.1 to 2.3 µg/m3 fall in each group’s exposure and for 0.190 of the 0.196 µg/m3 narrowing in the Black-white gap, while the redistribution term contributed only a few hundredths (Table S3). The same pattern held for NO2 and ozone, where cleanup again dominated the change in each group’s exposure, and the redistribution term remained small (Figure S3).
Figure 3.
Shift-share decomposition of the 2011 to 2019 change in each group’s mean PM2.5 into in-place cleanup and population redistribution.
This result might seem to imply that population redistribution was unimportant, but that would be mistaken, because the decomposition and the conditional model answer different questions. The decomposition asks how much redistribution shifted the average exposure of a group. It does not ask whether the households who moved fared equally well. Because some moves led to cleaner air and others to dirtier air, these opposing changes largely cancel when averaged over a group, leaving a small net term even when the gains from moving are distributed unequally among movers. The conditional avoidance gap estimated in the next section addresses that second question directly, by comparing movers who left equally polluted neighborhoods. A near-zero net contribution to group average exposure is therefore fully compatible with substantial inequity in which households reach cleaner destinations.
3.3. The Conditional Avoidance Gap
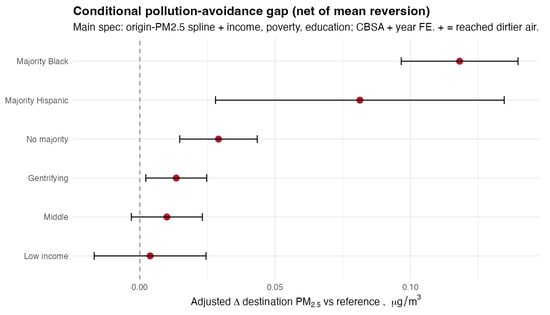
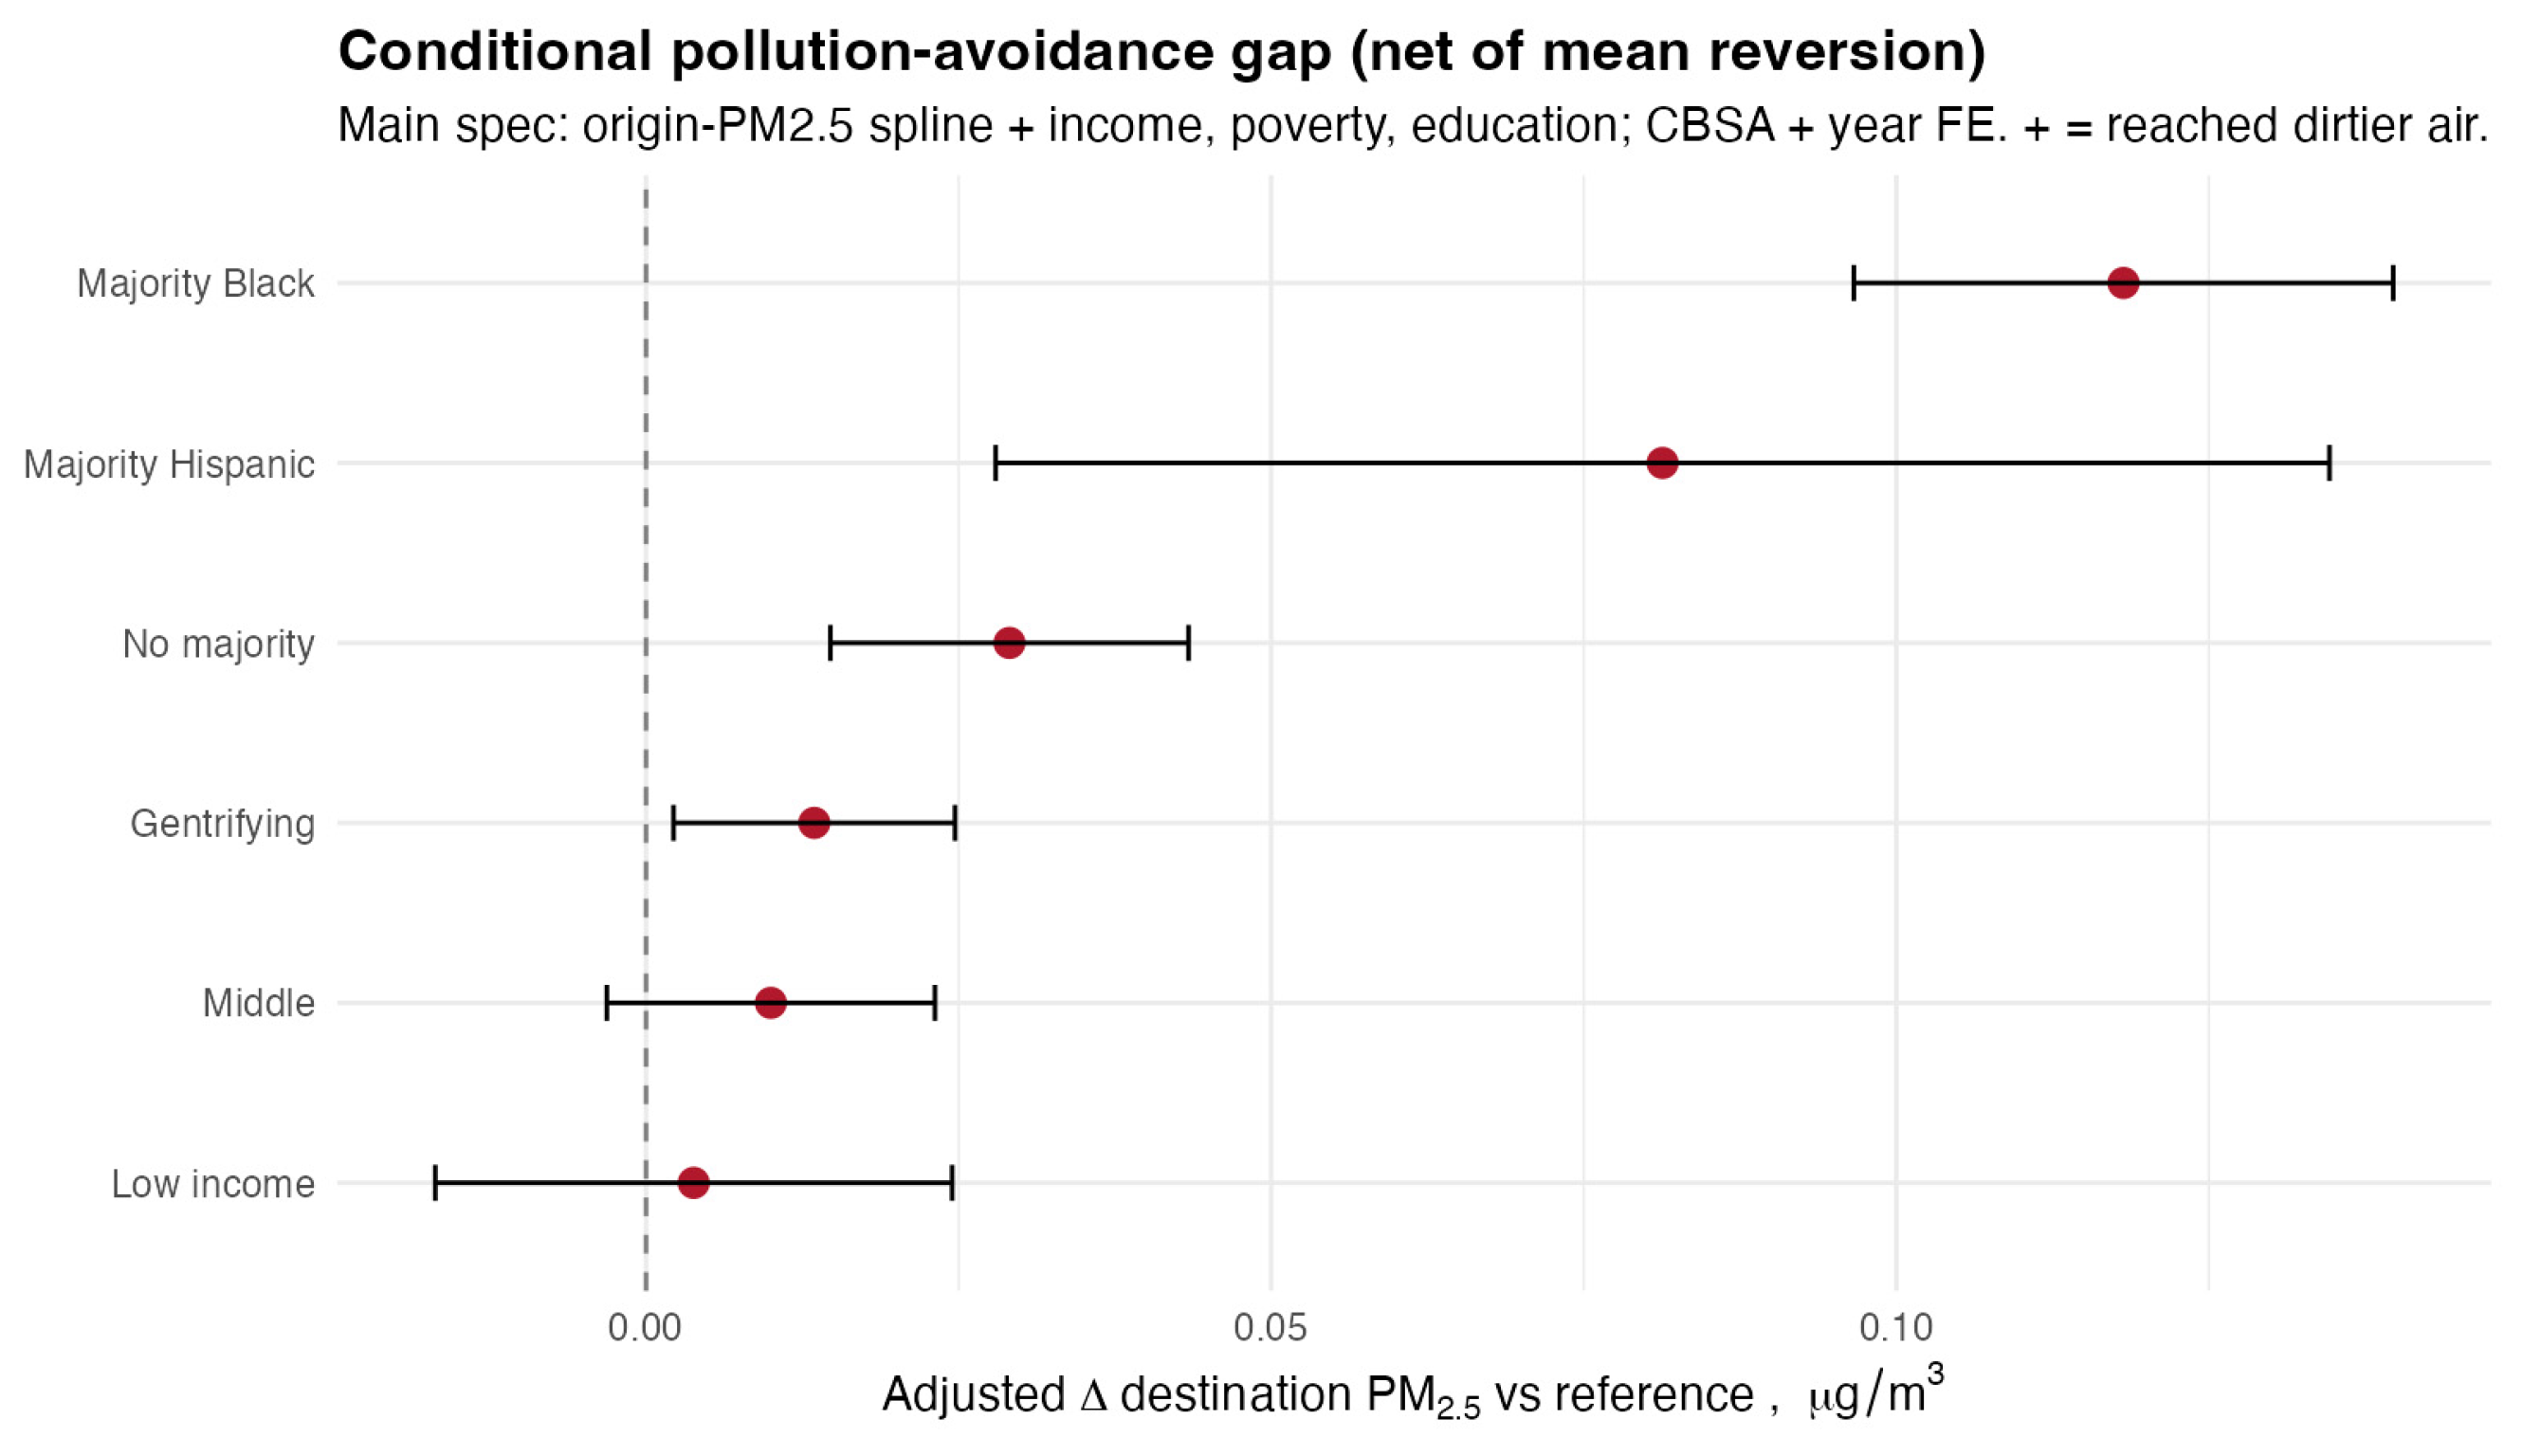
Raw avoidance was largest for origins that began dirtiest, which is the signature of mean reversion. Initially dirty places record larger declines simply because they started at an extreme, regardless of who lives there (Figure S4). Because minority neighborhoods were more polluted to begin with, their out-migrant streams appeared to gain more clean air than others. Conditioning on origin pollution through the spline, together with controls for origin income, poverty, and educational attainment, and with metropolitan and year fixed effects, accounts for differences in origin conditions, and the adjusted estimates show the opposite pattern: a consistent gap (Figure 4).
Figure 4.
Conditional pollution-avoidance gap in the main CBSA specification, net of an origin-PM2.5 spline and controls for origin income, poverty, and education.
In the main metropolitan-fixed-effects specification, movers from majority-Black origins reached PM2.5 destinations 0.118 µg/m3 dirtier than comparable movers from majority-white origins (95% CI: 0.097, 0.140). The corresponding gap was 0.081 µg/m3 for majority-Hispanic origins (95% CI: 0.028, 0.135) and 0.029 µg/m3 for no-majority origins (95% CI: 0.015, 0.043). Income terciles did not differ appreciably, and origins classified as gentrifying showed only a small gap of 0.013 µg/m3 (95% CI: 0.002, 0.025) that did not persist under county or national fixed effects (Table S4). This estimate for majority-Black origins, referred to henceforth as the Black gap, was robust to county and national fixed effects (Table S4, Figure S5) and to alternative thresholds for classifying neighborhood racial composition (Table S5). Table 1 reports these estimates under each fixed-effect specification and without flow weights.
Table 1.
Conditional PM2.5 avoidance gap by origin neighborhood type (µg/m3): additional destination PM2.5 reached by movers from each origin type relative to comparable movers from majority-white origins (Equation (2)), net of an origin-PM2.5 spline and origin income, poverty and education, under metropolitan (main), county and national fixed effects, and for the main specification without flow weights. Standard errors are clustered on the metropolitan area in the metropolitan specification and on county in the county and year-only specifications. Income-tercile and gentrification contrasts are in Table S4.
To contextualize this magnitude, 0.118 µg/m3 represents about 1.5 percent of mean exposure, but it is more than double the average exposure reduction achieved by movers overall, which is approximately 0.05 µg/m3, and roughly one-seventh of the entire 2019 Black-white exposure gap of 0.82 µg/m3 (Table S6, Figure S6). Adding the controls one at a time traces the evolution of the estimate: it is negative when no controls are included, reflecting mean reversion, becomes positive once origin pollution is netted out, remains stable as the socioeconomic controls enter, and is largest within metropolitan areas (Figure S7).
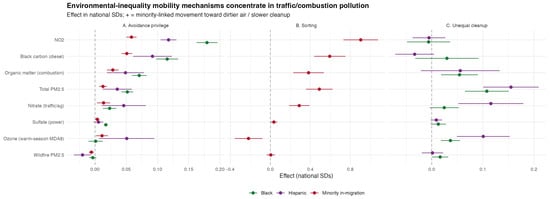
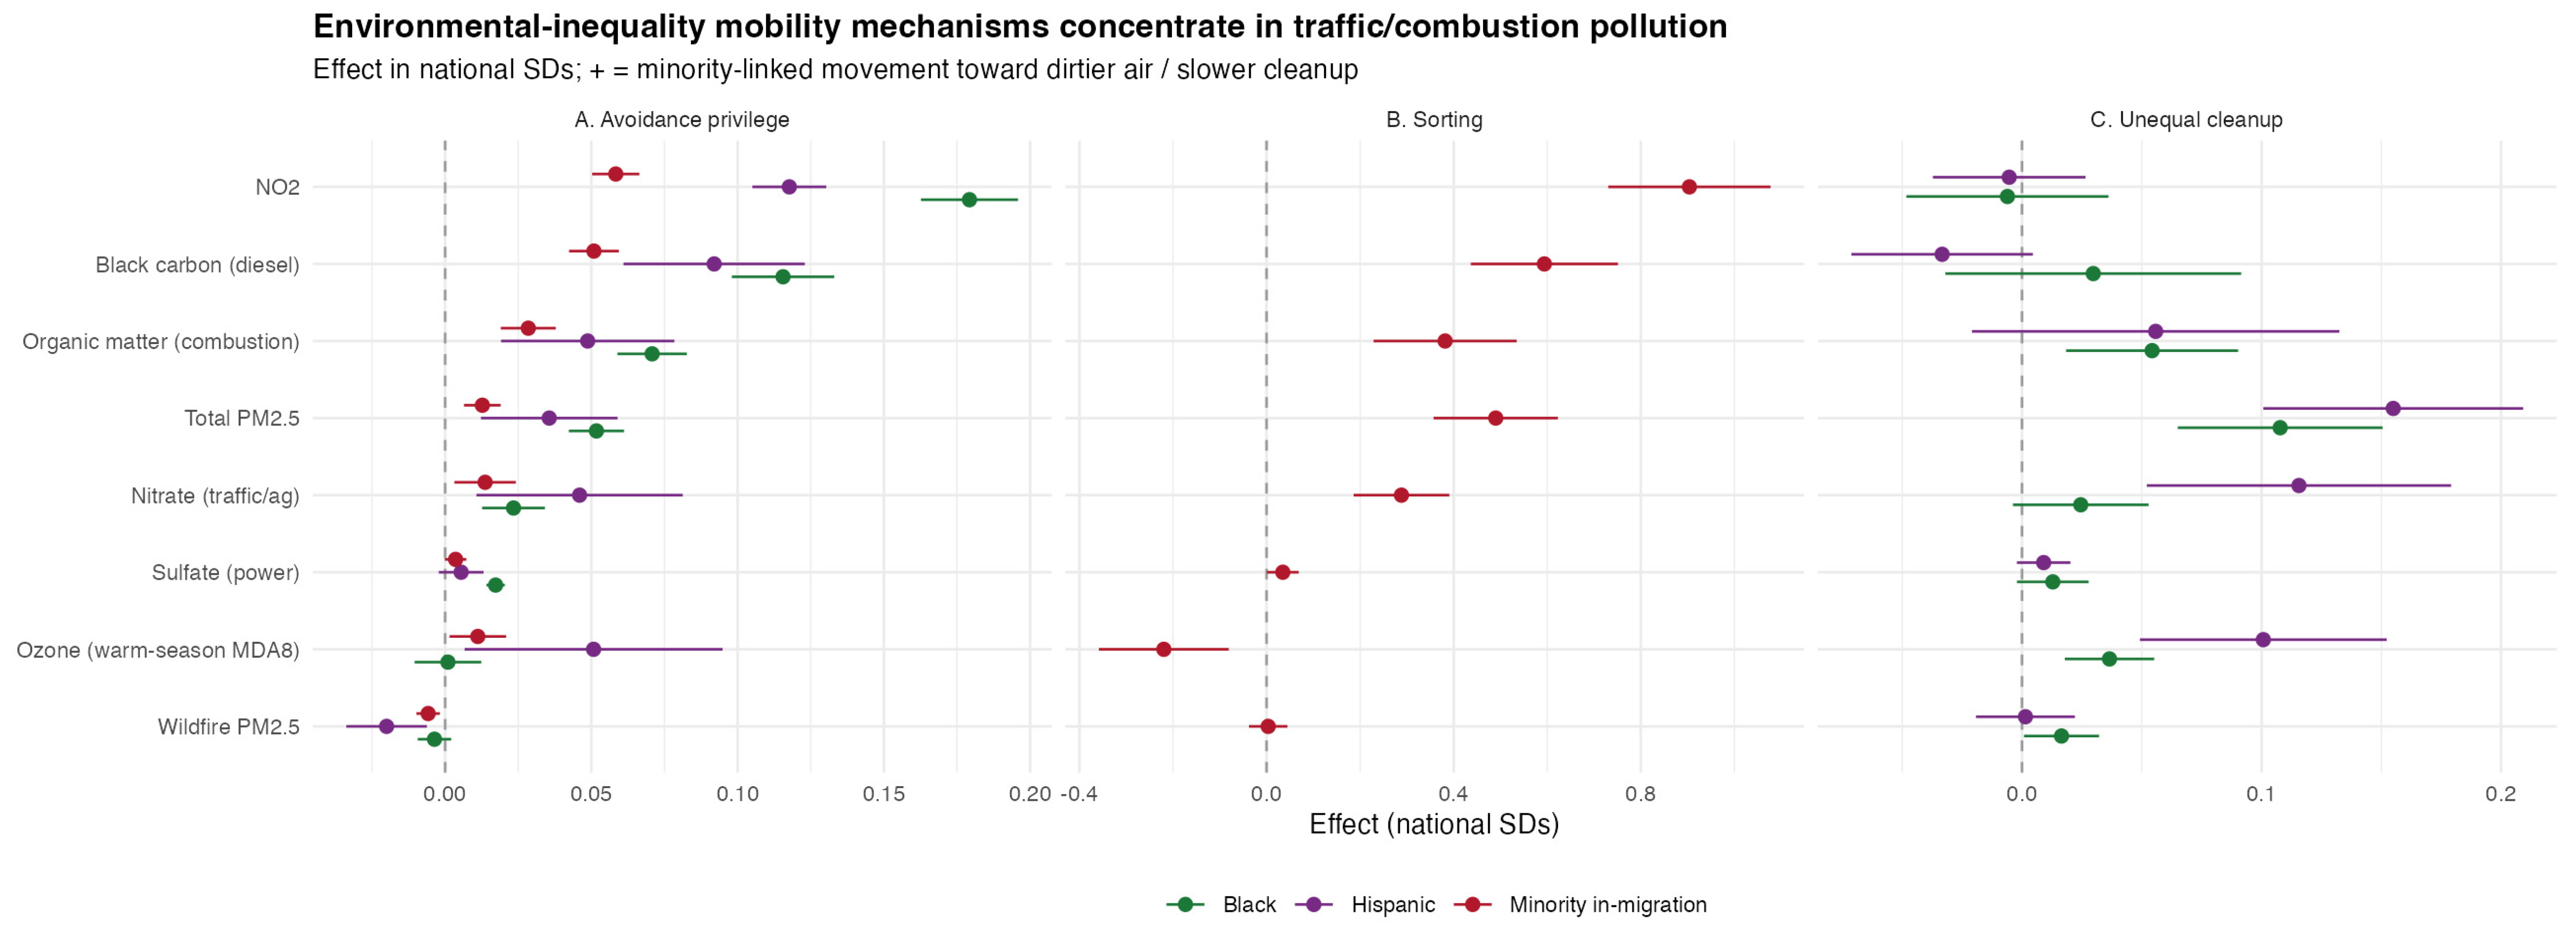
To summarize, among origins with similar pollution and socioeconomic characteristics, movers from white-majority origins achieved larger exposure reductions, and raw comparisons concealed this difference. The gap was not unique to PM2.5. Estimating the same model for each of the other seven pollutants produced the largest gap for NO2, at 1.075 ppb for Black-majority origins (95% CI: 0.975, 1.174), together with significant gaps for the combustion-related components (Figure 5).
Figure 5.
The three mechanisms across pollutants, expressed in national standard-deviation units. Panel (A), avoidance gap; panel (B), destination sorting; panel (C), unequal cleanup, or pollution persistence. The two mobility mechanisms in panels (A,B) concentrate in traffic and combustion pollution, vanish for wildfire smoke, and reverse for ozone.
3.4. Mechanisms Across Eight Pollutants (Secondary Analyses)
Three mechanisms can be estimated for each pollutant. The first is the conditional avoidance gap defined in Equation (2), which compares the destinations reached by movers leaving equally polluted origins. The second is destination sorting (Equation (4)), which asks whether neighborhoods receiving a larger minority share of in-migrants are themselves more polluted. The third is unequal cleanup (Equation (5)), which asks whether neighborhoods with higher baseline minority shares improved more slowly from the same starting level.
Estimating all three across the eight pollutants shows that the inequity concerns mainly pollution tied to combustion sources such as roads, ports, rail yards, diesel corridors, and industry (Figure 5). Effects are expressed in national standard deviations (SD) of each pollutant so that pollutants measured in different units can be compared directly. The sorting coefficient gives the change in destination pollution as the minority share of a destination’s in-migrant stream rises from zero to one. Full estimates appear in Table S7, sorting by destination quintile in Table S8, and robustness of the unequal-cleanup estimate in Table S9 and Figure S8.
Both mobility mechanisms were strongest for NO2, a traffic marker, with a Black gap of 0.179 standard deviations and a sorting coefficient of 0.904 standard deviations. Both were also significant for the other combustion-linked pollutants, namely black carbon, which is dominated in cities by traffic and diesel emissions; organic matter, which arises from vehicle exhaust, residential wood burning, cooking, and secondary formation; total PM2.5; and nitrate, which forms from traffic and power-plant nitrogen oxides. Across these four pollutants, Black gaps ranged from 0.023 to 0.116 standard deviations and sorting coefficients from 0.288 to 0.594 standard deviations, all with p < 0.001 (Table S7). Because 44 percent of block groups, home to 36 percent of the population, are smaller than a single 1 km grid cell, near-road gradients are smoothed within cells; the NO2 contrasts reported here are therefore, if anything, attenuated (Table S27; see Section 4).
Both mobility mechanisms disappeared for wildfire smoke, where the Black gap was −0.004 standard deviations (p = 0.21) and the sorting coefficient was 0.003 standard deviations (p = 0.87); the Hispanic wildfire gap was statistically distinguishable from zero but negligible in size (−0.008 µg/m3, Table S7). Sorting reversed for ozone, with a Black gap of 0.001 standard deviations (p = 0.87) and a sorting coefficient of −0.220 standard deviations (p = 0.002), indicating that destinations receiving more minority in-migration had lower ozone, consistent with ozone being higher in whiter exurban areas. The combustion pollutants were correlated with one another because they have common sources, with a correlation of 0.80 between PM2.5 and organic matter, 0.64 between black carbon and NO2, and 0.72 between black carbon and organic matter, whereas wildfire smoke was nearly uncorrelated with all of them, at 0.13 with PM2.5 and −0.09 with NO2 (Table S10).
The unequal-cleanup result is conditional and is consistent with Figure 3. The absolute decreases recorded in minority neighborhoods were larger because those neighborhoods started dirtier, but among neighborhoods that began equally polluted, those with higher minority shares cleaned up more slowly. This is the same inversion between raw and conditional comparisons that characterizes the avoidance gap.
Wildfire smoke is episodic and driven by regional fire activity rather than by local sources, and although research has shown smoke episodes can move rents and prices transiently [40], within the time frame of this study, smoke was unlikely to have created the stable neighborhood-level price gradients through which persistent local pollutants are capitalized [9]. Households are therefore unlikely to be able to sort on it durably. The results were in line with this hypothesis (Figure 5, Table S7).
3.5. Affordability, Selection, Distance, and Urban Form (Secondary Analyses)
If movers from minority origins had simply been reaching cheaper and therefore dirtier neighborhoods, controlling for the housing values of the destinations they reached would have absorbed the gap. However, the estimate changed very little. A Gelbach decomposition attributed 0.56 percent of the Black PM2.5 avoidance gap to destination housing cost, of which 0.41 percent is attributable to median home value and 0.15 percent to gross rent, and 0.25 percent of the Hispanic gap (Table S11). At a given destination price, minority-origin streams still reached dirtier air.
This null result should be read narrowly. Because purchasing power also depends on household income, wealth, credit access, and local housing supply, none of which neighborhood medians capture, the observation that destination price levels do not explain the gap does not rule out broader affordability concerns. The housing measures are also incompletely observed: the American Community Survey suppresses median home value for 4.3 percent of populated block groups and gross rent for 15.8 percent, and block groups without a home-value estimate are smaller and predominantly renter-occupied, with 87 percent of them reporting a rent value. Because those destinations drop out of the flow-weighted averages, the affordability control misses a portion of the rental market on which minority neighborhoods disproportionately rely. The small, explained share may therefore partly reflect incomplete coverage of the relevant rental market. The finding therefore does not support destination price levels, as measured here, as a sufficient explanation; it does not rule out affordability in a broader sense.
A separate concern is selection into moving. Movers who cross metropolitan boundaries, or who move long distances, may differ from other movers in ways that could widen the observed gap. The Black gap survived each restriction designed to address this concern, whereas the Hispanic gap did not: it fell to 0.009 µg/m3 (95% CI: −0.015, 0.034) within metropolitan areas (Table S12). Within the same metropolitan area, where movers share a labor and housing market, the Black gap was 0.050 µg/m3 (95% CI: 0.034, 0.066). Among short distance moves of 50 km or less, it was 0.060 µg/m3 (95% CI: 0.045, 0.075). Adding move distance as an explicit control left the estimate essentially unchanged (Table S12).
Two additional analyses examine how the avoidance gap varies by location within metropolitan areas and by moving distance (Tables S13–S15, Figures S11 and S12). I classify block groups as urban core (principal city), inner suburb (within the principal city’s county or 15 km of its center), or periphery. Moves out of the urban core yield the largest exposure reductions across all groups, but movers from majority-Black core origins are less likely to leave: 66% of moves from these origins remain within the core, compared with 52% from majority-white core origins. Adding origin-by-destination-type fixed effects to Equation (2), which restricts comparisons to moves between the same geographic categories, reduces the Black avoidance gap from 0.119 to 0.069 µg/m3 (95% CI: 0.052, 0.086). Differences in movement away from the urban core are therefore associated with approximately 40% of the gap, although disparities persist among geographically comparable moves. The remaining gap is concentrated in moves to inner suburbs (0.062 µg/m3; 95% CI: 0.018, 0.107) and the periphery (0.045 µg/m3; 95% CI: −0.001, 0.091), with no detectable gap for moves within the core.
Moves from majority-Black origins also cover shorter distances, with a flow-weighted median of 8.4 km versus 15.0 km for majority-white origins and are more likely to remain within the same metropolitan area (81% versus 67%). Within distance bands, the Black avoidance gap is 0.042 µg/m3 (95% CI: 0.034, 0.050) for moves of 10 km or less, 0.080 (95% CI: 0.046, 0.114) for 10–50 km, −0.024 (95% CI: −0.046 to −0.001) for 50–200 km, and 0.249 (95% CI: 0.213, 0.286) for moves exceeding 200 km. The gap is therefore evident even for short-distance moves, which may be less likely to involve workplace changes, but is largest for long-distance moves, many of which cross metropolitan boundaries. Because the data do not identify households’ reasons for moving, these findings describe differences in the destinations reached by movers from similarly polluted origins, rather than differences in their motivations.
The gap was also robust to PM2.5 uncertainty weighting (Table S16). Extending these tests to all eight pollutants left the overall pattern intact (Tables S17 and S18, Figures S9 and S10). The combustion-pollutant gaps survived the selection restrictions: the NO2 gap attenuated from 1.07 ppb in the full sample to 1.04 ppb within metropolitan areas. The two non-market pollutants behaved as expected. The wildfire-smoke gap remained null in every subsample, and the near-zero ozone gap turned negative within metropolitan areas, meaning that movers from Black-majority origins there reached destinations with slightly lower ozone.
3.6. The Opportunity Set and Segregation (Secondary Analyses)
Because access to cleaner neighborhoods is central to understanding the origins of the exposure changes achievable by moving, I attempted to quantify access. I defined the ‘opportunity set’ of neighborhoods, or the range of neighborhoods open to a household, as the share of all neighborhoods in a metropolitan area that are both clean (below the metropolitan median PM2.5 concentration) and affordable to the origin (median home value within three times the origin median household income). This is the environmental analogue of the reachable labor markets that define economic opportunity [41]. The three-times multiple is a standard affordability rule of thumb, and no substantive conclusion depends on it. Sensitivity analyses reported below vary every element of the definition. The measure is a heuristic summary of reach based on price alone. A household’s feasible choice set also depends on tenure, wealth and credit, vacancies, transport and commuting, employment, and the cost of moving itself, none of which it captures; it is used to ask whether a price-based account can explain the gap, not to describe the options any household faced.
First, this paper finds that the opportunity set of neighborhoods was substantially smaller for minority origins. For the typical majority-Black or majority-Hispanic origin, about 12 percent of the neighborhoods in its metropolitan area were both clean and affordable, compared with 26 percent for the typical majority-white origin, or roughly half the price-screened set (Figure S13, Table S19).
Second, the avoidance gap was also larger in more segregated metropolitan areas. This gradient is interpreted in Section 4. Across quartiles of metropolitan Black-white dissimilarity, the Black gap rose from 0.044 µg/m3 (95% CI: 0.026, 0.063) in the least-segregated quartile to 0.198 µg/m3 (95% CI: 0.175, 0.222) in the most segregated quartile. The increase was not strictly monotonic, but more segregated metropolitan areas generally showed larger gaps.
In a continuous specification, each standard-deviation increase in dissimilarity was associated with a 0.046 µg/m3 larger Black gap (95% CI: 0.026, 0.067; Figure S14, Table S20). Adding the measured opportunity set to the conditional model did not narrow the avoidance gap (Table S21), indicating that the disparity is not explained by the particular price-based measure of accessibility used here.
The contrast by origin race and ethnicity was robust to alternative income multiples ranging from 2.5 to 5 times income to a rent-based affordability rule for renter origins, and to defining clean neighborhoods as the cleanest quartile of a metropolitan area rather than its below-median half (Table S22).
Both results generalized across pollutants: redefining clean neighborhoods by each of the eight pollutants left the opportunity set essentially unchanged, with the minority-to-white ratio remaining near one-half under every definition, and the segregation interaction was strongest for NO2, at 0.588 ppb per standard deviation of dissimilarity (95% CI: 0.502, 0.673), and positive for PM2.5, black carbon, and nitrate (Table S23, Figures S15 and S16).
3.7. Individual-Level Evidence (Secondary Analysis)
Because the primary analysis is ecological, defined by the composition of origin neighborhoods rather than by the race or ethnicity of individual movers, I examined whether the same pattern appears at the individual level using American Community Survey microdata for 2012 to 2019. These data record each respondent’s race, ethnicity, and place of residence one year earlier, which permits the same contrast to be estimated for actual movers at the level of migration PUMAs (MIGPUMAs, the Census units of at least 100,000 residents in which public-use ACS microdata report each respondent’s residence one year earlier).
The microdata analysis differs from the neighborhood-stream analysis in three respects, which should be kept in mind when comparing the estimates (Table 2). Residences are located to migration PUMAs rather than block groups, so exposure contrasts within a PUMA are invisible. The controls are a spline in origin PM2.5 and year effects, with household income available for 71 percent of records; the block-group socioeconomic covariates and metropolitan fixed effects of Equation (2) have no counterpart in the microdata. Because the ACS records residence one year earlier, origin exposure is measured in the year before the survey and destination exposure in the survey year, whereas the flow analysis uses contemporaneous values for both. The microdata estimates are therefore a coarser test of the same qualitative contrast, not a re-estimation of Equation (2).
Table 2.
The neighborhood-stream and individual-level estimates side by side, with the differences in unit, resolution, exposure timing and controls that limit their comparability. The microdata provides supportive evidence on the same qualitative contrast, not a re-estimation of Equation (2).
As in the neighborhood-stream analysis, the raw gap was null and emerged only after conditioning on origin pollution, which is the signature of mean reversion. Conditional on a flexible spline in origin PM2.5, Black movers reached PM2.5 concentrations 0.165 µg/m3 higher than comparable white movers (95% CI: 0.114, 0.216), and Hispanic movers 0.183 µg/m3 higher (95% CI: 0.101, 0.265). Adjusting additionally for household income, which is available for 71 percent of records, gave 0.178 µg/m3 for Black movers and 0.179 µg/m3 for Hispanic movers. These estimates rest on 410,000 and 486,000 person-records, respectively (Figure S17, Table S24; subsample sensitivity, including a split between homeowners and renters, appears in Table S25).
Public microdata locate residences only to migration PUMAs, which are Census-defined units built from whole counties or groups of counties within a state and containing at least 100,000 residents. The individual-level analysis is therefore spatially coarser than the neighborhood-stream analysis, though still far finer than the metropolitan area.
Re-estimating the individual-level model for every pollutant showed the same cross-pollutant signature. The conditional gap was largest for NO2, at 0.225 ppb for Black movers (95% CI: 0.084, 0.366) and 0.407 ppb for Hispanic movers (95% CI: 0.232, 0.582). It was present for black carbon and organic matter, null for ozone among Black movers (−0.043 ppb, p = 0.59), and small but significantly negative for wildfire smoke (−0.046 µg/m3, p < 0.001). The positive Hispanic ozone gap of 0.449 ppb (p = 0.007) was the single departure from the neighborhood-level pattern (Table S26). In sum, the individual-level estimates showed the same direction and the same general order of magnitude of the neighborhood-stream results. They are supportive evidence that the ecological pattern is unlikely to be solely an artifact of neighborhood composition, while leaving open that part of it may be. One candidate explanation is that Hispanic movers in the microdata disproportionately reach exurban and agricultural destinations in the Southwest where ozone is high; the data cannot test this, and the departure is noted rather than explained.
4. Discussion
Residential mobility was not associated with an erosion of environmental inequality over 2011 to 2019; the patterns documented here are consistent with its reproduction. The analysis documents a disparity and characterizes it; it does not identify the mechanism that produces it. In-place pollution cleanup occurred roughly proportionally everywhere, which narrowed absolute gaps. Residential mobility, which could in principle have accelerated relative convergence by moving disadvantaged residents disproportionately toward cleaner air, was instead associated with the opposite pattern. Conditional on baseline exposure, movers from minority origins achieved smaller exposure reductions, dirtier destinations drew disproportionate minority in-migration, and pollution persisted where minority residents lived. Environmental opportunity, in this framing, is not the clean air a household ultimately obtains but the range of cleaner neighborhoods accessible to it. That range was narrower for minority origins; movers leaving those origins captured smaller reductions, and the shortfall was not explained by the price of the destinations they reached.
The baseline inequality that movers inherited did not arise from migration. Pollutant concentrations were higher in minority neighborhoods because of longstanding and well-documented processes: the siting of industry and highways in or beside Black and Hispanic neighborhoods, redlining and exclusionary zoning, and land-market dynamics that concentrated inexpensive housing near pollution [2,13,15,22]. The present analysis takes that baseline as given and finds patterns consistent with migration reproducing it within the study period.
That destination housing values explain so little of the gap is a central finding. At the same destination price, minority-origin streams still reached dirtier options. This provides little support for destination price levels, as measured by ACS medians, as a sufficient explanation. It does not rule out affordability in the broader sense of wealth, credit, mortgage terms, and tenure, which neighborhood medians do not capture, and the urban-form results add a second component to the disparity: movers from majority-Black origins decentralize less often and, when they do, reach more polluted suburbs.
Setting aside the simplest price story leaves open a range of explanations that data used in this study cannot separate: discrimination and steering in housing and rental markets, information asymmetries, time and search constraints, ties to employment, kin, and community, unmeasured preferences over schools, commutes, and co-ethnic neighborhoods, and supply-side factors such as tenure, zoning, and housing availability. Any of these forces could channel moves toward neighborhoods that are demographically similar to the origin and, on average, more polluted than the available alternatives; the present data cannot distinguish among them, and the segregation gradient of Section 3.6, while consistent with discrimination and steering, is equally consistent with co-ethnic preferences, information networks, and the spatial structure of housing supply in segregated markets.
The acute inequalities in traffic- and combustion-related pollution are an important result for the field of urban planning. NO2, black carbon, and organic matter are key indicators of combustion infrastructure, including roads, ports, rail, and industry, that most systematically burdens people of color [2]. That infrastructure is concentrated in the dense, lower-cost urban neighborhoods in which minority households tend to live, and leaving it means leaving those neighborhoods.
Wildfire smoke served as a useful contrast exposure: it is spatially diffuse, and smoke episodes produce at most transient price responses rather than durable neighborhood price gradients [40]. If the avoidance gap arises because households sort across neighborhoods on pollution that is capitalized into housing prices and tied to fixed infrastructure, then the mobility mechanisms should be weak for smoke, which this paper found to be the case. Ozone, a secondary pollutant, which tends to be higher in whiter exurban areas, was also in the opposite direction, as expected. This consistency is supportive rather than decisive. The pollutants differ in spatial structure, sources, and salience as well as in capitalization, and the same contrast could arise if sorting of any kind simply has more scope where pollution is more spatially concentrated.
This analysis has several limitations, of which the most consequential for a study of fine exposure differences is spatial aggregation: the 1 km pollutant surfaces smooth the near-road gradients on which housing markets sort, as discussed below. First, the estimates describe patterns of moves and destinations: they show that mobility is consistent with reproducing environmental inequality, not that moving itself is the causal mechanism, since the same patterns could arise from constraints acting on movers rather than from the act of moving. Second, the analysis is ecological. The MIGRATE flows are not disaggregated by race or ethnicity, so every contrast is defined by the composition of the origin neighborhood, that is, by streams leaving majority-Black or majority-Hispanic neighborhoods, rather than by the race or ethnicity of individual movers. The individual-level analysis of American Community Survey microdata (Figure S17) showed the same gap for individual Black and Hispanic movers at the coarser migration-PUMA level, which partly mitigates this concern but cannot address sorting within migration PUMAs.
The exposure datasets used in this analysis are error-prone. Satellite-derived estimates are least reliable where ground monitors are sparse, speciated components inherit additional model error, and aggregation to block-group and, for wildfire smoke, 10 km annual means smooths over within-neighborhood and within-year variation. Translating gridded surfaces to census block groups introduces a further spatial-aggregation error: block-group boundaries do not align with grid cells, concentrations are treated as uniform within each cell, and many urban block groups are smaller than a single 1 km cell, so sharp within-cell gradients such as near-road NO2 peaks are smoothed away (Table S27). Because this smoothing removes precisely the fine-scale variation on which the housing market can sort, the resulting change-of-support error plausibly attenuates rather than creates the contrasts documented here. Uncertainty weighting left the main estimate essentially unchanged (Table S16), but residual exposure error cannot be ruled out.
The exposure reallocation is a contemporaneous cross-sectional difference rather than a within-person trajectory, and who moves is not random. Migrant selection and the strong distance-dependence of moves are longstanding features of internal migration in the United States [23,42], although the gap survived both the within-metropolitan and the short-distance restrictions. An exploratory analysis of Clean Air Act nonattainment designations is reported in Table S28 and Figures S18 and S19; its pre-trends fail, and it is therefore not relied upon. The distance-band estimates show the gap at every scale of move except regional moves of 50 to 200 km, and largest for moves over 200 km. The data do not identify why any household moved, and all estimates should be read as comparisons of destinations reached, not of motives.
Finally, these results describe the period 2011 to 2019, and conditions have since shifted in ways that bound their reach. Most notably, wildfire smoke, which was episodic during the study period and had at most transient price effects, has since become dramatically more frequent and severe and is now a major driver of particulate pollution across much of the country. The negative-control logic employed here is therefore specific to 2011 to 2019, and smoke may now be capitalized into housing and shape residential moves. Post-2020 changes in remote work and in housing markets may likewise have altered the mobility patterns on which the analysis rests. Each of these considerations points toward the same next step: linking individual residential histories to pollution in order to recover the household-level version of the pattern documented here at the neighborhood scale.
Supplementary Materials
The following supporting information can be downloaded at: https://www.mdpi.com/article/10.3390/su182110784/s1. Section S1: Supplementary Methods (pollutant data sources and extraction to block groups; gentrification classification; worked examples of the exposure reallocation and of the shift-share and Gelbach decompositions; the environmental opportunity set; the segregation index; the individual-level ACS analysis; the exposure-reallocation signature; the exploratory Clean Air Act nonattainment analysis; reproducibility; and the urban-form and move-distance classification), Section S2: Supplementary Tables, Section S3: Supplementary Figures, Section S4: Descriptive Figures; Tables S1–S28: supplementary results (endpoint robustness, exposure trends, the shift-share decomposition, fixed-effect, threshold and weighting sensitivity of the avoidance gap, the cross-pollutant mechanisms, affordability, selection, urban-form and move-distance analyses, the opportunity set and segregation, the individual-level ACS estimates, block-group size relative to the exposure grids, and the exploratory nonattainment estimates); Figures S1–S19: the assumed causal structure and supplementary results figures; Figures S20–S58: descriptive maps of the pollutant, socioeconomic, demographic, gentrification, segregation and migration-PUMA inputs at the start and end of the study period, and alluvial diagrams of migration across pollutant quintiles and terciles. References [43,44] are cited in the Supplementary Materials.
Funding
This research received no external funding.
Institutional Review Board Statement
Not applicable.
Informed Consent Statement
Not applicable.
Data Availability Statement
All data analyzed in this study are publicly available. Block-group origin-destination migration flows are from the MIGRATE database; demographic, socioeconomic, and housing variables are from the American Community Survey; individual-level microdata are from IPUMS USA; and the PM2.5, NO2, ozone, and wildfire smoke surfaces are published, publicly accessible exposure products cited in Materials and Methods. An interactive results explorer built from the same results, including a block-group-level origin-destination tracer for every year, is available at https://01a12bbc-84a4-a651-2a33-53f591fca244.share.connect.posit.cloud/ (accessed on 21 June 2026).
Conflicts of Interest
The author declares no conflict of interest.
References
- Jbaily, A.; Zhou, X.; Liu, J.; Lee, T.-H.; Verguet, S.; Dominici, F. Inequalities in Air Pollution Exposure Are Increasing in the United States. medRxiv 2020. [Google Scholar] [CrossRef] [Scilit]
- Tessum, C.W.; Paolella, D.A.; Chambliss, S.E.; Apte, J.S.; Hill, J.D.; Marshall, J.D. PM2.5 Polluters Disproportionately and Systemically Affect People of Color in the United States. Sci. Adv. 2021, 7, eabf4491. [Google Scholar] [CrossRef] [Scilit] [PubMed]
- Colmer, J.; Hardman, I.; Shimshack, J.; Voorheis, J. Disparities in PM2.5 Air Pollution in the United States. Science 2020, 369, 575–578. [Google Scholar] [CrossRef] [Scilit] [PubMed]
- Bekbulat, B.; Sharma, A.; Apte, J.S.; Bullard, R.; Koolik, L.H.; Min, E.; Morello-Frosch, R.; Pastor, M.; Patterson, R.; Robinson, A.L.; et al. PM2.5 Air Pollution Inequities in the US by Sector and State: Past Trajectories and Future Directions. Sci. Adv. 2026, 12, eaed7425. [Google Scholar] [CrossRef] [Scilit] [PubMed]
- deSouza, P.; Anenberg, S.; Makarewicz, C.; Shirgaokar, M.; Duarte, F.; Ratti, C.; Durant, J.L.; Kinney, P.L.; Niemeier, D. Quantifying Disparities in Air Pollution Exposures across the United States Using Home and Work Addresses. Environ. Sci. Technol. 2024, 58, 280–290. [Google Scholar] [CrossRef] [Scilit] [PubMed]
- deSouza, P.N.; Anenberg, S.; Fann, N.; McKenzie, L.M.; Chan, E.; Roy, A.; Jimenez, J.L.; Raich, W.; Roman, H.; Kinney, P.L. Evaluating the Sensitivity of Mortality Attributable to Pollution to Modeling Choices: A Case Study for Colorado. Environ. Int. 2024, 185, 108416. [Google Scholar] [CrossRef] [Scilit] [PubMed]
- Kerr, G.H.; Goldberg, D.L.; Harris, M.H.; Henderson, B.H.; Hystad, P.; Roy, A.; Anenberg, S.C. Ethnoracial Disparities in Nitrogen Dioxide Pollution in the United States: Comparing Data Sets from Satellites, Models, and Monitors. Environ. Sci. Technol. 2023, 57, 19532–19544. [Google Scholar] [CrossRef] [Scilit] [PubMed]
- United Nations General Assembly. Transforming Our World: The 2030 Agenda for Sustainable Development; Resolution A/RES/70/1; United Nations: New York, NY, USA, 2015. [Google Scholar]
- Chay, K.Y.; Greenstone, M. Does Air Quality Matter? Evidence from the Housing Market. J. Political Econ. 2005, 113, 376–424. [Google Scholar] [CrossRef] [Scilit]
- Bayer, P.; Keohane, N.; Timmins, C. Migration and Hedonic Valuation: The Case of Air Quality. J. Environ. Econ. Manag. 2009, 58, 1–14. [Google Scholar] [CrossRef] [Scilit]
- De Silva, D.G.; Schiller, A.R.; Slechten, A.; Wolk, L. Tiebout Sorting and Toxic Releases. Environ. Resour. Econ. 2024, 87, 2487–2520. [Google Scholar] [CrossRef] [Scilit]
- Sullivan, D.M. Residential Sorting and the Incidence of Local Public Goods: Theory and Evidence from Air Pollution; Resources for the Future Working Paper; Resources for the Future: Washington, DC, USA, 2016. [Google Scholar]
- Been, V. Market Dynamics and the Siting of LULUs: Questions to Raise in the Classroom about Existing Research. W. Va. Law Rev. 1994, 96, 1069–1077. [Google Scholar]
- Mohai, P.; Saha, R. Which Came First, People or Pollution? A Review of Theory and Evidence from Longitudinal Environmental Justice Studies. Environ. Res. Lett. 2015, 10, 125011. [Google Scholar] [CrossRef] [Scilit]
- Pastor, M.; Sadd, J.; Hipp, J. Which Came First? Toxic Facilities, Minority Move-In, and Environmental Justice. J. Urban Aff. 2001, 23, 1–21. [Google Scholar] [CrossRef] [Scilit]
- Chen, S.; Oliva, P.; Zhang, P. The Effect of Air Pollution on Migration: Evidence from China. J. Dev. Econ. 2022, 156, 102833. [Google Scholar] [CrossRef] [Scilit]
- Khanna, G.; Liang, W.; Mobarak, A.M.; Song, R. The Productivity Consequences of Pollution-Induced Migration in China. Am. Econ. J. Appl. Econ. 2025, 17, 184–224. [Google Scholar] [CrossRef] [Scilit]
- Mikula, Š.; Pytliková, M. Migratory Responses to Air Pollution Reduction: Evidence from a Large-Scale Desulfurization Programme. Eur. Econ. Rev. 2026, 181, 105154. [Google Scholar] [CrossRef] [Scilit]
- Keller, M.; Knittel, C.R.; Krebs, B.; Luechinger, S. Air Pollution and Internal Migration in the United States; NBER Working Paper No. 35317; National Bureau of Economic Research: Cambridge, MA, USA, 2026. [Google Scholar] [CrossRef] [Scilit]
- Kim, B. Do Air Quality Alerts Affect Household Migration? South. Econ. J. 2019, 85, 766–795. [Google Scholar] [CrossRef] [Scilit]
- Fraenkel, R.; Zivin, J.G.; Krumholz, S. The Coal Transition and Its Implications for Health and Housing Values. Land Econ. 2024, 100, 51–65. [Google Scholar] [CrossRef] [Scilit]
- Heblich, S.; Trew, A.; Zylberberg, Y. East-Side Story: Historical Pollution and Persistent Neighborhood Sorting. J. Political Econ. 2021, 129, 1508–1552. [Google Scholar] [CrossRef] [Scilit] [PubMed]
- Molloy, R.; Smith, C.L.; Wozniak, A. Internal Migration in the United States. J. Econ. Perspect. 2011, 25, 173–196. [Google Scholar] [CrossRef] [Scilit]
- Olney, W.W.; Thompson, O. The Determinants of Declining Internal Migration. J. Urban Econ. 2026, 153, 103856. [Google Scholar] [CrossRef] [Scilit]
- Sharkey, P. Residential Mobility and the Reproduction of Unequal Neighborhoods. Cityscape 2012, 14, 9–31. [Google Scholar]
- Borusyak, K.; Dix-Carneiro, R.; Kovak, B.K. Understanding Migration Responses to Local Shocks; NBER Working Paper No. 35921; National Bureau of Economic Research: Cambridge, MA, USA, 2026. [Google Scholar] [CrossRef] [Scilit]
- Carrasco-Escobar, G.; Schwarz, L.; Miranda, J.J.; Benmarhnia, T. Revealing the Air Pollution Burden Associated with Internal Migration in Peru. Sci. Rep. 2020, 10, 7147, Correction in Sci. Rep. 2020, 10, 20820. [Google Scholar] [CrossRef] [Scilit] [PubMed]
- Shen, S.; van Donkelaar, A.; Jacobs, N.; Li, C.; Martin, R.V. Enhancing Estimation of Fine Particulate Matter Chemical Composition across North America by Including Geophysical A Priori Information in Deep Learning with Uncertainty Quantification. ACS EST Air 2026, 3, 336–350. [Google Scholar] [CrossRef] [Scilit] [PubMed]
- van Donkelaar, A.; Hammer, M.S.; Bindle, L.; Brauer, M.; Brook, J.R.; Garay, M.J.; Hsu, N.C.; Kalashnikova, O.V.; Kahn, R.A.; Lee, C.; et al. Monthly Global Estimates of Fine Particulate Matter and Their Uncertainty. Environ. Sci. Technol. 2021, 55, 15287–15300, Correction in Environ. Sci. Technol. 2024, 58, 4463–4464. [Google Scholar] [CrossRef] [Scilit] [PubMed]
- Anenberg, S.C.; Mohegh, A.; Goldberg, D.L.; Kerr, G.H.; Brauer, M.; Burkart, K.; Hystad, P.; Larkin, A.; Wozniak, S.; Lamsal, L. Long-Term Trends in Urban NO2 Concentrations and Associated Paediatric Asthma Incidence: Estimates from Global Datasets. Lancet Planet. Health 2022, 6, e49–e58. [Google Scholar] [CrossRef] [Scilit] [PubMed]
- Liu, R.; Chu, L.; Deziel, N.C.; Chen, K. Four-Decade (1980–2023) Surface Ozone Concentrations across the Contiguous United States: Fine-Resolution Estimates and Health Implications. Environ. Sci. Technol. 2026, 60, 14292–14306. [Google Scholar] [CrossRef] [Scilit] [PubMed]
- Childs, M.L.; Li, J.; Wen, J.; Heft-Neal, S.; Driscoll, A.; Wang, S.; Gould, C.F.; Qiu, M.; Burney, J.; Burke, M. Daily Local-Level Estimates of Ambient Wildfire Smoke PM2.5 for the Contiguous US. Environ. Sci. Technol. 2022, 56, 13607–13621. [Google Scholar] [CrossRef] [Scilit] [PubMed]
- deSouza, P.; Crawford, B.; Durant, J.L.; Hudda, N.; Ibsen, P.; L’Orange, C.; Jimenez, J.; Graeber, B.; Cicione, B.; Mekonnen, R.; et al. High-Resolution Multi-Pollutant Mapping in Denver, Colorado. Atmos. Environ. X 2025, 27, 100364. [Google Scholar] [CrossRef] [Scilit]
- Agostini, G.; Young, R.; Fitzpatrick, M.; Garg, N.; Pierson, E. Inferring Fine-Grained Migration Patterns across the United States. Nat. Commun. 2025, 17, 1265. [Google Scholar] [CrossRef] [Scilit] [PubMed]
- Bates, L. Gentrification and Displacement Study: Implementing an Equitable Inclusive Development Strategy in the Context of Gentrification; Urban Studies and Planning Faculty Publications and Presentations; Portland State University: Portland, OR, USA, 2013. [Google Scholar] [CrossRef] [Scilit]
- Ding, L.; Hwang, J.; Divringi, E. Gentrification and Residential Mobility in Philadelphia. Reg. Sci. Urban Econ. 2016, 61, 38–51. [Google Scholar] [CrossRef] [Scilit] [PubMed]
- Freeman, L. Displacement or Succession? Residential Mobility in Gentrifying Neighborhoods. Urban Aff. Rev. 2005, 40, 463–491. [Google Scholar] [CrossRef] [Scilit]
- Freeman, L.; Braconi, F. Gentrification and Displacement: New York City in the 1990s. J. Am. Plan. Assoc. 2004, 70, 39–52. [Google Scholar] [CrossRef] [Scilit]
- Duncan, O.D.; Duncan, B. A Methodological Analysis of Segregation Indexes. Am. Sociol. Rev. 1955, 20, 210–217. [Google Scholar] [CrossRef] [Scilit]
- Lopez, L.A.; Tzur-Ilan, N. Air Pollution and Rent Prices: Evidence from Wildfire Smoke Plumes; Working Paper; Federal Reserve Bank of Dallas, Research Department: Dallas, TX, USA, 2025. [Google Scholar]
- Sprung-Keyser, B.; Hendren, N.; Porter, S. The Radius of Economic Opportunity: Evidence from Migration and Local Labor Markets; Center for Economic Studies Working Paper; US Census Bureau: Washington, DC, USA, 2022.
- von Berlepsch, V.; Rodríguez-Pose, A. The Missing Ingredient: Distance. Internal Migration and Its Long-Term Economic Impact in the United States; Papers in Evolutionary Economic Geography (PEEG); Utrecht University: Utrecht, The Netherlands, 2019. [Google Scholar]
- Larkin, A.; Geddes, J.A.; Martin, R.V.; Xiao, Q.; Liu, Y.; Marshall, J.D.; Brauer, M.; Hystad, P. Global Land Use Regression Model for Nitrogen Dioxide Air Pollution. Environ. Sci. Technol. 2017, 51, 6957–6964. [Google Scholar] [CrossRef] [Scilit] [PubMed]
- Baston, D. exactextractr: Fast Extraction from Raster Datasets Using Polygons; R Package; ISciences, LLC: Burlington, VT, USA, 2022; Available online: https://CRAN.R-project.org/package=exactextractr (accessed on 21 June 2026).

Disclaimer/Publisher’s Note: The statements, opinions and data contained in all publications are solely those of the individual author(s) and contributor(s) and not of MDPI and/or the editor(s). MDPI and/or the editor(s) disclaim responsibility for any injury to people or property resulting from any ideas, methods, instructions or products referred to in the content. |
© 2026 by the author. Licensee MDPI, Basel, Switzerland. This article is an open access article distributed under the terms and conditions of the Creative Commons Attribution (CC BY) license.