


Abstract
The new energy vehicle (NEV) industry anchors China’s transition towards sustainable mobility, and the Pearl River Delta (PRD) hosts one of its densest clusters. Yet the spatial organisation of the innovation system underpinning it remains poorly understood, because actors, data and methods are heterogeneous. This study develops a hybrid computational intelligence framework linking kernel density estimation, spatial autocorrelation, social network analysis and temporal exponential random graph models (TERGMs) in one reproducible pipeline, applied to 4036 innovation entities, 1260 co-applied NEV patents yielding 274 cooperating pairs among 290 organisations, and 187 policy documents (2009–2025). The chain exhibits a dual-core, core-periphery agglomeration (global Moran’s I = 0.538, p = 0.001): a Shenzhen-centred mass extending into Dongguan and a smaller Guangzhou core, against 14 low-low peripheral units. Its cooperation network expands rapidly without consolidating: cooperating organisations grow from 30 to 290 while density falls from 0.071 to 0.007; it stays sparse and modular, anchored by universities and flagship firms. Geographic proximity and organisational scale raise, and technological distance lowers, the odds of cooperation, while same-tier alignment is not significant once proximity is controlled. Contrary to expectations, cities with richer non-subsidy portfolios show weaker tie formation (β = −0.59, p < 0.001), and strengthening over time, whereas subsidy intensity is only weakly positive (β = 0.16, p = 0.067). These associations, stable across five specifications, are observational, not causal; they imply that the sustainability of the PRD’s NEV innovation system rests less on further concentration than on making existing proximity usable across municipal boundaries.
1. Introduction
China’s new energy vehicle (NEV) sector has grown from a niche market into the world’s largest electric-vehicle industry. In 2024, the country accounted for roughly 70% of global electric passenger-vehicle sales [1], and the Pearl River Delta (PRD) remains one of the most concentrated production and innovation clusters, hosting flagship firms such as BYD, GAC Aion, and Denza. The sector is also embedded in a complex innovation chain that links basic research, applied technology development, vehicle engineering, battery and motor manufacturing, charging infrastructure, and downstream production [2,3,4,5]. Understanding the spatial layout, network structure, and dynamic drivers of this chain is essential for evidence-based industrial policy.
China is not alone in pursuing electrification, and the motives behind it are not exclusively environmental. Governments across both developed and developing economies promote vehicle electrification in order to address energy, climate, and environmental concerns and, at the same time, to secure or expand their position in the global automotive value chain [6,7]. Agenda-setting work on the electric vehicle (EV) sector identifies the geopolitics of critical battery metals, the design of government incentives and the changing rationale for subsidies as the field’s most pressing research priorities [6], while evidence from emerging EV industries shows that investment is attracted not by nearshoring alone but by the interaction of trade agreements, climate policy, consumer incentives and locally accumulated technological capabilities [7]. Both strands converge on the same implication: because domestic innovation ecosystems—universities, research institutes, suppliers and lead firms—are the mechanism through which industrial objectives are converted into technological capacity, how those ecosystems are spatially distributed and how their members cooperate are questions of first-order policy importance rather than descriptive curiosities. The PRD, as the densest such ecosystem in China, is therefore a strategically informative case rather than a purely local one.
Understanding this chain nevertheless remains methodologically challenging for three reasons. First, NEV innovation involves heterogeneous actors—high-tech enterprises, technology-based SMEs, universities, engineering R&D centres, new-type R&D institutions, and key laboratories—whose attributes and cooperation modes differ substantially [3,8,9]. Capturing this heterogeneity requires a multimodal data pipeline that can fuse entity, geographic, and relational information. Second, many studies rely on static models that cannot describe network evolution, reciprocal dynamics, or multi-dimensional proximity interactions [10,11,12]. Third, policy instruments in the PRD have evolved over the past fifteen years from direct subsidies toward mixed subsidy and non-subsidy instruments, so their effects warrant separate modelling [2,13,14].
To address these challenges, we propose a hybrid computational intelligence framework that integrates spatial measurement, social network analysis (SNA), and temporal dynamic modelling. Hybrid computational intelligence [15,16,17] combines computational paradigms—statistical learning, network science, spatial econometrics, and meta-heuristic optimisation—so that each method offsets the limitations of the others. The framework developed here (Section 3.3) chains five layers: multimodal data acquisition, preprocessing and entity linkage, spatial pattern analytics, network topology analytics, and temporal driver analytics. Fourteen methods, from kernel density estimation to bootstrap inference, operationalise the fusion. The modular architecture means each layer can be replaced or refined without disrupting the others, which improves reusability across regions and industries.
This study is organised around three research questions and three corresponding sets of hypotheses.
RQ1. How is the PRD NEV innovation chain spatially organised, and does its agglomeration follow a monocentric or a polycentric pattern? We expect innovation entities to be significantly and positively spatially autocorrelated (H1a), and agglomeration to be polycentric rather than monocentric, with a dual core and pronounced core-periphery asymmetry between the core cities and the periphery (H1b).
RQ2. What structure does the patent-based cooperation network exhibit, and how does it evolve across successive observation windows? We expect the network to display the small-world signature of high clustering combined with short average path length (H2a), and to densify over time through both a rising density and an increasing share of cross-tier ties (H2b).
RQ3. To what extent are subsidy-based and non-subsidy-based policy instruments associated with the formation and optimisation of cooperation ties, once spatial, technological and organisational factors are held constant? We expect non-subsidy instruments to be positively and stably associated with tie formation (H3a); direct subsidies to be associated positively in the short run but negatively in the long run (H3b); and geographic proximity, enterprise scale and university R&D strength to raise, and technological distance to lower, the probability of cooperation (H3c).
These hypotheses are deliberately stated in associational terms. As set out in Section 3.5, the design used here narrows but does not close the identification gap between association and causation, and the empirical sections are written accordingly.
This study makes three contributions, each specified relative to—rather than merely alongside—the existing literature. Methodologically, it formalises a reusable, end-to-end hybrid computational intelligence pipeline in which the spatial, network and temporal modules share a single data backbone, so that the geographic and technological weights used in the temporal model are estimated from the data rather than asserted [10,18,19]. The theoretical contribution is deliberately narrower than the application of a temporal exponential random graph model, which has been used in innovation- and trade-network research before [11,20]. What is new here is the joint estimation of policy, proximity, attribute, and endogenous structural terms inside one temporal model, which makes the relative weight of policy instruments directly comparable with proximity and attribute effects instead of being reported in isolation; the substantive claim tested is that the observed transition in PRD NEV governance from direct fiscal transfers towards obligations, standards, and tax instruments is reflected in the network’s tie-formation logic, and that this transition is better read as a change in the resilience than merely in the efficiency of the cooperation system [21]. Empirically, this paper supplies quantitative benchmarks—spatial autocorrelation coefficients, network density, modularity, centrality rankings and network-model coefficients—for the PRD NEV innovation chain, together with an explicit assessment of how representative the cooperation-active core is of the wider innovation ecosystem, a question that comparable studies typically leave unaddressed. The remainder of the article is structured as follows. Section 2 reviews the literature on innovation-chain analytics, the spatial distribution of the NEV industry, social network analysis, hybrid computational intelligence, policy effects, sustainable security and the smart-city regulatory framework, and states the research gap. Section 3 describes the data, the measurement of the cooperation network, the identification strategy, and the hybrid computational intelligence pipeline. Section 4 presents the empirical results. Section 5 discusses the methodological, theoretical, resilience, and policy implications and acknowledges the limitations. Section 6 concludes.
2. Literature Review
2.1. Industrial Innovation Chain Analytics
The concept of an industrial innovation chain emerged from the integration of value-chain theory and national innovation systems [3]. Recent studies have begun to treat the chain as a multi-tier, multi-actor network and to investigate its structure and performance using network-based methods [8,9,10,18]. Ren et al. [10] examined the agglomeration externalities of NEV innovation resources and found that well-structured innovation networks significantly improve energy efficiency, while Du et al. [5] used 283 Chinese cities to show that cross-regional collaborative innovation networks enhance regional economic resilience. Liu et al. [22] reported that the resilience of China’s NEV industry is positively correlated with the density and robustness of its collaborative innovation network. Most of these studies, however, treat innovation networks in a relatively static manner, leaving temporal dynamics under-explored. The present paper addresses this gap by integrating static and dynamic perspectives within a single analytic framework.
2.2. Spatial Distribution of the NEV Industry
The spatial distribution of China’s NEV industry has attracted considerable attention. Cao [4] documented an uneven distribution pattern, with the Yangtze River Delta, Pearl River Delta, and Beijing-Tianjin-Hebei regions dominating. Wang et al. [23] used spatial differentiation to uncover innovation hot spots in the lithium-ion battery sub-industry, while Li and Zhou [24] mapped the coupling between industrial and innovation chains across provinces and reported a positive, geographically heterogeneous feedback mechanism. These studies, however, are mostly descriptive or rely on single methods (e.g., global Moran’s I); they rarely integrate spatial econometrics with subsequent network analysis. The present work attempts to close this gap by feeding spatial autocorrelation results directly into the network construction, ensuring that geographic proximity is operationalised in a data-driven way rather than approximated by Euclidean distance alone.
2.3. Social Network Analysis of Innovation
SNA has matured into a powerful toolkit for studying industrial innovation. Classical centrality measures [25]—degree, betweenness, and closeness—have been supplemented by PageRank [26], structural holes [27], and community detection algorithms (Louvain [28], multilayer unfolding [29]). In the Chinese context, Liu et al. [19] traced the spatio-temporal evolution of green innovation networks and reported strong agglomeration combined with multi-dimensional proximity effects. Wen and Liu [18] used an evolutionary correlation-network approach to reveal configuration mechanisms in China’s innovation ecosystem; they showed that the structural balance of hubs, bridges, and peripheral nodes co-evolves with policy changes. Yet these studies rarely embed SNA outputs into downstream causal models. The contribution of the present paper is to treat centrality rankings, structural-hole indices, and community assignments as covariates of the downstream network model, not merely descriptive outputs.
2.4. Hybrid Computational Intelligence
Hybrid computational intelligence [15,16,17] combines paradigms such as fuzzy systems, evolutionary computation, neural networks, and statistical learning to overcome the limitations of any single method. Bhattacharyya et al. [15] presented an encompassing framework for hybrid CI applied to engineering optimisation and pattern recognition. Malsagov et al. [16] reviewed hybrid modelling methods for complex systems and discussed their growing utility in socio-economic modelling. Gwabavu et al. [17] applied hybrid intelligent optimisation for wind-power forecasting, demonstrating gains in accuracy relative to pure statistical baselines. The present paper extends hybrid CI to socio-economic systems, specifically industrial innovation chains, by unifying spatial, network, and temporal analytic modules. By contrast with the engineering focus of prior work, our application places primary weight on the interpretability of each module, ensuring that the resulting coefficients are policy-relevant.
2.5. Policy Effects: Subsidies Versus Non-Subsidies
Policy effects on NEV innovation have been widely debated. Qin and Xiong [2] compared subsidised and non-subsidised policies and found substantial differences in innovation effectiveness; non-subsidy policies were associated with more durable patent generation, whereas subsidies showed short-term boosts but flatter long-term trajectories. Wang et al. [30] documented that non-subsidy incentives significantly shape enterprise innovation choices through channels other than direct cash transfer. Ma et al. [14] showed that information asymmetry moderates the impact of dual-credit policy on NEV innovation. Tian et al. [1] charted the evolution of Chinese NEV policy from 2009 to 2024 and documented a clear pivot from direct fiscal subsidies toward credit-and-tax instruments after 2018. To date, however, the temporal heterogeneity of subsidy effects (short-term positive vs long-term negative) has been less studied using TERGM-type models, which this paper attempts to do. We contribute to this stream by embedding both subsidy and non-subsidy policy terms in a single temporal model, allowing their effects to be directly compared while controlling for spatial and attribute factors.
2.6. Sustainable Security and Systemic Resilience as an Integrative Lens
Research on sustainability has increasingly converged with research on security. Ivančík and Dušek [21] argue that progress towards sustainable development depends to a substantial extent on the resilience of economic, environmental, societal and institutional systems, and they propose an integrated sustainable-security framework in which sustainability and security are treated as mutually conditioning rather than parallel agendas. Their central analytical move is to show that the conditions under which sustainability objectives can be pursued—governance capability, infrastructure continuity and the ability to absorb systemic shocks—are themselves part of what sustainability means, so that decoupling the two agendas produces policy that is fragile precisely where it is most ambitious.
This perspective is directly relevant to the NEV transition, which is a socio-technical transformation rather than only an environmental programme. Electrification reallocates critical dependencies: it substitutes dependence on imported oil with dependence on critical minerals, battery supply chains and grid capacity, and it reorganises the infrastructure through which energy and mobility are delivered. Sector-level agenda-setting work reaches an overlapping conclusion from a different direction, identifying the geopolitics of critical battery metals and the competitiveness of domestic battery industries as among the most consequential open questions for the EV transition [6]. Both literatures imply that the relevant question for a region such as the PRD is not only whether its NEV innovation chain is efficient, but whether it is organised in a way that can absorb the withdrawal of a partner, a policy instrument or a supply route without loss of function.
Three features of innovation networks make this framing operational for the present study. First, density and connectivity are resilience properties as much as efficiency properties: a cooperation network with multiple alternative paths between knowledge producers and industrialisers can route around a failed hub, whereas a sparse network with a single bridging organisation cannot. Second, the composition of the policy mix determines whether governance effects are reversible inputs or durable capacities; instruments that require continued fiscal commitment are, by construction, less robust than instruments embedded in obligations and standards. Third, concentration is ambivalent: the same hubs that accelerate diffusion also constitute single points of failure. We therefore use sustainable security as an interpretive lens rather than as a formal hypothesis-testing framework, returning to it in Section 5.2, and we are careful not to claim that the associations documented here demonstrate resilience effects.
2.7. Smart-City and Digital-Infrastructure Perspectives on the NEV Transition
A second body of work locates the same transition within urban governance and law. Peráček and Kaššaj [31] examine how effective public administration, digital connectivity and a coherent legal framework condition the implementation of smart-city objectives in the European Union, with particular attention to the regulation of artificial intelligence as a driver of urban transformation. Their review of the European policy architecture—effective public administration, the WiFi4EU connectivity programme, the abolition of roaming charges, Industry 4.0 and automated and autonomous vehicles—shows that these initiatives share a common requirement: technological interoperability presupposes administrative interoperability, and both presuppose a regulatory framework capable of assigning responsibility for automated, data-driven urban systems [31]. Their conclusion is that digital ecosystems which are sustainable, legally compatible and ethically managed cannot be assembled from technology alone; they are products of governance capacity.
NEV deployment depends on the same preconditions, and in ways that are easy to overlook in a technology-centred account. Smart charging networks require interoperable communication protocols and settlement rules that cross municipal and provincial boundaries; vehicle-to-grid services require tariff structures and metering arrangements; automated and connected vehicle functions require arrangements covering spectrum, data sharing, cybersecurity and liability; and demand-responsive charging, route optimisation and fleet management all rest on data infrastructure and administrative capacity. In the PRD, these functions are distributed across municipal governments, grid operators, platform firms, certification bodies and standards organisations, which means that the transaction costs of cooperation are partly administrative and legal rather than technical or financial. A purely techno-economic account of NEV diffusion therefore understates the preconditions of the cooperation that this paper measures, and it understates the extent to which policy effectiveness depends on the administrative layer that connects municipalities. We return to these requirements in Section 5.3 and Section 5.4; they also motivate the recommendation, developed there, that the harmonisation of charging and permit standards across the nine PRD cities be treated as innovation policy rather than as downstream infrastructure.
2.8. Research Gap and Positioning Relative to Prior Work
Three streams of research bear on this study, and the marginal contribution of the present work is best specified as a response to what each of them leaves unresolved.
The first stream analyses industrial innovation chains as networks, using centrality, structural holes and community detection to characterise how knowledge moves between research, development, and industrialisation tiers [3,10,18,19,22]. Its weakness is temporal: most contributions describe a network at one or a few dates and treat the resulting structure as an explanation rather than as something to be explained. Where dynamics are modelled, the focus is usually on structural self-organisation—reciprocity and transitivity—rather than on the relative weight of external drivers [11,20].
The second stream examines the spatial distribution of the NEV industry, documenting uneven agglomeration across the Yangtze River Delta, the Pearl River Delta and the Beijing–Tianjin–Hebei region and identifying innovation hot-spots in specific sub-industries [4,23,24]. It is largely descriptive in method, typically relying on global measures of spatial association, and it rarely carries its spatial output forward into a relational model. As a result, geographic proximity enters subsequent network analyses as an assumption rather than as an empirically estimated weight.
The third stream evaluates policy effects on NEV innovation and has established that subsidy-based and non-subsidy-based instruments differ in their innovation effectiveness, that non-subsidy incentives operate through channels other than cash transfer, and that the composition of China’s NEV policy portfolio shifted from fiscal subsidies towards credit and tax instruments after 2018 [1,2,14,30]. Three limitations are common to this stream. Policy is usually treated as exogenous, with limited engagement with the possibility that policy responds to innovation performance; the unit of analysis is typically the firm or the region rather than the relation; and short-run and long-run effects are rarely separated within a single stochastic-actor model.
3. Materials and Methods
3.1. Study Area: The Pearl River Delta
The Pearl River Delta (PRD) comprises nine prefecture-level cities: Guangzhou, Shenzhen, Dongguan, Foshan, Zhuhai, Huizhou, Zhongshan, Jiangmen, and Zhaoqing. With an area of approximately 55,000 km2 and a resident population of more than 80 million, the PRD accounted for over 12% of China’s GDP in 2024. The PRD has been a national hub for NEV production and innovation since 2010, hosting flagship firms such as BYD, GAC Aion, and Denza, along with a dense ecosystem of suppliers, testing platforms, and research institutions. The spatial boundaries of the PRD used in this study follow the official demarcation defined in the “Outline of the Pearl River Delta Urban Agglomeration Development Plan” (2014); the underlying administrative boundary shapefile was obtained from the Guangdong Bureau of Surveying and Mapping (GBSM) at 1:250,000 scale. For the spatial analyses, the nine cities are further partitioned into 62 functional groups obtained by aggregating the 634 municipal townships into contiguous units, so that the analysis units are fine enough to resolve within-city variation in agglomeration yet stable with respect to township-boundary revisions.
3.2. Data Sources and Multimodal Preprocessing
Six heterogeneous datasets were integrated in this study. (i) High-tech enterprise list (National High-Tech Enterprise Recognition Programme, n = 2249 entities); (ii) technology-based small and medium enterprise list (n = 1638); (iii) higher-education institution database (n = 51); (iv) provincial key laboratory list (n = 19); (v) provincial-level engineering R&D centre list (n = 46); (vi) new-type R&D institution list (n = 33). Together, these yield n = 4036 innovation entities. Geocoding was performed against the 2024 administrative boundary data of the GBSM, with manual disambiguation applied in 31 edge cases (e.g., entities whose addresses refer to district-level rather than city-level units). Each geocoded entity was then assigned to one of the 62 functional groups by point-in-polygon intersection; 3961 of the 4036 entities (98.1%) fall inside the study area, and the remaining 75 carry out-of-region or malformed coordinates (e.g., addresses in other provinces) and are excluded from the spatial analyses. Patent cooperation data were extracted from the State Intellectual Property Office open patent database covering 2009–2025; after duplicate removal and entity disambiguation via a BiLSTM-CRF model trained on 4500 manually labelled entities (precision 0.97, recall 0.95 on a held-out set of 800 entities), 1260 co-applied NEV patents filed between 2009 and 2025 with at least two organisational applicants were retained; their 1943 organisational co-application records correspond to 274 distinct cooperating pairs involving 290 organisations. A policy-text corpus of 187 central-, provincial-, and municipal-level NEV-related documents (2009–2025) was collected from official government portals and coded along three dimensions: instrument type (subsidy vs. non-subsidy), issuing level (central, provincial, municipal), and intensity (binary indicator × cumulative strength of the text). Inter-rater agreement for the coding reached Cohen’s κ = 0.84 on a 30-document test set.
Two features of this data structure condition the interpretation of every subsequent result and are therefore stated at the outset. First, the cooperation network links 290 organisations, of which 113 appear in the 4036-entity list (2.8% of the identified innovation entities) and 177 are co-applicants—suppliers, clients, research partners and organisations located outside the PRD—that fall outside the recognition lists. The network therefore describes the cooperation-active layer of the ecosystem rather than the ecosystem as a whole. This is neither an error nor a sampling artefact but a property of the indicator. Formal co-patenting is a demanding form of collaboration: it requires joint inventive contribution, agreed inventorship and a shared filing decision. Most high-tech enterprises and technology-based SMEs in the PRD innovate through internal R&D, contract research, equipment purchase, licensing or informal personnel exchange, none of which produces a co-assigned patent. Restricting the network to co-patenting therefore trades coverage for verifiability: every tie can be traced to a public legal document, but the network describes the formal, patent-intensive layer of cooperation rather than all cooperation.
Second, organisations are not drawn evenly from the actor types of the entity list. Relative to their share of the 4036 entities, universities are over-represented by a factor of about eleven (14.2% of the 113 matched nodes against 1.3% of the list) and new-type R&D institutions by a factor of about four, high-tech enterprises modestly (74.3% against 55.7%), whereas technology-based SMEs are strongly under-represented (8.0% against 40.6%). The network is therefore best understood as the formal knowledge-co-production layer of the PRD NEV innovation chain. We treat it as such throughout: the results in Section 4 are interpreted as statements about this layer, Section 4.2 quantifies how the cooperating organisations differ from the wider population, and Section 5.5 sets out what can and cannot be inferred about the ecosystem from a network of this kind. The substantive justification for proceeding with a small, verifiable network rather than a larger, inferred one is that the research questions concern the logic of cooperation—which organisations cooperate, on what basis, and how policy covaries with that behaviour—and that logic is observable in co-patenting records, whereas a network assembled from media reports, supply contracts or directory co-membership would be larger but would not support the same claims.
To ensure methodological transparency, data cleansing followed a four-step protocol: (i) field schema harmonisation; (ii) string normalisation (e.g., “Shenzhen City” → “Shenzhen”, “Pazhou” → “Haizhu”); (iii) Fuzzy entity resolution using Levenshtein distance (threshold = 0.85) supplemented by Jaccard similarity on address tokens; (iv) cross-source deduplication via a 64-bit hash of (entity_name, address, type). The result of these operations is summarised in Figure 1, Figure 2 and Figure 3 (composition by type, by city, and by innovation chain tier). The analytical pipeline that operates on these data is set out in Figure 4. The cleaned files—entity attribute table, patent cooperation table, policy coding table—are deposited alongside this manuscript to facilitate replication (see the Data Availability Statement).
Figure 1.
Composition of 4036 innovation entities by type in the PRD NEV innovation chain. High-tech enterprises (2249; 55.7%) and technology-based SMEs (1638; 40.6%) dominate; universities, engineering R&D centres, new-type R&D institutions, and key laboratories account for the remainder. (a) Count of entities by type; (b) proportional distribution by type.
Figure 2.
Spatial distribution of innovation entities across the nine PRD cities. Shenzhen (1651) and Guangzhou (981) jointly account for ~65% of entities; Dongguan (378) and Foshan (330) form the secondary tier; the remaining five cities are peripheral.
Figure 3.
Innovation-chain tier composition by entity type. High-tech enterprises (2249) are assigned to the technology R&D tier on their recognition criteria, technology-based SMEs (1638) to the industrialisation tier, and universities (51) and key laboratories (19) to the knowledge production tier.
Figure 4.
Analytical framework of hybrid computational intelligence for innovation-chain big-data analytics. The framework comprises a data layer, a method layer, and an application layer. Arrows indicate the upward flow from the data layer through the method layer to the application layer; the three colour blocks distinguish the data, method and application layers. Note: the framework integrates four heterogeneous data sources with eight analytical modules organised into three layers.
All analyses were carried out in Python 3.13.12 (Python Software Foundation, Wilmington, DE, USA) and R 4.5.2 (R Foundation for Statistical Computing, Vienna, Austria); the principal packages were GeoPandas 1.2.0, libpysal 4.15.0, esda 2.10.0, Shapely 2.2.0, SciPy 1.18.1 and mapclassify 2.11.0 for the spatial analyses, and statnet, tergm and sna for the network and temporal models. No chemical, reagent, device or commercial cell line was used.
3.3. Hybrid Computational Intelligence Framework
3.3.1. Spatial Pattern Analytics
Spatial pattern analytics comprises two complementary procedures. (i) Kernel Density Estimation (KDE) is used to identify the agglomeration “hot-spots” of innovation entities across the PRD. Bandwidth is selected by Silverman’s rule of thumb for bivariate data, h = n − 1/6 with 2 = ½(σx2 + σy2) [32], which yields h = 8.6 km for the 3961 geocoded entities; the surface is evaluated on a 200 m grid and reported as entities per km2. The KDE surface summarises the continuous density of entity presence, and the geographic-proximity covariate used in the network and temporal modules applies the same Gaussian decay to the pairwise distance between organisations. (ii) Spatial autocorrelation analysis employs both global and local Moran’s I [33] on the 62 functional groups. The univariate Moran’s I captures the global clustering of innovation entity density, while bivariate Moran’s I estimates the spatial lag of one variable (here, patent output) on another (the number of innovation entities). Statistical significance is assessed through 999 Monte-Carlo permutations; a row-standardised queen-contiguity weights matrix is used unless otherwise noted. The 62 groups form a single connected queen neighbourhood (153 adjacent pairs, mean 4.9 neighbours per unit, no isolates), so no unit is excluded from the weights matrix.
The mathematical principles underlying these two procedures are formalised as follows. The KDE estimator and Silverman’s rule-of-thumb bandwidth are given by [32]:
where K(·) is the Gaussian kernel, h the bandwidth, and xi the coordinate of the i-th innovation entity. Global and local spatial autocorrelation are measured by Moran’s I [34] and the LISA statistic [33]:
where wij denotes the row-standardised queen-contiguity weight, , and the mean entity density; significance is evaluated against 999 Monte-Carlo permutations.
h = 0.9∙min(σ, IQR/1.34)∙n−1/5
3.3.2. Network Topology Analytics
The cooperation network G = (V, E) is constructed with V the set of entities and E the set of 274 undirected, weighted ties defined by joint patent filings. Network statistics are computed on the whole graph and on three temporal windows (2009–2013, 2014–2018, 2019–2025). Centrality measures include degree, weighted degree, betweenness, closeness, PageRank [26], and Burt’s structural-hole indicator [27]. PageRank is computed with damping factor α = 0.85, the standard value recommended in the original algorithm and adopted in citation-analytics literature. Community detection applies the Louvain algorithm [28] with resolution parameter γ = 1.0 (selected to maximise modularity); robustness to γ is checked later in the sensitivity analysis. Cross-window comparisons are made through Jaccard similarity of community partitions. Robustness of community assignments is evaluated by bootstrapping the network 1000 times.
Four specification choices determine what the network statistics reported below mean, and we state them explicitly because they constrain interpretation. (i) Node set. The node set comprises every legal-entity organisation that appears as a co-applicant on at least one multi-applicant NEV patent filed between 2009 and 2025 on which at least one co-applicant belongs to the 4036-entity list; the co-applicant partner may lie outside the list, which preserves cooperation with suppliers, clients and research partners that the recognition lists do not capture. Natural-person applicants are excluded. Organisations in the wider entity list that never co-apply are outside the network by construction and are not treated as isolates. (ii) Tie definition and weighting. A tie exists between two organisations when they co-apply for at least one patent within the observation window. Ties are undirected, because co-application is a symmetric legal relation, and are weighted by the number of joint applications between the pair, so that repeated collaboration strengthens an existing tie rather than creating additional ones; the reported edge count is the number of distinct cooperating pairs, and the mean tie weight is the average number of joint applications per pair. (iii) Window construction. The three observation windows (2009–2013, 2014–2018, 2019–2025) are cumulative rather than disjoint: the second window contains all ties observed up to 2018 and the third all ties observed up to 2025. Cumulative windows are used for two reasons. A cooperation relation is durable rather than instantaneous, so a disjoint partition would discard ties that remain active across a boundary; and because the cooperation-active population is small, disjoint windows would leave several periods with too few nodes to support reliable structural statistics. It follows that the node and edge counts of the final window coincide with those of the full network, and that cross-window comparisons describe the progressive observation of a single network rather than three independent networks. (iv) Normalisation. Because the observed population grows across windows, raw node and edge counts are not comparable on their own; density, average degree, average clustering and average path length are reported alongside them, and Section 4.4 examines how much of the apparent structural change survives when the composition of the observed population is taken into account.
Two consequences of this specification are worth flagging for readers of the statistics that follow. Because the network is defined by co-patenting, its density is low by construction in comparison with networks assembled from affiliation, membership, or supply relations; density measures the incidence of a demanding relational form, not the general connectedness of the regional innovation system. Because the windows are cumulative, the falling density is largely an arithmetic consequence of a nearly constant average degree applied to an expanding node set, which is why Section 4.4 separates what changes with the observation base from what does not before drawing any conclusion about structural change.
Formally, the weighted-degree, betweenness, and closeness centralities follow Freeman [25]:
where is the number of shortest paths from s to t and those passing through node i. PageRank is defined recursively with damping factor α = 0.85 [26]:
Burt’s network constraint, which quantifies the absence of structural holes around node i, is [27]:
The Louvain algorithm maximises the weighted modularity [28]:
where equals 1 if nodes i and j belong to the same community. Cross-window partition stability is assessed by the Jaccard coefficient [29]:
3.3.3. Temporal Dynamic Modelling
To capture the temporal structure of the cooperation network, we estimate a nested family of exponential random graph models (ERGMs) in the statnet suite for R [35]: M1 (edges only), M2 (edges plus geometrically weighted shared-partner and degree terms), and M3 (the full specification with dyadic and node-level covariates). Because the three observation windows are cumulative and hence nested, a separable temporal ERGM with an explicit dissolution component is not identifiable—no tie observed in an earlier window is absent from a later one—so temporal structure is recovered in two complementary ways: M3 is re-estimated on each cumulative window, and a further specification adds the lagged cooperation network as an edge covariate to the final window, this being the leading term of the separable formation component. Estimates are obtained by maximum pseudolikelihood; MCMC-MLE did not converge for these specifications, a well-documented difficulty for networks as sparse as this one (density = 0.0065), and the reported standard errors should therefore be read as approximate. Quadratic assignment procedure (QAP) regression [13] provides an independent, distribution-free assessment of the same cross-sectional relationship, with coefficient-level inference based on 1000 permutations of the response matrix and 300 semi-partialling permutations of the predictor matrices.
The static ERGM specifies the probability of observing network Y conditional on covariates X [20]:
where is the vector of network statistics (edge count, geometrically weighted shared-partner and degree terms, and dyadic and node-level covariates) and the coefficient vector. The temporal extension models a Markovian sequence of networks [20,35]:
QAP regression vectorises the dyadic matrices and obtains ordinary least-squares estimates, with significance assessed by permuting the rows and columns of the response matrix (1000 draws) and, for coefficient-level inference, by semi-partialling the predictor matrices (300 draws) [13]:
vec(y) = vec(X)β + ε
3.4. Innovation-Chain Tier Classification
Following the OECD Frascati Manual adaptation by Li and Zhou [24], each entity is assigned to one of three innovation-chain tiers based on primary activity: knowledge production (K) for universities and key laboratories; technology R&D (T) for high-tech enterprises, engineering R&D centres and new-type R&D institutions; and industrialisation (I) for technology-based SMEs. The assignment follows the recognition criteria under which each entity enters the database: high-tech enterprises are recognised on sustained R&D expenditure, technical personnel and proprietary technology, which places them in the technology R&D tier, whereas technology-based SMEs are recognised for commercialisation and scaling activity, which places them in the industrialisation tier. This classification enables the analysis of vertical flow of knowledge and the detection of missing links across tiers. A tier-coherence indicator is constructed by computing the proportion of edges whose endpoints fall in different tiers; lower tier-coherence implies denser cross-tier flow.
Four implementation rules make this classification reproducible and rule out double counting. First, each entity is assigned to exactly one tier on the basis of primary declared activity, taken from the official recognition under which it enters the database; no entity appears in two tiers. Second, where an organisation’s recognition status could imply more than one tier—for example, a university that also operates an accredited engineering centre—the assignment follows the legal nature of the entity, with universities and key laboratories placed in K; high-tech enterprises, engineering R&D centres and new-type R&D institutions placed in T; and technology-based SMEs placed in I. This criterion was selected because it is the only one documented consistently across all six source lists, and it is applied uniformly rather than case by case. Third, an organisation’s tier is fixed over the whole observation period, so that cross-window comparisons describe changes in who cooperates with whom rather than changes in classification. Fourth, ties are classified by the tiers of their two endpoints, and a tie counts as cross-tier when the endpoints belong to different tiers.
These rules give the tier-coherence indicator its meaning: a low value indicates a network in which knowledge produced in the K tier is carried into the T and I tiers, whereas a value close to one indicates a network in which universities cooperate mainly with universities and firms mainly with firms, that is, a chain whose vertical links are absent. Because a three-way scheme is coarse, the analysis in Section 4.2 supplements it with a four-way entity-type breakdown (university, engineering R&D centre, high-tech enterprise, technology-based SME) computed on the same ties. This provides a finer-grained check on the same question and guards against artefacts of the coarser classification: if the three-tier result were driven by the placement of a particular organisational form, the four-way breakdown would not reproduce it.
The tier-coherence indicator is defined as the share of intra-tier edges among all cooperation ties [24]:
3.5. Identification Strategy and the Interpretation of Policy Effects
Policy variables of the kind used here are not randomly assigned, and the central threat to inference is reverse causation: provinces and municipalities with more active innovation systems are also more likely to adopt ambitious NEV policies, so a positive coefficient on policy intensity may reflect the responsiveness of policy to innovation rather than the effect of policy on innovation. Two further complications arise in a network setting. Tie formation is strongly endogenous, in that cooperation tends to be reciprocated and clustered, so a model that ignores network self-organisation will attribute to policy effects that are in fact structural. Additionally, policy intensity is measured from documents rather than from realised transfers, so it is a proxy for the obligations and resources actually confronting firms. The design choices below are intended to narrow the space of alternative explanations; we then state what they cannot rule out.
First, the model conditions on the previous state of the network rather than estimating coefficients from a single cross-section. The three observation windows are cumulative and therefore nested, so an explicit dissolution component cannot be identified; the preferred specification instead includes the lagged cooperation matrix as a dyadic covariate, which is the leading term of the separable formation component, and every specification is re-estimated on each cumulative window so that the movement of the coefficients as the network grows remains visible. This removes the most direct form of simultaneity between the outcome and its own history. Second, the specification includes the endogenous structural terms that dominate tie formation in cooperation networks—edges, geometrically weighted edgewise shared partners and geometrically weighted degree—so that the policy coefficients are estimated net of the network’s self-organising tendency, which is the most important omitted variable in cross-sectional regressions of policy on network outcomes. Third, the model incorporates time-varying organisational attributes that proxy for local innovation capacity, namely enterprise scale and university R&D strength, which are precisely the characteristics most likely to be confounded with policy adoption. Fourth, three nested specifications are compared (M1–M3 in Section 4.3) so that the movement of the policy coefficients as controls are added remains visible, and the preferred specification is subjected to the five robustness checks reported in Section 4.5, including replacement of the policy-intensity measure with raw document counts, re-estimation on the two earlier cumulative windows, variation of the structural decay parameter, removal of the ten heaviest ties and inclusion of the lagged network.
These measures narrow but do not close the identification gap, and three limitations remain. There is no credible instrument available at the level of a cooperation tie: the obvious candidates, such as central-government mandates or provincial fiscal capacity, are themselves correlated with regional innovation performance, and a weak instrument would replace one bias with another. The cooperation-active population is small, which limits the power available to detect modest effects and constrains the precision of the long-run estimates. Additionally, document-based intensity is a proxy for resources actually committed, which introduces measurement error of unknown sign. For these reasons we do not interpret the policy coefficients as causal effects. They are conditional associations: they describe how tie formation covaries with policy intensity once network structure, multi-dimensional proximity and observable attributes are held constant. Where the discussion uses language such as ‘resilience-building’, this is an interpretive framing of an association rather than a causal claim, and Section 5.5 states what additional design would be required to move from association to effect.
4. Results
4.1. Spatial Distribution and Agglomeration
The KDE surface is rendered in Figure 5, and the LISA cluster map in Figure 6. Two contiguous high-density masses emerge. The larger one spans from Shenzhen into Dongguan and Huizhou: at a threshold of 0.5 entities per km2, it covers roughly 1600 km2, with a kernel maximum of 1.62 entities per km2 in Shenzhen (Nanshan–Futian); its Dongguan (0.88) and Huizhou (0.49) maxima lie on the ridge descending from the Shenzhen core rather than forming separate peaks. The smaller one is centred on Guangzhou (Tianhe–Haizhu) with a kernel maximum of 0.54 entities per km2, and Foshan (0.32) forms its south-western extension rather than an independent peak. Zhuhai and Zhongshan (≈0.11), Jiangmen and Zhaoqing (≤0.06) are one to two orders of magnitude below the leading core, which is the quantitative content of the core–periphery reading. Formally, the global Moran’s I for innovation entity density across the 62 functional groups is 0.538 (z = 8.15, p = 0.001, 999 permutations), confirming significant positive spatial autocorrelation. The LISA cluster map (Figure 6) identifies 5 high-high units (all in Shenzhen), 14 low-low units (concentrated in western Jiangmen and Zhaoqing and in northern Huizhou), and no significant high-low or low-high outliers at the 5% level; 43 of the 62 units are not significant. The hot spots are therefore more concentrated than a corridor reading would suggest: the agglomeration is anchored by a single Shenzhen-centred cluster, with Guangzhou’s core units high but not individually significant once within-city variation is accounted for (the spatiotemporal evolution of the entity base is taken up in Section 4.5).
Figure 5.
Kernel density estimation of innovation entity agglomeration in the PRD (Gaussian kernel, Silverman bandwidth h = 8.6 km, 200 m grid, n = 3961 entities). Stars mark the two statistically separable cores: a Shenzhen–Dongguan mass and a Guangzhou core.
Figure 6.
Local Indicators of Spatial Association (LISA) cluster map of innovation entity density across the 62 functional groups (queen contiguity, row-standardised, 999 permutations). High-high hotspots (n = 5), low-low cold spots (n = 14), no significant high-low or low-high outliers. Global Moran’s I = 0.538, p = 0.001.
Bivariate Moran’s I between patent output and the number of innovation entities per unit is 0.436 (p = 0.001), indicating that units with many entities tend to be surrounded by units with high patent output. This reinforces the spatial agglomeration argument and motivates the use of geographic-proximity covariates in the downstream network and temporal models. The reverse specification, in which the number of innovation entities is regressed on the spatial lag of patent output, yields 0.466: the two directions are of similar magnitude, so the data do not support a strongly asymmetric spillover reading. What the bivariate decomposition does show is intensity rather than direction: of the 18 significant units, 6 are high-high (five Shenzhen units together with DG02 in Dongguan), 10 are low-low (western Jiangmen and Zhaoqing), and 2 are low-high (DG03 in Dongguan and SZ03 in Shenzhen), with no high-low units; the core–periphery asymmetry is therefore expressed in the level of patent output rather than in an asymmetric spillover.
4.2. Network Topology and Cohesion
Table 1 summarises the basic graph statistics for the full network and the three temporal windows. The undirected weighted network has 290 nodes and 274 edges (mean weight = 7.09). The network grows rapidly but does not consolidate: cooperating organisations increase from 30 to 290 and cooperating pairs from 31 to 274 across the three cumulative windows, yet density falls from 0.071 to 0.007, the number of disconnected components rises from 7 to 72, and the share of organisations in the largest component remains essentially flat (0.300, 0.318, 0.317). Average clustering declines moderately (from 0.417 to 0.300), and the average path length within the largest component lengthens from 2.03 to 4.23. The average degree stays close to two throughout, so the density decline is largely an arithmetic consequence of applying a nearly constant intensity of cooperation to an expanding population rather than evidence of disengagement. These statistics do not support the canonical small-world characterisation: clustering is moderate, but path lengths are long, and 198 of the 290 organisations lie outside the largest component.
Table 1.
Network statistics across three observation windows.
Centrality rankings reveal the structural backbone of the innovation chain. Top-10 nodes by PageRank include SCUT (South China University of Technology, 0.029), SYSU (Sun Yat-sen University, 0.026), GDUT (Guangdong University of Technology, 0.020), Dongguan University of Technology (0.014), South China Normal University and Shenzhen University (0.013 each), followed by Shenzhen CLOU Electronics, the Dongguan SYSU Research Institute, the Dongguan South China Design and Innovation Institute, and BYD (0.008 each). The structural-hole indicators [27] identify the organisations that bridge otherwise disconnected communities, again predominantly universities, with flagship firms such as BYD and GAC Group entering the lower half of the ranking. Importantly, the top-10 by PageRank overlaps with the top-10 by structural holes in eight of ten entities, so the two criteria identify largely the same organisations: prestige and brokerage are concentrated in one small group of universities and flagship firms rather than distributed across different actors. Figure 7 displays the top-10 nodes by degree, betweenness, and closeness centrality.
Figure 7.
Top-10 nodes by three centrality measures (PageRank, betweenness, and closeness). Universities occupy the leading PageRank positions, and a small set of flagship firms enters the top ranks. Blue bars are universities and research institutions; orange bars are enterprises. The enterprises shown are located in China: Shenzhen CLOU Electronics and BYD Co. (Shenzhen); Guangzhou Tinci Materials, GAC Group, Guangzhou Research Institute of Nonferrous Metals and GAC Aion New Energy Automobile (Guangzhou); Zhanjiang Juxin New Energy (Zhanjiang); Huizhou Highpower Technology (Huizhou).
The composition of the 4036 identified entities reported in Figure 1 makes the position of the cooperating organisations within the wider ecosystem explicit, and the contrast is stark. The population is dominated numerically by high-tech enterprises (2249; 55.7%) and technology-based SMEs (1638; 40.6%). The four knowledge- and technology-producing categories together account for only 149 entities, or 3.7% of the total: 51 universities, 46 provincial-level engineering R&D centres, 33 new-type R&D institutions, and 19 provincial key laboratories. It is precisely this 3.7% that dominates the centrality rankings—universities hold the six leading PageRank positions—and supplies six of the eight organisations that appear in both the top ten by PageRank and the top ten by structural holes. The cooperation-active core is therefore not a scaled-down image of the ecosystem but a structurally distinct layer, in which a numerically marginal set of organisations performs the integrative function that connects knowledge production to industrialisation. Three consequences follow for the interpretation of the results that follow. The network statistics in Table 1 characterise the behaviour of this layer and should not be read as averages for the 4036 entities. The centrality of universities is a property of the patent-intensive layer, since firms that innovate without co-patenting do not appear in it at all. Additionally, the low density of the network, discussed in Section 3.3.2, is partly a reflection of the fact that the layer is defined by a demanding relational form rather than by general connectedness.
Community detection by the Louvain algorithm [28] returns 78 communities with full-graph modularity Q = 0.91 (Figure 8). This value must be read with care: because 198 organisations lie in components disconnected from the rest, much of the modularity is produced by that fragmentation rather than by internal separation, so we also report the largest component separately, where Louvain identifies 10 communities with Q = 0.76—still high, but comparable with values reported for connected innovation networks. Partition persistence is high: the Jaccard similarity of co-membership is 0.875 between the first and second windows and 0.793 between the second and third, indicating that the community structure, once observed, is stable rather than continuously reorganised. Cross-tier integration is substantial but incomplete: among the 29 ties whose two endpoints both appear in the entity list, 12 (41.4%) connect different tiers, and the largest single block (14 ties) links high-tech enterprises to one another.
Figure 8.
Community structure of the cooperation network (Louvain algorithm). The 15 largest of 78 detected communities are coloured (full-graph modularity Q = 0.91); the largest connected component contains 92 of 290 organisations, within which Louvain identifies 10 communities with Q = 0.76. The ten highest-PageRank organisations are labelled. Each dot is an organisation and each connecting line a cooperation tie; node colour denotes community membership, with grey marking the 63 smaller communities.
Beyond community-level integration, Figure 9 disaggregates cooperation by entity type for the subset of ties that can be typed on both ends, that is, the 29 ties whose endpoints both appear in the entity list. Enterprise–enterprise ties are the most frequent channel (14 of 29), followed by university–enterprise ties (7); university-involved ties account for eight of the twelve cross-tier ties, which qualifies rather than contradicts the boundary-spanning role of universities: they are the principal bridges between the knowledge-producing and technology-developing tiers, but most ties between listed organisations connect enterprises to one another.
Figure 9.
Cooperation ties by entity-type pair for the 29 ties whose two endpoints both appear in the 4036-entity list (10.6% of all 274 ties). Enterprise–enterprise ties are the most frequent, followed by university–enterprise ties.
Figure 10 traces the annual number of newly observed cooperating pairs over the full 2009–2025 period.
Figure 10.
Dynamic trend of patent cooperation ties, 2009–2025. Bars show cooperating pairs observed for the first time in each year; the line shows the cumulative total, which reaches 274 pairs by 2025. New tie formation peaks at 42 pairs in 2020 and remains at 11–27 pairs per year thereafter.
Figure 11 displays the M3 coefficient estimates together with their 95% confidence intervals.
Figure 11.
Exponential random graph model coefficient estimates with 95% confidence intervals for the cumulative 2019–2025 window (M3, Table 2). Geographic proximity, the geometrically weighted shared-partner and degree terms, enterprise scale, and university R&D strength are positive and significant; technological distance and non-subsidy policy intensity are negative and significant; same-tier alignment and subsidy intensity are not significant at the 5% level. Red markers denote positive and significant coefficients, blue markers negative and significant ones, and grey markers terms not significant at the 5% level; the dashed vertical line marks zero.
Figure 12 reports the subsidy and non-subsidy policy coefficients separately for each cumulative window.
Figure 12.
Window-by-window coefficients of subsidy and non-subsidy policy intensity. The non-subsidy coefficient is negative in all three cumulative windows and becomes strongly negative in the final window; the subsidy coefficient is negative in the middle window and weakly positive in the final window. The dashed horizontal line marks zero; error bars show 95% confidence intervals.
4.3. Dynamic Evolution Drivers
To disentangle the drivers of network evolution, we estimate three nested exponential random graph models: M1 (edges only), M2 (edges plus geometrically weighted shared-partner and degree terms), and M3 (the full specification adding dyadic and node-level covariates). Table 2 reports the M3 estimates for the cumulative 2019–2025 window, our preferred specification. Because the three observation windows are cumulative and therefore nested, a conventional separable temporal ERGM with distinct formation and dissolution components is not identifiable here: a tie observed in 2013 cannot be absent from the 2018 window, so dissolution is never observed, and the dissolution component is empty by construction [20]. We therefore recover temporal structure in two complementary ways. First, M3 is re-estimated separately on each cumulative window, which shows how the coefficients move as the network grows. Second, a further specification adds the lagged cooperation network as an edge covariate—the leading term of the separable formation component—to the final window. Estimates are obtained by maximum pseudolikelihood; MCMC-MLE failed to converge for these specifications, which is a well-documented difficulty for networks as sparse as this one (density = 0.0065), and the associated standard errors should therefore be read as approximate. Eight of the ten terms are significant at p < 0.05.
Table 2.
Exponential random graph model (ERGM) coefficient estimates for the PRD NEV cooperation network (M3, cumulative window 2019–2025).
Four findings warrant emphasis. (i) Geographic proximity and technological distance dominate the cross-sectional structure. Dyads whose organisations are located in the same or adjacent localities are far more likely to cooperate (β = 4.31, 95% CI [3.57, 5.05]), and technological distance is strongly inhibiting (β = −1.93, 95% CI [−2.47, −1.39]). Because both dyadic terms enter on comparable scales, the comparison is direct: on the evidence of the cooperation-active layer, co-location is a considerably stronger correlate of cooperation than technological relatedness. (ii) Institutional attributes reinforce this pattern. Enterprise scale (β = 0.47, p < 0.001) and university R&D strength (β = 0.30, p < 0.001) are both positively associated with tie formation, whereas same-tier alignment loses significance once proximity and attributes are controlled (β = −0.55, p = 0.084), contrary to the tier-homophily expectation of H3c. This qualification matters for the interpretation of Section 4.2: cross-tier ties are common in the raw data, but their frequency is accounted for by the co-location of universities and industrialisers rather than by a distinct preference for same-tier partners. (iii) The structural terms are large. The geometrically weighted edgewise-shared-partner term (β = 1.51, p < 0.001) and the geometrically weighted degree term (β = 6.65, p < 0.001) indicate strong triadic closure combined with a marked concentration of connectivity in a few organisations—the statistical counterpart of the hub-and-fragment topology reported in Table 1. (iv) Against expectation, non-subsidy policy intensity carries a negative coefficient (β = −0.59, p < 0.001) and subsidy intensity a weakly positive one (β = 0.16, p = 0.067), the reverse of H3a and of the pattern anticipated by H3b. The window-by-window estimates show that this is not an artefact of aggregation: the non-subsidy coefficient is statistically indistinguishable from zero in 2009–2013 (−0.10, p = 0.935) and in 2014–2018 (−0.26, p = 0.132) and becomes strongly negative only in 2019–2025 (−0.59, p < 0.001), while the subsidy coefficient is negative in the middle window (−0.25, p = 0.039) and weakly positive in the final one. Two features of the measurement bound the interpretation. Policy intensity is a city-level attribute with only eight distinct values in the cooperation-active population, so the term compares cities rather than organisations and is estimated net of patent scale, university status and proximity. Additionally, because high non-subsidy intensity co-occurs with the largest and most internally connected city systems, the negative sign is most coherently read as an association between a diversified non-subsidy portfolio and locally self-contained rather than cross-city cooperation. We therefore treat H3a as unsupported and H3b as only weakly consistent with the data. (Figure 13 and Figure 14).
Figure 13.
Network evolution across the three cumulative observation windows. Node size scales with degree. The network expands from 30 organisations and 31 ties to 290 organisations and 274 ties while remaining fragmented: the number of connected components rises from 7 to 72. Each dot is an organisation and each connecting line a cooperation tie.
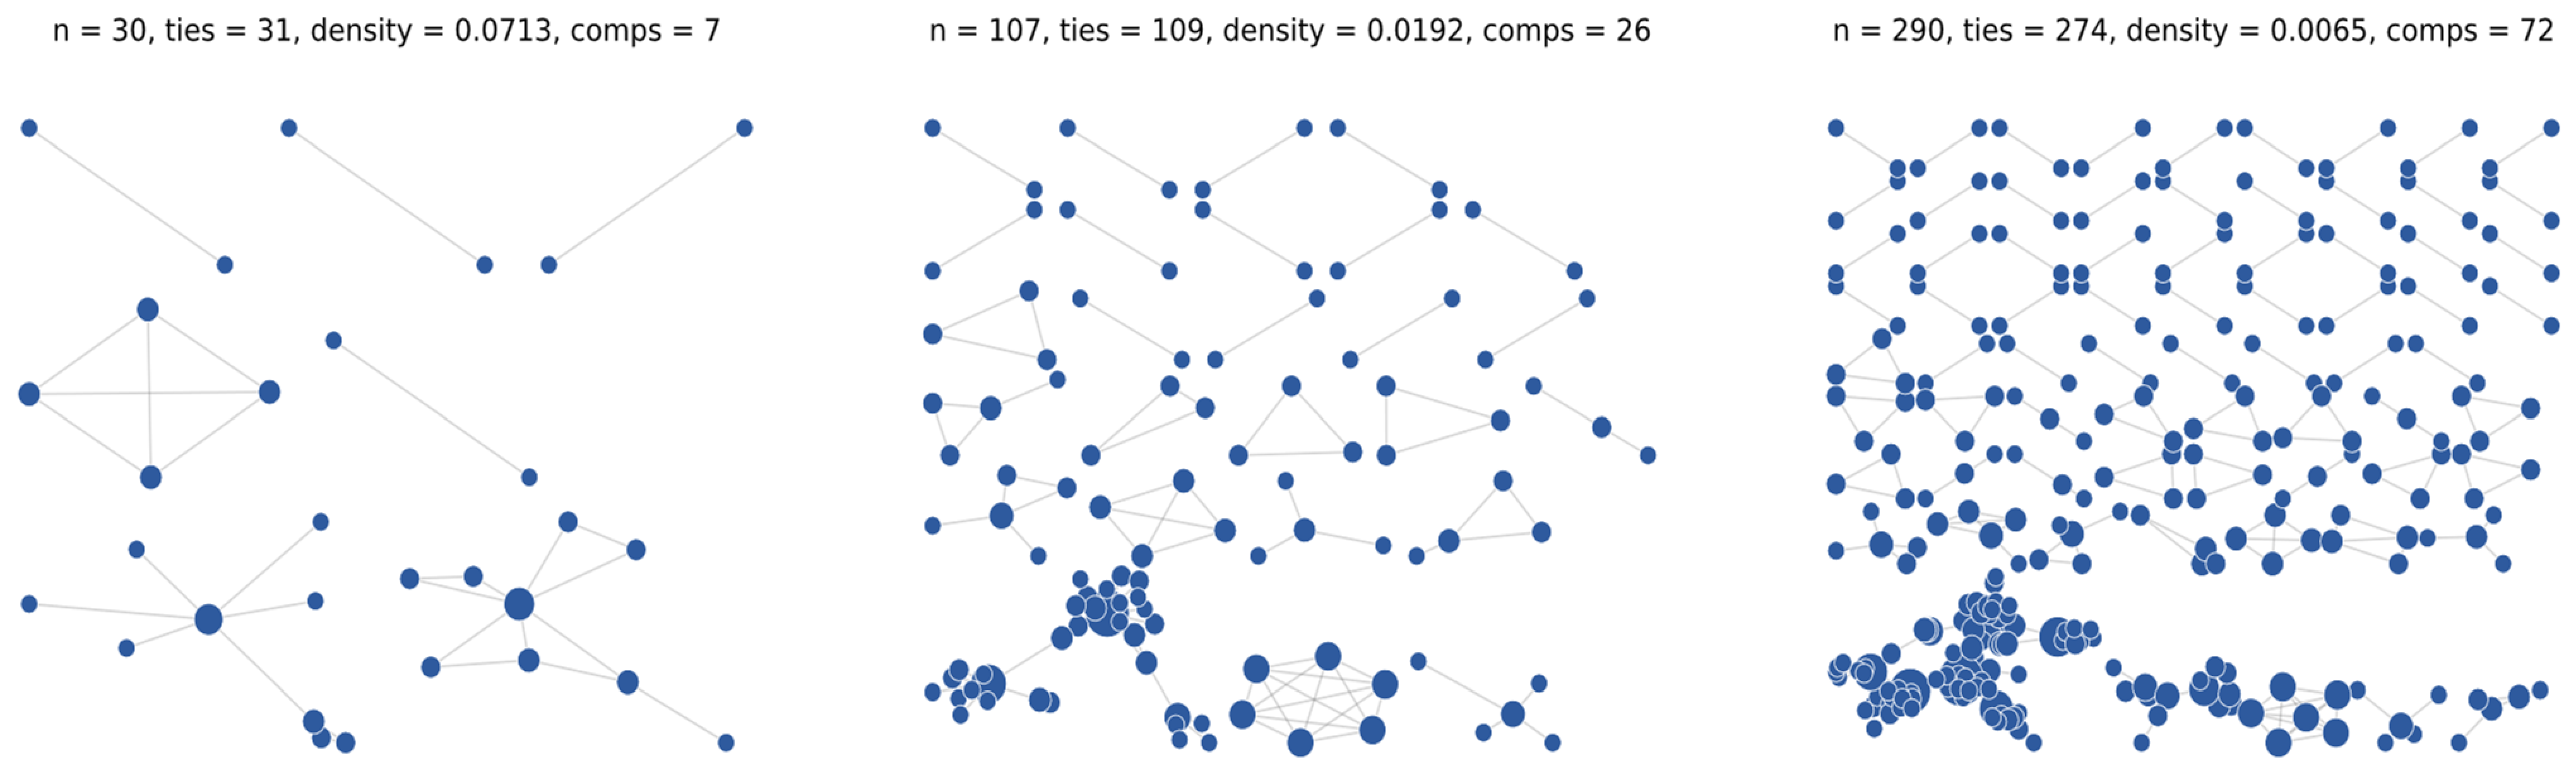
Figure 14.
Robustness of the key coefficients across the five alternative specifications of Table 3. The geographic-proximity and technological-distance coefficients retain their sign and significance throughout, and the non-subsidy coefficient is negative in every specification. B = baseline; (i) raw policy-document counts; (ii) cumulative 2014–2018 window; (iii) structural decay α = 0.25; (iv) ten heaviest ties removed; error bars show 95% confidence intervals.
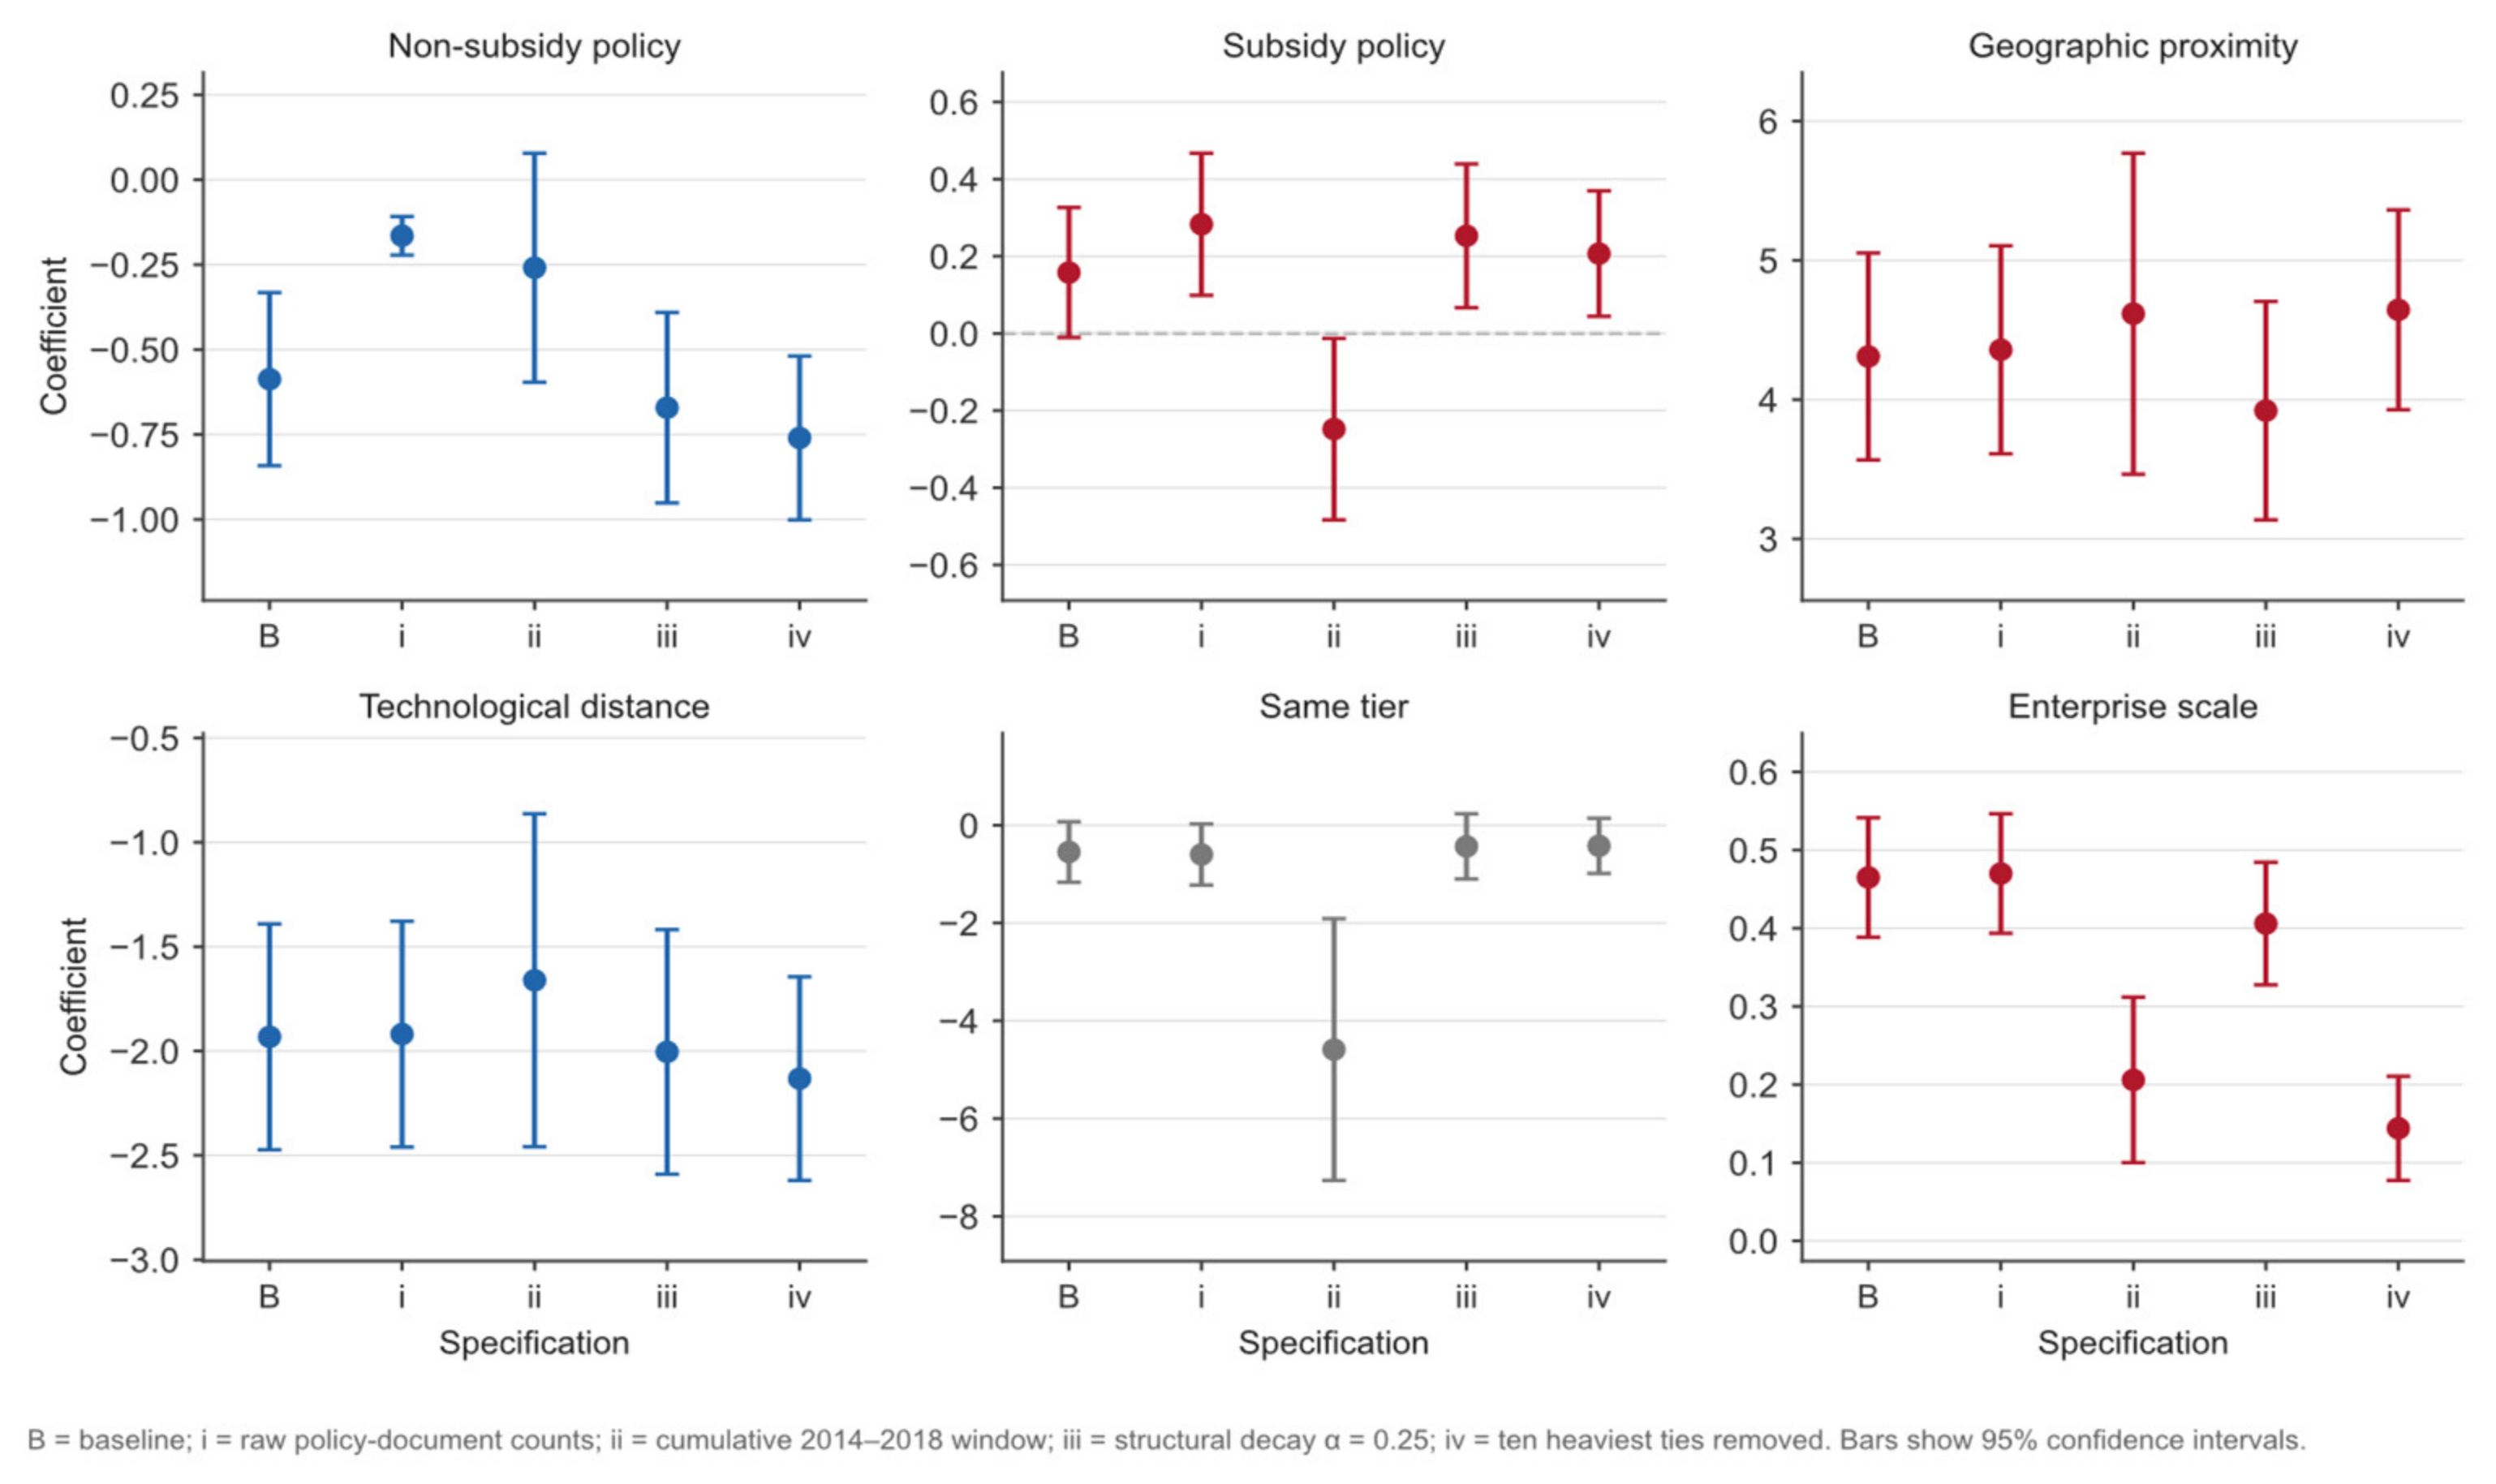
Table 3.
Robustness of the ERGM estimates across five alternative specifications. Cells report coefficients; *** p < 0.001, ** p < 0.01, * p < 0.05. Column (ii) reports the cumulative 2014–2018 window; all other columns use the cumulative 2019–2025 window.
4.4. Distinguishing Structural Change from an Expanding Observation Base
The growth of the network across windows raises an interpretive question that the aggregate statistics alone cannot settle: do the reported increases in density, clustering, and cross-tier cooperation reflect a genuine change in cooperation behaviour, or are they an artefact of the fact that the observed population itself expands from window to window? Two features of Table 1 indicate that the observed pattern is largely, though not entirely, an accounting consequence of the expanding observation base. First, the fall in density is accompanied by an essentially unchanged average degree (2.07, 2.04, 1.89): the network adds organisations and ties in near-equal proportion, which is what an expanding population that replicates its existing sparse structure would produce. Second, the share of organisations in the largest component is stable across all three windows (0.300, 0.318, 0.317) even as the number of components rises from 7 to 72, so the growing fragmentation visible in the raw counts is a scale effect rather than a change in the cohesion of the cooperating core. What does change is the internal reachability of the largest component: its average path length lengthens from 2.03 to 4.23, and its diameter grows from 3 to 10, which reflects the incorporation of more distant organisations rather than a weakening of existing relations.
These two patterns establish that the apparent decline in cohesion is not evidence of disengagement, but they do not licence a claim of strengthening cooperation either, because the windows are cumulative and therefore nested. Two further considerations bound the interpretation. The first is compositional. Part of the measured increase must arise because each successive window accumulates ties that were formed earlier, so the level of the final window describes the stock of cooperation observed over seventeen years rather than its current intensity. Comparisons across windows are therefore informative about the accumulation of cooperative relations, not about cooperation activity in each period taken separately. The second concerns the two channels through which accumulation can occur: incumbent pairs deepening their collaboration, and new and already connected organisations joining. The aggregate statistics reported in Table 1 cannot separate these channels. Doing so requires the structural statistics to be recomputed on the sub-network induced by the organisations observed in all three windows, which holds the observation base constant and isolates the behaviour of incumbent participants, and on the set of ties observed for the first time in each window, which isolates entry. The annual series in Figure 10 provides a first approximation to the second of these: new tie formation does not decline but fluctuates between 11 and 42 pairs per year after 2015, with its maximum in 2020, so entry remains active throughout the observation period.
Two conclusions follow, both of which qualify the findings of Section 4.2. The growth of the network is real, but it is growth without consolidation: no indicator in Table 1—density, clustering, component count, or largest-component share—shows the network becoming more integrated as it expands, and the stability of the largest-component share indicates that the topology has remained essentially self-similar while scaling by an order of magnitude. At the same time, the level statistics of the final window describe accumulated rather than current cooperation, and the decomposition of accumulation into deepening and entry is only partially achieved here. Claims about structural change in PRD NEV cooperation should therefore be made cautiously, and the finding that is best supported by the evidence is the persistence of a sparse, fragmented, highly modular structure across the whole observation period.
4.5. Robustness Analysis
We implemented five robustness checks, all reported in Table 3. (i) Replacing policy intensity with the raw count of non-subsidy documents leaves every substantive coefficient unchanged in sign, with the non-subsidy term remaining negative (−0.165, p < 0.001) and the subsidy term more clearly positive (0.283, p = 0.0025). (ii) Re-estimating the model separately on the two earlier cumulative windows (2009–2013 and 2014–2018) shows that the structural and proximity terms are stable in sign and approximate magnitude across all three windows, while the policy terms are insignificant in the first window and acquire their final signs only later—the temporal pattern reported in Section 4.3. (iii) Changing the decay parameter of the geometrically weighted structural terms from α = 0.5 to α = 0.25 and α = 1.0 changes the fit (AIC = 1268, 1457 and 1694 respectively) but leaves the sign and significance of every covariate unchanged. (iv) Dropping the ten heaviest ties—all of which are intra-group co-applications between legally distinct but economically related entities—leaves 264 ties and strengthens rather than weakens the results (non-subsidy −0.760, p < 0.001; geographic proximity 4.645; technological distance −2.132), confirming that the estimates are not driven by corporate-group artefacts. (v) Adding the lagged cooperation network as an edge covariate reduces the AIC to 918 and leaves every covariate coefficient in the same direction (non-subsidy −0.497, p = 0.004), although the lag term itself is imprecisely estimated under maximum pseudolikelihood (24.3, SE 481) because of quasi-complete separation in the sparse lag matrix. In addition, alternative Louvain resolution parameters (γ = 0.7 and γ = 1.3) yield Jaccard similarities of 0.89 and 0.83 with the baseline partition, indicating stable community assignments. The stability of the key coefficients across the five specifications is illustrated in Figure 14.
The five specifications agree on the substantive picture: geographic proximity and technological distance are the dominant, always-significant correlates of tie formation; same-tier alignment is never significant once proximity is controlled; the non-subsidy coefficient is negative in every specification; and subsidy intensity is, at most, weakly positive. Across the four same-scale specifications that use the log-intensity measure, the non-subsidy coefficient ranges from −0.549 to −0.760 around a baseline of −0.587, a spread comparable to the baseline standard error of 0.130, and no specification recovers a positive sign. The QAP regression reaches the same conclusion from the cross-sectional side. Vectorising the 41,905 dyads of the binary cooperation matrix, the model explains 1.5% of the dyadic variance (adjusted R2 = 0.015), and the low linear fit is a mechanical consequence of the extreme sparsity of the network rather than of weak covariate association: with only 274 ties among 41,905 dyads, a linear probability model cannot attain a high R2, and the corresponding logistic specification reaches a McFadden pseudo-R2 of 0.19. The conditional tie rates quantify the association directly—2.22% for dyads in the same locality against 0.09% for dyads in the most distant technological classes, a twenty-fivefold difference. In the permutation tests, geographic proximity and technological distance are significant at p < 0.001 and the scale difference between organisations at p = 0.096, whereas same-tier similarity (p = 0.202), both-listed status (p = 0.742), non-subsidy intensity (p = 0.186), and subsidy intensity (p = 0.292) are not. The QAP result therefore reinforces the ERGM finding on proximity and attributes and, importantly, does not support a positive cross-sectional association between non-subsidy intensity and cooperation, consistent with the ERGM estimates. (Figure 14).
The composition of the underlying entity base also shifts over the observation period: Figure 15 maps the spatiotemporal distribution of innovation entities across the nine cities and the three windows, with Shenzhen and Guangzhou increasing their shares.
Figure 15.
Spatiotemporal distribution of innovation entities across cities and time windows (2009–13, 2014–18, 2019–25). Shenzhen and Guangzhou increase their shares over time.
5. Discussion
5.1. Methodological Implications
The hybrid computational intelligence framework introduced here advances the methodological frontier of innovation-chain analytics in three ways. First, by chaining spatial, network, and temporal modules through a shared data backbone, it produces internally consistent estimates that respect each module’s assumptions. Spatial autocorrelation and density estimation deliver empirical rather than asserted geographic-proximity matrices, which are then directly fed into the network model. Second, the explicit use of hybrid CI [15,16,17] reduces the risk of model misspecification that often arises when a single paradigm (e.g., pure network analysis) is forced to bear the entire analytic load. Third, the framework is portable: each module has an open-source implementation, and the orchestrator is a thin Python/R glue layer. Future studies can swap individual modules (e.g., replace Louvain with Leiden or Infomap, or replace TERGM with a Bayesian structural time-series model) without redesigning the entire pipeline. The methodological gain is therefore not only about the present NEV study but about future comparative studies across regions and industries, where transferability of analytic pipelines is often the rate-limiting step.
5.2. Theoretical Implications
Theoretically, this paper refines three lines of inquiry. (i) On innovation agglomeration, the dual-core pattern reported here aligns with [4,23] but adds a quantitative LISA decomposition that distinguishes hotspots, cold spots, and spatial outliers, providing a more granular characterisation than a single global Moran’s I. The decomposition is deliberately conservative—only 19 of the 62 units reach significance at the 5% level, and none is a significant spatial outlier—which sharpens rather than dilutes the core–periphery contrast: the agglomeration is carried by a small number of units rather than diffused across the region. (ii) On network theory, the documented pattern of rapid growth without consolidation—near-constant average degree, a stable largest-component share and persistent fragmentation—complicates the “network-as-infrastructure” reading advocated by [9,22]: the cooperation system scales, but it does not thicken into an integrated infrastructure, and moderate clustering combined with long path lengths means that information must traverse many intermediaries to cross the network. (iii) On policy theory, the results qualify rather than confirm the prevailing reading of subsidy versus non-subsidy effectiveness [2,30]. Estimated on the cooperation-active layer and net of proximity, scale, and university status, non-subsidy intensity is negatively associated with tie formation in every specification and increasingly so over time, while subsidy intensity is at most weakly positive. This does not overturn the finding of [2] that non-subsidy instruments are associated with more durable patent generation; it shows that the durability of individual innovation and the breadth of inter-organisational cooperation are distinct outcomes that the same instrument can affect in opposite directions. Cities that have diversified their instrument portfolio are also, in this population, the cities whose cooperating organisations are most strongly localised, which is consistent with a reading in which non-subsidy instruments—standards, procurement rules, charging infrastructure—operate mainly within metropolitan boundaries, whereas cross-city cooperation depends on factors that no single municipal instrument portfolio can supply. We therefore separate the early-window and long-window associations explicitly and read them as evidence of a scope limitation of municipal policy rather than as evidence of instrument effectiveness.
Read through the lens of sustainable security [21], these findings acquire a second interpretation. Ivančík and Dušek argue that progress towards sustainability depends substantially on the resilience of economic, environmental, societal and institutional systems, and that these dimensions should be analysed jointly rather than as separate policy fields [21]. The PRD evidence presented here is consistent with that argument in three specific respects. First, the structural evolution of the network—rapid growth in participants without consolidation, a largest component that never exceeds about a third of the organisations, and 72 disconnected components by 2025—indicates that redundancy has not formed at the level of the regional cooperation system as a whole. The capacity to absorb the withdrawal of an individual partner or instrument exists inside the largest component, but for the majority of organisations cooperation rests on a single dyadic relation, which is the least resilient configuration a cooperative system can have. Second, the two instrument families carry different implications for the reversibility of the cooperation system, though not in the direction that the raw association alone would suggest. Subsidies are, by construction, a reversible input, and their coefficient is weak and unstable across windows, which is consistent with the absence of a durable governance effect. Non-subsidy instruments—standards, obligations, procurement rules—are the durable instruments, yet in this population they are associated with more locally self-contained rather than broader cooperation. The resilience-relevant reading is therefore not that one instrument family is superior but that the durability of the instruments currently in use is being spent within city boundaries: a policy mix that embeds obligations and standards without a cross-jurisdictional mechanism produces local robustness at the cost of regional redundancy, which is the configuration that the fragmentation statistics in Table 1 already describe. Third, the concentration of the network in a small group of universities and flagship firms is simultaneously an efficiency asset and a resilience liability, since the same hubs that accelerate knowledge diffusion constitute single points of failure if their cooperation is interrupted. Framing the PRD NEV chain in these terms converts a set of descriptive network statistics into a statement about the conditions under which an industrial transition remains viable under systemic uncertainty. We stress that this is an interpretive reading: the present design cannot measure resilience, and the argument is that the observed structure is consistent with the sustainable-security framework, not that it demonstrates it.
5.3. Smart Cities, Digital Infrastructure and the Regulatory Implementation Framework
NEV deployment is not only an industrial and environmental programme; it is also an urban and administrative one, and the results above bear on that dimension. Peráček and Kaššaj show that the operationalisation of smart-city objectives depends on effective public administration, digital connectivity and a legal framework capable of governing automated and data-driven urban systems, including the compliance requirements that accompany AI-based management [31]. NEV ecosystems depend on the same preconditions: smart charging networks require interoperable communication protocols and settlement rules across municipal and provincial boundaries; automated and connected vehicle services require spectrum, data-sharing, cybersecurity and liability arrangements; and vehicle-to-grid integration requires tariff structures and metering standards. In each case, the binding constraint is administrative and legal rather than technological [31], which means that a purely techno-economic account of NEV diffusion understates the preconditions of the cooperation measured here.
The PRD evidence speaks to three of these requirements. First, the dual-core pattern documented in Section 4.1 implies that the digital and charging infrastructure serving NEV cooperation is itself likely to be concentrated, which raises a coverage and equity question: if the administrative capacity that regulates charging, permits grid connection and certifies vehicles is concentrated in Guangzhou and Shenzhen, peripheral cities face a double disadvantage, lacking both the cooperating organisations and the regulatory capacity to attract them. The spillover-canals argument developed in Section 5.4 therefore has an administrative as well as an economic component, because inter-city harmonisation of charging standards, permit procedures and data-sharing rules is a precondition for the cooperation that the geographic-proximity coefficient describes. Second, the centrality of universities and provincial engineering R&D centres in the cooperation network identifies an under-used interface between the innovation system and public administration. These organisations already function as boundary-spanning intermediaries within the network, and the same convening capacity and facilities could be used to operate the testbeds, regulatory sandboxes and standards working groups through which frameworks for automated mobility are typically developed. Third, the evidence on non-subsidy instruments is more cautionary than the earlier literature implies. The re-estimated coefficients associate non-subsidy intensity with weaker rather than stronger tie formation, and the association is concentrated in the most recent window. Read alongside the proximity results, the most plausible reading is one of jurisdictional scope: dual-credit obligations, technical standards, interoperability rules and public procurement requirements are durable because they do not require continued fiscal commitment, but in the PRD they are designed and administered municipality by municipality, and the cooperation they support is correspondingly local. If the administrative layer is to do the durable work that [31] describes, it needs a cross-jurisdictional instrument—harmonised charging standards, mutual recognition of permits, shared data rules—that no single municipal portfolio currently contains. For the PRD, this implies that investment in the administrative and digital layer of the NEV ecosystem should be treated as innovation policy in its own right rather than as infrastructure that follows once the technology is in place. The caveat of Section 3.5 applies: these are policy implications of conditional associations, and the administrative mechanisms proposed here are hypotheses for evaluation rather than demonstrated effects.
5.4. Practical Implications for the PRD
For PRD policymakers, the results support four recommendations of deliberately different strength, and we calibrate each to the evidence behind it rather than presenting them as equally established.
First, and most strongly supported, the priority for spatial policy is to make existing proximity usable rather than to pursue further concentration. The dual-core pattern is confirmed by a global Moran’s I of 0.538 and by a LISA decomposition that locates 5 high-high units in Shenzhen against 14 low-low units in the western and northern periphery, and the exponential random graph model identifies geographic proximity as a positive and significant correlate of cooperation (Table 2). The natural instruments are therefore not new incentives but the removal of frictions that prevent proximity from being exploited: harmonisation of charging and grid-connection standards across the nine municipalities, mutual recognition of municipal NEV incentives, and shared access to testing and certification facilities located in the core. Because these measures operate mainly on administrative barriers and are correspondingly low in cost, they are proportionate to evidence that is descriptive and associational rather than experimental.
Second, and supported by the centrality results, support should be directed at the intermediaries identified by the network rather than spread across the population of firms. The centrality and structural-hole analyses converge on universities as the organisations that bridge otherwise disconnected communities, and eight of the ten organisations in the PageRank top ten also appear in the structural-hole top ten. A set of this size makes a targeted instrument administratively feasible: competitive grants for joint laboratories and shared equipment platforms that require at least one partner from the technology R&D tier and one from the industrialisation tier, renewable only on documented cross-tier activity. The evidence base here is firmer than a ranking alone would provide, because the same organisations are the endpoints of the cross-tier ties counted by the tier-coherence indicator, so their prominence rests on two independent measurements.
Third, and most cautiously, the policy-mix evidence in this paper no longer supports the recommendation to shift instrument portfolios from transfers towards obligations and standards on the ground that non-subsidy instruments build cooperation. Re-estimated on the cooperation-active layer, the non-subsidy coefficient is negative in every specification and the subsidy coefficient weakly positive, and the original expectation is not recoverable from the data. What the estimates do support is narrower and directional: municipal non-subsidy portfolios are associated with locally contained rather than regionally distributed cooperation, so an instrument-mix argument that rests on cooperation breadth requires a cross-jurisdictional component—jointly administered standards, mutual recognition and shared procurement—rather than a substitution of one municipal instrument for another. Where a subsidy is retained, attaching it to verifiable joint activity such as co-applied patents or jointly operated testbeds remains defensible on the separate ground that it makes the transfer conditional on the relation it is meant to build; however, we no longer present this as a comparison of instrument effectiveness, because the present design cannot identify one.
Fourth, and least supported by the present evidence, the peripheral cities cannot expect to attract NEV cooperation through conventional inducements. Their low-low LISA status and the absence of any significant high-low outlier inside the core indicate that they function as recipients rather than poles, and the framework developed here provides no evidence on what would change this. Any intervention in these cities should therefore be designed as a pilot with explicit evaluation, and we refrain from prescribing its content. Two caveats govern all four recommendations: they describe the cooperation-active, patent-intensive layer of the ecosystem rather than the whole of it, and they rest on conditional associations rather than identified causal effects. They should be read as a prioritisation of directions that the evidence supports over directions it does not, and as hypotheses for evaluation rather than as conclusions to be implemented without monitoring.
5.5. Limitations and Future Research
This study has three primary limitations that open avenues for future work. First, although patent cooperation is a well-validated proxy for formal R&D linkage in innovation research, it does not capture informal cooperation such as equipment sharing, personnel exchange, and contract research. Future work should triangulate patent data with procurement records, conference co-attendance, and digital-trace data to paint a more complete picture. Such triangulation would be feasible in the Chinese setting given the growing availability of public procurement records and academic conference proceedings. Second, the static spatial weights matrix used here does not reflect emerging high-speed rail and 5G connectivity; temporally varying weights may yield more accurate geographic-proximity effects, especially in a region where the Guangzhou–Shenzhen–Hong Kong high-speed rail and the cross-sea bridge have fundamentally reorganised inter-city relationships. Third, the network specification assumes structural stationarity, which may be violated when disruptive technologies (e.g., solid-state batteries, autonomous driving, hydrogen fuel cells) reshape cooperation patterns. A piecewise specification with breakpoint detection, or a Bayesian structural time-series model, could better capture regime shifts. Beyond these methodological frontiers, the framework could also be extended to other emerging-industry innovation chains—biomedicine, integrated circuits, and offshore wind power—where similar multi-tier actor structures and policy-mix dynamics are likely to obtain.
Two further limitations follow directly from the design and qualify the scope of the findings. The first concerns representativeness. The cooperation network is built from formal co-patenting and therefore describes the patent-intensive layer of the PRD NEV innovation chain rather than the ecosystem as a whole. The cooperating organisations are a small fraction of the 4036 identified entities, and the composition of the network is skewed relative to the list: universities and new-type R&D institutions are strongly over-represented, high-tech enterprises modestly so, and technology-based SMEs strongly under-represented. The network statistics reported in Section 4 should consequently be read as accurate descriptions of that layer and as evidence about, rather than direct estimates of, the wider ecosystem. Whether the dual-core pattern, the fragmented structure and the centrality of universities extend to firms that innovate without co-patenting is an empirical question the present data cannot answer, because observing supplier networks, technology licensing, contract research and talent mobility would require a different data infrastructure and a different unit of observation. Future work could also triangulate co-patenting with trademark co-filings, standard-setting participation, and public procurement consortia, each of which captures a different layer of cooperation and would allow the layer-specific findings reported here to be tested for generality.
The second concerns causal interpretation. As set out in Section 3.5, the policy coefficients are conditional associations estimated within a temporal model that narrows but does not close the identification gap; the possibility that policy responds to innovation performance cannot be excluded with the present design. The most promising routes to identification would be a regression discontinuity design exploiting the thresholds used in subsidy-eligibility rules, which generate discontinuous variation in treatment intensity among otherwise similar applicants, or firm-level panel data on the decision to cooperate, which would allow the network terms to be related to observed choices rather than to realised ties. Neither is available here, and we therefore present the policy results as regularities that require such designs before they can support unconditional policy prescriptions.
6. Conclusions
This study set out to answer three questions about the Pearl River Delta NEV innovation chain: how it is spatially organised, what structure its cooperation network takes and how that structure evolves, and how subsidy-based and non-subsidy-based policy instruments are associated with cooperation once spatial, technological and organisational factors are held constant. To address them, it proposed a hybrid computational intelligence framework that integrates kernel density estimation, spatial autocorrelation analysis, social network analysis, Louvain community detection, QAP regression and exponential random graph modelling across cumulative observation windows into a single reproducible pipeline, and applied it to 4036 innovation entities, 1260 co-applied NEV patents yielding 274 cooperating pairs among 290 organisations, and 187 central-, provincial-, and municipal-level policy documents issued between 2009 and 2025. Four findings emerge. (i) The chain exhibits a pronounced dual-core, core-periphery agglomeration centred on Shenzhen and Guangzhou, confirmed by a global Moran’s I of 0.538 and by a LISA decomposition comprising 5 high-high units in Shenzhen and 14 low-low units in the periphery. (ii) The cooperation network expands rapidly but does not consolidate: cooperating organisations grow from 30 to 290 and cooperating pairs from 31 to 274 across the three cumulative windows, while density falls from 0.071 to 0.007, disconnected components rise from 7 to 72, and the share of organisations in the largest component stays close to one third. (iii) The network is sparse, highly modular, and anchored by universities, which hold the six leading PageRank positions; among the ties that can be typed on both ends, 41.4% connect different tiers, and universities mediate eight of the twelve cross-tier ties. (iv) Geographic proximity and technological distance are the dominant and always-significant correlates of cooperation, while same-tier alignment is not significant once proximity is controlled; and, contrary to expectation, non-subsidy policy intensity is negatively associated with tie formation (β = −0.59, p < 0.001), with the association strengthening across successive windows, whereas subsidy intensity is only weakly positive (β = 0.16, p = 0.067). This pattern survives five alternative specifications and is consistent with the cross-sectional QAP results, and we read it as evidence of the municipal scope of non-subsidy instruments rather than of their ineffectiveness.
Three qualifications bound these conclusions. The cooperation network describes the patent-intensive layer of the ecosystem rather than the ecosystem as a whole, so the findings are statements about that layer. The policy estimates are conditional associations rather than identified causal effects. Additionally, because the observation windows are cumulative, the growth they record combines behavioural change with the accumulation of ties over a growing observation base, a mixture that Section 4.4 begins to decompose but does not fully resolve. Within those bounds, this study contributes a reusable analytical template for innovation-chain research, a refinement of the multi-dimensional proximity perspective in which proximity is estimated from the data rather than asserted, and an evidence base for a policy mix weighted towards instruments that do not depend on continued fiscal commitment. Three extensions follow directly. Extending the framework to other emerging-industry chains such as biomedicine, integrated circuits and offshore wind would test the portability of the pipeline. Triangulating co-patenting with licensing, procurement and mobility data would allow the layer-specific findings reported here to be checked against other forms of cooperation. Additionally, designs that exploit discontinuities in policy eligibility, or that observe firm-level cooperation decisions, would allow the associational results documented here to be tested as causal mechanisms.
Author Contributions
Conceptualization, Z.J.; Methodology, Z.J.; Software, Z.J.; Validation, Z.J.; Formal analysis, Z.J.; Investigation, Z.J.; Resources, Z.J.; Data curation, Z.J.; Writing – original draft, Z.J.; Writing – review & editing, Z.J. and Z.Z.; Visualization, Z.Z.; Supervision, Z.Z.; Project administration, Z.Z.; Funding acquisition, Z.Z. All authors have read and agreed to the published version of the manuscript.
Funding
This research was funded by the National Key R&D Program of China (grant number 2022YFC3800103), Ministry of Science and Technology of the People’s Republic of China.
Institutional Review Board Statement
Not applicable.
Informed Consent Statement
Not applicable.
Data Availability Statement
The cleaned analytical datasets generated and analysed in this study—the innovation entity table (n = 4036), the patent-based cooperation table (1943 co-application records yielding 274 distinct ties among 290 organisations) and the policy-text coding table (187 documents)—are openly available in Science Data Bank (ScienceDB) at https://doi.org/10.57760/sciencedb.012kq (accessed on 13 October 2026), together with the derived spatial-analysis outputs for the 62 analysis groups (unit-level entity and patent counts, global and local Moran’s I statistics with LISA cluster categories, and the kernel-density peaks and contiguous high-density cores), a README describing all fields, and the reproducible Python 3.13.12 and R 4.5.2 scripts.
Conflicts of Interest
The authors declare no conflicts of interest. The funders had no role in the design of this study; in the collection, analysis, or interpretation of data; in the writing of the manuscript; or in the decision to publish the results.
References
- Tian, J.; Wang, P.; Zhu, D. Overview of Chinese new energy vehicle industry and policy development. Green Energy Resour. 2024, 2, 100075. [Google Scholar] [CrossRef] [Scilit]
- Qin, S.; Xiong, Y. Differences in the innovation effectiveness of China’s new energy vehicle industry policies: A comparison of subsidized and non-subsidized policies. Energy 2024, 304, 132151. [Google Scholar] [CrossRef] [Scilit]
- OECD. Oslo Manual 2018: Guidelines for Collecting, Reporting and Using Data on Innovation, 4th ed.; OECD Publishing: Paris, France, 2018. [Google Scholar] [CrossRef] [Scilit]
- Cao, L. Spatial distribution patterns and influencing factors of China’s new energy vehicle industry. J. Clean. Prod. 2022, 379, 134641. [Google Scholar] [CrossRef] [Scilit]
- Du, Y.; Wang, Q.; Song, Y.; Xin, Y. How cross-regional collaborative innovation networks affect regional economic resilience: Evidence from 283 cities in China. Technol. Forecast. Soc. Change 2025, 215, 124057. [Google Scholar] [CrossRef] [Scilit]
- Dua, R.; Almutairi, S.; Bansal, P. Emerging energy economics and policy research priorities for enabling the electric vehicle sector. Energy Rep. 2024, 12, 1836–1847. [Google Scholar] [CrossRef] [Scilit]
- Martinez, N.; Terrazas-Santamaria, D. Beyond nearshoring: The political economy of Mexico’s emerging electric vehicle industry. Energy Policy 2024, 195, 114385. [Google Scholar] [CrossRef] [Scilit]
- Sarasini, S. Electrifying the automotive industry: The geography and governance of R&D collaboration. Environ. Innov. Soc. Transit. 2014, 13, 109–128. [Google Scholar] [CrossRef] [Scilit]
- Li, X.; Zhang, Y.; Zhou, S.; Zhao, Z.; Zhao, Y. Exploration and future trends on spatial correlation of green innovation efficiency in strategic emerging industries under the digital economy: A social network analysis. J. Environ. Manag. 2024, 359, 121005. [Google Scholar] [CrossRef] [Scilit] [PubMed]
- Ren, M.; Zhou, T.; Wang, C. New energy vehicle innovation network, innovation resources agglomeration externalities and energy efficiency: Navigating industry chain innovation. Technol. Forecast. Soc. Change 2024, 200, 123114. [Google Scholar] [CrossRef] [Scilit]
- Wang, X.Y.; Chen, B.; Hou, N.; Chi, Z.P. Evolution of structural properties of the global strategic emerging industries’ trade network and its determinants: A TERGM analysis. Ind. Mark. Manag. 2024, 118, 121–135. [Google Scholar] [CrossRef] [Scilit]
- Chen, Y.; Ni, L.; Liu, K. Innovation efficiency and technology heterogeneity within China’s new energy vehicle industry: A two-stage NSBM approach embedded in a three-hierarchy meta-frontier framework. Energy Policy 2022, 161, 112780. [Google Scholar] [CrossRef] [Scilit]
- Krackhardt, D. QAP partialling as a test of spuriousness. Soc. Netw. 1987, 9, 171–186. [Google Scholar] [CrossRef] [Scilit]
- Ma, M.; Meng, W.; Li, Y. Impact of dual credit policy on new energy vehicles technology innovation with information asymmetry. Appl. Energy 2023, 332, 120524. [Google Scholar] [CrossRef] [Scilit]
- Bhattacharyya, S.; Snásel, V.; Gupta, D.; Khanna, A. Hybrid Computational Intelligence: Challenges and Applications; Academic Press: London, UK, 2020. [Google Scholar] [CrossRef] [Scilit]
- Malsagov, B.; Ketova, F.; Makienko, D. Evolvement of artificial intelligence and hybrid methods for modeling and optimization in complex systems. ITM Web Conf. 2025, 72, 01004. [Google Scholar] [CrossRef] [Scilit]
- Gwabavu, M.; Bansal, R.C.; Bryce, A. Hybrid Intelligent Optimisation for Onshore Wind Farm Forecasting. Smart Grids Sustain. Energy 2025, 10, 65. [Google Scholar] [CrossRef] [Scilit]
- Wen, B.; Liu, F. The evolution and configuration mechanism of spatial correlation network in China’s innovation ecosystem. Environ. Technol. Innov. 2025, 38, 104157. [Google Scholar] [CrossRef] [Scilit]
- Liu, Y.; Shao, X.; Tang, M.; Lan, H. Spatio-temporal evolution of green innovation network and its multidimensional proximity analysis: Empirical evidence from China. J. Clean. Prod. 2021, 283, 124649. [Google Scholar] [CrossRef] [Scilit]
- Leifeld, P.; Cranmer, S.J.; Desmarais, B.A. Temporal Exponential Random Graph Models (TERGMs). In The Oxford Handbook of Political Networks; Oxford University Press: Oxford, UK, 2018; pp. 481–508. [Google Scholar]
- Ivančík, R.; Dušek, J. From Sustainable Development to Sustainable Security: Reframing the Security–Sustainability Nexus. Sustainability 2026, 18, 8517. [Google Scholar] [CrossRef] [Scilit]
- Liu, Q.; Chen, R.; Yu, Q. Improving sustainable performance of China’s new energy industry through collaborative innovation network resilience. Renew. Sustain. Energy Rev. 2024, 201, 114625. [Google Scholar] [CrossRef] [Scilit]
- Wang, H.; Dai, J.; Wei, H.; Lu, Q. Understanding technological innovation and evolution of energy storage in China: Spatial differentiation of innovations in lithium-ion battery industry. J. Energy Storage 2023, 66, 107307. [Google Scholar] [CrossRef] [Scilit]
- Li, Y.; Zhou, B. The spatial-temporal evolution characteristics and influencing factors of the coupling between the industrial chain and innovation chain in China. Sustain. Futur. 2024, 7, 100366. [Google Scholar] [CrossRef] [Scilit]
- Freeman, L.C. Centrality in social networks conceptual clarification. Soc. Netw. 1978, 1, 215–239. [Google Scholar] [CrossRef] [Scilit]
- Page, L.; Brin, S.; Motwani, R.; Winograd, T. The PageRank Citation Ranking: Bringing Order to the Web; Stanford InfoLab: Stanford, CA, USA, 1999; Technical Report 1999–1966. [Google Scholar]
- Burt, R.S. Structural holes and good ideas. Am. J. Sociol. 2004, 110, 349–399. [Google Scholar] [CrossRef] [Scilit] [PubMed]
- Blondel, V.D.; Guillaume, J.L.; Lambiotte, R.; Lefebvre, E. Fast unfolding of communities in large networks. J. Stat. Mech. Theory Exp. 2008, 2008, P10008. [Google Scholar] [CrossRef] [Scilit]
- Jaccard, P. Étude comparative de la distribution florale dans une portion des Alpes et des Jura. Bull. Soc. Vaud. Sci. Nat. 1901, 37, 547–579. [Google Scholar]
- Wang, X.; Xiong, Z.; Li, X.; Xiong, Y. How do non-subsidized incentives affect enterprises’ innovation choices? A case from the new energy vehicle industry in China. Technol. Forecast. Soc. Change 2024, 204, 123445. [Google Scholar] [CrossRef] [Scilit]
- Peráček, T.; Kaššaj, M. The Impact of Effective Public Administration and European Digital Connectivity on Building Smart Cities: An Analysis of Legal Frameworks, Policy Initiatives and Transformative Impact in the Emerging Era of Artificial Intelligence. Jurid. Trib.-Rev. Comp. Int. Law 2025, 15, 720–745. [Google Scholar] [CrossRef] [Scilit]
- Silverman, B.W. Density Estimation for Statistics and Data Analysis; Chapman & Hall/CRC: London, UK, 1986. [Google Scholar] [CrossRef] [Scilit]
- Anselin, L. Local Indicators of Spatial Association—LISA. Geogr. Anal. 1995, 27, 93–115. [Google Scholar] [CrossRef] [Scilit]
- Moran, P.A.P. Notes on continuous stochastic phenomena. Biometrika 1950, 37, 17–23. [Google Scholar] [CrossRef] [Scilit]
- Hunter, D.R.; Goodreau, S.M.; Handcock, M.S. Goodness of fit of social network models. J. Am. Stat. Assoc. 2008, 103, 248–258. [Google Scholar] [CrossRef] [Scilit]
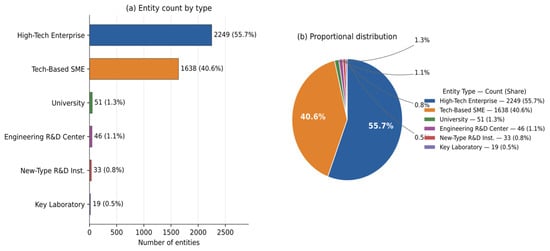
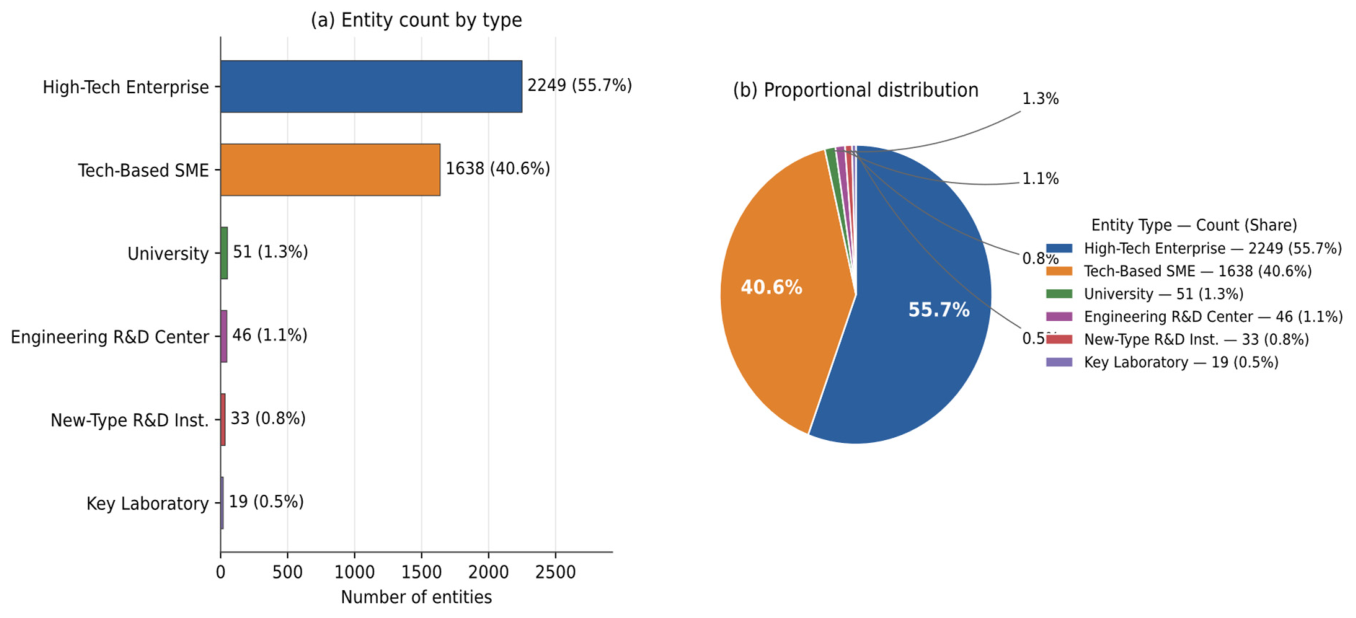
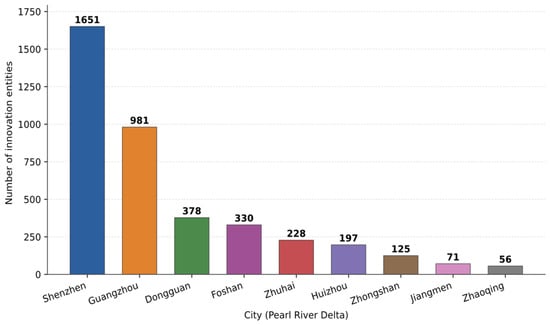
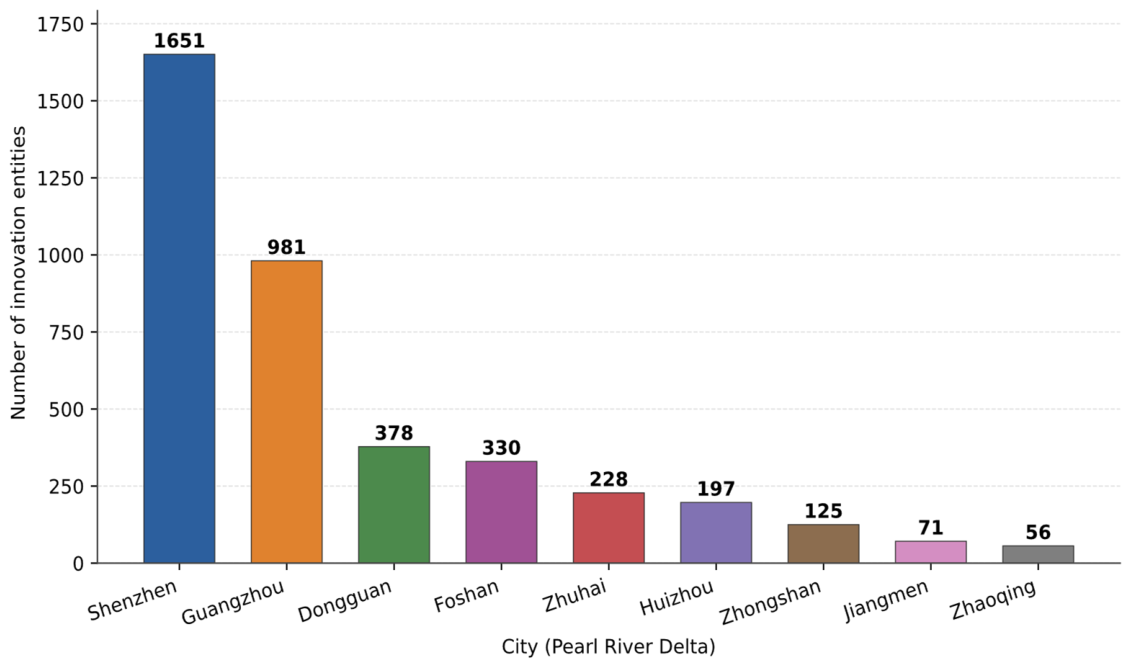
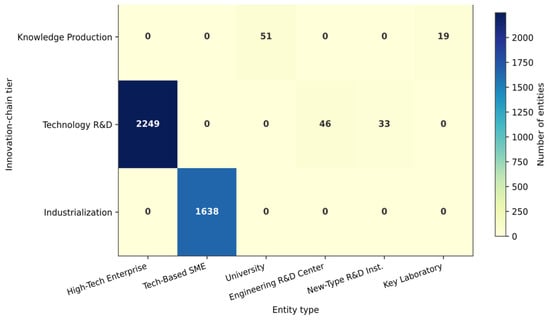
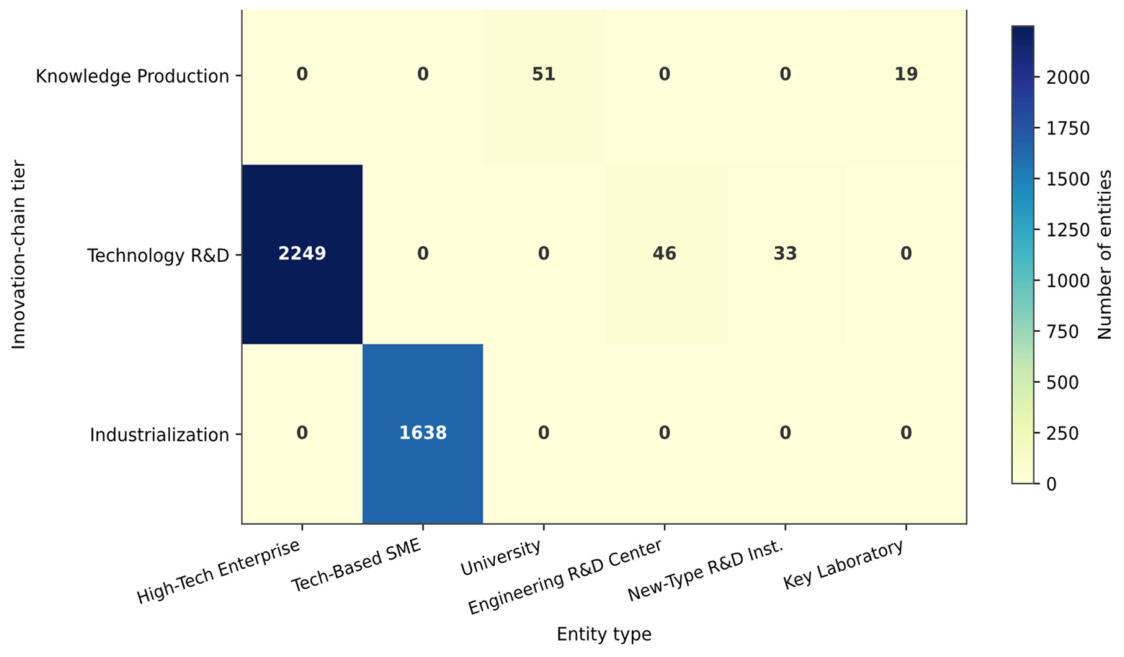
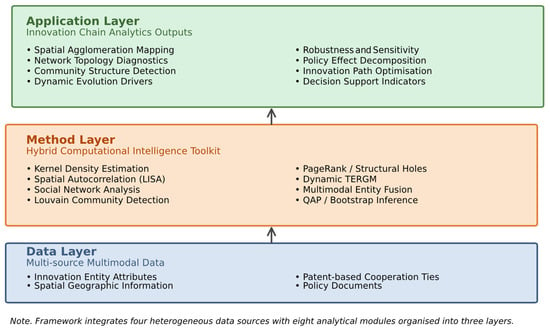
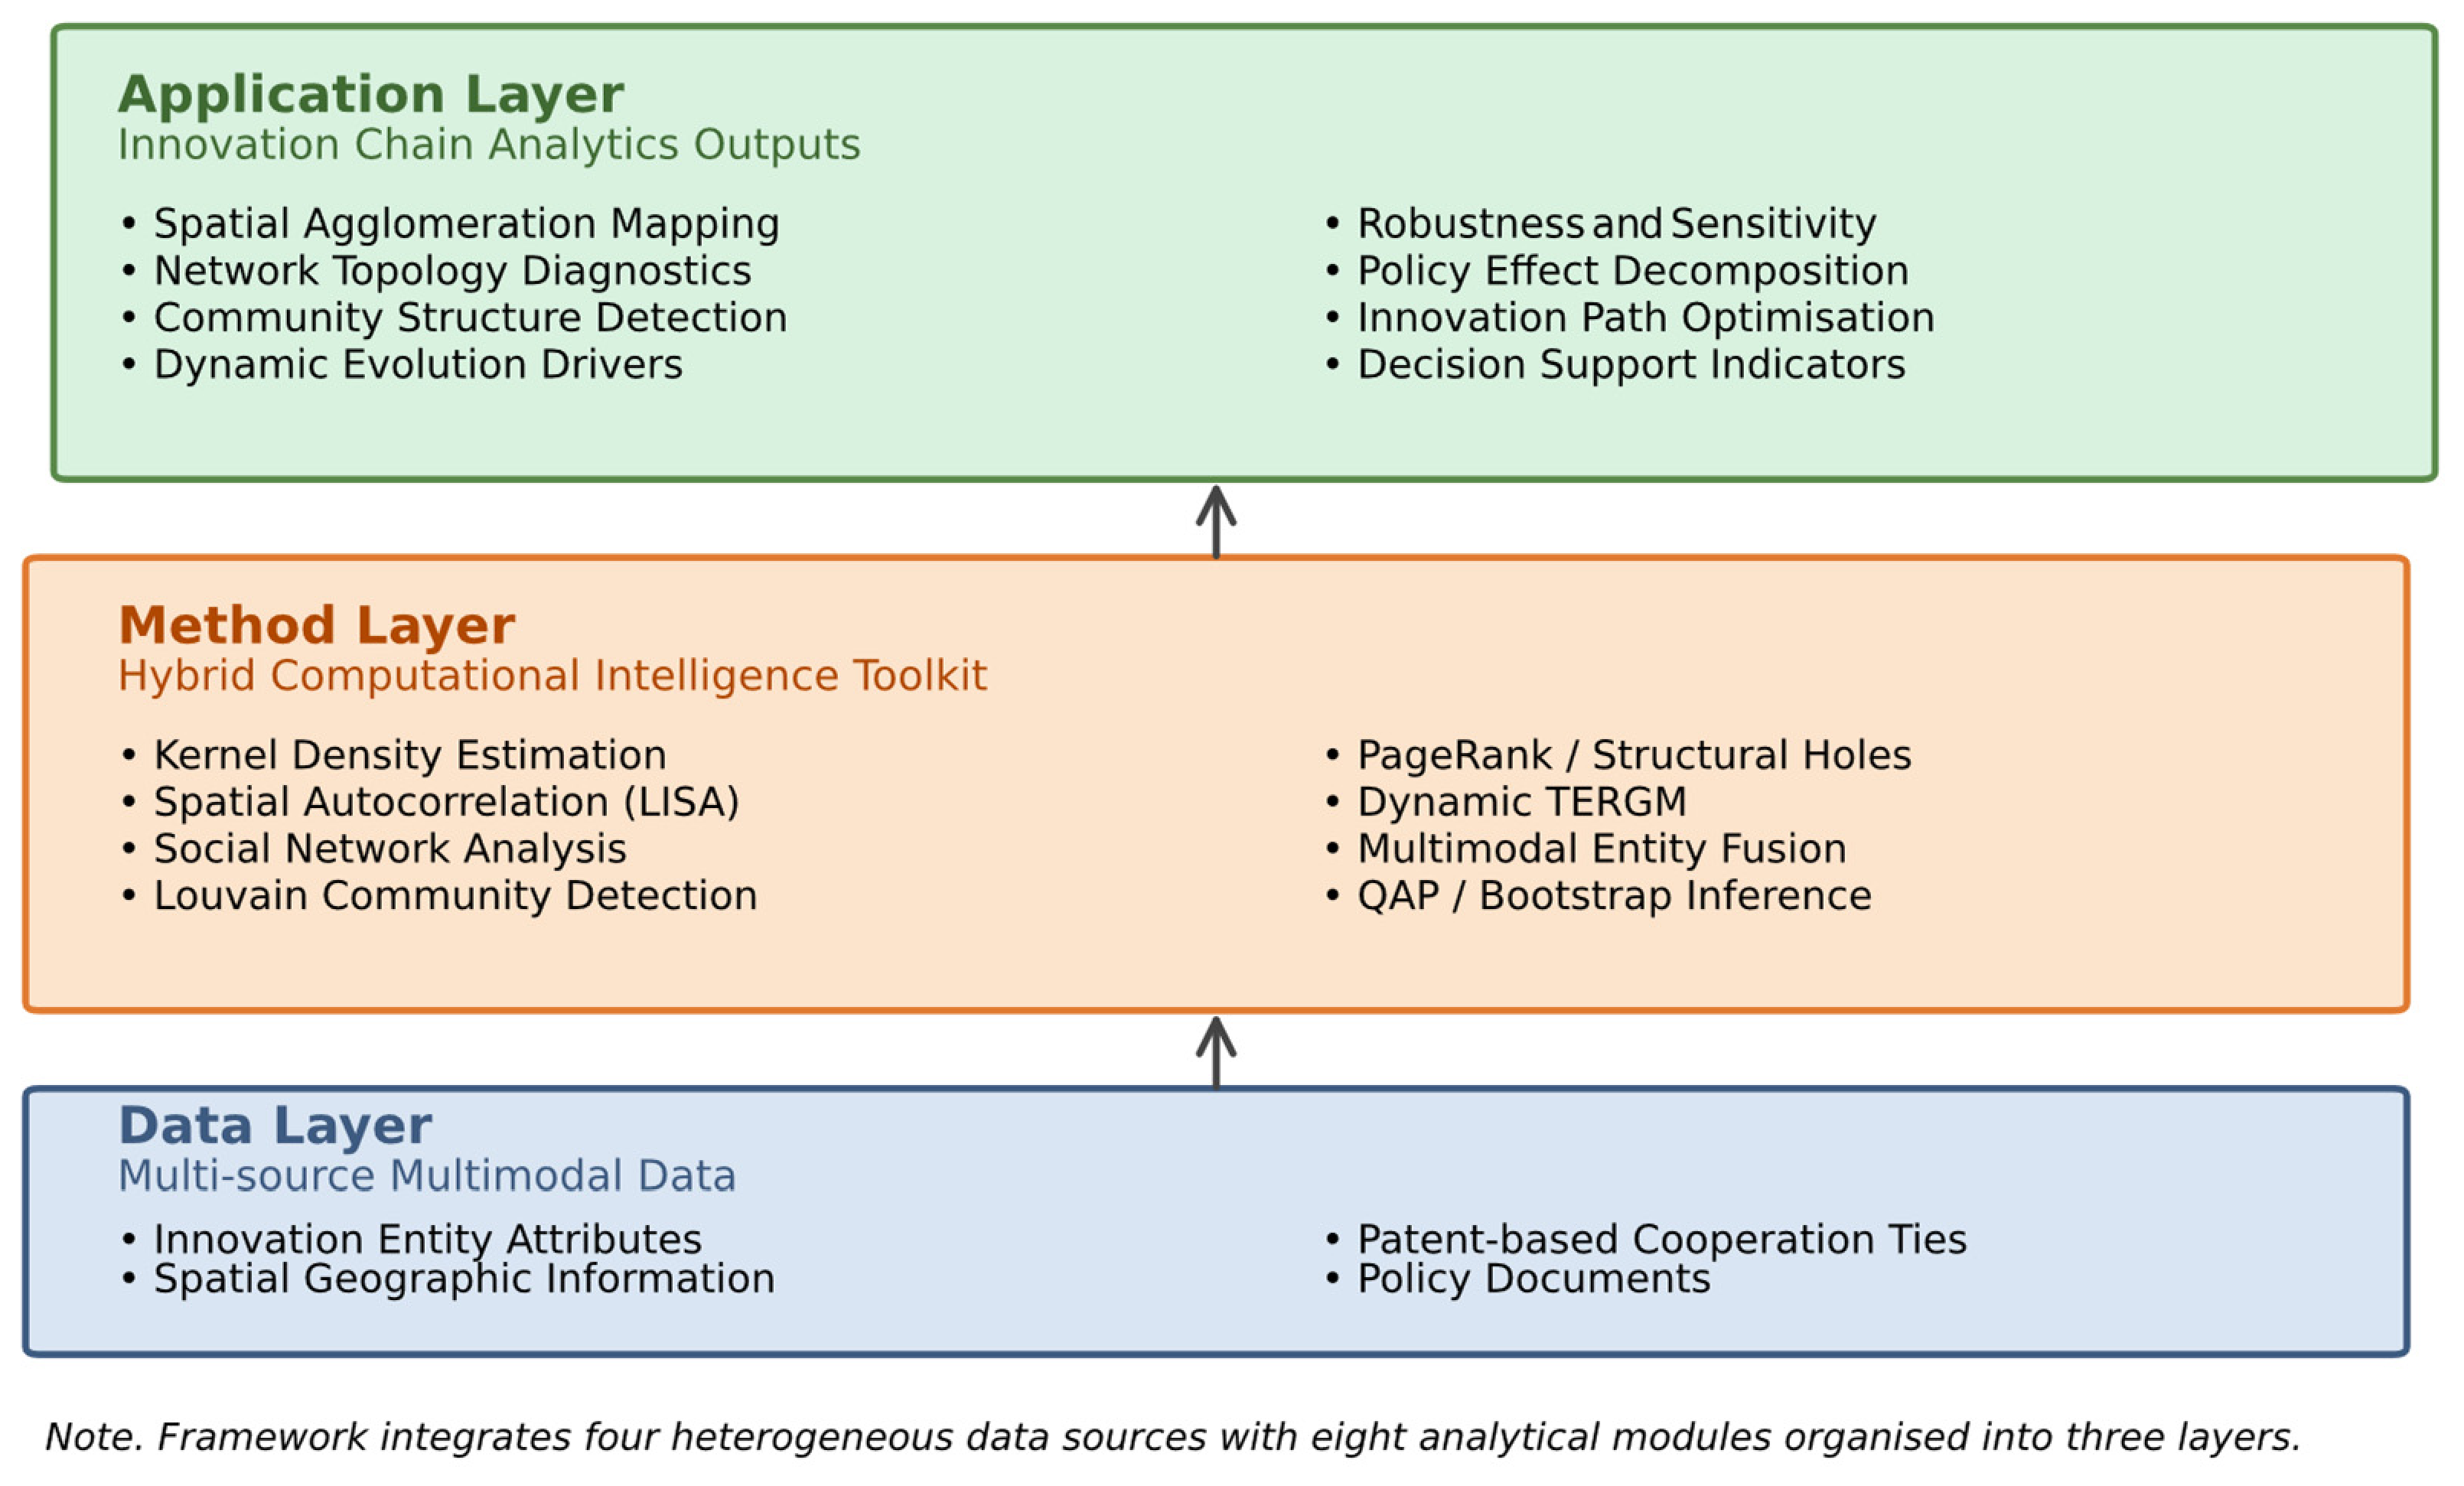
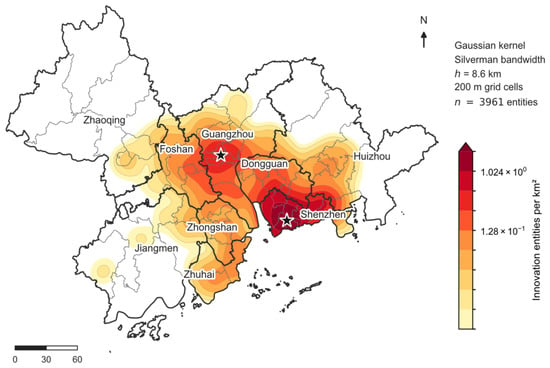
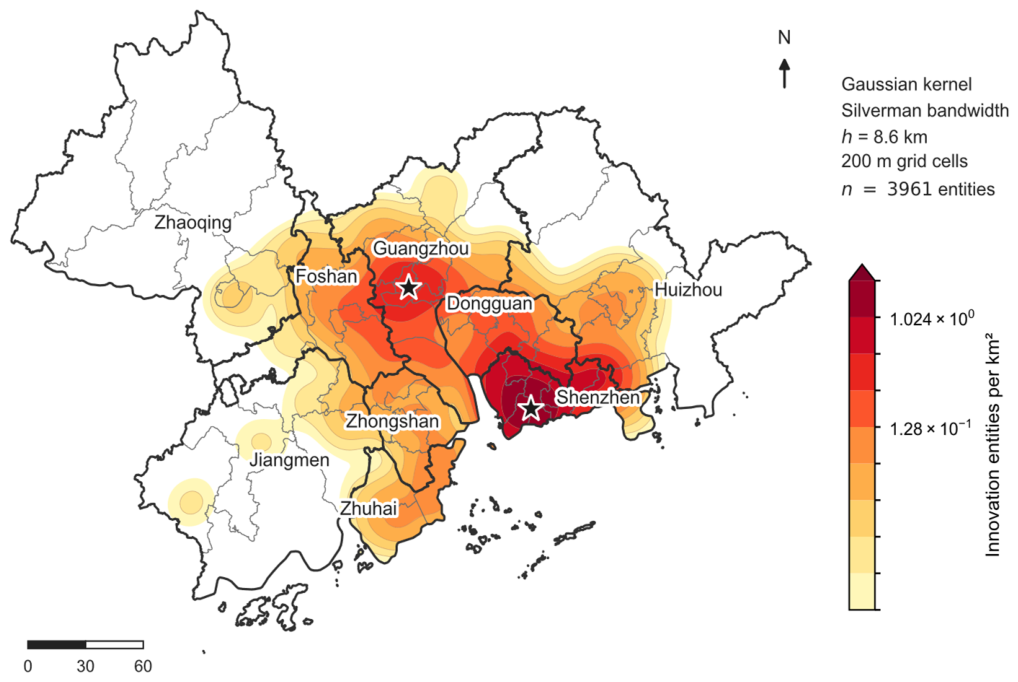
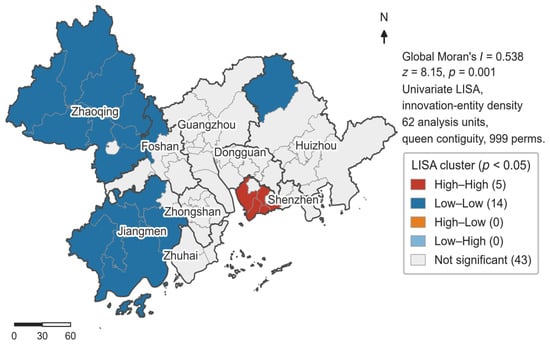
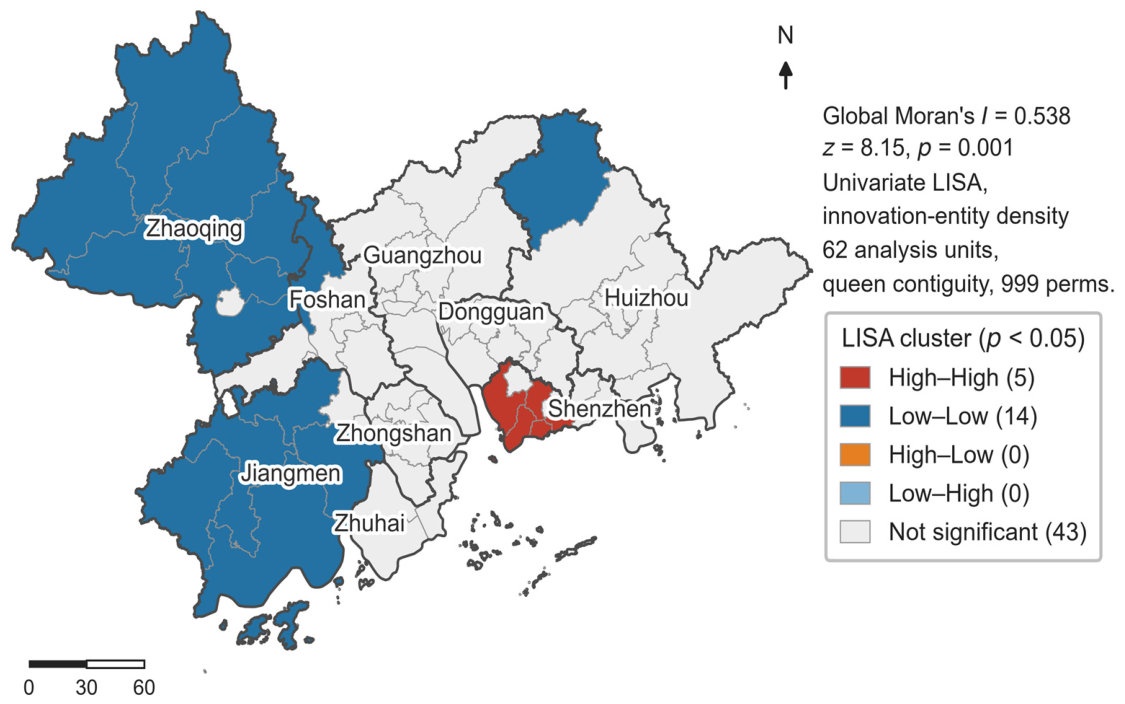
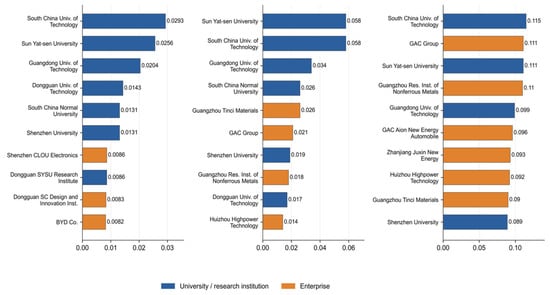
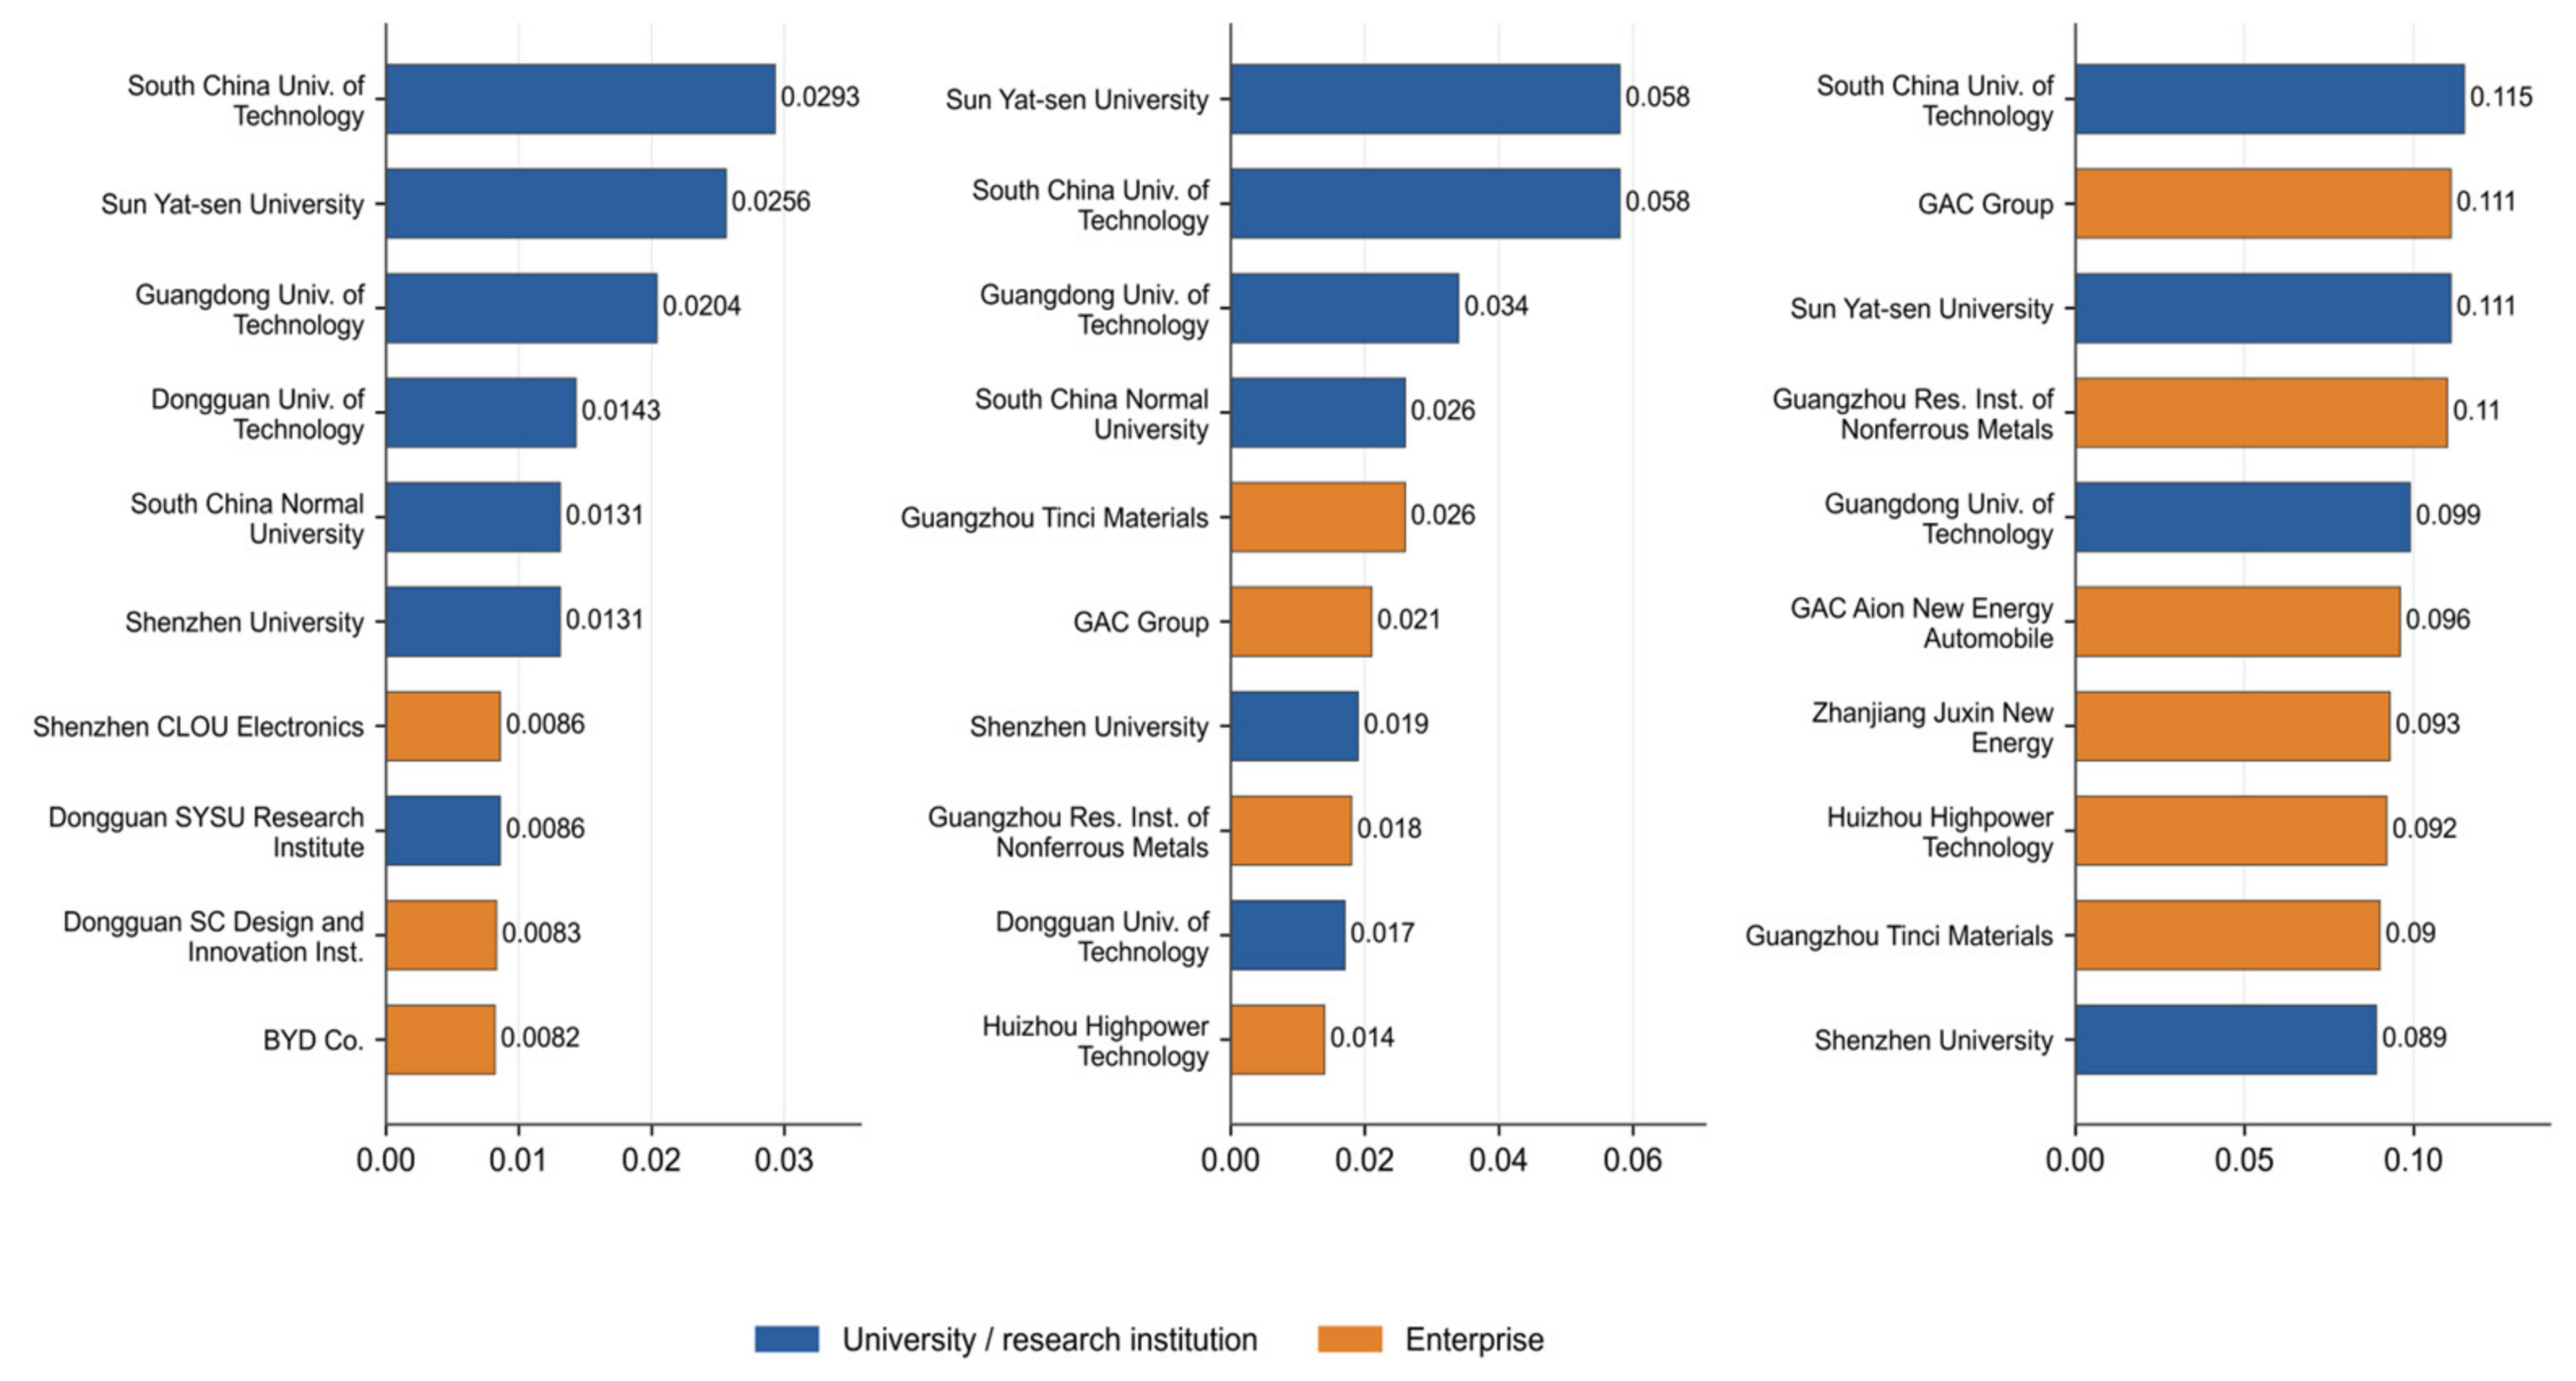
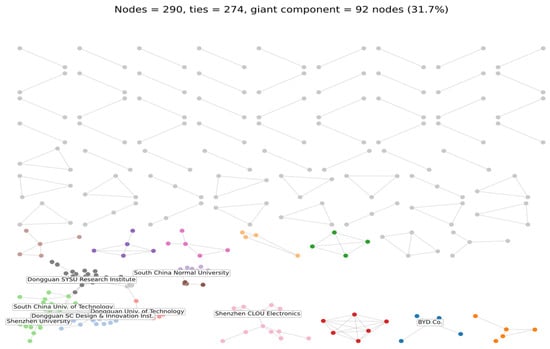
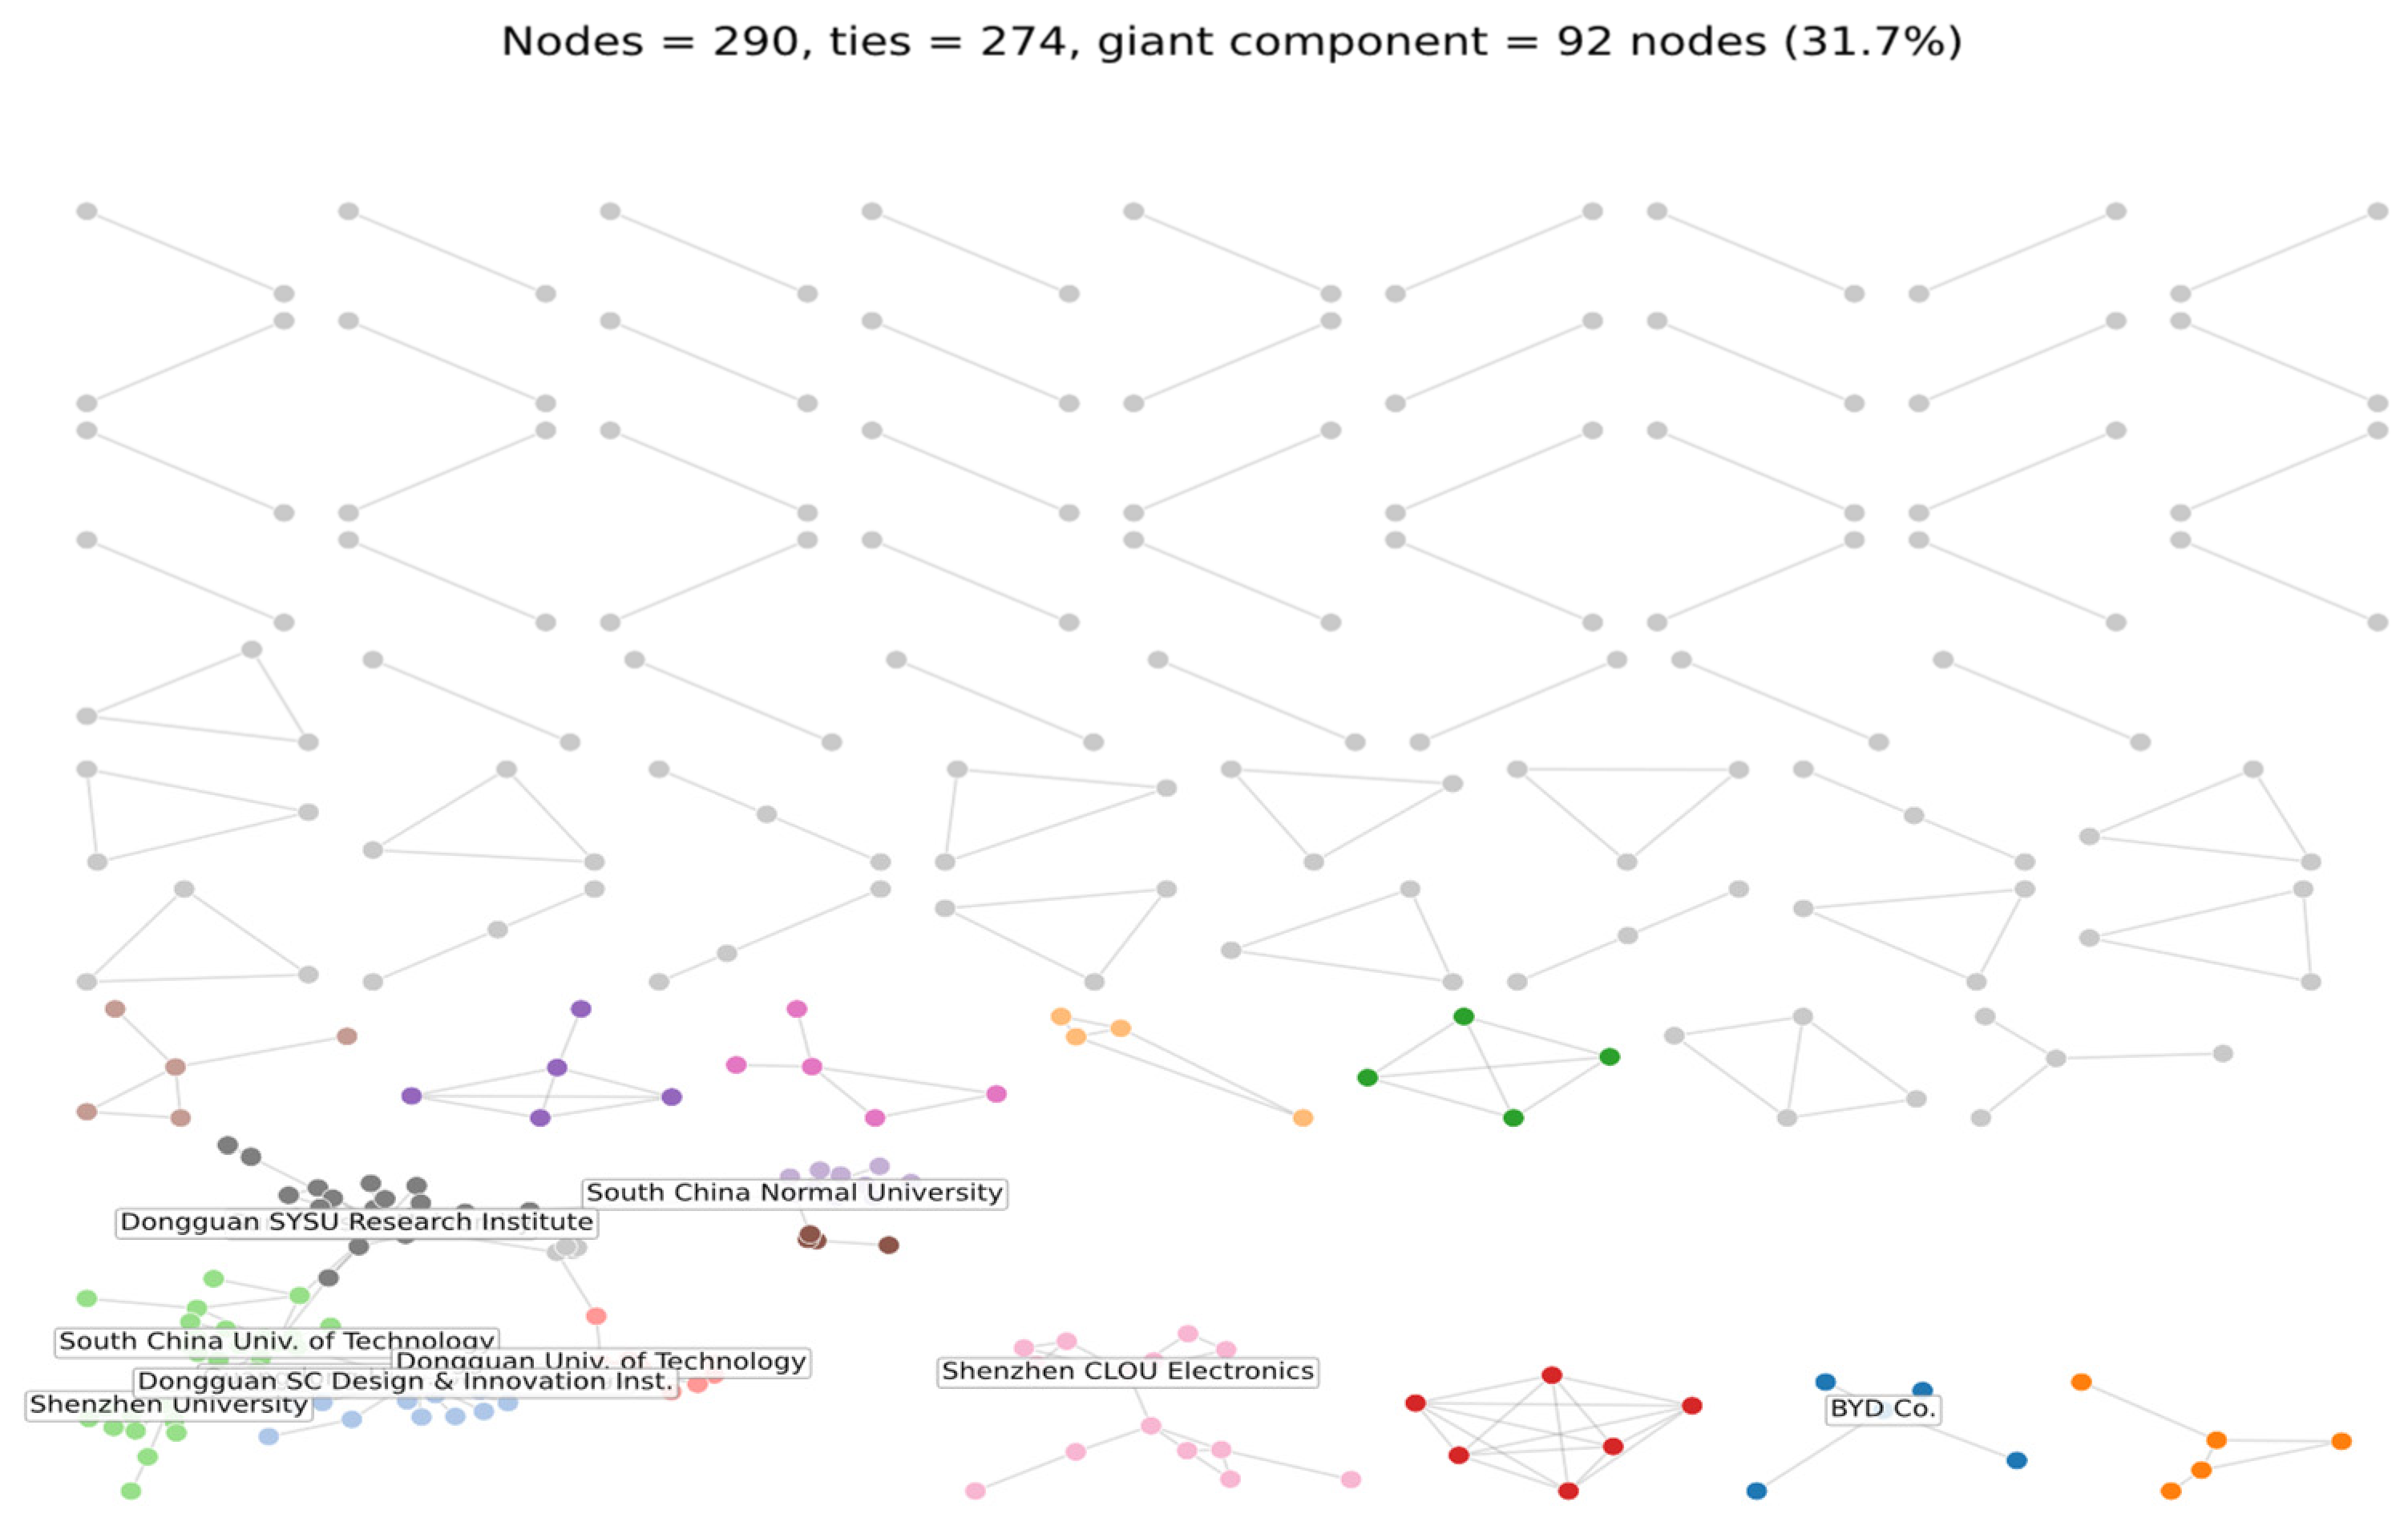
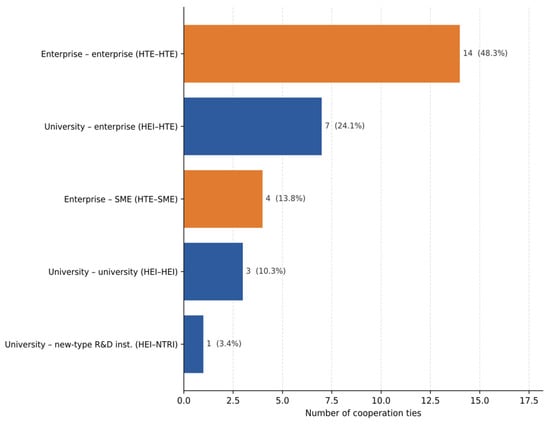
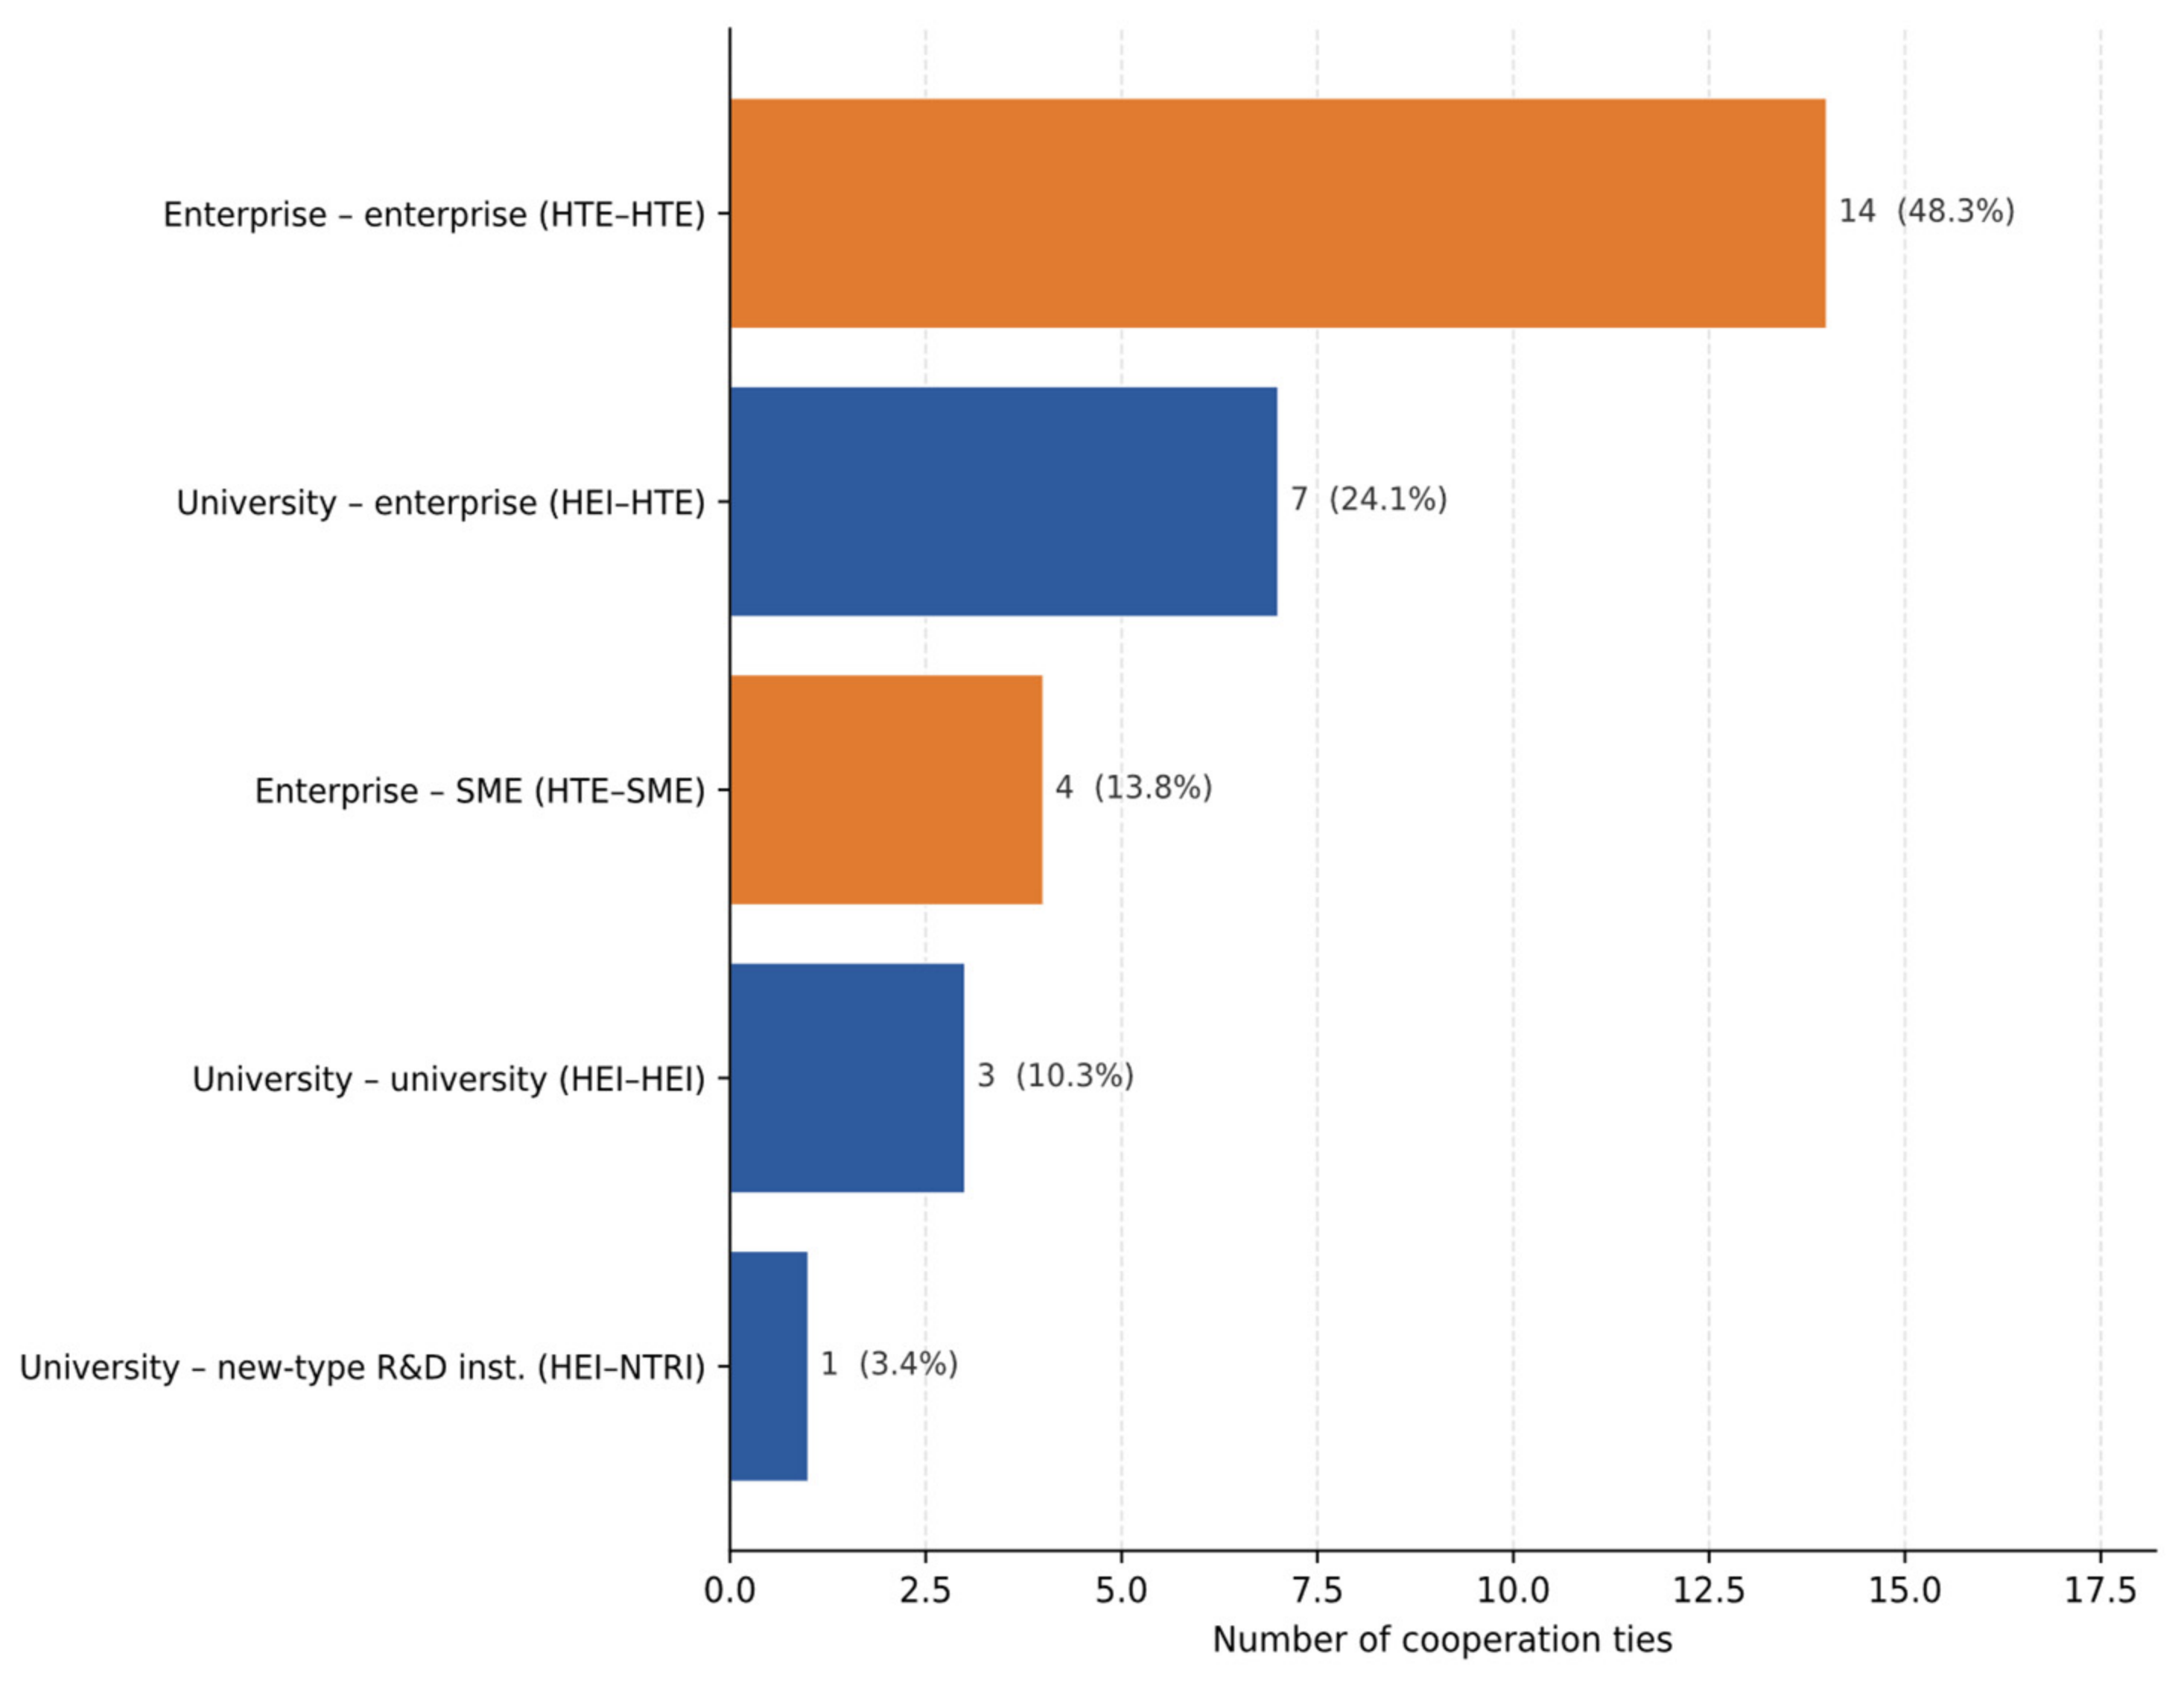
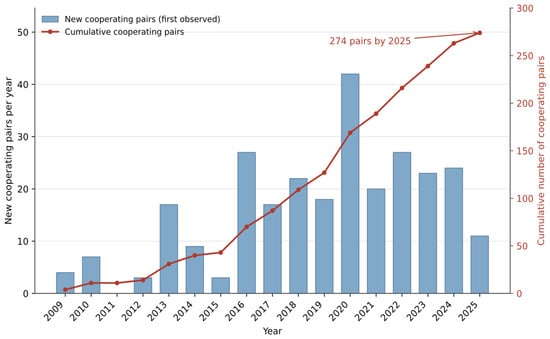
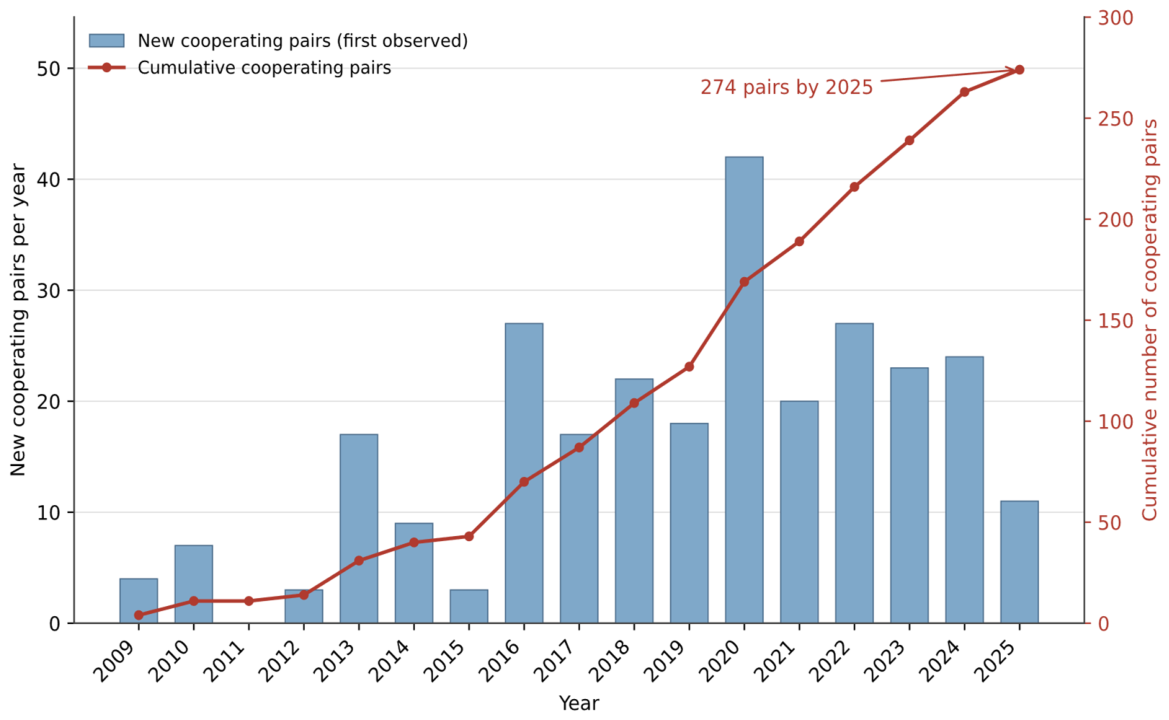
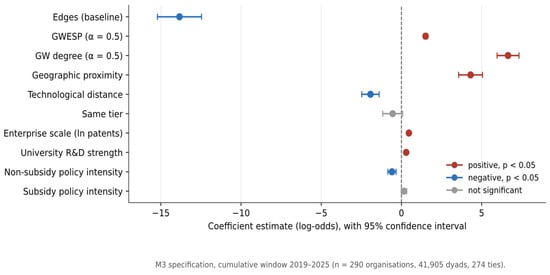
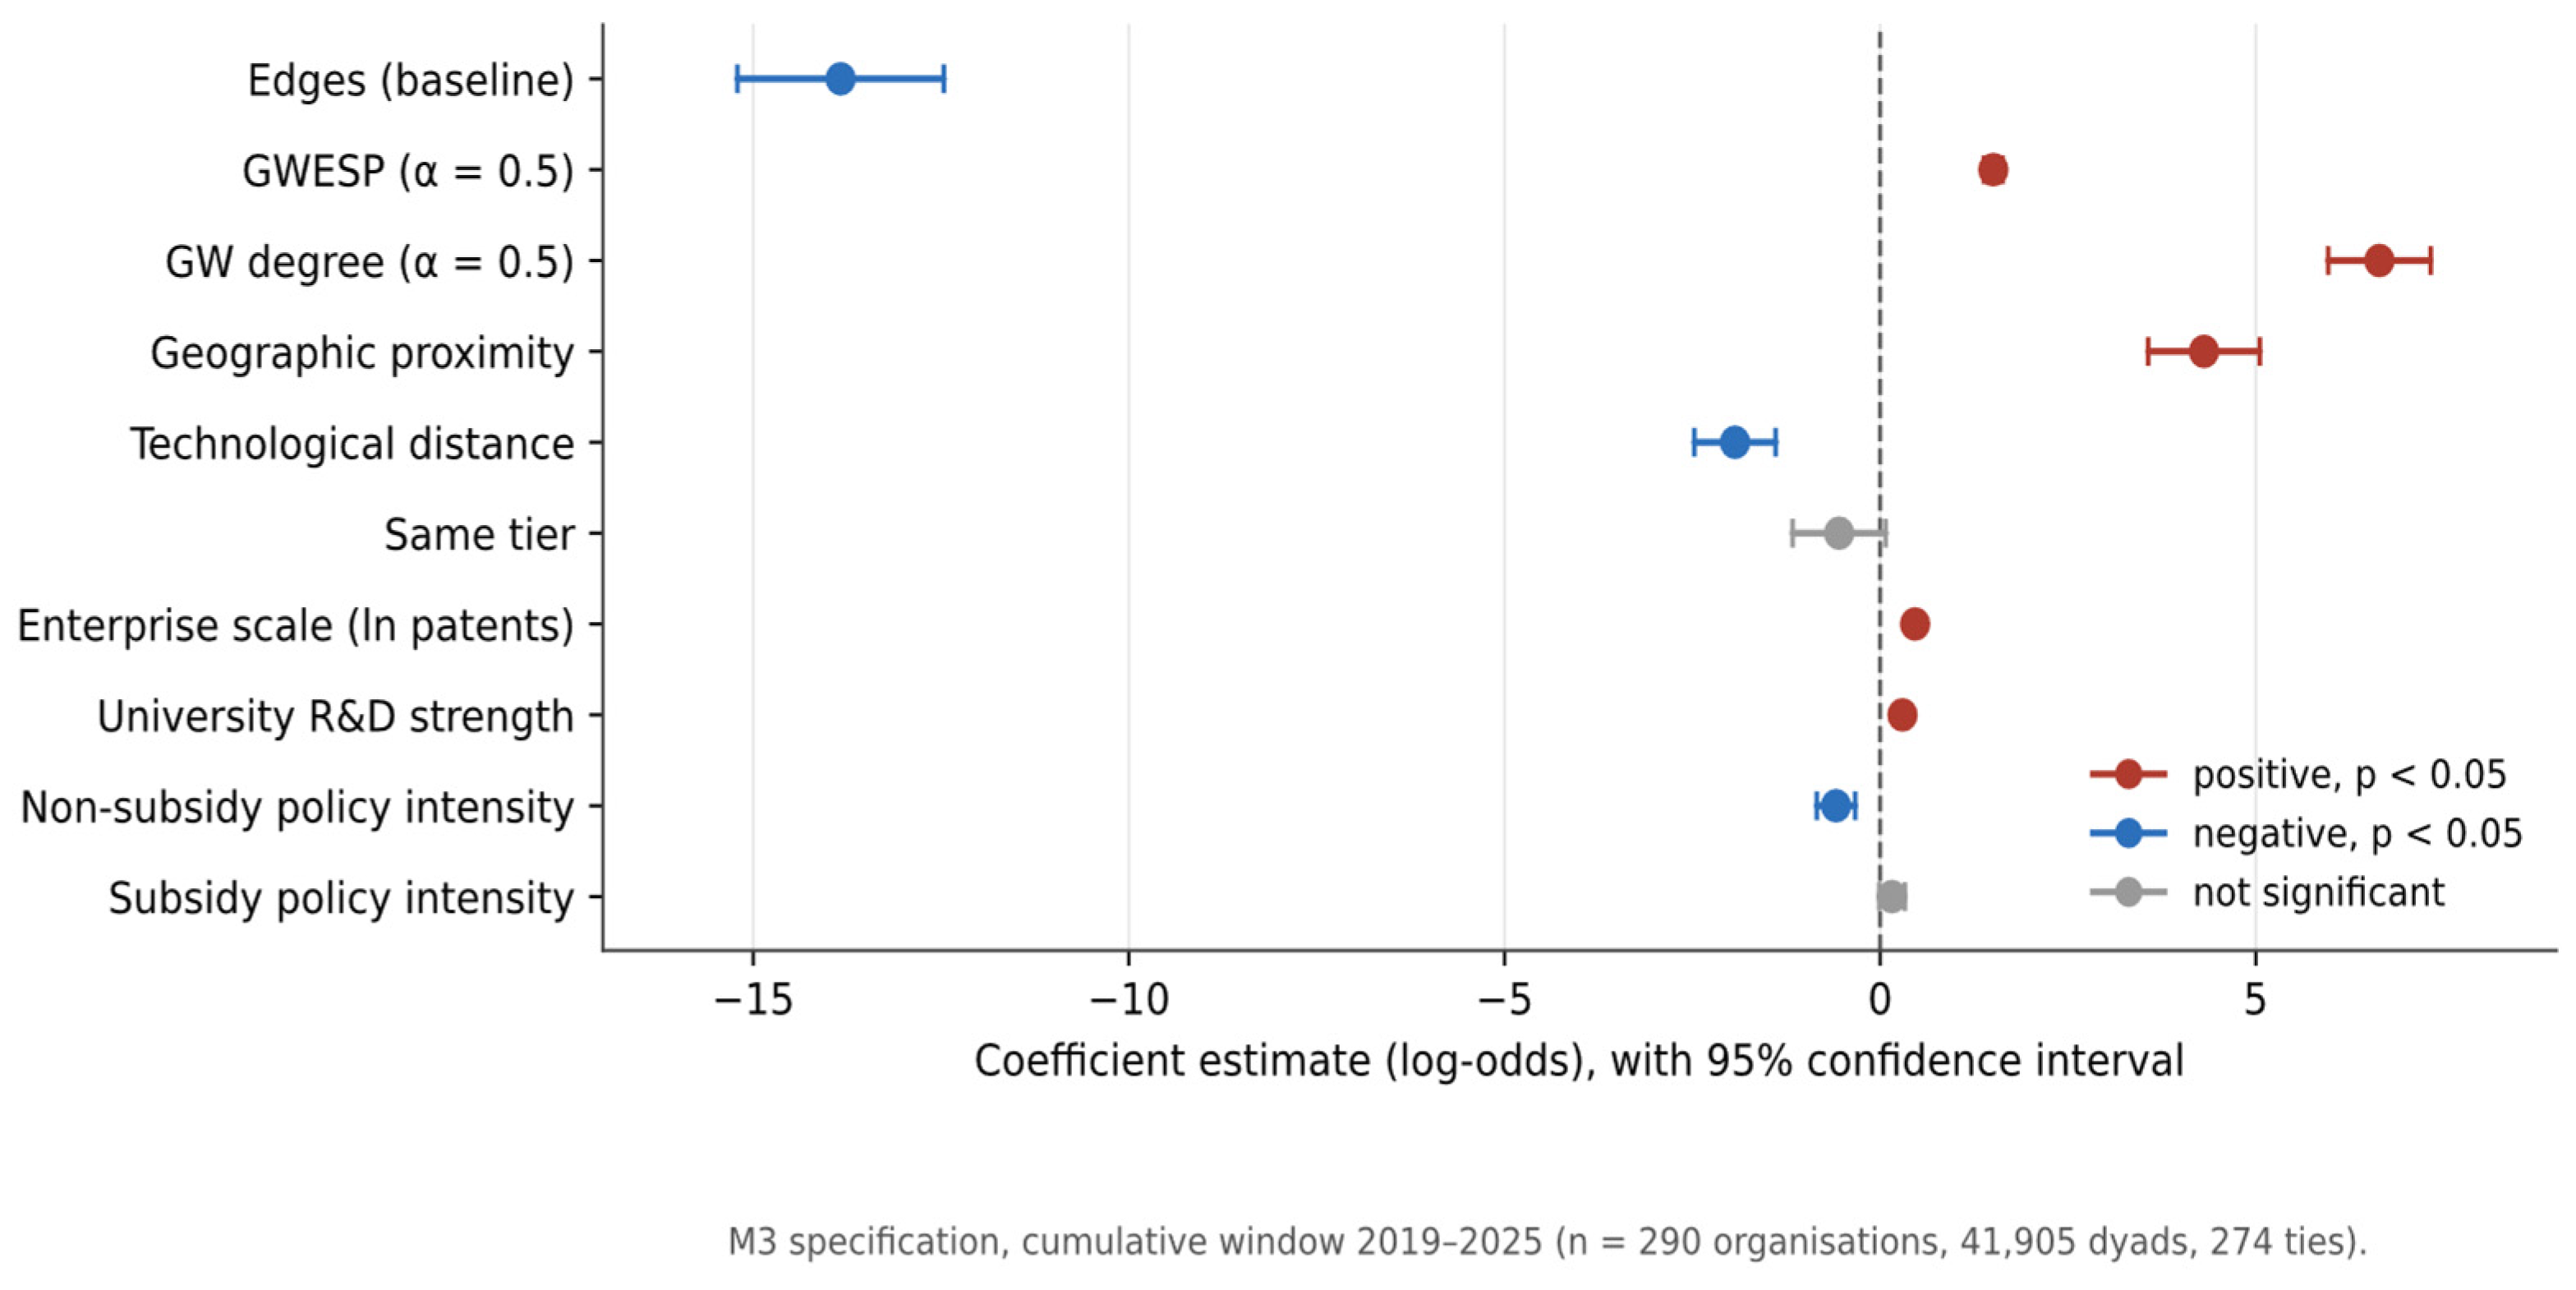
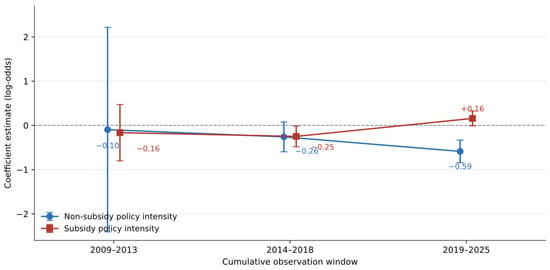
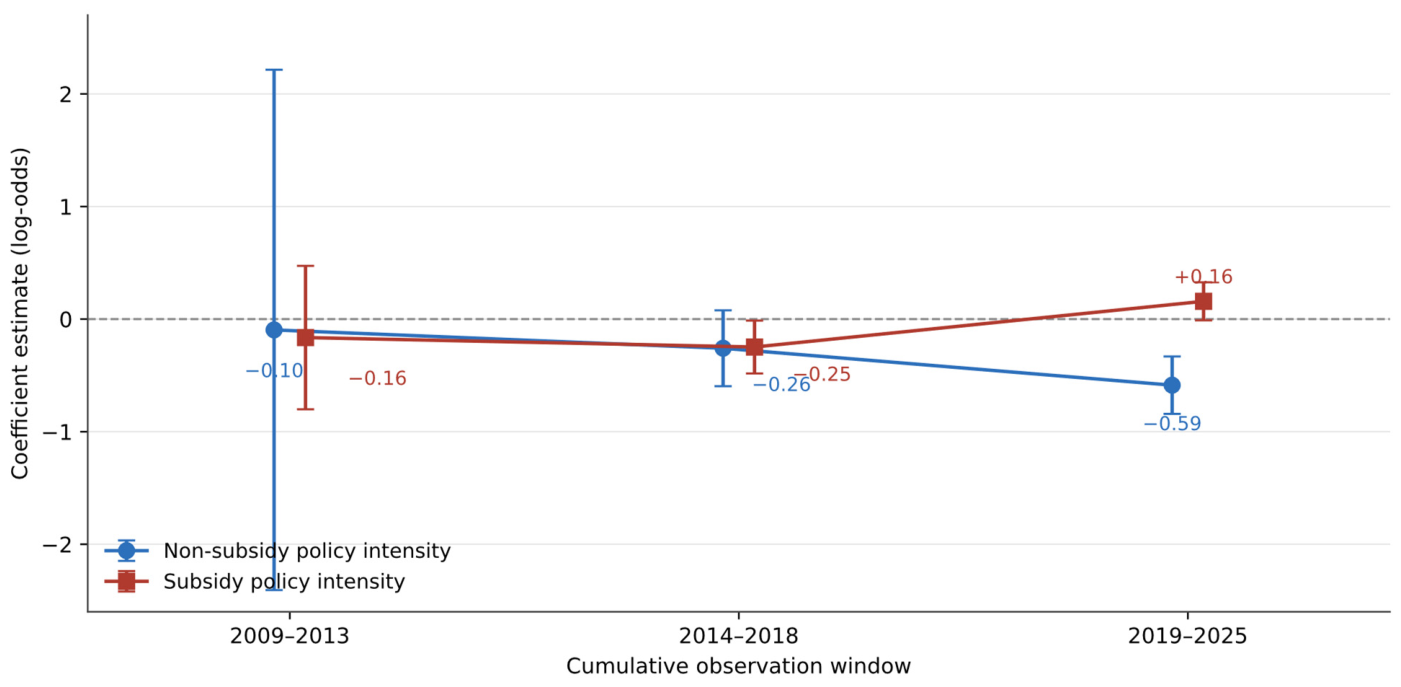
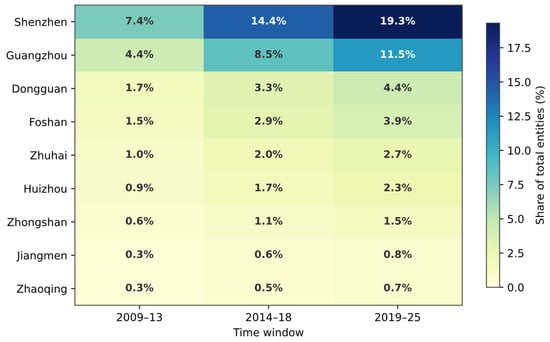
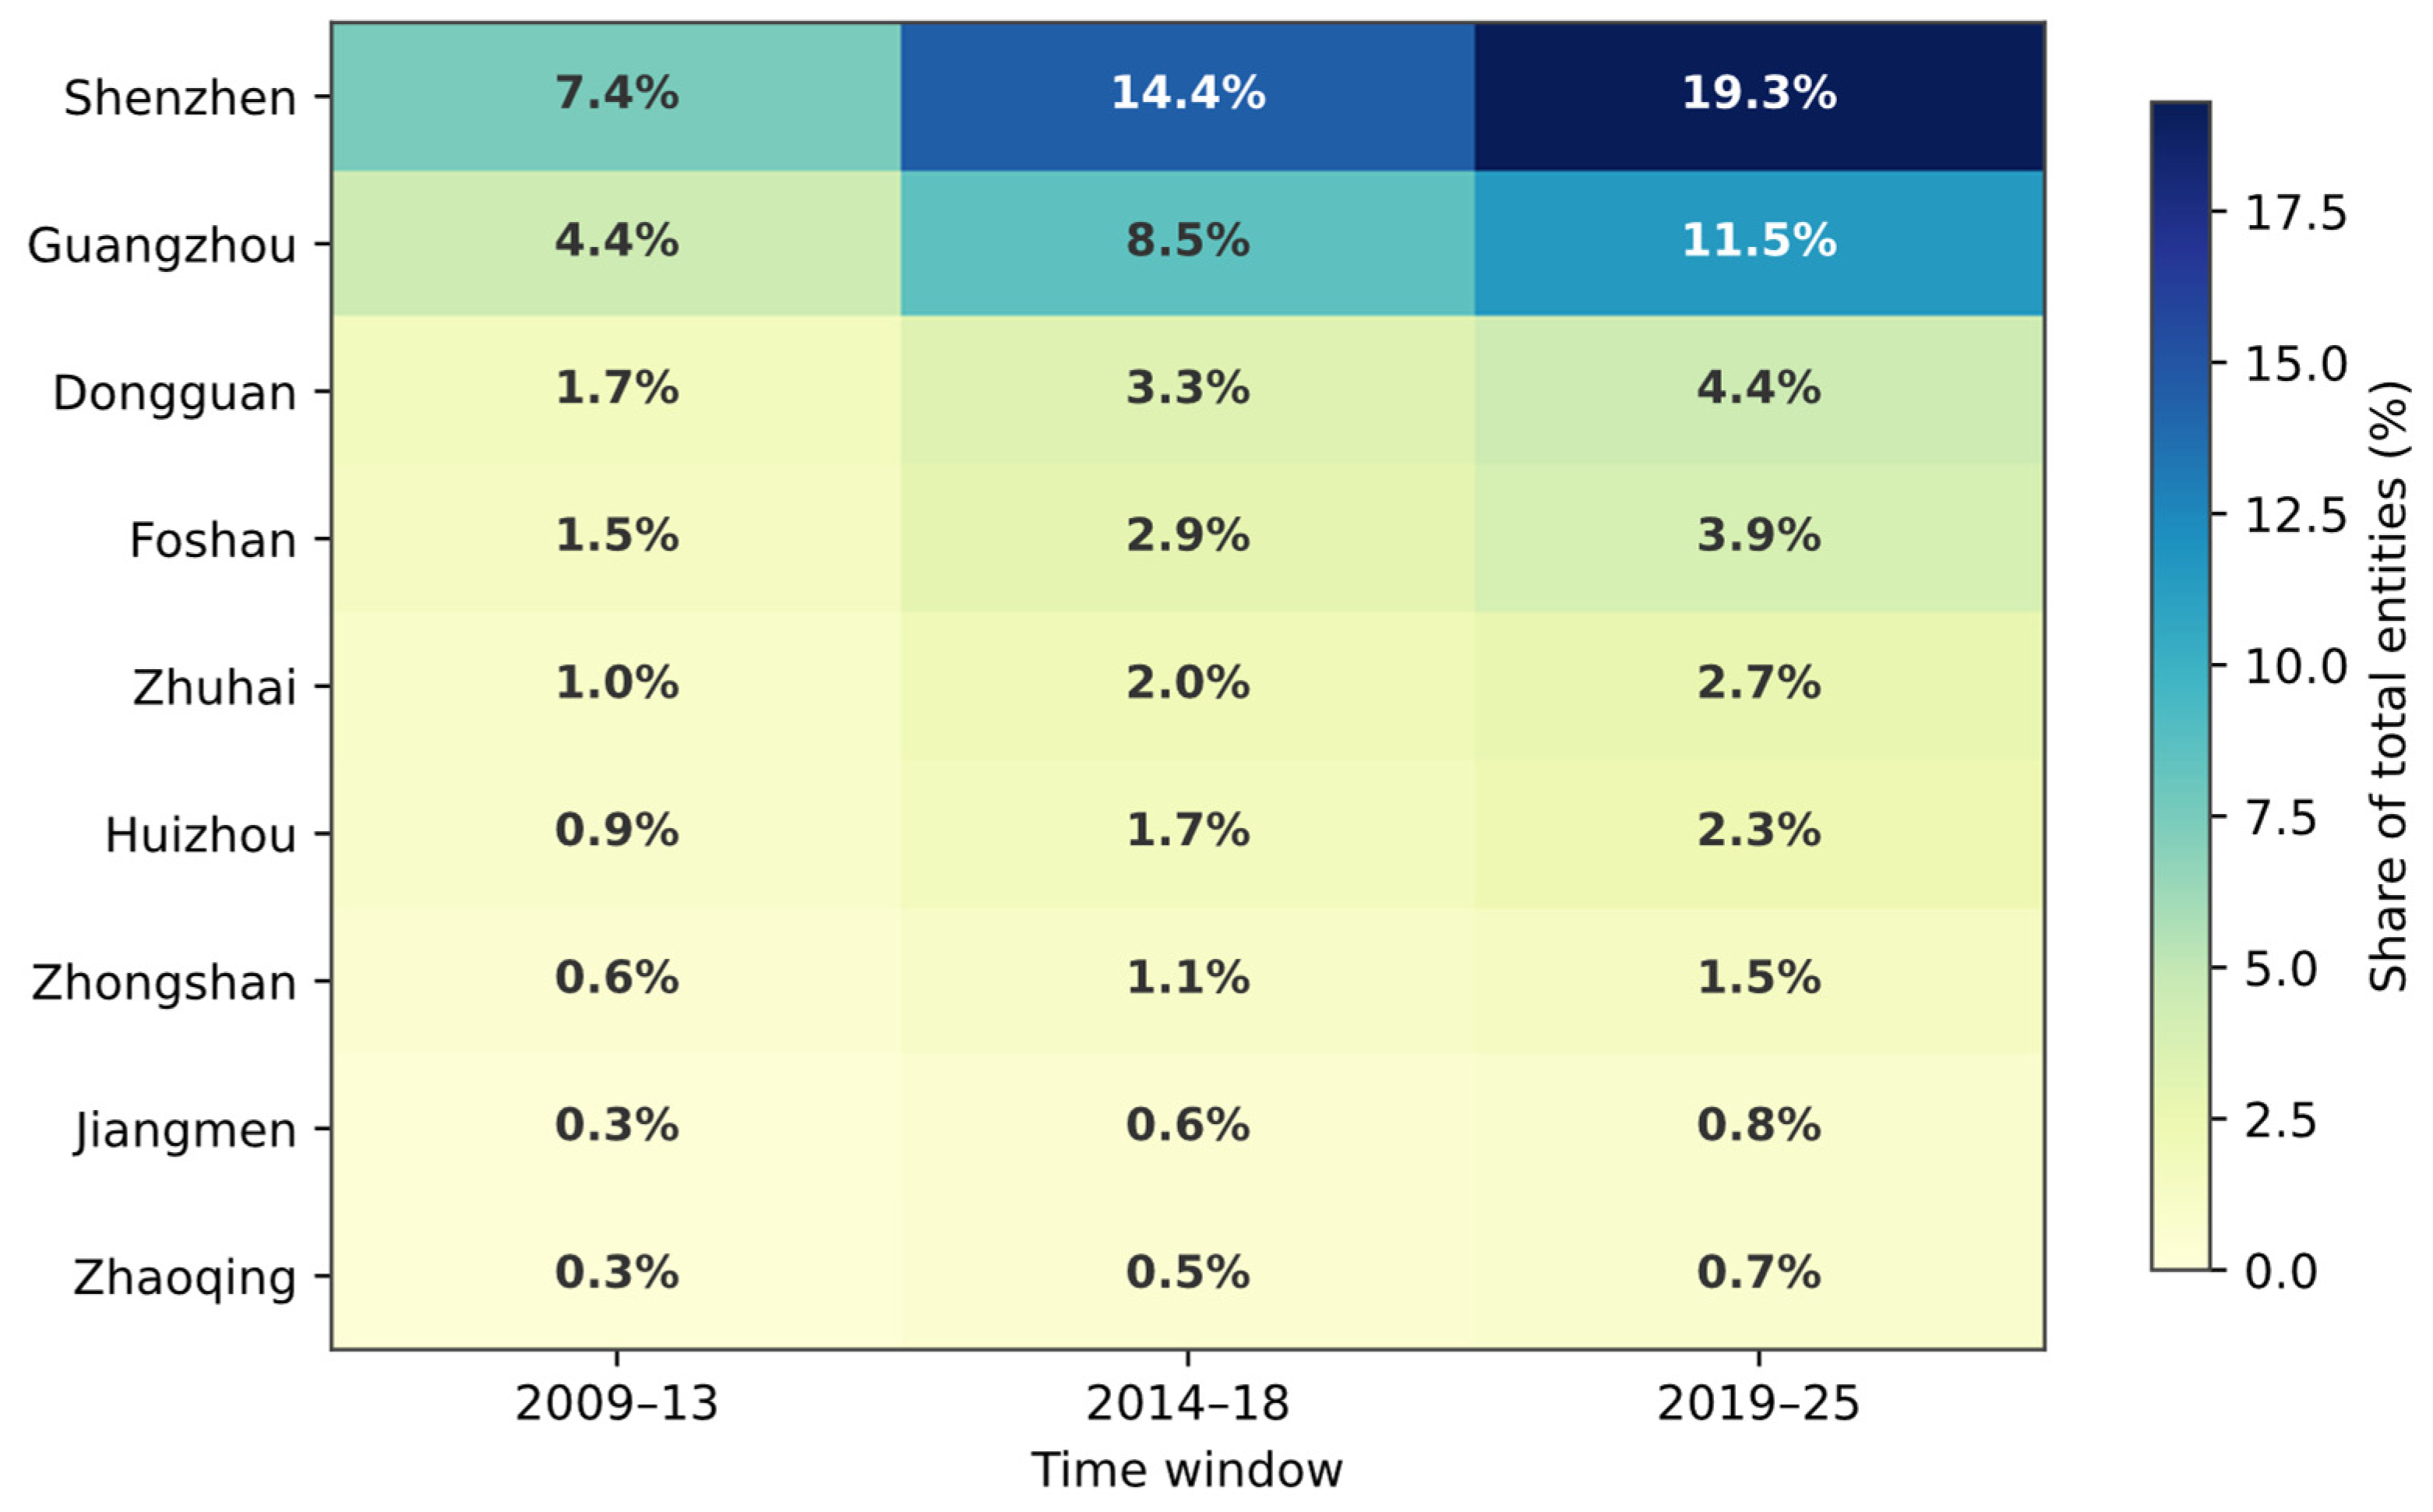

Disclaimer/Publisher’s Note: The statements, opinions and data contained in all publications are solely those of the individual author(s) and contributor(s) and not of MDPI and/or the editor(s). MDPI and/or the editor(s) disclaim responsibility for any injury to people or property resulting from any ideas, methods, instructions or products referred to in the content. |
© 2026 by the authors. Licensee MDPI, Basel, Switzerland. This article is an open access article distributed under the terms and conditions of the Creative Commons Attribution (CC BY) license.