


Abstract
Nitrogen fertilization is essential for balancing yield stability and supporting agricultural intensification, particularly in nations where cropland expansion is constrained. The pivotal role of nitrogen fertilizers in sustainable agriculture also renders them a strategically traded commodity. Consequently, trade-oriented analyses of fertilizer markets represent a vital dimension of sustainability research, as they influence input accessibility, production stability, and global food security. This study aims to develop an integrated and structured multi-criteria decision-making (MCDM) framework to identify emerging markets for nitrogen fertilizer exporters, accounting for the multi-dimensional impacts of global change. The analysis focuses on AMIS countries, which constitute the core of global agricultural production and trade. The decision model incorporates a diverse set of agricultural, demographic, and trade-related criteria, including import value, trade balance, agricultural nitrogen use, fertilizer use per unit of cropland, cropland availability, food vulnerability, and urbanization rate. Criterion weights are established using the CRITIC method—accounting for both contrast intensity and inter-criteria correlations—while alternative markets are ranked via the Fuzzy TOPSIS method. The results indicate that India, the United States, and China achieved the highest overall scores, with closeness coefficients of 0.5945, 0.5197, and 0.5098, respectively. The most influential criteria are food vulnerability (0.2035), urbanization (0.1865), and cropland area (0.1407). The findings identify high-potential markets characterized by structurally sustained fertilizer demand, driven by land constraints, demographic pressures, and the necessity for agricultural intensification.
1. Introduction
Feeding the growing world population has long been a central global concern. Rising population, climate change, and multifaceted crises—such as pandemics and geopolitical conflicts—represent major challenges exacerbating global food insecurity and vulnerability. Recent global assessments highlight the severity of these challenges; the United Nations (UN) projects that the world’s population will reach 10.3 billion in the mid-2080s, a significant increase from 8.2 billion in 2025 [1], driving higher food demand. Furthermore, the Food Security Information Network (FSIN) and the Global Network Against Food Crises (GNAFC) reported that 281.6 million people across 59 food-crisis countries faced acute food insecurity in 2023 [2]. Parallel to demographic growth, urbanization also plays a pivotal role in the escalating food demand through its impact on land-use alterations. Urbanization, together with industrial development, exerts significant pressure on cropland availability by encroaching upon high-quality cultivated land [3]. According to World Bank projections, urbanization will continue to rise, with approximately 68% of the global population residing in urban areas by 2050 [1]. Simultaneously, global urban land area is expected to increase by an average of 112% [4], expanding to 3.6 million square kilometers by 2100 [5]. Notably, over 60% of the world’s irrigated farmland is situated in the immediate vicinity of urban centers [6], underscoring the intensified pressure for conversion and fragmentation of productive cropland, particularly in Asia, Africa, and South America [4]. Consequently, cropland areas continue to decline, especially in rapidly urbanizing nations [7,8,9,10]. Empirical studies indicate that approximately 50–63% of new urban expansion is expected to occur on existing croplands, potentially resulting in a 1–4% decline in global food production [11].
In the current era, characterized by rapid urbanization, climate change and geopolitical upheaval, expanding agricultural output through land conversion has become increasingly constrained. Consequently, productivity gains achieved through input-intensive farming practices have become the primary mechanism for meeting rising food demand [12,13]. Agricultural productivity research underscores the growing significance of fertilizers as key determinants of yield performance [12,14,15]. Within this framework, modern agricultural inputs—specifically fertilizers—play a central role, as they directly influence production stability and resource-use efficiency. Nitrogen-based fertilizers (N-fertilizers) in particular constitute a critical production input embedded in modern food systems. The use of N-fertilizers remains one of the most vital practices in contemporary agriculture [16] and has become increasingly essential for sustaining productivity under conditions of land scarcity and escalating demand. Given their critical role, the demand for N-fertilizers is projected to rise under the collective pressures of urbanization, global population growth, and declining arable land. Therefore, N-fertilizers can be regarded as one of the most tactical trade commodities for ensuring global food security. Accordingly, generating systematic, comparative, and data-driven insights into countries where demographic trends and agricultural practices sustain expanding demand is important for the initial screening of potential N-fertilizer markets, irrespective of a specific exporting origin. However, existing literature generally examines the fertilizer industry from either a production or an agricultural-use perspective, leaving a gap in trade-oriented strategic analysis. Research concerning N-fertilizer trade operations and export-oriented target market selection remains remarkably limited. Existing studies primarily concentrate on conventional trade metrics, often neglecting the profound impact of global structural shifts. Specifically, there is a lack of data-driven frameworks that concurrently account for urbanization pressures, cropland constraints, and food vulnerability alongside commercial trade dynamics. Consequently, a comprehensive assessment of the N-fertilizer trade necessitates an integrated evaluation of both market-based factors and broader structural drivers.
Addressing this gap, this research aims to provide an exporter-independent, first-stage screening and prioritization of potential N-fertilizer markets by jointly assessing destination-country trade conditions and the structural drivers of agricultural demand. Rather than identifying the optimal market for a particular exporting country or firm, the framework evaluates the general structural attractiveness of alternative destination markets. Rather than presenting MCDM as a novel methodology in itself, the study extends existing target-market selection research by developing a fertilizer-specific decision framework that integrates conventional trade indicators with agricultural use, fertilizer-use intensity, cropland availability, food vulnerability, and urbanization. This multidimensional structure enables countries to be evaluated not only according to their current commercial attractiveness but also according to the longer-term agricultural and demographic conditions shaping N-fertilizer demand. By combining objective CRITIC weighting with Fuzzy TOPSIS and incorporating long-term market observations, the framework provides a systematic basis for distinguishing structurally sustained fertilizer markets from markets whose attractiveness is primarily driven by short-term trade conditions.
The study contributes to the literature in three main respects. First, it extends the application of target-market selection models to the N-fertilizer sector by addressing a product-specific trade problem with direct implications for agricultural productivity and food security. Second, it integrates conventional trade indicators with agricultural, demographic, land-use, and food-vulnerability variables, thereby broadening the assessment of market potential beyond current import performance. Third, it combines objective CRITIC weighting with Fuzzy TOPSIS and long-term market observations to account for both the informational structure of the criteria and the uncertainty associated with changing market conditions. These contributions are conceptual and application-oriented rather than based on the methodological novelty of MCDM itself.
Furthermore, the research contributes to sectoral development by supporting data-driven marketing strategies and providing strategic insights for exporting countries and enterprises. Identifying high-potential markets can help refine international marketing strategies, reduce market-entry uncertainty, and enhance long-term competitiveness amid intensifying global food-security pressures.
The remainder of this paper is structured as follows. Section 2 reviews the relevant literature on MCDM techniques applied to target market selection, alongside prior studies on fertilizer markets. Section 3 provides a detailed exposition of the dataset, the selected criteria, and the procedural steps of the CRITIC and Fuzzy TOPSIS methods used for weighting and ranking the nitrogen fertilizer markets. Section 4 presents the resulting criteria weights and market rankings, followed by a comprehensive discussion of the high-potential markets identified. Finally, Section 5 offers a summary of the overall findings, outlines strategic implications for policymakers and exporters, and suggests directions for future research.
2. Literature Review
Target market selection is a multidimensional challenge influenced by economic, logistical, political, and social variables, requiring decision-makers to evaluate multiple and often conflicting criteria simultaneously. In this context, the rapid increase in publications using MCDM across industrial and other application areas highlights the relevance of these methods for complex decision-making problems involving competing objectives and constraints [17]. In the existing literature, research in this domain is typically categorized by either methodological frameworks—ranging from AHP and TOPSIS to entropy and hybrid systems—or by specific industrial contexts. Due to its efficacy in structuring hierarchical decisions, AHP has seen extensive adoption. For instance, Aghdaie et al. (2013) utilized a Fuzzy AHP-COPRAS-G model to examine entry barriers in the Iranian furniture sector, while Sener (2014) and Aghdaie and Alimardani (2015) applied AHP and hybrid AHP-TOPSIS models, respectively, to identify strategic expansion opportunities in the porcelain and furniture industries [18,19,20].
The application of these methods extends into customer segmentation and diverse industrial sectors. Güçdemir and Selim (2015) merged AHP with segmental clustering to categorize OEM customers, whereas Khalili and Khalilpour (2016) leveraged TOPSIS for risk-based classification [21,22]. Subsequent sector-specific evaluations expanded upon these frameworks by incorporating Ghorabaee et al. (2017), who applied the CODAS technique to the footwear industry, and Oey et al. (2018), who integrated goal programming with AHP for the metal products sector [23,24]. In an agricultural context, Ünal and Çetin (2019) employed a hybrid AHP-TOPSIS model to identify prime fertilizer markets in India and Brazil, demonstrating a recurring scholarly emphasis on economic and logistical feasibility [25].
Recent years have witnessed a shift toward advanced computational and objective data-driven approaches. The integration of machine learning for retail satisfaction classification [26] and the use of hybrid systems like TOPSIS-GRA-ANP for the hosiery industry [27] reflect this trend. Furthermore, researchers such as Ray et al. (2021) and Vanegas-Lopez et al. (2021) integrated MCDM tools with data mining to enhance export entry strategies in the retail and textile sectors [28,29]. While Çelik and Akmermer (2022) underscored product-specific preferences in seafood markets using Fuzzy AHP-TOPSIS, Duong and Thao (2021) shifted toward objective entropy-based weighting to evaluate agricultural segments [30,31].
The most contemporary literature highlights a transition toward increasingly sophisticated hybrid models to navigate the complexities of modern trade. Recent contributions include the use of TOPSIS for transportation demand [32], proximity–distance models for insurance classification [33], and complex integrations such as AHP-VIKOR-TOPSIS for the fiberboard industry [34]. Furthermore, the emergence of the Comparative Alternative Market Assessment (CAPMA) method has provided specialized insights into commodity markets like hazelnuts and figs [35,36]. Öztürkçü (2025) introduced an entropy-ARAS-CAPMA framework for the dried apricot trade [37]. Recent studies have continued to explore export market dynamics; for instance, Meral et al. (2025) utilized a hybrid Entropy-TOPSIS framework to assess potential international markets for Turkey’s dried apricot exports [38]. In a similar vein, Akmermer and Şentürk (2026) investigated the expansion of wood pellet markets by employing a combination of the CRITIC and ARAS methodologies [39]. Collectively, these advancements signify a clear methodological evolution toward more integrated and robust decision-making architectures in global trade analysis.
3. Materials and Methods
This research adopts a structured and systematic methodological framework for the exporter-independent screening and prioritization of potential N-fertilizer destination markets. The methodology is designed to ensure analytical transparency and replicability while considering the multiple dimensions—such as market attractiveness, vulnerability-related risks, and external supply dependence—that characterize international markets. This framework facilitates the simultaneous integration of heterogeneous indicators capturing demand intensity, trade potential, and structural fragilities within a unified decision matrix.
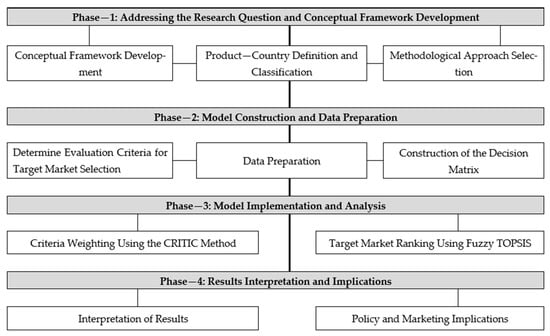
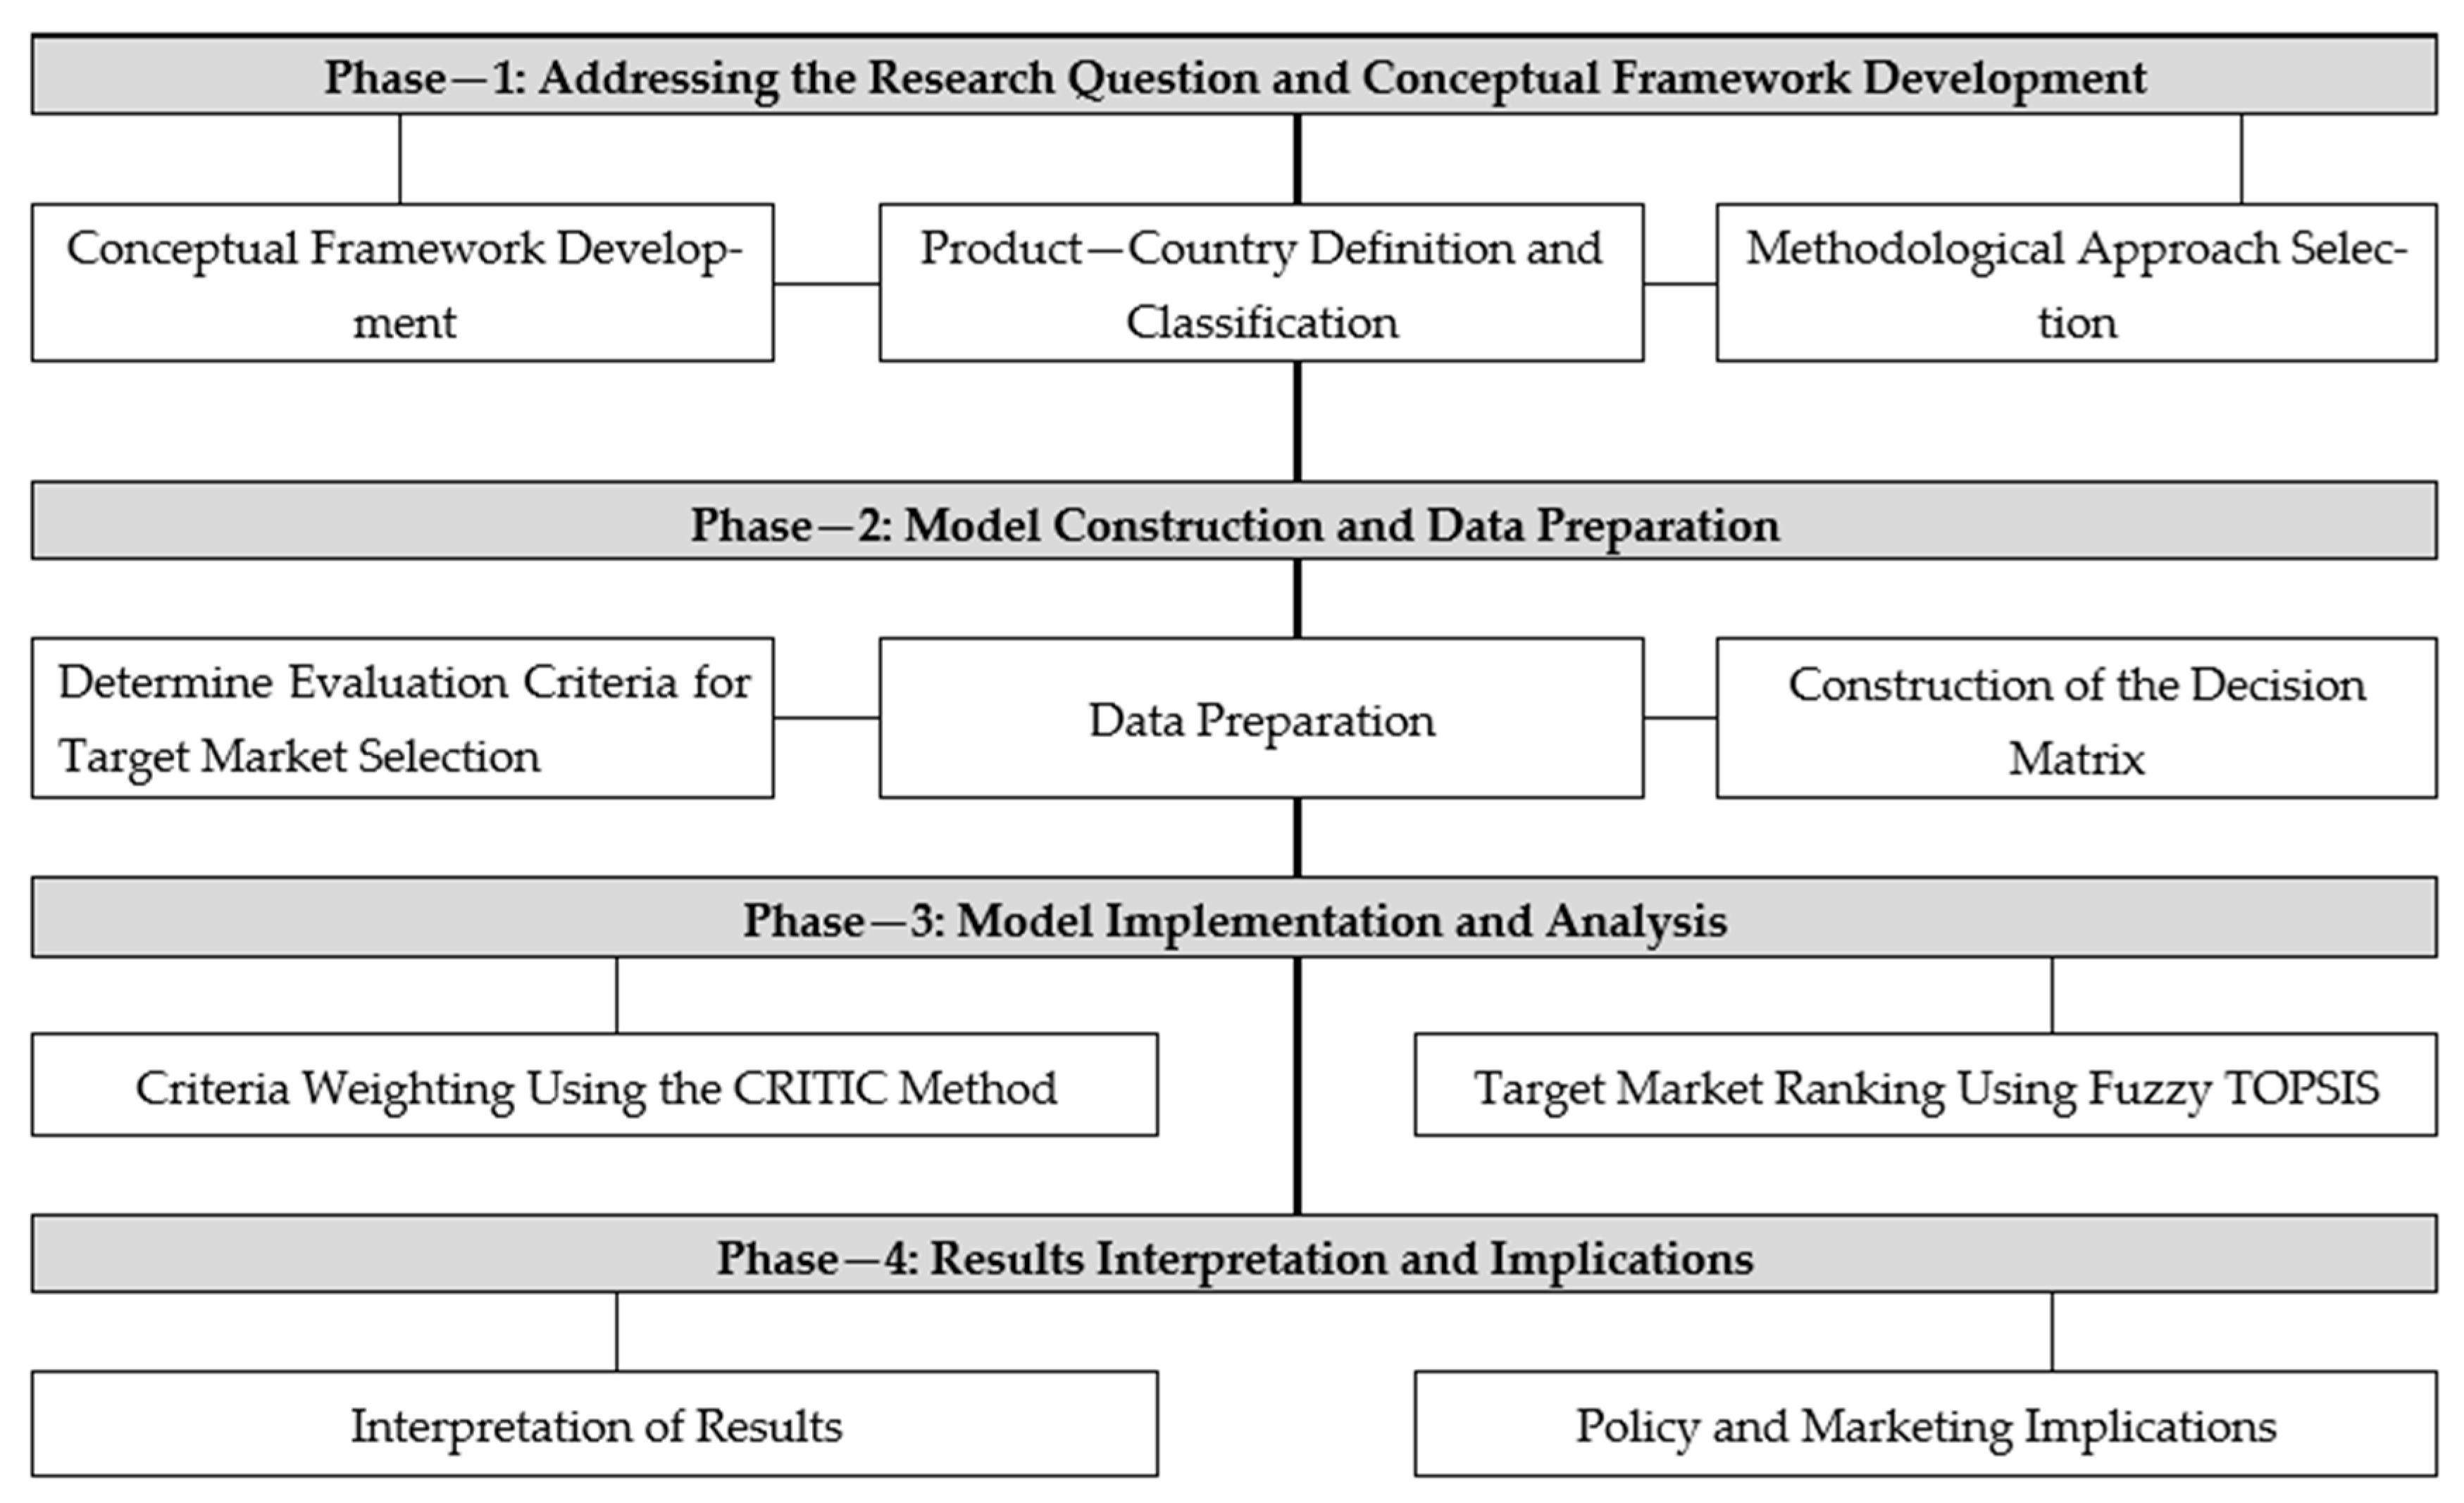
In the present decision problem, the decision-maker is conceptualized as a generic N-fertilizer exporter rather than a specific exporting country or fertilizer-producing firm. The decision objective is to comparatively assess the structural attractiveness of alternative destination markets and identify countries warranting further exporter-specific evaluation. Accordingly, the model focuses on destination-country characteristics and does not incorporate origin-specific or firm-specific factors. Geographic distance, freight costs, bilateral tariffs, sanctions, trade agreements, port and logistics conditions, payment risk, existing distribution channels, product-registration requirements, and geopolitical relationships are therefore outside the scope of the present analysis. Consequently, the resulting rankings represent a first-stage market screening rather than definitive market-entry recommendations for a particular exporter. The comprehensive research workflow is illustrated in Figure 1.
Figure 1.
Research methodology. The authors used (ChatGPT, GPT-5, OpenAI) to support the ideation and initial draft of Figure 1.
3.1. Product Classification for Nitrogen Fertilizers in International Trade
To ensure consistency in data selection and cross-country comparability, the product classification for nitrogen fertilizers is explicitly defined in Table 1. This empirical research utilizes the Harmonized System (HS) chapters as the basis for product classification. The HS, an international nomenclature published by the World Customs Organization (WCO), enables participating countries to categorize traded goods on a standardized basis for customs and statistical purposes. At the international level, the HS nomenclature operates as a hierarchical six-digit coding system. The specific nitrogen fertilizer products analyzed in this study, along with their corresponding HS codes, are detailed in Table 1. All trade data utilized in this research were compiled based on these codes.
Table 1.
Harmonization codes of N-fertilizer product group.
3.2. Selection of Countries as Decision Alternatives
The decision alternatives in the proposed screening framework consist of the Agricultural Market Information System (AMIS) participant countries, which are evaluated as potential N-fertilizer destination markets. These countries were selected due to their dominant roles in global agricultural production, consumption, and trade, as well as their influence on international food markets and input-demand dynamics. AMIS is composed of G20 members plus Spain and eight additional major countries exporting and importing agricultural commodities. Collectively, the AMIS countries shown in Table 2 account for approximately 80–90% of global production, consumption, and trade of the targeted crops.
Table 2.
List of AMIS countries grouped according to their importance for research purposes.
Furthermore, AMIS nations increasingly shape international food markets and input demand trends. Fertilizer demand within these countries is structurally embedded in large-scale agricultural systems and global supply–demand balances, making them critical case studies for N-fertilizer market analysis.
3.3. Determination of Criteria
The structural attractiveness of potential N-fertilizer destination markets is influenced not only by conventional trade conditions but also by broader agricultural, demographic, and socioeconomic changes. To ensure effective decision-making, it is imperative to develop a comprehensive understanding of multiple dimensions, including market attractiveness, vulnerability-related risks, and external supply dependence. Within the context of international N-fertilizer trade, these dimensions reflect both demand-side pressures and trade-related dynamics. Accordingly, this research incorporates a set of criteria designed to jointly capture agricultural use, land availability, demand intensity, trade exposure, and structural fragility within potential target markets. These criteria are selected based on their theoretical relevance in the agricultural economics and trade literature, as well as their empirical suitability for cross-country comparison within the AMIS group. Table 3 presents the operational definitions of each criterion and their classification as benefit-type or cost-type variables within the CRITIC–Fuzzy TOPSIS framework.
Table 3.
List of evaluation criteria used in the research.
The data for each criterion utilized in this study are obtained from internationally recognized and publicly accessible databases to ensure transparency, reliability, and cross-country comparability. Indicators related to agriculture and land use—including ‘cropland area,’ ‘agricultural use,’ and ‘use per area of cropland’—are sourced from the Food and Agriculture Organization of the United Nations Corporate Statistical Database (FAOSTAT) [40]. Trade values used in the analysis are reported in current nominal USD. Consequently, their variation over the 2005–2024 period may reflect both changes in underlying trade activity and changes in prices, exchange rates, and broader market conditions. This issue is particularly relevant to fertilizer markets, which experienced substantial price and energy-market fluctuations during the observation period. Accordingly, nominal trade-value indicators are interpreted as measures of observed market conditions rather than pure measures of changes in physical trade flows. Demographic and structural data, including the ‘urbanization rate’ (defined as urban population as a percentage of the total population), are retrieved from the World Bank’s World Development Indicators (WDI) [42]. Finally, the ‘food vulnerability’ indicator is derived from food security assessment datasets provided by the FSIN, GNAFC, and FAO, which provide composite measures reflecting national exposure to food security risks, supply shocks, and structural fragility [40,43].
3.4. Research Methods
The CRITIC–Fuzzy TOPSIS framework was selected to address two complementary requirements of the present decision problem. First, the evaluation criteria originate from heterogeneous agricultural, trade, demographic, and vulnerability-related indicators, and their relative importance is intended to be determined objectively from the data rather than through expert judgment. CRITIC is therefore used because it incorporates both the variability of each criterion and its correlation with the remaining criteria when deriving weights. Second, the country evaluations are based on long-term observations that exhibit temporal variation. Fuzzy TOPSIS allows this variability to be represented through fuzzy numbers and ranks alternative markets according to their relative proximity to the ideal market profile. Thus, CRITIC provides an objective weighting structure, while Fuzzy TOPSIS provides a suitable ranking mechanism for multidimensional and temporally variable market data.
To ensure methodological transparency, the relationship between the 20-year observations, the CRITIC weighting procedure, and the fuzzy representation is clarified as follows. The original dataset consists of annual observations for 27 country alternatives, seven evaluation criteria, and the 2005–2024 period. For each country–criterion combination, the 20 annual observations were summarized using the minimum, median, and maximum values.
Two related but methodologically distinct decision matrices were subsequently constructed. First, the median value of the 20-year series for each country–criterion combination was used as a single crisp representative value. The conventional CRITIC method was applied exclusively to this median-based crisp matrix. After normalization, the standard deviation of each criterion and the correlations among criteria were calculated across the 27 country alternatives, and these statistics were used to derive the seven objective criterion weights.
Second, the same 20-year observations were represented by triangular fuzzy numbers using the minimum, median, and maximum values for each country–criterion combination. The criterion weights previously obtained from the crisp CRITIC analysis were then incorporated into the Fuzzy TOPSIS procedure to rank the alternative markets.
3.4.1. The CRITIC Method
The CRITIC method has been proposed to objectively determine the weights of the criteria of MCDM problems. The CRITIC method was introduced to the literature in 1995 by Diakoulaki et al. [44]. The CRITIC method is a weighting method performed by using the standard deviations of the criteria and the correlation between the criteria.
The steps of the CRITIC method are as follows.
Step 1. The decision matrix is created.
In the decision matrix expressed by Equation (1), the index i represents the alternatives and the index j represents the criteria, while xij represents the performance value of the ith alternative in terms of the jth criterion.
Step 2. The decision matrix is normalized by Equation (2).
(i = 1, 2, …m and j = 1, 2, …, n)
Step 3. In this step, the standard deviation of the criterion and its correlation between other criteria are included. Then, the weight is calculated by Equation (3).
Cj shows the quantity of information contained in the j th criterion, determined as:
This method assigns greater weight to criteria with higher standard deviations and lower correlation coefficients with other criteria. In other words, a higher value of Cj indicates that the criterion provides a greater amount of unique information, thereby signifying its higher relative importance for the decision problem.
3.4.2. Fuzzy TOPSIS Method
TOPSIS, which was developed by Hwang and Yoon, 1981 [45], is a technique that is mostly used by researchers in performance evaluation studies. The most important feature of the TOPSIS method is choosing the alternative that has the shortest distance from the positive ideal solution and the farthest from the negative ideal solution [46]. Briefly, the positive ideal solution comprises all the best values obtainable with the criteria, whereas the negative ideal solution constitutes all the worst values obtainable with the criteria [47]. In the TOPSIS method, the ratings of alternatives are precise numbers; however, due to the vagueness of the decision data, precise numbers are unavailable to model real-life decision problems [48].
The usefulness of using the fuzzy approach is to appoint the relative importance of attributes analyzing fuzzy numbers instead of crisp numbers [49]. The steps of Fuzzy TOPSIS are as follows [50,51,52]:
Step 1. Creating the data matrix
Firstly, ratings are calculated by using Equation (5):
where is the performance rating value obtained by the s-th decision-maker. The fuzzy evaluation matrix is created using Equation (6):
where .
Step 2. Normalizing the evaluation matrix
The normalized fuzzy matrix is . B represents benefit criteria and C presents cost criteria.
After normalization, the fuzzy elements take values between [0, 1].
Step 3. Calculating the weighted normalized fuzzy decision matrix
The weighted normalized decision matrix is ;
i = 1, 2, …, m, and j = 1, 2, …, n
Step 4. Calculating the positive and negative ideal solutions
The Fuzzy Positive Ideal Solution (FPIS) and Fuzzy Negative Ideal Solution (FNIS) can be given as:
where .
Step 5. Calculating the distances from FPIS and FNIS
Using Equations (10) and (11), the distances from the FPIS and FNIS are calculated.
The distance between two triangular fuzzy numbers and is calculated by Equation (12):
Step 6. Computing the closeness coefficients
The closeness coefficients of each alternative are computed by Equation (13):
If the CCi value of the alternative is close to 1, then the alternative is the best choice.
4. Results
This section establishes a hybrid decision-support framework by integrating the CRITIC and Fuzzy TOPSIS methodologies discussed previously. The evaluation model is structured around seven distinct criteria. Specifically, C1 through C5 are classified as benefit criteria, where higher performance levels are desirable. In contrast, C6 and C7 are designated as cost (non-beneficial) criteria, where lower numerical values are prioritized for the ranking process.
Upon establishing the decision matrix and its subsequent normalization—as detailed in the initial stages of the CRITIC methodology—the standard deviation for each criterion is derived from its respective vectors in Table 4. This statistical measure captures the inherent variability in and diversity of the data across the evaluated alternatives. For a thorough overview of the raw and normalized datasets, readers may refer to Tables S1 and S2 in the Supplementary Materials.
Table 4.
Standard deviations.
A higher standard deviation signifies a greater contrast intensity among the alternatives for a given criterion, thereby warranting a more significant objective weight. Conversely, a lower standard deviation suggests that the values are relatively homogeneous, indicating that the criterion offers less distinctive information and should be assigned a diminished priority.
In this case study, the highest value of standard deviation is obtained for urbanization, and hence, a higher priority is assigned to this criterion in the decision-making process, followed by cropland area. Then, the correlation matrix and information measure of each criterion are calculated using Equation (2).
The correlation matrix is derived by evaluating the inter-criteria relationships, where the information measure (Cj) quantifies the degree of redundancy or divergence between each criterion and the rest of the set. A higher Cj value indicates that a criterion provides more unique information (lower redundancy), thereby increasing its significance in the final decision-making framework. Based on the results presented in Table 5, criterion C6 (food vulnerability) achieved the highest informational content, followed by C7 (urbanization) and C2 (cropland area).
Table 5.
Weights of the criteria.
In the final stage of the weighting process, the objective weight for each criterion is determined according to Equation (3). As illustrated in Table 4, food vulnerability emerged as the most significant factor with a weight of 0.2035 followed by urbanization (0.1865) and cropland area (0.1407). The thorough list of weights for the remaining criteria is documented in Table 5.
The CRITIC method derives objective weights by evaluating two fundamental dimensions: contrast intensity and inter-criteria correlation. While contrast intensity is quantified through standard deviation values, the correlation between criteria is assessed using the information measure of each attribute. Detailed calculations regarding the inter-criteria correlation coefficients are documented in Table S3 of the Supplementary Material.
Once the criteria weights are established, the procedure shifts to the final evaluation stage, where the alternatives are ranked using the TOPSIS technique. This transition ensures that the objective importance of each indicator is directly integrated into the performance assessment of the alternatives.
To reach the values of 20 years, the representative indicator of country i on indicator j presented with the triangular fuzzy number () is defined as:
and
The median is preferred over the arithmetic mean as the central representative value to reduce sensitivity to extreme fluctuations and outliers in the 20-year time series. This choice is particularly relevant for nominal trade-value indicators, which may be affected by temporary price, exchange-rate, and commodity-market shocks. Nevertheless, because the lower and upper bounds of the triangular fuzzy numbers are based on the observed minimum and maximum values, this approach does not completely eliminate the influence of exceptional price conditions. Following the application of the triangular fuzzy number approach, the fuzzy weights for each criterion are detailed in Table 6. The complete dataset, including the expanded results for all indicators, is available in Table S4 of the Supplementary Material.
Table 6.
Decision matrix.
The normalized fuzzy decision matrix and the subsequent weighted normalized matrix are derived using Equations (7) and (8). Detailed computations for both matrices are provided in Tables S5 and S6 of the Supplementary Material. In addition, the fuzzy positive ideal solution (A*) and the fuzzy negative ideal solution (A−) are established via Equation (9), serving as benchmark points to evaluate the relative performance of each alternative. The specific A* and A− values for each criterion are summarized in Table 7 (Supplementary Material, Table S7).
Table 7.
Positive and negative ideal solutions.
In the subsequent phase, the distances from each alternative to the fuzzy positive (A*) and negative (A−) ideal solutions are determined. The proximity to the ideal best solution is quantified using the Vertex Method (Euclidean distance), as defined in Equation (10), while the distance to the ideal worst solution is computed via Equation (11). Alternatives exhibiting minimal distance to A* are considered most favorable. Finally, the closeness coefficient (performance score) for each alternative is derived through Equation (13). According to this metric, the alternative achieving the highest score represents the optimal choice. The thorough performance scores and corresponding distance measurements are detailed in Table 8.
Table 8.
Performance scores.
Based on the calculated performance scores, India emerges as the highest-ranked market in the exporter-independent structural screening, followed by the United States and China. These rankings indicate comparatively favorable destination-market conditions under the selected country-level criteria and should not be interpreted as definitive market-entry recommendations for a particular exporting country or firm.
In the last step of the application, scenario analysis is performed to investigate the impact of variations in criteria weights on the final ranking as a way of confirming the robustness of the suggested methodology. Indeed, these analyses are necessary to evaluate the stability of results in MCDM, which is characterized by its inherent uncertainties [53]. Since the determination of weights in MCDM is usually based on subjective approaches, such as AHP and ANP, conducting a sensitivity analysis is important to confirm the robustness of the results and the correctness of interpreting the data.
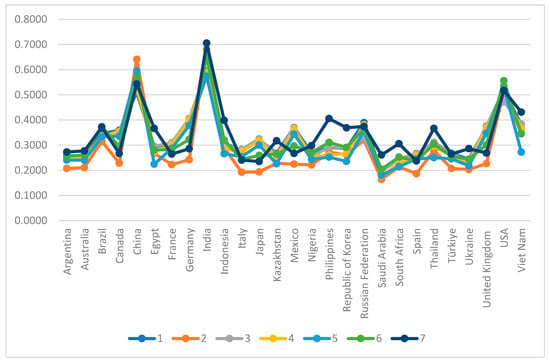
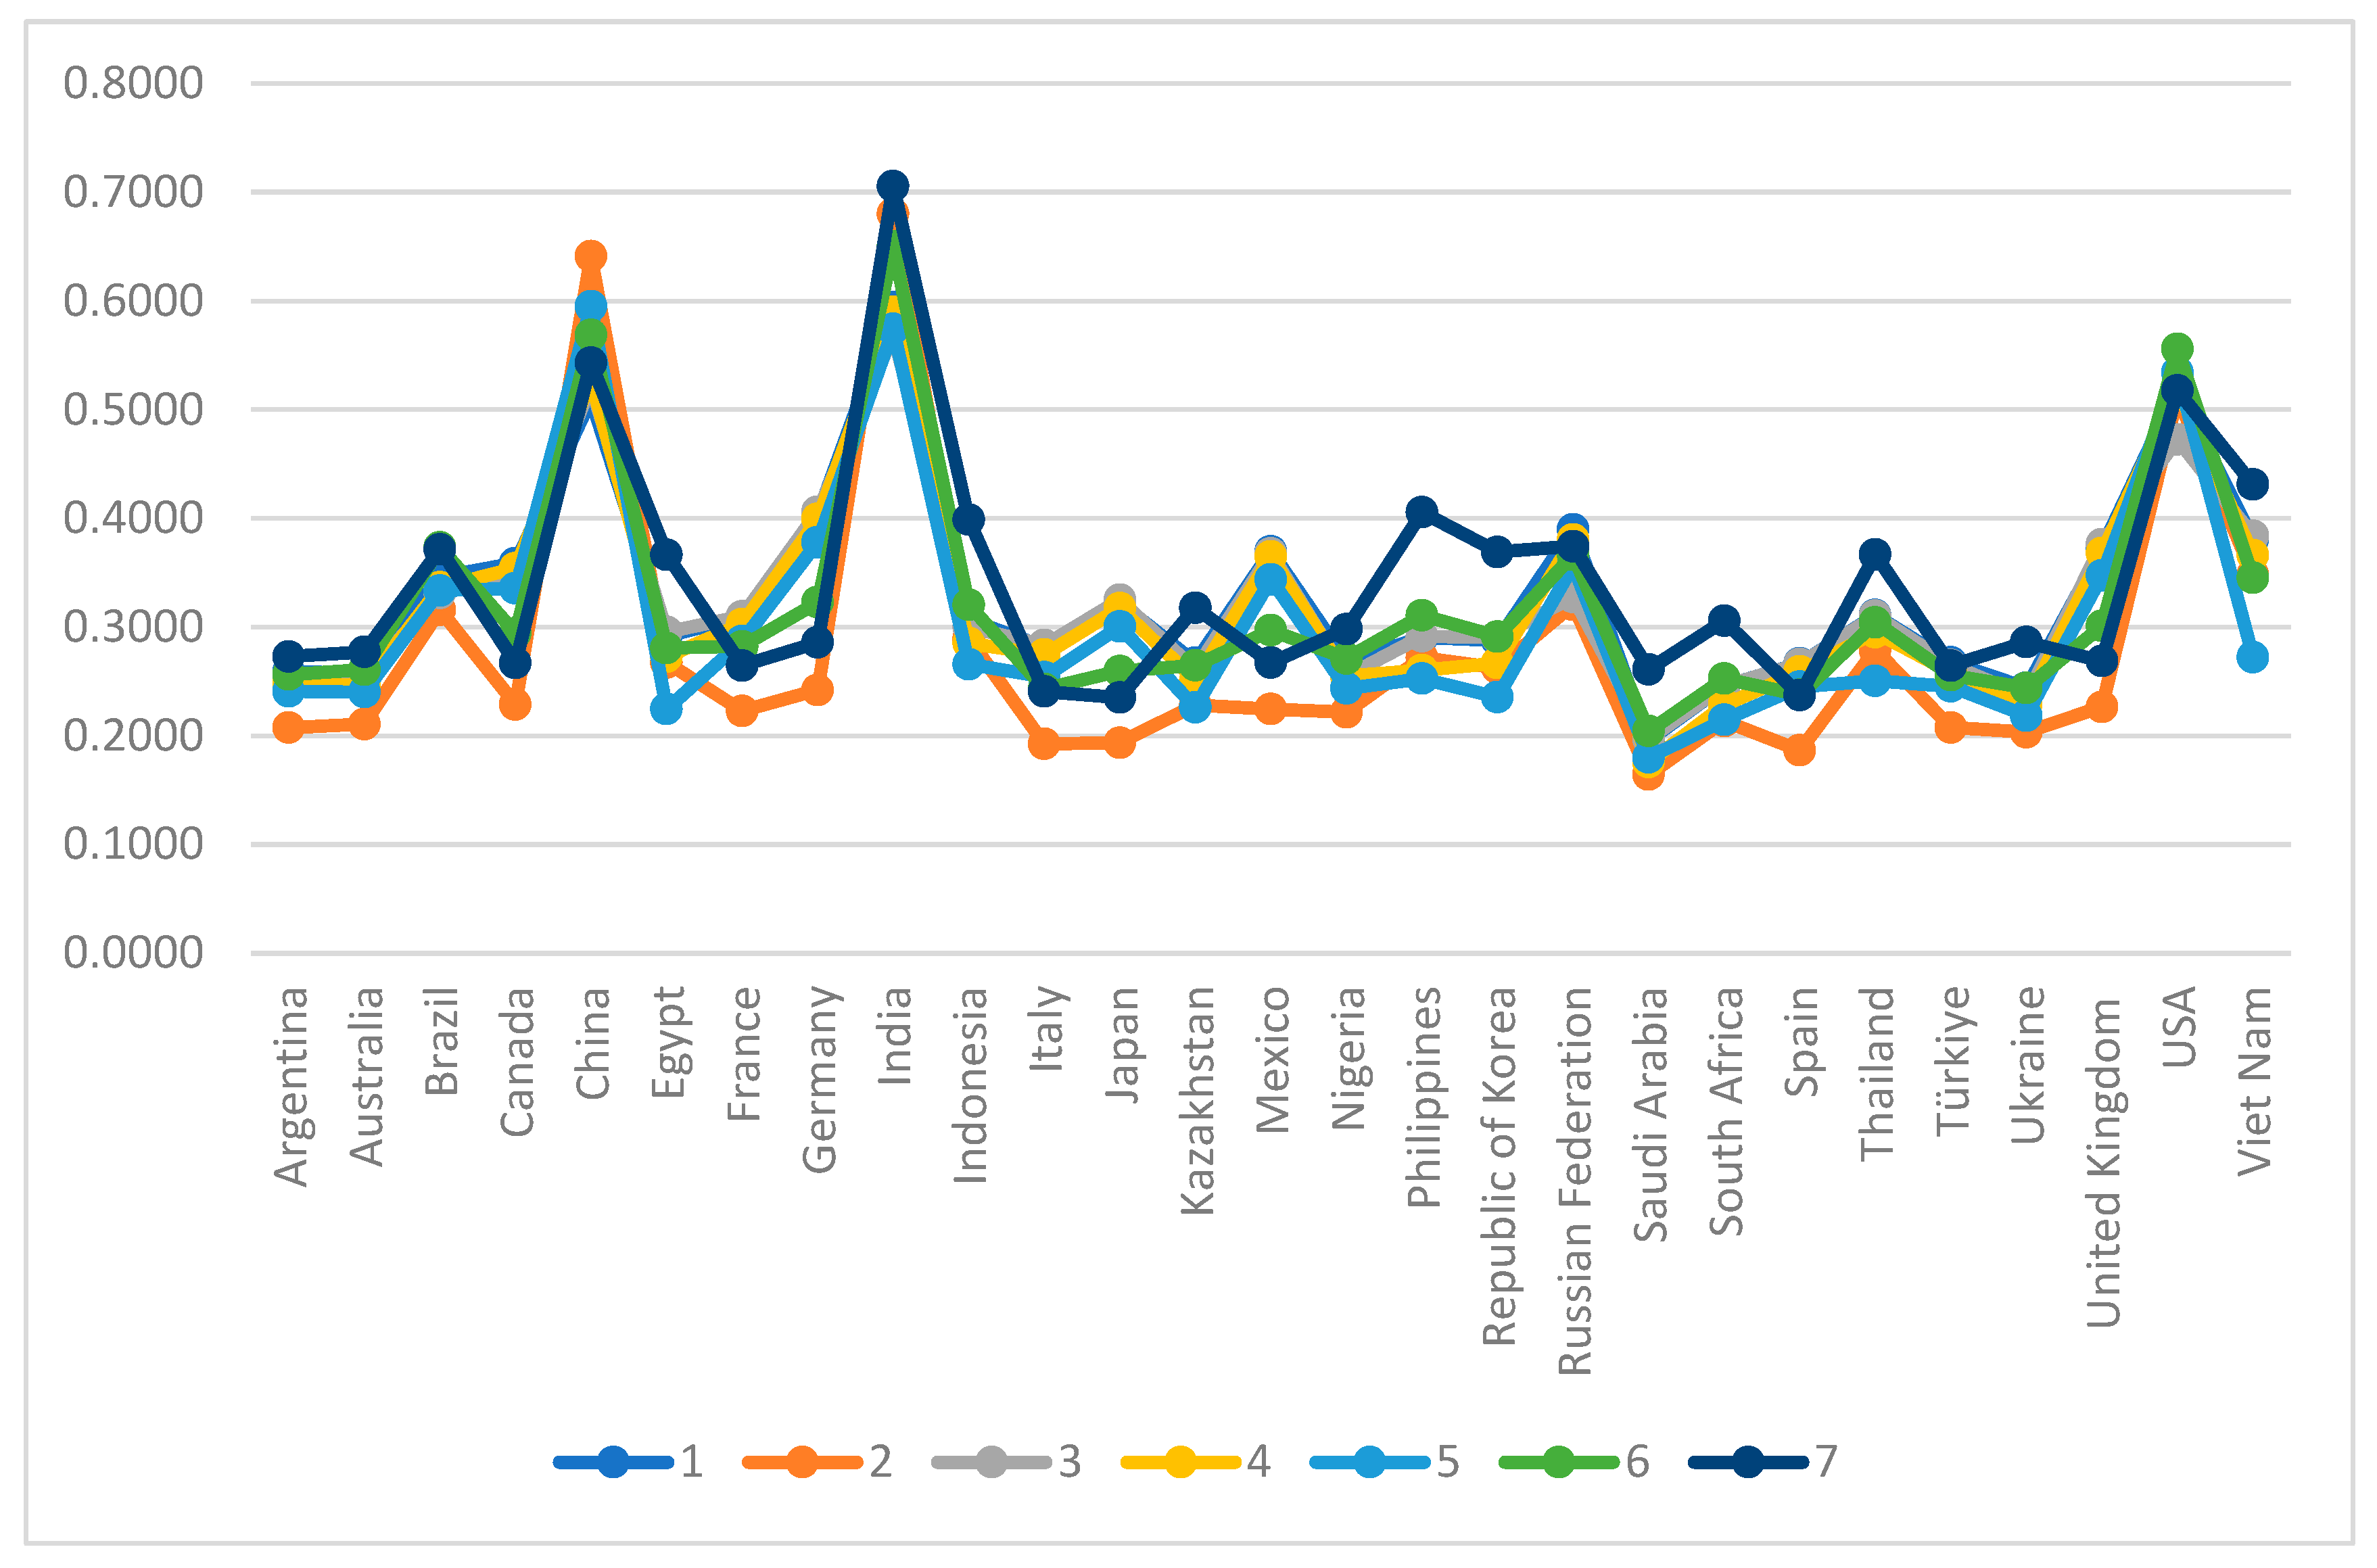
While the baseline model relies on data-driven CRITIC weights, the sensitivity analysis deliberately introduces controlled variations in criteria weights to evaluate how shifts in strategic priorities and indicator importance impact the final market rankings. These seven scenarios represent distinct weighting schemes designed to test the responsiveness and stability of the ranking framework under alternative policy and trade contexts.
The findings in Table 9 indicate strong stability at the top of the ranking, as India, the United States, and China remain within the top three positions across all seven scenarios. However, the quantitative robustness assessment shows greater sensitivity among several middle- and lower-ranked alternatives. Therefore, robustness is strongest for the leading alternatives rather than uniform across the full ranking.
Table 9.
Sensitivity analysis.
For a more intuitive understanding of the distributions, Figure 2 presents the graphical representation of the calculated values.
Figure 2.
Sensitivity analysis.
To quantitatively assess ranking robustness, Spearman rank correlations, maximum absolute rank changes, and top-three stability were calculated by comparing each alternative weighting scenario with the baseline CRITIC-weighted ranking. As shown in Table 10, the Spearman rank correlation coefficients ranged from 0.4695 to 0.9799 across Scenarios 2–7. Scenarios 3 and 4 exhibited particularly high agreement with the baseline ranking (ρ = 0.9799), whereas Scenario 7 produced the greatest overall ranking variation (ρ = 0.4695). The maximum absolute rank change ranged from 5 to 16 positions, indicating that some middle- and lower-ranked alternatives were sensitive to changes in criterion importance. Nevertheless, India, the United States, and China remained within the top three positions under all seven scenarios, corresponding to a top-three stability rate of 100%. These findings indicate that robustness is strongest for the leading alternatives, while the relative positions of several middle- and lower-ranked countries are more sensitive to alternative weighting structures.
Table 10.
Quantitative robustness assessment of country rankings across sensitivity scenarios.
5. Discussion and Conclusions
5.1. Study Objectives and Overview
This study developed and implemented a structured and systematic methodological framework to identify and prioritize potential target markets for nitrogen fertilizer exporters. The methodology was designed to ensure analytical transparency and replicability while capturing the multidimensional nature of international fertilizer trade and agricultural demand dynamics. The analysis was executed in four integrated stages, utilizing an MCDM approach to identify optimal export destinations. By integrating seven pivotal indicators—agricultural nitrogen use, cropland area, fertilizer use per unit of cropland, import value, trade balance, food vulnerability, and urbanization—this research provided a robust basis for evaluating 27 AMIS member countries through the objective CRITIC weighting and Fuzzy TOPSIS ranking techniques.
5.2. Evaluation of Findings and Results
The empirical results derived from the CRITIC method reveal that food vulnerability holds the highest significance (wj = 0.2035), indicating that it carries the greatest objective information within the decision matrix. This is closely followed by urbanization (wj = 0.1865) and cropland area (wj = 0.1407). The high information intensity (CCj) values for food vulnerability (1.9408) and urbanization (1.7788) suggest that these criteria exhibit significant conflict and contrast with other indicators, marking them as the primary drivers in market differentiation.
The Fuzzy TOPSIS ranking (Table 7) identifies India as the most optimal export destination (CCj = 0.5945), primarily due to its proximity to the fuzzy positive ideal solution. Following India, the United States (CCj = 0.5197) and China (CCj = 0.5098) are ranked as the second and third priority markets, respectively. Notably, these three nations are the only alternatives to exceed a performance score of 0.50, significantly outperforming others. The leading positions of India, China, and the United States reflect their combined performance across several dimensions rather than superiority in any single criterion. Their large agricultural production bases, substantial nitrogen-fertilizer use and import-market scale, together with their relative performance on land- and vulnerability-related indicators, contribute to their comparatively favorable structural profiles under the selected criteria. Conversely, cost criteria such as urbanization may partially offset these advantages, illustrating the multidimensional nature of the resulting rankings. Conversely, countries such as Saudi Arabia and Ukraine were positioned at the lower end of the ranking, reflecting a higher proximity to the negative ideal solution under the selected criteria. The robustness of these rankings was further validated through a comprehensive sensitivity analysis involving seven distinct scenarios, ensuring reliability amidst decision-making uncertainties.
5.3. Theoretical Contributions to Literature
The contribution of this study is primarily conceptual and application-oriented rather than being based on the novelty of MCDM itself. Previous studies have demonstrated the usefulness of MCDM techniques for export market selection, including applications in agricultural and commodity markets. Building on this literature, the present research extends the conventional target-market selection perspective by conceptualizing nitrogen-fertilizer demand as the outcome of both market conditions and broader structural pressures affecting agricultural production.
Accordingly, the proposed framework simultaneously incorporates three interconnected dimensions: market attractiveness, external supply dependence, and structural vulnerability. In addition to conventional indicators such as import value and trade balance, the model incorporates agricultural nitrogen use, fertilizer-use intensity, cropland availability, food vulnerability, and urbanization. This structure connects international market selection with agricultural intensification, land-use constraints, and food-security conditions, thereby providing a broader explanation of why fertilizer demand may remain structurally important in particular markets.
A further contribution is the use of an objective weighting procedure together with a long-term fuzzy representation of market conditions. CRITIC determines criterion weights from the information contained in the data, while the Fuzzy TOPSIS framework incorporates temporal variability in the evaluation of alternative markets. Thus, the study complements previous MCDM-based export market selection research by offering a nitrogen-fertilizer-specific decision-support framework focused on structurally sustained market potential rather than solely on contemporaneous trade attractiveness.
5.4. Managerial and Policy Implications
Beyond its theoretical novelty, the findings offer strategic insights for fertilizer producers and trade policymakers.
- For Managerial Decision-Makers: India, the United States, and China emerge as the highest-ranked markets in the exporter-independent structural screening and may therefore be considered priority candidates for further exporter-specific assessment. Their rankings reflect comparatively favorable conditions under the agricultural, trade, demographic, and vulnerability-related criteria included in the model. However, actual market-entry decisions should additionally consider exporter-specific factors such as transportation costs, tariffs, regulatory requirements, logistics, distribution networks, and geopolitical conditions.
- For Policymakers: The relatively high weight assigned to food vulnerability indicates that structural fragility is an important consideration when assessing potential fertilizer markets. Accordingly, market-oriented assessments should consider not only fertilizer demand potential but also the broader economic and institutional conditions affecting market stability. Land-Use Monitoring: The impact of urbanization serves as a critical signal for exporters to monitor land-use policies; rapid urban expansion may necessitate a shift toward high-efficiency, specialized nitrogen products to compensate for shrinking cultivable areas.
5.5. Contributions to Global Agricultural Sustainability
The sustainability relevance of this study should be interpreted primarily in terms of agricultural production continuity, input accessibility, and food-system resilience rather than as a direct assessment of the environmental sustainability of nitrogen-fertilizer use. Nitrogen fertilizers remain a critical input for sustaining agricultural productivity, particularly in countries where production is constrained by land availability, demographic pressures, and structural vulnerability. From this perspective, identifying markets in which fertilizer demand is likely to remain structurally important can contribute to more informed planning of fertilizer supply and international trade.
This perspective is also related to Sustainable Development Goal 2 (Zero Hunger), as stable access to productivity-enhancing agricultural inputs is an important component of maintaining food-production capacity. However, the present framework does not directly evaluate environmental dimensions such as nitrogen-use efficiency, nutrient losses, greenhouse-gas emissions, or pollution risks. Therefore, the sustainability contribution of the study is limited to the production and food-system dimensions of agricultural sustainability.
At the same time, the environmental consequences of excessive or inefficient nitrogen-fertilizer use should not be overlooked. Future research could extend the proposed framework by incorporating environmental indicators, including nitrogen-use efficiency, emissions intensity, nutrient-loss risks, and other measures of environmental performance, thereby enabling a broader assessment that integrates market attractiveness with environmental sustainability.
5.6. Limitations and Future Research Directions
Despite its contributions, this study is subject to several limitations that should be considered when interpreting the findings. First, the analysis is restricted to 27 AMIS countries, and the selection of evaluation criteria is partly constrained by the availability of comprehensive and harmonized cross-country datasets. Although AMIS countries represent a substantial share of global agricultural production, consumption, and trade, the resulting rankings should not be generalized to all potential N-fertilizer markets. Future research could extend the geographical coverage of the framework and incorporate additional indicators as comparable international data become available.
A second limitation concerns the temporal comparability of trade indicators expressed in nominal monetary values. The study covers the 2005–2024 period, during which international fertilizer markets experienced substantial fluctuations associated with commodity and energy prices, inflation, exchange-rate movements, and major global disruptions. Consequently, variations in nominal trade values may reflect price effects in addition to changes in underlying trade activity. Although the use of the median as the central value of the triangular fuzzy representation reduces sensitivity to extreme observations, the minimum and maximum values may still capture temporary price spikes or exceptional market conditions. Therefore, the trade-related indicators should not be interpreted solely as measures of structural changes in physical fertilizer trade. Future research could improve temporal comparability by employing constant-price trade values, appropriate fertilizer-price deflators, quantity-based net import measures, or shorter and rolling observation periods.
A third limitation concerns the exporter-independent nature of the proposed framework. The analysis evaluates the structural attractiveness of destination markets using country-level indicators and does not adopt the perspective of a specific exporting country or fertilizer-producing firm. Consequently, bilateral and firm-specific determinants of actual export feasibility—including geographic distance, freight costs, bilateral tariffs, trade agreements, sanctions, logistics and port conditions, payment risk, established distribution channels, product-registration requirements, and geopolitical relationships—are not incorporated into the present model. The resulting rankings should therefore be interpreted as a first-stage strategic screening of structurally attractive markets rather than as definitive market-entry recommendations for a particular exporter. Future research could extend the framework through a second-stage exporter-specific assessment incorporating bilateral trade costs, regulatory barriers, logistical conditions, and firm-level capabilities.
Finally, future studies may extend the current framework by examining broader indicator combinations and alternative criterion orientations under different decision objectives. In particular, the roles of urbanization and food vulnerability may be reassessed alongside alternative measures of agricultural scale, fertilizer-use intensity, import demand, and external dependence. Furthermore, environmental indicators such as nitrogen-use efficiency, nutrient losses, and emissions intensity could be integrated into future applications to provide a more comprehensive assessment combining market attractiveness, trade feasibility, and environmental sustainability.
Supplementary Materials
The following supporting information can be downloaded at: https://www.mdpi.com/article/10.3390/su182110709/s1, Table S1: Decision Matrix; Table S2: Normalized Matrix; Table S3: Correlation Matrix; Table S4: Decision Matrix; Table S5: Normalized Matrix; Table S6: Weighted Normalized Matrix; Table S7: Positive and Negative Ideal Solutions; Table S8: Scenario Analysis.
Author Contributions
Conceptualization, B.A. and P.S.; methodology, B.A., P.S. and Y.B.; investigation, B.A., P.S. and Y.B.; resources, B.A. and P.S.; data curation, B.A. and P.S.; writing—original draft preparation, B.A. and P.S.; writing—review and editing, B.A., P.S. and Y.B.; visualization, B.A., P.S. and Y.B.; supervision, B.A., P.S. and Y.B.; project administration, B.A. and P.S.; funding acquisition, B.A. All authors have read and agreed to the published version of the manuscript.
Funding
This research was funded by Karadeniz Technical University Scientific Research Projects Coordination Unit (BAP) under the International Research Collaboration project category (grant number SUA-2026-18330). The APC was also funded by Karadeniz Technical University Scientific Research Projects Coordination Unit (BAP) under the same project (SUA-2026-18330).
Institutional Review Board Statement
Not applicable.
Informed Consent Statement
Not applicable.
Data Availability Statement
The raw data supporting the conclusions of this article will be made available by the authors on request.
Acknowledgments
During the preparation of this manuscript, the authors used (ChatGPT, GPT-5, OpenAI) to support the ideation and initial draft of Figure 1. The authors have reviewed and edited the output and take full responsibility for the content of this publication.
Conflicts of Interest
The authors declare no conflict of interest.
Abbreviations
The following abbreviations are used in this manuscript:
| MCDM | Multi-Criteria Decision-Making |
| AMIS | Agricultural Market Information System |
| UN | United Nations |
| FSIN | Food Security Information Network |
| GNAFC | Global Network Against Food Crises |
| FAO | Food and Agricultural Organization |
| AHP | Analytic Hierarchy Process |
| HS | Harmonized System |
| WCO | World Customs Organization |
| CRITIC | Criteria Importance Through Intercriteria Correlation |
| TOPSIS | Technique for Order of Preference by Similarity to Ideal Solution |
| FPIS | Fuzzy Positive Ideal Solutions |
| FNIS | Fuzzy Negative Ideal Solutions |
| WDI | World Development Indicators |
| ND-GAIN | Notre Dame Global Adaptation Initiative |
References
- United Nations (UN). World Population Prospects. Available online: https://population.un.org/wpp/ (accessed on 2 March 2026).
- Global Report on Food Crises (GRFC). Global Report on Food Crises|Global Network Against Food Crises (GNAFC). Available online: https://www.fightfoodcrises.net/global-report-food-crises (accessed on 2 March 2026).
- Li, Y.; Li, X.; Tan, M.; Wang, X.; Xin, L. The Impact of Cultivated Land Spatial Shift on Food Crop Production in China, 1990–2010. Land Degrad. Dev. 2018, 29, 1652–1659. [Google Scholar] [CrossRef] [Scilit]
- van Vliet, J.; Yang, H.; Benz, N.; Cheng, C.; Doelman, J.; Gao, J.; Huang, Q.; Koomen, E.; Li, X.; Niu, L.; et al. Hotspots of Disagreement across Global Urban Land Projections until 2100. Geogr. Sustain. 2026, 7, 100403. [Google Scholar] [CrossRef] [Scilit]
- Gao, J.; O’Neill, B.C. Mapping Global Urban Land for the 21st Century with Data-Driven Simulations and Shared Socioeconomic Pathways. Nat. Commun. 2020, 11, 2302. [Google Scholar] [CrossRef] [Scilit]
- Thebo, A.L.; Drechsel, P.; Lambin, E.F. Global Assessment of Urban and Peri-Urban Agriculture: Irrigated and Rainfed Croplands. Environ. Res. Lett. 2014, 9, 114002. [Google Scholar] [CrossRef] [Scilit]
- Tu, Y.; Chen, B.; Yu, L.; Song, Y.; Wu, S.; Li, M.; Wei, H.; Chen, T.; Lang, W.; Gong, P.; et al. Raveling the Nexus between Urban Expansion and Cropland Loss in China. Landsc. Ecol. 2023, 38, 1869–1884. [Google Scholar] [CrossRef] [Scilit]
- Li, F.; Wu, S.; Liu, H.; Yan, D. Biodiversity Loss through Cropland Displacement for Urban Expansion in China. Sci. Total Environ. 2024, 907, 167988. [Google Scholar] [CrossRef] [Scilit]
- Deng, X.; Xu, X.; Cai, H.; Li, J. Assessment the Impact of Urban Expansion on Cropland Net Primary Productivity in Northeast China. Ecol. Indic. 2024, 159, 111698. [Google Scholar] [CrossRef] [Scilit]
- Zhao, T.; Zhang, X.; Liu, W.; Wang, J.; Li, Z.; Liu, L. Increase in Global per Capita Cropland Imbalance across Countries from 1985 to 2022: A Threat to Achieving Sustainable Development Goals. Geogr. Sustain. 2025, 6, 100239. [Google Scholar] [CrossRef] [Scilit]
- Chen, G.; Li, X.; Liu, X.; Chen, Y.; Liang, X.; Leng, J.; Xu, X.; Liao, W.; Qiu, Y.; Wu, Q.; et al. Global Projections of Future Urban Land Expansion under Shared Socioeconomic Pathways. Nat. Commun. 2020, 11, 537. [Google Scholar] [CrossRef] [Scilit]
- Food and Agriculture Organization of the United Nations (FAO). The Future of Food and Agriculture and Challenges; FAO: Rome, Italy, 2017. [Google Scholar]
- Fuglie, K.; Gautam, M.; Goyal, A.; Maloney, W.F. Technology and Productivity Growth in Agriculture Harvesting Prosperity; The World Bank Group: Washington, DC, USA, 2020. [Google Scholar]
- Ainan, H.B.; Luan, J. Sustaining the Economic Growth for Agriculture Sector in Benin#: How Do Agricultural Technologies Influence the Growth Rate? J. Dev. Agric. Econ. 2018, 10, 135–145. [Google Scholar] [CrossRef] [Scilit]
- Hou, M.; Xi, Z.; Zhao, S. Evaluating the Heterogeneity Effect of Fertilizer Use Intensity on Agricultural Eco-Efficiency in China: Evidence from a Panel Quantile Regression Model. Int. J. Environ. Res. Public Health 2022, 19, 6612. [Google Scholar] [CrossRef] [Scilit]
- Khush, G.S. Green Revolution: The Way Forward. Nat. Rev. Genet. 2001, 2, 815–822. [Google Scholar] [CrossRef] [Scilit]
- Trung, D.D.; Trang, B.T.T.; Dudić, B. Application of the Depart Method in Ranking Alternatives for Mechanical Machining and Chemical Extraction Processes. Appl. Eng. Lett. J. Eng. Appl. Sci. 2026, 11, 55. [Google Scholar] [CrossRef] [Scilit]
- Aghdaie, M.H.; Zolfani, S.H.; Zavadskas, E.K. Market Segment Evaluation and Selection Based on Application of Fuzzy AHP and COPRAS-G Methods. J. Bus. Econ. Manag. 2013, 14, 213–233. [Google Scholar] [CrossRef] [Scilit]
- Sener, H.Y. Determining New Markets Using Analytic Hierarchy Process: Case Study in Güral Porcelain. Int. J. Mark. Stud. 2014, 6, p149. [Google Scholar] [CrossRef] [Scilit]
- Aghdaie, M.H.; Alimardani, M. Target Market Selection Based on Market Segment Evaluation: A Multiple Attribute Decision Making Approach. Int. J. Oper. Res. 2015, 24, 262–278. [Google Scholar] [CrossRef] [Scilit]
- Güçdemir, H.; Selim, H. Integrating Multi-Criteria Decision Making and Clustering for Business Customer Segmentation. Ind. Manag. Data Syst. 2015, 115, 1022–1040. [Google Scholar] [CrossRef] [Scilit]
- Khalili, K.; Khalilpour, K. Customer Classification in Banking System of Iran Based on the Credit Risk Model Using Multi-Criteria Decision-Making Models. Accounting 2016, 2, 177–184. [Google Scholar] [CrossRef] [Scilit]
- Ghorabaee, M.K.; Amiri, M.; Zavadskas, E.K.; Hooshmand, R.; Antuchevičienė, J. Fuzzy Extension of the CODAS Method for Multi-Criteria Market Segment Evaluation. J. Bus. Econ. Manag. 2017, 18, 1–19. [Google Scholar] [CrossRef] [Scilit]
- Oey, E.; Noviyanti; Lim, S. Evaluating International Market Selection with Multi-Criteria Decision Making Tools—A Case Study of a Metal Company in Indonesia. Int. J. Bus. Excell. 2018, 16, 341–361. [Google Scholar] [CrossRef] [Scilit]
- Ünal, Z.; İpekçi Çetin, E. Gübre Üreticisinin Hedef Pazar Seçiminde Bütünleşik AHP-TOPSIS Yöntemi. Mediterr. Agric. Sci. 2019, 32, 357–364. [Google Scholar] [CrossRef] [Scilit]
- Gopalan, R.; Desai, M.; Acharjya, D.P. Customer Classification in Indian Retail Sector—A Comparative Analysis of Various Machine Learning Approaches. Int. J. Oper. Quant. Manag. 2020, 26, 1–28. [Google Scholar] [CrossRef] [Scilit]
- Yıldız, A.; Özbek, A. Selection of Socks Export Markets for Turkey Using Multi-Criteria Decision Making Methods. Sigma J. Eng. Nat. Sci. 2021, 38, 795–815. [Google Scholar]
- Ray, M.; Ray, M.; Muduli, K.; Banaitis, A.; Kumar, A. Integrated Approach of Fuzzy Multi-Attribute Decision Making and Data Mining for Customer Segmentation. E M Econ. Manag. 2021, 24, 174–188. [Google Scholar] [CrossRef] [Scilit]
- Vanegas-López, J.G.; Baena-Rojas, J.J.; López-Cadavid, D.A.; Mathew, M. International Market Selection: An Application of Hybrid Multi-Criteria Decision-Making Technique in the Textile Sector. Rev. Int. Bus. Strategy 2021, 31, 127–150. [Google Scholar] [CrossRef] [Scilit]
- Çelik, P.; Akmermer, B. Target Market Selection for the Major Aquaculture Products of Turkey-an Evaluation on Export Markets by Hybrid Multi-Criteria Decision-Making Approach. Aquac. Stud. 2022, 22, AQUAST691. [Google Scholar] [CrossRef] [Scilit]
- Duong, T.T.T.; Nguyen, X.T. TOPSIS Model Based on Entropy and Similarity Measure for Market Segment Selection and Evaluation. Asian J. Econ. Bank. 2021, 5, 194–203. [Google Scholar] [CrossRef] [Scilit]
- Tripathy, B.B.; Singh, S. A Fuzzy Topsis Approach for Market Segment Evaluation and Selection. Fuzzy Econ. Rev. 2022, 27, 33–50. [Google Scholar] [CrossRef] [Scilit]
- Akhyani, F.; Komeili Birjandi, A.; Sheikh, R.; Sana, S.S. New Approach Based on Proximity/Remoteness Measurement for Customer Classification. Electron. Commer. Res. 2022, 22, 267–298. [Google Scholar] [CrossRef] [Scilit]
- Yeşilkaya, M.; Çabuk, Y. A Hybrid Mathematical Model for International Target Market Decision: The Case of Fibreboard Industry. Wood Mater. Sci. Eng. 2023, 18, 2013–2028. [Google Scholar] [CrossRef] [Scilit]
- Baki, R. The Evaluation of Target Markets for Hazelnut Exports with the Classification Approach of Potential Market Alternatives. Br. Food J. 2023, 125, 3540–3552. [Google Scholar] [CrossRef] [Scilit]
- Baki, R. Evaluating and Classifying Market Alternatives Using the CAPMA Technique to Assess Potential Export Volume: An Application for Turkey’s Fig Exports. Br. Food J. 2024, 126, 3301–3315. [Google Scholar] [CrossRef] [Scilit]
- Öztürkçü, N. Evaluation of Potential Alternative Markets for Dried Apricot Exports Using the CAPMA Technique: An Application to Türkiye. Turk. J. Agric. Econ. 2025, 31, 77–90. [Google Scholar] [CrossRef] [Scilit]
- Meral, H.; Özdemir, Y.E.; Gündüz, O. Navigating Global Agri-Food Markets: An Entropy-Based TOPSIS Approach for Strategic Diversification of Türkiye’s Dried Apricot Exports. Appl. Fruit Sci. 2025, 67, 403. [Google Scholar] [CrossRef] [Scilit]
- Akmermer, B.; Senturk, P. Analyzing Growing Wood Pellet Markets in Face of Renewable Energy Demand: Making Informed Trading Decisions with Multi-Criteria Decision-Making Model. Drv. Ind. 2025, 76, 57–67. [Google Scholar] [CrossRef] [Scilit]
- FAO Statistical Database (FAOSTAT). Statistics|FAO|Food and Agriculture Organization of the United Nations. Available online: https://www.fao.org/statistics/en (accessed on 2 March 2026).
- Notre Dame Global Adaptation Initiative (ND-GAIN). ND-GAIN Country Index; University of Notre Dame: Notre Dame, IN, USA, 2026; Available online: https://gain.nd.edu/our-work/country-index/ (accessed on 22 June 2026).
- World Bank’s World Development Indicators. World Development Indicators|DataBank. Available online: https://databank.worldbank.org/source/world-development-indicators (accessed on 2 March 2026).
- Global Report on Food Crises (GRFC). Global Report on Food Crises (GRFC) 2025|World Food Programme. Available online: https://www.wfp.org/publications/global-report-food-crises-grfc (accessed on 2 March 2026).
- Diakoulaki, D.; Mavrotas, G.; Papayannakis, L. Determining objective weights in multiple criteria problems: The CRITIC method. Comput. Oper. Res. 1995, 22, 763–770. [Google Scholar] [CrossRef] [Scilit]
- Hwang, C.L.; Yoon, K. Multiple Attribute Decision Making: Methods and Applications: A State-of-the-Art Survey; Lecture Notes in Economics and Mathematical Systems; Springer: Berlin/Heidelberg, Germany, 1981; Volume 186. [Google Scholar] [CrossRef] [Scilit]
- Perçin, S.; Aldalou, E. Financial Performance Evaluation of Turkish Airline Companies Using Integrated Fuzzy AHP Fuzzy Topsis Model. Uluslar. İktisadi Ve İdari İncelemeler Derg. 2018, 583–598. [Google Scholar] [CrossRef] [Scilit]
- Wang, Y.J.; Lee, H.S. Generalizing TOPSIS for Fuzzy Multiple-Criteria Group Decision-Making. Comput. Math. Appl. 2007, 53, 1762–1772. [Google Scholar] [CrossRef] [Scilit]
- Lee, C.-C.; Chiang, C.; Chen, C.-T. An Evaluation Model of E-Service Quality by Applying Hierarchical Fuzzy TOPSIS Method. Int. J. Electron. Bus. Manag. 2012, 10, 38–49. [Google Scholar]
- Mohaghar, A.; Fathi, M.R.; Faghih, A.; Turkayesh, M.M. An Integrated Approach of Fuzzy ANP and Fuzzy TOPSIS for R&D Project Selection: A Case Study. Aust. J. Basic Appl. Sci. 2012, 6, 66–75. [Google Scholar]
- Kuo, M.S.; Tzeng, G.H.; Huang, W.C. Group Decision-Making Based on Concepts of Ideal and Anti-Ideal Points in a Fuzzy Environment. Math. Comput. Model. 2007, 45, 324–339. [Google Scholar] [CrossRef] [Scilit]
- Çakir, S.; Perçïn, S. AB Ülkeleri’nde Bütünleşik Entropi Ağirlik-Topsis Yöntemiyle Ar-Ge Performansinin Ölçülmesi. Uludağ Üniversitesi İktisadi Ve İdari Bilim. Fakültesi Derg. 2013, 32, 77–95. [Google Scholar]
- Eyüboğlu, K.; Çelik, P. Financial Performance Evaluation of Turkish Energy Companies with Fuzzy AHP and Fuzzy TOPSIS Methods. Bus. Econ. Res. J. 2016, 7, 21–37. [Google Scholar] [CrossRef] [Scilit]
- Karande, P.; Zavadskas, E.K.; Chakraborty, S. A Study on the Ranking Performance of Some MCDM Methods for Industrial Robot Selection Problems. Int. J. Ind. Eng. Comput. 2016, 7, 399–422. [Google Scholar] [CrossRef] [Scilit]

Disclaimer/Publisher’s Note: The statements, opinions and data contained in all publications are solely those of the individual author(s) and contributor(s) and not of MDPI and/or the editor(s). MDPI and/or the editor(s) disclaim responsibility for any injury to people or property resulting from any ideas, methods, instructions or products referred to in the content. |
© 2026 by the authors. Licensee MDPI, Basel, Switzerland. This article is an open access article distributed under the terms and conditions of the Creative Commons Attribution (CC BY) license.