


Abstract
The transition toward circular and resource-efficient industrial systems requires effective strategies for recovering secondary raw materials, reducing resource losses, and improving the environmental and economic performance of industrial processes. This study examines waste paraffin refining as a circular resource recovery process and develops an integrated framework for improving resource efficiency, process stability, and product quality. An empirical–analytical case study was conducted in a Polish paraffin refining enterprise using process mapping, Ishikawa analysis, Failure Mode and Effects Analysis (FMEA), Critical to Quality (CTQ) analysis, Statistical Process Control (SPC), and process capability analysis. The results indicate that the heterogeneity of waste paraffin, inappropriate sorbent selection, insufficient process standardization, sampling limitations, and filtration instability are the main factors affecting process performance. Color and optical purity were identified as critical quality attributes. The historical analysis reported Cp = 1.18 and Cpk = 0.86 under the company’s operational color-score range of 24–30 points. These values are reported historical estimates whose underlying batch-level observations could not be independently re-examined; the measurement system has not been independently validated. The operational range should not be interpreted as an independently validated bilateral product specification, particularly because the upper value of 30 may represent the endpoint of the company-specific scoring scale. To improve resource utilization and reduce nonconforming production, an integrated improvement framework was developed incorporating standardized sampling, a sorbent selection matrix, in-line color monitoring, and SPC-based real-time monitoring. A deterministic illustrative scenario was used to examine the potential effect of assumed improvements in process centering and variability. Under the assumed parameters, Cp and Cpk increased from the reported current-state values of 1.18 and 0.86 to 1.67 and 1.39, respectively. These values are conditional analytical results, not empirically observed post-implementation outcomes. The assumed parameters were not estimated from production data collected after implementation, and the effectiveness of the proposed interventions remains to be verified under industrial operating conditions. The proposed framework illustrates how integrated quality management, statistical control, process monitoring, and digitalization may support more systematic management of waste-paraffin refining and secondary-resource utilization. The study indicates how process-level optimization may support circular resource flows by improving the management and control of waste paraffin as a secondary raw material. The proposed approach may contribute to reducing nonconforming production and improving resource utilization, although these effects require quantitative industrial validation.
1. Introduction
The transition toward circular and resource-efficient industrial systems is increasingly important for manufacturing enterprises facing growing pressure to reduce material losses, improve resource utilization, and maintain stable production under changing market and environmental conditions. In this context, the recovery and reuse of secondary raw materials represent an important pathway for reducing dependence on primary resources and improving the efficiency of industrial resource flows [1]. These challenges are particularly relevant to petroleum- and paraffin-based processing, where the variability of recovered raw materials, energy-intensive processing operations, and stringent product-quality requirements can significantly influence the efficiency and predictability of resource recovery processes.
Waste paraffin represents a potentially valuable secondary resource that can be recovered and converted into a material suitable for further industrial applications [2]. Its refining can therefore be considered not only as a quality-improvement operation, but also as a circular resource recovery process in which a waste stream is transformed into a usable secondary raw material. Effective recovery, however, depends on the ability to control variability in the incoming material and maintain stable refining conditions. Variations in waste paraffin composition, impurities, moisture content, and other raw material characteristics may affect adsorption efficiency, filtration performance, product color, optical purity, and ultimately the proportion of material that can be successfully recovered and utilized. Consequently, process stability and quality control constitute important enabling factors for efficient management of secondary resources.
Paraffin is a mixture of saturated hydrocarbons, typically solid at room temperature, colorless or white, tasteless, and odorless, and it leaves a greasy residue on the skin [3,4]. It is insoluble in water and ethanol but soluble in organic solvents such as benzene, hexane, and chloroform. Its molecular structure, consisting mainly of linear and branched alkanes, determines important physical and chemical properties, including melting point, crystallinity, viscosity, and chemical inertness [5]. Linear paraffins generally enhance crystallinity and hardness, whereas branched paraffins favor amorphous phases and lower hardness, thereby influencing the properties of paraffin-based materials. These characteristics are important from the perspective of refining because variations in feedstock composition may influence both processing conditions and the properties of the recovered material.
Paraffin refining involves a number of operations intended to remove impurities and improve the physical and chemical characteristics of the recovered material [6]. Depending on the required product specification, these operations may include dewaxing, chemical decolorization, adsorption purification using bleaching earths or activated carbon, distillation fractionation, recrystallization, and, in selected applications, hydrorefining for pharmaceutical or cosmetic-grade products [7]. The objective is to obtain a stable material with properties appropriate for subsequent applications. Important quality parameters include melting point, viscosity, color, odor, and optical purity, which determine the suitability of paraffin for applications including candles, cosmetics, pharmaceuticals, food-related products, packaging, automotive products, and phase-change-material (PCM) technologies [8,9,10]. From a resource-efficiency perspective, maintaining these parameters within the required specifications is important because process deviations may result in nonconforming material, additional processing, material losses, and inefficient use of energy and auxiliary resources [11,12].
Recent research has increasingly focused on improving the technological efficiency of paraffin-related processes through process intensification, energy-efficiency measures, solvent dewaxing, heat integration, and catalytic processing [13]. Quality-management and statistical process-control literature provides established approaches for monitoring process variability and supporting process control. Such approaches are particularly relevant to secondary-resource processing because systematic information about process and product conditions can support the earlier identification of deviations and more adaptive responses to variability in recovered feedstock.
The effective management of resource recovery processes also requires systematic identification of the factors responsible for process variability and material losses [14,15]. Quality-management and statistical process-control literature provides established approaches for identifying sources of variability, prioritizing operational risks, defining critical quality characteristics, evaluating measurement systems, and monitoring process stability. Specifically, Failure Mode and Effects Analysis (FMEA) supports structured identification and prioritization of process risks [16], Statistical Process Control (SPC) supports the detection of process variation and special-cause signals [17], while Measurement System Analysis (MSA) is used to evaluate the reliability of measurement systems [18]. Ishikawa and Pareto analyses provide complementary tools for structuring and prioritizing potential causes of process variability.
Although these methods have been widely used in manufacturing and process improvement, their application in waste paraffin refining can provide an additional function: supporting the stable recovery and utilization of a secondary resource. In this context, quality management is treated as an operational mechanism that enables more effective resource management rather than as an independent objective of the refining process [19,20,21,22,23]. The effective recovery of waste paraffin depends not only on the availability of waste streams, but also on the ability to maintain stable process conditions and consistently obtain a secondary raw material meeting predefined quality requirements.
Sustainability and circular economy principles further strengthen the importance of efficient waste paraffin recovery. Sustainable manufacturing emphasizes the reduction in waste, efficient use of raw materials and energy, and improvement in production processes [24]. Circular economy strategies seek to retain the value of materials within production and consumption systems through recovery, reuse, recycling, and more efficient management of resource flows [25]. For waste paraffin, refining provides an opportunity to recover material that would otherwise require disposal or lose its potential economic value. Improving the stability and predictability of this process may therefore contribute to more efficient use of secondary paraffin resources and reduce the generation of nonconforming material. Related environmental and operational studies have also addressed issues such as wax deposition, filtration optimization, process integration, and energy use in petroleum- and paraffin-related systems [26,27]. Environmental and quality-management standards, including ISO 9001:2015 [28] and ISO 14001:2015 [29], provide complementary organizational frameworks for systematic quality and environmental management.
Digitalization offers a further opportunity to strengthen the management of circular resource flows. In-line sensors, automated data acquisition, Statistical Process Control, and process databases can provide continuous information on critical process parameters and product characteristics. In waste paraffin refining, such a system could support monitoring of color and optical purity as well as selected operating conditions, including mixing temperature and time, filtration pressure, and sorbent dosage. The resulting process information could subsequently be used to improve decision-making concerning sorbent selection, process adjustment, and the routing of nonconforming material for reprocessing. Consequently, digital process monitoring can be viewed as an enabling mechanism for improving the predictability and efficiency of secondary-resource recovery rather than solely as a technological improvement in quality control.
Despite the growing literature on paraffin refining technologies, adsorption systems, process intensification, sustainability, and individual quality-management methods, these research areas have largely been investigated separately. Limited attention has been given to an integrated approach in which the variability of waste paraffin as a secondary raw material is considered together with process risks, critical quality characteristics, statistical process capability, and opportunities for digital monitoring. In particular, there is a research gap concerning the integration of process mapping, Ishikawa analysis, FMEA, CTQ, MSA, SPC, and process capability assessment into a framework explicitly oriented toward improving the efficiency and stability of waste paraffin recovery. Addressing this gap is relevant to circular resource management because the effectiveness of secondary-resource recovery depends not only on the availability of waste material, but also on the ability of the refining process to convert variable waste streams into consistent and usable secondary raw materials.
Therefore, the objective of this study was to develop and evaluate an integrated process-improvement framework for waste paraffin refining that supports circular resource recovery, resource efficiency, process stability, and product quality. The research focused on identifying the main sources of process variability and operational risk, determining critical quality characteristics, assessing the capability of the existing refining process, and defining improvement measures that could reduce nonconforming material and improve the utilization of recovered paraffin. The study combines process mapping, Ishikawa analysis, FMEA, CTQ analysis, SPC, and process capability assessment, while a formal MSA is identified as a prerequisite for future implementation of automated measurement.
The scientific contribution of the study lies in linking process-level quality and statistical-management methods with the broader objective of secondary-resource recovery. The contribution of the study is conceptual and application-oriented rather than methodological in the sense of introducing a new statistical or quality-management method. Instead, the study integrates established process-analysis, quality-management, statistical-control, and digital-monitoring tools within the specific operational context of waste paraffin recovery. The proposed framework links process variability and product-quality control with the objective of maintaining waste-derived paraffin as a usable secondary raw material. The proposed framework incorporates standardized sampling, a sorbent-selection matrix, in-line color monitoring, and real-time SPC as mechanisms for improving the stability and predictability of waste paraffin refining. The study also evaluates an illustrative deterministic improvement scenario based on assumed process-centering and variability parameters to examine the potential change in process capability. These projected results are not treated as evidence of industrial implementation, but as an analytical basis for identifying the potential benefits and directions for future pilot-scale validation.
By integrating circular resource recovery, process optimization, quality management, and digital monitoring, the study provides a process-level framework through which process interventions may support more efficient utilization of secondary paraffin resources [30]. The study does not quantify the resulting changes in material yield, energy use, sorbent consumption, or residual waste, and therefore does not claim a quantified resource-efficiency improvement. The proposed approach is intended to reduce material losses and nonconforming production, improve the predictability of the recovered material, and provide a basis for further assessment of material, energy, environmental, and economic performance at industrial scale. In this way, waste paraffin refining is considered as part of a broader transition toward more efficient and sustainable industrial resource systems.
2. Materials and Methods
2.1. Research Design and Analytical Framework
The study employed an empirical–analytical case study approach to investigate waste paraffin refining as a secondary resource recovery process in a Polish paraffin refining enterprise. The research framework combined process analysis, quality management, risk assessment, Statistical Process Control (SPC), and process capability analysis to identify factors affecting process stability, product conformity, and the efficiency of recovered paraffin utilization.
The methodology was structured into three stages. Stage I focused on the analysis of the current waste paraffin refining process and the identification of critical sources of process variability, operational risk, quality losses, and material losses. Stage II involved the development of an improvement framework based on the results of the current-state analysis. The proposed framework incorporated standardized sampling, improved sorbent selection, additional measurement points, in-line monitoring, and SPC-based process control. Stage III involved an illustrative scenario-based evaluation of the proposed improvement framework using process capability calculations based on assumed process parameters.
The study employed process mapping, SWOT analysis, SIPOC analysis, Pareto–Lorenz analysis, Ishikawa analysis, Failure Mode and Effects Analysis (FMEA), Critical to Quality (CTQ) analysis, Statistical Process Control (SPC), and process capability analysis using Cp and Cpk indices. These methods were selected to provide complementary information on process structure, sources of variability, operational risks, critical quality characteristics, measurement reliability, statistical stability, and process capability.
The analytical framework was designed to connect process-level quality control with the broader objective of efficient secondary-resource recovery. Particular attention was given to factors that may influence the proportion of waste paraffin that can be converted into a usable product, including variability of the incoming waste material, sorbent selection, sampling procedures, mixing conditions, filtration performance, and product color. Process deviations were considered in relation to their potential consequences for nonconforming material, reprocessing requirements, and inefficient utilization of material and energy resources.
No technological modifications proposed within the improvement framework were implemented under industrial operating conditions during the study. Consequently, the assessment of the proposed improvements was conducted using an illustrative deterministic scenario based on assumed process-centering and variability parameters rather than experimental post-implementation observations. The scenario-based calculations were used to estimate the potential change in process capability and process centering associated with the proposed measures. They are therefore interpreted as a scenario analysis and not as empirical evidence of confirmed industrial improvement.
2.2. Methodology for Analysis and Improvement in the Waste Paraffin Recovery Process
2.2.1. Stage I—Current-State Analysis
The first stage focused on characterizing the existing waste paraffin refining process and identifying the main factors affecting process performance and secondary-resource utilization. Process mapping and SIPOC analysis were used to identify suppliers, material and energy inputs, major process stages, outputs, and customers. SWOT analysis and benchmarking were considered as supplementary criteria to identify internal and external factors influencing technological performance, resource utilization, digitalization opportunities, and operational risks. Benchmarking was used only as a supplementary qualitative comparison of the investigated process with established process-improvement practices reported in the literature and relevant industrial quality-management approaches. It was not based on a quantitative comparison with a defined external reference plant or standardized benchmark dataset.
Selected basic quality-management tools were subsequently applied to analyze process variability and nonconformities. Pareto–Lorenz analysis was used to identify the principal sources of quality losses and product rejection. The Ishikawa (6M) diagram was used to classify potential causes of process variability according to Machines, Methods, People, Materials, Measurements, and Environment. Histograms, check sheets, and control charts were used to characterize the distribution and stability of selected process and product parameters based on available production data.
Failure Mode and Effects Analysis (FMEA) was applied to identify and prioritize potential failure modes occurring at critical stages of the refining process. The analysis considered the severity, occurrence, and detectability of individual failure modes and was used to calculate Risk Priority Numbers (RPNs) [16]. Particular attention was given to failure modes that could affect product conformity, process continuity, and the effective utilization of recovered paraffin. For the FMEA assessment, Severity (S), Occurrence (O), and Detection (D) were evaluated using a 1–10 ordinal scale. Severity represented the potential impact of a failure mode on product conformity, process continuity, operational safety, and the utilization of recovered paraffin. Occurrence represented the estimated likelihood or frequency of a failure mode under the observed operating conditions. Detection represented the likelihood that a failure would remain undetected before affecting a subsequent process stage or the final product, with higher values indicating lower detectability. The Risk Priority Number (RPN) was calculated as S × O × D. Table 1 presents a summary of the datasets used in the study.
Table 1.
Summary of datasets used in the study.
The 72% conformity rate refers to overall product conformity according to the company’s quality requirements and should not be interpreted as a color-specific nonconformity rate. The color-based datasets were analyzed separately using the company’s color specification limits of 24–30 points.
The available production records did not contain sufficient documentation to reconstruct the exact denominator and collection period retrospectively. Therefore, the reported 72% conformity rate is presented as a descriptive proportion from the available company records and should not be interpreted as a directly comparable rate to the 65-, 50-, or 25-observation analytical datasets.
The production-record dataset was used to describe conformity, the 65-observation dataset to characterize the distribution of color, the 25-observation historical I-MR analysis documented in the original study, the 50-batch dataset to assess current-state process capability, and the 15-customer dataset to examine the association between color and customer satisfaction.
The FMEA assessment was performed by the authors based on process observations, company production records, quality-control information, and consultations concerning the investigated refining process. Severity (S), Occurrence (O), and Detection (D) were evaluated jointly using a consensus-based 1–10 ordinal scale, and the Risk Priority Number (RPN) was calculated as S × O × D. The resulting risk ratings were used to prioritize corrective actions rather than as objective probability estimates. The High and Medium priority classifications are case-specific and are not intended as universal FMEA thresholds.
No fixed numerical RPN threshold was used to distinguish High from Medium priority. The priority category was assigned during the consensus assessment by considering the combined Severity, Occurrence, and Detection ratings together with the operational consequences of each failure mode and its potential effect on product conformity, process continuity, and secondary-resource utilization. Therefore, the High and Medium classifications in represent case-specific risk-prioritization decisions rather than universal numerical RPN thresholds. This approach reflects the internal risk-prioritization practice applied in the investigated enterprise and should not be interpreted as a generally applicable FMEA classification rule.
Because FMEA scoring involves expert judgment, the resulting RPN values were treated as a structured prioritization tool for identifying improvement priorities rather than as objective probability estimates.
Critical to Quality (CTQ) analysis was used to identify the product and process characteristics most relevant to customer requirements and final product conformity. Measurement System Analysis (MSA) was identified as a necessary step for assessing the reliability and repeatability of the measurement system [18]. The 5 Whys method was additionally used as a structured root-cause exploration tool for the principal process nonconformity, namely inadequate paraffin color after refining. Because the study was based on a case-study analysis and did not include controlled causal experiments, the causes identified through the 5 Whys analysis were treated as process-based explanations supported by observations and company information rather than as experimentally verified causal mechanisms. Where direct evidence was unavailable, the corresponding explanations were considered hypotheses requiring verification during future industrial implementation. The current-state process capability was evaluated using Cp and Cpk indices in accordance with established statistical quality-control methodology [17]. Cp characterizes the relationship between process variability and the specification width, whereas Cpk additionally accounts for the position of the process mean relative to the specification limits. Before interpreting these indices, the distributional characteristics of the paraffin color measurements were assessed using the available graphical evidence, including the histogram and normal probability plot [17,30].
The distributional characteristics of the paraffin color measurements were considered using the available graphical evidence, including the histogram and normal probability plot. Because the complete original batch-level observations were not retained, a retrospective numerical normality test could not be independently reproduced. Accordingly, the historical Cp and Cpk values are reported as retained results from the original analysis and should not be interpreted as a newly revalidated capability assessment. Process stability and distributional characteristics were evaluated as separate properties; observations remaining within the I-MR control limits were not interpreted as evidence of normality. The suitability of the conventional Cp and Cpk indices was therefore assessed separately from the analysis of statistical process stability. The histogram and capability analyses were based on retained datasets, whereas the historical I-MR analysis could not be independently reconstructed from the retained records. The original batch-level values underlying the 25-observation I-MR analysis were not retained in the available documentation; therefore, the historical chronological sequence and control limits could not be independently reconstructed and are not presented as reproducible empirical results. These indices were calculated for the paraffin color parameter using the predefined lower and upper specification limits. Cp was used to characterize the potential capability of the process relative to the specification width, whereas Cpk was used to account for the actual centering of the process between the specification limits.
Because the complete original batch-level observations underlying the historical capability calculation were not retained in the available study documentation, the numerical results of the current-state capability analysis were retained as reported in the original analysis, while no retrospective numerical normality-test result was attributed to the original dataset. This distinction was made to avoid presenting reconstructed observations as original empirical measurements. Therefore, the reported historical Cp and Cpk values should be interpreted as retained analytical results rather than as independently reproducible capability estimates.
2.2.2. Stage II—Development of the Improvement Framework
The second stage involved the development of a process-improvement framework based on the critical factors identified during the current-state analysis. The objective was to improve the stability and predictability of waste paraffin recovery while reducing the probability of nonconforming material and inefficient use of process resources.
The proposed improvement measures included standardized sampling procedures, a sorbent-selection matrix, additional process measurement points, in-line color monitoring, and integration of Statistical Process Control (SPC). In-line color sensors were proposed at selected stages of the refining process, particularly after mixing and filtration, to provide more frequent information on product characteristics than periodic laboratory sampling alone. Viscosity and selected process parameters were also identified as potential variables for additional monitoring.
The proposed SPC system was designed to integrate process measurements, batch identification, operating conditions, and quality results into a common process-data structure. The intended monitoring variables included color, optical purity, moisture content, mixing temperature, mixing time, sorbent type and dosage, filtration time, and filter-press pressure drop. The proposed system would enable the identification of deviations at an earlier stage and could support corrective actions, process adjustment, or reprocessing of nonconforming material.
The proposed digital monitoring framework was also designed to create a historical process database. Such a database could subsequently support the development of predictive relationships between waste paraffin characteristics, sorbent selection, process parameters, and final product quality. In this way, digitalization was considered an enabling mechanism for improving the management and utilization of variable secondary-resource streams.
2.2.3. Stage III—Scenario-Based Evaluation of the Proposed Improvement Framework
The third stage involved a scenario-based evaluation of the potential effects of the proposed improvement measures by calculating the process capability indices Cp, and Cpk for the current-state dataset and an illustrative improvement scenario using the same specification limits for the paraffin color parameter (24–30 points), in accordance with the company’s existing quality-control convention. Since the technological modifications had not been implemented under industrial operating conditions, no post-implementation data were available for model calibration. Therefore, the analysis was formulated as an illustrative deterministic scenario rather than a stochastic simulation or a statistically estimated predictive model. The scenario assumed a mean color score of 27.5 points and a standard deviation of 0.60 points, selected solely for analytical purposes and not derived from implementation data, pilot experiments, external benchmarks, or a calibrated predictive model. Although the specification interval has a midpoint of 27.0 points, the assumed mean of 27.5 represents a shift toward the midpoint relative to the baseline mean of 26.2 points, rather than exact centering. The resulting Cp and Cpk values should therefore be interpreted as conditional calculations illustrating the potential process capability under the assumed parameters, not as evidence of empirically verified improvement or a forecast of future production performance.
2.3. Evaluation Criteria
The proposed framework was evaluated using criteria corresponding to the objectives of process optimization and circular resource recovery. These included:
- Process stability, assessed using control charts and statistical analysis;
- Process capability, assessed using Cp, and Cpk indices;
- Measurement reliability, identified as a prerequisite for future implementation of the proposed monitoring system;
- Process risk, assessed using FMEA and RPN values;
- Product conformity, assessed using CTQ characteristics and specification limits;
- material losses and nonconforming production, identified from process and quality-control data;
- Resource utilization efficiency, considered in relation to the use of waste paraffin, sorbents, energy, and processing capacity; and
- Potential contribution to circular resource recovery, assessed conceptually through the proposed improvement framework.
The environmental and economic implications of the proposed framework were not quantified using a life-cycle assessment, carbon-footprint analysis, or detailed cost model. Instead, potential environmental and economic benefits were considered qualitatively in relation to reduced material losses, lower reprocessing requirements, improved resource utilization, and the potential reduction in unnecessary process operations. Quantitative assessment of these effects remains outside the scope of the present study and is identified as a direction for future research.
The Pearson confidence interval was reported as calculated using Fisher’s z transformation. The Spearman confidence interval was reported as estimated using a nonparametric bootstrap with 10,000 resamples and a two-sided 95% percentile interval. The original 15 paired observations and computational output were unavailable for independent verification; therefore, the estimates and procedures could not be independently reproduced. Because the test underlying any previously reported p-value could not be confirmed, no p-value or claim of statistical significance is reported.
3. Results and Discussion
3.1. Empirical Diagnosis of the Current-State Refining Process
The results are presented according to the adopted research framework. First, the current state of the waste paraffin recovery process was analyzed to identify major sources of variability, operational risks, and quality-related losses. Subsequently, process and quality-management tools were considered as supplementary criteria to identify critical process stages and evaluate current process capability. The present section focuses on the empirical diagnosis of the existing refining process, including sources of variability, operational risks, quality-related losses, and current process capability [31]. Table 2 presents an SWOT analysis of the paraffin refining process.
Table 2.
SWOT analysis of the paraffin refining process.
The SWOT analysis indicates that the company possesses significant technological and organizational strengths, including extensive experience in paraffin refining, flexible production capabilities, and well-developed laboratory and logistics facilities. The existing refining system provides an established basis for recovering waste paraffin as a secondary raw material. However, limited process automation, insufficient in-line monitoring, high energy requirements, and the lack of standardized sorbent-selection procedures may constrain recovery efficiency, process predictability, and the repeatability of results. The identified opportunities, particularly digital process monitoring and the implementation of circular economy solutions, offer potential to optimize refining operations, reduce the generation of nonconforming material, and improve the efficiency of secondary resource utilization.
The analysis of the paraffin refining process showed that the existing technological sequence—raw material melting, sorbent addition, mixing, filtration, and granulation—is capable of producing paraffin that meets current quality requirements. However, the reliance on laboratory testing and periodic sampling limits early detection of process deviations. The implementation of in-line sensors for monitoring color, oil content, and moisture, together with modernization of the filtration system, would enable real-time process control and improve product consistency.
The current quality control system could be further enhanced by integrating Statistical Process Control (SPC), Failure Mode and Effects Analysis (FMEA), a formal Measurement System Analysis (MSA), control charts, and process capability indices (Cp and Cpk). In the present study, MSA was identified as a necessary prerequisite for implementation of automated and in-line measurement but was not experimentally performed. These tools support continuous process monitoring, reduce variability, and provide objective assessment of process capability, consistent with previous studies on quality management in the petrochemical industry.
Previous studies and established process-improvement practice indicate that the implementation of Lean Management, Value Stream Mapping (VSM), and Manufacturing Execution Systems (MESs) can improve material flow, shorten production lead times, and increase operational efficiency. Overall, the analysis suggests that combining technological modernization with quality-management tools may provide a structured approach to improving process stability, product quality, and resource efficiency, subject to industrial validation.
The SIPOC (Supplier–Input–Process–Output–Customer) map was used to systematically analyze the paraffin refining process by identifying its key suppliers, inputs, technological stages, outputs, and customers. This approach facilitated process visualization, clarified relationships between process elements, and supported the identification of areas requiring optimization and quality improvement. The complete process structure is presented in Table 3.
Table 3.
SIPOC map.
The Ishikawa (cause-and-effect) diagram was used to identify the main sources of quality problems in the waste paraffin refining process. Potential causes were classified into six categories (6M): Machines, Methods, People, Materials, Measurements, and Environment. The analysis identified key issues, including equipment wear, filter press leakage, lack of in-line monitoring, improper sorbent selection, insufficient process standardization, operator errors, variability of waste paraffin composition, limited process measurements, and environmental factors affecting process stability. The diagram provides a systematic basis for identifying critical process weaknesses and defining improvement actions. Figure 1 presents the Ishikawa diagram.
Figure 1.
Representation of the process using an Ishikawa (cause-and-effect) diagram. Source: own elaboration based on company data.
Pareto–Lorenz analysis was applied to identify the main factors affecting the quality of refined paraffin. The most frequent process non-conformities were ranked according to their significance and presented as a cumulative chart, enabling the identification of priority areas requiring corrective actions and resource allocation. Figure 2 presents the Pareto–Lorenz chart based on company data from 2024, illustrating the factors responsible for product rejection by the quality department prior to market release.
Figure 2.
Representation of the Pareto–Lorenz analysis of the refining process. Source: own elaboration based on company data.
The Pareto–Lorenz analysis identified color, lack of transparency, and odor as the principal factors responsible for product rejection during quality inspection. To further evaluate the critical quality parameter, a histogram analysis was performed on 65 paraffin samples using the company’s internal color scale (0 = light brown, 30 = pure white). This company-specific operational scale was used for internal comparison of paraffin color scores across production batches. However, the historical measurement procedure and measurement-system characteristics could not be independently verified from the available records. Therefore, the scale should not be interpreted as a validated standardized colorimetric method, and differences between adjacent score values should not be assumed to represent equal physical intervals. Figure 3 presents the company’s color classification matrix used for evaluating refined paraffin.
Figure 3.
Representation of the company’s color selection matrix. Source: own elaboration based on company data.
Figure 4 graphically presents, using a histogram, the distribution of 65 paraffin samples after the refining process in terms of their color, relative to the company’s color selection matrix. The 65-sample dataset was used for descriptive characterization of the observed color distribution, whereas a separate 50-batch dataset was used for the current-state process capability analysis.
Figure 4.
Representation of paraffin batches after purification using a histogram. Source: own elaboration based on company data.
The histogram analysis showed that most samples were within the 20–30 point range. The highest concentration of results between 24 and 26 points indicates that a substantial proportion of the analyzed batches approached the required color range. Lower color values may reflect variability in raw material quality, sorbent performance, or filtration conditions. These observations indicate that variability of the incoming waste material and process conditions remains relevant to the consistency of the recovered paraffin.
Because customer satisfaction was measured on an ordinal 1–5 scale and the sample consisted of only 15 customers, both Pearson’s product-moment correlation and Spearman’s rank correlation were considered to characterize the relationship between paraffin color and customer satisfaction. Pearson’s coefficient was used to describe the linear association, whereas Spearman’s coefficient was used to assess the monotonic association without requiring the satisfaction scale to be treated as an interval variable.
Previously documented exploratory results indicated a positive association between paraffin color score and customer satisfaction (Pearson’s r = 0.86, reported 95% CI: 0.63–0.95; Spearman’s ρ = 0.875, reported bootstrap 95% CI: approximately 0.62–0.97). These are previously reported estimates, not independently reproduced results, because the original 15 paired observations and computational output were unavailable for verification. No p-value is reported because the original test output could not be verified; statistical significance is therefore not claimed. Given the small, records-based convenience sample, this relationship should be interpreted as exploratory and observational rather than causal or population-representative.
The analysis used the 15 available company records containing both a paraffin color score and the corresponding customer satisfaction rating on a 1–5 scale. This records-based convenience sample was not randomly selected or population-representative. Because the original customer-selection protocol was not documented, no retrospective sampling or exclusion procedure was applied. The results are presented in Figure 5.
Figure 5.
Exploratory relationship between paraffin color score and customer satisfaction based on 15 paired customer observations. Source: own elaboration based on company data.
An illustrative control-sheet example is presented in Table 4 to demonstrate how key refining parameters and product-conformity decisions could be recorded systematically. The table is intended as an example of the proposed monitoring format and should not be interpreted as a complete or independently verified historical production dataset. The recorded variables include paraffin color score, mixing temperature, sorbent type, mixing time, and overall product conformity.
Table 4.
Illustrative example of a process control sheet for waste paraffin refining.
The minimum acceptable color score under the company’s operational color requirement is 24 points. Accordingly, a batch with a color score below 24 is classified as nonconforming with respect to color. Overall product conformity, however, also depends on other applicable quality requirements and cannot be determined from the color score alone. The OK/NOK classification therefore refers to overall product conformity, while the color score provides a separate assessment of compliance with the operational color requirement.
The data collected in the control sheet provide a basis for statistical analyses, including histograms, Shewhart control charts, and process capability indices (Cp and Cpk). These tools support the identification of process variability, long-term quality trends, and the relationship between deviations in paraffin color and process parameters, such as sorbent type, mixing conditions, and filtration parameters.
Statistical Process Control (SPC) was considered as a relevant framework for monitoring process stability and identifying potential special-cause variation. However, the original 25 batch-level observations underlying the historical I-MR analysis were not retained in the available documentation. Consequently, the historical control limits and chronological observation sequence could not be independently reconstructed and verified. The historical I-MR analysis was documented in the original study but cannot be independently reproduced from the retained records. Future SPC implementation should retain the complete chronological observation series and document the calculation of moving ranges, control limits, and special-cause rules to ensure full reproducibility.
Similarly, the application of FMEA enabled systematic identification of high-risk process stages within the investigated refining process. The proposed implementation of in-line sensors is consistent with the broader use of digital process monitoring and Industry 4.0-oriented approaches in industrial process management. Unlike previous studies focusing mainly on individual technological operations, the proposed framework integrates process monitoring, quality management, and sustainability into a single improvement model. For the interpretation of the FMEA results, the High and Medium priority categories were assigned according to the internal risk-prioritization scheme used in the analysis and presented in Table 5. These categories should be understood as internal prioritization levels rather than universal risk thresholds. The RPN values were used primarily to rank the identified failure modes and support the selection of corrective actions.
Table 5.
FMEA analysis conducted to identify process risks.
The investigated enterprise did not use a universal numerical RPN cut-off for defining High and Medium priority. Instead, these categories were assigned according to the internal risk-prioritization practice applied during the FMEA assessment. The FMEA results indicate that the highest-risk stages are concentrated around raw material reception, dewatering, melting, sampling, and filtration. These stages are particularly relevant to resource efficiency because failures occurring at these points may compromise the usability of recovered paraffin and increase the probability of reprocessing, material rejection, or loss of recovered material. The high RPN values therefore provide not only a basis for prioritizing quality-related corrective actions, but also a basis for allocating improvement resources to process stages with the greatest potential influence on the efficiency of secondary-resource recovery. In particular, variability of incoming waste paraffin and insufficiently standardized sampling and sorbent selection may propagate through subsequent process stages, increasing the risk of inefficient use of sorbents, energy, processing capacity, and recovered material.
Figure 6 presents the identification of Critical to Quality (CTQ) requirements, highlighting the key product and process characteristics affecting refined paraffin quality and customer satisfaction. CTQ parameters translate customer expectations into measurable process variables, enabling effective process monitoring, optimization, and quality control while reducing the risk of nonconformities and supporting continuous improvement and sustainable production.
Figure 6.
Critical-to-Quality (CTQ) Requirements for Refined Paraffin. Source: own elaboration based on company data.
Based on the available production records, 72% of the recorded production batches were classified as conforming according to the company’s overall quality requirements, while approximately 28% were classified as nonconforming. Because the original documentation did not retain a verifiable denominator or complete collection-period information, this proportion is reported descriptively and is not interpreted as a statistically generalizable estimate of the long-term conformity rate. This production-record dataset was considered separately from the 65-sample dataset used for the subsequent histogram analysis of the color parameter. For clarity, the datasets used in the study served different analytical purposes. The production-record dataset was used to describe the proportion of conforming and nonconforming batches. A separate dataset of 65 observations was used for the histogram analysis, whereas a 50-batch dataset was used for the current-state process capability analysis. The subsequent improvement scenario was not based on post-implementation observations. It consisted of an analytical calculation using assumed mean and standard deviation parameters representing improved process centering and reduced variability. These datasets should therefore not be interpreted as interchangeable samples from a single statistical population.
The paraffin color parameter was assessed using the investigated company’s internal color scale, ranging from zero (light brown) to 30 (pure white). The scale represents the company’s operational quality-classification system and was used for the histogram and capability analyses; the historical I-MR analysis could not be independently reconstructed from the retained records. The numerical scale should therefore be understood as a company-specific quality score rather than as a universally standardized colorimetric scale. The available company documentation did not provide sufficient detail to independently reconstruct the historical measurement procedure, including whether the color score was assigned exclusively by visual comparison or supported by instrumental measurement, nor did it document standardized sample thickness, lighting conditions, or a formal scoring-resolution protocol. These limitations prevent retrospective validation of the measurement procedure from the available records.
The lower specification limit of 24 points represents the minimum color score accepted for the investigated product according to the company’s quality requirements. The value of 30 corresponds to the upper endpoint of the company’s internal scoring scale. It should therefore not be interpreted as an independently established physical or customer-derived upper specification unless explicitly defined as such by the company’s product specification.
The present study did not perform an independent validation of the measurement-system characteristics of the internal color scale. In particular, the available study documentation did not contain a complete Measurement System Analysis establishing repeatability, reproducibility, resolution, or equivalence between individual scale increments. Consequently, differences between adjacent numerical scores are treated as operational scale units and are not assumed to represent independently demonstrated equal physical intervals.
The interval from 24 to 30 points represents the operational range adopted for the company’s internal color-scoring convention and for the conditional capability calculations presented in this study. The lower limit of 24 points represents the minimum acceptable color score, whereas 30 is the upper endpoint of the internal scale and has not been independently established as an upper product specification. Accordingly, the bilateral capability calculations are conditional on the adopted scoring convention and limits and should not be interpreted as an independently validated assessment of product specifications.
As part of the study on the color parameter of paraffin according to the company’s internal color scale, the specification limits were defined as: LSL (Lower Specification Limit) = 24 and USL (Upper Specification Limit) = 30 points. A sample of 50 randomly selected batches was analyzed, for which the mean color value was 26.2 points with a standard deviation σ = 0.85 points. The use of bilateral specification limits in the present analysis reflects the company’s existing quality-control convention rather than an independently validated statistical specification model. Because higher color scores correspond to a whiter product, the upper value of 30 also represents the upper boundary of the internal scale and may function partly as a measurement ceiling. A one-sided capability assessment could therefore be considered if future product specifications define only a minimum acceptable color value. In the present study, Cp and Cpk were retained for comparability with the company’s existing quality-control convention, which uses the operational range of 24–30 points. This analytical choice does not imply that the upper boundary of 30 represents an independently validated physical or customer-derived specification.
The bounded and potentially discrete nature of the scale should also be considered when interpreting distributional assumptions and capability indices. This 50-batch dataset was used specifically for the current-state process capability analysis presented below. For consistency, all current-state capability calculations reported in this manuscript are based on these same parameters (n = 50, mean = 26.2, SD = 0.85, LSL = 24, and USL = 30). No alternative baseline standard deviation is used in the revised analysis. The previously reported standard deviation of 1.02 used in the Welch comparison referred to a different analytical calculation and was not the standard deviation used for the 50-batch current-state capability dataset. In the revised manuscript, the Welch comparison has been removed because the underlying data and analytical context could not be independently reconstructed from the available study documentation. For the current-state capability analysis, the 50-batch dataset is consistently characterized by a mean of 26.2 and a standard deviation of 0.85. Accordingly, SD = 0.85 is used throughout the revised capability analysis, while the previously reported value of 1.02 is not used in any current-state capability calculation.
Based on these data, the process capability indices were calculated:
Cp, which indicates the potential capability of the process to fit within the specification width assuming perfect centering:
Cpk, which accounts for the actual centering of the process relative to the specification limits:
The reported baseline Cp and Cpk values are historical estimates that could not be independently re-examined because the underlying batch-level observations were not retained. The 24–30 interval represents the company’s operational scoring convention rather than an independently validated bilateral product specification. Accordingly, the capability indices should be interpreted conditionally, taking these measurement and specification limitations into account.
The empirical findings presented above describe the existing refining process and are based on company production and quality-control data. The following sections address the proposed improvement framework and its scenario-based evaluation separately.
3.2. Development of the Integrated Process-Improvement Framework
The improvement framework was developed based on the empirical findings presented in Section 3.1. The objective was to address the principal sources of variability and operational risk identified in the current-state analysis and to provide a more systematic basis for monitoring and controlling the refining process.
Optimization efforts focused primarily on improving product color. Achieving consistent color remains challenging because waste paraffin originates mainly from candle and memorial product manufacturers using various additives and paraffin substitutes, which may adversely affect the visual properties of the recovered material.
To improve compliance with color specifications, the implementation of optical in-line color sensors is proposed. Installed between refining stages, these sensors could enable continuous real-time color monitoring and integration with key process variables, including sorbent dosage, mixing conditions, and filtration efficiency.
Combined with real-time Statistical Process Control (SPC), the proposed solution is intended to enable earlier identification of process deviations and could support corrective actions when control limits are exceeded. Its effect on the number of nonconforming batches would require verification under industrial operating conditions.
Consistent with Industry 4.0 principles, the proposed system integrates process monitoring, automation, and digital data collection. The accumulated data could subsequently support the development of mathematical relationships between waste-paraffin characteristics, sorbent selection, process conditions, and final product quality. Such a system could reduce reliance on periodic laboratory testing and provide a basis for more systematic process adjustment.
The proposed improvement framework combines standardized sampling, a sorbent-selection matrix, additional process measurement points, in-line color monitoring, and Statistical Process Control. The proposed sorbent-selection matrix is intended as a decision-support tool rather than as a validated optimization model. The selection procedure should first classify the incoming waste paraffin according to relevant characteristics, including initial color, visible impurities, turbidity/clarity, and available process information. The operator would then select the sorbent type and starting dosage according to the corresponding predefined category. Following treatment, the resulting color and other quality characteristics would be recorded and linked to the batch identifier. Repeated observations would subsequently be used to refine the matrix. Until such empirical calibration is completed, the matrix should be regarded as a structured decision rule for standardizing operator decisions rather than as a validated prescription of optimal sorbent type or dosage. Standardized sampling is intended to improve the representativeness and repeatability of process measurements, while the sorbent-selection matrix is intended to provide a more systematic basis for selecting sorbent type and dosage according to the characteristics of the incoming waste paraffin.
For example, an incoming batch showing a relatively low initial color score together with visible impurities and elevated turbidity would be assigned to the corresponding predefined raw-material category, after which the operator would select the sorbent type and starting dosage specified for that category. The post-treatment color, turbidity, and other relevant quality observations would then be recorded against the batch identifier. Because the historical records did not provide sufficient data to validate category-specific sorbent dosages, the present study does not prescribe numerical dosage values. Instead, the example illustrates how the proposed matrix would standardize operator decisions and generate the empirical data required for subsequent calibration of the decision rules.
Quality-management and statistical process-control literature provides established approaches for identifying sources of variability, prioritizing operational risks, defining critical quality characteristics, evaluating measurement systems, and monitoring process stability. Specifically, Failure Mode and Effects Analysis (FMEA) supports structured identification and prioritization of process risks, Statistical Process Control (SPC) supports the detection of process variation and special-cause signals, while Measurement System Analysis (MSA) is used to evaluate the reliability of measurement systems. Ishikawa and Pareto analyses provide complementary tools for structuring and prioritizing potential causes of process variability.
The proposed digital monitoring framework is also designed to create a historical process database. Such a database could subsequently support the development of predictive relationships between waste paraffin characteristics, sorbent selection, process parameters, and final product quality. In this way, digitalization is considered an enabling mechanism for improving the management and utilization of variable secondary-resource streams. A key improvement proposed for the enterprise is the implementation of in-line color sensors integrated with a Statistical Process Control (SPC) system. The proposed in-line monitoring system could enable automatic acquisition, aggregation, and visualization of process data, supporting both real-time process supervision and long-term decision-making. The main objective is the early detection of deviations affecting Critical to Quality (CTQ) characteristics, particularly color, optical purity, and indirectly oil content, thereby reducing nonconforming batches and improving process capability Cpk.
Process monitoring should focus on three critical stages: before mixing, after mixing, and after filtration. The monitored CTQ parameters include color (minimum specification of 24 units on the company scale), optical purity, and moisture content (<0.1%). In-line color sensors are complemented by process measurements of mixing temperature and time, filter press pressure drop (ΔP), sorbent type and dosage, and process temperature. Sensor data are proposed to be collected at 30 s intervals and analyzed using SPC indicators, including means and ranges. The proposed SPC framework should include integrated data management and real-time visualization of process variables, including batch identification, operator, sorbent type, temperature, pressure drop, and filtration time.
Prior to implementation, the measurement system should undergo Measurement System Analysis (MSA) to verify accuracy and repeatability, with periodic reassessment after maintenance or sensor replacement. Control limits are initially established using historical data and subsequently applied for routine SPC monitoring. When control limits are exceeded, an Out-of-Control Action Plan (OCAP) is initiated, including sensor verification, assessment of mixing and filtration parameters, process adjustment or batch reprocessing, and root cause analysis (e.g., 5 Why). Recurrent issues should be incorporated into the FMEA risk assessment.
Before routine use, each in-line sensor should be calibrated and verified against the company’s internal color scale using representative paraffin samples covering the relevant operating range, particularly the specification region around 24 points. Calibration and verification should be performed under controlled and documented measurement conditions. These conditions should include sample temperature, optical path and sample presentation, and should account for potential interference from turbidity, suspended particles, bubbles, and sensor-window fouling. The relationship between sensor output and the company’s internal color score should be established empirically before the sensor is used for SPC-based product decisions.
The commercial sensors should therefore not be assumed to provide a direct numerical equivalent of the company’s 0–30 color score. Instead, the implementation should use paired measurements obtained from the same paraffin samples: the laboratory/company color score and the corresponding instrumental sensor output. A calibration relationship should then be established empirically over the relevant operating range, with particular attention to the specification region around 24 points and to the upper part of the 0–30 scale. The calibration model and acceptance criteria should be validated using independent samples and should include assessment of bias, repeatability, reproducibility, and prediction error before sensor values are used for SPC or product-release decisions.
Regular operational reviews and process capability analyses Cp and Cpk support continuous improvement. Integration with process automation and recipe management is intended to enable predictive sorbent dosing, adaptation to raw material variability, and automatic routing of nonconforming material for reprocessing. This approach is intended to improve process stability and product consistency; however, the magnitude of any improvement would require empirical verification under industrial operating conditions. Table 6 presents a comparison of three selected in-line color sensors recommended for implementation in the enterprise.
Table 6.
Comparison of three selected in-line color sensors recommended for implementation in the enterprise.
All three proposed solutions could enable continuous in-line color measurement and reduce the delays associated with laboratory analyses. The OUSAF22 sensor is suitable for applications requiring consistent product quality and provides UV/VIS absorbance measurement. The Kemtrak Saybolt Color Analyzer is designed for continuous optical photometry according to the Saybolt scale and may therefore be suitable where this measurement scale is applicable. The optek-Danulat AF26 VIS/NIR sensor offers broader functionality by monitoring color, turbidity, and other optical parameters.
The analyses presented in Section 3.1 and Section 3.2 distinguish between the empirical diagnosis of the existing process and the development of the proposed improvement framework. The findings presented in Section 3.1 are based on company production and quality-control data and describe the current operating conditions. In contrast, the measures described in Section 3.2, including standardized sampling, improved sorbent selection, in-line color monitoring, and SPC-based control, represent proposed interventions that were not implemented under industrial operating conditions during the study.
The proposed interventions provide a qualitative rationale for examining a scenario with improved centering and reduced variability: standardized sampling may improve measurement consistency, structured sorbent selection may reduce variation associated with sorbent choice, and in-line monitoring with SPC may help detect deviations earlier. Their individual and combined effects on the process mean and standard deviation were not quantified; the scenario is therefore not a causal estimate of intervention effects.
3.3. Scenario-Based Evaluation of the Proposed Improvement
Using the illustrative parameters defined in Section 2.2 (assumed mean = 27.5 points; standard deviation = 0.60 points), the scenario yields conditional capability indices rather than observed post-implementation results. The midpoint of the operational interval 24–30 is 27.0 points; thus, 27.5 is closer to the midpoint than the reported baseline mean of 26.2, but it does not represent exact centering. The assumptions were not estimated from implementation data, pilot experiments, or a calibrated predictive model, and the results do not demonstrate experimentally verified improvement.
Because the improvement scenario is a deterministic analytical illustration rather than a stochastic simulation, no random seed, probability distribution, or repeated simulation runs were specified. To examine the sensitivity of the projected capability indices to the assumed process mean and standard deviation, an additional deterministic sensitivity analysis was performed by varying these two parameters while retaining the same specification limits (LSL = 24 and USL = 30 points). The resulting Cp and Cpk values are conditional scenario outputs and should not be interpreted as prediction intervals or statistical uncertainty bounds. Table 7 presents a deterministic sensitivity analysis for an example process capability scenario.
Table 7.
Deterministic sensitivity analysis of hypothetical process-capability scenarios under alternative assumed means and standard deviations.
The scenario comparison was descriptive and did not involve a stochastic simulation or an inferential test of intervention effects. The calculated Cp and Cpk values are conditional outputs based on the assumed mean and standard deviation, rather than observed post-implementation results. Validation of the proposed interventions requires industrial implementation and independently collected pre- and post-implementation data.
3.4. Implications for Circular Resource Recovery and Transferability
From a circular economy perspective, the proposed approach should be interpreted as a process-management framework with potential implications for secondary-resource utilization rather than as a quantitatively demonstrated resource-efficiency improvement. The study did not directly quantify material yield, energy consumption per unit of recovered paraffin, sorbent consumption per batch, reprocessing losses, or residual waste. The available study records did not allow the fate of nonconforming batches to be quantified separately into reprocessing, downgraded sale, or disposal categories. Therefore, the present study does not claim a quantified reduction in any of these material-loss pathways or in overall material and energy losses.
The proposed framework should be interpreted primarily as an integrated analytical and process-management structure rather than as a universally applicable set of numerical solutions. The current study was conducted within a single enterprise and used a company-specific color scale, process configuration, specification limits, waste-paraffin feedstock, and measurement system. Consequently, the numerical Cp and Cpk values, FMEA RPN rankings, specification limits, and relative importance of individual process parameters are context-dependent. They should not be transferred directly to other paraffin-refining facilities or other secondary-resource recovery processes without independent validation.
The analytical structure of the framework may nevertheless be transferable to other processes involving the recovery and reuse of secondary resources. Application to another enterprise would require independent process mapping, identification of local critical quality characteristics, assessment of the measurement system, definition of process-specific specification limits, FMEA, process stability analysis, and process capability assessment.
The main limitations of the study are the single-enterprise case-study design, variability in the composition of waste paraffin, the company-specific quality-control system, and the absence of industrial validation of the proposed technological modifications. In addition, the illustrative improvement scenario represents a conditional analytical assessment and therefore cannot establish the actual magnitude of improvement that would result from implementation.
Future research should focus on pilot- and industrial-scale validation of the proposed monitoring and control system. Such studies should record material input, recovered-product output, rejected material, reprocessed material, sorbent consumption, energy consumption, and the fate of nonconforming batches. Comparative studies involving multiple enterprises would also be required to assess the transferability of the proposed framework to other secondary-resource recovery processes.
4. Conclusions
The available historical analysis reported Cp = 1.18 and Cpk = 0.86 under the company’s operational color-score range of 24–30 points. Because the underlying batch-level observations were not retained for independent re-examination and the measurement system has not been independently validated, these values should be interpreted as reported historical estimates rather than newly verified capability results. The adopted limits reflect the company’s operational scoring convention and do not establish an independently validated bilateral product specification.
Based on these empirical findings, an integrated process-improvement framework was proposed combining standardized sampling, a sorbent-selection matrix, in-line color monitoring, and Statistical Process Control. The framework is intended to provide a more systematic basis for monitoring process variability and managing secondary-resource inputs. The proposed technological measures were not implemented under industrial operating conditions during the study. However, the present study does not provide quantitative evidence of improved material or energy efficiency; such effects require the measurement of material flows, energy use, sorbent consumption, reprocessing, and residual waste during future industrial validation.
Under the illustrative assumptions (mean = 27.5 points; standard deviation = 0.60 points), the scenario yielded Cp = 1.67 and Cpk = 1.39, compared with the reported historical estimates of Cp = 1.18 and Cpk= 0.86. These conditional calculations are not evidence of an experimentally verified improvement; the proposed framework must be evaluated through industrial implementation using independently collected pre- and post-implementation data.
The main contribution of this study is the application-level integration of established quality-management, FMEA, SPC, process-monitoring, and digitalization tools within the operational context of waste-paraffin refining. The proposed framework links process diagnosis and quality control with secondary-resource recovery. Its contribution is conceptual and application-oriented rather than the development of a new statistical method, sensor technology, or experimentally validated optimization algorithm.
Author Contributions
Conceptualization, M.N. and W.L.; methodology, M.N. and W.L.; software, M.N.; validation, M.N. and W.L.; formal analysis, M.N., A.A.O. and W.L.; investigation, M.N. and W.L.; resources, M.N.; data curation, M.N. and W.L.; writing—original draft preparation, M.N., A.A.O. and W.L.; writing—review and editing, M.N., A.A.O. and W.L.; visualization, M.N. and W.L.; supervision, W.L.; project administration, M.N. and W.L.; funding acquisition, W.L. and A.A.O. All authors have read and agreed to the published version of the manuscript.
Funding
This research received no external funding.
Institutional Review Board Statement
Not applicable.
Informed Consent Statement
Not applicable.
Data Availability Statement
The aggregated data and results supporting the analyses are reported in the manuscript. The complete original batch-level observations underlying the historical capability calculation and the 25-observation historical I-MR analysis were not retained in the available study documentation. Consequently, these historical analyses cannot be independently reproduced from the original batch-level data. Future data collection should retain the complete chronological batch-level dataset to enable full reproducibility of process-control and capability analyses.
Conflicts of Interest
The authors declare no conflicts of interest.
Abbreviations
The following abbreviations are used in this manuscript:
| AI | Artificial intelligence |
| ASTM | ASTM International (formerly American Society for Testing and Materials) |
| CO2 | Carbon dioxide |
| Cp | Process capability index |
| Cpk | Process capability index adjusted for process centering |
| CTQ | Critical to Quality |
| FIFO | First In, First Out |
| FMEA | Failure Mode and Effects Analysis |
| I-MR | Individuals–Moving Range |
| ISO | International Organization for Standardization |
| LSL | Lower Specification Limit |
| MES | Manufacturing Execution System |
| MSA | Measurement System Analysis |
| NIR | Near-infrared |
| NOK | Not OK/nonconforming |
| OCAP | Out-of-Control Action Plan |
| PCM | Phase-change material |
| QFD | Quality Function Deployment |
| RPN | Risk Priority Number |
| SIPOC | Supplier–Input–Process–Output–Customer |
| SPC | Statistical Process Control |
| SWOT | Strengths, Weaknesses, Opportunities, and Threats |
| USL | Upper Specification Limit |
| UV/VIS | Ultraviolet/visible spectroscopy |
| VIS/NIR | Visible/near-infrared spectroscopy |
| VSM | Value Stream Mapping |
References
- Walendziewski, J. Frakcje węglowodorowe z krakingu termicznego odpadów poliolefinowych—Otrzymywanie, uszlachetnianie i zastosowanie. Polimery 2010, 55, 782–787. [Google Scholar]
- Antosz, A.; Ptak, S. Badania możliwości powtórnego wykorzystania surowców odpadowych powstających w trakcie produkcji świec. Nafta-Gaz 2022, 78, 760–775. [Google Scholar] [CrossRef] [Scilit]
- Speight, J.G. The Chemistry and Technology of Petroleum, 5th ed.; CRC Press: Boca Raton, FL, USA, 2014. [Google Scholar]
- Ptak, S.; Jakóbiec, J. Ropa naftowa jako główny surowiec energetyczno-przemysłowy. Nafta-Gaz 2016, 72, 451–460. [Google Scholar] [CrossRef] [Scilit]
- Li, T.; Xu, J.; Zou, R.; Feng, H.; Li, L.; Wang, J.; Stuart, M.A.C.; Guo, X. Resin from Liaohe heavy oil: Molecular structure, aggregation behavior, and effect on oil viscosity. Energy Fuels 2018, 32, 306–313. [Google Scholar] [CrossRef] [Scilit]
- Syrek, H. Parafiny i woski—Tradycja badawcza, rozwój technologii i wdrożenia. Nafta-Gaz 2009, 65, 50–57. [Google Scholar]
- Antosz, A.; Ptak, S. Badanie procesu rozpuszczalnikowego odolejania gaczów parafinowych. Nafta-Gaz 2018, 74, 138–147. [Google Scholar] [CrossRef] [Scilit]
- Laux, H.; Matthäi, M.; Weil, B.; Butz, T. Influences on the needle penetration of petroleum wax. Pet. Sci. Technol. 2005, 23, 29–37. [Google Scholar] [CrossRef] [Scilit]
- Rezaei, K.; Wang, T.; Johnson, L.A. Hydrogenated vegetable oils as candle wax. J. Am. Oil Chem. Soc. 2002, 79, 1241–1247. [Google Scholar] [CrossRef] [Scilit]
- Wang, L.; Wang, T. Chemical modification of partially hydrogenated vegetable oil to improve its functional properties for candles. J. Am. Oil Chem. Soc. 2007, 84, 1149–1159. [Google Scholar] [CrossRef] [Scilit]
- Qi, J.; Ge, Y.; Li, Q.; Lv, X.; Li, X.; Wang, N.; Lu, H. Sustainable and cleaner approach for paraffin wax treatment via CO2-induced polarity transformation of switchable solvents. J. Clean. Prod. 2023, 396, 136500. [Google Scholar] [CrossRef] [Scilit]
- Romero, S.Z.; Minari, R.J.; Collins, S.E. Bio-paraffin from soybean oil as eco-friendly alternative to mineral waxes. Ind. Eng. Chem. Res. 2021, 60, 5364–5373. [Google Scholar] [CrossRef] [Scilit]
- Ptak, S. Ocena procesu odparafinowania rozpuszczalnikowego plastyfikatora TDAE. Nafta-Gaz 2017, 73, 604–615. [Google Scholar] [CrossRef] [Scilit]
- Antosz, A.; Ptak, S. Badanie procesu ekstrakcji wysokoaromatycznych surowców naftowych z zastosowaniem współrozpuszczalnika. Nafta-Gaz 2021, 77, 692–703. [Google Scholar] [CrossRef] [Scilit]
- Smoliło, M. Badanie odporności na utlenianie mieszanin olejów otrzymanych z regeneracji olejów przepracowanych z olejami naftenowymi. Nafta-Gaz 2020, 76, 408–418. [Google Scholar] [CrossRef] [Scilit]
- AIAG; VDA. AIAG & VDA FMEA Handbook: Design FMEA, Process FMEA, Supplemental FMEA for Monitoring & System Response, 1st ed.; Automotive Industry Action Group: Southfield, MI, USA; Verband der Automobilindustrie: Berlin, Germany, 2019. [Google Scholar]
- Montgomery, D.C. Introduction to Statistical Quality Control, 8th ed.; John Wiley & Sons: Hoboken, NJ, USA, 2024. [Google Scholar]
- Automotive Industry Action Group (AIAG). Measurement Systems Analysis (MSA) Reference Manual, 4th ed.; AIAG: Southfield, MI, USA, 2010. [Google Scholar]
- Mahir, L.H.A.; Vilas Bôas Fávero, C.; Ketjuntiwa, T.; Fogler, H.S.; Larson, R.G. Mechanism of Wax Deposition on Cold Surfaces: Gelation and Deposit Aging. Energy Fuels 2019, 33, 3776–3786. [Google Scholar] [CrossRef] [Scilit]
- Derudi, M.; Gelosa, S.; Sliepcevich, A.; Cattaneo, A.; Rota, R.; Cavallo, D.; Nano, G. Emissions of air pollutants from scented candles burning in a test chamber. Atmos. Environ. 2012, 55, 257–262. [Google Scholar] [CrossRef] [Scilit]
- Lau, C.; Fiedler, H.; Hutzinger, O.; Schwind, K.H.; Hosseinpour, J. Levels of selected organic compounds in materials for candle production and human exposure to candle emissions. Chemosphere 1997, 34, 1623–1630. [Google Scholar] [CrossRef] [Scilit] [PubMed]
- Lieder, M.; Rashid, A. Towards circular economy implementation: A comprehensive review in context of manufacturing industry. J. Clean. Prod. 2016, 115, 36–51. [Google Scholar] [CrossRef] [Scilit]
- Jia, F.-R.; Jing, W.-T.; Liu, G.-X.; Yue, Q.; Wang, H.-M.; Shi, L. Paraffin-based crude oil refining process unit-level energy consumption and CO2 emissions in China. J. Clean. Prod. 2020, 255, 120347. [Google Scholar] [CrossRef] [Scilit]
- Kirchherr, J.; Reike, D.; Hekkert, M. Conceptualizing the circular economy: An analysis of 114 definitions. Resour. Conserv. Recycl. 2017, 127, 221–232. [Google Scholar] [CrossRef] [Scilit]
- Niekurzak, M.; Lewicki, W.; Wróbel, J. Efficiency Assessment of the Production of Alternative Fuels of High Usable Quality within the Circular Economy: An Example from the Cement Sector. Sustainability 2024, 16, 8762. [Google Scholar] [CrossRef] [Scilit]
- Wen, J.; Lu, Y.; Jia, Y.; Luo, H.; You, C.; Huang, Z.; Wang, C.; Luo, Y. Progress on wax deposition characteristics and prediction methods for crude oil pipelines. Processes 2025, 13, 1651. [Google Scholar] [CrossRef] [Scilit]
- Helsper, S.; Ali, A.A.; Liberatore, M.W. Shear alters wax appearance in mineral oil + paraffin wax mixtures. Rheol. Acta 2021, 60, 521–529. [Google Scholar] [CrossRef] [Scilit]
- ISO 9001:2015; Quality Management Systems—Requirements. International Organization for Standardization: Geneva, Switzerland, 2015.
- ISO 14001:2015; Environmental Management Systems—Requirements with Guidance for Use. International Organization for Standardization: Geneva, Switzerland, 2015.
- Berdechowski, K.; Duda, A.; Łaczek, T. Emisja w procesie hydrokonwersji bioolejów jako składnik emisji gazów cieplarnianych w cyklu życia (LCA) olejów napędowych. Nafta-Gaz 2012, 68, 254–259. [Google Scholar]
- Niekurzak, M. Determining the unit values of the allocation of greenhouse gas emissions for the production of biofuels in the life cycle. Energies 2021, 14, 8394. [Google Scholar] [CrossRef] [Scilit]
- ASTM D156-23; Standard Test Method for Saybolt Color of Petroleum Products (Saybolt Chromometer Method). ASTM International: West Conshohocken, PA, USA, 2023. [Google Scholar] [CrossRef] [Scilit]
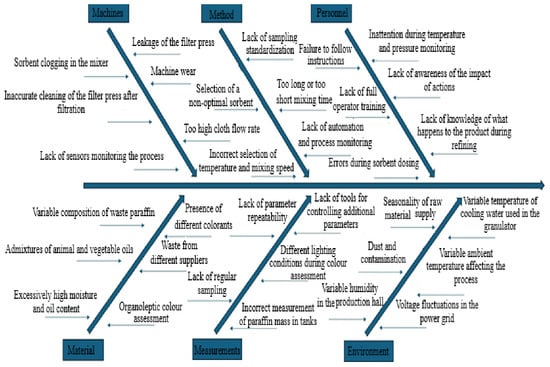
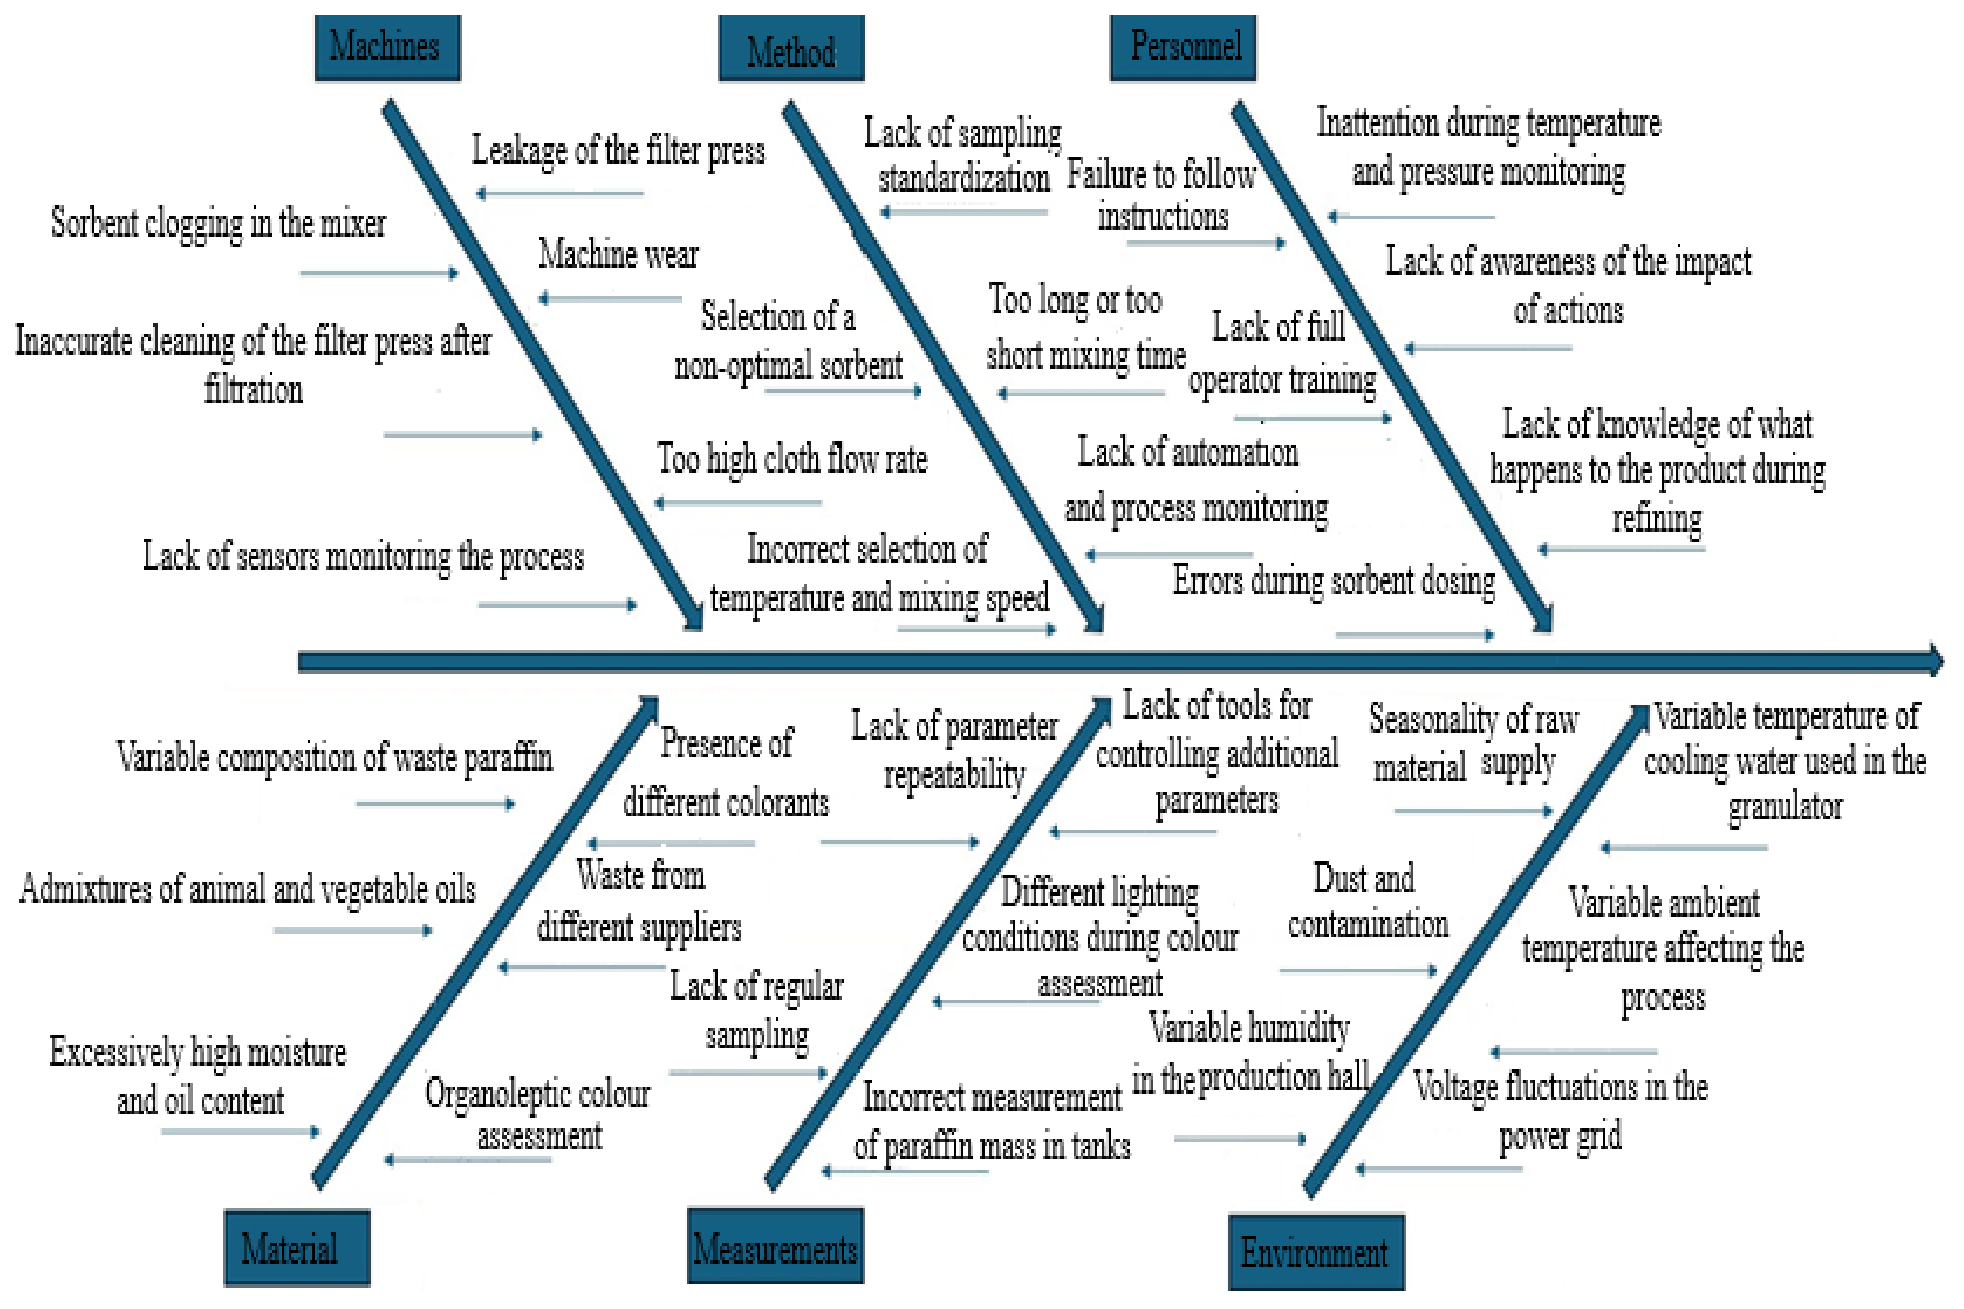
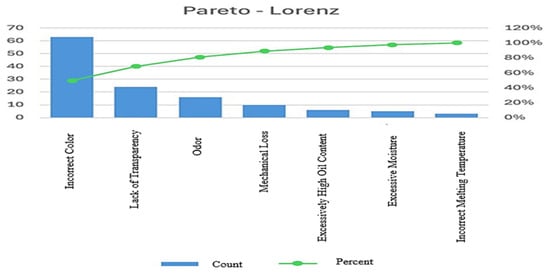
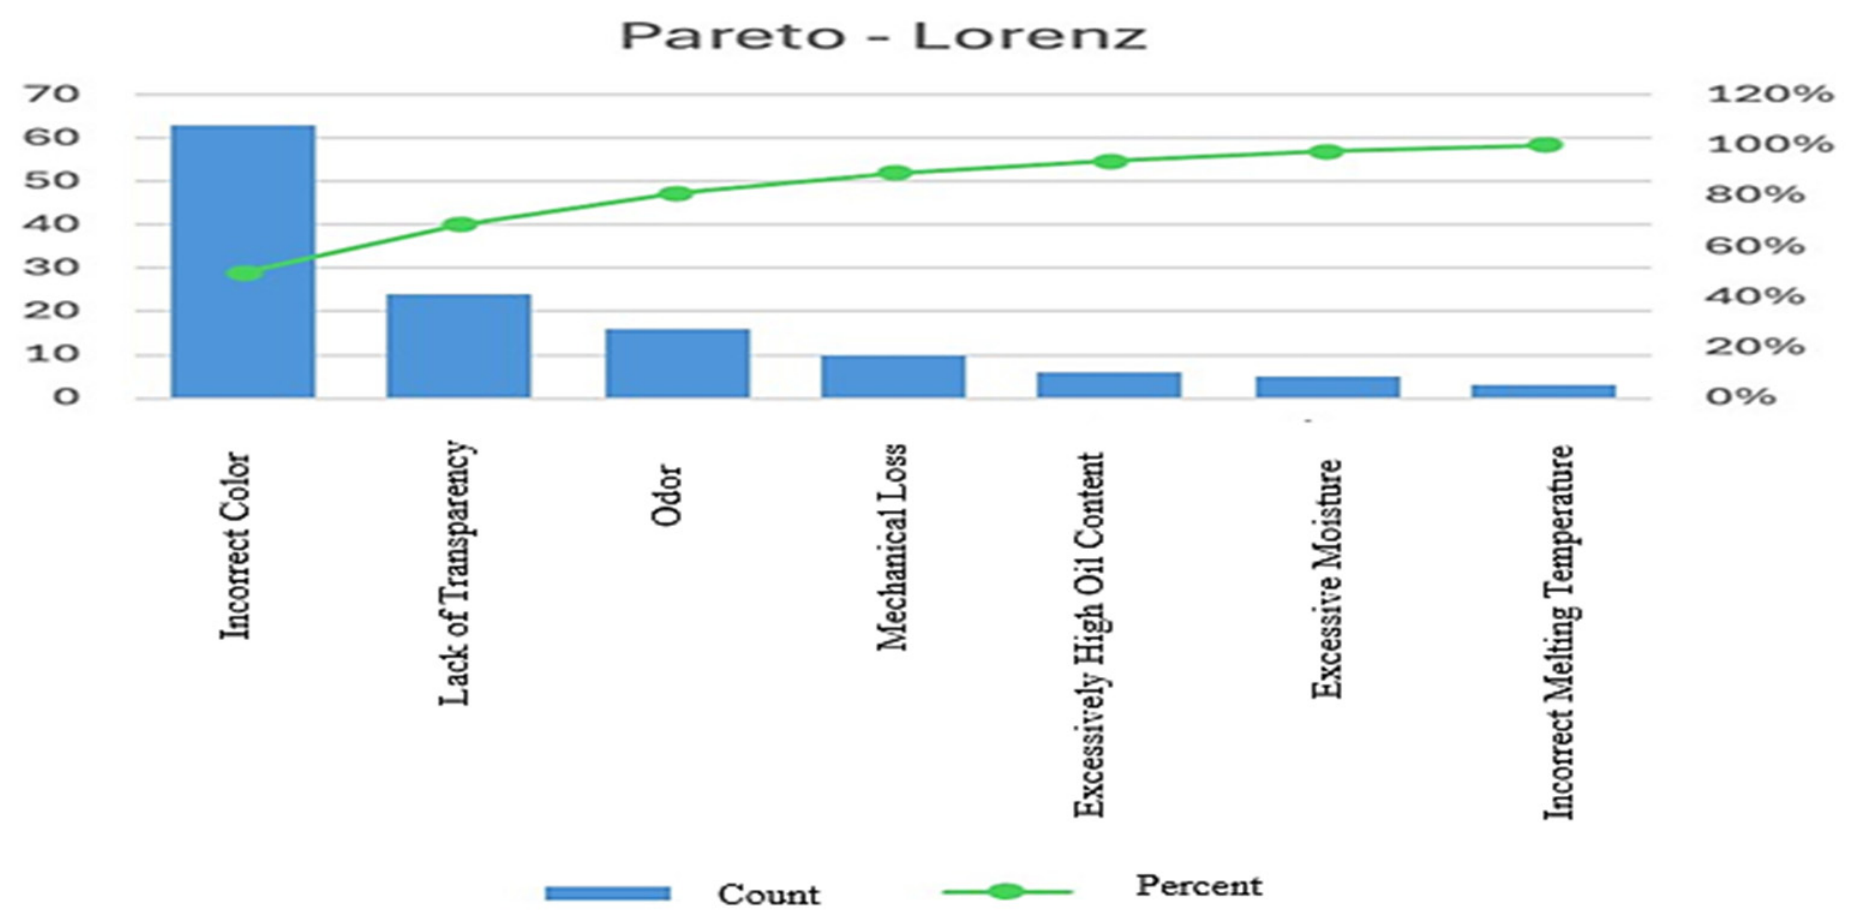


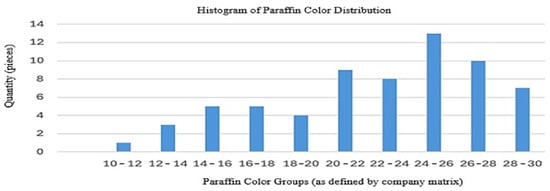
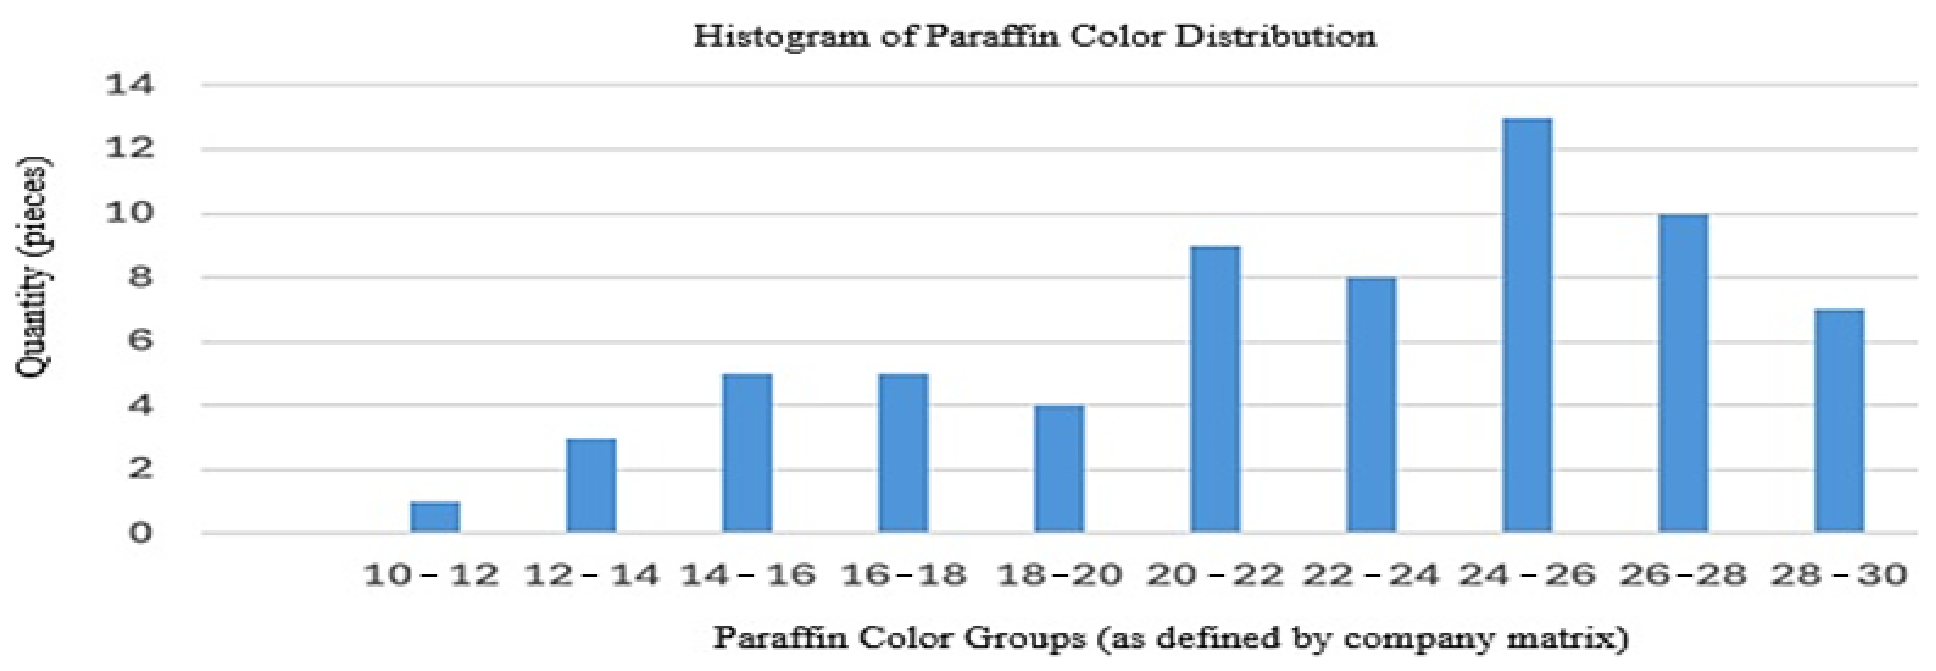
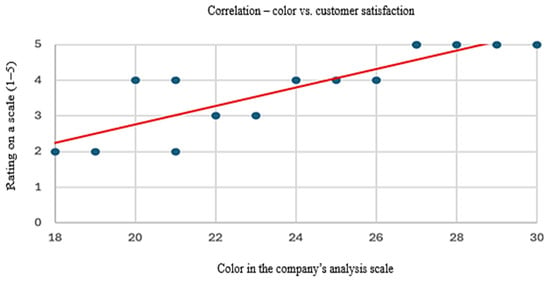
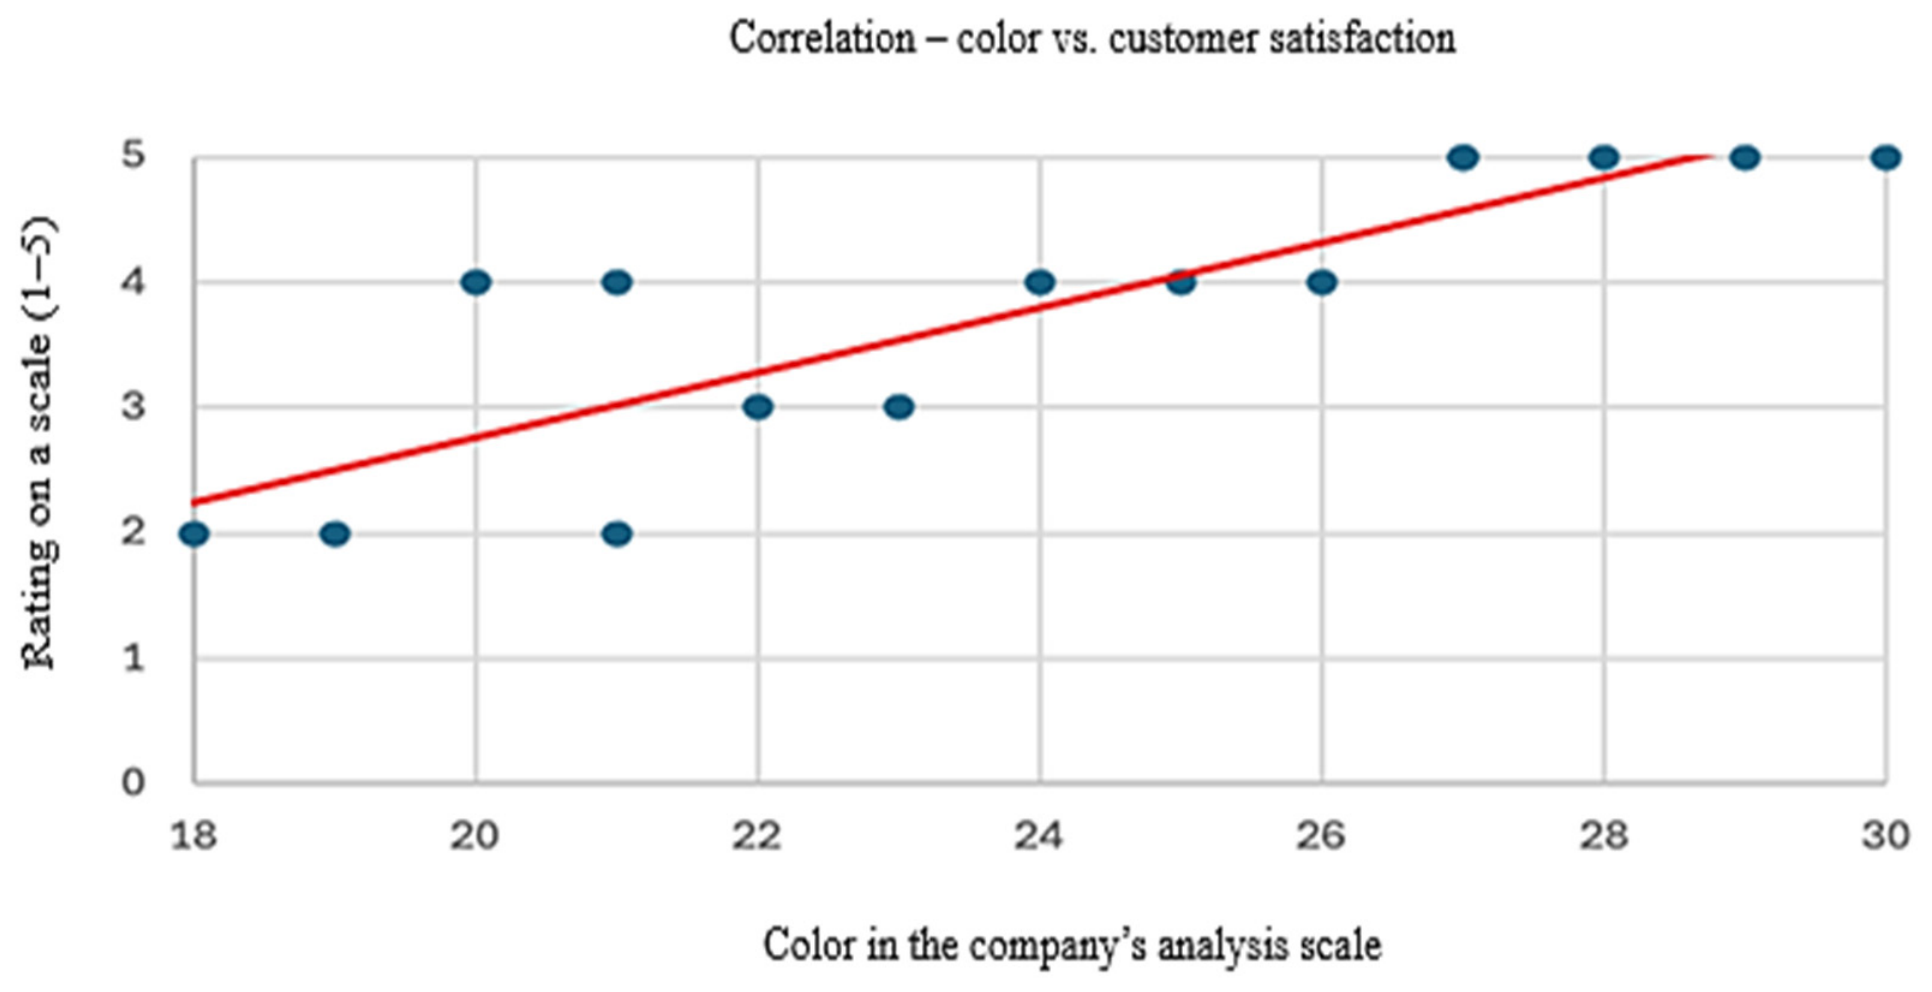
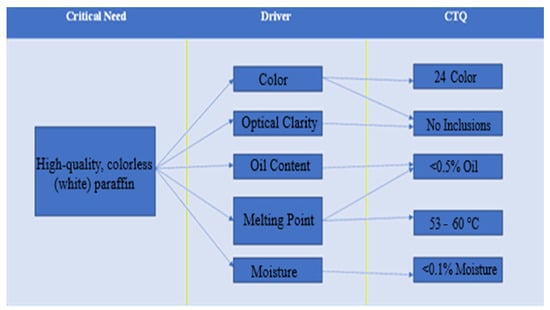
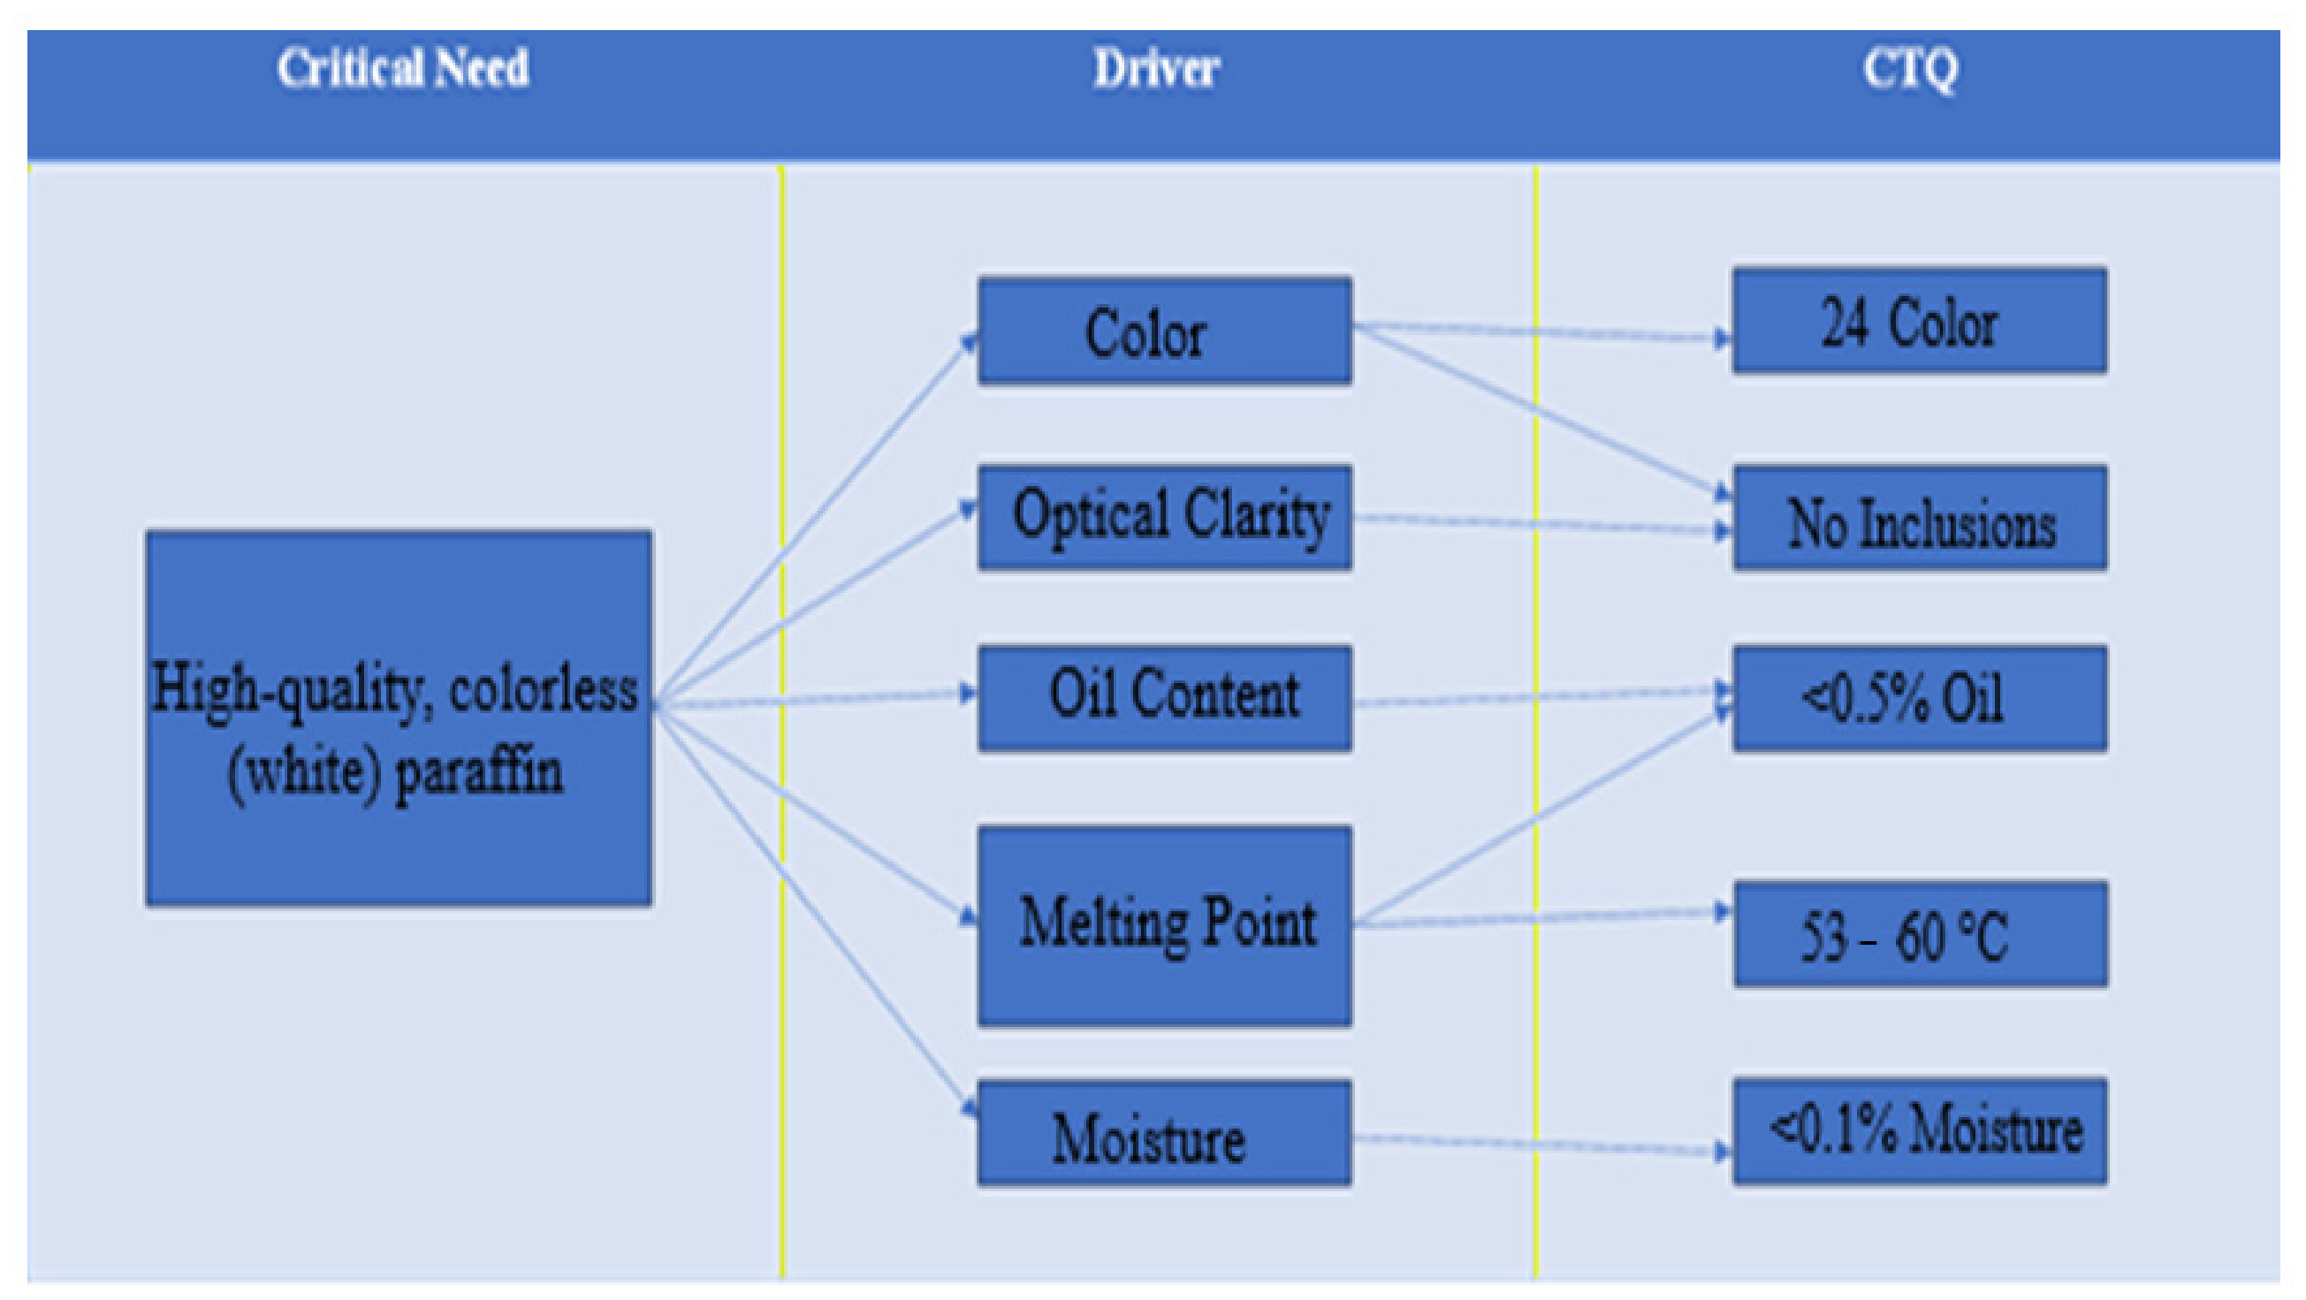

Disclaimer/Publisher’s Note: The statements, opinions and data contained in all publications are solely those of the individual author(s) and contributor(s) and not of MDPI and/or the editor(s). MDPI and/or the editor(s) disclaim responsibility for any injury to people or property resulting from any ideas, methods, instructions or products referred to in the content. |
© 2026 by the authors. Licensee MDPI, Basel, Switzerland. This article is an open access article distributed under the terms and conditions of the Creative Commons Attribution (CC BY) license.