


Abstract
North China is a major production base for winter wheat and one of the regions most severely affected by meteorological droughts. However, the stage-specific characteristics of drought variability and their response to large-scale atmospheric teleconnections remain insufficiently understood, limiting sustainable winter wheat production and food security. Based on monthly observational records from 1961 to 2021 and large-scale atmospheric circulation data, this study investigated the spatiotemporal evolution of long-term meteorological drought across the entire winter wheat growing season, as well as its linkages with atmospheric circulation through the integrated application of Sen’s slope estimation, Modified Mann-Kendall (MMK) test, run theory, and wavelet analysis. The results showed that the 12-month Standardized Precipitation Evapotranspiration Index (SPEI-12) for each winter wheat growth stage exhibited significant upward trends over the study period, especially during the overwintering–jointing stage (0.0092 yr−1). The trends in SPEI-12 varied considerably across different growth stages, with pronounced drying detected in Shanxi Province, northern Hebei Province, and eastern Shandong Province. Drought frequency in Shanxi, northern Hebei, and southern Henan during the whole growth period was relatively high, yet drought duration and severity were generally low. SPEI-12 responded differently to circulation factors across the growth stages. The Pacific Decadal Oscillation (PDO) showed the strongest coherence with SPEI-12 during the emergence–tillering stage (Percentage of Significant Coherence Area, PASC = 12.63%), whereas the Niño 3.4 Sea Surface Temperature Index (Niño 3.4) was most strongly associated with SPEI-12 during the overwintering–jointing (PASC = 12.27%) and booting–maturity (PASC = 10.00%) stages. These findings advance the understanding of winter wheat drought risk and teleconnection-driven drought patterns, with implications for sustainable agricultural strategies.
1. Introduction
Drought is one of the major meteorological hazards threatening global agroecosystem stability and food security [1,2], with roughly three-quarters of the global harvested area experiencing drought-related production losses [3]. Crop production depends not only on the total water supply over the entire growing season but also on crop sensitivity to moisture stress at specific phenological stages [4]. For example, water deficits during the emergence–tillering stage directly inhibit seedling establishment and reduce the number of productive tillers [5]. Drought from overwintering to jointing impairs spike differentiation and increases susceptibility to frost injury [6], and water stress during booting–maturity lowers both grain number per spike and thousand-grain weight, ultimately resulting in substantial yield reductions [7,8]. A thorough understanding of the spatiotemporal drought patterns at different growth phases is thus essential for accurately evaluating drought impacts on crop physiology and for informing targeted adaptation strategies [9,10].
A reliable drought index is needed to accurately identify drought events [11,12]. Numerous drought indices have been proposed such as the Standard Precipitation Index (SPI) [13], the Palmer Drought Severity Index (PDSI) [14], the Standard Precipitation Evapotranspiration Index (SPEI) [15], and the Composite Meteorological Drought Index (CI) [16]. The SPI is based solely on precipitation and does not account for the influence of atmospheric moisture demand. The PDSI incorporates a simplified water balance but suffers from region-dependent calibration, which limits its spatial comparability. The CI effectively combines monthly and seasonal precipitation anomalies with moisture deficits for drought monitoring, but its high sensitivity to short-term precipitation often causes unrealistic jumps in drought severity and underestimates prolonged severe droughts [17,18]. In contrast, although it is dependent on the choice of the PET estimation method [19,20,21], the SPEI addresses the concurrent effects of precipitation and potential evapotranspiration, and it is also easy to calculate and operates over multiple timescales [22]. Therefore, the SPEI is suitable for analyzing meteorological drought characteristics to support disaster management. By adjusting its accumulation window, the SPEI characterizes drought across diverse temporal scales effectively bridging rapid soil moisture deficits and prolonged hydrological droughts. The SPEI for 1–6-month timescales reflects rapid soil moisture conditions, whereas longer timescales represent cumulative anomalies in water balance and correlate most strongly with cumulative water deficit and interannual drought trends [18,23]. The appropriate timescale for SPEI depends on the specific hydrological or agricultural process being characterized.
North China is a major grain-producing region, has the highest average planting area, total production, and yield per unit area in China and contributes a substantial share of the national winter wheat production [24,25]. Recent studies have substantially advanced our understanding of drought variability across various regions, with particular emphasis on its spatiotemporal evolution [26,27], trend and recurrence patterns [23], and vegetation response [28], but stage-specific drought research remains insufficient and warrants further strengthening. On the other hand, drought variability is strongly modulated by atmospheric circulation factors. The precipitation and temperature variability in North China are coherent with the El Niño-Southern Oscillation [23,29], and also correlate closely with the eastward-shifted negative phase of the summer North Atlantic Oscillation [30] and the coupling of these atmospheric circulation factors [31,32]. However, a fundamental challenge in using these teleconnections is their non-stationary nature [33], and a systematic evaluation of the coupled relationships across specific growth periods remains inadequately addressed. To address these gaps, the present study aimed to (1) characterize the spatiotemporal evolution of SPEI-12 across growth stages from 1961 to 2021; (2) quantify the spatial patterns of drought events and their differentiation across critical growth stages; (3) identify the coupling between SPEI-12 and atmospheric circulation indices across multiple time–frequency domains. These analyses are expected to provide a scientific reference for drought risk assessment and adaptive management of winter wheat production in North China.
2. Materials and Methods
2.1. Study Area
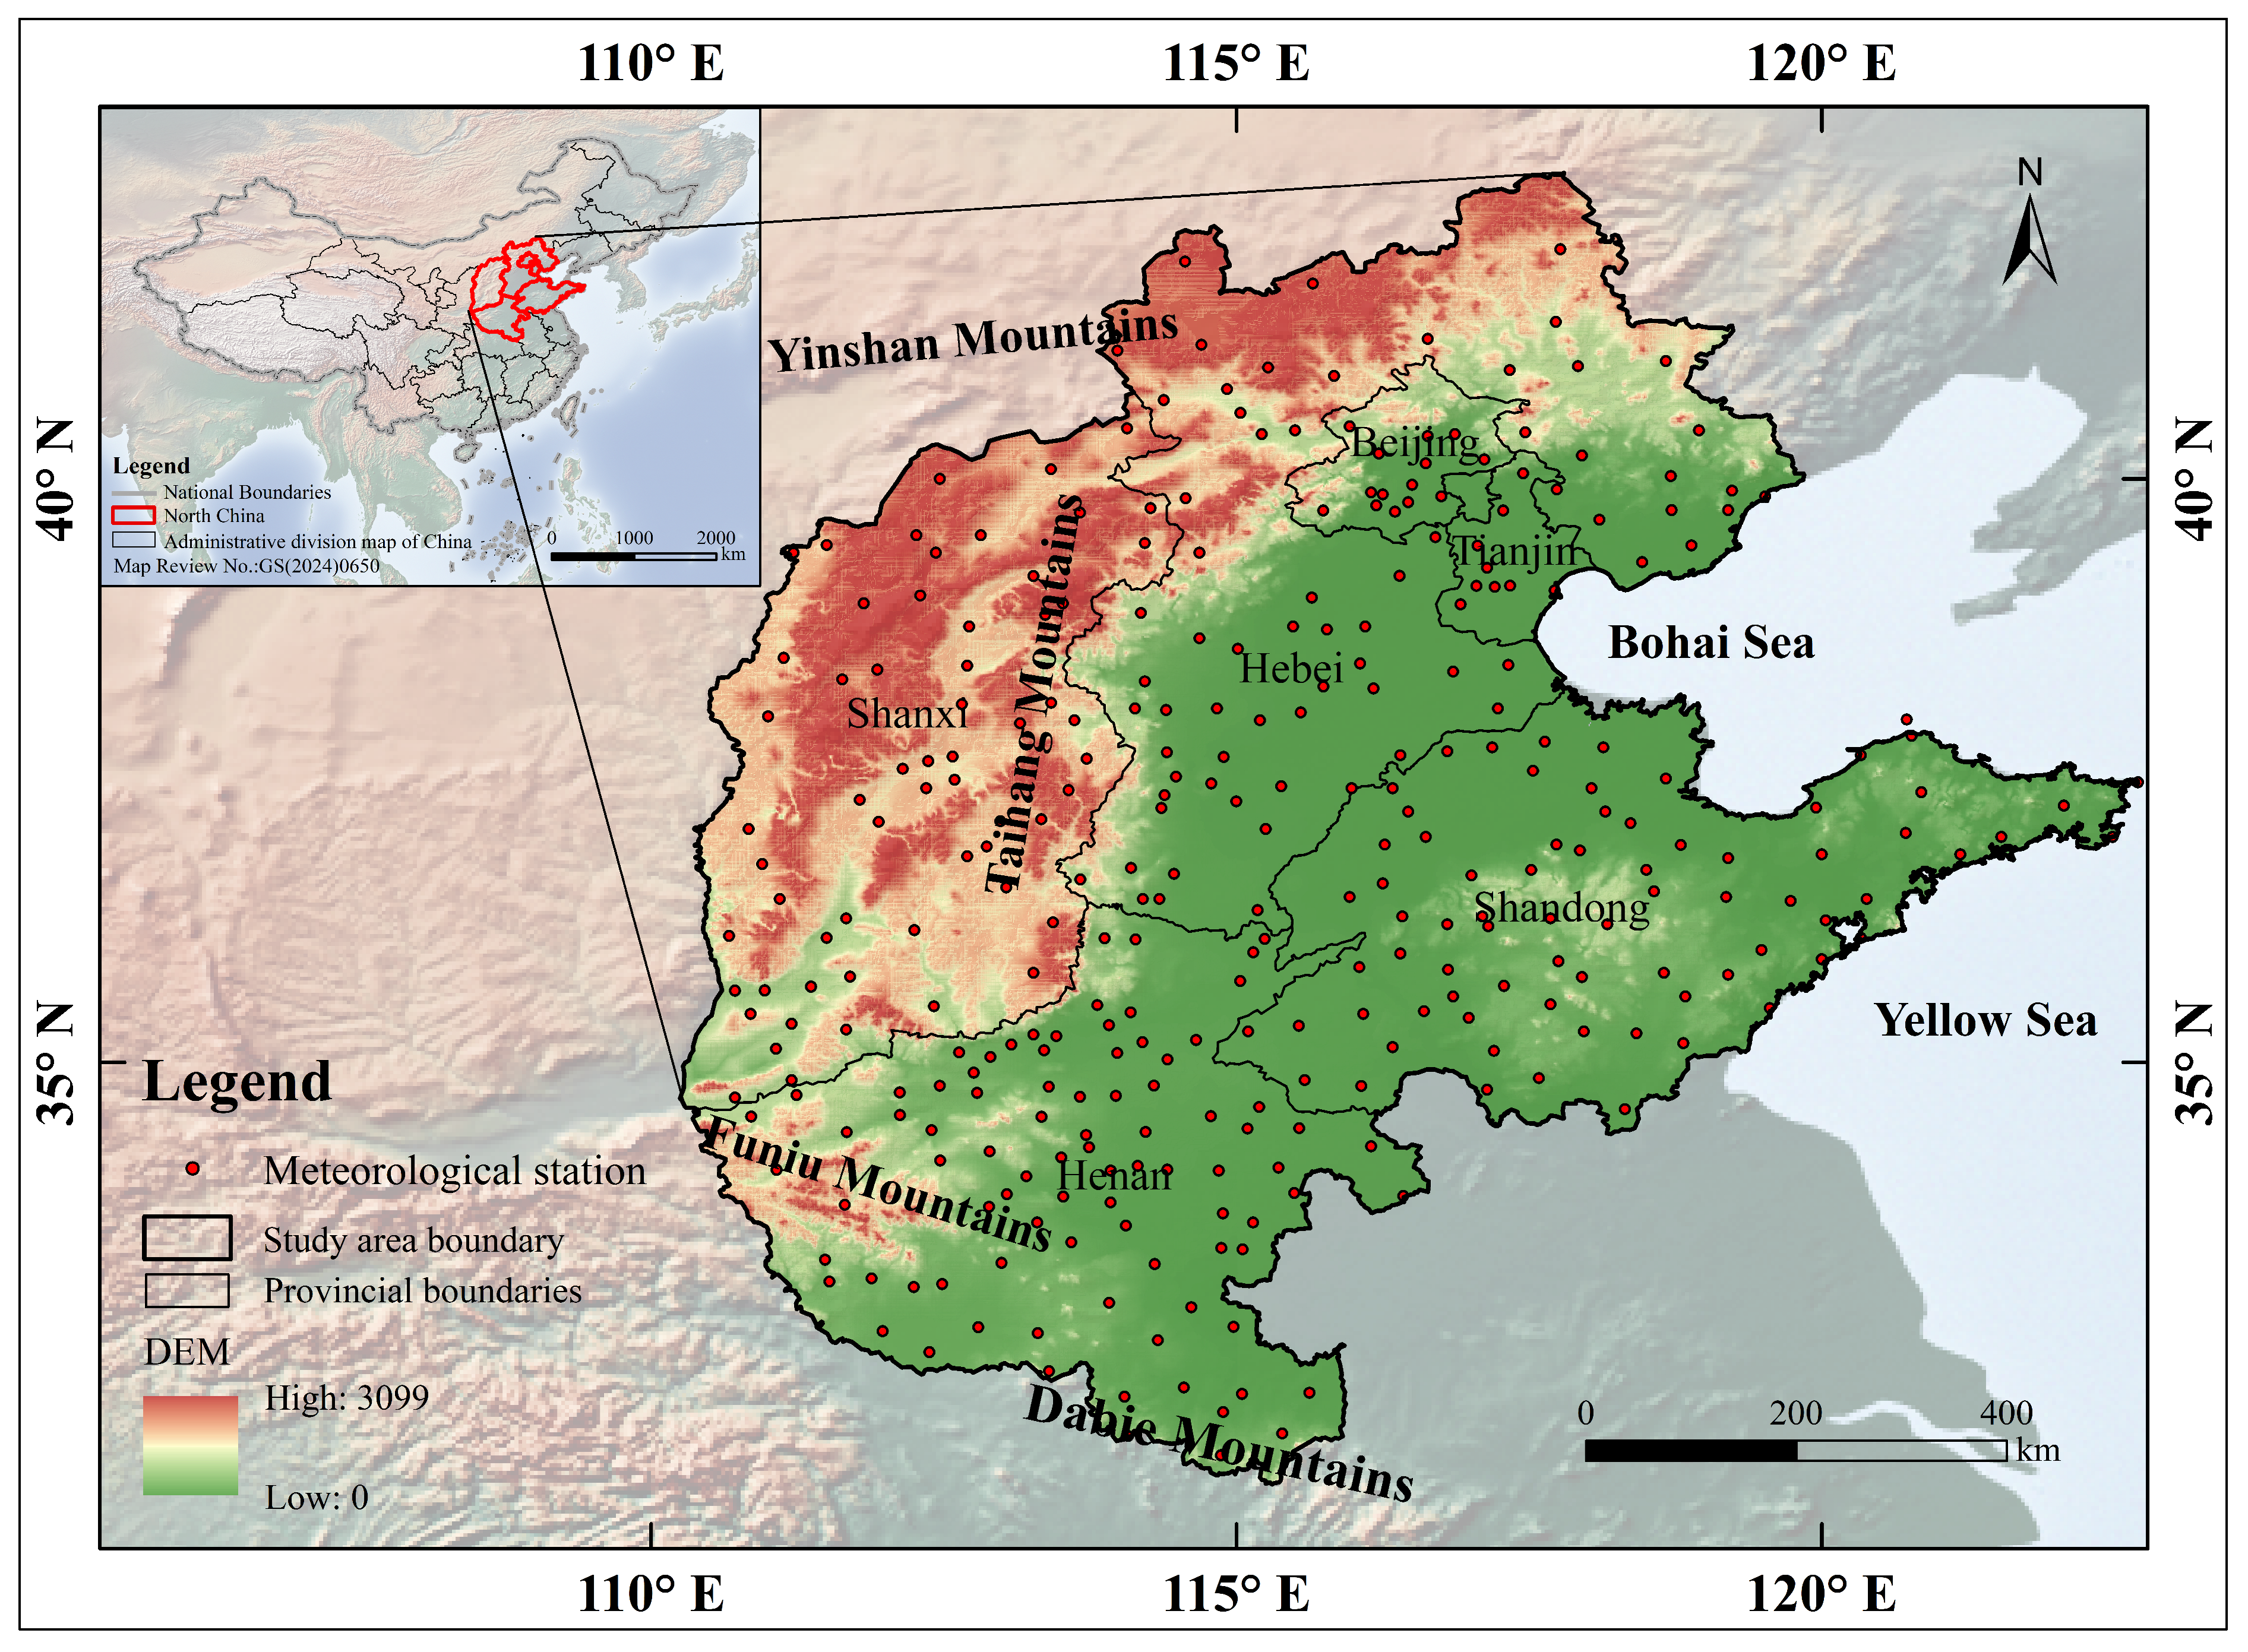
North China is bordered by the Yanshan Mountains to the north, the Dabie Mountains to the south, the Taihang and Funiu Mountains to the west, and the Bohai and Yellow Seas to the east (Figure 1). This area comprises Beijing and Tianjin municipalities and the provinces of Hebei, Henan, Shandong, and Shanxi. It features a semi-humid monsoon climate, with annual precipitation of 600–900 mm and annual accumulated temperature of 3200–4500 °C [34]. Precipitation is unevenly distributed within the year and highly variable interannually, resulting in frequent drought flood alternation that seriously threatens agricultural production. The region is dominated by three crops over two-year systems and constitutes a major production area in China for winter wheat, maize, and cotton [35]. Winter wheat is sown in mid-October and harvested the following June. Accordingly, the entire growing season in this study refers to October to the following June, and the growth period is generally divided into three key phenological stages: emergence–tillering (October–November), overwintering–jointing (December–April), and booting–maturity (May–June) [36].
Figure 1.
Geographic location of the study area and distribution of meteorological stations.
2.2. Data Sources
Meteorological data were obtained from the observation datasets provided by the Resource and Environmental Science Data Center of the Institute of Geographic Sciences and Natural Resources Research, Chinese Academy of Sciences (https://www.resdc.cn/ (accessed on 31 August 2026)). The datasets comprised monthly minimum temperature, maximum temperature, mean temperature, precipitation, and wind speed. First, meteorological stations with more than 12 consecutive months of missing records for meteorological variables were excluded. Missing data for sporadic missing values were imputed by the mean of adjacent months, and for long-term missing data in certain months, the mean of the same period from adjacent years was used. Finally, a total of 315 meteorological stations were retained for subsequent analysis (see Table S1 in the Supplementary Materials). Missing records were identified at one station for precipitation, 10 stations for temperature, 14 stations for wind speed, and 97 stations for sunshine duration. In addition, nine large-scale atmospheric circulation indices covering the period 1961–2021 were selected, namely the Pacific-North American Pattern (PNA), Arctic Oscillation (AO), Pacific Decadal Oscillation (PDO) (https://www.ncei.noaa.gov/access/monitoring/ (accessed on 26 July 2026)), Niño 3.4 Sea Surface Temperature Index (Niño 3.4), Southern Oscillation Index (SOI), Trans-Niño Index (TNI), Atlantic Multidecadal Oscillation (AMO) (https://psl.noaa.gov/gcos_wgsp/Timeseries/ (accessed on 18 June 2026)), North Atlantic Oscillation (NAO) (https://www.cpc.ncep.noaa.gov/data/teledoc/nao.shtml (accessed on 12 July 2026)), and Tropical Northern Atlantic Index (TNA) (https://psl.noaa.gov/data/climateindices/list/ (accessed on 13 August 2026)).
2.3. Methods
The SPEI-12 was used to characterize long-term meteorological drought conditions because of its ability to capture both seasonal and interannual drought persistence [13]. Monthly SPEI-12 values were calculated using the SPEI package (version 1.7) in R. First, based on monthly meteorological data, such as minimum temperature, maximum temperature, average wind speed, sunshine duration, station latitude, and elevation, the potential evapotranspiration (PET) was calculated using the Penman method via the Penman() function. Second, monthly climatic water balances were calculated and then used as input to the spei() function at a 12-month timescale (scale = 12). The spei() function used the default settings of the package, including a rectangular kernel for equally weighted accumulation over the 12-month period, the log-logistic probability distribution, and the unbiased probability-weighted moments method for fitting the probability distribution. In this study, the Mann–Kendall (MK) test was first applied to the mean SPEI-12 time series to detect abrupt changes and to examine the shifting patterns of dry–wet conditions across different growth stages of winter wheat, with a stricter threshold of confidence level (±1.96). Subsequently, Sen’s slope estimator and the Modified Mann–Kendall (MMK) test were employed to quantify trends of the mean SPEI-12 with a significance level of p = 0.10, given the strong interannual variability and relatively limited length of the time series.
To further identify the spatiotemporal characteristics of drought in North China, the run theory was applied by following the methodology of Yao et al. [37]. Specifically, a drought event is defined as beginning in the month when SPEI-12 < −1 and ending in the month when SPEI-12 > 0. In order to compare sufficiently the drought characteristics among winter wheat growth stages, we divided the monthly SPEI-12 series according to winter wheat growth stages to construct a stage-specific SPEI-12 series and identified drought events independently within each growth stage. For each growth stage, the monthly SPEI-12 values within that stage were averaged to obtain a representative value for that stage. It should be noted that the identified runs are interpreted as stage-specific drought segments rather than strictly independent drought events. Five standardized drought metrics were defined as follows: drought frequency (DF), mean drought duration (MDD), mean drought severity (MDS), mean drought intensity (MDI), and extreme drought intensity (DPmax).
where N is the total number of drought events, Y is the number of years in the study period, Ti is the total months for the i-th drought event, Si is the cumulative SPEI-12 for the i-th drought event, and DPi is the lowest SPEI-12 value for the i-th drought event. Among these, DF follows the definition of Yao et al. [37], while MDD, MDS, MDI, and DPmax are defined in this study based on the run theory framework to describe the mean characteristics of multiple drought events. To generate spatial drought characteristics, station-based drought metrics were interpolated using the Inverse Distance Weighted method. The interpolation was performed at a spatial resolution of approximately 5 km in the GCS_Beijing_1954 geographic coordinate system. A variable search radius was automatically adjusted according to the local density of the stations with no fixed distance threshold, and 12 neighboring stations were used for each estimation.
DPmax = max |DPi |, i = 1,2 … N
To investigate the multi-timescale periodic signals and phase relationships between SPEI-12 and climate indices in the time–frequency domain, cross-wavelet transform (XWT) and wavelet coherence (WTC) analyses were jointly employed [38]. XWT captures phase relationships only within high-energy resonance bands, whereas WTC compensates for this limitation by quantifying coherence across all frequency intervals [39]. The analysis was performed in the Grinsted wavelet toolbox of the MATLAB (version R2023b) platform, with its default settings including zero padding (Pad = 1), a scale resolution of Dj = 1/12, and a minimum scale of S0 = 2dt. The time series were mean-centered but were not further normalized to unit variance. Significance was assessed against a red-noise background using Monte Carlo simulations with 300 iterations. The cone of influence (COI) was used to identify regions affected by edge effects, and the 95% significance level was determined from Monte Carlo simulations. Additionally, the Percentage of Significant Coherence Area (PASC) was introduced as a quantitative measure of correlation strength, with higher PASC values indicating more robust wavelet coherence. For the PASC calculation, as shown in Equation (6), the percentage was computed as the proportion of significant points (sif95 ≥ 1) across the entire wavelet matrix:
where Nsig is the number of significant points and Ntotal is the total number of points in the wavelet matrix.
In the cross-wavelet power spectra and wavelet coherence spectra, the thin black solid line denotes the cone of influence, which indicates regions affected by wavelet edge effects; the thick black contours mark areas passing the 95% significance test against red noise, corresponding to statistically significant phase relationships. Red shades indicate high coherence intensity, whereas blue shades indicate low coherence intensity. The arrows indicate phase differences between the two time series: → denotes in-phase variation (positive correlation); ← denotes anti-phase variation (negative correlation); ↓ indicates that SPEI-12 leads the climate index by one-quarter of the oscillation period; and ↑ indicates that SPEI-12 lags the climate index by one-quarter of the oscillation period.
3. Results
3.1. Temporal and Spatial Variations in SPEI-12
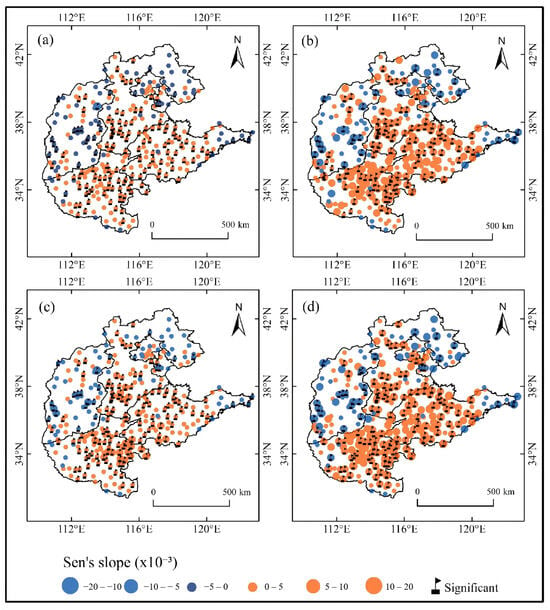
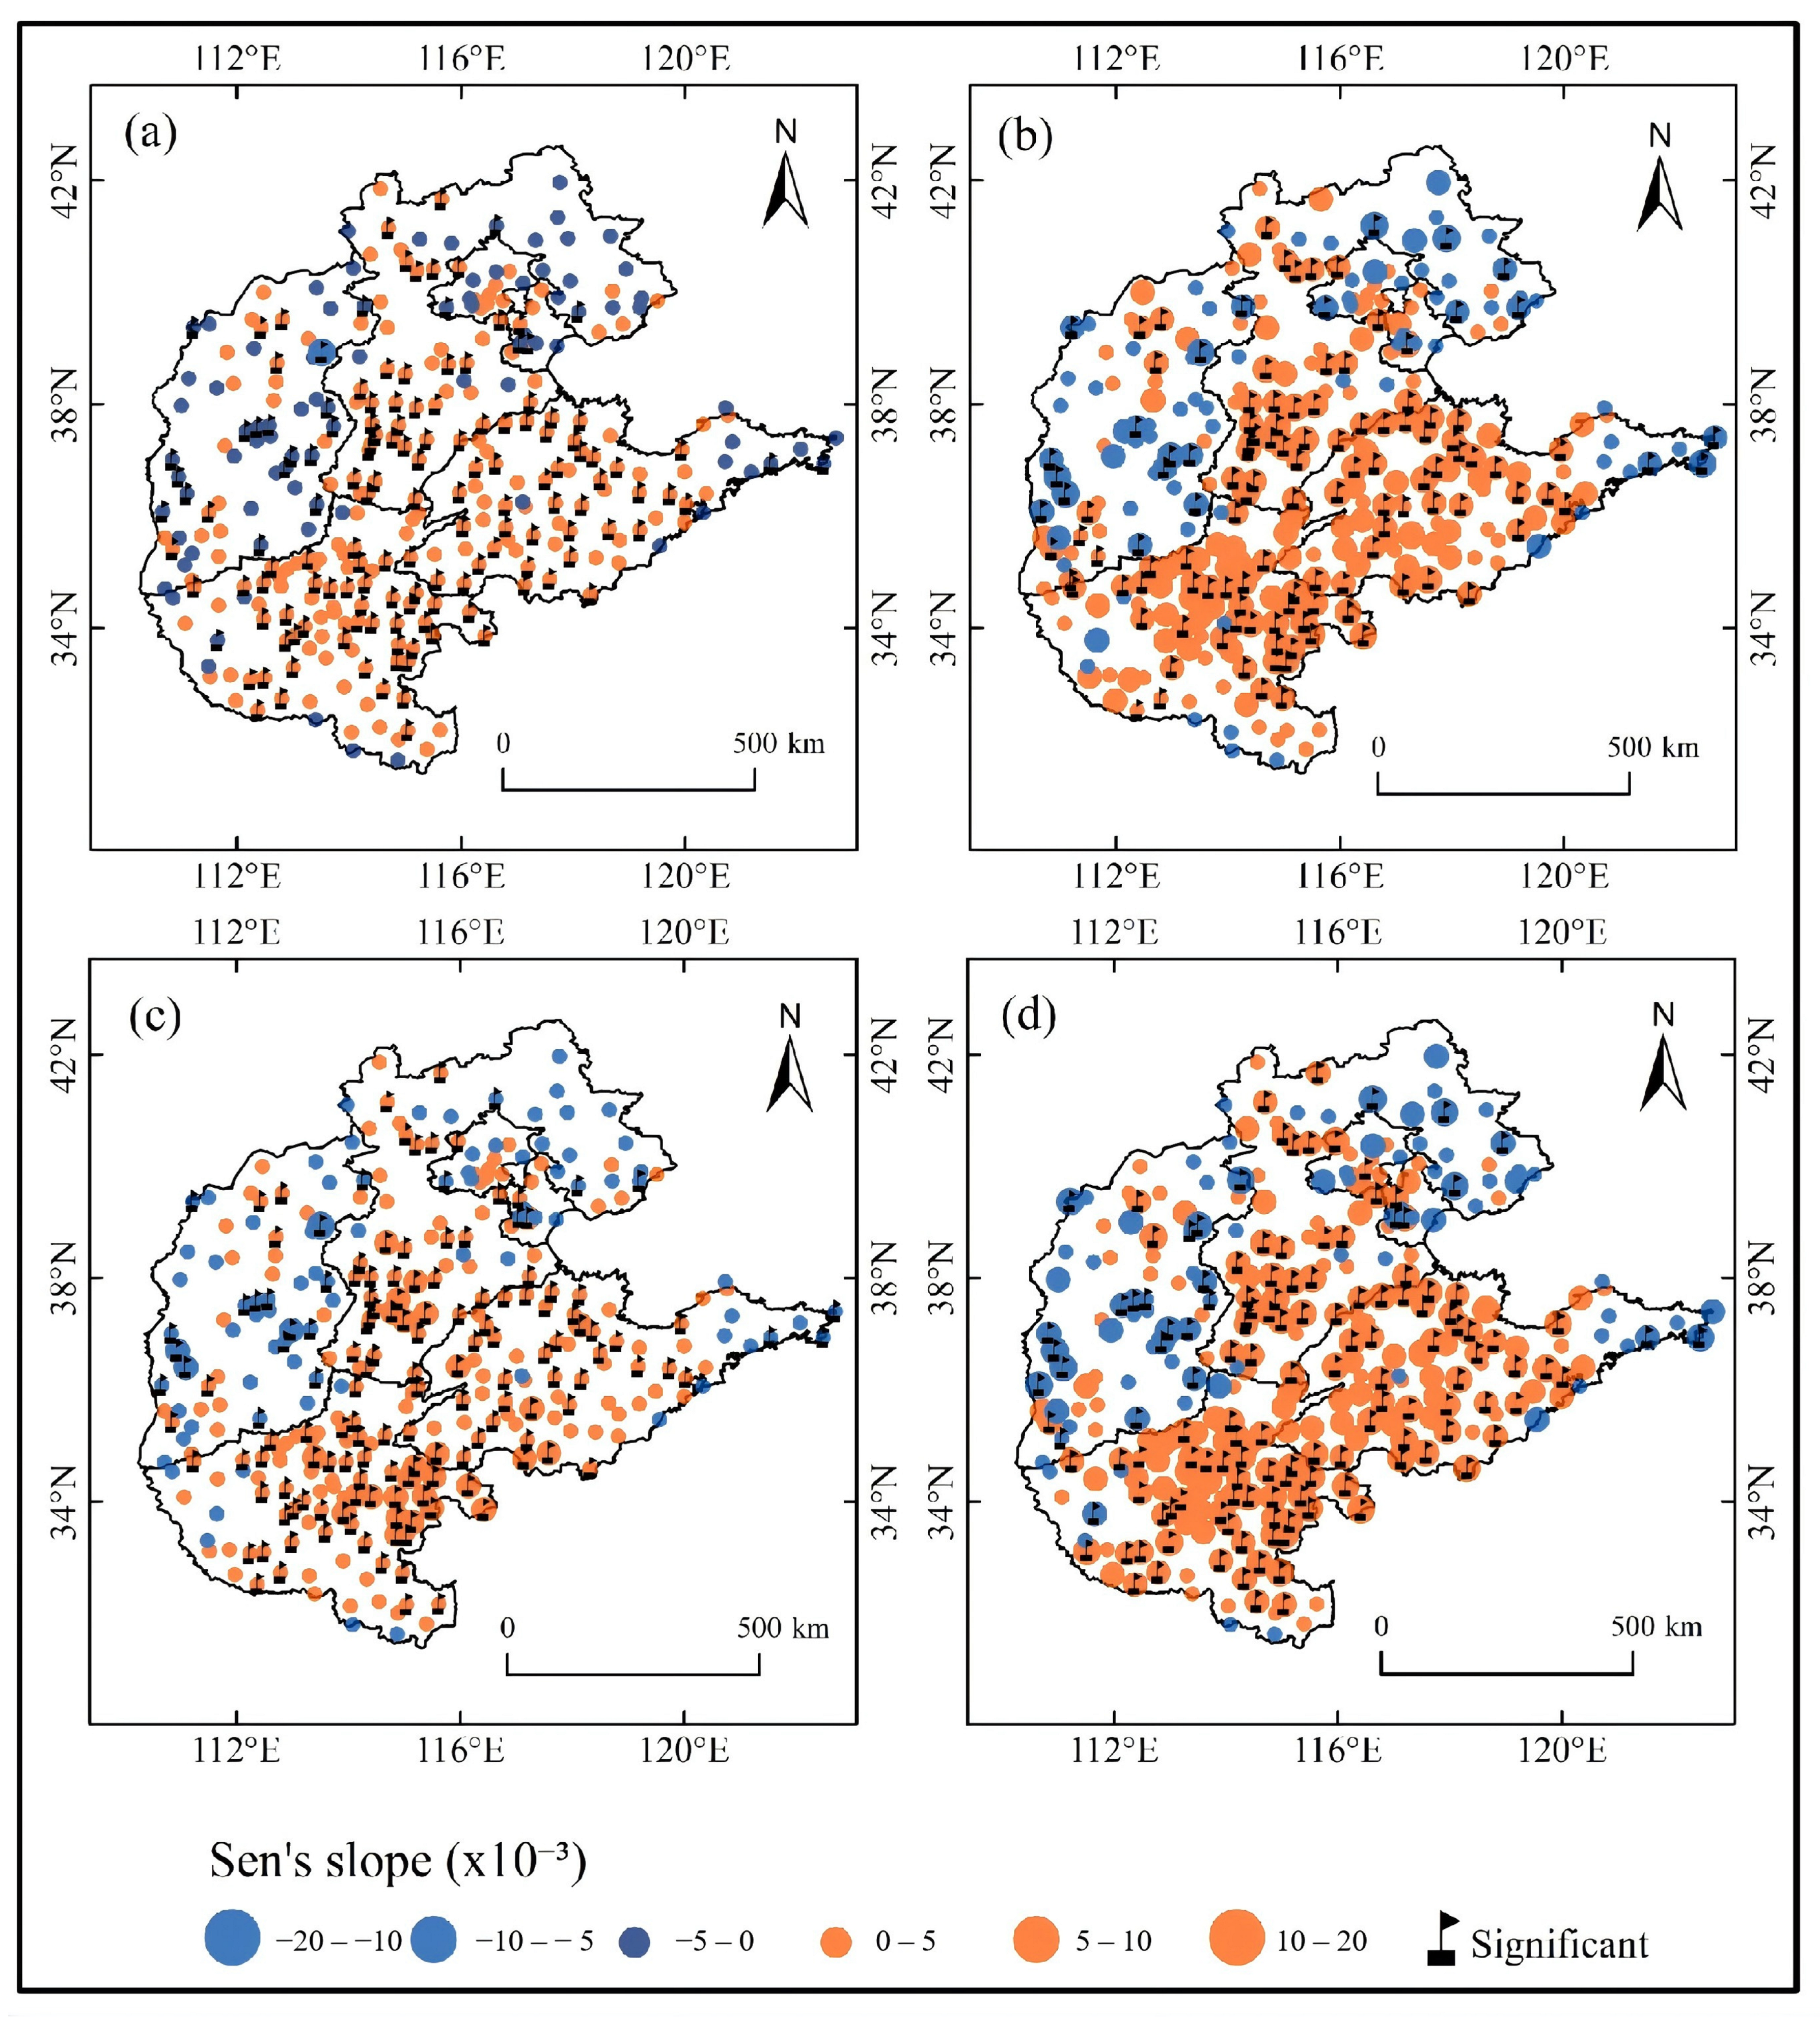
Figure 2 shows the spatial distribution of the SPEI-12 trend across different winter wheat growth stages from 1961–2021. For the entire growing season, increasing SPEI-12 trends were observed at 72.06% of the stations across North China, 38.10% of which were significant and mainly concentrated in southern Hebei, Shandong, and Henan. Comparatively, drying trends were significantly detected at only 7.62% of the stations, mostly clustered in Shanxi Province (Figure 2a). The spatial patterns of the SPEI-12 trend were similar among growth stages, while the magnitudes showed pronounced spatial heterogeneity. In general, increasing SPEI-12 trends were similarly concentrated in southern Hebei, Henan, and Shandong, with significant variation at 32.70% of the stations in the emergence–tillering stage, 40.00% in the overwintering–jointing stage, and 36.51% in the booting–maturity stage (Figure 2b–d). Moreover, the increase in SPEI-12 at the wetting region was more pronounced during the emergence–tillering and booting–maturity stages.
Figure 2.
Spatial patterns of SPEI-12 variation trends during winter wheat growing season in North China from 1961 to 2021. (a) The entire growing season, (b) the emergence–tillering stage, (c) the overwintering–jointing stage, (d) the booting–maturity stage.
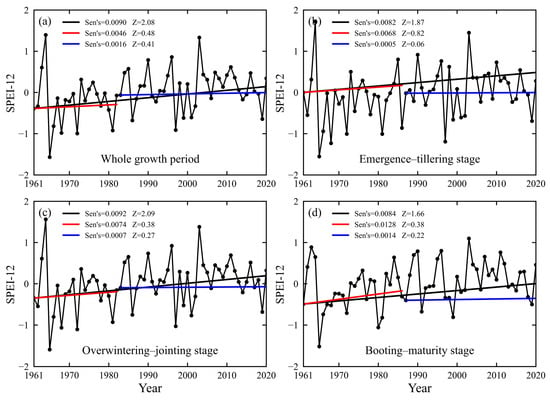
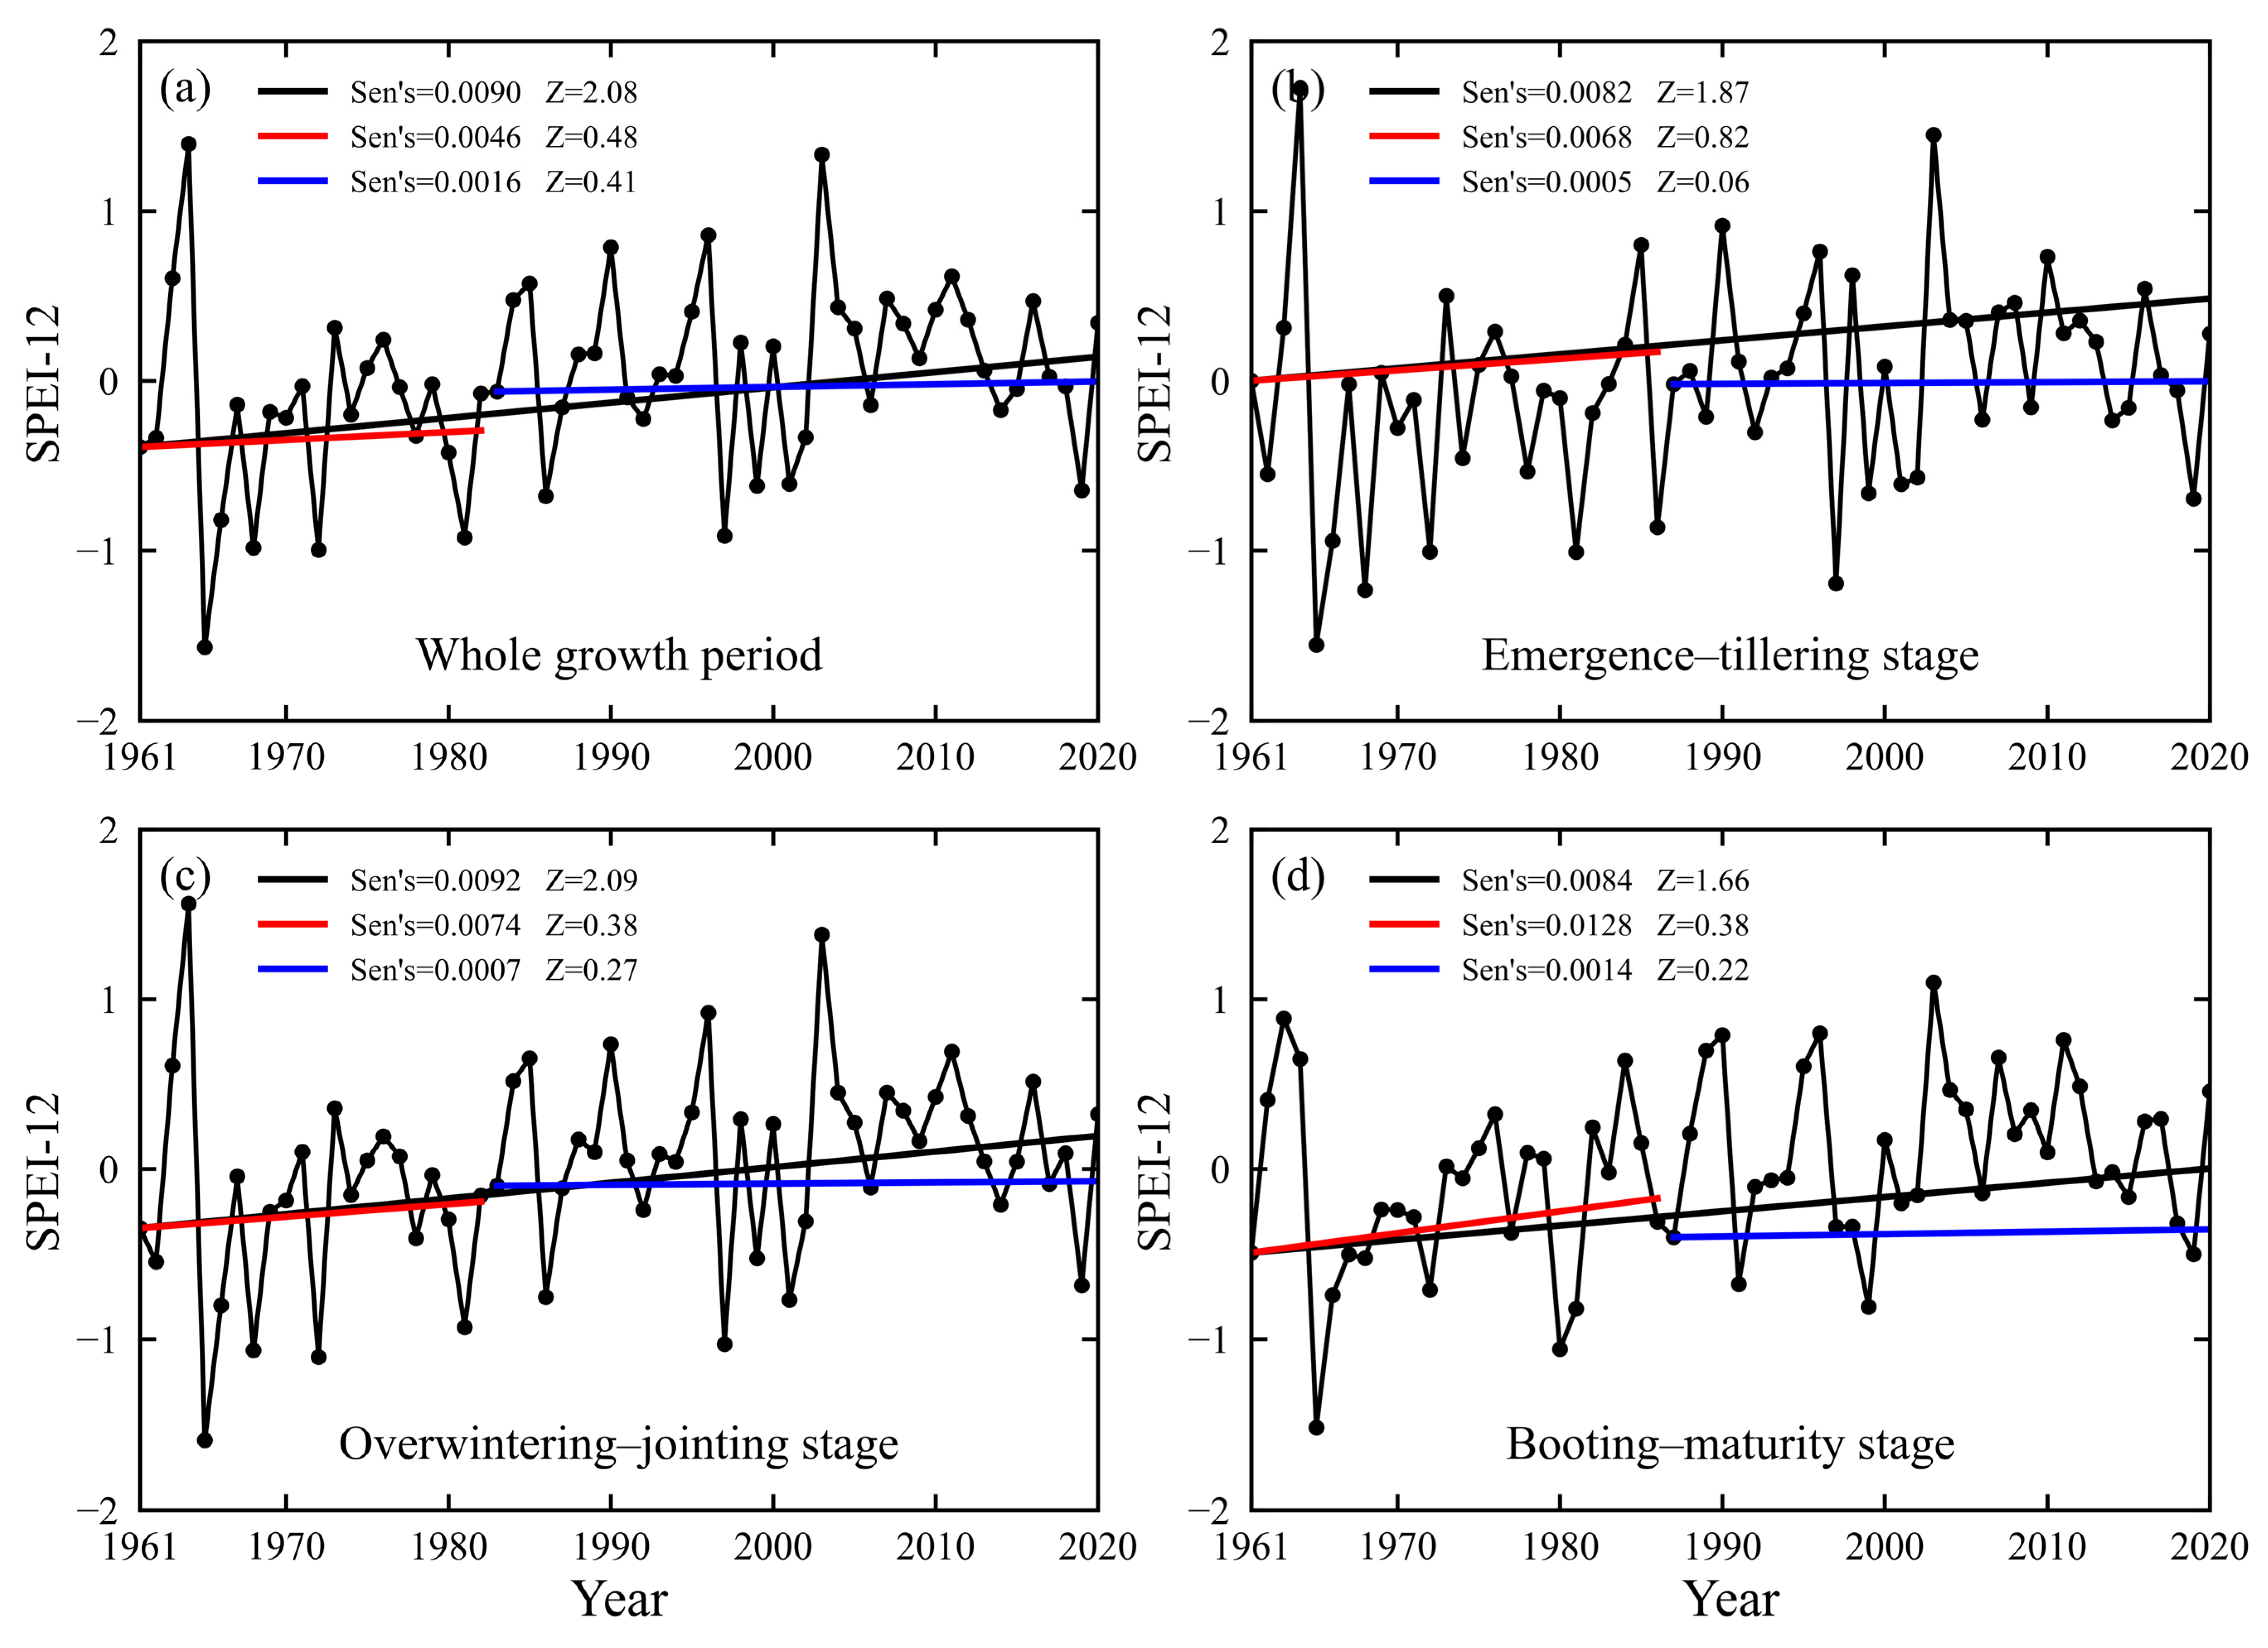
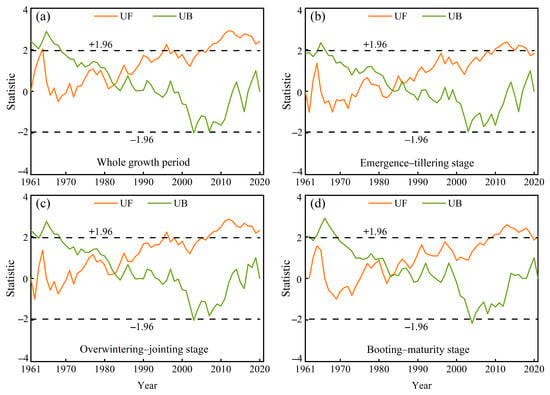
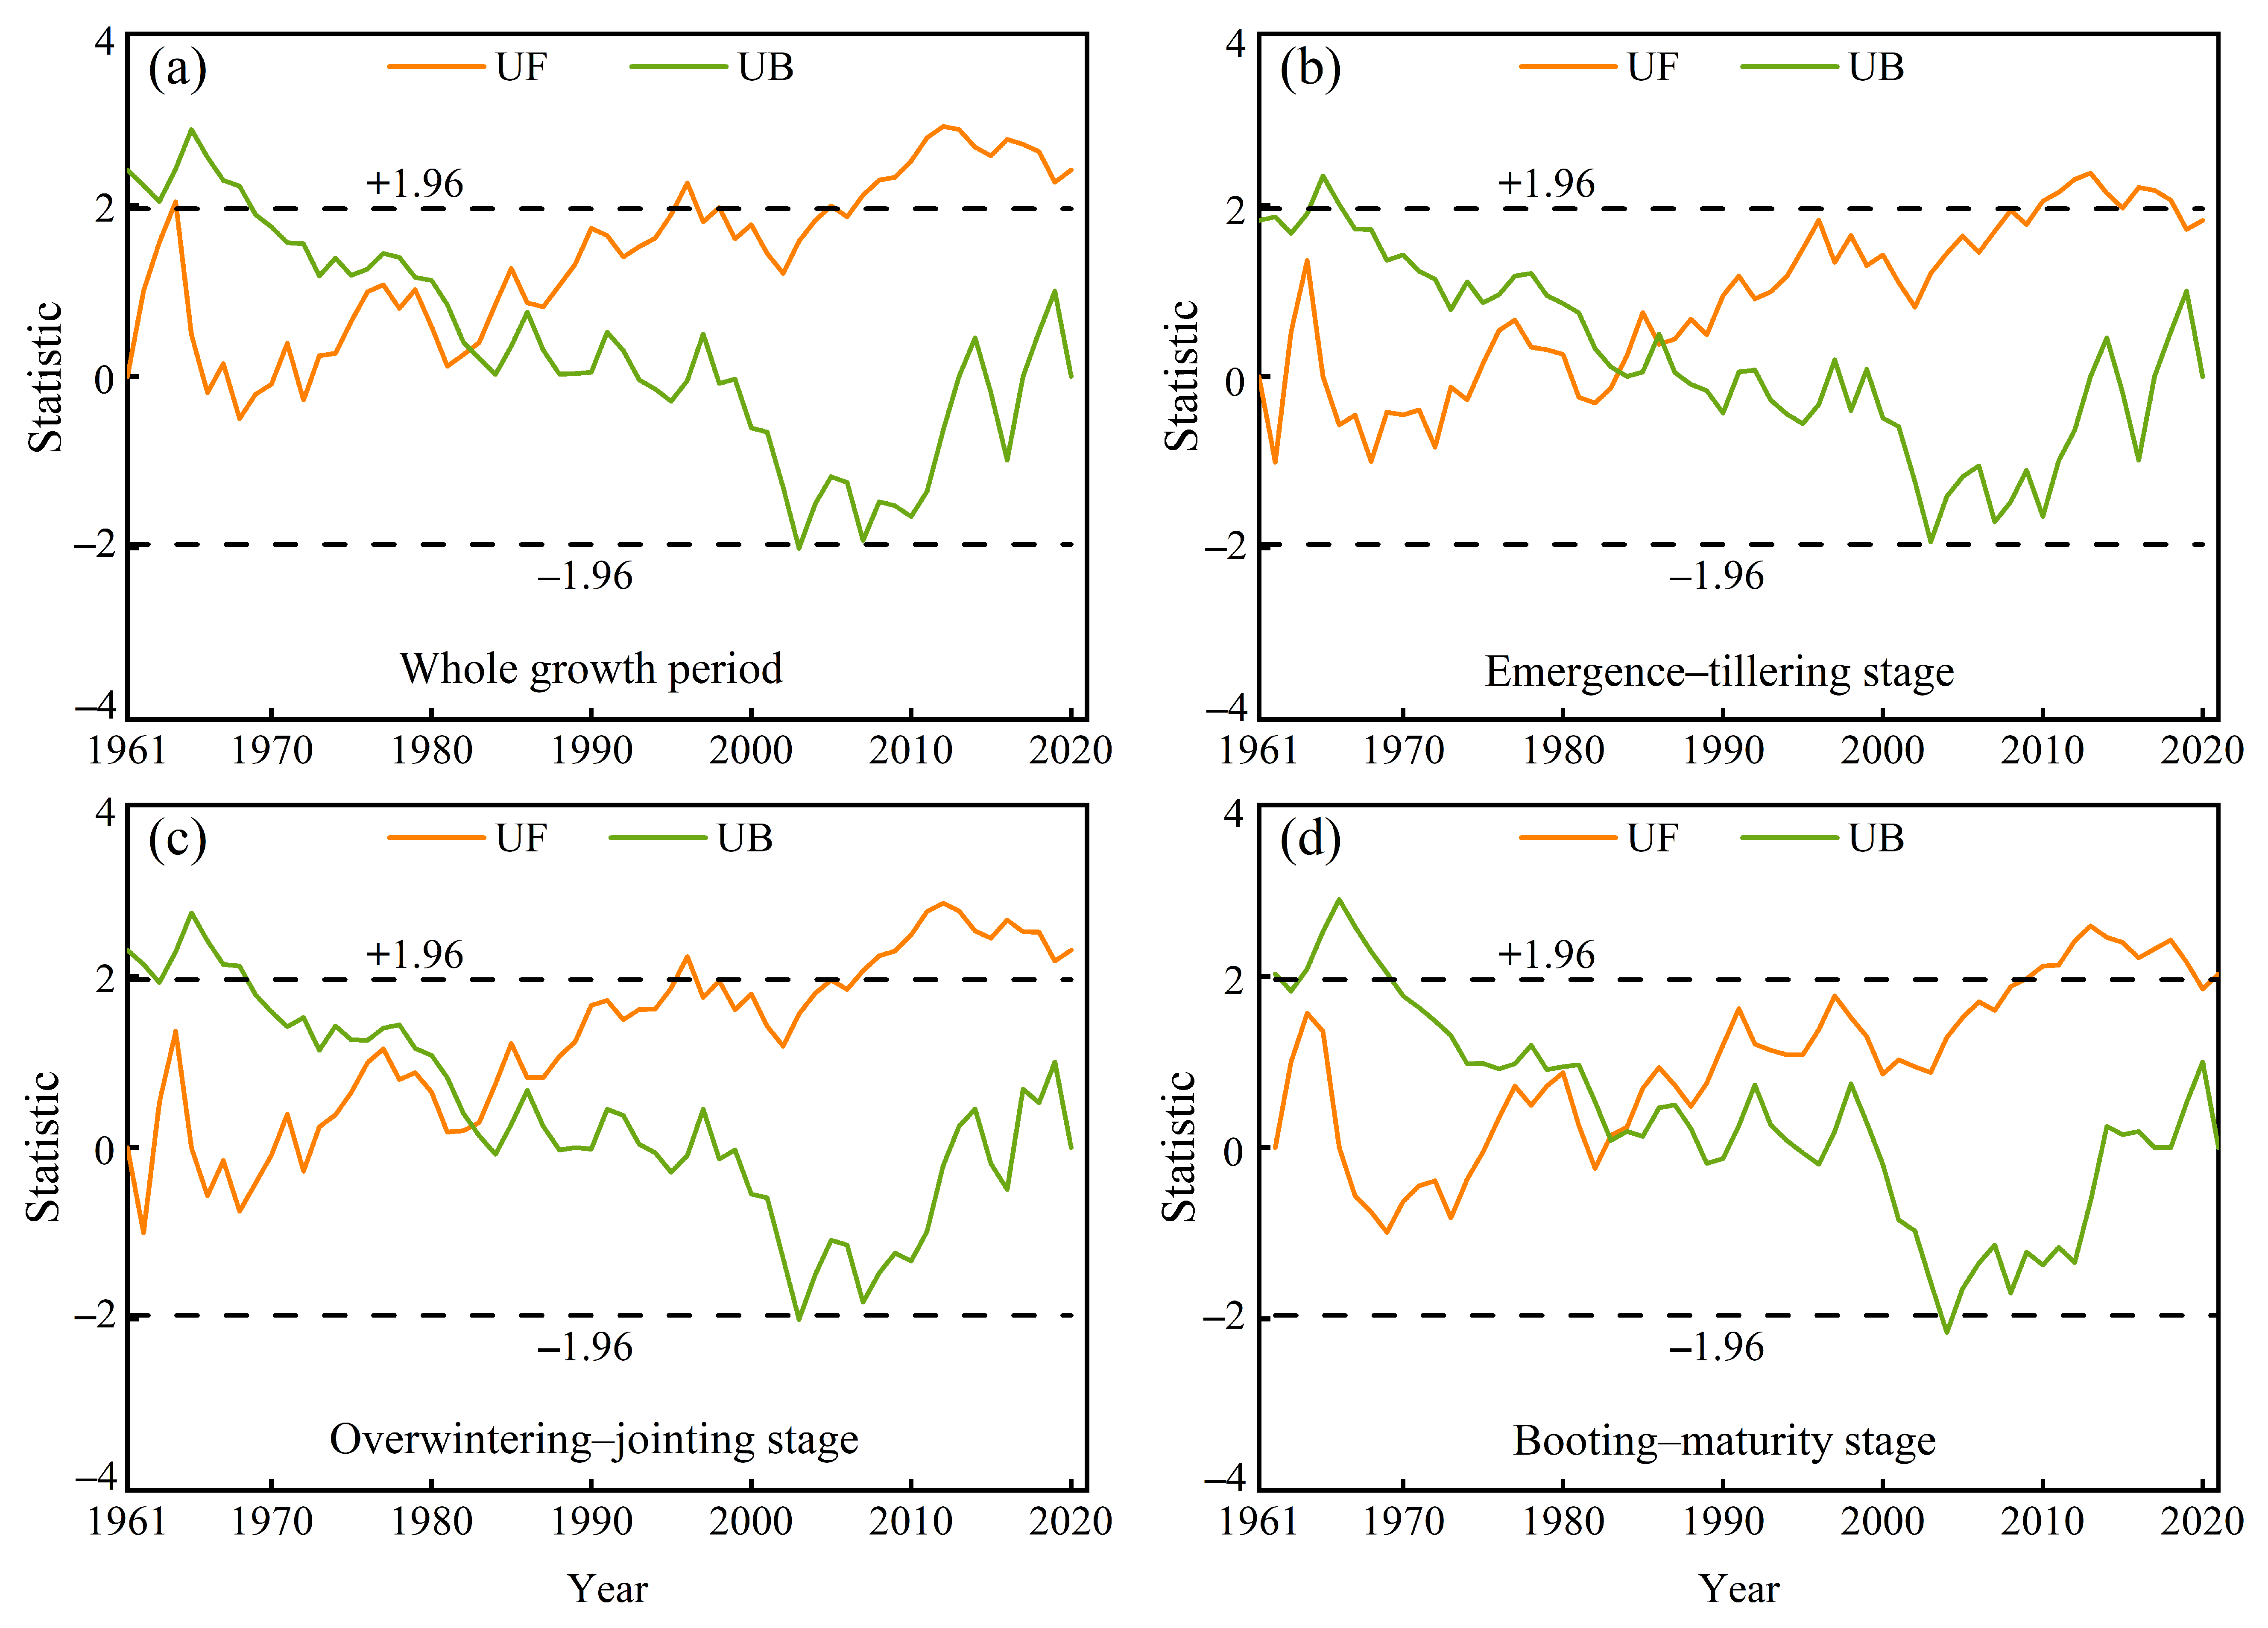
At the regional scale, SPEI-12 showed a significant increasing trend during the entire growth stage from 1961 to 2021, with a slope of 0.0090 yr−1 (Figure 3). Similarly, significant increasing trends were also observed for the emergence–tillering stage (0.0082 yr−1), overwintering–jointing stage (0.0092 yr−1), and booting–maturity stage (0.0084 yr−1). Furthermore, the UF and UB curves intersect within the confidence interval in 1982 for both the entire growing season and the overwintering–jointing stage, suggesting a possible change point. Thereafter, the UF curve rose steadily and exceeded the confidence level line after 2007, indicating a significant shift toward wetter conditions (Figure 4). For the booting–maturity stage, the SPEI-12 significantly shifted toward an increasing trend in 2009–2021.
Figure 3.
Interannual variations of SPEI-12 during winter wheat growing season in North China from 1961 to 2021. (a) the entire growing season, (b) the emergence–tillering stage, (c) the overwintering–jointing stage, (d) the booting–maturity stage.
Figure 4.
Change point of SPEI-12 during winter wheat growing season in North China from 1961 to 2021. The UF curve represents the forward Mann–Kendall statistic sequence, while the UB curve represents the backward sequence. (a) the entire growing season, (b) the emergence–tillering stage, (c) the overwintering–jointing stage, (d) the booting–maturity stage.
3.2. Spatial Patterns and Characteristics of Drought Events
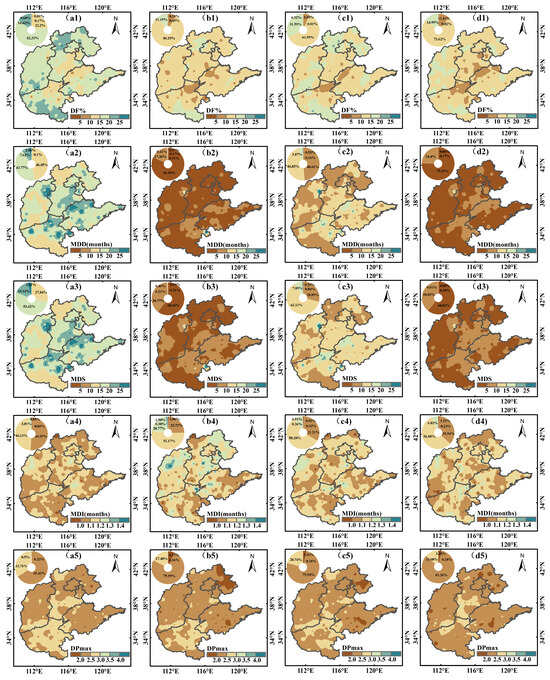
Figure 5 illustrates the spatial patterns of drought characteristics across different growth stages. During the entire growing season, regions characterized by long-duration drought (MDD ≥ 20) and high drought severity (MDS ≥ 20) were predominantly located in southern Hebei, northern Shanxi, northeastern Henan, and Shandong, although drought frequency was relatively low in these regions. Compared with the emergence–tillering stage, the overwintering–jointing stage exhibited a marked increase in both drought duration and severity across Shandong, southern Henan, and Hebei. The spatial pattern of MDI was broadly consistent between the two stages, with DPmax more pronounced in north-central Henan and high drought intensity (MDI ≥ 1.2) scattered throughout the region. During the booting–maturity stage, areas with low drought duration (MDD ≤ 5) and low drought severity (MDS ≤ 5) accounted for 75.39% and 60.82% of the study area respectively, mainly located in Shanxi, southern Hebei, northern Shandong, and Henan. DPmax values of 2.0–2.5 covered 83.26% of the study area, with larger values in some parts of southern Hebei and surrounding areas.
Figure 5.
Spatial patterns of drought event across different winter wheat growth stages in North China from 1961–2021. (a1–a5) The entire growing season, (b1–b5) the emergence–tillering stage. (c1–c5) the overwintering–jointing stage. (d1–d5) The booting–maturity stage. The inset panels show the area proportions of each class, with the same color scheme as the map.
3.3. Correlation Between SPEI-12 and Large-Scale Atmospheric Circulation Indices
The cross-wavelet power spectra illustrate the periodic signals and phase relationships between SPEI-12 and nine atmospheric circulation indices across each phenological stage (Figure 6). During the entire growing season, significant anti-phase resonances between SPEI-12 and Niño 3.4 were detected at 12–39 months (1963–1976), 36–55 months (1981–1995), and 10–41 months (1992–2009), alongside an unstable 18- to 28-month signal during 1978–1991. The SPEI-12–PNA pair exhibited discontinuous periodic bands at 12–36 months (1963–1975) and 14–24 months (1994–2007) with unstable phases, whereas significant positive and negative coherences emerged at 22–33 months (1977–1985) and 39–60 months (1983–1996), respectively. SPEI-12 and SOI displayed stable in-phase signals at 13–36 months (1964–1975), 42–57 months (1982–1995), and 13–28 months (1994–2001), with weak incoherence from 1979–1988 at 20.5–26.5 months. For the SPEI-12–TNI pair, significant positive and negative signals occurred at 11–31 months (1964–1976) and 41–55 months (1982–1994), respectively, while the periods 1980–1992 and 1994–2010 were characterized by unstable phase relations.
Figure 6.
Cross-wavelet power spectra of SPEI-12 and large-scale atmospheric circulation indices during winter wheat growing season. The arrows indicate the phase difference between the two time series: arrows pointing right (→) denote in-phase variation (positive correlation); arrows pointing left (←) denote anti-phase variation (negative correlation); arrows pointing down (↓) indicate that SPEI-12 leads the climate index by one-quarter of the oscillation period; and arrows pointing up (↑) indicate that SPEI-12 lags the climate index by one-quarter of the oscillation period.
For the emergence–tillering stage, AO and TNI shared two oscillation windows: a stable positive band at 3.5–8 months (1964–1971), and an unstable band (1996–2002). Niño 3.4 exhibited persistent anti-phase short-period coherence across multiple intervals. SOI showed significant in-phase signals at 2.4–7.6 months (1963–1975) and 2.7–5.5 months (1995–2000), with SPEI-12 leading SOI by a quarter-cycle during 1982–1989. PDO displayed a sustained negative short-period coherence over the entire record.
For the overwintering–jointing stage, Niño 3.4 maintained anti-phase multi-month signals from 1964 to 2006, while SOI showed stable positive bands from 1965–2003. TNI exhibited significant positive signals at 6.5–18 months (1964–1975), with SPEI-12 leading by a quarter-cycle from 1985–1990, followed by unstable signals after 1995. PDO alternated between positive and negative coherence across different time windows.
During the booting–maturity stage, AO displayed a significant positive band at 10–13 months (1984–1996), and Niño 3.4 showed high-amplitude but unstable resonance from 1980–1998. Meanwhile, PNA maintained consistent negative coherence at 5.5–14.5 months (1983–1999), while both SOI and TNI exhibited alternating positive and negative signals across discrete intervals.
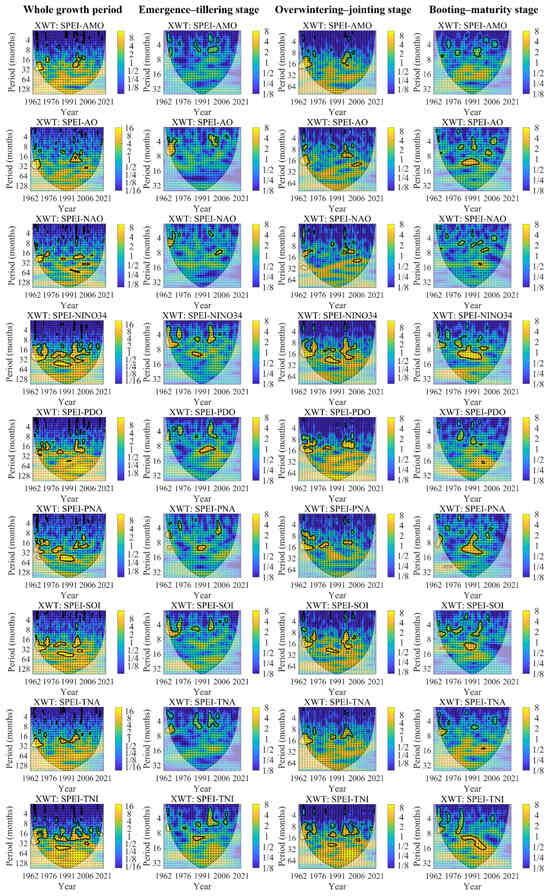
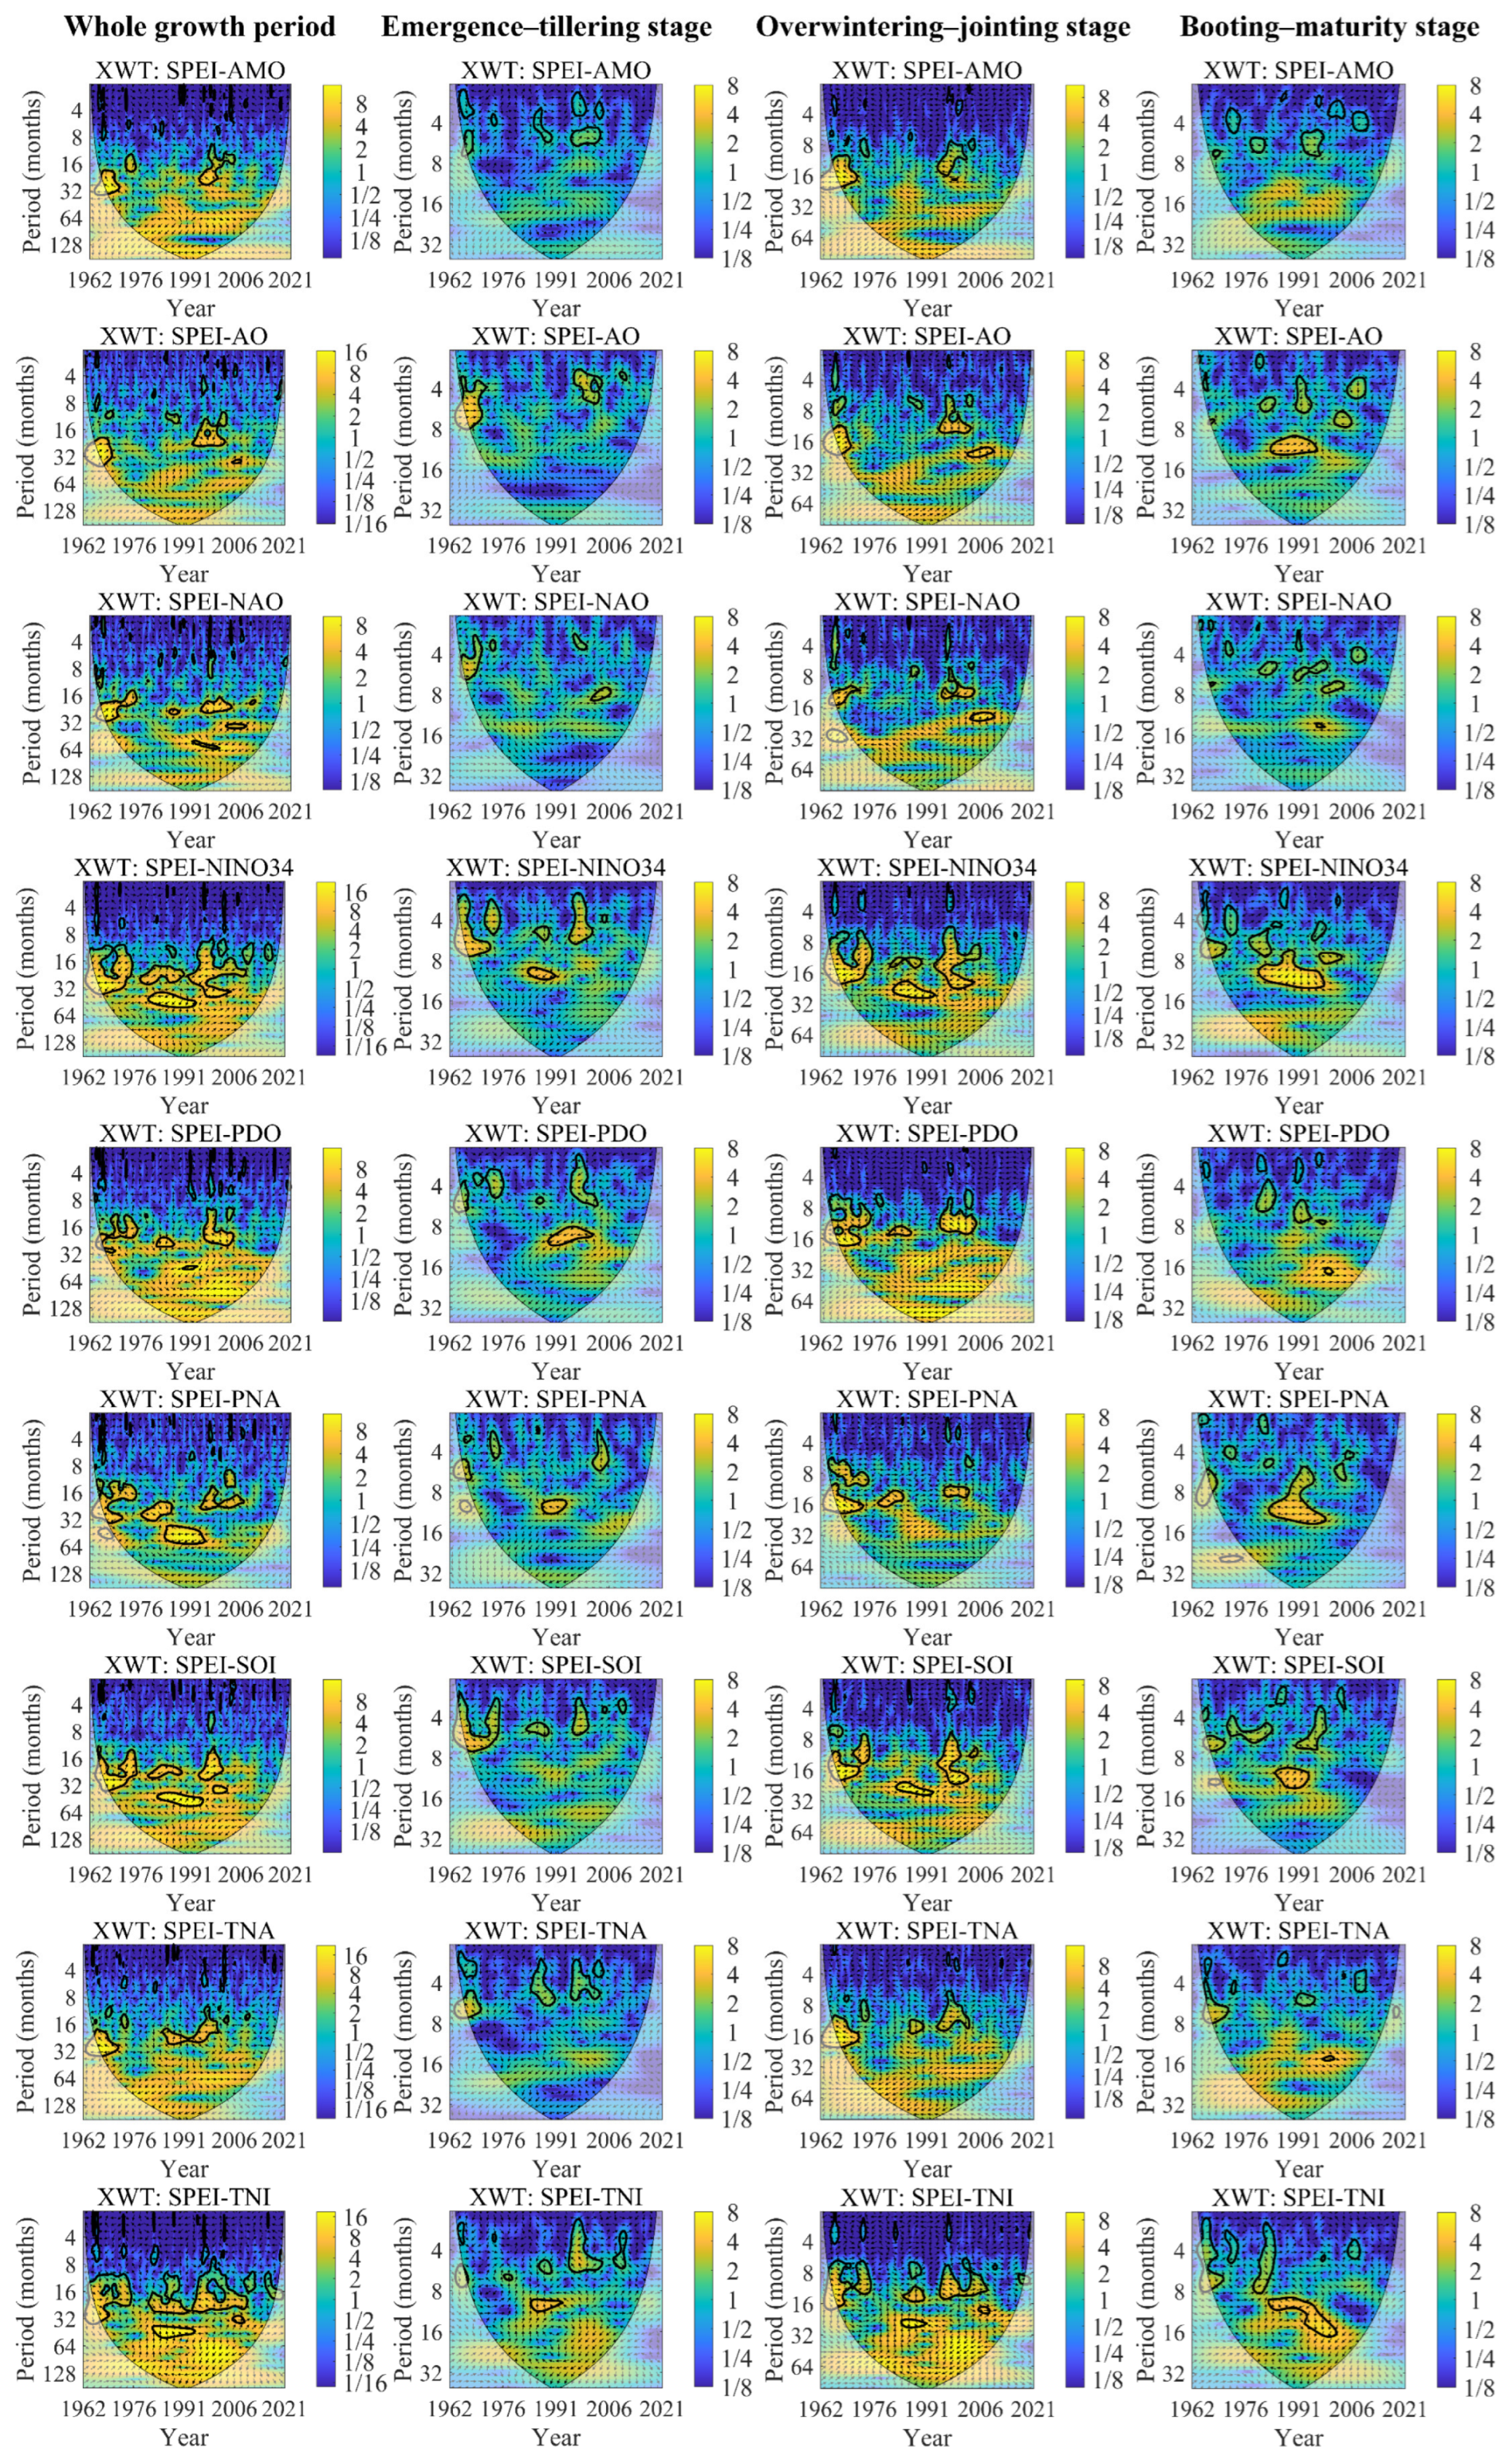
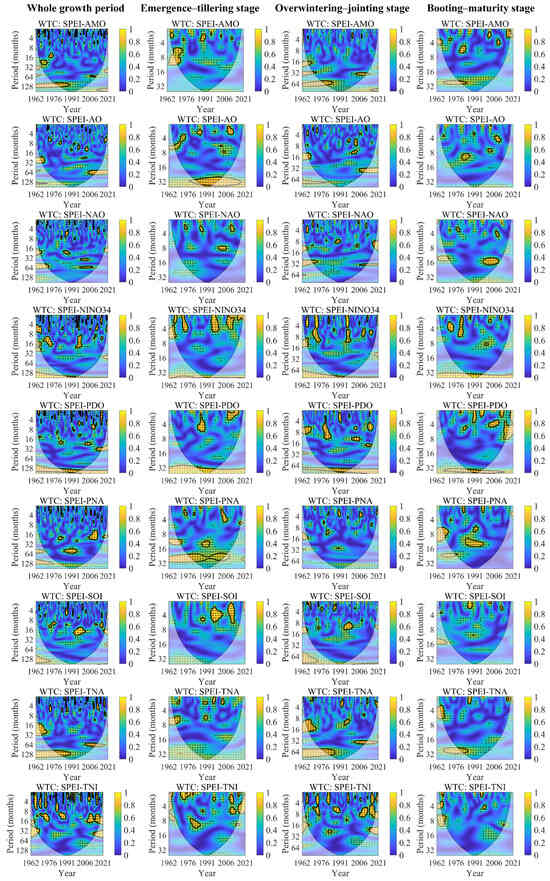
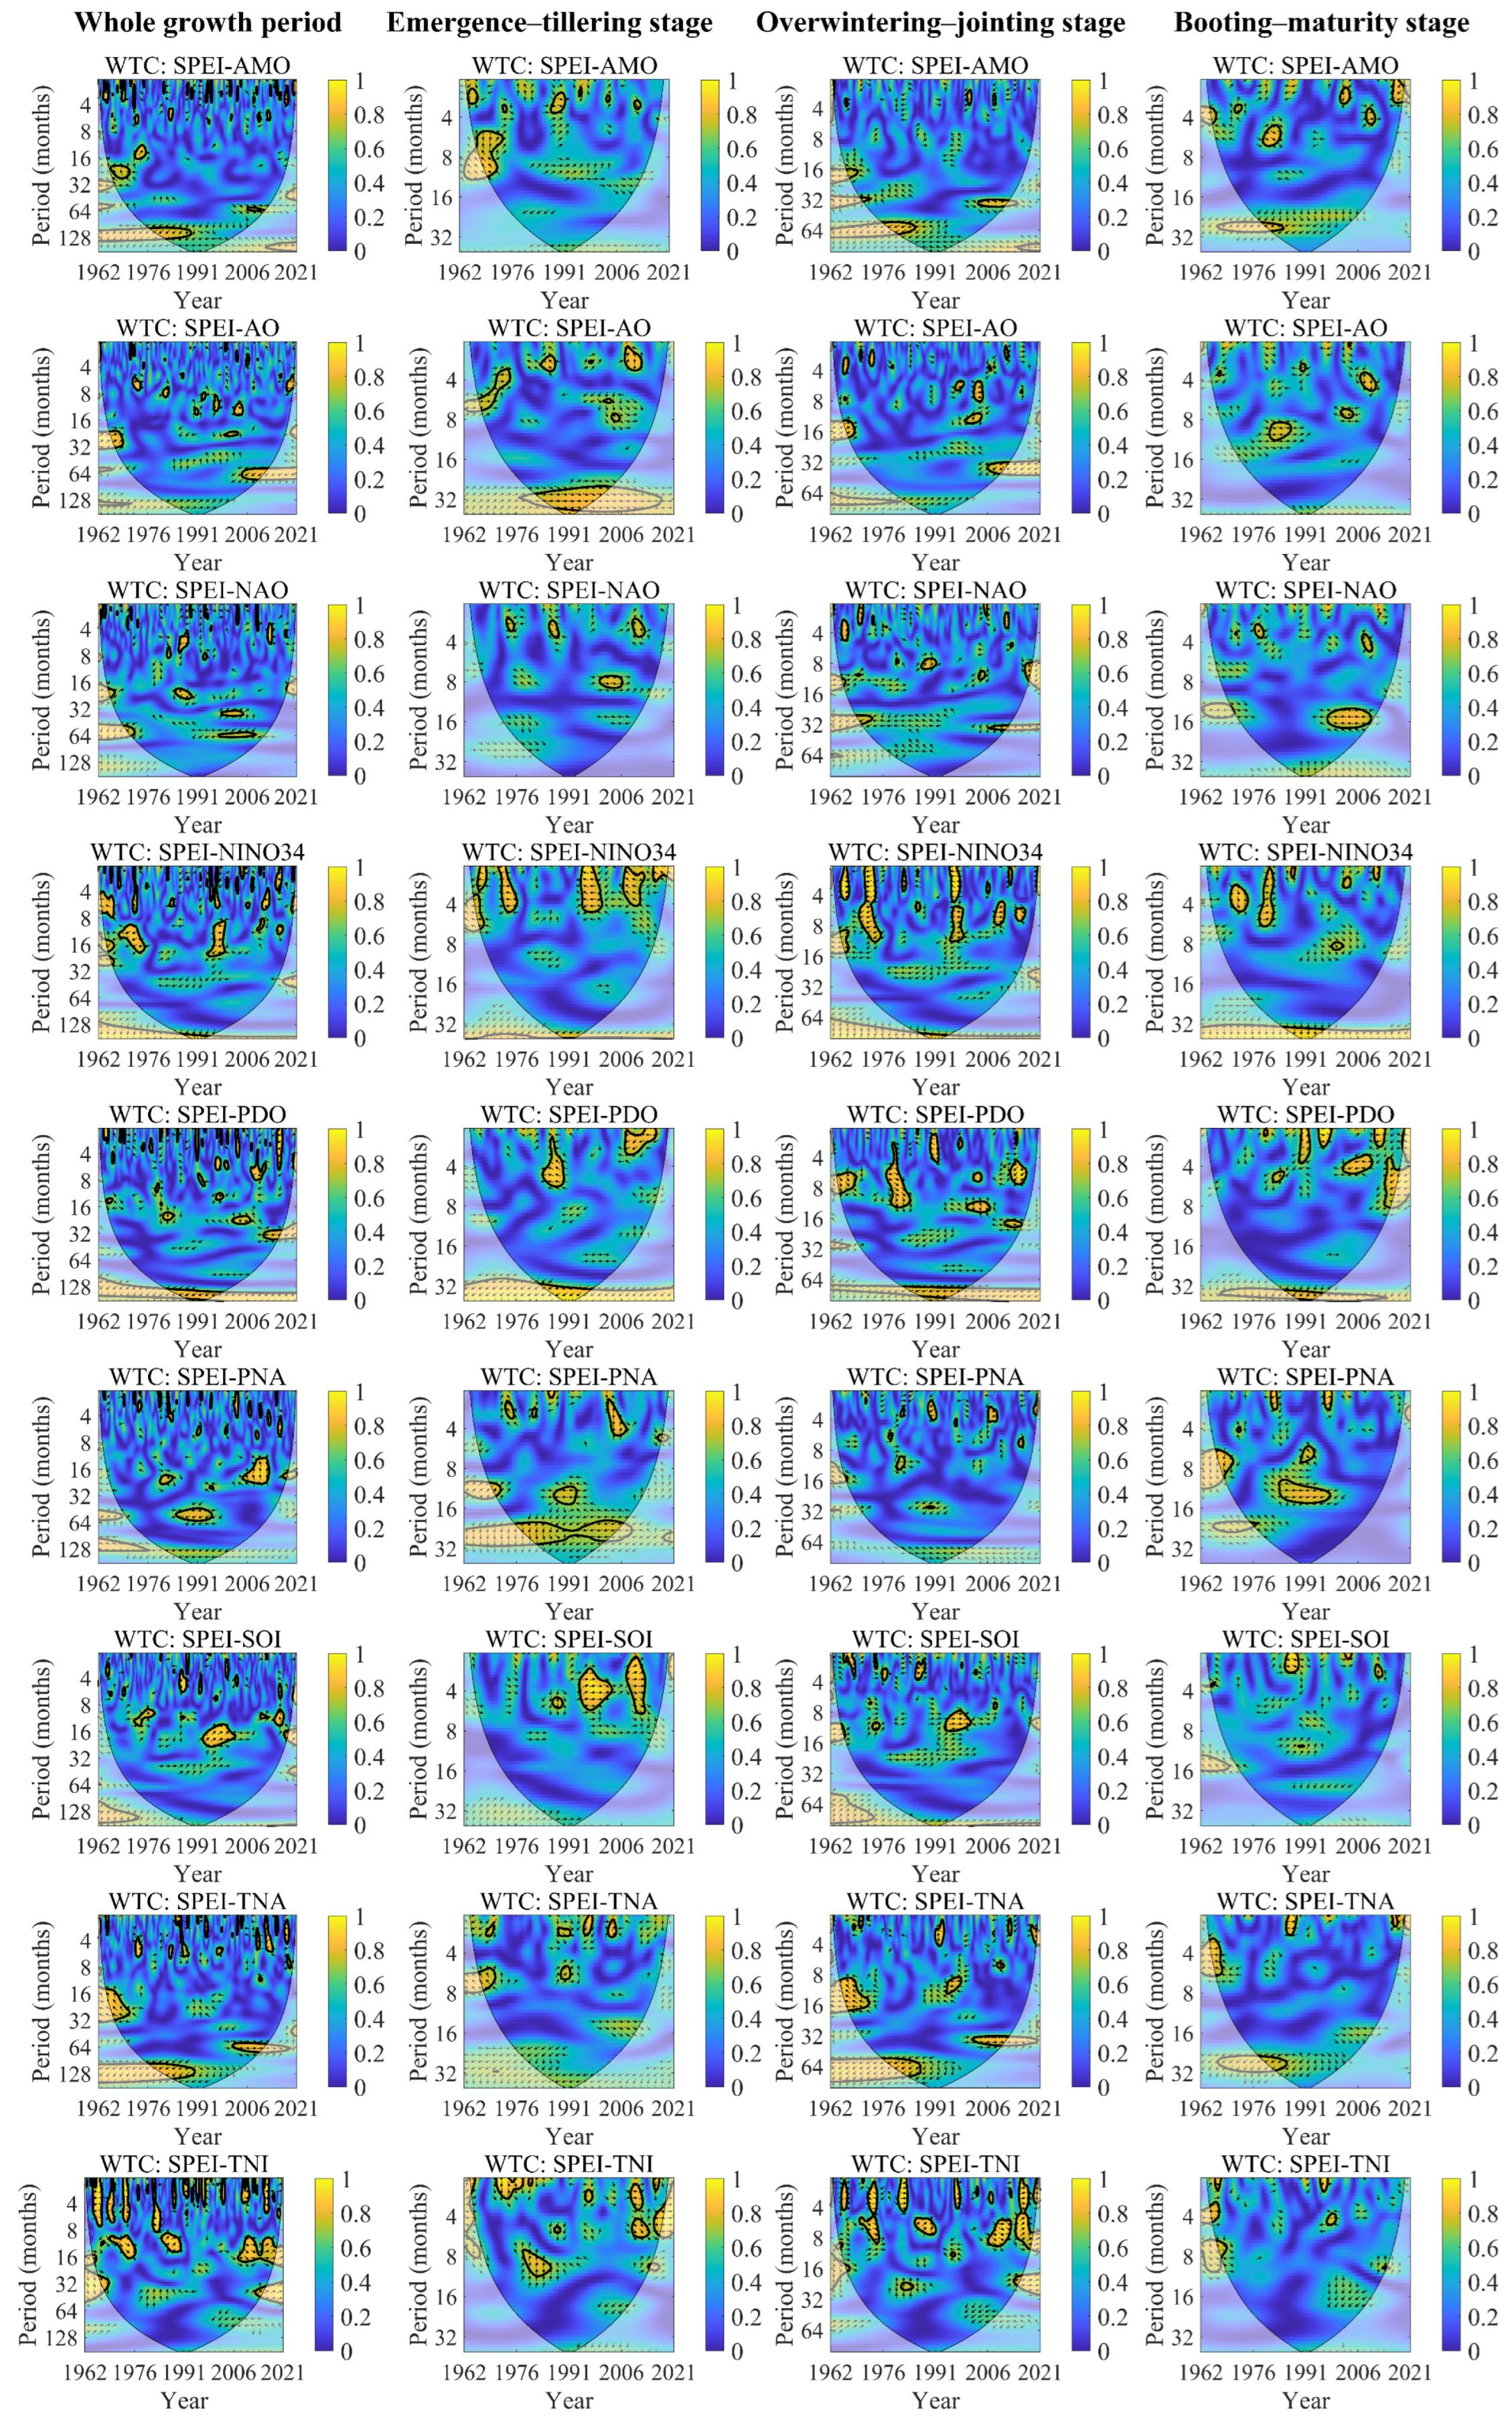
During the entire growing season, intermittent resonance cycles of 1–32 months were observed between SPEI-12 and AMO, AO, NAO, Niño 3.4, PDO, and TNA (Figure 7). A 106–130-month anti-phase band was identified for SPEI-12 and AMO from 1961–1989, though only the 1976–1989 sub-period exceeded the 95% confidence level. For AO, NAO, Niño 3.4, and TNA, significant in-phase (21.5–33.5 months, 1961–1968) and anti-phase (59–78 months, 2005–2021) cycles were detected, along with positive (16–26 months, 1961–1966) and negative (51.5–64 months, 1961–1972) resonance bands. Intermittent 1–8-month signals were found for SPEI-12 with SOI, featuring a distinct in-phase band of 14–24.2 months from 1993–2002. For SPEI-12 with TNI, significant in-phase periodicities were observed at 9.7–16.6 months (1969–1977), 9.7–14.3 months (1984–1990), and 9.7–19 months (2009–2019).
Figure 7.
Wavelet coherence spectra of SPEI-12 and large-scale atmospheric circulation indices during winter wheat growing season. The arrows indicate the phase difference between the two time series: arrows pointing right (→) denote in-phase variation (positive correlation); arrows pointing left (←) denote anti-phase variation (negative correlation); arrows pointing down (↓) indicate that SPEI-12 leads the climate index by one-quarter of the oscillation period; and arrows pointing up (↑) indicate that SPEI-12 lags the climate index by one-quarter of the oscillation period.
For the emergence-tillering stage, a 1.7–3-month resonance band was found between SPEI-12 and AMO for 1963–1966, while a 1.2–3.5-month resonance band with a significant positive phase relationship was recorded from 1986–1991. SPEI-12 and AO showed a 3.4–7.1-month resonance band with significant positive phase correlation in 1965–1973 and an extremely prominent positive resonance band roughly spanning 1976–1982, but only the 1981–2002 and 1983–1987 intervals met the 95% confidence level. Four distinct significant resonance bands within the 1–4.7-month range were observed between SPEI-12 and Niño 3.4 across the entire study period, all featuring negative phase relationships. SPEI-12 and PDO exhibited resonance bands at the 1.6–6-month (1983–1989) and 1–1.71-month (2007–2015) timescales with significant negative phase relationships, and a broad continuous negative resonance band also ran through the whole time series. For SPEI-12 and PNA, a 1.5–4.5-month resonance band appeared in 2003–2007 with SPEI-12 lagging PNA by one-quarter oscillation period, while significant negative phase resonance occurred at 12–14 months (1986–1993) and 20.5–26 months (1995–2006).
For the overwintering to jointing stage, SPEI-12 and Niño 3.4 showed resonance bands of 1–4.5 months (1964–1967), 1–12 months (1969–1974), 1–5 months (1996–1998), 9–15 months (1964–1967), 5.5–12 months (1996–1999) and 5–8 months (2008–2011) with consistent negative phase relationships. SPEI-12 and PDO displayed significant positive phase resonance at the 6–9-month (1963–1975) and 2.7–13-month (1977–1984) timescales, alongside significant negative phase bands at the 4.4–4.9-month (1990–1992), 12–14-month (2001–2007) and 4.9–7.5-month (2013–2018) timescales. A broad continuous resonance band centered at approximately 83–104 months spanned the entire period with negative phase characteristics, though only partial regions passed the significance test. Three distinct resonance bands were identified for SPEI-12 and TNA: significant negative phase correlation at 9–18-month timescale (1961–1972), long-term negative resonance of 55–83 months (1961–1989), and significant positive phase bands of 33.5–42 months (2002–2020), yet only part of the regions satisfied the confidence standard.
For the booting to maturity stage, for SPEI-12 and Niño 3.4, a 2.5–4.7-month resonance band appeared in 1970–1975 where SPEI-12 led Niño 3.4 by a one-quarter oscillation period. A 1–6-month band with significant positive phase correlation occurred from 1978–1982 and a broad continuous resonance band centered at approximate 36–44 months ran through the entire time series, with SPEI-12 leading Niño 3.4 by a one-quarter oscillation period. SPEI-12 and PDO showed significant negative phase resonance bands of 1–3.5 months (1990–1993), 3.1–4.4 months (2002–2010), 1–2.5 months (2010–2014), and 36–43 months (1986–1996), alongside a significant positive band of 1–2.5 months (1995–1998) and a negative resonance band at the 3.5–8-month (2014–2021) timescale that only partially passed the significance test.
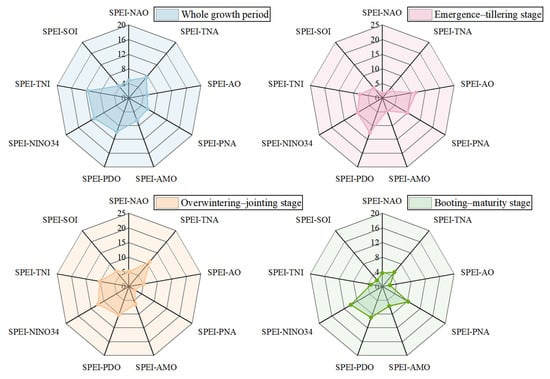
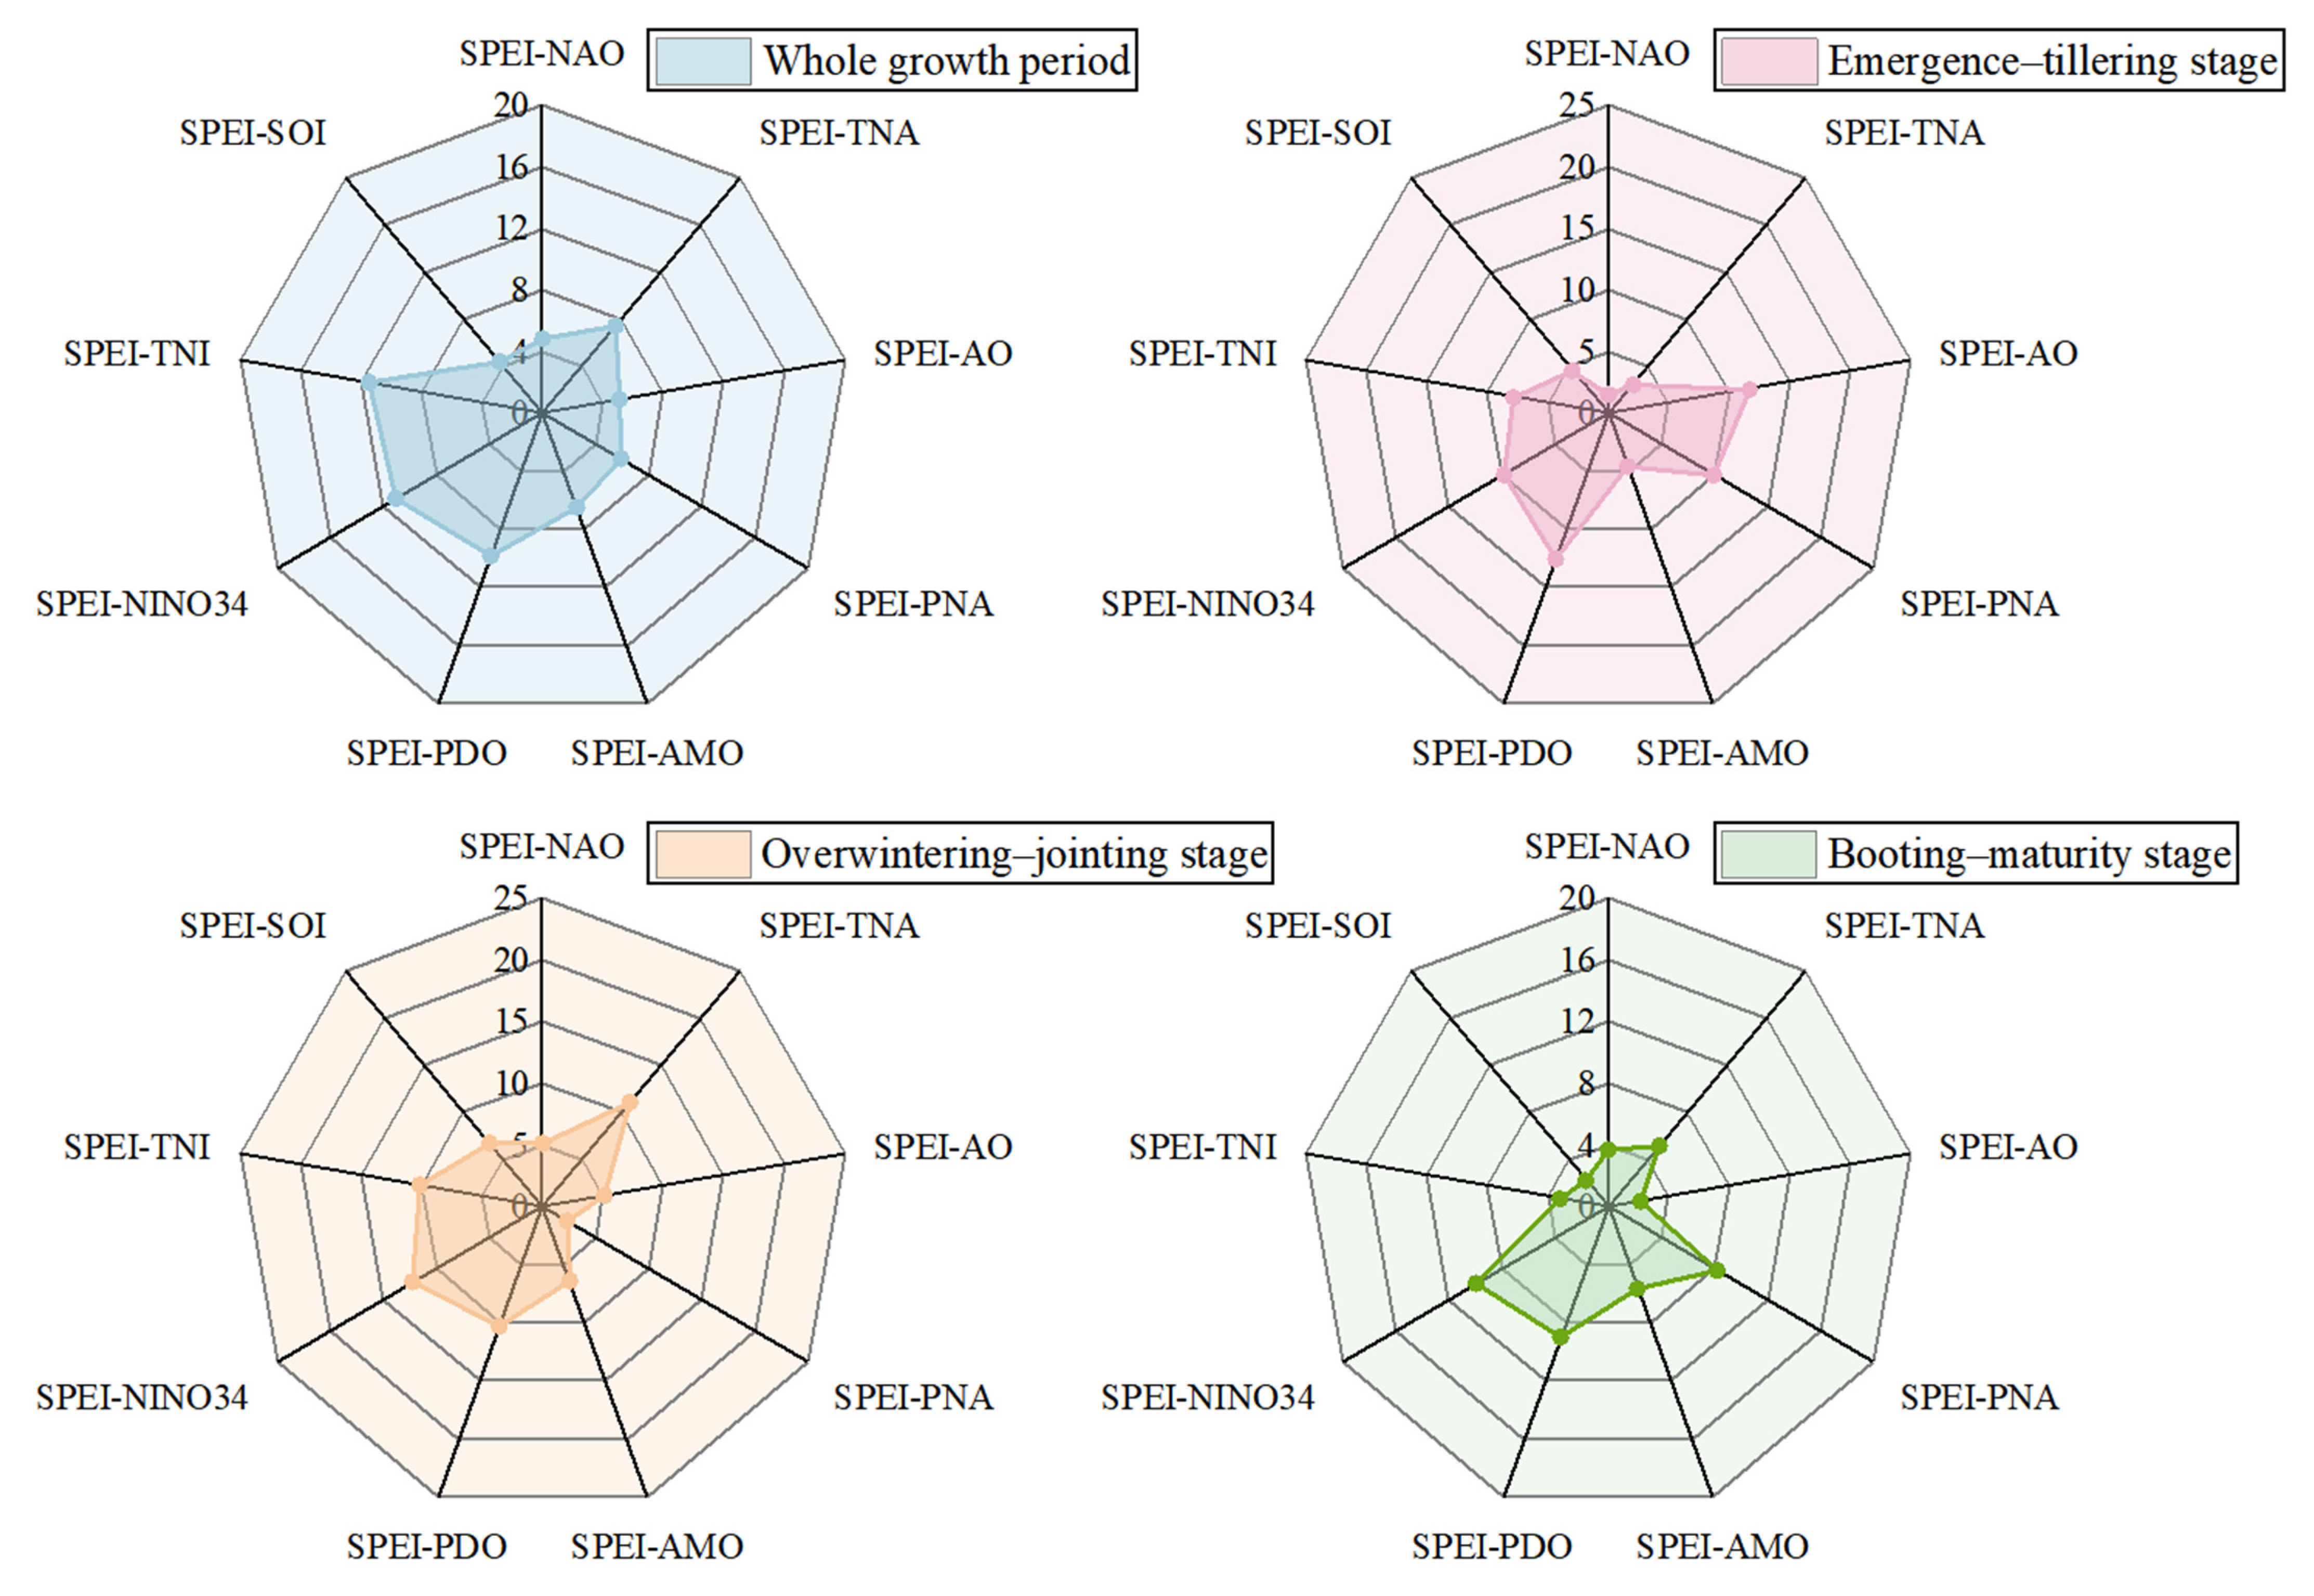
Figure 8 presents radar charts of PASC values for SPEI-12 paired with nine atmospheric circulation indices across different growth stages. During the entire growing season, the SPEI-12–TNI pair recorded the highest PASC value (11.56%), whereas the SPEI-12–SOI pair yielded the lowest (4.37%). For the emergence–tillering stage, the maximum PASC value was observed for the SPEI-12–PDO combination (12.63%), whereas the minimum occurred for SPEI-12–NAO (1.60%). During the overwintering–jointing and the booting–maturity stages, the SPEI-12–Niño 3.4 pair showed the maximum PASC values of 12.27% and 10.00%, respectively, while the lowest values were recorded for SPEI-12–PNA and SPEI-12–AO, respectively.
Figure 8.
PASC values between SPEI-12 and large–scale atmospheric circulation indices during winter wheat growing season.
4. Discussion
SPEI-12 during each winter wheat growth stage in North China from 1961 to 2021 exhibited a significant upward trend, indicating an overall regional wetting tendency, which is consistent with the regional precipitation increase [40,41] and the decreased potential evapotranspiration [42] under global warming. Spatially, about 38.10% of the stations showed significant upward trends over the entire growing season, mainly concentrated in the central North China Plain. This east wetting versus west drying pattern is likely linked to the orographic blocking of the Taihang Mountains on moisture transport and regional differences in monsoon-circulation responses [43,44]. Trend magnitudes varied across winter wheat growth stages, with the highest rate occurring during the overwintering–jointing stage (0.0092 yr−1) and the lowest during emergence–tillering (0.0082 yr−1). Similarly, the proportions of stations with significant upward trends were higher for overwintering–jointing (40.00%) and booting–maturity (36.51%) than for emergence–tillering (32.70%). These results imply that the wetting trend is relatively stronger during these two later stages, which may be favorable for yield formation, but also highlight the agricultural risks from spatially divergent drying trends in northern Hebei, northern Shanxi, and eastern Shandong. The SPEI-12 exhibited multi-scale resonant cycles with several atmospheric circulation drivers, suggesting that drought evolution is synergistically regulated by multiple systems [31]. Over the entire growing season, the highest PASC was observed between SPEI-12 and TNI, indicating that significant coherence between the two series was most extensive across the time–frequency domain. This linkage is likely modulated by variations in the position and intensity of the western North Pacific subtropical high, which in turn affect summer monsoon precipitation and winter moisture transport in the region [45]. During the emergence–tillering stage, high PASC values occurred in the relationship of SPEI-12 and PDO, consistent with the pronounced PDO signal from autumn to early winter [46,47]. By contrast, the overwintering–jointing and booting–maturity stages displayed stronger coherence with the NINO34 index. This pattern may be associated with the seasonal phase-locking of ENSO and its robust teleconnections with the East Asian winter and summer monsoons [31,48].
Nevertheless, several limitations should be acknowledged. This study relies on meteorological station data and meteorological data imputation, and the failure to account for anthropogenic interventions such as irrigation may lead to substantial biases in these estimates. Second, the winter wheat growth stage in North China exhibits obvious spatiotemporal variabilities due to the combined influence of natural conditions, anthropogenic factors, and technological advances, which inevitably increases the uncertainty of the results. Drought characteristics were evaluated on a stage-specific composite series for winter wheat rather than by identifying actual continuous drought events that span years or growth stages. Although this approach allowed comparisons of drought frequency, intensity, and duration across growth stages, the results were relative drought segments and did not strictly correspond to independent drought events. Moreover, the circulation-driver correlations identified herein are statistical in nature, and the underlying physical mechanisms warrant further validation through numerical modeling and process-based simulations [49]. Future research should integrate CMIP6 projections with crop models to comprehensively assess the mechanistic impacts of synergistic circulation changes on winter wheat production under evolving climatic conditions.
5. Conclusions
Based on multi-decadal meteorological observations from 315 stations across North China and nine large scale circulation indices, this study applied an integrated framework of Sen’s slope estimation, the Modified Mann–Kendall test, run theory, and wavelet analysis to examine the spatiotemporal evolution of SPEI-12 and its underlying drivers during the winter wheat growing season. The results indicate a significant wetting trend during the winter wheat growing season, yet the wetting trend during the emergence–tillering stage was relatively weaker than those in the later stages. SPEI-12 variation exhibited pronounced heterogeneity, with wetting prevailing in the central North China Plain and drying concentrated in northern Hebei, northern Shanxi, and eastern Shandong. Moreover, the relationship between SPEI-12 and atmospheric circulation was stage dependent. The Pacific Decadal Oscillation showed the strongest coherence during the early growth stage, while the Niño 3.4 index exhibited a stronger association during the later stages. Collectively, these findings highlight the importance of developing phenology-specific and regionally tailored adaptation measures to enhance the climatic resilience of winter wheat production in North China.
Supplementary Materials
The following supporting information can be downloaded at: https://www.mdpi.com/article/10.3390/su182010686/s1, Table S1: Historical statistical data on meteorological disaster events from the China Meteorological Disaster Yearbook.
Author Contributions
J.Q.: Conceptualization, Methodology, Writing-Review and Editing. Y.L.: Methodology, Software, Validation, Writing-Original Draft, Visualization. G.L. and Y.H.: Investigation, Data Curation. L.G.: Writing-Review and Editing, Supervision. All authors have read and agreed to the published version of the manuscript.
Funding
This research was funded by the National Natural Science Foundation of China (No. 42271124), the Henan Province Science and Technology Research Project (No. 252102321002), and the “Double First-Class” Construction Project of Henan Polytechnic University (No. GCCYJKT202521).
Institutional Review Board Statement
Not applicable.
Informed Consent Statement
Not applicable.
Data Availability Statement
The data presented in this study are available on request from the corresponding author.
Conflicts of Interest
Author Yuanyuan Luo was employed by Lingbao Gold Group Company Limited. The remaining authors declare that the research was conducted in the absence of any commercial or financial relationships that could be construed as potential conflicts of interest.
References
- Lesk, C.; Rowhani, P.; Ramankutty, N. Influence of extreme weather disasters on global crop production. Nature 2016, 529, 84–87. [Google Scholar] [CrossRef] [Scilit] [PubMed]
- Kraklow, V.A.; Paff, K.; Comeau, D.; Solander, K.; Pitts, T.R.; Price, S.F.; Xu, C.G. Impact of drought on global food security by 2050. Nat. Commun. 2026, 17, 1099. [Google Scholar] [CrossRef] [Scilit] [PubMed]
- Kim, W.; Iizumi, T.; Nishimori, M. Global patterns of crop production losses associated with droughts from 1983 to 2009. J. Appl. Meteorol. Climatol. 2019, 58, 1233–1244. [Google Scholar] [CrossRef] [Scilit]
- Barnabás, B.; Jäger, K.; Fehér, A. The effect of drought and heat stress on reproductive processes in cereals. Plant Cell Environ. 2008, 31, 11–38. [Google Scholar] [CrossRef] [Scilit] [PubMed]
- Malko, M.M.; Zhang, Y.; Ge, J.; Yi, W.; Khanzada, A.; Xiao, W.; Li, Q.; Samo, A.; Cai, J.; Dong, J. Dynamic hormone flux and gene-metabolite integration influence drought tolerance and tiller plasticity under drought conditions in wheat. Plant Physiol. Biochem. 2025, 229, 110698. [Google Scholar] [CrossRef] [Scilit] [PubMed]
- Ali, M.F.; Li, P.; Ma, L.; Feng, C.; Gu, S.; Lin, X.; Wang, D. Investigating the Impact of Drought During Returning Green and Jointing Stages on Different Tillers Position of Winter Wheat. J. Plant Growth Regul. 2025, 44, 5542–5560. [Google Scholar] [CrossRef] [Scilit]
- Berki, Z.; Kiss, T.; Bányai, J.; Cseh, A.; Balla, K.; Karsai, I. Effect of drought stress during critical developmental stages on morphological and grain yield-related traits in winter barley (Hordeum vulgare L.). PLoS ONE 2025, 20, e0329391. [Google Scholar] [CrossRef] [Scilit] [PubMed]
- Saeidi, M.; Abdoli, M. Effect of Drought Stress during Grain Filling on Yield and Its Components, Gas Exchange Variables, and Some Physiological Traits of Wheat Cultivars. J. Agric. Sci. Technol. 2015, 17, 885–898. [Google Scholar]
- Wang, Y.; Li, B.; Luo, M.; Guo, H.; Meng, X.; Cao, Z. Daily-scale gridded analysis of spatiotemporal characteristics in agricultural drought events across winter wheat growth stages in the Huang–Huai–Hai Plain, China. Agric. Water Manag. 2026, 327, 110274. [Google Scholar] [CrossRef] [Scilit]
- Li, Q.; Liu, Y.; Luo, L.; Wang, Y.; Wang, Q.; Ma, M. Spatiotemporal drought characteristics during growing seasons of the winter wheat and summer maize in the North China Plain. Front. Earth Sci. 2024, 11, 1358987. [Google Scholar] [CrossRef] [Scilit]
- Kulkarni, S.; Sawada, Y.; Bayissa, Y.; Wardlow, B. Global assessment of socio-economic drought events at the subnational scale: A comparative analysis of combined versus single drought indicators. Hydrol. Earth Syst. Sci. 2025, 29, 4341–4370. [Google Scholar] [CrossRef] [Scilit]
- Faiz, M.A.; Zhang, L.; Liu, D.; Ma, N.; Li, M.; Zhou, Z.; Baig, F.; Li, T.; Cui, S. Revisiting the composite drought index for improving drought monitoring. J. Hydrol. 2025, 652, 132707. [Google Scholar] [CrossRef] [Scilit]
- Ghazi, B.; Salehi, H.; Przybylak, R.; Pospieszyńska, A. Assessment of drought conditions under climate change scenarios in Central Europe (Poland) using the standardized precipitation index (SPI). Clim. Serv. 2025, 39, 100591. [Google Scholar] [CrossRef] [Scilit]
- Gobena, A.K.; Gan, T.Y. Assessment of trends and possible climate change impacts on summer moisture availability in western canada based on metrics of the palmer drought severity index. J. Clim. 2013, 26, 4583–4595. [Google Scholar] [CrossRef] [Scilit]
- Musei, S.K.; Nyaga, J.M.; Dubow, A.Z. SPEI-based spatial and temporal evaluation of drought in Somalia. J. Arid Environ. 2021, 184, 104296. [Google Scholar] [CrossRef] [Scilit]
- Wang, Y.; Ren, F.; Zhao, Y.; Li, Y. Comparison of Two Drought Indices in Studying Regional Meteorological Drought Events in China. J. Meteorol. Res. 2017, 31, 187–195. [Google Scholar] [CrossRef] [Scilit]
- Chen, S.; Zhang, L.; Liu, X.; Guo, M.; She, D. The Use of SPEI and TVDI to Assess Temporal-Spatial Variations in Drought Conditions in the Middle and Lower Reaches of the Yangtze River Basin, China. Adv. Meteorol. 2018, 2018, 9362041. [Google Scholar] [CrossRef] [Scilit]
- Peng, Y.; Li, Q.; Jiang, P.; Yao, N.; Tao, H.; Aihemaiti, M. Spatiotemporal characteristics of drought in the Tarim River Basin from 2000 to 2022 based on the SPEI. Clim. Serv. 2025, 40, 100615. [Google Scholar] [CrossRef] [Scilit]
- Vicente-Serrano, S.M.; Beguería, S.; López-Moreno, J.I. A multiscalar drought index sensitive to global warming: The Standardized Precipitation Evapotranspiration Index. J. Clim. 2010, 23, 1696–1718. [Google Scholar] [CrossRef] [Scilit]
- Bharghavi, K.; Reddy, T.L.; Kapa, H.; Rajesh, P.; Sushmitha, H.; Reddy, K.K. Evaluating climate change impact on drought: A comprehensive review of drought indices and future projections. Nat. Hazards 2025, 121, 20819–20854. [Google Scholar] [CrossRef] [Scilit]
- Gond, S.; Gupta, N.; Patel, J.; Dikshit, P.K.S. Spatiotemporal evaluation of drought characteristics based on standard drought indices at various timescales over Uttar Pradesh, India. Environ. Monit. Assess. 2023, 195, 439. [Google Scholar] [CrossRef] [Scilit] [PubMed]
- Mwinjuma, M.; Wang, R.; Mtupili, M.; Twaha, M. Comparisons of SPI and SPEI in capturing drought dynamics: A Global assessment across arid and humid regions. Atmos. Res. 2026, 329, 108475. [Google Scholar] [CrossRef] [Scilit]
- Xue, J.; Zhao, Q.; Zhang, Y.; Chen, Y.; Wang, X.; Dou, X.; Li, X. Three-dimensional Copula-based Assessment of Meteorological Drought Characteristics and Driving Mechanisms in Haihe River Basin, China. Chin. Geogr. Sci. 2025, 35, 545–563. [Google Scholar] [CrossRef] [Scilit]
- Si, Z.; Li, P.; Gao, Y.; Li, J.; Yan, R.; Zhao, X.; Xiang, F.; Li, Y.; Li, X. Dominant Regions of Wheat Research on the Production Pattern and Fertilization Status in Chinas. J. Triticeae Crops 2024, 44, 230–241. (In Chinese) [Google Scholar] [CrossRef]
- Dong, Q.; Chen, X.; Chen, J.; Zhang, C.; Liu, L.; Cao, X.; Zang, Y.; Zhu, X.; Cui, X. Mapping winter wheat in north china using sentinel 2a/b data: A method based on phenology-time weighted dynamic time warping. Remote Sens. 2020, 12, 1274. [Google Scholar] [CrossRef] [Scilit]
- Liu, X.; Pan, Y.; Zhu, X.; Yang, T.; Bai, J.; Sun, Z. Drought evolution and its impact on the crop yield in the North China Plain. J. Hydrol. 2018, 564, 984–996. [Google Scholar] [CrossRef] [Scilit]
- Zhao, A.; Xiang, K.; Zhang, A.; Zhang, X. Spatial-temporal evolution of meteorological and groundwater droughts and their relationship in the North China Plain. J. Hydrol. 2022, 610, 127903. [Google Scholar] [CrossRef] [Scilit]
- Wu, J.; Cheng, G.; Wang, N.; Shen, H.; Ma, X. Spatiotemporal Patterns of Multiscale Drought and Its Impact on Winter Wheat Yield over North China Plain. Agronomy 2022, 12, 1209. [Google Scholar] [CrossRef] [Scilit]
- Lu, F.; Ma, C.; Zhu, C.; Lu, H.; Zhang, X.; Huang, K.; Guo, T.; Li, K.; Li, L.; Li, B.; et al. Variability of East Asian summer monsoon precipitation during the Holocene and possible forcing mechanisms. Clim. Dyn. 2018, 52, 969–989. [Google Scholar] [CrossRef] [Scilit]
- Du, Y.; Zhang, J.; Zhao, S.; Chen, H. Impact of the eastward shift in the negative-phase NAO on extreme drought over northern China in summmer. J. Geophys. Res. Atmos. 2020, 125, e2019JD032019. [Google Scholar] [CrossRef] [Scilit]
- Xue, J.; Zhao, Q.; Sang, G.; Li, Q.; Wang, Q.; Song, Q.; Li, X. Unraveling the seasonal variability of meteorological droughts: Multiscale insights into the coupling with atmospheric circulation factors. Theor. Appl. Climatol. 2025, 156, 551. [Google Scholar] [CrossRef] [Scilit]
- Bharghavi, K.; Reddy, T.L.; Sushmitha, H.; Kapa, H.; Rajesh, P.; Reddy, K.K. Global drought variability under a warming climate: SPEI based assessment of El Niño–Southern Oscillation and IOD teleconnections across global drylands (1961–2020). Theor. Appl. Climatol. 2026, 157, 557. [Google Scholar] [CrossRef] [Scilit]
- Wang, D.; Du, S.; Jia, W. Multiscale variability of China’s historical flood/drought index and precipitation teleconnections with ENSO using wavelet analyses. Theor. Appl. Climatol. 2022, 149, 1583–1597. [Google Scholar] [CrossRef] [Scilit]
- Gao, Y.; Zhang, L.; Yang, W. Study on Temporal and Spatial Variation of Drought in North China and Its Influence on Vegetation NDVI. Chin. J. Agrometeorol. 2024, 45, 374–389. (In Chinese) [Google Scholar] [CrossRef]
- Yang, J.; Mei, X.; Liu, Q.; Yan, C.; He, W.; Liu, E.; Liu, S. Variations of winter wheat growth stages under climate changes in northern China. Chin. J. Plant Ecol. 2011, 35, 623–631. (In Chinese) [Google Scholar] [CrossRef] [Scilit]
- Wang, S.; Chen, J.; Shen, M.; Shi, T.; Liu, L.; Zhang, L.; Dong, Q.; Wang, C. Characterizing Spatiotemporal Patterns of Winter Wheat Phenology from 1981 to 2016 in North China by Improving Phenology Estimation. Remote Sens. 2022, 14, 4930. [Google Scholar] [CrossRef] [Scilit]
- Yao, N.; Li, L.; Feng, P.; Feng, H.; Liu, D.; Liu, Y.; Jiang, K.; Hu, X.; Li, Y. Projections of drought characteristics in China based on a standardized precipitation and evapotranspiration index and multiple GCMs. Sci. Total Environ. 2020, 704, 135245. [Google Scholar] [CrossRef] [Scilit] [PubMed]
- Cazelles, B.; Chavez, M.; Berteaux, D.; Ménard, F.; Vik, J.O.; Jenouvrier, S.; Stenseth, N.C. Wavelet analysis of ecological time series. Oecologia 2008, 156, 287–304. [Google Scholar] [CrossRef] [Scilit] [PubMed]
- Wang, F.; Lai, H.; Li, Y.; Feng, K.; Tian, Q.; Zhang, Z.; Di, D.; Yang, H. Terrestrial ecological drought dynamics and its response to atmospheric circulation factors in the North China Plain. Atmos. Res. 2023, 294, 106944. [Google Scholar] [CrossRef] [Scilit]
- Wang, Q.; Zhai, P.; Zhang, Q. Regional Patterns of Climate Change and Extreme Events in China since 1961. J. Meteorol. Res. 2026, 39, 688–697. [Google Scholar] [CrossRef] [Scilit]
- Chen, F.; Xie, T.; Yang, Y.; Chen, S.; Chen, F.; Huang, W.; Chen, J. Discussion of the “warming and wetting” trend and its future variation in the drylands of Northwest China under global warming. Sci. China Earth Sci. 2023, 66, 1241–1257. [Google Scholar] [CrossRef] [Scilit]
- Han, J.; Wang, J.; Zhao, Y.; Wang, Q.; Zhang, B.; Li, H.; Zhai, J. Spatio-temporal variation of potential evapotranspiration and climatic drivers in the Jing-Jin-Ji region, North China. Agric. For. Meteorol. 2018, 256, 75–83. [Google Scholar] [CrossRef] [Scilit]
- Li, M.; Sun, J.; Li, F.; Wu, C.; Xia, R.; Bao, X.; Yin, J.; Liang, X. Precipitation Evolution from Plain to Mountains during the July 2023 Extreme Heavy Rainfall Event in North China. J. Meteorol. Res. 2024, 38, 635–651. [Google Scholar] [CrossRef] [Scilit]
- Chen, S.; Yang, B.; Huang, A.; Zhang, Y. Terrain and urban impacts on summer extreme precipitation over Henan, China: A synoptic and simulation analysis. Atmos. Res. 2025, 320, 108033. [Google Scholar] [CrossRef] [Scilit]
- Gao, H.; Jiang, W.; Li, W. Changed relationships between the East Asian summer monsoon circulations and the summer rainfall in eastern China. J. Meteorol. Res. 2014, 28, 1075–1084. [Google Scholar] [CrossRef] [Scilit]
- Ma, Z. The interdecadal trend and shift of dry/wet over the central part of North China and their relationship to the Pacific Decadal Oscillation (PDO). Chin. Sci. Bull. 2007, 52, 2130–2139. [Google Scholar] [CrossRef] [Scilit]
- Wang, M.; Gu, Q.; Jia, X.; Ge, J. An assessment of the impact of Pacific Decadal Oscillation on autumn droughts in North China based on the Palmer drought severity index. Int. J. Climatol. 2019, 39, 5338–5350. [Google Scholar] [CrossRef] [Scilit]
- Lv, A.; Fan, L.; Zhang, W. Impact of ENSO Events on Droughts in China. Atmosphere 2022, 13, 1764. [Google Scholar] [CrossRef] [Scilit]
- Jin, H.; Li, X.; Zhang, Y.; He, L.; Zhang, G.; Ma, W. Prospective Evolution of Meteorological Drought in the Haihe River Basin and Its Connection with Large-Scale Atmospheric Circulations Using CMIP6 Multimodel Ensemble. J. Geophys. Res. Atmos. 2023, 128, e2023JD038954. [Google Scholar] [CrossRef] [Scilit]
Disclaimer/Publisher’s Note: The statements, opinions and data contained in all publications are solely those of the individual author(s) and contributor(s) and not of MDPI and/or the editor(s). MDPI and/or the editor(s) disclaim responsibility for any injury to people or property resulting from any ideas, methods, instructions or products referred to in the content. |
© 2026 by the authors. Licensee MDPI, Basel, Switzerland. This article is an open access article distributed under the terms and conditions of the Creative Commons Attribution (CC BY) license.