


Abstract
The selection of restoration areas in large river basins is a technical and socioeconomic challenge due to the environmental and socioeconomic complexities involved, particularly in data-scarce tropical basins. To address this challenge, multi-criteria models (MCMs) and multi-criteria decision analyses (MCDAs), coupled with GIS, are used by managers and decision-makers as integrated and objective prioritization alternatives. In the present study, an MCM was developed integrating hydrological, environmental (runoff, sediment yield, and degraded lands), and socioeconomic (stakeholder prioritization) variables to screen priority restoration areas in the Urucuia Basin, a large watershed in the Brazilian savanna, leading to the final selection of 2000 hectares for the Urucuia’s Proaguas Project. Runoff and erosion were estimated using the calibrated InVEST Seasonal Water Yield (SWY) and Sediment Delivery Ratio (SDR) models, respectively. Integrated with a Geographic Information System (GIS) and supported by off-the-shelf watershed data, the MCM identified 31,455 hectares of priority areas, spanning all basin landscapes. These areas were validated by ground-truthing and by a corresponding confusion matrix, as well as by a validation workshop with local stakeholders. The prioritization map had an accuracy of 90% and was consistent with local stakeholder knowledge and preferences. The method could be applied to similar basins after appropriate calibration and validation.
1. Introduction
Tropical watersheds are fundamental landscape units that integrate climatic, hydrological, ecological, and socioeconomic processes across multiple spatial scales [1]. However, the accelerated degradation of these systems—driven by land-use change, deforestation, agricultural expansion, urbanization, and climate change—compromises essential ecosystem services, including water regulation [2], sediment retention [3], nutrient cycling [4], and flood control [5], reducing watershed sustainability.
In tropical watersheds, the technical, financial, and human resources available for environmental restoration are limited relative to the extent of degraded areas [6]. Consequently, restoring all degraded sites within a watershed is often technically, ecologically, and economically unfeasible. Therefore, prioritizing restoration areas has become a major challenge in watershed management, restoration ecology, and landscape planning [7].
The prioritization process seeks to maximize the environmental return of restoration efforts by achieving the greatest possible benefit per unit of invested resource. This process requires balancing multiple and often competing objectives [8], including erosion and sediment control [9,10,11], biodiversity conservation, habitat connectivity [12], carbon sequestration, and climate change adaptation [13,14].
Several conceptual and methodological approaches have been developed to address this multi-objective and spatial prioritization problem. Among the most widely used are spatially explicit conservation planning and trade-off analysis frameworks [15], spatial multi-criteria decision analysis (MCDA) with or without the Analytic Hierarchy Process (AHP) [16], benefit–cost analysis [17], multi-criteria models [18], production frontier analysis [19], and process-based hydrological modeling coupled with optimization algorithms [20].
Multi-criteria decision analysis (MCDA) is a structured approach for supporting decisions by identifying relevant criteria, measuring the performance of alternatives against given criteria and constraints, and aggregating this information to compare or rank alternatives [21]. On the other hand, multi-criteria models (MCMs) are mathematical or computational models that represent, integrate, or concomitantly evaluate multiple criteria to characterize alternatives or scenarios or map key spatial units [18]. Both tools have been used for decades to support decision-making processes, with mixed results [22].
An extensive review and comparison of dozens of MCDA and MCM studies indicated that, although they utilize different approaches and techniques, the recommended course of action did not vary significantly with the model utilized [23]. In the past, prioritization approaches commonly relied on weighted linear combinations of biophysical variables, whereas recent frameworks integrate ecological, hydrological, socioeconomic, and feasibility criteria within a single spatial decision-support system [7].
More recently, high-resolution remote-sensing products and cloud platforms have substantially improved the spatial and temporal representation of land cover, land degradation, fire occurrence, hydrological processes, and landscape connectivity [24], enhancing prioritization analyses.
Another important advance was the incorporation of multiple restoration benefits, such as biodiversity conservation, carbon sequestration, water regulation, erosion control, and connectivity, while simultaneously considering restoration costs and opportunity costs [25,26]. Recent prioritization models also incorporate natural regeneration potential, ecological connectivity, climate refugia, hydrological impacts, and restoration feasibility, moving beyond simple degradation-based identification [7].
There has been increasing convergence toward integrated approaches that explicitly consider landscape spatial configuration and the concept of strategic restoration, defined as the selection of interventions and locations that generate greater environmental benefits than restoring the same area randomly or in less strategic locations [8].
Participatory weighting of criteria and scenario analysis are increasingly used to incorporate stakeholder preferences and assess uncertainty associated with criterion weights [7]. A recent systematic review identified 59 spatial criteria grouped into nine major categories, illustrating both the increasing sophistication and the methodological diversity of restoration-prioritization models [27].
Although GIS-based MCM/MCDAs provide a systematic framework for identifying priority areas, the resulting spatial rankings remain model-based representations dependent on the selected criteria, spatial datasets, normalization procedures, weighting assumptions [28,29], and parochialism [30]. Therefore, ground-truthing of representative priority sites is important for assessing whether modeled priority classes correspond to actual field conditions, increasing the reliability of the resulting prioritization for in situ management applications [31].
Criteria weighting is a controversial issue within MCDA and MCM modeling. Although it provides an explicit representation of the relative importance/trade-offs among criteria [32], criteria weights create a false impression of objectivity and stability, particularly when the weights are based on subjective judgments [33].
Considering these aspects, the objective of this study was to develop a multi-criteria prioritization model to screen restoration areas in the Urucuia River Basin, optimizing the hydrological services and providing a sufficiently large pool of candidate sites to support a further selection process, leading to the 2000-hectare restoration goal.
2. Materials and Methods
2.1. Study Area
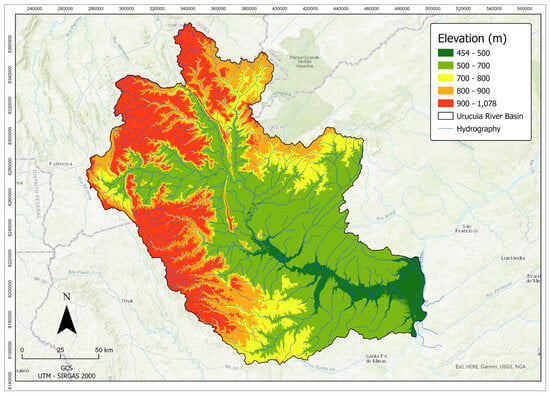
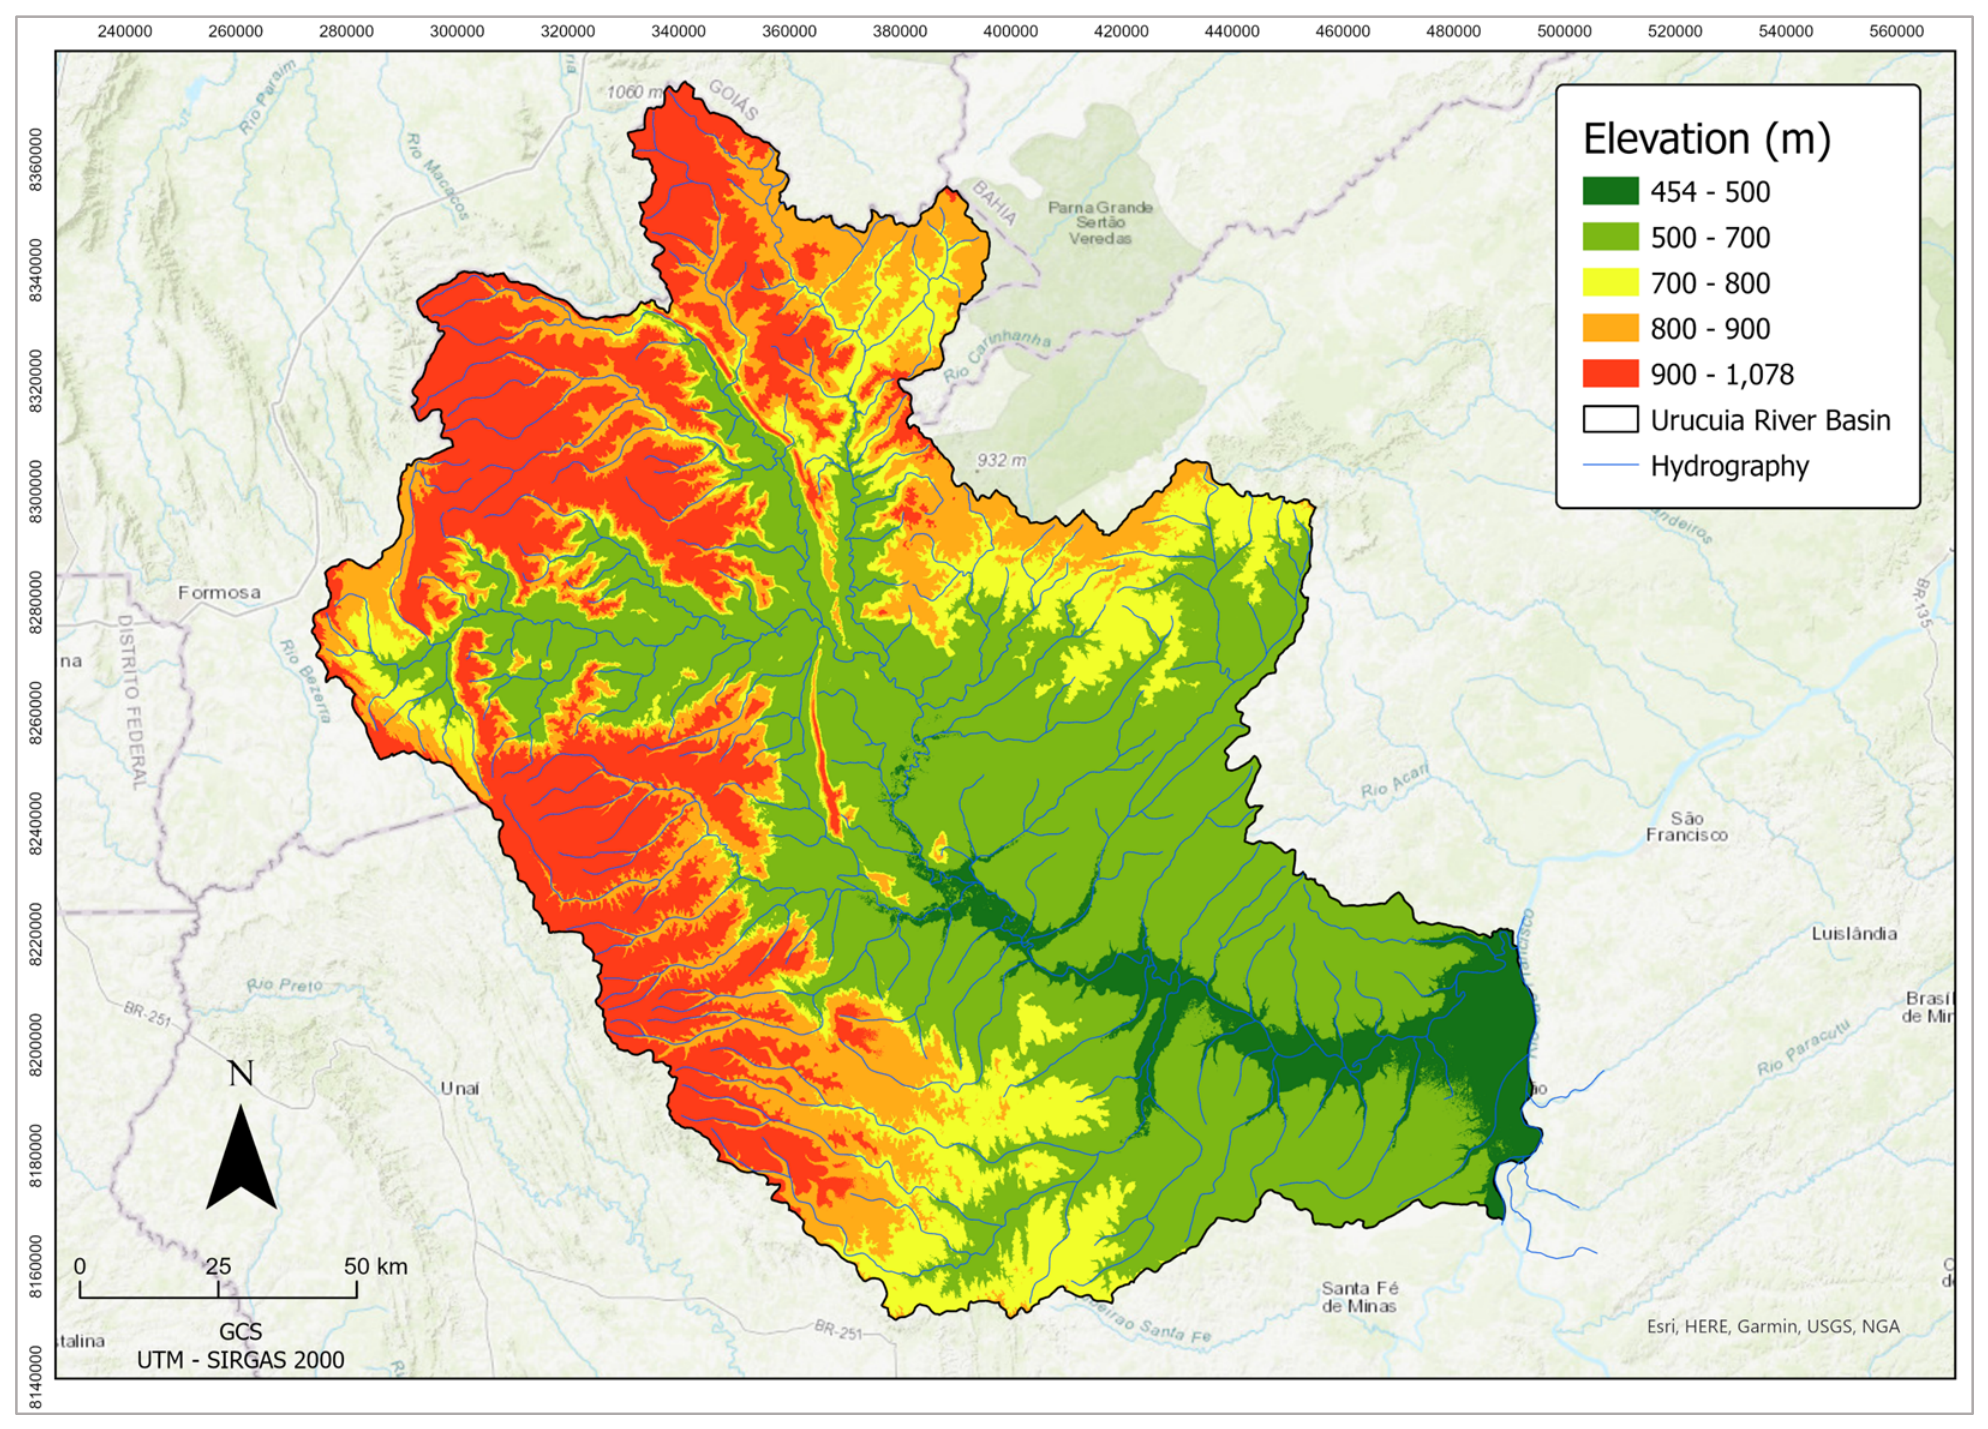
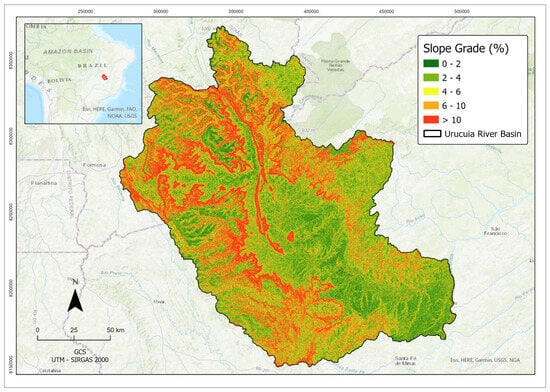
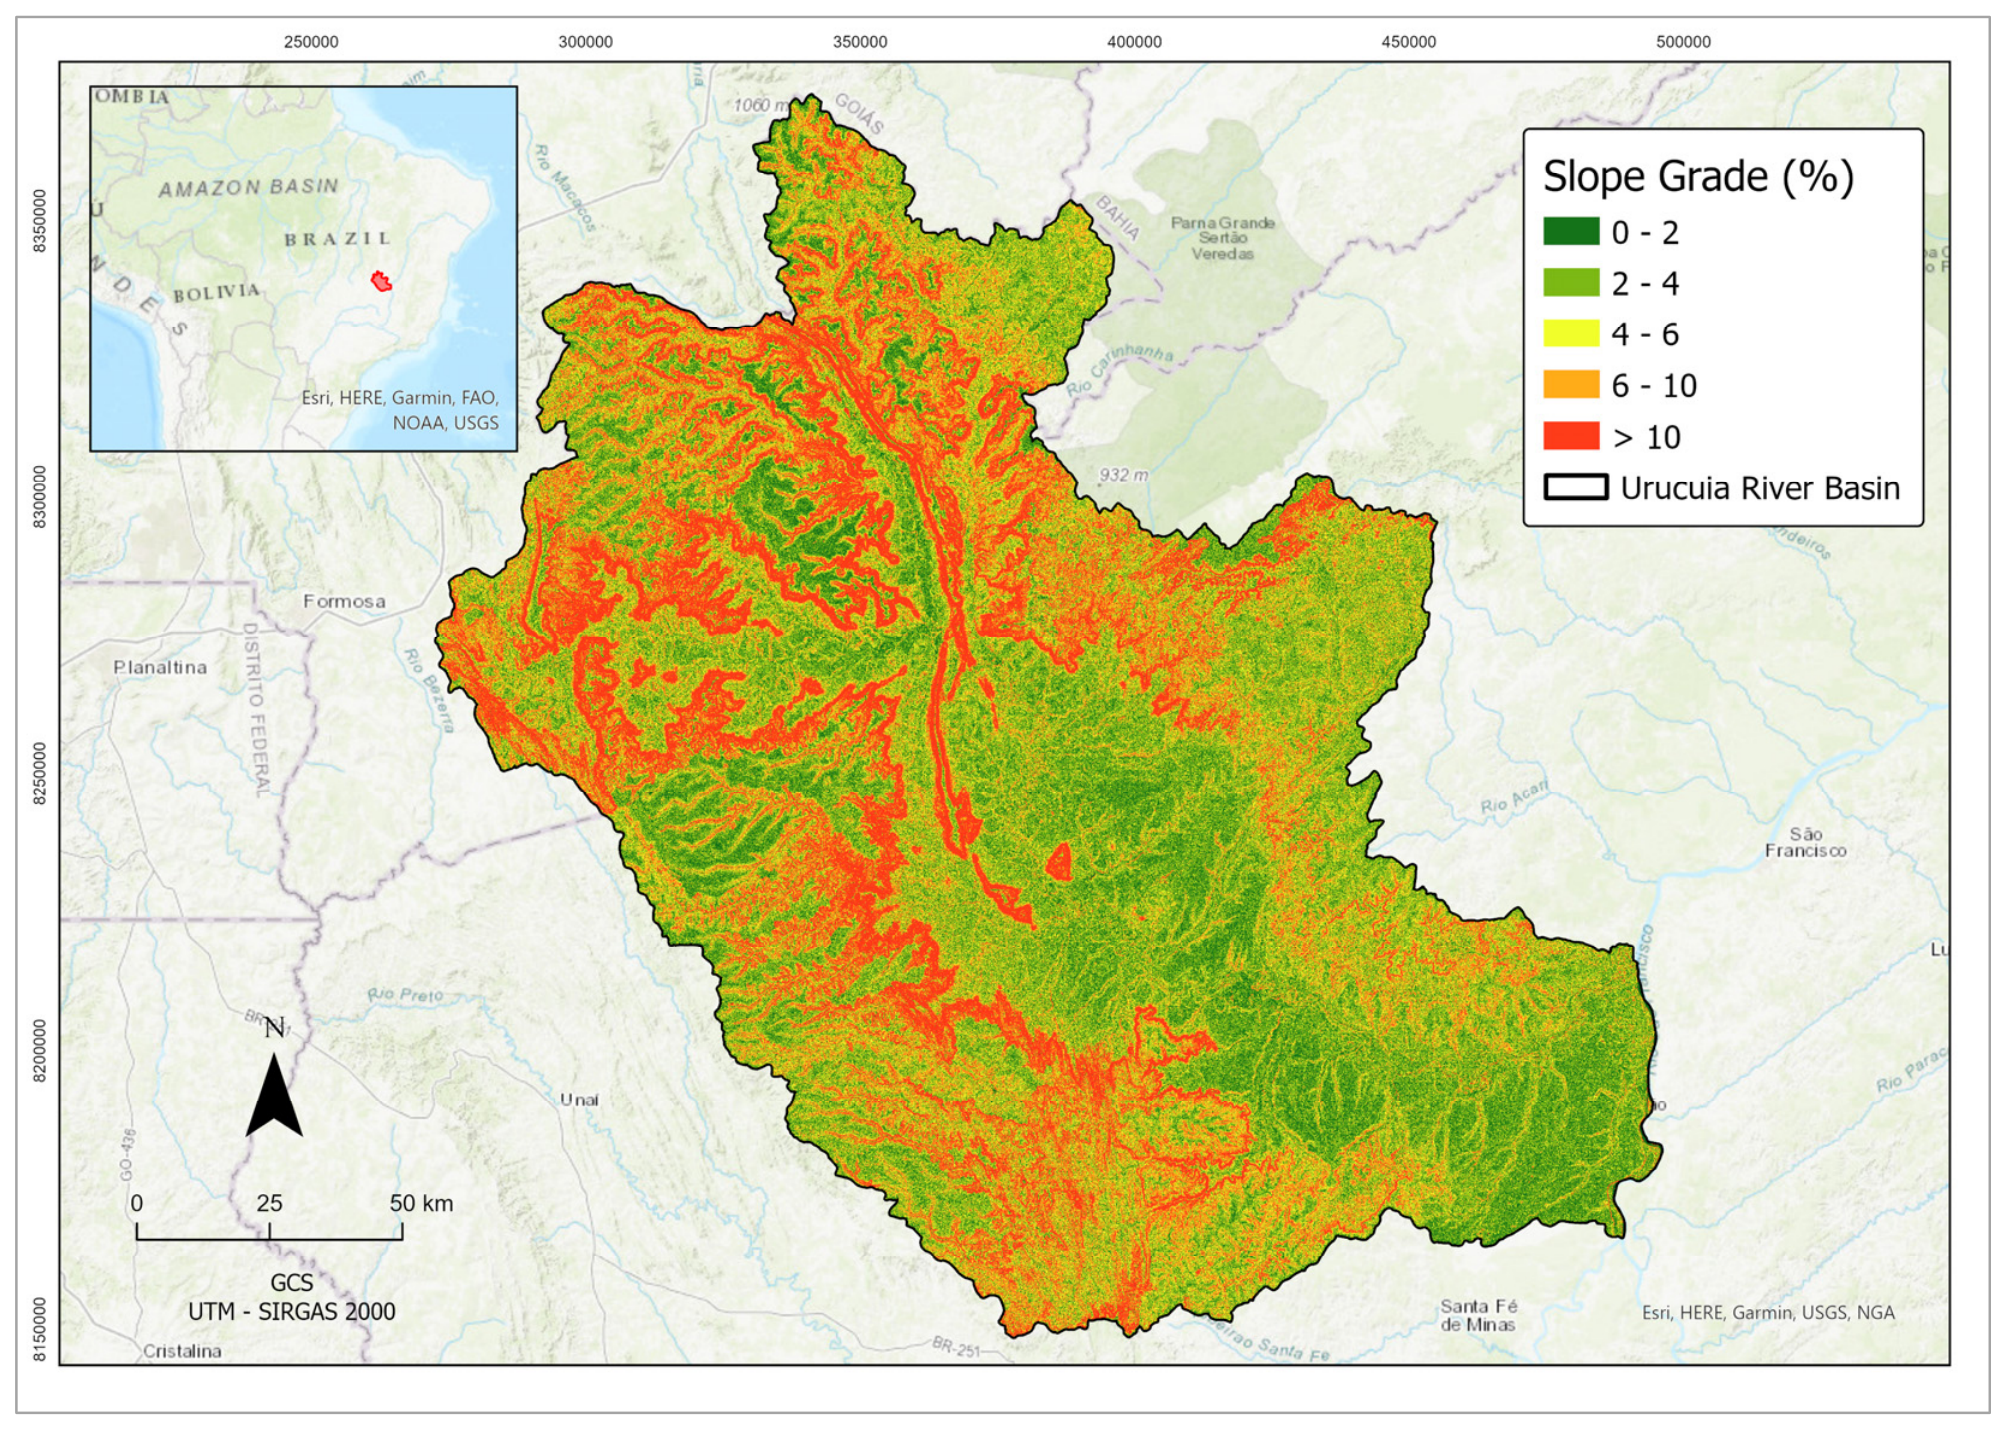
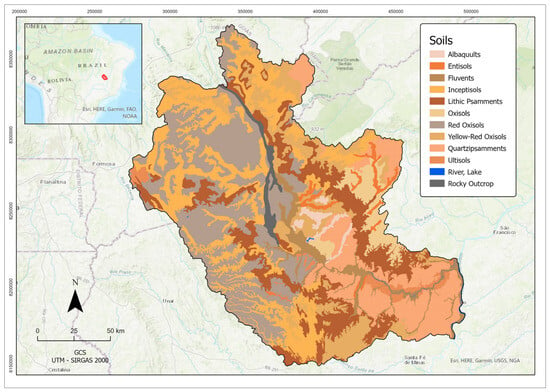
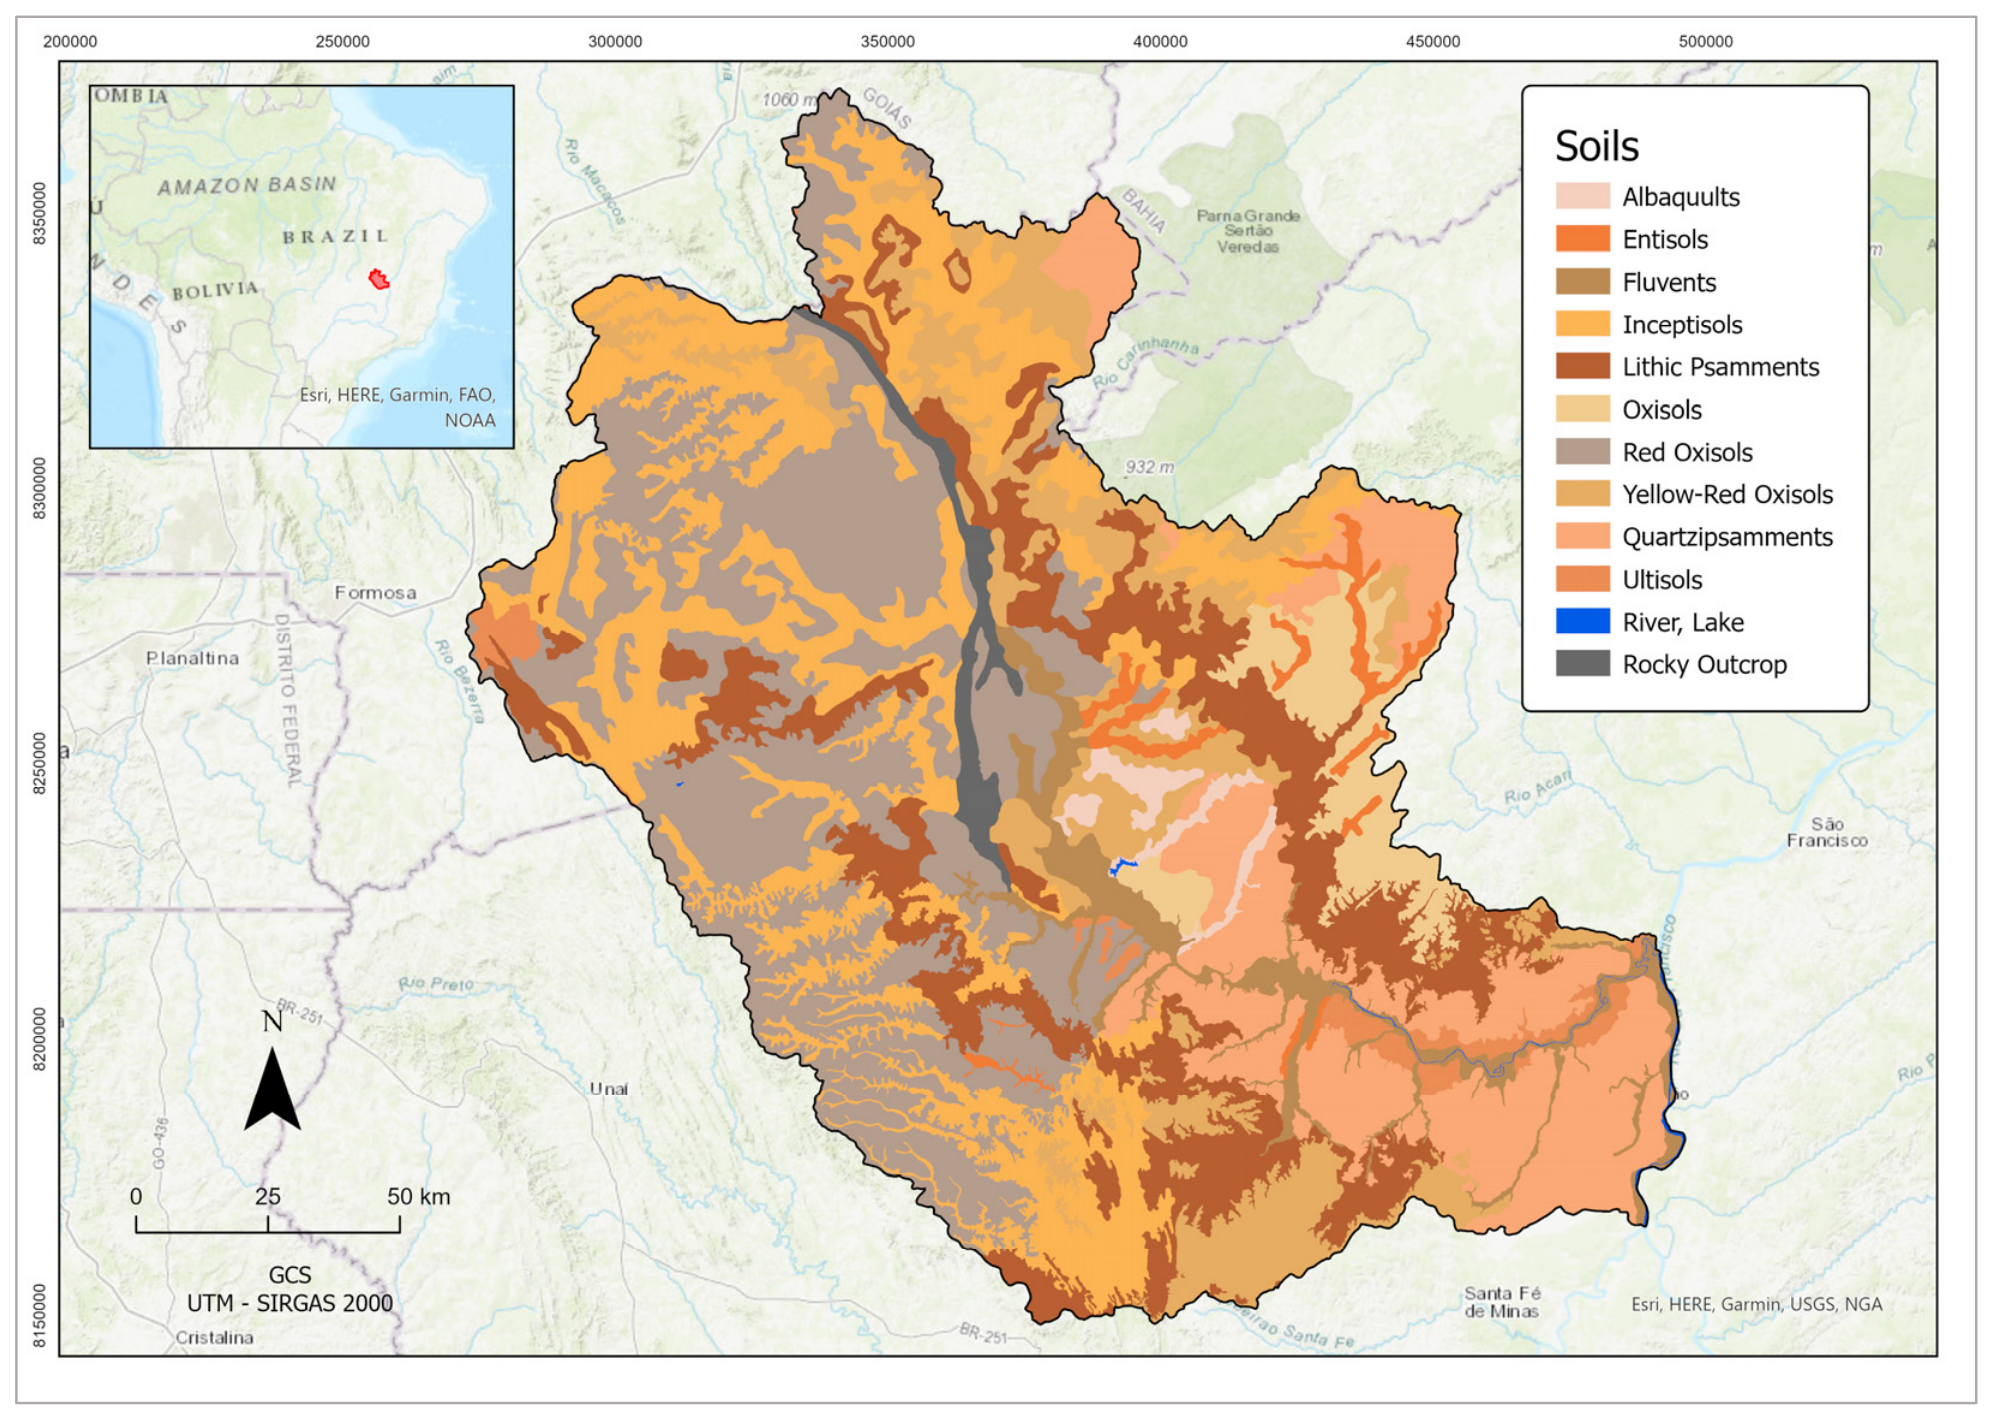
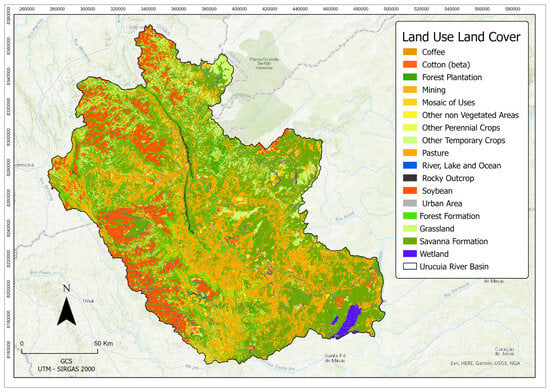
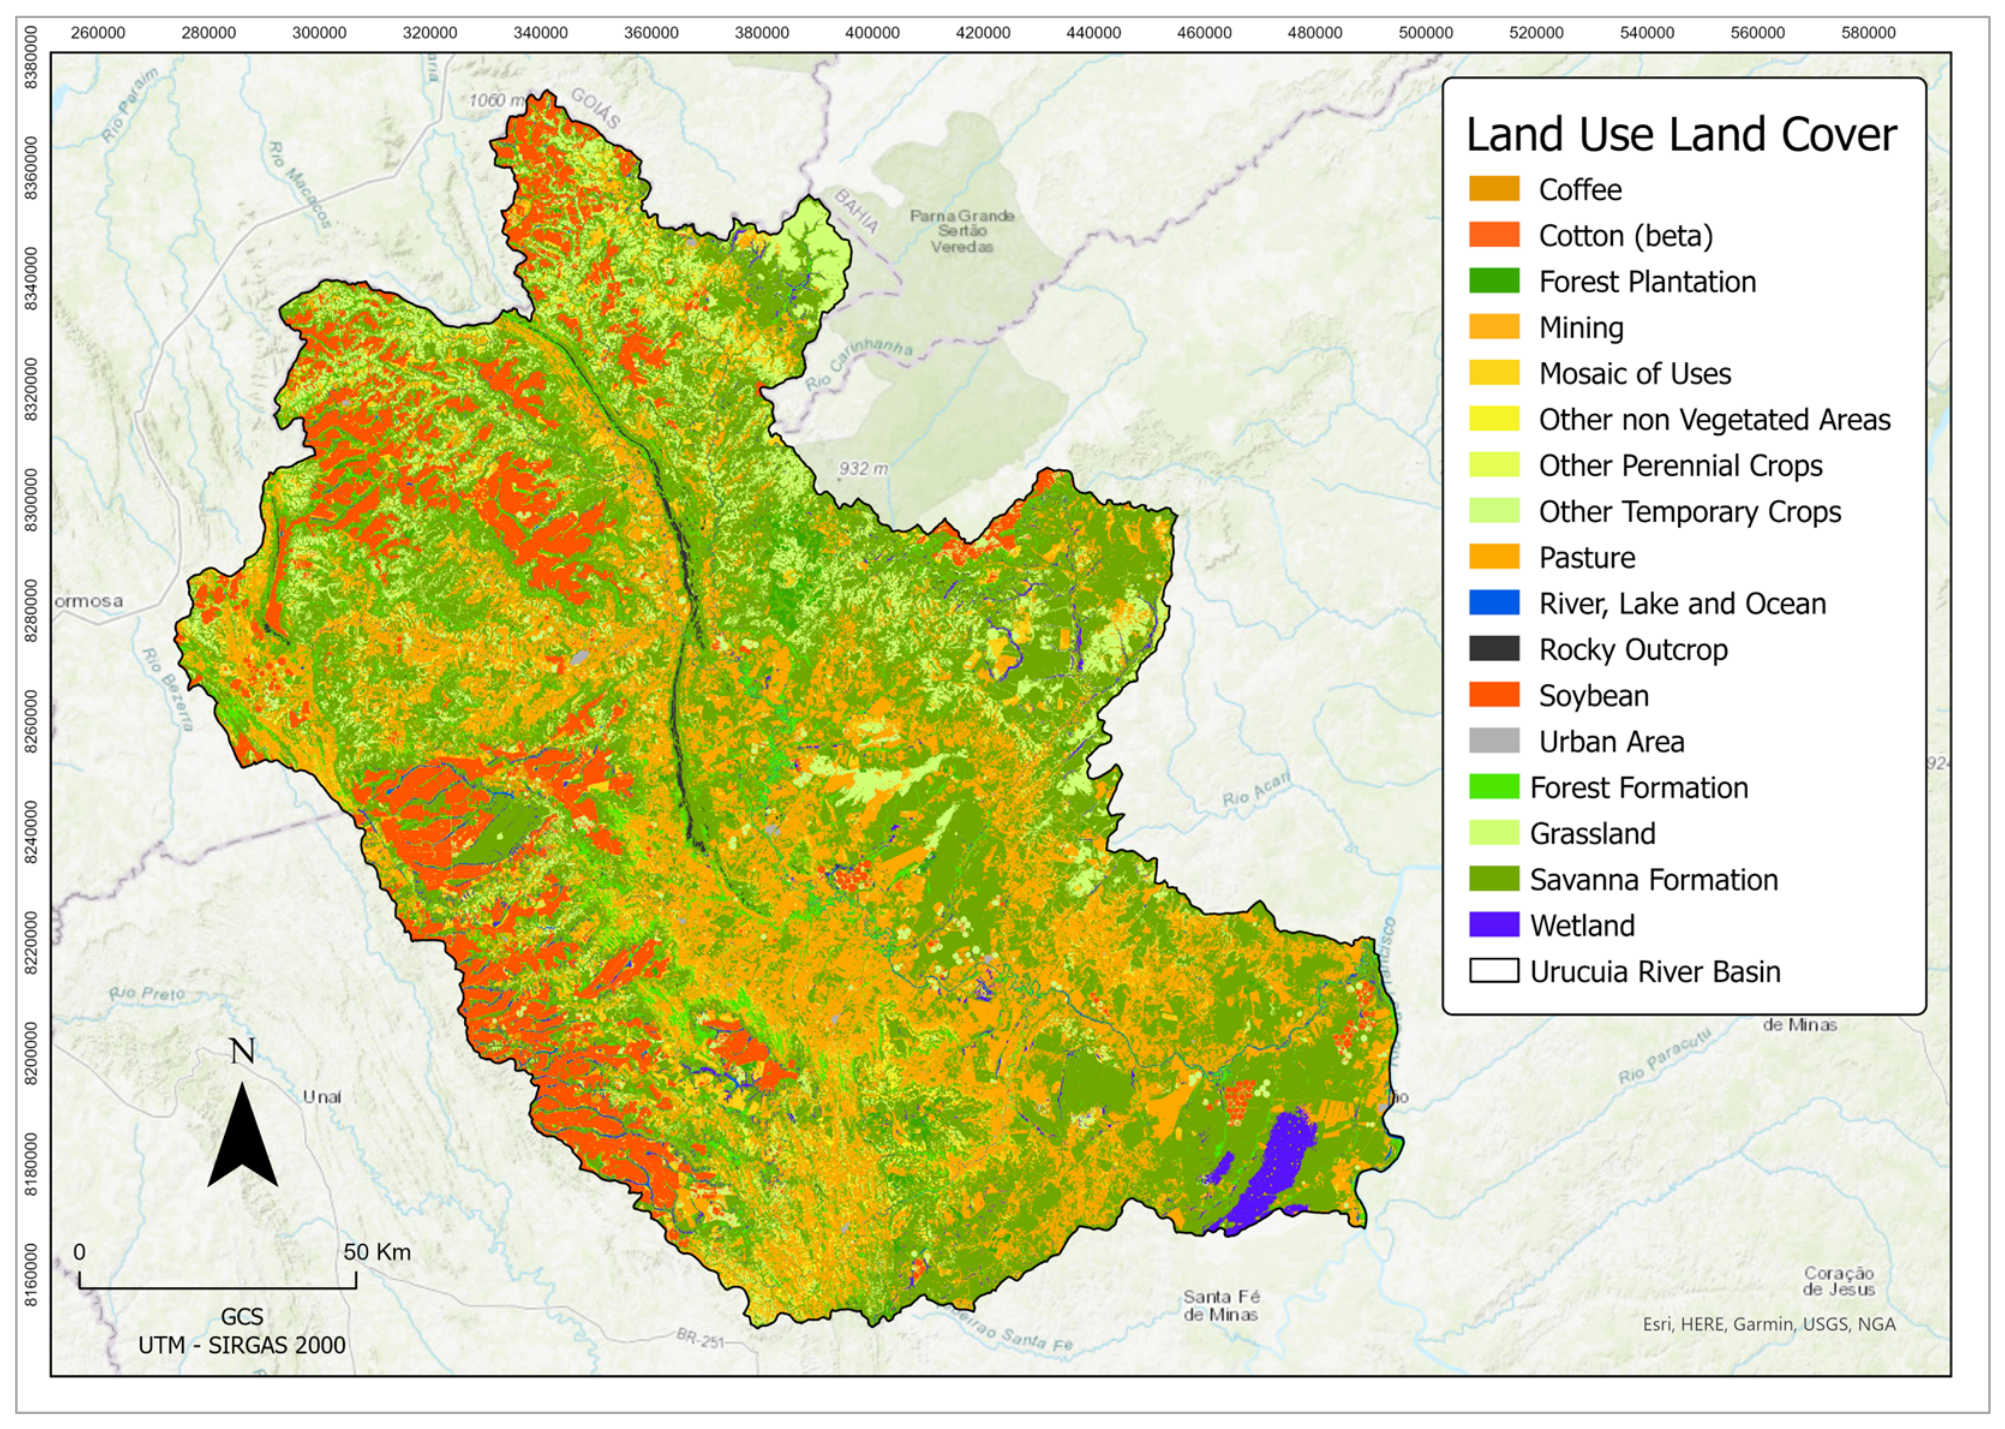
The Urucuia River Basin, the focus of this study, comprises 14 municipalities, spanning an area of 25,835 km2, previously delineated by the National Water Agency [34]. Basin topography is gently sloping (Figure 1 and Figure 2) and the dominant soils are Orthox, Ochrepts, and Psamments [35] (Figure 3). The basin’s natural vegetation, covering 35.1% of the basin area, comprises different variations in tropical open savannah, with the remaining land uses consisting of pastureland and rainfed and irrigated agriculture (Figure 4). No missing data existed in the land-use map. Basin mean annual precipitation is 1050 mm and mean annual streamflow at the basin outlet is 250 m3/s [36].
Figure 1.
Urucuia Basin altimetry. Map resolution: 30 × 30 m. Source: prepared by the authors, using ArcGISPro3.6.0 (ESRI, Redlands, CA, USA).
Figure 2.
Slope grade map of the Urucuia Basin. Map resolution: 30 × 30 m. Source: prepared by the authors, using ArcGISPro3.6.0 (ESRI, Redlands, CA, USA).
Figure 3.
Urucuia Basin soils. Map resolution: 30 × 30 m. Source: prepared by the authors, using ArcGISPro3.6.0 (ESRI, CA, USA).
Figure 4.
Urucuia Basin land use and cover. Map resolution: 30 × 30 m. Source: prepared by the authors, using ArcGISPro3.6.0 (ESRI, Redlands, CA, USA).
In the last 40 years, the Urucuia River Basin has experienced significant environmental impacts due to deforestation and inadequate land use and management [37]. The impacts include soil erosion and siltation of watercourses [38] and reduced infiltration and aquifer recharge [39], which affect the quantity and quality of water available for sanitation, irrigation and cattle watering, especially during the dry season.
In order to mitigate the hydrologic impacts and improve soil and biodiversity in the basin, ‘Proaguas Urucuia’, an agri-environmental restoration project, was launched in 2025, aiming to restore 2000 hectares of degraded areas in the basin through reforestation and soil conservation practices. One of the project requirements is that the candidate areas are prioritized according to objective environmental and socioeconomic criteria, avoiding political interference and parochialism [30].
2.2. Development of the Multi-Criteria Model for Prioritization of Restoration Areas
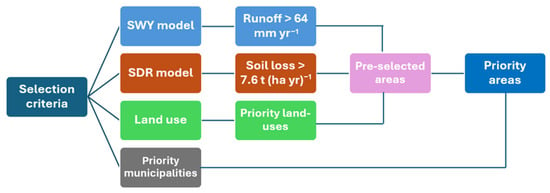
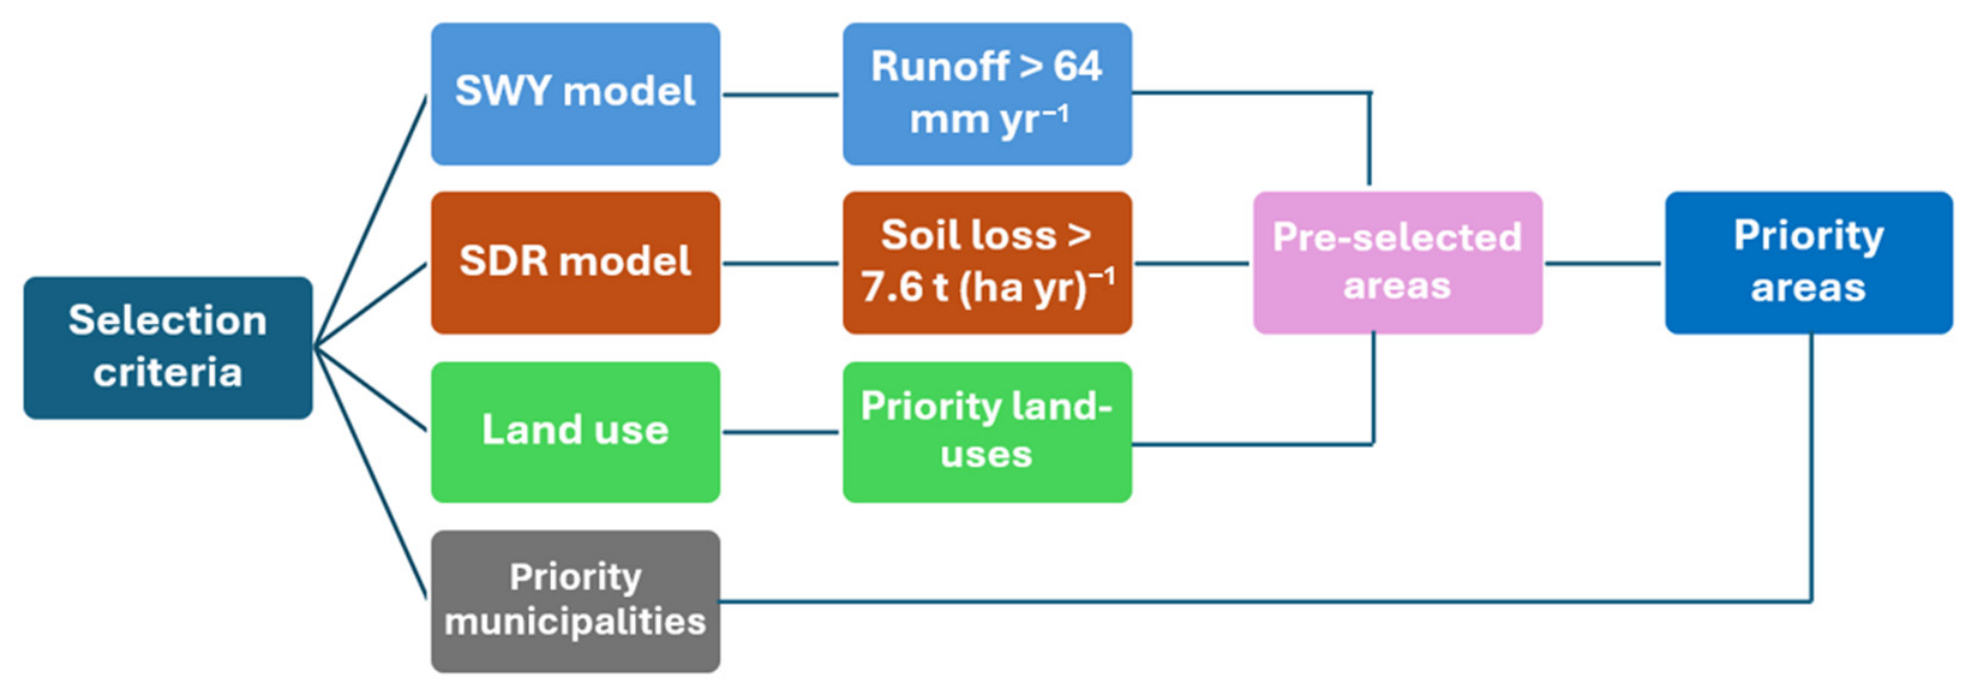
The development of the multi-criteria model (MCM) followed the philosophy of MCM conceptualization, trying to avoid common pitfalls, such as subjectivity and lack of transparency [40]. Hence, the first selected MCM criteria were the two key objectives of the ‘Proáguas Urucuia’ project, namely (i) the reduction in surface runoff [16] and (ii) erosion and sedimentation abatement [11], both being key hydrological services generated by restoration interventions [41].
The third MCM criterion consisted of the group of land-use classes eligible for restoration under the Urucuia Project, including pastureland, agricultural land, and non-vegetated areas, where restoration measures would be cost-effective [21].
The fourth MCM criterion was the degree of land degradation severity within basin municipalities [42]. The latter was applied to the MCM after the overlay (map algebra) of the three previous criteria in the GIS (ArcGIS Pro V.3.6.0®), balancing environmental and social heterogeneity and improving project implementation capacity [43] (Figure 5).
Figure 5.
Conceptual MCM for prioritization of restoration areas. Source: prepared by the authors, using MS Powerpoint V. 2604 (Microsoft, Seattle, WA, USA).
To allow the spatial overlay of the MCM criteria within the GIS, the quantitative and qualitative criteria datasets were previously standardized into common prioritization classes and scores [44]. Hence, quantitative variables (basin surface runoff and soil loss) were classified according to their statistical distributions, whereas qualitative variables (eligible land use and priority municipalities) were classified according to their restoration priority levels. Each criterion class was assigned a numerical score, as follows:
- Surface runoff: three classes (low = 1, medium = 2, high = 3);
- Soil loss: three classes (low = 1, medium = 2, high = 3);
- Land use: two classes (low = 1, high = 2);
- Municipal priority: four classes (low = 1, medium = 2, high = 3, very high = 4).
The four raster layers corresponding to the above criteria were subsequently combined by raster multiplication within the GIS environment [28]. To obtain the final standardized prioritization map, the four criteria and their corresponding scores were normalized in the GIS to a common scale, i.e., by the maximum product of criterion scores [44], producing four overall restoration-priority classes: low (1), medium (2), high (3), and very high (4). Because criterion normalization by the maximum score resulted in equal ranges, an equal-weight approach was maintained [1].
Since the proposed MCM aimed at the maximization of the hydrological services related to water quality and quantity, established by the Proaguas Project objectives, other potential environmental benefits, such as biodiversity improvement, effective land recovery, and connectivity with water receptors, were not explicitly assessed but were not totally excluded.
2.2.1. Surface Runoff Criterion
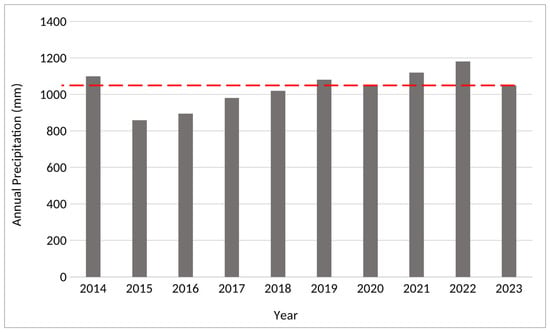
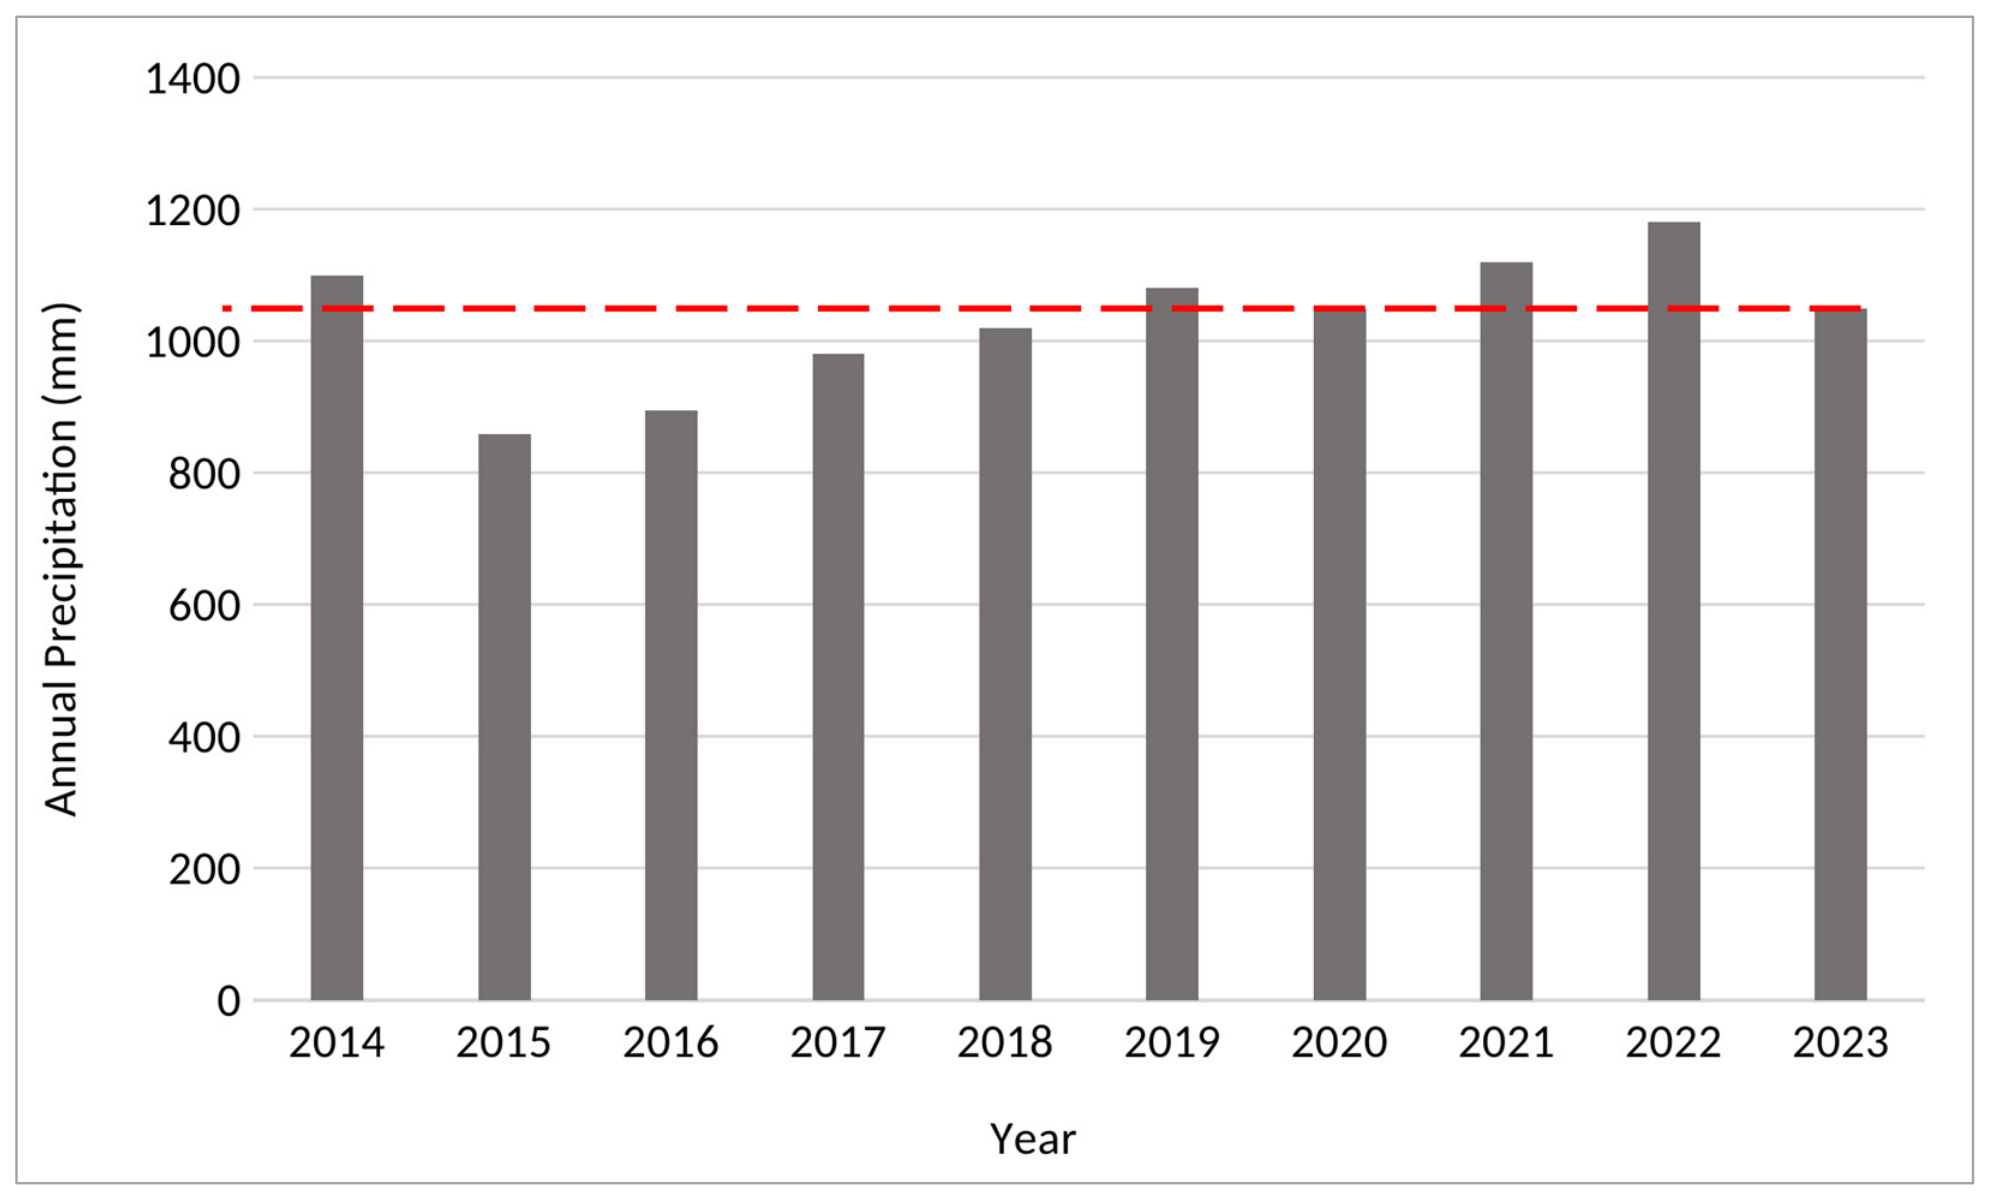
Annual surface runoff was estimated using the InVEST Seasonal Water Yield (SWY) model [45], with corresponding soil, land use, precipitation, and topography datasets. Simulations were performed using data from 2023 because it represented the mean basin climatology of the last decade (Figure 6) and was the latest year for which both land-use [46] and spatially distributed precipitation data [47] were simultaneously available.
Figure 6.
Observed annual precipitation of decade 2014–2023, with the latter year representing the mean decadal precipitation (dotted line). Source: prepared by the authors, using MS-Excel V. 2609 (Microsoft, Seattle, WA, USA).
Monthly precipitation and potential evapotranspiration were obtained from the Climate Hazards Center InfraRed Precipitation with Station Data-CHIRPS dataset, with a grid cell size of 4750 × 4750 m [48]. To improve the reliability of the gridded precipitation data, consistency analysis and bias correction were conducted by pointwise comparing them to observed rainfall from selected rain gauges in the basin. Bias correction was achieved by a parametric equation [49]:
where Pc = bias-corrected precipitation (mm); Pg = gridded precipitation (mm); and α and β are adjustment coefficients obtained from the regression of observed and gridded data. The resulting α and β were 0.85 and 0.04, respectively, with R2 = 0.92. Table 1 presents the monthly precipitation, monthly potential evapotranspiration, and number of rain events in the representative year 2023, used in the simulation. The record had no missing data.
Pc = α + β Pg
Table 1.
Monthly precipitation, monthly potential evapotranspiration, and number of rain events in 2023.
Crop coefficients for the basin land uses were obtained from the literature [50], and curve-number (CN) values, representing the basin’s soil–land-use combinations, were adopted from previous experimental studies in the Brazilian savannah [51,52]. Table 2 presents the mean annual crop coefficients and mean CN values for the Basin land use types.
Table 2.
Mean annual evapotranspiration coefficients (Kc) and mean CN values for the basin land uses (CN is the mean of the four NRCS soil hydrologic groups).
The SWY model parameters (α, β, and γ) were calibrated by minimizing the difference between observed and simulated annual streamflow (objective function), using the MS-Excel Solver optimization routine [53]. The lower and upper calibration bounds for the α and β parameters were 0 and 1 and 1/12 and 12/12 for the γ parameter, respectively. Observed annual streamflow data were obtained from the basin outlet gauging station [36], while simulated annual streamflow was the sum of InVEST-SWY annual modeled baseflow (Qb) and surface runoff (Qf), the latter being consistent with rainfall frequency.
Observed river discharge (m3 s−1) was converted into water depths (mm yr−1) by a discharge-to-depth conversion formula, using the basin area upstream of the gaging station (A = 23.765 km2). The flow accumulation threshold parameter of the Urucuia Basin was obtained by matching the stream heads of cartographic (map) and GIS-generated flow accumulation [54], resulting in a mean of 5000 pixels.
Following model calibration and validation, the spatial distribution of annual runoff was statistically analyzed to establish a restoration-priority threshold [55]. Areas with runoff values greater than twice the basin-wide mean were classified as priority areas [56], as they represent locations with greater hydrological services.
2.2.2. Soil Loss Criterion
Mean annual soil loss across the basin was estimated with the InVEST Sediment Delivery Ratio (SDR) model [45], using land-use and precipitation data from 2023. Model calibration and validation were performed by minimizing the difference between simulated and observed basin annual sediment yield for the years 2014–2023, using the MS-Excel Solver [53]. Observed sediment yield was obtained from the Urucuia Basin sediment-rating curve [39] in combination with the measured annual streamflow at the basin outlet [36].
The default value of 0.8 was adopted for the model SDRmax parameter [45], and a value of 5.0 was assumed for the Lmax coefficient, both considering the basin slope and drainage density characteristics. The InVEST-SDR calibrated parameters were Kb (bounds: 0–1.0) and IC0 (bounds: 0–10).
As with the surface runoff criterion, a soil-loss threshold was established to identify restoration-priority areas. Cells with annual soil loss that exceeded twice the overall basin mean were classified as priority areas [57], which generally approach the soil loss tolerance limit for tropical soils [52,58].
Rainfall Erosivity
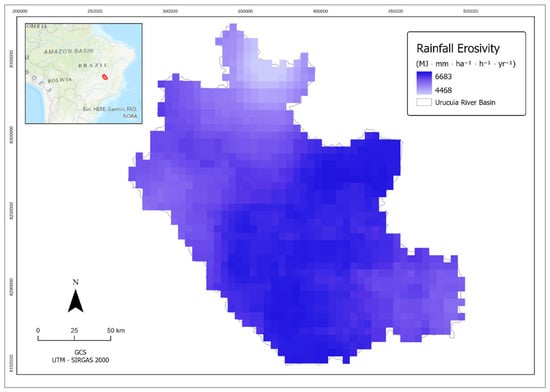
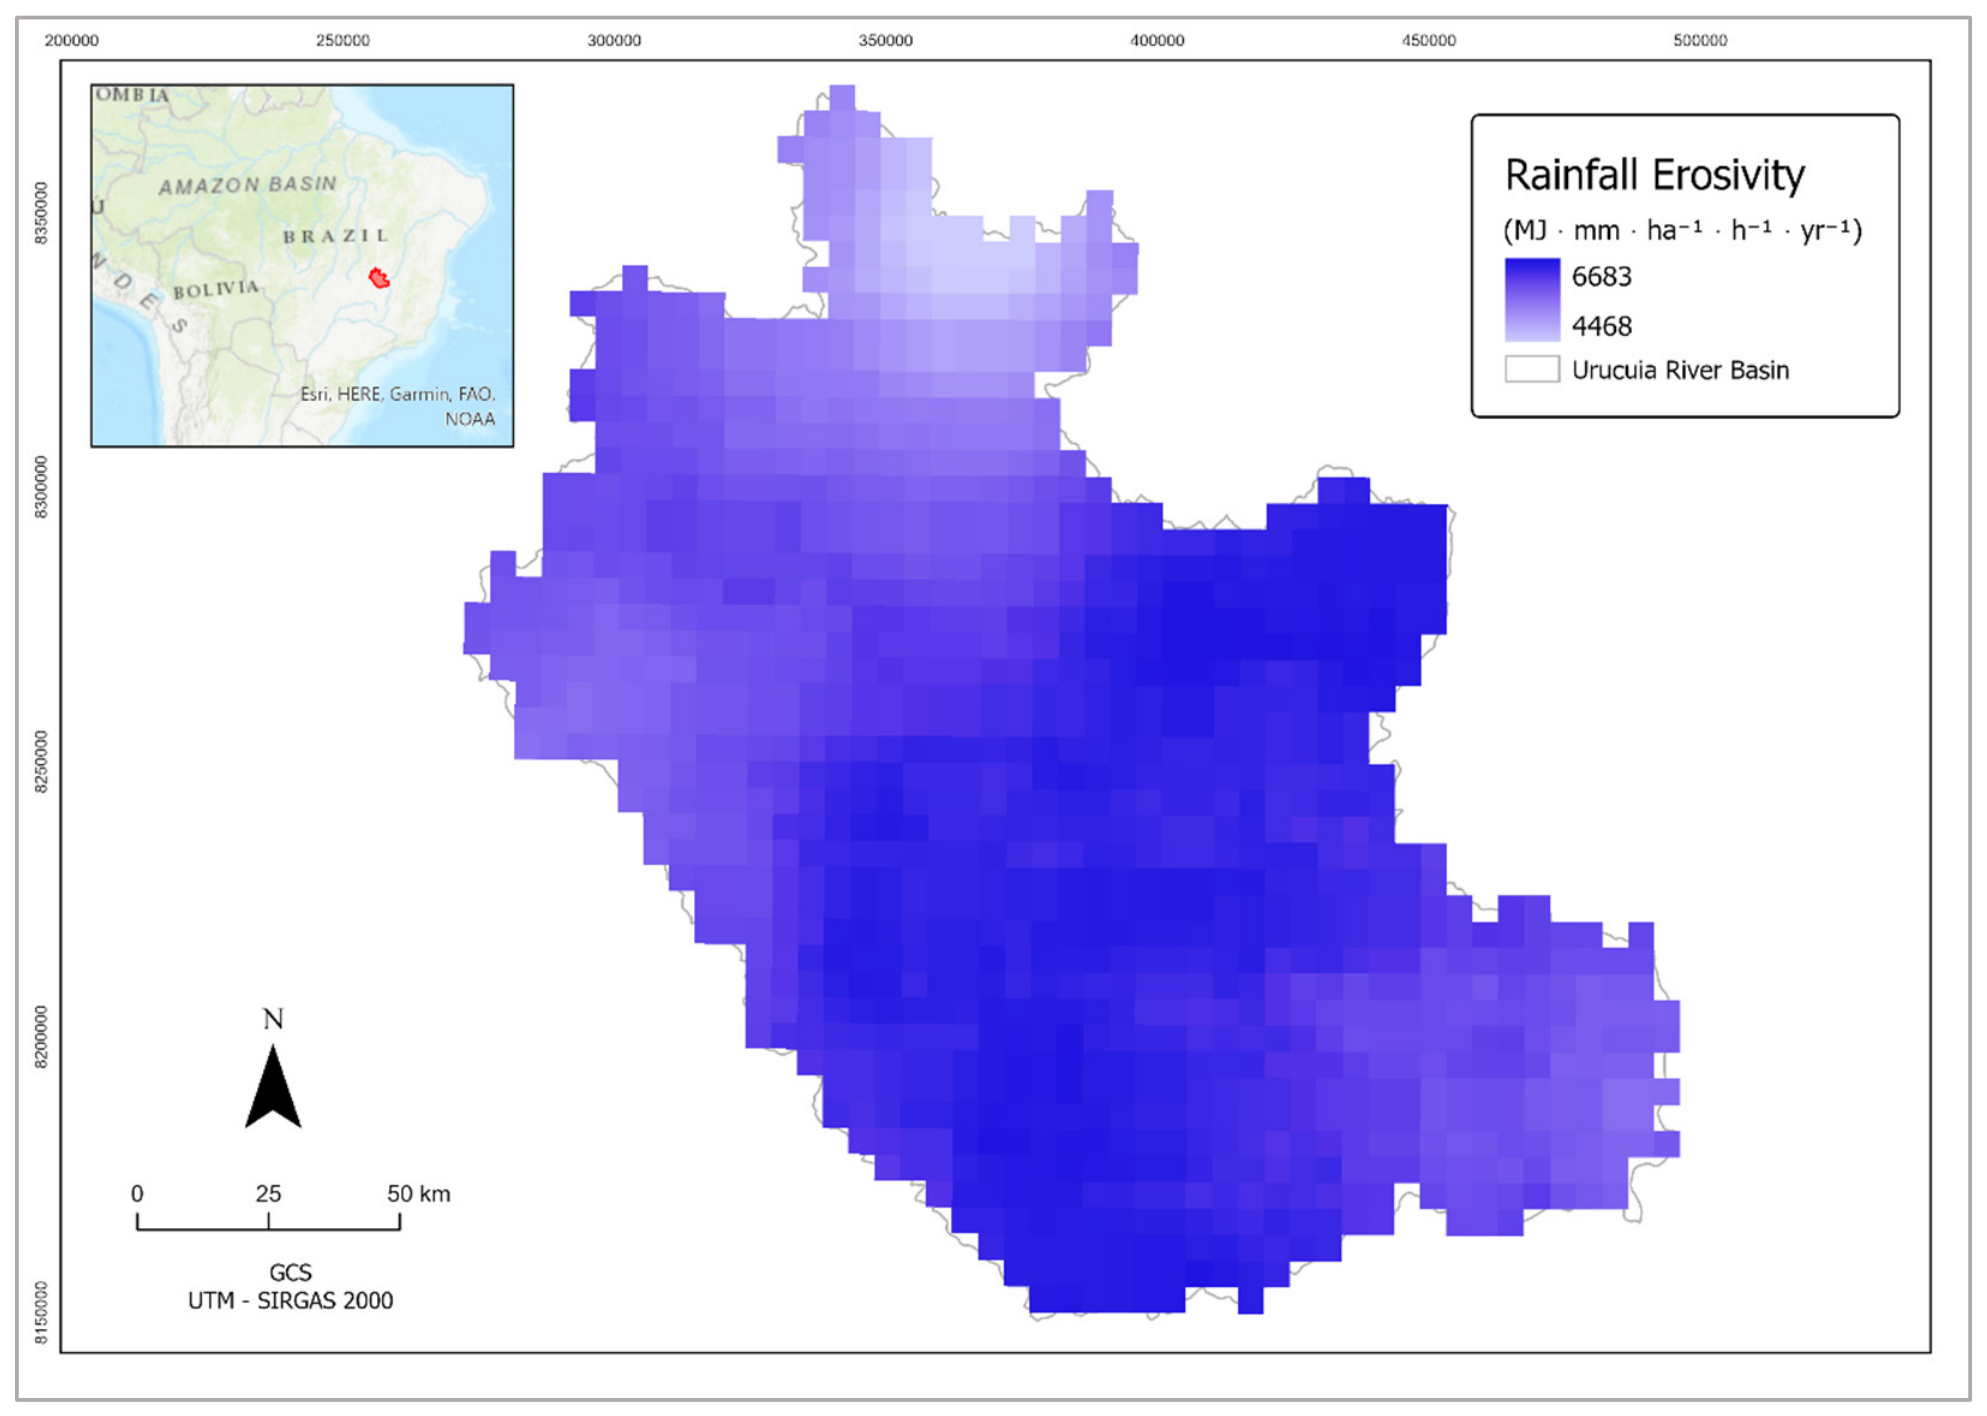
Basin rainfall erosivity was obtained with a Fournier-type equation [59], calibrated for Central Brazil [60], using CHIRPS gridded monthly precipitation data [48].
where R = annual rainfall erosivity (MJ mm ha−1 h−1); Mi = monthly precipitation of 2023 (mm); and P = annual precipitation of 2023 (mm) (Figure 7).
Figure 7.
Annual rainfall erosivity of the Urucuia Basin for the representative year 2023. Map resolution: 4750 × 4750 m. Prepared by the authors, using ArcGISPro3.6.0 (ESRI, Redlands, CA, USA).
Soil Erodibility
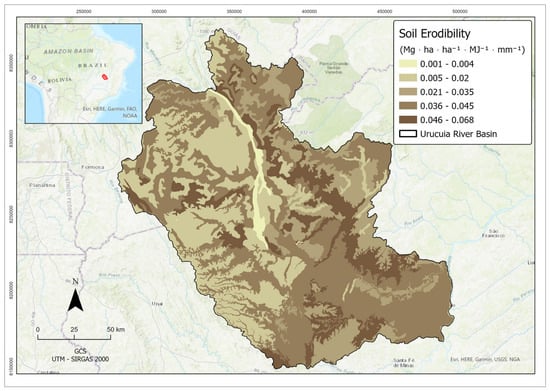
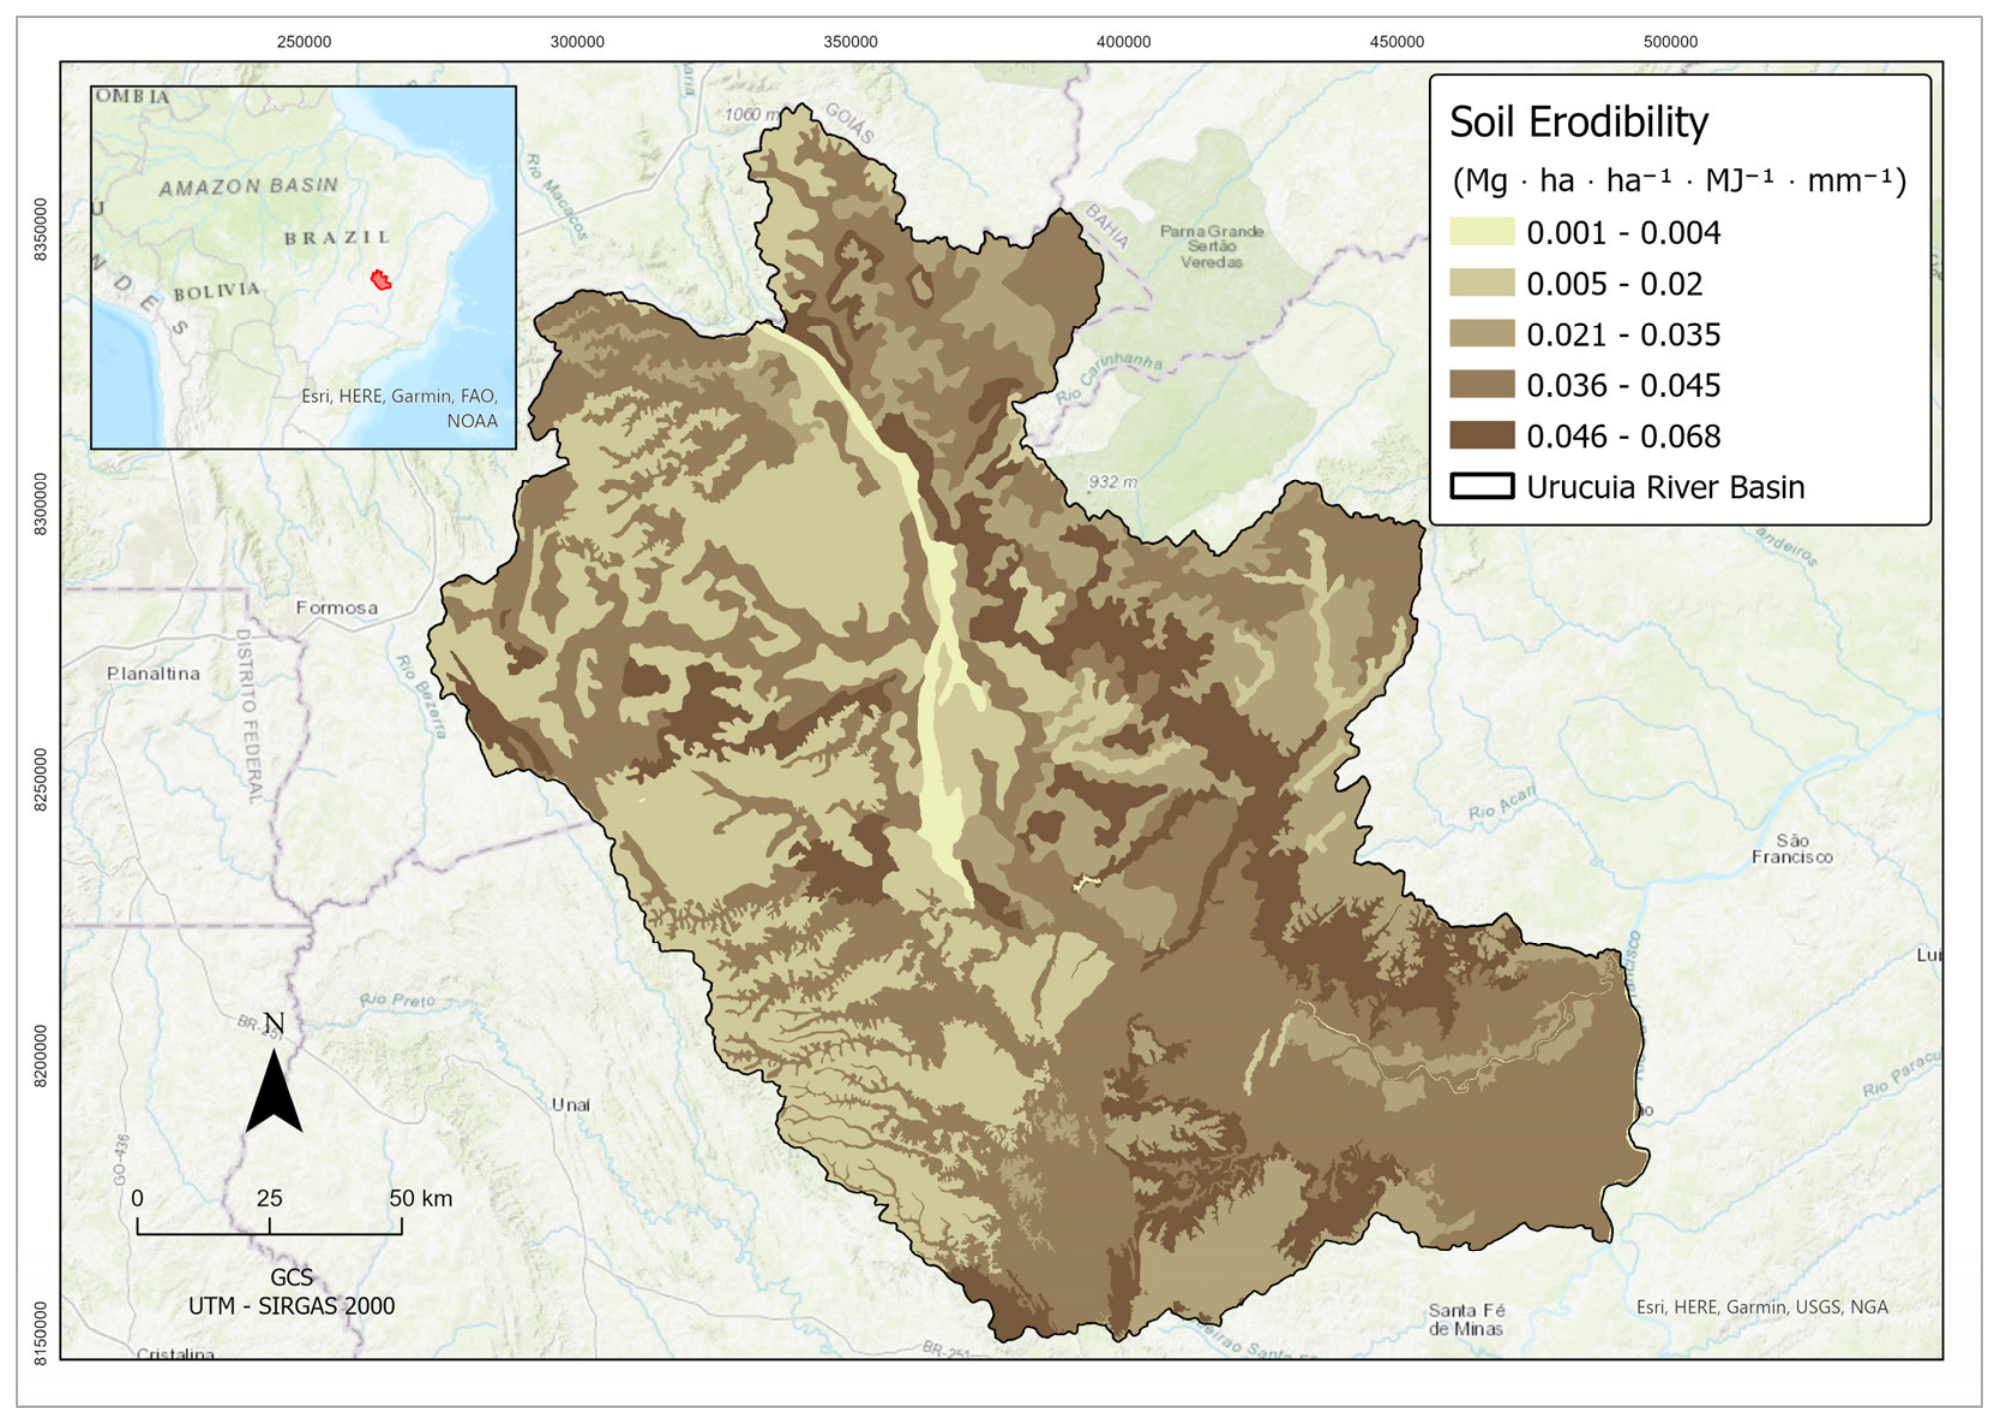
Since the original USLE equation for soil erodibility, developed for temperate soils [61], is generally unfit for tropical soils [62], the SDR soil erodibility factor (K) was calculated using an empirical equation based on soil texture developed for the Brazilian savannah [63], using the basin soil map (30 × 30 m pixel size) and representative soil texture mapping samples [64]:
where K = soil erodibility (t ha h ha−1 MJ−1 mm−1); AF (%) = fine sand content in the A horizon; SIL (%) = silt content in the A horizon; OC (%) = organic carbon content in the A horizon; and AR (%) = total sand content in the soil. Figure 4 shows the erodibility of the Urucuia Basin soils.
K = −0.00043 (AF + SIL)/OC + 0.000437 AR + 0.000863 SIL
Equation (2) was obtained from runoff plot and soil textural data, and although it appears to have a dimensionally heterogeneous form, its fitted coefficients (constants) incorporate the required dimensional balance. The soil erodibility map of the Urucuia Basin is presented in Figure 8.
Figure 8.
Erodibility of the basin soils. Prepared by the authors, using ArcGISPro3.6.0 (ESRI, Redlands, CA, USA).
Land Use and Land Cover
The SDR C factor for each land use type in the basin was obtained from previous studies in the Brazilian savannah [52,65] (Table 3).
Table 3.
Basin land use/cover and C factor.
Topographic Factor
The SDR slope-length and slope-steepness factor (LS) was computed internally by the model using the basin digital elevation model [45]. Elevation data were obtained from the 30 × 30 m Shuttle Radar Topography Mission (SRTM) dataset [66]. The support-practice factor (P) was assigned a value of 0.1 for terraced cropland and 1.0 for all other land-use classes [63].
Aggregation of Erosion Sub-Criteria
All erosion sub-criteria were spatially aggregated by the InVEST-SDR model, which uses a spatially distributed RUSLE model, incorporating a simplified sediment routing routine along the basin slopes, fully available in the model documentation [45].
2.2.3. Land-Use Priority Criterion
The prioritized land uses were those eligible under the ‘Proáguas Urucuia’ project, namely (i) pastureland, (ii) land-use mosaic, (iii) temporary crops, and (iv) non-vegetated areas. All remaining land-use classes were excluded from the prioritization process. Since natural savannah was considered a preserved land-use condition, it was not prioritized because it was not eligible for restoration within the Urucuia Project.
2.2.4. Municipality Criterion
The municipality criterion was based on an online survey conducted with 50 basin managers and stakeholders, representing all 14 basin municipalities. The survey included questions about the following aspects: (i) the main basin environmental issue; (ii) the main hydrologic issue; and (iii) the most critical municipalities with respect to observed hydro-environmental impacts. The issues and municipalities were ranked based on their relative frequency.
Water scarcity, soil erosion, and river sedimentation were the three most critical issues, and the 14 municipalities were ranked into four priority classes. Hence, the municipality criterion was classified into four restoration-priority categories according to the severity of their environmental degradation. Each priority class was subsequently assigned a corresponding numerical score (1–4) for incorporation into the multi-criteria model.
2.3. Prioritization Field Validation
The restoration-priority map was validated by ground-truthing [67], with mapping accuracy estimated using a confusion matrix that compared predicted and observed classifications for 40 randomly selected priority and non-priority sites. Prioritization accuracy was calculated according to the following equation [54]:
where Ap = prioritization accuracy; Tp = number of true priority sites; Tn = number of true non-priority sites; Fp = number of false priority sites; and Fn = number of false priority sites. A true-positive observation occurred when a basin site identified as a restoration priority by the model was confirmed during field verification. Conversely, a true-negative observation corresponded to a location correctly classified as a non-priority area.
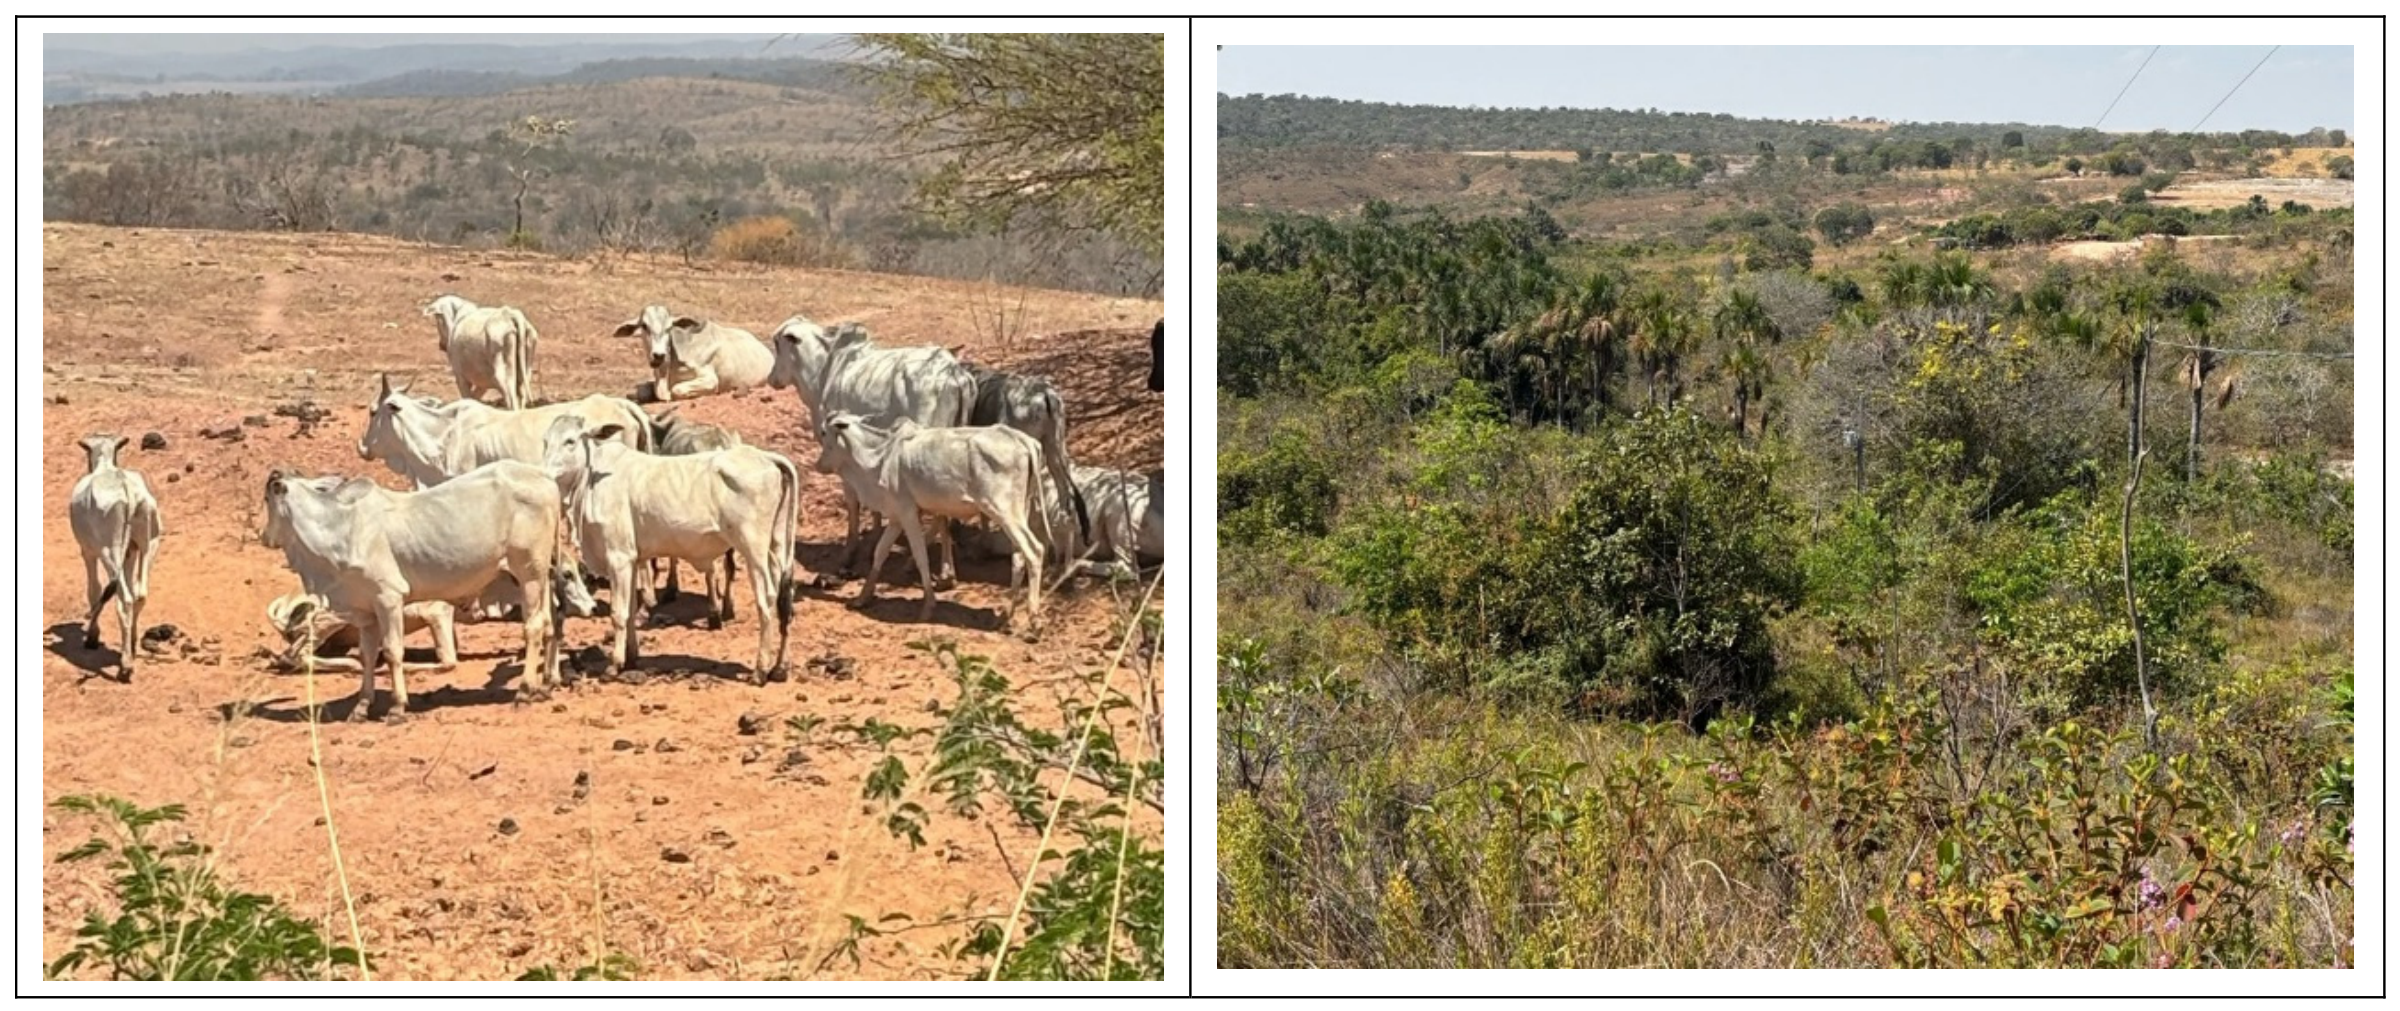
Therefore, 20 priority and 20 non-priority sites were independent of the eligible land-use classes, and randomly selected across the Urucuia River Basin, spanning different physiographic settings and land-use classes, encompassing the upper, middle, and lower reaches of the basin. Examples of priority and non-priority sites are shown in Figure 9.
Figure 9.
Examples of validation sites in the Urucuia Basin. Left: priority area (degraded pasture); right: non-priority area (natural savannah). Source: Authors, Urucuia, Brazil, 2025.
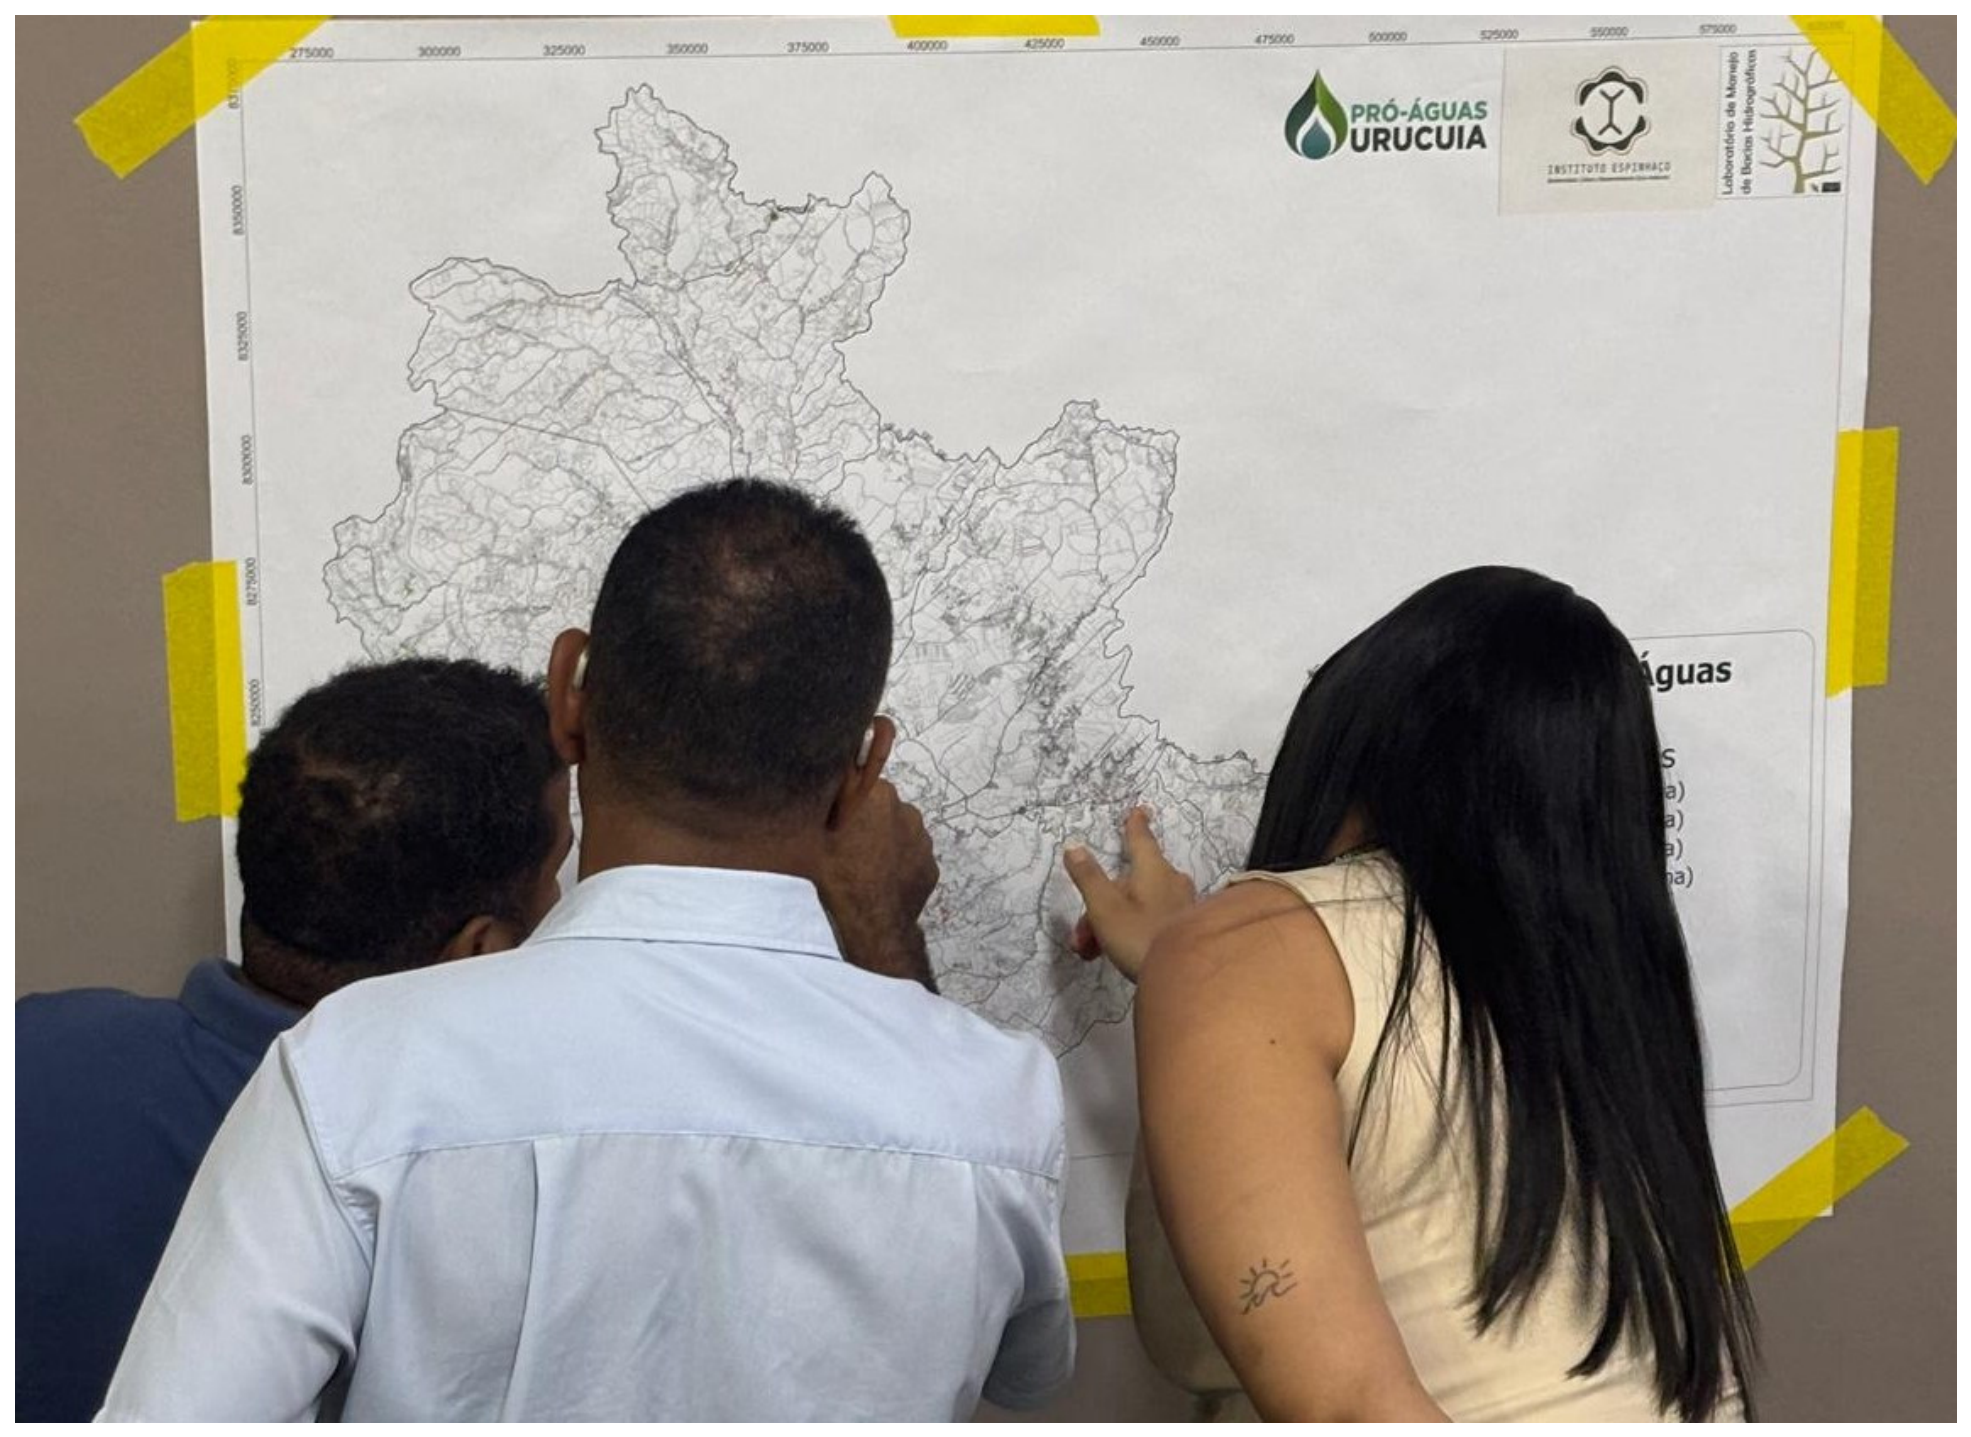
The basin priority map was also evaluated during a stakeholder validation workshop [68], attended by 50 basin managers, extension officers, and farmers. During the workshop, participants assessed the consistency of the mapped priority areas based on their local knowledge and practical experience, with the help of large-format paper maps containing property lines and major geographic features of the basin (Figure 10).
Figure 10.
Stakeholder validation workshop. Source: Authors, Urucuia, Brazil, 2025.
3. Results
3.1. Basin Runoff
The InVEST-SWY runoff model calibration and validation results, using the 2014–2023 series, are presented in Table 4, with the corresponding Nash–Sutcliffe efficiency coefficients [69] and R2 values. Calibration (C) was performed for the odd years and validation (V) for the even years of the series. The calibrated model parameters were a = 1.0, b = 1.0, and g = 1/12.
Table 4.
Calibration (C) and validation (V) results of the InVEST-SWY model for the annual flow in the series 2014–2023, with corresponding means, NSE, and R2 accuracy coefficients.
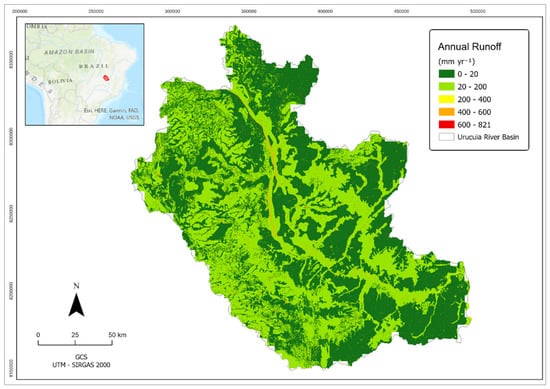
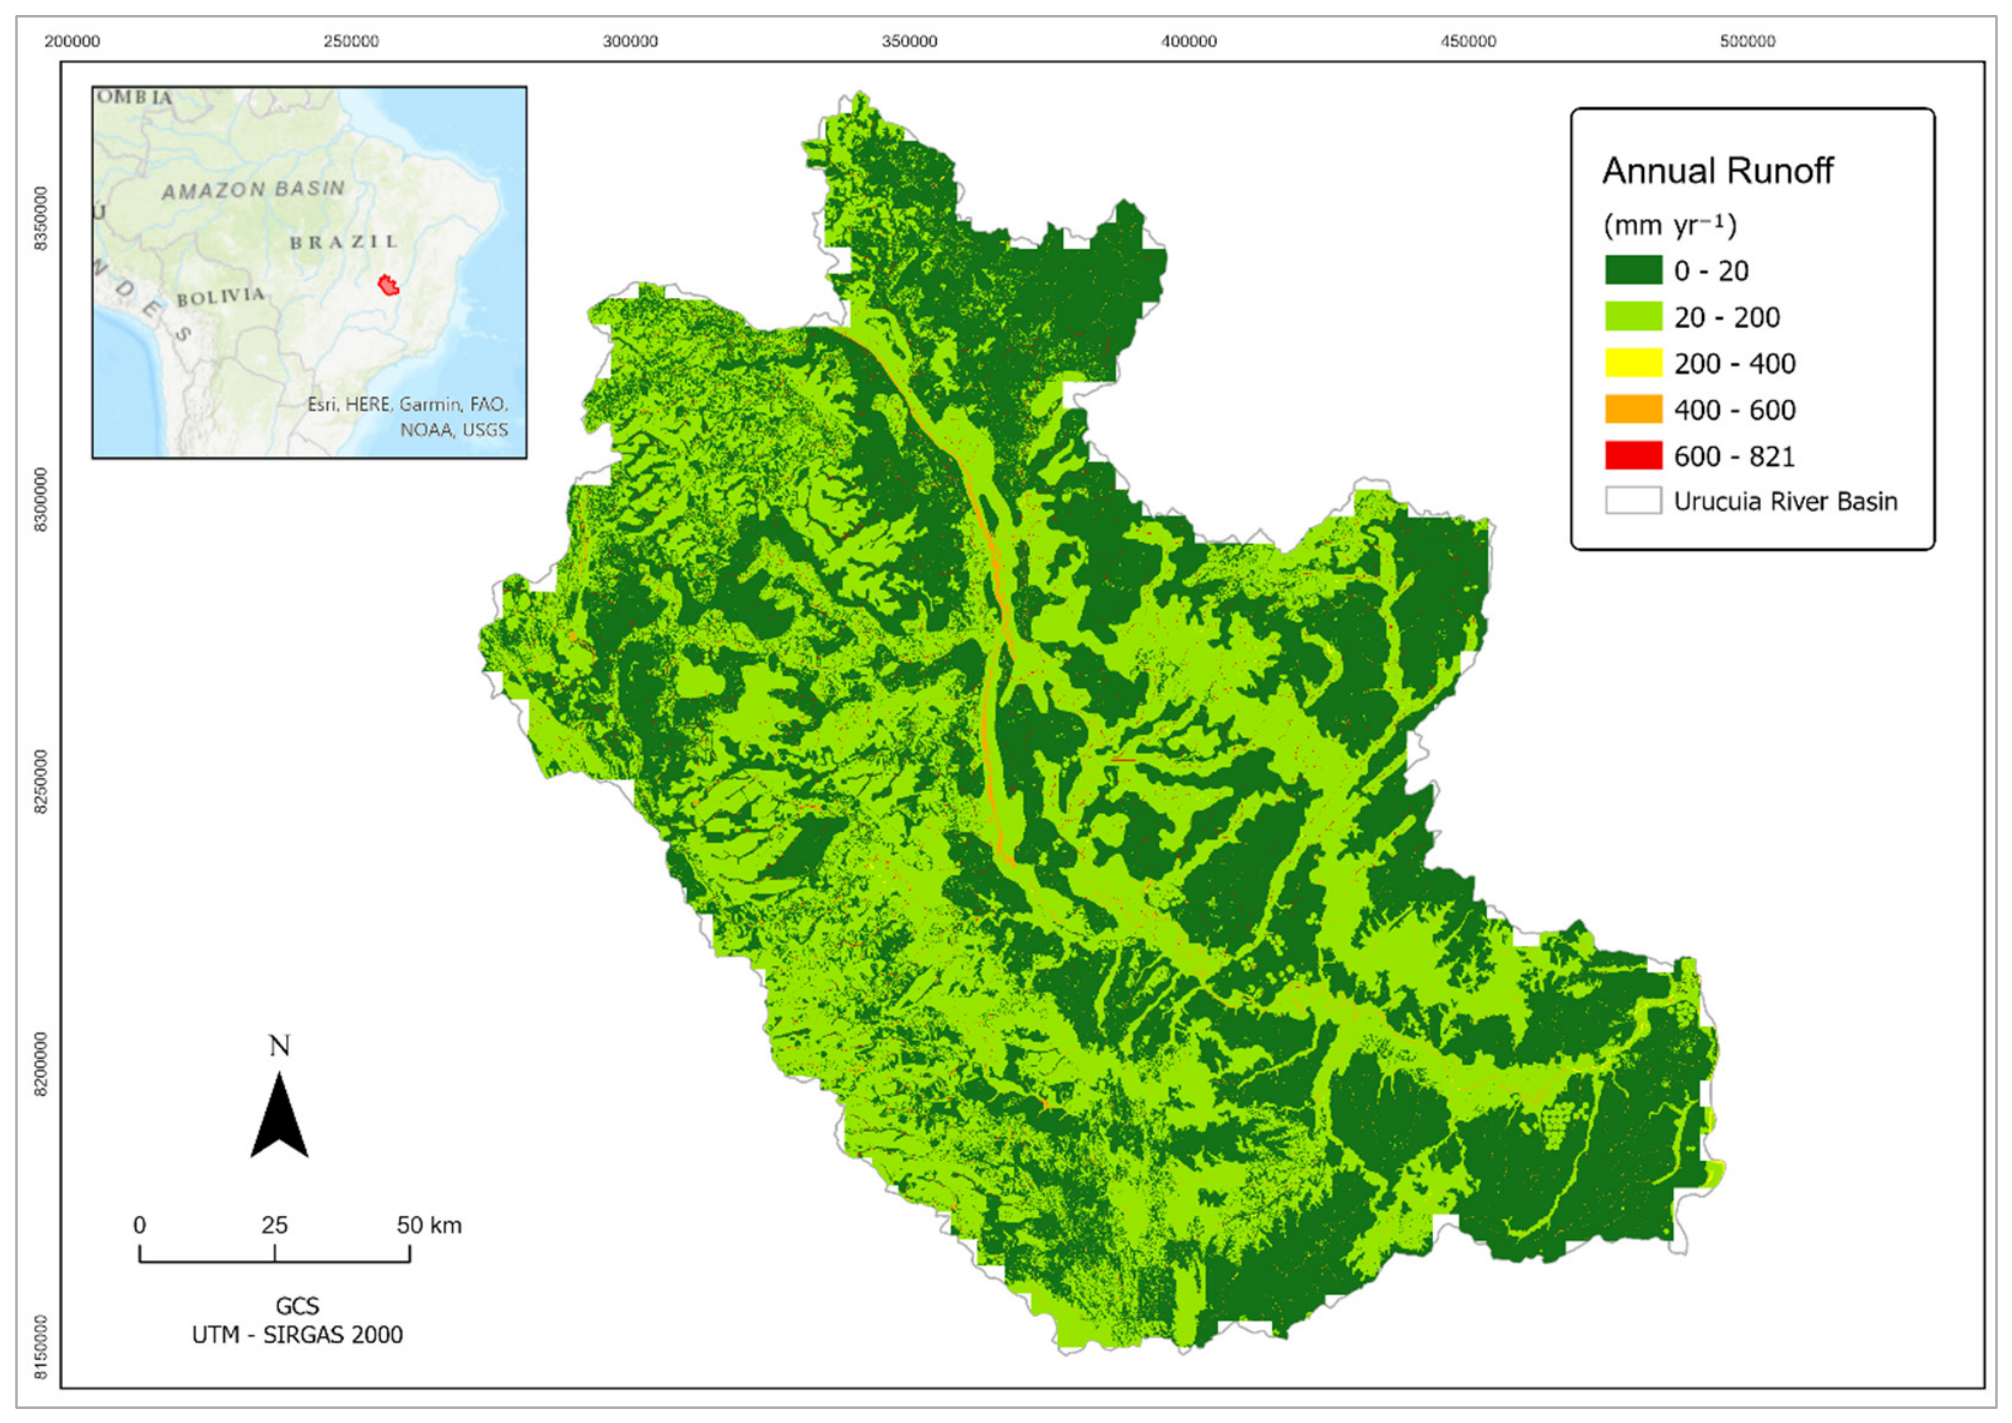
The spatial distribution of annual surface runoff, corresponding to the first MCM criterion, is presented in Figure 11. Basin mean annual runoff was 32 mm yr−1, with 10.3% of the basin area (268,135 ha) exceeding the prioritization threshold of 64 mm yr−1. These areas were therefore classified as priority locations for reforestation and soil conservation based on their runoff and environmental service generation potential.
Figure 11.
Annual runoff in the Urucuia River Basin. Source: prepared by the authors, using ArcGISPro3.6.0 (ESRI, Redlands, CA, USA).
3.2. Basin Soil Loss and Sediment Yield
The InVEST-SDR erosion model calibration and validation results, using the 2014–2023 basin observed and calculated sediment yields, are presented in Table 5 below, with the corresponding Nash–Sutcliffe efficiency coefficients [69] and R2. Calibration (C) was performed for the odd years and validation (V) for the even years of the series. Calibrated SDR model parameters were 1.0 (Kb) and 1.77 (IC0).
Table 5.
Calibration (C) and validation (V) results of the InVEST-SDR model relative to the basin annual specific sediment yield in the series 2014–2023, with corresponding means, NSE, and R2 accuracy coefficients.
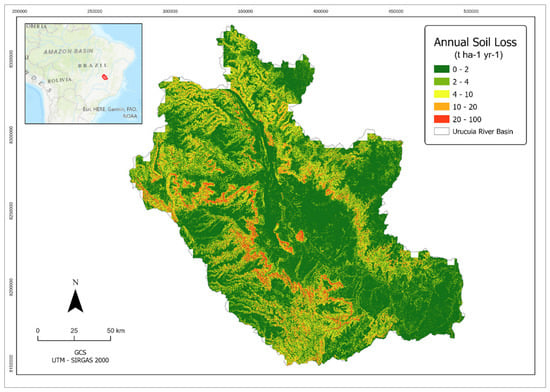
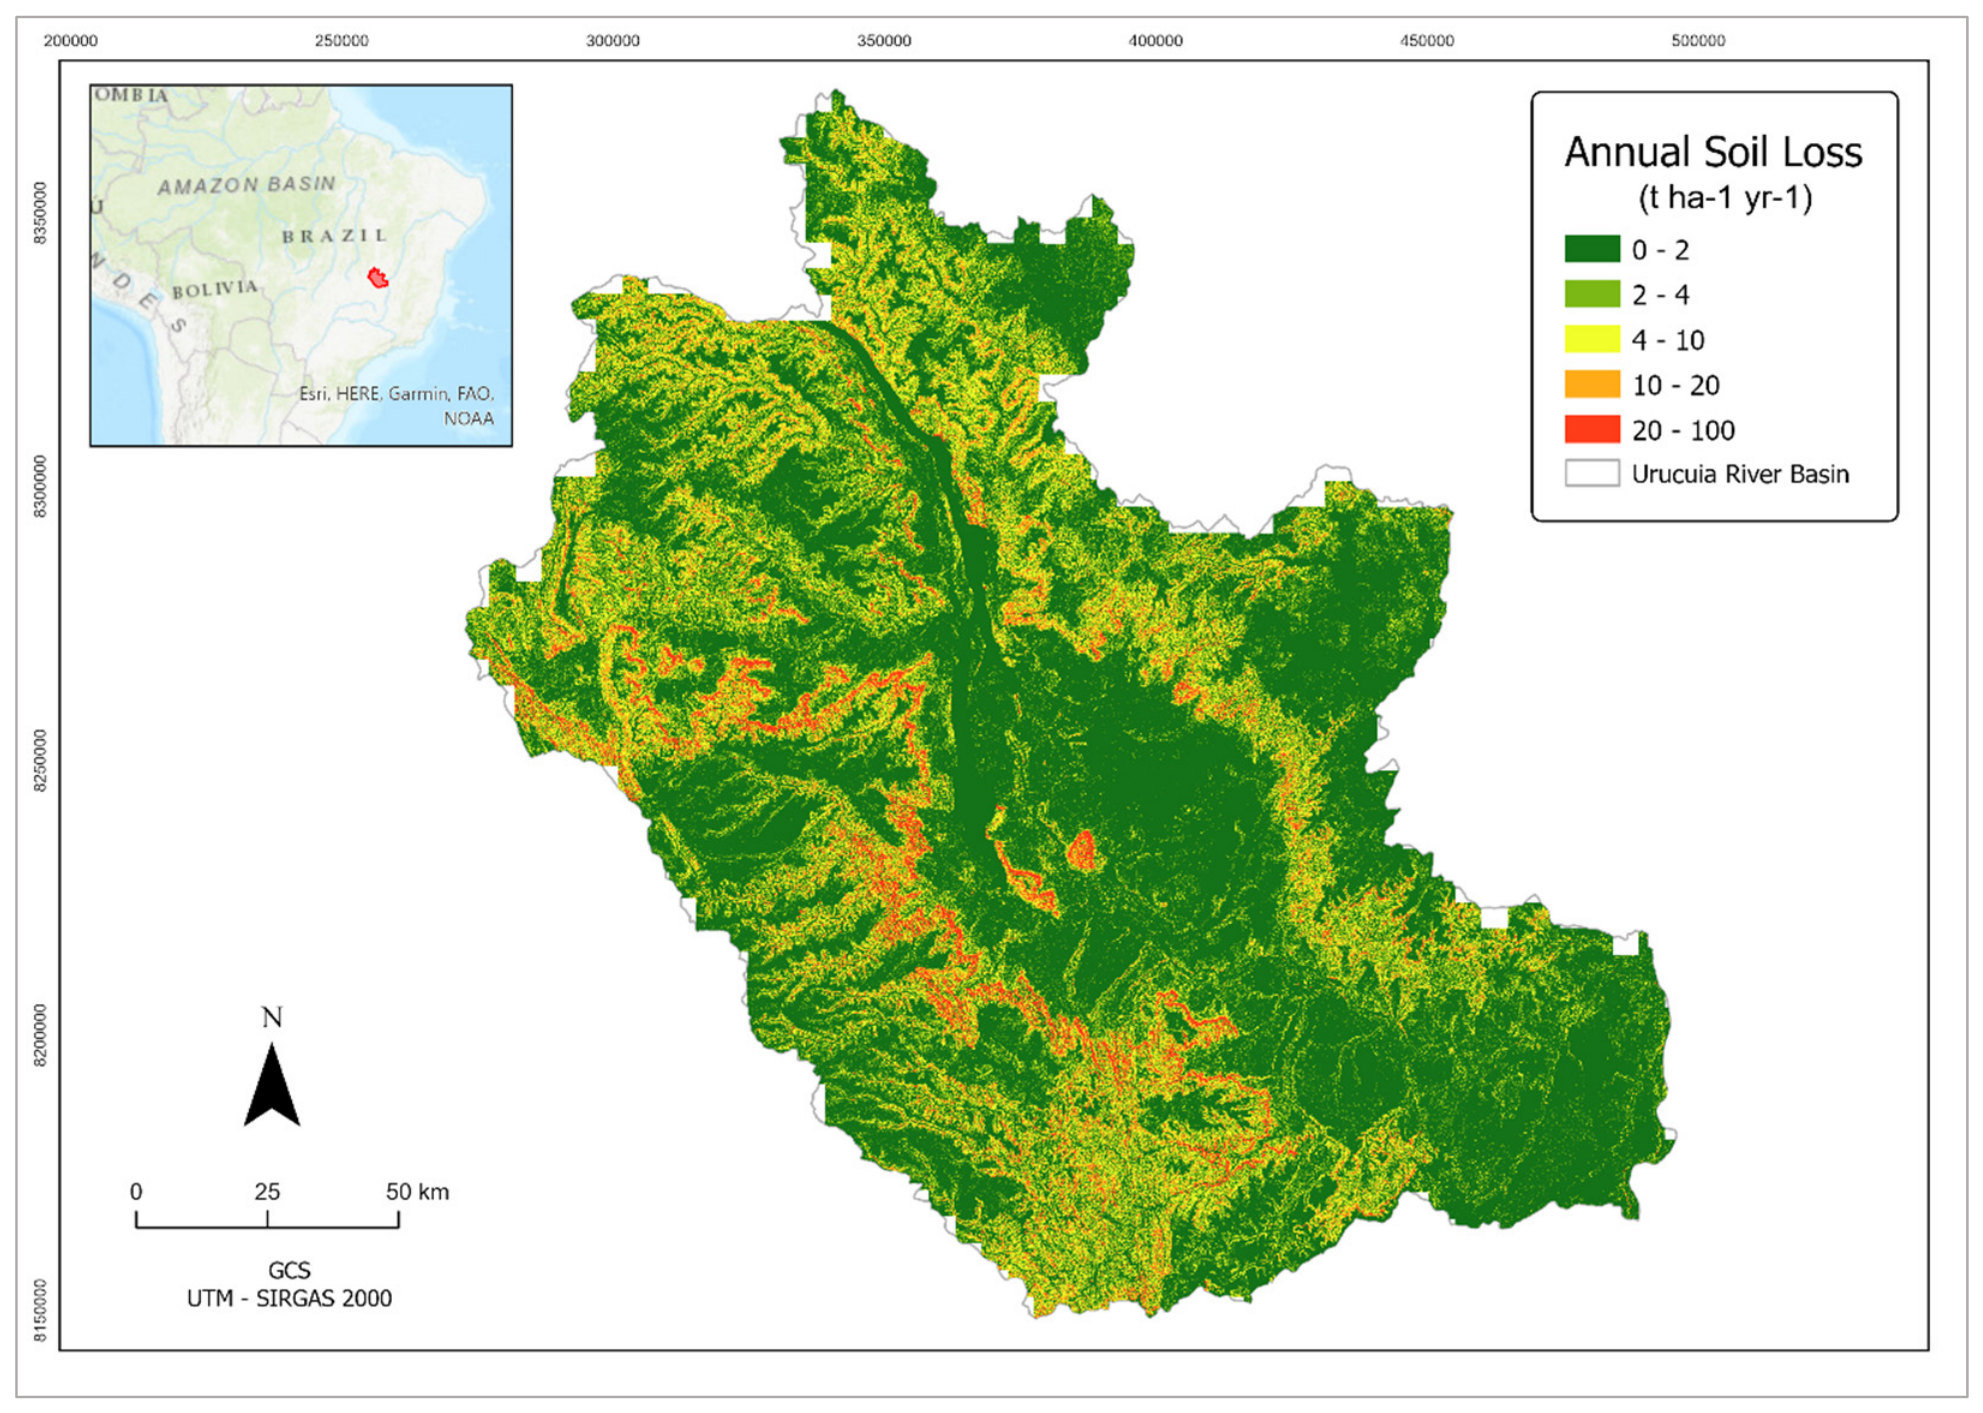
The map of mean annual soil loss is shown in Figure 12. Mean basin soil loss was 3.8 t ha−1yr−1, with 12.7% of the basin area (332,065 ha) presenting erosion rates greater than the prioritization threshold of 7.6 t ha−1yr−1. These areas have severe erosion and the highest potential for environmental service generation resulting from restoration. In both runoff (Figure 11) and soil loss (Figure 12) maps, the unclassified areas around the border represent only 1.5% of the total basin area, as a result of the large pixel size of the gridded CHIRPS data.
Figure 12.
Annual soil loss in the Urucuia River Basin. Prepared by the authors, using ArcGISPro3.6.0 (ESRI, Redlands, CA, USA).
3.3. Priority Land-Use Classes
The eligible land-use classes for restoration occupied an area of 752,140 ha, representing 29.1% of the Urucuia River Basin area. These constituted the third criterion of the multi-criteria model and corresponded to the land uses targeted by the ‘Proáguas Urucuia’ project, excluding the natural land covers, such as natural savannah.
3.4. Municipal Priority
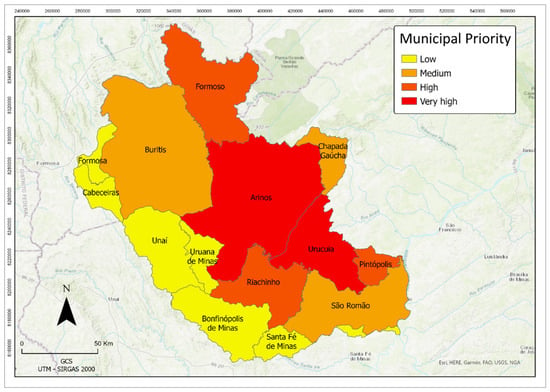
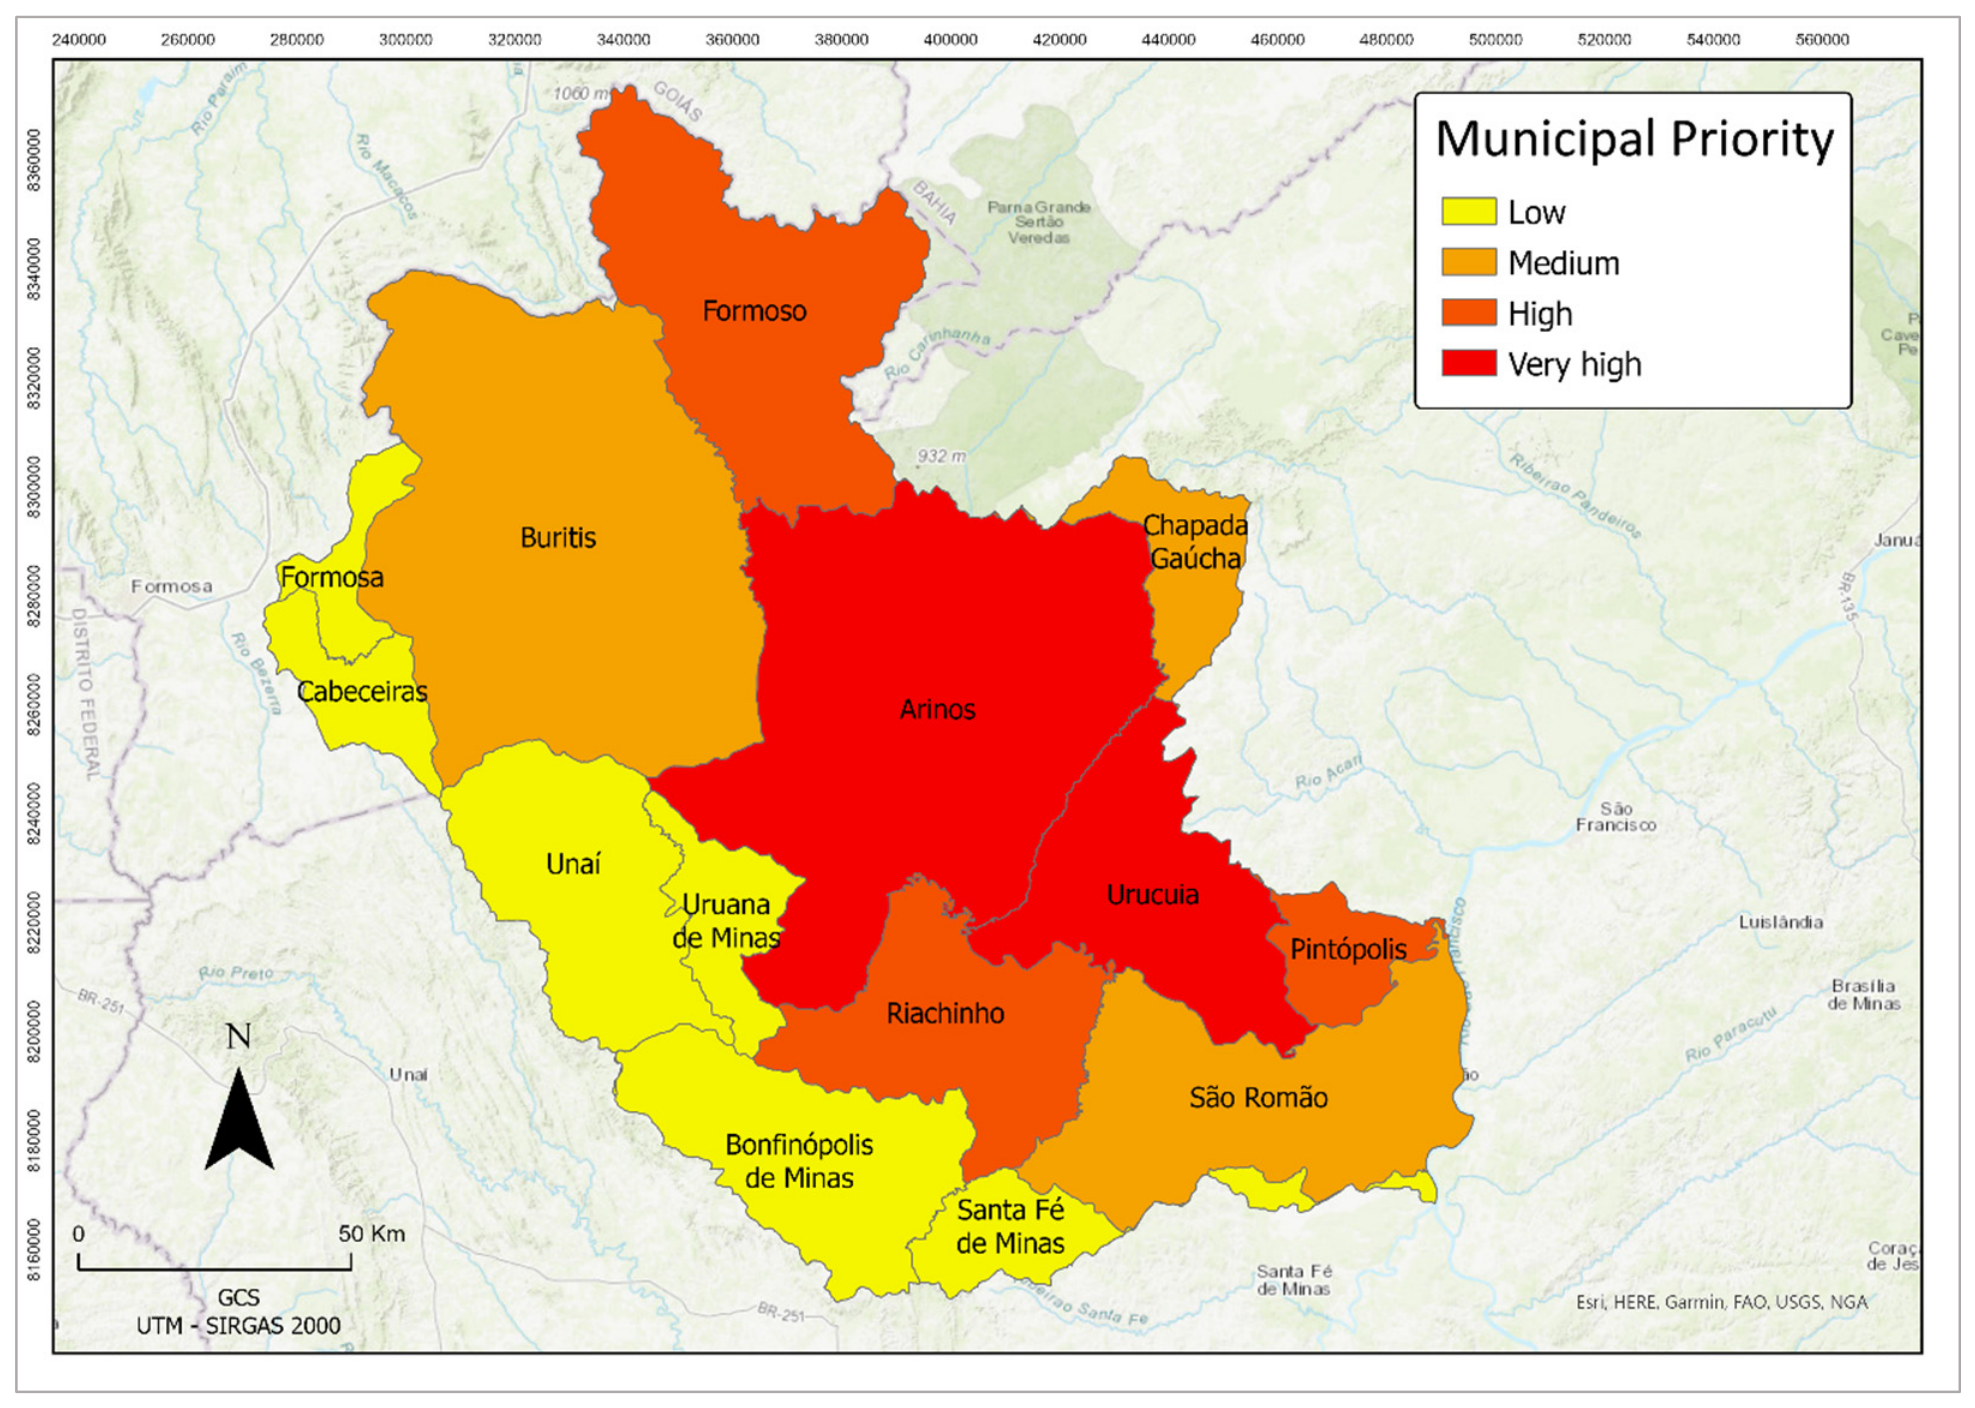
The municipal restoration-priority map, based on land degradation severity established by basin managers and stakeholders, is shown in Figure 13, representing the fourth criterion of the multi-criteria model. According to the local stakeholder assessment, two municipalities were classified as having very high restoration priority, three as high priority, three as medium priority, and six as low priority.
Figure 13.
Municipal restoration priority from the local stakeholder survey. Source: prepared by the authors, using ArcGISPro3.6.0 (ESRI, Redlands, CA, USA).
3.5. Restoration-Priority Map
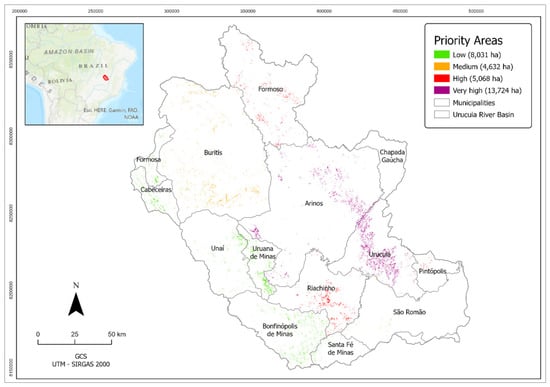
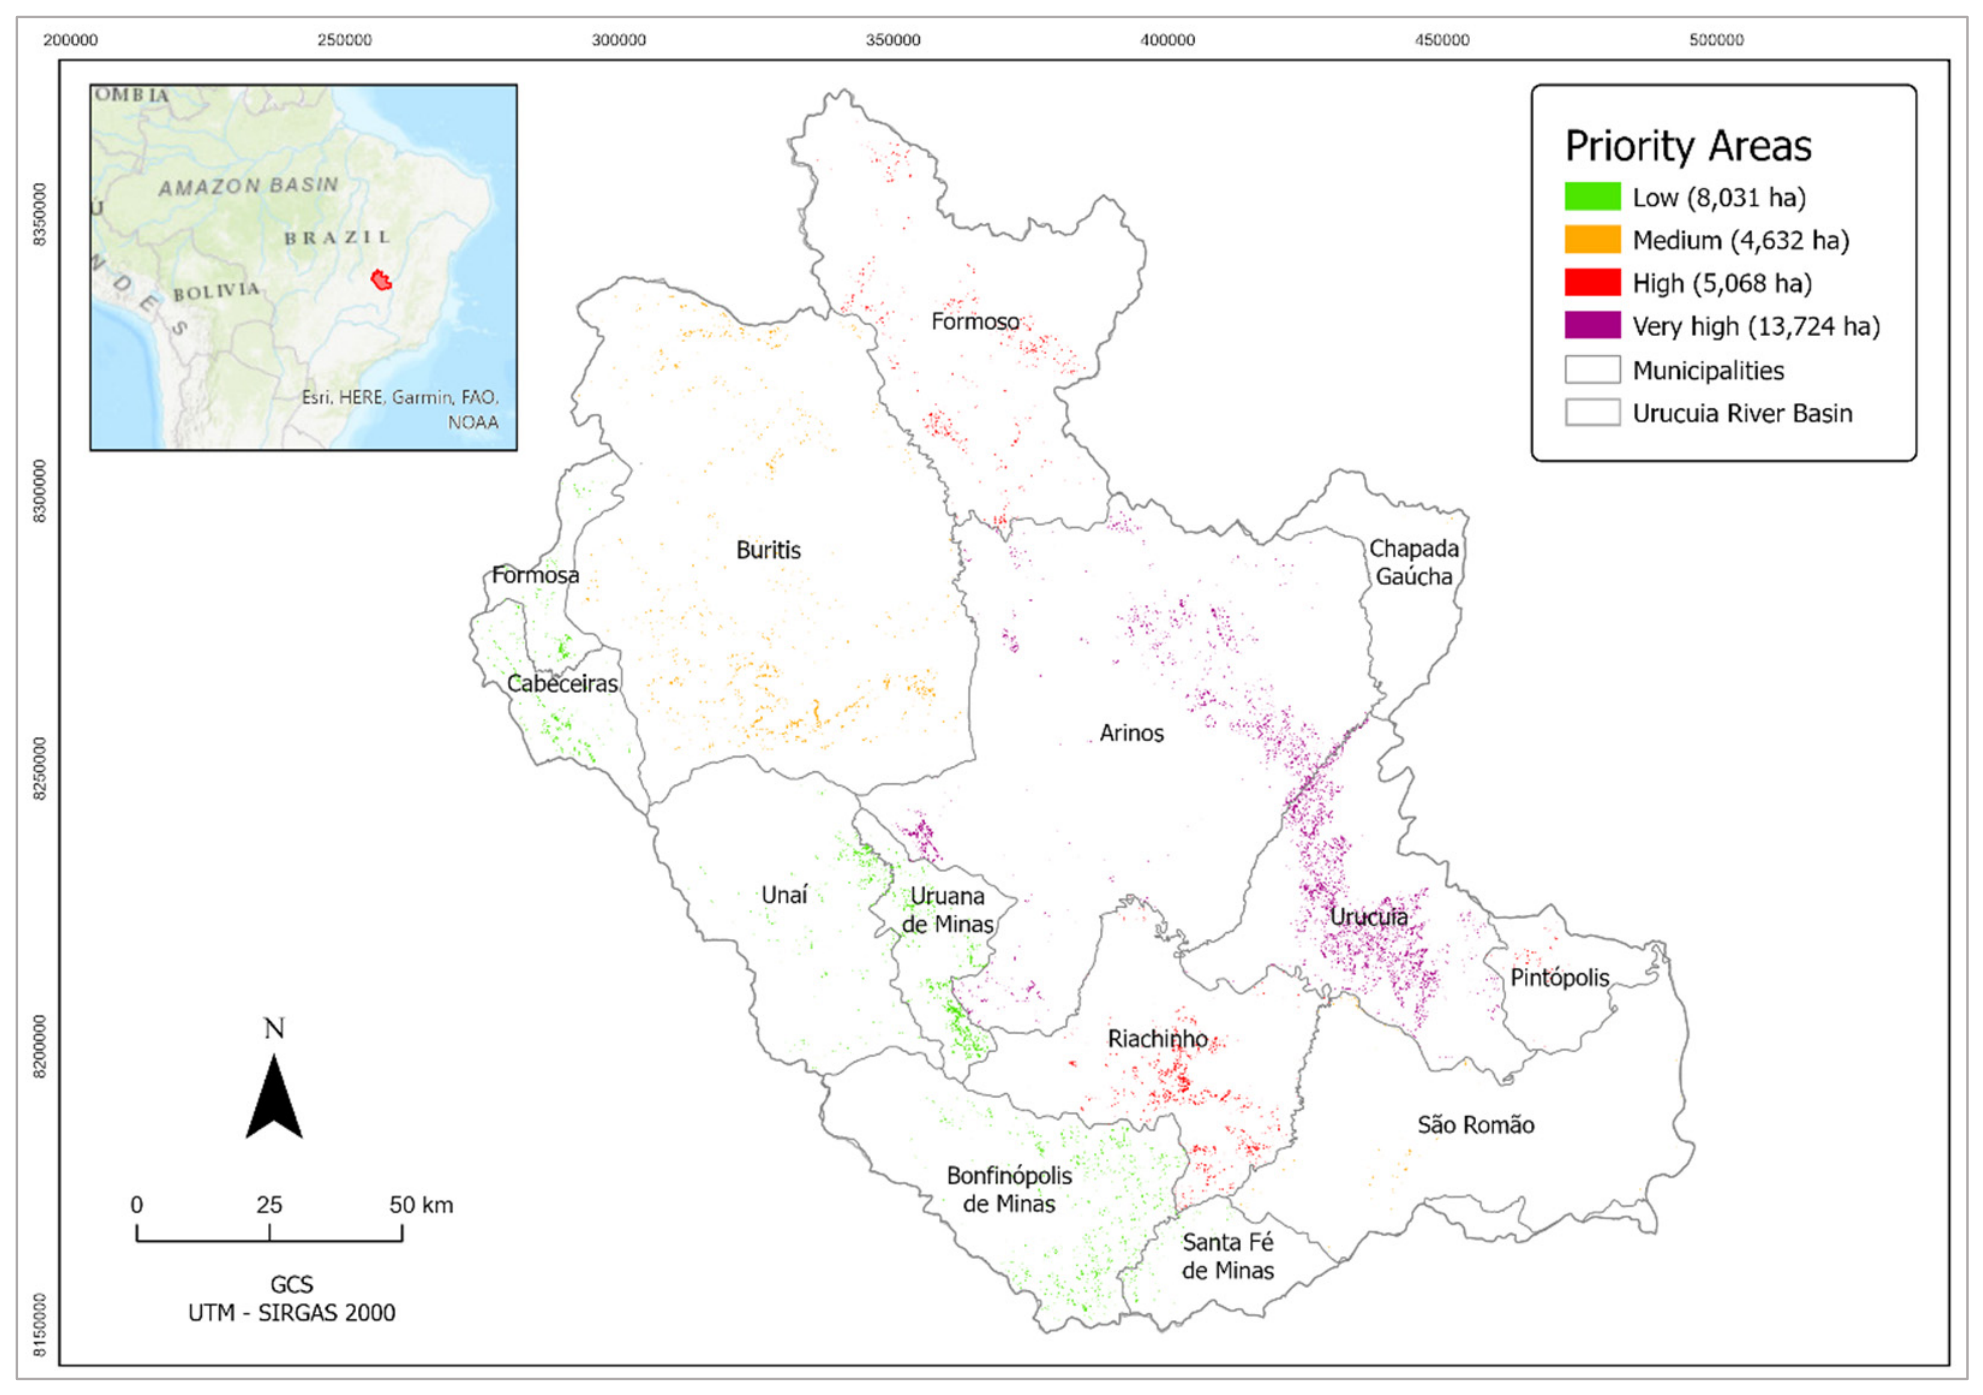
The final restoration-priority map generated by the multi-criteria model is presented in Figure 14. Prioritized areas spanned the upper, middle, and lower portions of the Urucuia River Basin and all landscape settings, encompassing 31,455 ha (1.2% of the total basin area).
Figure 14.
Urucuia Basin priority areas for environmental restoration. Source: prepared by the authors, using ArcGISPro3.6.0 (ESRI, Redlands, CA, USA).
A comparison of the final prioritization map (Figure 14) with the maps of slope grade (Figure 2), soil erodibility (Figure 8), and land use (Figure 4) indicates that the prioritized areas were associated with high slope grades (S > 6%), highly erodible soils (K > 0.04), and low-density land cover, such as pastureland and agriculture.
Because the prioritization criteria focus on the principal drivers of hydrological degradation—including excessive runoff, accelerated soil erosion, and inappropriate land use—the selected restoration areas are expected to provide substantial improvements in water regulation, sediment retention, and overall watershed resilience [20]. Consequently, restoration investments could generate greater environmental returns than those achieved through non-prioritized or subjective site selections, thereby contributing to a positive feedback cycle of watershed recovery and sustainable resource management [70].
Considering that the ‘Proáguas Urucuia’ project aims to restore 2000 ha, the prioritized areas, approximately 15 times the restoration target, provide a sufficiently large pool of candidate sites to support a comprehensive selection process. This allows restoration priority to be considered alongside additional operational factors, including landowner socioeconomic conditions and project implementation logistics [8].
3.6. Validation of Prioritized Areas
The ground-truthing confusion matrix is presented in Table 6. Application of Equation (3) resulted in an overall mapping accuracy of 90%, indicating good agreement between predicted and observed verification sites.
Table 6.
Confusion matrix results.
Additionally, at the stakeholder validation workshop, the majority of the 50 participants considered the prioritization method relevant and transparent, and the corresponding prioritization map to be consistent with their personal knowledge of basin environmental issues and restoration needs.
4. Discussion
A total of 31,455 hectares were prioritized with the multi-criteria model in the Urucuia River Basin, with selected areas spanning all 14 municipalities of the upper, middle, and lower reaches of the watershed, encompassing different land cover typologies, such as forests, agricultural land, wetlands, and built-up areas. The prioritized areas were associated with steep slopes with little or no land cover, highly erodible soils, and zones of high runoff generation, features which were previously recognized in different tropical basins [3,71].
A key strength of the proposed method is the integration of hydrological, environmental, and socioeconomic criteria within a single decision-support framework [1]. This integrated approach enables restoration actions to be directed toward areas where environmental interventions are expected to generate the greatest overall benefits with respect to water quality and quantity, which are compatible with basin management priorities [72].
Although the relatively low number of model criteria could potentially reduce the prioritization reliability of the proposed MCM, a large number of factors would increase model complexity and the risk of model multicollinearity [73]. Also, the assignment of equal criteria weights contributed to improving the transparency and reproducibility of the methodology, since balanced models are less prone to subjectivity and bias associated with expert judgment [74]. This assumption was supported by similar basin prioritization studies elsewhere [75].
The fact that the InVEST-SWY (runoff) and SDR (erosion) models were designed for relative comparisons between land-use scenarios and not for quantitative model predictions [45] explains in part their lack of accuracy during the calibration and validation process, as shown in Table 4 and Table 5.
Indeed, previous research using both models resulted in low NSE and R2 in basins around the world. In American basins, the InVEST-SWY yielded R2 scores below 0.5 [76]. In Brazil, InVEST-SDR model calibration and validation accuracies were also low, with NSE < −0.3 and R2 < 0.2 [77], reinforcing the fact that those models are more suitable for qualitative applications, such as basin prioritization.
Since the main objective of the present study was the screening of effective prioritized basin areas, the model efficiency indicator was the field-check accuracy (90%), above the 85% threshold adopted as a benchmark for acceptable land-use/land-cover classification [78]. Although the number of ground control points was not too large, they were spatially distributed across the study area and land-cover classes and followed principles of probability-based sampling [79].
Furthermore, the validation workshop provided additional evidence of stakeholder compliance, a key engagement indicator of institutions and communities involved in project implementation [80]. Although the field verification and the participatory mapping workshop do not span all dimensions of prioritization accuracy and representativeness, they are independent verification processes and complementary indicators of mapping effectiveness [81].
Although the proposed methodology proved to be a useful screening tool in the Urucuia River Basin, its application to different basins should be preceded by appropriate verification [82]. Finally, the proposed multi-criteria framework is intended to support—not replace—managerial decision-making, requiring that the final area selection process considers factors that cannot be fully represented in spatial models [83], including landowner willingness to participate, land tenure, project logistics, implementation costs, and institutional priorities.
5. Conclusions
The proposed method allowed for accurate identification of prioritized restoration areas in the Urucuia Basin, using a simple and balanced multi-criteria model, in which biophysical variables were aggregated by runoff and erosion models, followed by ground-truthing and stakeholder validation.
The prioritized areas spanned all basin physiographic settings, land-use classes, and municipalities, and were associated with steep slopes, low vegetation cover/density, and highly erodible soils, which are responsible for most of the runoff and sediment generation in the basin, and where hydro-environmental services of restoration could be maximized.
Another methodological innovation was the strong stakeholder involvement in the prioritization process, both in MCM development (municipality criterion) and validation (stakeholder workshop). This is a key element in successful basin management initiatives. The selected MCM criterion thresholds were sensitive enough to generate a total prioritization area equivalent to 15 times the project restoration goal (2000 ha), providing a sufficiently large pool of candidate sites to support a subsequent selection process, subject to socioeconomic and logistical constraints, and guaranteeing project sustainability.
Although the small number of MCM criteria and their equal weights of the proposed method could be considered a limitation, by reducing the complexity of real-world conditions, model simplicity and equilibrium are often preferred in situations where data uncertainty and scarcity are present, such as in tropical basins.
Although the multi-criteria model was developed for the Urucuia River Basin, its conceptual framework is sufficiently simple and flexible to be adapted to other tropical and subtropical watersheds. However, its successful application in different basins should be preceded by calibration, field verification, and stakeholder validation to account for differences in environmental and socioeconomic conditions, land-use patterns, and restoration objectives.
Author Contributions
Conceptualization, H.M.L.C. and M.R.S.F.; methodology, H.M.L.C. and M.R.S.F.; validation, S.N. and L.C.F.d.O.; data curation, M.R.S.F.; writing—original draft preparation, review and editing, H.M.L.C.; funding acquisition and review, L.C.F.d.O. All authors have read and agreed to the published version of the manuscript.
Funding
This research was funded by Instituto Espinhaço, grant # 23106043110/2023-88.
Institutional Review Board Statement
Not applicable.
Informed Consent Statement
Not applicable.
Data Availability Statement
The original contributions presented in this study are included in the article. Further inquiries can be directed to the corresponding author.
Acknowledgments
The authors acknowledge the support of Instituto Espinhaço, Finatec, IBAMA, and the Urucuia Basin managers and stakeholders in the execution of this study. The authors have reviewed and edited the output and take full responsibility for the content of this publication.
Conflicts of Interest
Henrique Marinho Leite Chaves and Maria Rita Souza Fonseca are affiliated with the Watershed Management Lab, Forestry Dept., University of Brasilia, located at Campus Darcy Ribeiro, Asa Norte, Brasília-DF, 70910-900, and Luiz Claudio Ferreira de Oliveira and Sérgio Nésio are affiliated with Instituto Espinhaço, located at SAUS, Quadra 1, Lote 2—Building Terra Brasilia, Sala 1104, Asa Sul, Brasília-DF, 70.000-000. All the authors declare that the research was conducted in the absence of any commercial, financial, or personal relationships that could be construed as a potential conflict of interest.
Abbreviations
The following abbreviations are used in this manuscript:
| MCM | Multi-criteria model |
| SDR | Sediment delivery ratio model |
| SWY | Seasonal water yield model |
| GIS | Geographic information system |
References
- Chaves, H.M.L.; Alipaz, S. An Integrated Indicator Based on Basin Hydrology, Environment, Life, and Policy: The Watershed Sustainability Index. Water Resour. Manag. 2007, 21, 883–895. [Google Scholar] [CrossRef] [Scilit]
- Fonseca, M.R.S.; Chaves, H.M.L.; Uagoda, R.E.S. On- and off-Site Erosion Impacts of Restoration Measures in a Tropical Karst Watershed. Earth Surf. Process. Landf. 2023, 48, 1701–1711. [Google Scholar] [CrossRef] [Scilit]
- Singh, M.C.; Satpute, S.; Prasad, V. Remote Sensing and GIS-Based Watershed Prioritization for Land and Water Conservation Planning and Management. Water Sci. Technol. 2023, 88, 233–265. [Google Scholar] [CrossRef] [Scilit] [PubMed]
- Talib, A.; Randhir, T.O. Climate Change and Land Use Impacts on Hydrologic Processes of Watershed Systems. J. Water Clim. Change 2017, 8, 363–374. [Google Scholar] [CrossRef] [Scilit]
- Rogger, M.; Agnoletti, M.; Alaoui, A.; Bathurst, J.C.; Bodner, G.; Borga, M.; Chaplot, V.; Gallart, F.; Glatzel, G.; Hall, J.; et al. Land Use Change Impacts on Floods at the Catchment Scale: Challenges and Opportunities for Future Research. Water Resour. Res. 2017, 53, 5209–5219. [Google Scholar] [CrossRef] [Scilit] [PubMed]
- Edwards, D.P.; Cerullo, G.R.; Chomba, S.; Worthington, T.A.; Balmford, A.P.; Chazdon, R.L.; Harrison, R.D. Upscaling Tropical Restoration to Deliver Environmental Benefits and Socially Equitable Outcomes. Curr. Biol. 2021, 31, R1326–R1341. [Google Scholar] [CrossRef] [Scilit] [PubMed]
- Valente, R.A.; de Mello, K.; Metedieri, J.F.; Américo, C. A Multicriteria Evaluation Approach to Set Forest Restoration Priorities Based on Water Ecosystem Services. J. Environ. Manag. 2021, 285, 112049. [Google Scholar] [CrossRef] [Scilit] [PubMed]
- Orsi, F.; Geneletti, D.; Newton, A.C. Towards a Common Set of Criteria and Indicators to Identify Forest Restoration Priorities: An Expert Panel-Based Approach. Ecol. Indic. 2011, 11, 337–347. [Google Scholar] [CrossRef] [Scilit]
- Cartwright, J.H.; Shammi, S.A.; Rodgers, J.C. Use of Multi-Criteria Decision Analysis (MCDA) for Mapping Erosion Potential in Gulf of Mexico Watersheds. Water 2022, 14, 1923. [Google Scholar] [CrossRef] [Scilit]
- Kumar, D.; Dhaloiya, A.; Nain, A.S.; Sharma, M.P.; Singh, A. Prioritization of Watershed Using Remote Sensing and Geographic Information System. Sustainability 2021, 13, 9456. [Google Scholar] [CrossRef] [Scilit]
- Lemma, H.; Frankl, A.; van Griensven, A.; Poesen, J.; Adgo, E.; Nyssen, J. Identifying Erosion Hotspots in Lake Tana Basin from a Multisite Soil and Water Assessment Tool Validation: Opportunity for Land Managers. Land Degrad. Dev. 2019, 30, 1449–1467. [Google Scholar] [CrossRef] [Scilit]
- Lopes, T.R.; Moura, L.B.; Nascimento, J.G.; Fraga Junior, L.S.; Zolin, C.A.; Duarte, S.N.; Folegatti, M.V.; Santos, O.N.A. Priority Areas for Forest Restoration Aiming at the Maintenance of Water Resources in a Basin in the Cerrado/Amazon Ecotone, Brazil. J. S. Am. Earth Sci. 2020, 101, 102630. [Google Scholar] [CrossRef] [Scilit]
- Coe, M.T.; Brando, P.M.; Deegan, L.A.; Macedo, M.N.; Neill, C.; Silvério, D.V. The Forests of the Amazon and Cerrado Moderate Regional Climate and Are the Key to the Future. Trop. Conserv. Sci. 2017, 10, 1–6. [Google Scholar] [CrossRef] [Scilit]
- Resende, F.M.; Cimon-Morin, J.; Poulin, M.; Meyer, L.; Loyola, R. Consequences of Delaying Actions for Safeguarding Ecosystem Services in the Brazilian Cerrado. Biol. Conserv. 2019, 234, 90–99. [Google Scholar] [CrossRef] [Scilit]
- Jellinek, S. Using Prioritisation Tools to Strategically Restore Vegetation Communities in Fragmented Agricultural Landscapes. Ecol. Manag. Restor. 2017, 18, 45–53. [Google Scholar] [CrossRef] [Scilit]
- Halder, S.; RoyChowdhury, A.; Kar, S.; Ray, D.; Bhandari, G. Critical Watershed Prioritization through Multi-Criteria Decision-Making Techniques and Geographical Information System Integration for Watershed Management. Sustainability 2024, 16, 3467. [Google Scholar] [CrossRef] [Scilit]
- Wainaina, P.; Minang, P.A.; Gituku, E.; Duguma, L. Cost-Benefit Analysis of Landscape Restoration: A Stocktake. Land 2020, 9, 465. [Google Scholar] [CrossRef] [Scilit]
- Carver, S.J. Integrating Multi-Criteria Evaluation with Geographical Information Systems. Int. J. Geogr. Inf. Syst. 1991, 5, 321–339. [Google Scholar] [CrossRef] [Scilit]
- Diefenderfer, H.L.; Johnson, G.E.; Skalski, J.R.; Breithaupt, S.A.; Coleman, A.M. Application of the Diminishing Returns Concept in the Hydroecologic Restoration of Riverscapes. Landsc. Ecol. 2012, 27, 671–682. [Google Scholar] [CrossRef] [Scilit]
- Wang, K.; Li, S.; Zhu, Z.; Gao, X.; Li, X.; Tang, W.; Liang, J. Identification of Priority Conservation Areas Based on Ecosystem Services and Systematic Conservation Planning Analysis. Environ. Sci. Pollut. Res. 2023, 30, 36573–36587. [Google Scholar] [CrossRef] [Scilit] [PubMed]
- Esmail, B.; Geneletti, D. Multi-Criteria Decision Analysis for Nature Conservation: A Review of 20 Years of Applications. Methods Ecol. Evol. 2018, 9, 42–53. [Google Scholar] [CrossRef] [Scilit]
- Ishizaka, A.; Siraj, S. Are Multi-Criteria Decision-Making Tools Useful? An Experimental Comparative Study of Three Methods. Eur. J. Oper. Res. 2018, 264, 462–471. [Google Scholar] [CrossRef] [Scilit]
- Huang, I.B.; Keisler, J.; Linkov, I. Multi-Criteria Decision Analysis in Environmental Sciences: Ten Years of Applications and Trends. Sci. Total Environ. 2011, 409, 3578–3594. [Google Scholar] [CrossRef] [Scilit] [PubMed]
- Fernandez, J.; Maillard, O.; Uyuni, G.; Guzmán-Rojo, M.; Escobar, M. Multi-Criteria Prioritization of Watersheds for Post-Fire Restoration Using GIS Tools and Google Earth Engine: A Case Study from the Department of Santa Cruz, Bolivia. Water 2023, 15, 3545. [Google Scholar] [CrossRef] [Scilit]
- Strassburg, B.B.N.; Iribarrem, A.; Beyer, H.L.; Cordeiro, C.L.; Crouzeilles, R.; Jakovac, C.C.; Braga Junqueira, A.; Lacerda, E.; Latawiec, A.E.; Balmford, A.; et al. Global Priority Areas for Ecosystem Restoration. Nature 2020, 586, 724–729. [Google Scholar] [CrossRef] [Scilit] [PubMed]
- Zuo, L.; Gao, J.; Du, F. The Pairwise Interaction of Environmental Factors for Ecosystem Services Relationships in Karst Ecological Priority Protection and Key Restoration Areas. Ecol. Indic. 2021, 131, 108125. [Google Scholar] [CrossRef] [Scilit]
- Morales, M.V.; Valente, R.A. The Role of Spatial Criteria in Enhancing Forest Restoration Actions: A Systematic Review. iForest 2026, 19, 157–167. [Google Scholar] [CrossRef] [Scilit]
- Malczewski, J. GIS-Based Multicriteria Decision Analysis: A Survey of the Literature. Int. J. Geogr. Inf. Sci. 2006, 20, 703–726. [Google Scholar] [CrossRef] [Scilit]
- Greene, R.; Devillers, R.; Luther, J.E.; Eddy, B.G. GIS-Based Multiple-Criteria Decision Analysis. Geogr. Compass 2011, 5, 412–432. [Google Scholar] [CrossRef] [Scilit]
- Pouzols, F.M.; Toivonen, T.; Di Minin, E.; Kukkala, A.S.; Kullberg, P.; Kuustera, J.; Lehtomaki, J.; Tenkanen, H.; Verburg, P.H.; Moilanen, A. Global Protected Area Expansion Is Compromised by Projected Land-Use and Parochialism. Nature 2014, 516, 383–386. [Google Scholar] [CrossRef] [Scilit] [PubMed]
- Eyre, A.C.; Briscoe, N.J.; Harley, D.K.P.; Lumsden, L.F.; McComb, L.B.; Lentini, P.E. Using Species Distribution Models and Decision Tools to Direct Surveys and Identify Potential Translocation Sites for a Critically Endangered Species. Divers. Distrib. 2022, 28, 700–711. [Google Scholar] [CrossRef] [Scilit]
- Jia, J.; Fischer, G.W.; Dyer, J.S. Attribute Weighting Methods and Decision Quality in the Presence of Response Error: A Simulation Study; John Wiley & Sons: Hoboken, NJ, USA, 1998; Volume 5. [Google Scholar]
- Steele, K.; Carmel, Y.; Cross, J.; Wilcox, C. Uses and Misuses of Multicriteria Decision Analysis (MCDA) in Environmental Decision Making. Risk Anal. 2009, 29, 26–33. [Google Scholar] [CrossRef] [Scilit] [PubMed]
- National Water Agency Ottocoded Watersheds (Otto Levels 1–7). Available online: https://gov.br/ana/pt-br (accessed on 10 August 2026).
- Embrapa Solos. Brazilian Soil Classification System; Embrapa: Rio de Janeiro, Brazil, 2018; 395p. [Google Scholar]
- Agência Nacional de Águas e Saneamento Básico. Hidroweb: Hydrological Information System; ANA: Brasilia, Brazil, 2023. [Google Scholar]
- Corrêa, T.R.; Matricardi, E.A.T.; Filoso, S.; dos Santos, J.A.; Scariot, A.O.; Torres, C.M.M.E.; Martorano, L.G.; Pereira, E.M. Sustainability Under Deforestation and Climate Variability in Tropical Savannas: Water Yield in the Urucuia River Basin, Brazil. Sustainability 2025, 17, 8169. [Google Scholar] [CrossRef] [Scilit]
- Mata, C.L.; de Carvalho Júnior, O.A.; Ferreira De Carvalho, A.P.; Arnaldo, R.; Gomes, T.; Guimarães, R.F. Multi-Temporal Assessment of Erosion Susceptibility in the Urucuia River Basin (MG) Using the Universal Soil Loss Equation. Rev. Bras. Geomorfol. 2007, 8, 57–71. [Google Scholar]
- Teixeira, C.; Viola, M.; Coelho, G.; Avanzi, C.; Junqueira, R. Hydro-Sedimentological Dynamics of the Urucuia River, Minas Gerais. Rev. Min. Rec. Hidr. 2020, 1, 1–15. [Google Scholar]
- Wenstøp, F. Mindsets, Rationality and Emotion in Multi-Criteria Decision Analysis. J. Multi-Criteria Decis. Anal. 2005, 13, 161–172. [Google Scholar] [CrossRef] [Scilit]
- Fontana, V.; Radtke, A.; Bossi Fedrigotti, V.; Tappeiner, U.; Tasser, E.; Zerbe, S.; Buchholz, T. Comparing Land-Use Alternatives: Using the Ecosystem Services Concept to Define a Multi-Criteria Decision Analysis. Ecol. Econ. 2013, 93, 128–136. [Google Scholar] [CrossRef] [Scilit]
- Ambarwulan, W.; Nahib, I.; Widiatmaka, W.; Suryanta, J.; Munajati, S.L.; Suwarno, Y.; Turmudi, T.; Darmawan, M.; Sutrisno, D. Using Geographic Information Systems and the Analytical Hierarchy Process for Delineating Erosion-Induced Land Degradation in the Middle Citarum Sub-Watershed, Indonesia. Front. Environ. Sci. 2021, 9, 710570. [Google Scholar] [CrossRef] [Scilit]
- Chazdon, R.L.; Wilson, S.J.; Brondizio, E.; Guariguata, M.R.; Herbohn, J. Key Challenges for Governing Forest and Landscape Restoration across Different Contexts. Land Use Policy 2021, 104, 104854. [Google Scholar] [CrossRef] [Scilit]
- Krishnan, A.R. Past Efforts in Determining Suitable Normalization Methods for Multi-Criteria Decision-Making: A Short Survey. Front. Big Data 2022, 5, 990699. [Google Scholar] [CrossRef] [Scilit] [PubMed]
- Sharp, R. The Natural Capital Project. In InVEST User Guide; The Natural Capital Project: Stanford, CA, USA; Stanford University: Stanford, CA, USA; University of Minnesota: Minneapolis, MN, USA; The Nature Conservancy: Arlington, VA, USA; World Wildlife Fund: Washington, DC, USA, 2026. [Google Scholar]
- MMA Collection 2023 of the Annual Land Use Land Cover Maps of Brazil. Available online: https://brasil.mapbiomas.org/ (accessed on 4 August 2026).
- Fick, S.E.; Hijmans, R.J. WorldClim 2: New 1-Km Spatial Resolution Climate Surfaces for Global Land Areas. Int. J. Climatol. 2017, 37, 4302–4315. [Google Scholar] [CrossRef] [Scilit]
- Funk, C.; Peterson, P.; Landsfeld, M.; Pedreros, D.; Verdin, J.; Shukla, S.; Husak, G.; Rowland, J.; Harrison, L.; Hoell, A.; et al. The Climate Hazards Infrared Precipitation with Stations—A New Environmental Record for Monitoring Extremes. Sci. Data 2015, 2, 150066. [Google Scholar] [CrossRef] [Scilit] [PubMed]
- Haerter, J.O.; Eggert, B.; Moseley, C.; Piani, C.; Berg, P. Statistical Precipitation Bias Correction of Gridded Model Data Using Point Measurements. Geophys. Res. Lett. 2015, 42, 1919–1929. [Google Scholar] [CrossRef] [Scilit]
- Allen, R.G.; Pereira, L.S.; Raes, D.; Smith, M. Crop Evapotranspiration—Guidelines for Computing Crop Water Requirements—FAO Irrigation and drainage paper 56. FAO Rome 1998, 300, D05109. [Google Scholar]
- Leite Chaves, H.M.; Camargo, I.F.L.G.; Brisolla, N.; Fonseca, M.R. Effect of Pasture Restoration on Runoff, Soil Loss, and Sediment Enrichment in a Karst Basin of the Brazilian Savannah. Catena 2026, 272, 110295. [Google Scholar] [CrossRef] [Scilit]
- Fonseca, M.R.S.; Uagoda, R.; Chaves, H.M.L. Runoff, Soil Loss, and Water Balance in a Restored Karst Area of the Brazilian Savanna. Catena 2023, 222, 106878. [Google Scholar] [CrossRef] [Scilit]
- Fylstra, D.; Lasdon, L.; Watson, J.; Waren, A. Design and Use of the Microsoft Excel Solver. Interfaces 1998, 28, 29–55. [Google Scholar] [CrossRef] [Scilit]
- Chaves, H.M.L.; Montalvão, M.T.L.; Fonseca, M.R.S. Mapping Wet Areas and Drainage Networks of Data-Scarce Catchments Using Topographic Attributes. Water 2025, 17, 2298. [Google Scholar] [CrossRef] [Scilit]
- Carpenter, T.M.; Sperfslage, J.A.; Georgakakos, K.P.; Sweeney, T.; Fread, D.L. National Threshold Runoff Estimation Utilizing GIS in Support of Operational Flash Flood Warning Systems. J. Hydrol. 1999, 224, 21–44. [Google Scholar] [CrossRef] [Scilit]
- DeGasperi, C.L.; Berge, H.B.; Whiting, K.R.; Burkey, J.J.; Cassin, J.L.; Fuerstenberg, R.R. Linking Hydrologic Alteration to Biological Impairment in Urbanizing Streams of the Puget Lowland, Washington, USA. J. Am. Water Resour. Assoc. 2009, 45, 512–533. [Google Scholar] [CrossRef] [Scilit] [PubMed]
- Panagos, P.; Borrelli, P.; Poesen, J.; Ballabio, C.; Lugato, E.; Meusburger, K.; Montanarella, L.; Alewell, C. The New Assessment of Soil Loss by Water Erosion in Europe. Environ. Sci. Policy 2015, 54, 438–447. [Google Scholar] [CrossRef] [Scilit]
- Botelho, T.H.A.; Jácomo, S.d.A.; Almeida, R.T.S.; Griebeler, N.P. Use of USLE/GIS Technology for Identifying Criteria for Monitoring Soil Erosion Losses in Agricultural Areas. Eng. Agric. 2018, 38, 13–21. [Google Scholar] [CrossRef] [Scilit]
- Fournier, F. Climat et Érosion: La Relation Entre L’érosion Du Sol Par L’eau et Les Précipitations Atmosphériques; Presses Universitaires de France (PUF): Paris, France, 1960; 201p. [Google Scholar]
- Silva, A.M. Rainfall Erosivity Map for Brazil. Catena 2004, 57, 251–259. [Google Scholar] [CrossRef] [Scilit]
- Wischmeier, W.H.; Johnson, C.B.; Cross, B.V. A Soil Erodibility Nomograph for Farmland and Construction Sites. J. Soil Water Conserv. 1971, 26, 189–193. [Google Scholar]
- Cassol, E.A.; da Silva, T.S.; Eltz, F.L.F.; Levien, R. Soil Erodibility under Natural Rainfall Conditions as the K Factor of the Universal Soil Loss Equation and Application of the Nomograph for a Subtropical Ultisol. Rev. Bras. Cienc. Solo 2018, 42, e0170262. [Google Scholar] [CrossRef] [Scilit]
- Chaves, H.M.L. Uncertainty in Erosion Prediction with USLE: Impacts and Mitigation. Rev. Bras. Cienc. Solo 2010, 34, 2021–2029. [Google Scholar]
- Fernandes Filho, E.I. Soil Map of the State of Minas Gerais. Available online: https://idesisema.meioambiente.mg.gov.br/ (accessed on 20 August 2026).
- Fonseca, M.R.S.; Uagoda, R.; Chaves, H.M.L. Rates, Factors, and Tolerances of Water Erosion in the Cerrado Biome (Brazil): A Meta-Analysis of Runoff Plot Data. Earth Surf. Process. Landf. 2021, 47, 582–595. [Google Scholar] [CrossRef] [Scilit]
- Valeriano, M.M.; Rossetti, D.F. Topodata: Brazilian Full Coverage Refinement of SRTM Data. Topodata Braz. Full Cover. Refinement SRTM Data 2012, 32, 300–309. [Google Scholar] [CrossRef] [Scilit]
- Foody, G.M. Status of Land Cover Classification Accuracy Assessment. Remote Sens. Environ. 2002, 80, 185–201. [Google Scholar] [CrossRef] [Scilit]
- Mahmoody Vanolya, N.; Jelokhani-Niaraki, M.; Toomanian, A. Validation of Spatial Multicriteria Decision Analysis Results Using Public Participation GIS. Appl. Geogr. 2019, 112, 102061. [Google Scholar] [CrossRef] [Scilit]
- Nash, J.E.; Sutcliffe, J.V. River Flow Forecasting through Conceptual Models Part I—A Discussion of Principles. J. Hydrol. 1970, 10, 282–290. [Google Scholar] [CrossRef] [Scilit]
- Liu, Z.; Sang, X.; Zheng, Y.; Yan, D.; Zhang, W. Virtuous Cycle: An Idea of Water Resources Management and Top-Level Planning. Water 2022, 14, 1738. [Google Scholar] [CrossRef] [Scilit]
- Saad, S.I.; Mota da Silva, J.; Silva, M.L.N.; Guimarães, J.L.B.; Sousa Júnior, W.C.; Figueiredo, R.d.O.; Rocha, H.R.d. Analyzing Ecological Restoration Strategies for Water and Soil Conservation. PLoS ONE 2018, 13, e0192325. [Google Scholar] [CrossRef] [Scilit] [PubMed]
- Silva, E.; Naji, W.; Salvaneschi, P.; Climent-Gil, E.; Derak, M.; López, G.; Bonet, A.; Aledo, A.; Cortina-Segarra, J. Prioritizing Areas for Ecological Restoration: A Participatory Approach Based on Cost-Effectiveness. J. Appl. Ecol. 2023, 60, 1194–1205. [Google Scholar] [CrossRef] [Scilit]
- Agrell, P.J. On Redundancy in Multi Criteria Decision Making. Eur. J. Oper. Res. 1997, 98, 571–586. [Google Scholar] [CrossRef] [Scilit]
- Keisler, J.M. The Value of Assessing Weights in Multi-criteria Portfolio Decision Analysis. J. Multi-Criteria Decis. Anal. 2008, 15, 111–123. [Google Scholar] [CrossRef] [Scilit]
- Zare Bidaki, R.; Esmaeilzadeh, M.; Chaves, H.M.L. Assessing Watershed Sustainability with Automatic Expert-Based Methods and Managers’ Preferences. Sustain. Water Resour. Manag. 2023, 9, 70. [Google Scholar] [CrossRef] [Scilit]
- Scordo, F.; Lavender, T.M.; Seitz, C.; Perillo, V.L.; Rusak, J.A.; Piccolo, M.C.; Perillo, G.M.E. Modeling Water Yield: Assessing the Role of Site and Region-Specific Attributes in Determining Model Performance of the InVEST Seasonal Water Yield Model. Water 2018, 10, 1496. [Google Scholar] [CrossRef] [Scilit]
- Anjinho, P.d.S.; Barbosa, M.A.G.A.; Mauad, F.F. Evaluation of InVEST’s Water Ecosystem Service Models in a Brazilian Subtropical Basin. Water 2022, 14, 1559. [Google Scholar] [CrossRef] [Scilit]
- Wulder, M.A.; Franklin, S.E.; White, J.C.; Linke, J.; Magnussen, S. An Accuracy Assessment Framework for Large-Area Land Cover Classification Products Derived from Medium-Resolution Satellite Data. Int. J. Remote Sens. 2006, 27, 663–683. [Google Scholar] [CrossRef] [Scilit]
- Congalton, R.G. A Review of Assessing the Accuracy of Classifications of Remotely Sensed Data. Remote Sens. Environ. 1991, 37, 35–46. [Google Scholar] [CrossRef] [Scilit]
- Webster, S.E.; Donovan, E.C.; Chudoba, E.; Miller Hesed, C.D.; Paolisso, M.; Dennison, W.C. Identifying and Harmonizing the Priorities of Stakeholders in the Chesapeake Bay Environmental Monitoring Community. Curr. Res. Environ. Sustain. 2022, 4, 100155. [Google Scholar] [CrossRef] [Scilit]
- Needham, J.L.; Beazley, K.F.; Papuga, V.P. Accessing Local Tacit Knowledge as a Means of Knowledge Co-Production for Effective Wildlife Corridor Planning in the Chignecto Isthmus, Canada. Land 2020, 9, 332. [Google Scholar] [CrossRef] [Scilit]
- Zollmann, M.; Liberzon, A.; Golberg, A. Challenges in Multi-System Model Calibration and Validation. In Towards Sustainable Macroalgae Biorefineries; Springer: Cham, Switzerland, 2025; pp. 109–126. [Google Scholar]
- Kujawski, E. Multi-Criteria Decision Analysis: Limitations, Pitfalls, and Practical Difficulties. INCOSE Int. Symp. 2003, 13, 1169–1176. [Google Scholar] [CrossRef] [Scilit]

Disclaimer/Publisher’s Note: The statements, opinions and data contained in all publications are solely those of the individual author(s) and contributor(s) and not of MDPI and/or the editor(s). MDPI and/or the editor(s) disclaim responsibility for any injury to people or property resulting from any ideas, methods, instructions or products referred to in the content. |
© 2026 by the authors. Licensee MDPI, Basel, Switzerland. This article is an open access article distributed under the terms and conditions of the Creative Commons Attribution (CC BY) license.