


Abstract
Deep integration between digital and real economic sectors (hereafter DREI) has become a salient engine underpinning high-quality and environmentally sustainable growth, yet comparatively little is known about how cross-city innovation networks shape this process. Drawing on a balanced panel covering 299 Chinese prefecture-level cities over 2006–2024, this paper examines whether and how a city’s eigenvector centrality in the intercity patent cooperation network affects DREI, drawing on two-way fixed-effects regressions, parallel mediation and moderation analyses, and a spatial Durbin framework. A city’s eigenvector centrality in the intercity patent cooperation network is significantly and positively associated with DREI, and this finding survives robustness checks and an instrumental-variable endogeneity treatment using lagged network centrality. Innovation network centrality is associated with higher DREI through knowledge spillover, resource allocation, and agglomeration economies, with the agglomeration channel being the strongest. Human capital, S&T investment, and digital governance positively moderate this effect, which is more pronounced in eastern, large, and high-policy-intensity cities. Furthermore, significant spatial spillovers exist and are stronger under provincial proximity than under geographical distance, varying across economic association patterns. These findings provide empirical evidence for optimizing intercity innovation networks and advancing regional coordinated development of DREI.
1. Introduction
The deep integration of the digital and real economies (DREI) has emerged as a central engine of high-quality development and a critical lever for advancing the United Nations Sustainable Development Goals. By reconfiguring production networks, lowering transaction frictions, and accelerating green innovation, digital technologies are fundamentally altering how firms compete and how regions grow [1,2]. In China, DREI has been explicitly incorporated into national strategic planning since the 14th Five-Year Plan, rendering a systematic understanding of its driving forces, transmission channels, and geographic distribution both academically consequential and policy-relevant [3,4].
China provides a particularly valuable empirical context for three reasons. First, as the largest developing nation and the globe’s second-largest digital marketplace, China is experiencing concurrent industrial modernization and widespread digital adoption, offering a distinctive setting for examining digital–real economic synergies. Second, the substantial east–west disparity in digital infrastructure and innovation capability generates considerable interurban heterogeneity, allowing for an investigation of how network positioning and spatial externalities influence DREI across varying development stages. Third, China’s multi-level governance framework, together with national initiatives including the “Broadband China” program and the National Big Data Comprehensive Pilot Zones, creates plausibly exogenous variation useful for causal inference. Evidence from China, thus, speaks not only to the domestic policy debate but also to the broader literature on digital transformation in emerging economies.
Existing research on the drivers of DREI has predominantly concentrated on local-level determinants. One body of literature demonstrates that broadband availability and internet adoption improve productivity, employment levels, and economic output [5,6]; a separate stream investigates how informatization and firm-level digital transformation boost total factor productivity and environmental performance [1,3,7]. However, as innovation activities become increasingly coordinated across municipal boundaries, purely local explanations prove inadequate: a city’s DREI development is shaped not only by its internal resource endowments but also by its standing within wider interurban innovation networks [1,3].
Social network theory and evolutionary economic geography offer complementary lenses for these cross-regional dynamics. A node’s structural position shapes its information and resource access [8,9], and eigenvector centrality—which assigns greater weight to connections with well-connected partners—captures the degree to which a city occupies a hub position in the innovation network [10]. Cross-regional knowledge flows occur through collaborative research, personnel exchange, and inter-firm learning [11,12,13], but their conversion into local productivity gains is conditioned by absorptive capacity [14]. Concurrently, the literature identifies multiple proximity dimensions—geographic, cognitive, social, and institutional—as joint drivers of network formation and evolution [15,16]. Social network analysis has, thus, become an established methodological toolkit in economic geography [17], while new economic geography and agglomeration theory underscore how spatial concentration generates scale economies and knowledge externalities [18,19,20,21,22]. Methodologically, the spatial Durbin model (SDM) has become the standard framework for decomposing direct and indirect spatial effects [23,24,25,26].
Despite this progress, a key question remains unresolved: under which pattern of spatial association—geographic distance, provincial proximity, economic linkage, or development-level similarity—are the knowledge spillovers from innovation networks most potent? Given that digital technologies carry inherent green and low-carbon attributes [3,7], answering this question from an innovation-network perspective has direct implications for sustainable urban development. This motivation underpins the present study.
This work makes three contributions. First, it shifts the analytical lens from local endowments to cross-regional innovation networks, measuring city-level network position by eigenvector centrality derived from intercity patent cooperation data. Second, it unpacks the transmission mechanisms by identifying three parallel mediation channels—knowledge spillover, resource allocation, and agglomeration economies—and by testing a “talent–investment–governance” moderation framework that encompasses human capital, S&T expenditure, and digital governance. Third, it constructs four spatial weight matrices—geographical distance, provincial proximity, gravity-based economic linkage, and per-capita-GDP similarity—to compare spillover intensity across association patterns. Using a balanced panel of 299 Chinese prefecture-level and above cities from 2006 to 2024, this study employs two-way fixed-effects, parallel multiple-mediation, moderation, and spatial Durbin models to examine the effects, mechanisms, boundary conditions, and spatial spillovers of innovation network centrality in DREI.
2. Theoretical Analysis and Research Hypotheses
2.1. Innovation Network Centrality and Digital–Real Economy Integration
Social network theory maintains that an actor’s structural location determines the quantity, variety, and caliber of information and resources it can obtain [8,9]. Municipalities with elevated eigenvector centrality gain advantages not merely from an extensive set of direct partners but also from linkages to other highly connected hubs, creating a cumulative edge in knowledge acquisition [10,27]. This positional advantage translates into enhanced DREI through three interconnected pathways. First, hub cities intercept frontier information on digital technologies and industrial applications at an earlier stage and with greater breadth, reducing the uncertainty and experimentation costs associated with technological adoption [28]. Second, central positions confer bargaining power in the allocation of innovation resources, enabling cities to attract and concentrate digital talent, venture capital, and data factors that are essential prerequisites for DREI. Third, network centrality itself serves as a quality signal and reputation mechanism, drawing additional investment, firms, and skilled workers and reinforcing the agglomeration of innovation factors [9,17]. These three advantages are mutually reinforcing and jointly elevate urban DREI levels. Accordingly, we propose the following hypothesis:
Hypothesis 1.
A city’s eigenvector centrality in the intercity patent cooperation network is positively associated with its level of digital–real economy integration.
2.2. Mediation Effect Mechanisms
2.2.1. Knowledge Spillover Path
Knowledge spillover theory emphasizes that innovation generates significant externalities, with knowledge diffusing across regions through labor mobility, academic exchange, collaborative R&D, and product trade [11,12]. The intercity patent cooperation network institutionalizes these spillover channels, and centrally positioned cities occupy bottleneck positions in knowledge flows. Such cities also tend to possess stronger absorptive capacity, allowing them to assimilate and reconfigure external knowledge more effectively [14]. Green technology innovation—a direct output of knowledge spillover—reflects a city’s ability to convert external knowledge into tangible innovation outcomes. On the one hand, green innovation accelerates the decarbonization of energy-intensive industries, lowering the environmental footprint of the real economy [7,26]. On the other hand, the technological capabilities and learning-by-doing experience accumulated in this process provide the technical foundation for deeper integration of digital technologies with manufacturing and services, giving rise to new DREI forms such as intelligent and green manufacturing. Accordingly, we propose the following hypothesis:
Hypothesis 2a.
Innovation network centrality promotes digital–real economy integration through the enhancement of green technology innovation.
2.2.2. Resource Allocation Path
Resource-based theory contends that sustained competitive advantage stems from the identification, acquisition, and deployment of scarce, valuable, and difficult-to-imitate resources [29]. The intercity innovation network functions as a cross-regional resource-allocation platform, and hub cities can identify and mobilize network resources more efficiently than peripheral cities, thereby improving factor utilization and total factor productivity. Green total factor productivity (GTFP) incorporates energy consumption and pollutant emissions as undesirable outputs, thereby capturing the quality of growth under resource and environmental constraints [30,31]. Network centrality raises GTFP through three routes: advancing the technological frontier, shifting industrial structure toward high-tech and low-emission sectors, and improving managerial efficiency via organizational and governance innovation. Higher GTFP signifies more efficient resource allocation, which, in turn, creates a favorable environment for DREI. Accordingly, we propose the following hypothesis:
Hypothesis 2b.
Innovation network centrality promotes digital–real economy integration through the improvement of green total factor productivity.
2.2.3. Agglomeration Economy Path
Agglomeration economy theory holds that the spatial concentration of population and economic activity generates positive externalities through scale economies, knowledge spillovers, labor market pooling, and intermediate-input sharing [18,19,20]. Cities with high network centrality typically offer richer innovation opportunities, superior employment prospects, and more complete public services, making them attractive destinations for skilled migrants and raising population density and economic density [32]. Higher density facilitates DREI through three mechanisms. First, labor market pooling provides a deep and diversified talent pool—including algorithm engineers and data analysts—that reduces firms’ search and matching costs [33]. Second, density promotes face-to-face interaction and tacit knowledge exchange, creating a fertile environment for digital technology innovation. Third, larger local markets support the scaling of digital application scenarios and business model innovation, fostering platform and sharing-economy business forms. Accordingly, we propose the following hypothesis:
Hypothesis 2c.
Innovation network centrality promotes digital–real economy integration through the enhancement of agglomeration economies.
2.3. Moderating Effect Mechanisms
The preceding analysis establishes the direct effect of network centrality on DREI and its three mediation channels. However, the magnitude of this effect is not uniform across cities; it is contingent on factor endowments, innovation investment, and institutional conditions. Drawing on contingency theory, this study examines how human capital, S&T investment, and digital governance moderate the centrality–DREI relationship. To avoid mechanical correlation arising from indicator overlap, all three moderators are constructed from data sources independent of both the DREI index and the network centrality measure.
2.3.1. Moderating Role of Human Capital
Human capital is the primary carrier of digital technology creation and application. The concentration of skilled workers is both a prerequisite for digital innovation and industrial transformation and a determinant of a region’s capacity to absorb frontier knowledge spillovers. In human-capital-abundant cities, the innovation opportunities and knowledge flows unlocked by network centrality can be more effectively captured, assimilated, and applied, amplifying the DREI effect. In cities with limited human capital, favorable network positions may not translate into DREI gains. Accordingly, we propose the following hypothesis:
Hypothesis 3a.
Human capital positively moderates the relationship between innovation network centrality and digital–real economy integration.
2.3.2. Moderating Role of Science and Technology Investment
S&T investment provides the financial foundation for innovation. Government S&T expenditure addresses market failures by funding basic research and generic technologies, lowering firms’ innovation costs and risks, and catalyzing private R&D investment. In cities with high S&T investment, the knowledge spillovers and innovation opportunities generated by network centrality receive stronger financial support, accelerating the commercialization of research outputs and the deployment of digital technologies. Accordingly, we propose the following hypothesis:
Hypothesis 3b.
S&T investment positively moderates the relationship between innovation network centrality and digital–real economy integration.
2.3.3. Moderating Role of Digital Governance
Digital governance refers to the institutional arrangements through which governments deploy digital technologies to optimize public services, facilitate data-factor circulation, and regulate digital markets. A robust digital governance system reduces the institutional costs of data flows and creates an enabling environment for digital technology penetration. In cities with strong digital governance, the knowledge and resources acquired through network centrality can be converted into DREI practices more rapidly via efficient data circulation and streamlined digital government services. Accordingly, we propose the following hypothesis:
Hypothesis 3c.
Digital governance positively moderates the relationship between innovation network centrality and digital–real economy integration.
2.4. Spatial Spillover Effects
New economic geography theory emphasizes that economic activity is spatially correlated and that transport costs and factor mobility determine the strength of cross-regional spillovers [18,19]. The intercity innovation network is itself a spatial linkage mechanism, and the effect of network centrality on DREI may diffuse to other cities through knowledge diffusion, industrial linkages, labor mobility, and technology transfer. Crucially, spillover intensity depends on the pattern of intercity association: geographical proximity captures physical distance; provincial proximity reflects administrative linkages within the same province, where unified policies and lower administrative barriers facilitate coordination; and economic proximity encompasses both actual economic-flow linkages (gravity model) and development-level similarity (per-capita GDP difference). Because mobility costs and knowledge diffusion efficiency differ across these patterns, spillover intensity varies accordingly. Accordingly, we propose the following hypothesis:
Hypothesis 4.
Innovation network centrality exerts a significant positive spatial spillover effect on digital–real economy integration; the spillover is strongest under provincial proximity and differs in intensity across economic association patterns.
3. Research Design
3.1. Sample Selection and Data Sources
This study employs a balanced panel of 299 prefecture-level and above cities in China over the period of 2006–2024, yielding 5681 city–year observations. Two selection criteria are applied: first, cities with severe and persistent gaps in patent or socioeconomic data are excluded; second, cities that underwent major administrative reorganizations during the sample period and, therefore, cannot be consistently matched across years are excluded.
Data sources: Intercity patent cooperation data are retrieved from the patent retrieval system of the China National Intellectual Property Administration (CNIPA). Collaborative invention patents with applicants located in different cities are identified to construct an annual intercity patent cooperation matrix, from which eigenvector centrality and other network indicators are computed using Gephi 0.10.1. The DREI index is measured using a patent co-classification approach based on CNIPA patent data, as detailed in Section 3.2 (1) and Appendix A.1. City-level socioeconomic variables are obtained from the China City Statistical Yearbook, the China Regional Economic Statistical Yearbook, and provincial statistical yearbooks. City-level socioeconomic variables are obtained from the same sources. Per capita GDP and other price-sensitive indicators are deflated to constant 2006 prices, and actual utilized foreign direct investment is converted into RMB using the annual average exchange rate.
Treatment of missing observations: For missing values flanked by non-missing observations, linear interpolation is applied; for gaps at the beginning or end of the panel, trend extrapolation based on the three nearest adjacent observations is used. Interpolated or extrapolated values account for approximately 2.3% of the full panel, concentrated in a small number of western cities during 2006–2008. All continuous variables are winsorized at the 1st and 99th percentiles to mitigate the influence of extreme values.
3.2. Variable Definition and Measurement
- (1)
- Dependent variable: Digital–real economy integration (Dig). Following the patent co-classification approach proposed by Zhou et al. (2024) [34], this study measures DREI based on cross-industry IPC co-occurrence in patent documents. The measurement proceeds in four steps.
IPC co-occurrence matrix: For each patent application, we identify all International Patent Classification (IPC) codes listed. An IPC co-occurrence matrix P is constructed, in which element records the number of patents in which IPC codes j and k appear together.
IPC–industry mapping: Each IPC code is mapped to national economic industry categories using the Reference Table for the Correspondence between International Patent Classification and National Economic Industry Classification (2018). This mapping converts the IPC co-occurrence matrix P into an industry co-occurrence matrix R.
Industry fusion level: Within the industry co-occurrence matrix R, the fusion level between industry i and industry m is computed as the co-occurrence frequency. The diagonal elements are set to zero.
Digital–real integration: Industries are classified as either “digital industries” or “real industries” based on the Statistical Classification of the Digital Economy and Its Core Industries (2021). The DREI level for city i in year t is computed as the total number of cross-type industry pairs weighted by their fusion frequency, plus one, and then transformed by taking the natural logarithm:
where D denotes the set of digital industries, R denotes the set of real industries, and is the fusion frequency between digital industry d and real industry r in city i in year t.
Because Dig is measured as the log of patent co-occurrence counts, its value reflects the intensity of cross-industry knowledge integration embedded in patent documents rather than a normalized composite index. After winsorization at the 1st and 99th percentiles, Dig ranges from 0 to approximately 5.51.
- (2)
- Core explanatory variable: Eigenvector centrality in the intercity patent cooperation network (Eic). An annual intercity patent cooperation matrix is constructed in which element denotes the number of collaborative invention patents jointly filed by cities i and j and is zero when no collaboration occurs. For patents involving applicants from three or more cities, each city pair within the patent is counted as one cooperative tie; for example, a patent with applicants from cities A, B, and C contributes one tie to each of the AB, AC, and BC pairs. Because the matrix is symmetric, an undirected weighted network is adopted, and eigenvector centrality is computed in Gephi 0.10.1. Centrality is calculated within the full national network of all cities appearing in the CNIPA data (approximately 340 cities per year), after which the values for the 299 sampled cities are extracted. This ensures that each city’s network position reflects its connections to all Chinese cities, not merely to other sampled cities. The eigenvector centrality of city i is given by Equation (2):
In the above model, denotes the eigenvector centrality of city i, is the adjacency matrix, and λ is the largest eigenvalue of matrix . Patent data capture formal, codified innovation and may under-represent informal and service-sector innovation; nevertheless, they remain the most systematic and longitudinally comparable measure of intercity innovation linkages for a large panel of Chinese cities, and the use of invention patents ensures substantive technological cooperation.
- (3)
- Mediating variables:
- (a)
- Green technology innovation (Gia) is measured by the natural logarithm of the number of green invention patent applications plus one.
- (b)
- Green total factor productivity (GTFP) is estimated using the slacks-based measure (SBM) directional distance function combined with the Malmquist–Luenberger (ML) index, following Oh (2010) [30]. The environmental production technology is defined as , where x denotes inputs, y denotes desirable outputs, and b denotes undesirable outputs, satisfying null-jointness and weak disposability.
The SBM directional distance function is specified as
subject to and , where is the intensity variable, and , are output slacks. An output-oriented direction ( = y, = b) and variable returns to scale () are adopted.
The ML index between periods t and (t + 1) is
The ML index is converted into a cumulative level index with 2006 as the base year () and used as the mediating variable. Estimation is performed in MAXDEA Ultra 8.0.
Inputs include capital stock (perpetual inventory method, 2006 base year), year-end employed persons, and total electricity consumption. The desirable output is real GDP at 2006 constant prices. Undesirable outputs include industrial , industrial wastewater, and industrial soot and dust emissions.
- (c)
- Population density (Popd) is measured by the permanent population per square kilometer. Because population density exhibits a pronounced right-skewed distribution, its natural logarithm (lnPopd) is used in the mediation equation.
- (4)
- Moderating variables:
- (a)
- Human capital (Hum) is the ratio of higher education enrollment to permanent population. This captures the quantity of skilled labor. While it does not measure educational quality or R&D workforce composition, it is consistently available across all sampled cities and years.
- (b)
- S&T investment (Tec) is fiscal S&T expenditure as a share of total fiscal expenditure. This aggregates basic and applied research; distinguishing the two could reveal more nuanced effects and is left for future research due to city-level data constraints.
- (c)
- Digital governance (GovD) is constructed via text analysis of municipal government work reports. The full texts of annual reports for all 299 cities (2006–2024) are collected from municipal government websites and the PKU Law database, and a dictionary of 42 digital governance terms is applied. GovD is defined as the frequency of these terms divided by the report’s total word count, multiplied by 1000, and then transformed by taking the natural logarithm.
- (5)
- Control variables: Following existing studies [1,3,4], this study includes the following control variables: (a) economic development level (PGDP), measured by the natural logarithm of per capita gross regional product deflated to the base year of 2006; (b) industrial structure upgrading (Ind), measured by the ratio of tertiary industry output to secondary industry output; (c) government intervention (Gov), measured by the ratio of fiscal expenditure to GDP; (d) openness (Open), measured by the ratio of actual utilized foreign capital (converted to RMB at the average exchange rate of the corresponding year) to GDP; and (e) financial development (Fin), measured by the ratio of the loan balance of financial institutions to GDP. The descriptive statistics report the winsorized values.
- (6)
- Heterogeneity grouping thresholds: Regional heterogeneity follows the official National Bureau of Statistics classification: eastern (10 provinces/municipalities), central (six provinces), and western (12 provinces/autonomous regions). City-size heterogeneity uses the State Council’s 2014 standard [35]: cities with an urban resident population above 1 million are classified as large cities, and the remainder as small- and medium-sized cities. Policy-intensity heterogeneity is based on whether a city was designated as a “Broadband China” pilot or a national big data comprehensive pilot zone during the sample period; cities with at least one such designation are classified as high-policy-intensity.
Table 1 reports the definitions, symbols, and measurement methods of all variables employed in this study, including the dependent variable, the core explanatory variable, the mediating and moderating variables, and the control variables.
Table 1.
Variable definitions and measurements.
3.3. Descriptive Statistics and Correlation Analysis
Table 2 reports the descriptive statistics and pairwise correlations. The absolute correlation coefficients among control variables are all below 0.6, and the variance inflation factors (VIFs) are all below 10, indicating no severe multicollinearity. The correlation between Eic and Dig is 0.850 and is significant at the 1% level, providing preliminary evidence of a positive association.
Table 2.
Descriptive statistics and correlation analysis.
4. Empirical Results and Analysis
4.1. Spatial Distribution Evolution of Intercity Patent Cooperation Networks
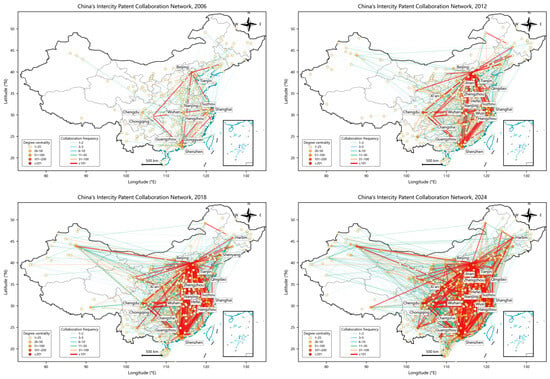
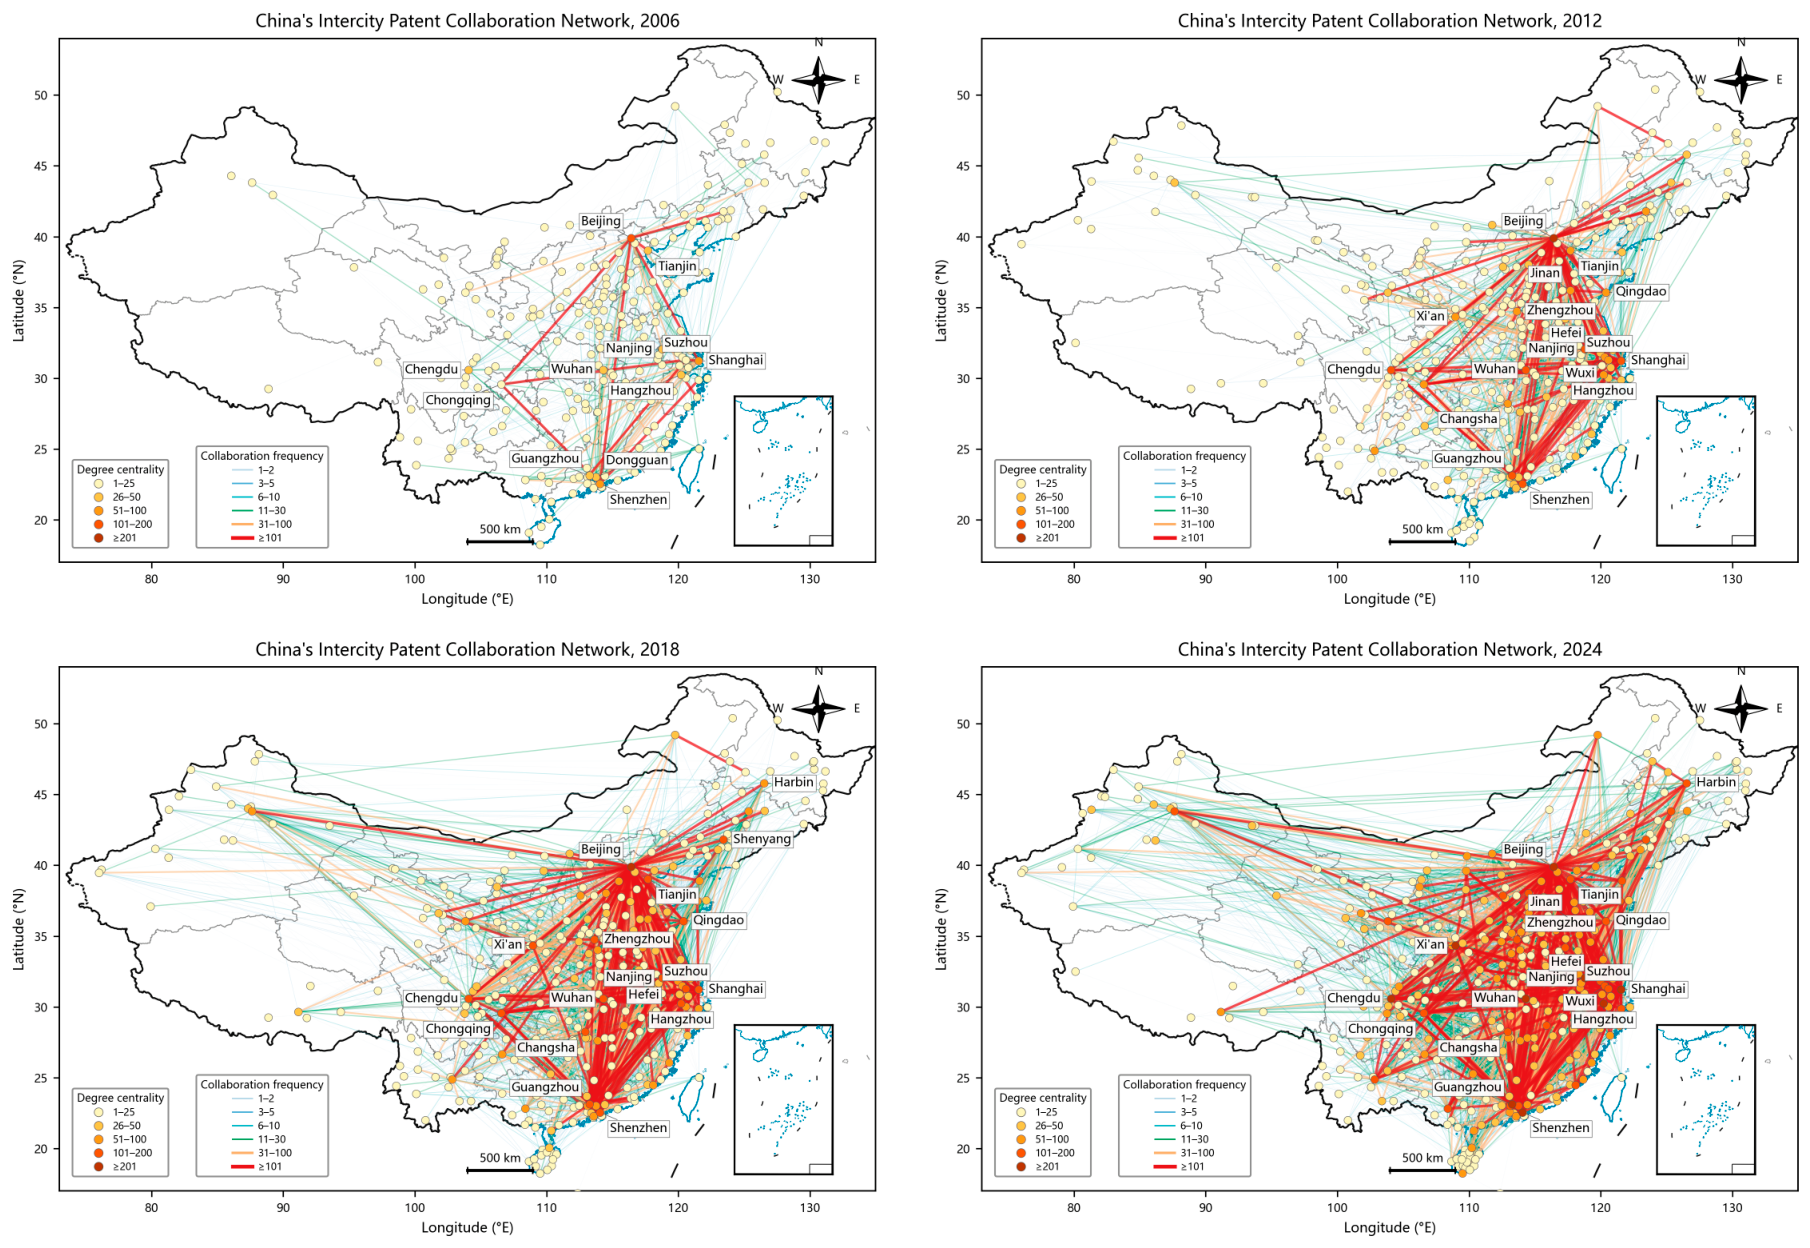
Before regression analysis, this study first examines the spatiotemporal evolution of intercity patent cooperation networks. Figure 1 depicts the networks at four time points: 2006, 2012, 2018, and 2024. Three features stand out. First, the networks have become markedly denser. In 2006, cooperative ties were sparse and concentrated among a handful of major cities; by 2024, ties had intensified substantially, forming a multi-tiered structure with core cities as hubs and urban agglomerations as carriers, reflecting the accelerating integration of regional innovation in China’s digital economy era [1,3]. Second, the spatial pattern has shifted from single-center to multi-center. In 2006, the network was dominated by eastern coastal hubs such as Beijing, Shanghai, Guangzhou, and Shenzhen, while most central and western cities lay at the periphery. Subsequently, high-centrality cities expanded into central and western regions, and the positions of regional hubs such as Chengdu, Wuhan, and Xi’an improved notably. By 2024, a multi-center pattern had emerged, with the Beijing–Tianjin–Hebei, Yangtze River Delta, and Pearl River Delta regions as cores and urban agglomerations such as Chengdu–Chongqing, the middle Yangtze River, and the Central Plains as important nodes [15,16]. Third, the networks exhibit a mixed association pattern in which proximate and long-distance interactions coexist. Geographically proximate cities maintain close ties, consistent with the facilitating role of distance in knowledge spillovers [15]; at the same time, long-distance cooperation has grown increasingly frequent, suggesting that digital technologies are eroding the geographic constraints on innovation collaboration [2,5]. These features indicate that China’s intercity innovation networks are transitioning from a core–periphery structure to a multi-center networked structure.
Figure 1.
Evolution of intercity patent cooperation networks in Chinese cities (2006–2024). Note: To improve readability in denser years (2018 and 2024), node sizes are scaled by eigenvector centrality and only edges with a weight above the 90th percentile are displayed; city labels are shown for the top 30 cities by centrality in each year.
4.2. Analysis of Benchmark Regression Results
To test the effect of intercity innovation network centrality on DREI, this study constructs a two-way fixed-effects baseline model, as shown in Equation (5):
In the above model, denotes the DREI level of city i in year t, denotes the eigenvector centrality in the intercity patent cooperation network, denotes the k-th control variable, is the city fixed effect, is the year fixed effect and is the random disturbance term. Standard errors are clustered at the city level to effectively address heteroskedasticity and serial correlation. Control variables are added sequentially to test the robustness of the results, and the baseline regression results are reported in Table 3.
Table 3.
Baseline regression results.
Table 3 reports the baseline results. In Column (1), which controls only for city and year fixed effects, the coefficient of Eic is positive and significant at the 1% level. In Columns (2)–(5), controls are added sequentially; the coefficient of Eic remains positive and significant at the 1% level and stabilizes in magnitude, indicating that the results are not driven by the choice of controls. Column (6) presents the full model, in which Eic retains a positive and significant coefficient. Among the controls, government intervention (Gov) and openness (Open) enter negatively, while financial development (Fin) is positive and significant at 1%; economic development level and industrial structure are not statistically significant. Overall, a city’s eigenvector centrality in the intercity patent cooperation network significantly promotes DREI, validating Hypothesis 1.
4.3. Mediation Effect Tests
To identify the transmission mechanisms, this study estimates a parallel multiple mediation model in which all three mediating variables—green technology innovation (Gia), green total factor productivity (GTFP), and population density (lnPopd)—enter the outcome equation simultaneously. The model is specified as follows:
where , , and denote Gia, GTFP, and lnPopd, respectively; bit is the coefficient of mediator k; is the vector of control variables with coefficients ; and and are city and year fixed effects. The specific indirect effect of channel k is , and the total indirect effect is the sum of the three specific indirect effects. The total effect satisfies .
Because the product is not normally distributed, inference is based on 1000 bootstrap resamples clustered at the city level, with bias-corrected and accelerated (BCa) 95% confidence intervals. Single-mediator estimates (each mediator entering separately) are also reported for comparison. The results are in Table 4.
Table 4.
Mediation effect test results. (A) Single-mediator models; (B) parallel multiple-mediator model.
First, the knowledge spillover path: In the single-mediator model, Eic significantly promotes Gia (coefficient = 0.312; p < 0.01), and Gia significantly promotes DREI (coefficient = 0.571; p < 0.01), with a direct effect of 2.912. The bootstrap indirect effect is 0.178 [0.116, 0.248], validating Hypothesis 2a. In the multiple-mediator model, the specific indirect effect through Gia is 0.152 [0.089, 0.228], remaining significant at the 5% level after controlling for the other two mediators.
Second, the resource allocation path: Eic significantly promotes GTFP (coefficient = 0.058; p < 0.01), and GTFP significantly promotes DREI (coefficient = 1.897; p < 0.01), with a direct effect of 2.980. The bootstrap indirect effect is 0.094 [0.021, 0.182], validating Hypothesis 2b. In the multiple-mediator model, the specific indirect effect through GTFP is 0.094 [0.021, 0.182], significant at the 5% level.
Third, the agglomeration economy path: Eic significantly promotes lnPopd (coefficient = 0.156; p < 0.01), and lnPopd significantly promotes DREI (coefficient = 3.058; p < 0.01), with a direct effect of 2.612. The bootstrap indirect effect is 0.477 [0.255, 0.746], validating Hypothesis 2c. In the multiple-mediator model, the specific indirect effect through lnPopd is 0.421 [0.203, 0.678], significant at the 1% level and the largest of the three channels.
Overall, the parallel multiple-mediator model yields a total indirect effect of 0.667 [0.398, 0.962], accounting for approximately 21.6% of the total effect (3.090). Among the three specific indirect effects, the agglomeration economy channel contributes the largest share (63.1%), followed by knowledge spillover (22.8%) and resource allocation (14.1%). All three BCa confidence intervals exclude zero, confirming that each channel operates independently even when the others are controlled for.
4.4. Moderating Effect Tests
To reduce multicollinearity and facilitate interpretation, the three moderating variables (Hum, Tec, and GovD) are mean-centered before constructing interaction terms. Under this specification, the coefficient of Eic captures the effect of network centrality when the moderator is at its sample mean, while the interaction coefficient captures the change in the marginal effect of Eic per one-unit increase in the moderator. The model is
In the above model, denotes the moderating variable, which is successively human capital (Hum), S&T investment (Tec), and digital governance (GovD), and is the interaction term whose coefficient reflects the direction and magnitude of the moderating effect. The test results are reported in Table 5.
Table 5.
Moderating effect test results.
Table 5 reports the moderating effects. In Column (1), the coefficient of Eic × Hum is 4.848 and significant at 1%, indicating that higher human capital strengthens the DREI effect of network centrality, validating Hypothesis 3a. The marginal effect of Eic is approximately 1.355 in low-human-capital cities and rises to 3.106 in high-human-capital cities. In Column (2), the coefficient of Eic × Tec is 28.231 and significant at 1%, validating Hypothesis 3b; the marginal effects are 1.913 and 2.877 for low- and high-S&T-investment cities, respectively. In Column (3), the coefficient of Eic × GovD is 1.254 and significant at 1%, validating Hypothesis 3c; the marginal effects are 1.585 and 3.130 for low- and high-digital-governance cities, respectively.
Overall, all three dimensions of the “people–funds–governance” framework significantly and positively moderate the effect of innovation network centrality on DREI, thereby constituting an organically coordinated support system in which human capital serves as the intellectual subject, S&T investment as the financial guarantee, and digital governance as the institutional environment. Notably, after mean-centering, the main effects of Eic in the three models are 2.230, 2.395, and 2.357, respectively, all of which are significantly positive at the 1% level, consistent with the baseline regression. Furthermore, the marginal effects of network centrality are significantly positive at both low and high levels of the moderating variables, and only the intensity increases with the moderating level; this pattern is more robust and economically plausible than a scenario in which the effect is effective only at high levels of the moderator.
4.5. Endogeneity Tests
Although the baseline regression controls for two-way fixed effects, reverse causality and omitted variables may still induce endogeneity. This study uses the one-period lagged eigenvector centrality (L1.Eic) as the instrumental variable for Eic. The relevance condition is satisfied: the first-stage Kleibergen–Paap rk Wald F statistic is 1678.6, far exceeding the 10% critical value for weak-instrument tests. The exclusion restriction rests on the predetermined nature of the lagged network position—the patent cooperation network formed in year t − 1 cannot be retroactively affected by current DREI—and is further supported by city and year fixed effects and a full set of time-varying controls. This is a predetermined-instrument approach rather than a quasi-natural experiment, and the IV results are interpreted as supportive evidence rather than definitive causal identification.
Table 6 reports the FE-2SLS estimates. The coefficient of Eic is 4.593 and significant at 1%, larger than the baseline FE estimate (3.090), consistent with measurement-error-induced attenuation bias in OLS/FE. Since the model is exactly identified, the Hansen J test is not applicable; instrument validity is supported by the theoretical arguments above.
Table 6.
Endogeneity test results.
4.6. Robustness Checks
The robustness of the baseline conclusions is tested in six dimensions: alternative measurement of the core explanatory variable, lagged explanatory variable, exclusion of special samples, exclusion of special years, shortened sample period, and alternative winsorization. The results are reported in Table 7.
Table 7.
Robustness check results.
As shown in Table 7, the coefficient of Eic remains positive and significant at the 1% level across all six checks. Specifically, replacing eigenvector centrality with degree centrality (Deg) yields a coefficient of 0.017; lagging Eic by one period yields 3.047; excluding the four municipalities (Beijing, Shanghai, Tianjin, and Chongqing) yields 3.086; excluding the pandemic year 2020 yields 3.041; shortening the sample to 2010–2024 yields 3.143; and re-estimating with variables winsorized at the fifth and 95th percentiles yields 3.122. The consistency of these results confirms that the promoting effect of innovation network centrality on DREI is not sensitive to variable measurement, sample composition, or extreme-value treatment.
4.7. Heterogeneity Analysis
Given China’s pronounced regional imbalances, the relationship between innovation network centrality and DREI may vary across cities [1,3]. This study examines heterogeneity in three dimensions: geographical location, city size, and policy intensity [32,33]. The results are in Table 8.
Table 8.
Heterogeneity analysis results.
First, regional heterogeneity: Using eastern cities as the baseline, interaction terms of Eic with central and western city dummies are constructed to test group differences formally. The coefficient of Eic in eastern cities is 3.951 (p < 0.01). The difference between central and eastern cities is −0.781 and not significant, while the difference between western and eastern cities is −2.284 and significant at 1%. Thus, the promoting effect is comparable between eastern and central cities and significantly stronger in both than in western cities. This is consistent with absorptive capacity theory [14]: eastern cities possess a solid digital economy foundation, abundant human capital, and mature institutions, enabling them to convert network knowledge into DREI more efficiently, whereas western cities are constrained by gaps in digital infrastructure and human capital.
Second, city-size heterogeneity: Using small- and medium-sized cities as the baseline, the coefficient of Eic is 1.126 (p < 0.01), and the difference between large and small- and medium-sized cities is 2.798 (p < 0.01), indicating that the DREI effect is significantly stronger in large cities. Large cities benefit from greater agglomeration scale, richer digital application scenarios, and denser innovation factors, allowing the knowledge spillover and resource allocation advantages of network centrality to be more fully released through economies of scale and scope. Small- and medium-sized cities also benefit from network connections, but their effects are more limited due to market-size and factor-reserve constraints.
Third, policy-intensity heterogeneity: Using low-policy-intensity cities as the baseline, the coefficient of Eic is 2.306 (p < 0.01), and the difference between high- and low-policy-intensity cities is 1.452 (p < 0.01), indicating a significantly stronger effect in high-policy-intensity cities. A well-developed policy environment reduces the transaction costs and uncertainty of innovation activities and provides institutional guarantees for factor agglomeration and flow. Talent policies, S&T investment policies, and digital infrastructure policies form a combination of supply-side, environmental, and demand-side instruments. Through the coordinated support of “talent–investment–governance” policies, high-policy-intensity cities more fully release the DREI potential of innovation networks. This result corroborates the moderation findings and jointly indicates that internal factor endowments and institutional environments are key conditions for transforming innovation network effects.
5. Spatial Spillover Effect Analysis
5.1. Construction of Spatial Weight Matrices
To avoid the contingency of results derived from a single weight matrix, this study constructs four row-standardized spatial weight matrices for the SDM estimation.
(1) Geographical distance weight matrix (): Based on city longitudes and latitudes, the spherical distance between cities is computed, and the weight is set as the reciprocal of distance, so that shorter distances receive higher weights. To alleviate collinearity from an overly dense matrix, weights for city pairs more than 300 km apart are set to zero. Diagonal elements are zero, and the matrix is row-standardized.
(2) Provincial proximity weight matrix (): If cities i and j belong to the same province, then ; otherwise, . The diagonal elements are set to zero, and the matrix is row-standardized. This matrix characterizes the associations induced by provincial administrative boundaries and reflects the reality of policy coordination within provinces and lower barriers to factor mobility.
(3) Gravity-model economic linkage weight matrix (): Reflects actual economic flow linkages between cities. The calculation formula is shown in Equation (9):
In the above model, and denote the gross regional products of cities i and j, and denotes the spherical geographical distance between them. The matrix is row-standardized after construction.
(4) Inverse per capita GDP difference economic proximity weight matrix (): Characterizes economic proximity from the perspective of the similarity of economic development levels. The calculation formula is shown in Equation (10):
where and denote the per capita GDP of cities i and j, respectively. The smaller the absolute difference in per capita GDP between two cities, the higher the weight assigned. To avoid division by zero, a small positive constant (equal to 1% of the sample mean of per capita GDP) is added to the absolute difference. The diagonal elements are set to zero, and the matrix is row-standardized.
(5) The spatial Durbin model: To test the spatial spillover effects, this study constructs the SDM based on each of the four spatial weight matrices [24,25,26].
The SDM is specified as follows:
Regarding temporal variation, W1 (geographical distance) and W2 (provincial proximity) are time-invariant matrices constructed from city coordinates and provincial administrative boundaries. W3 (gravity-model economic linkage) and W4 (per-capita-GDP similarity) are constructed using annual GDP and per capita GDP data, respectively, and are, therefore, time-varying.
5.2. Spatial Autocorrelation Tests
Before estimating the SDM, spatial autocorrelation of DREI and network centrality is tested. Table 9 reports the global Moran’s I indices based on the four weight matrices. During the sample period, the global Moran’s I values of both DREI (Dig) and network centrality (Eic) are significantly positive across all four matrix settings [36], indicating significant spatial agglomeration in both variables and justifying the use of spatial econometric models.
Table 9.
Global Moran’s I tests.
Furthermore, Lagrange multiplier (LM) tests for spatial dependence are conducted on the residuals of the panel fixed-effects model without spatial terms [37]. Table 10 reports the LM test results. Under all four matrices, both the LM-lag and LM-error statistics are significant at the 1% level, indicating the simultaneous presence of spatial lag and spatial error dependence. Since the SDM incorporates both the spatial lag of the dependent variable and the spatial interaction terms of the explanatory variables , it nests both the spatial autoregressive (SAR) and spatial error (SEM) models and can capture the two types of spatial dependence identified above. The SDM is, therefore, adopted as the baseline spatial specification.
Table 10.
LM tests for spatial dependence (panel fixed-effects residuals).
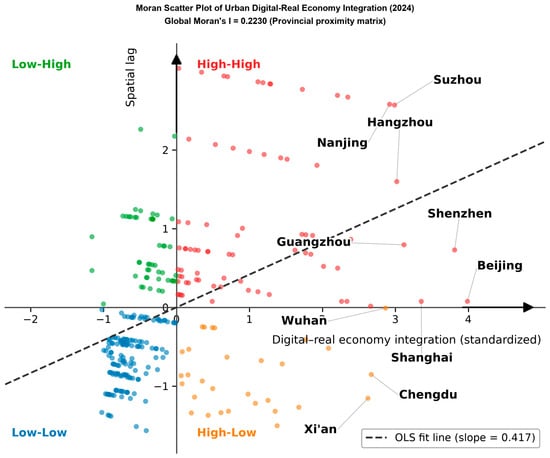
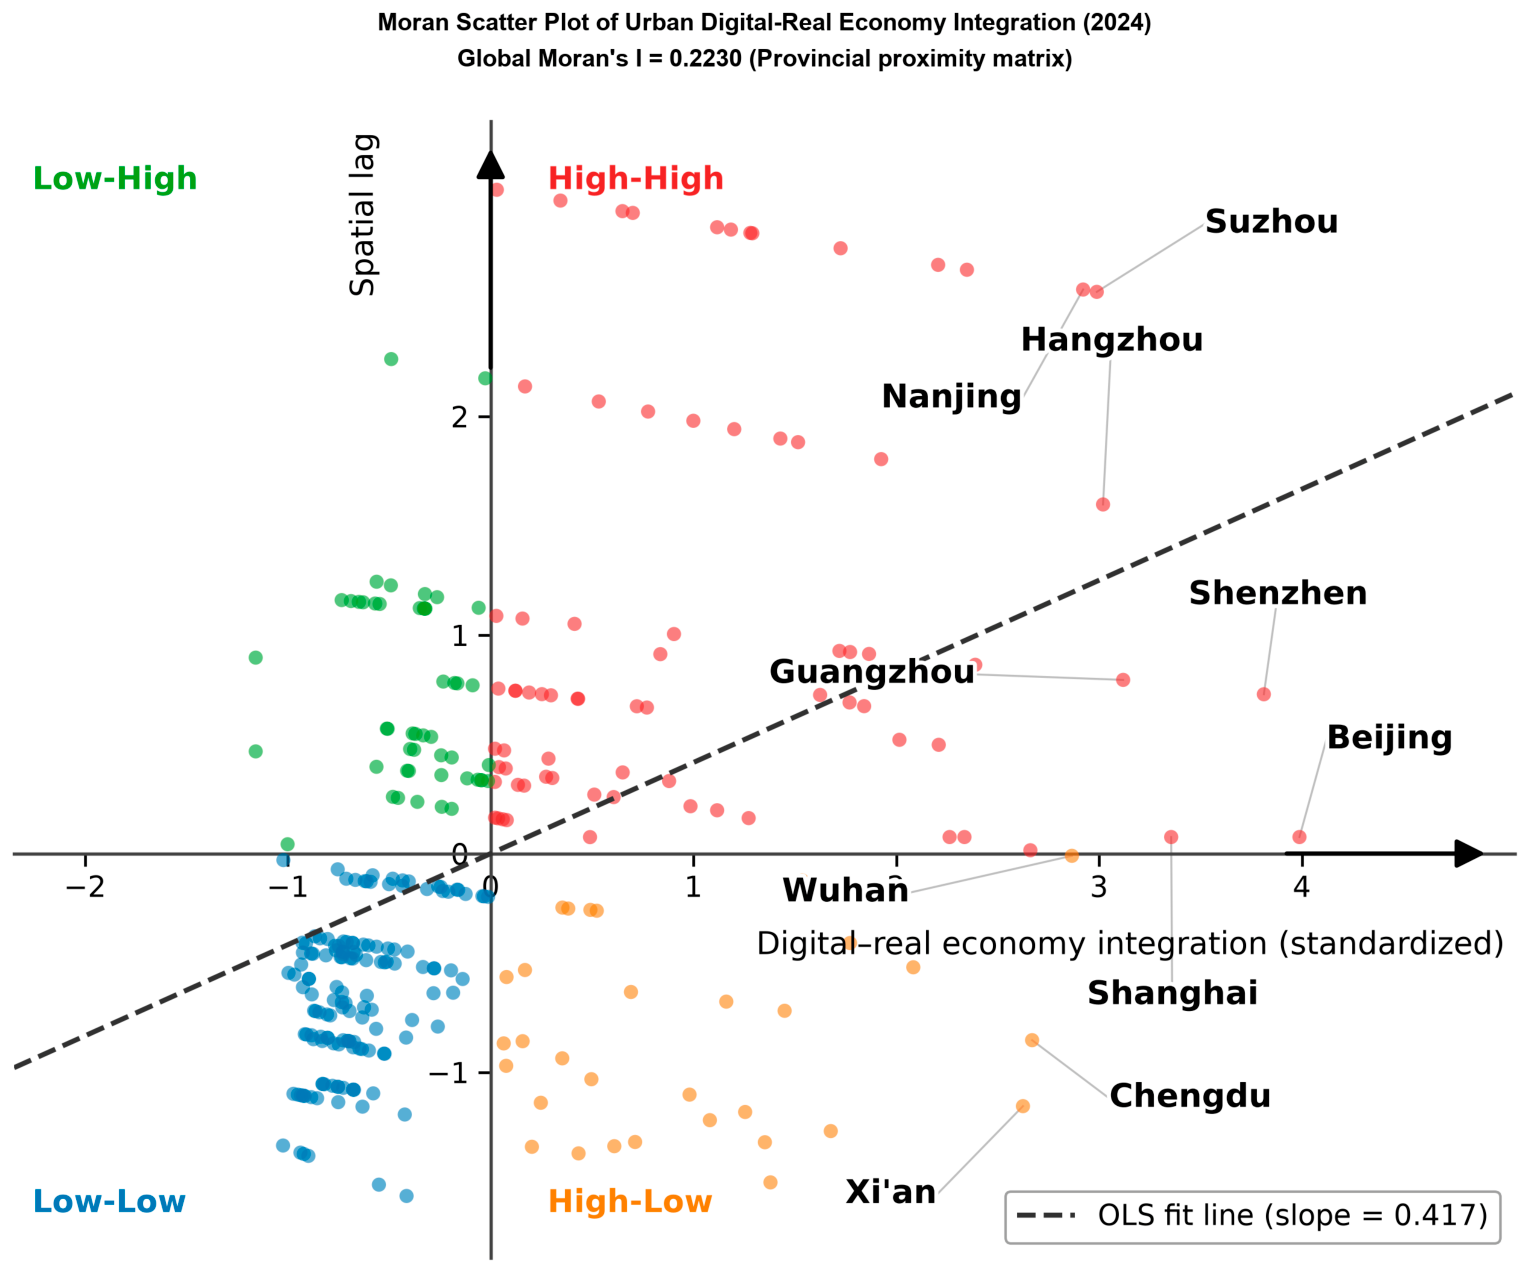
Figure 2 presents a Moran scatter plot for the DREI levels of cities in 2024, based on the provincial proximity weight matrix W2. The horizontal axis denotes the standardized DREI level of each city, and the vertical axis denotes its spatial lag term: the weighted average of neighboring cities’ DREI levels. The four quadrants have clear economic meanings: the first quadrant (high–high) indicates that a city’s own DREI and its neighbors’ DREI are both high, while the third quadrant (low–low) indicates that both are low; together, these constitute positive spatial autocorrelation clusters. The second (low–high) and fourth (high–low) quadrants represent negative spatial associations. As shown in Figure 2, most cities fall in the first and third quadrants—approximately 75 high–high and 143 low–low cluster cities—whereas the high–low and low–high quadrants contain approximately 31 and 50 cities, respectively. This pattern indicates significant same-type clustering among both high- and low-DREI cities. The global Moran’s I is 0.223 and is significantly positive at the 1% level (based on 999 permutation tests), further confirming significant positive spatial autocorrelation and supporting the necessity of spatial econometric models.
Figure 2.
Moran scatter plot of urban digital–real economy integration levels in 2024.
5.3. Spatial Spillover Effect Results
As shown in Table 11, several findings emerge. First, under all four matrix settings, the direct effects of Eic are significantly positive at the 1% level, indicating that network centrality promotes DREI within the city itself while also generating spatial spillovers [38]. Second, the magnitude of indirect spillover effects differs across association patterns: the indirect effect is largest under the provincial proximity matrix (W2), followed by the geographical distance matrix (W1), the gravity-based economic linkage matrix (W3), and finally the per-capita-GDP similarity matrix (W4), under which the indirect effect is the smallest and statistically insignificant. The strongest spillovers under provincial proximity indicate that, in China’s institutional context, unified industrial innovation policies, lower cross-city administrative barriers, and convenient intra-provincial factor mobility amplify the spillover dividends of innovation networks. Geographical proximity ranks second, confirming that spatial distance remains an important channel for knowledge spillovers [15]. The gravity-based economic linkage matrix ranks third, reflecting that genuine economic exchanges between cities also transmit innovation knowledge spillovers, albeit more weakly than pure geographical proximity in this sample. The insignificance of W4 suggests that development-level similarity alone—measured by the inverse per-capita-GDP gap—does not generate strong innovation network spillovers; rather, cross-city knowledge diffusion relies more on administrative coordination, geographical proximity, and actual economic linkages than on mere convergence in income levels. Third, the spatial autoregressive coefficients are significantly positive under W1, W2, and W3, indicating that DREI itself exhibits significant spatial agglomeration and that neighboring cities mutually reinforce each other’s DREI development.
Table 11.
Decomposition results of spatial spillover effects.
Overall, the spatial spillovers of intercity innovation networks on DREI result from the joint action of geographical conditions, provincial administrative institutions, and urban economic linkages. From a policy perspective, promoting DREI should not focus solely on individual cities; instead, attention should be paid to intra-provincial urban collaborative innovation and to leveraging the radiation roles of central cities.
6. Discussion
6.1. The Effect of Network Centrality on Digital–Real Economy Integration
This study finds that eigenvector centrality in the intercity patent cooperation network is significantly and positively associated with DREI, a conclusion that remains robust after multiple checks and endogeneity treatments. Consistent with network locational advantage theory [8,9] and prior evidence on network centrality and regional innovation [15,17], our contribution lies in linking network positional advantages to the sustainability theme of DREI: hub cities convert network knowledge into digital industrialization and industrial digitalization through the triple advantages of information acquisition, resource control, and signaling, indicating that a city’s structural position in the innovation network is itself an important driver of DREI.
6.2. The Relative Importance of Transmission Mechanisms
The parallel multiple-mediator model shows a total indirect effect of 0.667, accounting for approximately 21.6% of the total effect. Among the three specific channels, the agglomeration economy path contributes the largest share (0.421, 63.1% of the total indirect effect), followed by knowledge spillover (0.152, 22.8%) and resource allocation (0.094, 14.1%). The dominance of the agglomeration channel is consistent with agglomeration economies theory [20,21]: in a field heavily dependent on talent and market size, population and economic agglomeration provide the infrastructure and demand conditions essential for releasing network effects, echoing the logic of creative destruction in structural economic evolution [39].
6.3. Moderating Conditions and Heterogeneity
Human capital, S&T investment, and digital governance all positively moderate the DREI effect of network centrality, which is more pronounced in eastern, large, and high-policy-intensity cities. This supports the contingency logic that knowledge opportunities can be converted into DREI practices only when cities possess matching talent reserves [32,33], S&T investment, and digital institutional environments, and is consistent with absorptive capacity theory [14]. The policy implication is twofold: innovation networks serve both as a tool for developed regions to reinforce existing advantages and as a feasible pathway for less developed regions to pursue digital catch-up and green transformation, provided that gaps in digital capacity and human capital are addressed [3,7].
6.4. Differences in Spatial Spillovers Across Association Patterns
Spillovers are strongest under provincial proximity (W2), followed by geographical distance (W1), gravity-model economic linkage (W3), and per-capita-GDP similarity (W4), under which the spillover is not significant. This ordering suggests that spillover intensity depends primarily on administrative institutional coordination and geographical proximity, while genuine economic linkages play a secondary role and mere development-level similarity is insufficient to generate detectable spillovers [15,16]. This finding qualifies the common view that “economic proximity usually outweighs geographical proximity”. In the Chinese context, provincial administrative linkages and physical distance jointly shape the spatial pattern of innovation spillovers, whereas convergence in per capita income alone does not appear to be a sufficient channel for cross-city knowledge diffusion.
7. Conclusions and Policy Implications
7.1. Research Conclusions
Using panel data of 299 prefecture-level and above cities in China from 2006 to 2024, this study examines the effects, mechanisms, spatial spillovers, and heterogeneity of intercity innovation network centrality on DREI. The main conclusions are as follows.
First, a city’s eigenvector centrality in the intercity patent cooperation network is significantly and positively associated with DREI, and this conclusion remains valid after robustness checks and an instrumental-variable endogeneity treatment using one-period lagged network centrality.
Second, innovation network centrality is associated with higher DREI through knowledge spillover, resource allocation, and agglomeration economies. The parallel multiple-mediator model shows that all three channels exert significant specific indirect effects, with a total indirect effect of 0.667 accounting for approximately 21.6% of the total effect; the agglomeration economy channel is the strongest.
Third, human capital, S&T investment, and digital governance all positively moderate the positive association of innovation network centrality on DREI, and the marginal effects are significantly positive at both low and high levels of the moderators, suggesting that the DREI effect of innovation networks depends on the coordinated support of talent, investment, and digital institutions.
Fourth, significant spatial spillovers exist and vary across association patterns: they are strongest under provincial proximity (W2), followed by geographical distance (W1) and gravity-model economic linkage (W3), whereas the spillover under per-capita-GDP similarity (W4) is not significant, indicating that administrative coordination and geographical proximity promote cross-city knowledge diffusion more effectively than mere economic linkages or similar development levels.
Fifth, this positive association is more pronounced in eastern, large, and high-policy-intensity cities, corroborating the moderation findings. Eastern and large cities should leverage their radiation roles, while central and western cities and small- and medium-sized cities should strengthen digital capacity and human capital to improve absorption efficiency while integrating into innovation networks.
It should be noted that the static spatial model captures average effects over the sample period and does not distinguish short-run from long-run dynamic effects; examining the lag structure within a dynamic spatial framework is an important direction for future research.
7.2. Policy Implications
Based on the above conclusions, this study proposes five policy recommendations.
First, optimize the layout of intercity innovation networks. At the national level, governments should design cross-provincial innovation cooperation frameworks—inter-provincial innovation corridors, joint R&D funds, and cross-regional IP protection agreements—to reduce institutional costs. Central and western cities should integrate into the national network through industry–university–research cooperation, “innovation enclave” models (R&D branches in eastern hubs with localized production), and technology transfer centers. Rather than competing directly with hub cities, peripheral cities should identify niche technological fields, build specialized innovation nodes, and leverage network spillovers to upgrade their digital and industrial bases.
Second, strengthen the coordinated support of human capital, S&T investment, and digital governance. Local governments should increase investment in higher education and vocational training, raise the share of fiscal S&T expenditure, and accelerate digital government construction to reduce the institutional costs of data-factor flows, thereby maximizing the DREI effect of innovation networks.
Third, leverage spatial spillovers to promote coordinated development. Given that spillovers are strongest under provincial proximity, provincial governments should establish intra-provincial innovation coordination platforms—joint laboratories, talent rotation, and coordinated industrial planning—to facilitate knowledge diffusion from capitals to surrounding cities. For western and small cities with weaker centrality, the priority is to build “reception capacity”—basic digital infrastructure, a minimum threshold of human capital, and absorptive capacity—so they can effectively capture spillovers rather than remain passive recipients. Cross-provincial channels should also be cultivated through megalopolis strategies (e.g., the Chengdu–Chongqing economic circle) to extend spillovers beyond provincial boundaries.
Fourth, implement differentiated policies to improve policy precision. Central and western cities and small- and medium-sized cities should use innovation network integration as a lever and fill gaps in human capital and digital governance, whereas eastern and large cities should emphasize innovation quality and the depth of DREI while leveraging their radiation roles to promote green and low-carbon transformation.
Fifth, the findings offer transferable lessons for other developing economies. For enterprises in Asia and South America, actively embedding in cross-city innovation networks—rather than relying solely on in-house R&D—can accelerate digital transformation, provided that absorptive capacity is built first. For policymakers, the Chinese experience highlights two strategies: (i) establishing regional innovation coordination platforms to leverage administrative proximity spillovers, relevant for countries with strong subnational governments (e.g., India, Brazil, and Indonesia); (ii) targeting digital infrastructure and talent programs in lagging regions to prevent “digital islands.” These lessons are timely as developing economies accelerate digital transformation under fiscal constraints.
Author Contributions
Conceptualization, Z.L. and M.L.; methodology, Z.L.; software, M.L.; validation, Z.L.; formal analysis, Z.L.; investigation, M.L. and Z.Z.; resources, Z.L.; data curation, M.L. and Z.Z.; writing—original draft preparation, Z.L.; writing—review and editing, M.L. and Z.Z.; visualization, M.L. and Z.Z.; supervision, Z.L.; project administration, Z.L.; funding acquisition, Z.L. All authors have read and agreed to the published version of the manuscript.
Funding
This research was funded by the Postgraduate Science and Technology Innovation Project of Capital University of Economics and Business, grant number 2026KJCX003.
Institutional Review Board Statement
Not applicable.
Informed Consent Statement
Not applicable.
Data Availability Statement
Data are available upon request from the authors.
Conflicts of Interest
The authors declare no conflicts of interest.
Appendix A
Appendix A.1
The DREI index is constructed using a patent co-classification approach following Zhou et al. (2024) [34]. The procedure involves the following:
- IPC co-occurrence matrix construction: From all patent applications in the sample, identify all IPC codes listed on each patent document. Construct a co-occurrence matrix where each element records the number of patents in which two IPC codes appear together.
- IPC–industry mapping: Map each IPC code to national economic industry categories using the Reference Table for the Correspondence between International Patent Classification and National Economic Industry Classification (2018) issued by the National Bureau of Statistics.
- Industry classification: Classify industries as digital or real based on the Statistical Classification of the Digital Economy and Its Core Industries (2021). Digital industries include four major categories: digital product manufacturing, digital product services, digital technology application, and digital factor-driven industries.
- DREI calculation: Compute the total fusion frequency between digital and real industries for each city in each year. Take the natural logarithm of one plus this total to obtain the Dig index.
Data source: China National Intellectual Property Administration (CNIPA) patent database.
Appendix A.2
The 42-term dictionary used to construct the digital governance variable (GovD) is organized into five categories as follows.
Category 1: Digital Government and E-Government (10 terms)
1. Digital government; 2. E-government; 3. government digital transformation; 4. government online services; 5. online government services; 6. smart government; 7. government transparency; 8. government data openness; 9. administrative efficiency; and 10. government informatization.
Category 2: Big Data, Cloud Computing, and Data Infrastructure (10 terms)
11. Big data; 12. cloud computing; 13. data sharing; 14. data open platform; 15. data resource; 16. data governance; 17. data security; 18. digital infrastructure; 19. cloud platform; and 20. data center.
Category 3: Smart City and Digital Economy (10 terms)
21. Smart city; 22. digital economy; 23. digital transformation; 24. intelligent manufacturing; 25. industrial internet; 26. internet+; 27. digital village; 28. E-commerce; 29. online retail; and 30. platform economy.
Category 4: Internet+ Government Services and Public Services (7 terms)
31. Internet+ government services; 32. internet+ administration; 33. one-stop service; 34. online approval; 35. administrative convenience; 36. digital public services; and 37. smart services.
Category 5: Digital Regulation and Data Compliance (5 terms)
38. Digital regulation; 39. platform regulation; 40. algorithmic governance; 41. digital rights; and 42. data compliance.
Note: The dictionary was validated by two independent coders with an inter-coder agreement rate of 0.91 (Cohen’s kappa). All term frequencies were extracted from municipal government work reports using text analysis.
References
- Goldfarb, A.; Tucker, C. Digital Economics. J. Econ. Lit. 2019, 57, 3–43. [Google Scholar] [CrossRef] [Scilit]
- Sturgeon, T.J. Upgrading Strategies for the Digital Economy. Glob. Strategy J. 2021, 11, 34–57. [Google Scholar] [CrossRef] [Scilit]
- Zhao, P.; Guo, J.; Wang, Y. How Does the Digital Economy Affect Green Development? Evidence from 284 Cities in China. Sustainability 2023, 15, 11596. [Google Scholar] [CrossRef] [Scilit]
- Brynjolfsson, E.; Hitt, L.M. Beyond Computation: Information Technology, Organizational Transformation and Business Performance. J. Econ. Perspect. 2000, 14, 23–48. [Google Scholar] [CrossRef] [Scilit]
- Czernich, N.; Falck, O.; Kretschmer, T.; Woessmann, L. Broadband Infrastructure and Economic Growth. Econ. J. 2011, 121, 505–532. [Google Scholar] [CrossRef] [Scilit]
- Hjort, J.; Poulsen, J. The Arrival of Fast Internet and Employment in Africa. Am. Econ. Rev. 2019, 109, 1032–1079. [Google Scholar] [CrossRef] [Scilit]
- Porter, M.E.; van der Linde, C. Toward a New Conception of the Environment-Competitiveness Relationship. J. Econ. Perspect. 1995, 9, 97–118. [Google Scholar] [CrossRef] [Scilit]
- Granovetter, M.S. The Strength of Weak Ties. Am. J. Sociol. 1973, 78, 1360–1380. [Google Scholar] [CrossRef] [Scilit] [PubMed]
- Burt, R.S. Structural Holes: The Social Structure of Competition; Harvard University Press: Cambridge, MA, USA, 1992. [Google Scholar]
- Bonacich, P. Power and Centrality: A Family of Measures. Am. J. Sociol. 1987, 92, 1170–1182. [Google Scholar] [CrossRef] [Scilit] [PubMed]
- Jaffe, A.B. Real Effects of Academic Research. Am. Econ. Rev. 1989, 79, 957–970. [Google Scholar]
- Audretsch, D.B.; Feldman, M.P. R&D Spillovers and the Geography of Innovation and Production. Am. Econ. Rev. 1996, 86, 630–640. [Google Scholar]
- Powell, W.W.; Koput, K.W.; Smith-Doerr, L. Interorganizational Collaboration and the Locus of Innovation: Networks of Learning in Biotechnology. Adm. Sci. Q. 1996, 41, 116–145. [Google Scholar] [CrossRef] [Scilit]
- Cohen, W.M.; Levinthal, D.A. Absorptive Capacity: A New Perspective on Learning and Innovation. Adm. Sci. Q. 1990, 35, 128–152. [Google Scholar] [CrossRef] [Scilit]
- Boschma, R. Proximity and Innovation: A Critical Assessment. Reg. Stud. 2005, 39, 61–74. [Google Scholar] [CrossRef] [Scilit]
- Balland, P.-A.; Boschma, R.; Frenken, K. Proximity and Innovation: From Statics to Dynamics. Reg. Stud. 2015, 49, 907–920. [Google Scholar] [CrossRef] [Scilit]
- Ter Wal, A.L.J.; Boschma, R.A. Applying Social Network Analysis in Economic Geography: Framing Some Key Analytic Issues. Ann. Reg. Sci. 2009, 43, 739–756. [Google Scholar] [CrossRef] [Scilit]
- Krugman, P. Increasing Returns and Economic Geography. J. Polit. Econ. 1991, 99, 483–499. [Google Scholar] [CrossRef] [Scilit] [PubMed]
- Fujita, M.; Krugman, P.; Venables, A.J. The Spatial Economy: Cities, Regions, and International Trade; MIT Press: Cambridge, MA, USA, 1999. [Google Scholar]
- Glaeser, E.L.; Kallal, H.D.; Scheinkman, J.A.; Shleifer, A. Growth in Cities. J. Polit. Econ. 1992, 100, 1126–1152. [Google Scholar] [CrossRef] [Scilit]
- Moretti, E. The Effect of High-Tech Clusters on the Productivity of Top Inventors. Am. Econ. Rev. 2021, 111, 3328–3375. [Google Scholar] [CrossRef] [Scilit]
- Rigby, D.L.; Roesler, C.; Kogler, D.; Boschma, R.; Balland, P.-A. Do EU Regions Benefit from Smart Specialisation Principles? Reg. Stud. 2022, 56, 2058–2073. [Google Scholar] [CrossRef] [Scilit]
- Estrin, S.; Hu, Y.; Shapiro, D.; Zhang, P. Agglomeration Costs Limit Sustainable Innovation in Cities in Developing Economies. PLoS ONE 2024, 19, e0308742. [Google Scholar] [CrossRef] [Scilit] [PubMed]
- Gu, B.; Liu, J.; Ji, Q. The Effect of Social Sphere Digitalization on Green Total Factor Productivity in China: Evidence from a Dynamic Spatial Durbin Model. J. Environ. Manag. 2022, 320, 115946. [Google Scholar] [CrossRef] [Scilit] [PubMed]
- Lyu, Y.; Wang, W.; Wu, Y.; Zhang, J. How Does Digital Economy Affect Green Total Factor Productivity? Evidence from China. Sci. Total Environ. 2023, 857, 159428. [Google Scholar] [CrossRef] [Scilit] [PubMed]
- Zhang, X.; Xu, F. Environmental Regulation and Spatial Spillover Effect of Green Technology Innovation: An Empirical Study on the Spatial Durbin Model. Sustainability 2023, 15, 14133. [Google Scholar] [CrossRef] [Scilit]
- Barabási, A.-L.; Albert, R. Emergence of Scaling in Random Networks. Science 1999, 286, 509–512. [Google Scholar] [CrossRef] [Scilit] [PubMed]
- Gambardella, A. Private and Social Functions of Patents: Innovation, Markets, and New Firms. Res. Policy 2023, 52, 104718. [Google Scholar] [CrossRef] [Scilit]
- Barney, J.B.; Ketchen, D.J.; Wright, M. Bold Voices and New Opportunities: An Expanded Research Agenda for the Resource-Based View. J. Manag. 2021, 47, 1677–1689. [Google Scholar] [CrossRef] [Scilit]
- Oh, D.-H. A Global Malmquist-Luenberger Productivity Index. J. Prod. Anal. 2010, 34, 183–197. [Google Scholar] [CrossRef] [Scilit]
- Jiang, H.; Jiang, P.; Wang, D.; Wu, J. Can Smart City Construction Facilitate Green Total Factor Productivity? A Quasi-Natural Experiment Based on China’s Pilot Smart City. Sustain. Cities Soc. 2021, 69, 102862. [Google Scholar] [CrossRef] [Scilit]
- Combes, P.-P.; Duranton, G.; Gobillon, L. The Identification of Agglomeration Economies. J. Econ. Geogr. 2011, 11, 253–266. [Google Scholar] [CrossRef] [Scilit]
- Wang, J.; Tian, Z.; Sun, Y. Digital Economy, Employment Structure and Labor Share. Sustainability 2024, 16, 9584. [Google Scholar] [CrossRef] [Scilit]
- Zhou, M.; Wang, L.; Guo, J. Measuring and Spatiotemporal Comparison of Digital–Real Economy Integration in the Context of New Quality Productive Forces: A Patent Co-Classification Approach. J. Quant. Technol. Econ. 2024, 41, 5–27. [Google Scholar]
- Guo Fa [2014] No. 51; Notice of the State Council on Adjusting the Standards for the Classification of City Sizes. The State Council of the People’s Republic of China: Beijing, China, 2014.
- Moran, P.A.P. Notes on Continuous Stochastic Phenomena. Biometrika 1950, 37, 17–23. [Google Scholar] [CrossRef] [Scilit]
- Anselin, L.; Bera, A.K.; Florax, R.; Yoon, M.J. Simple Diagnostic Tests for Spatial Dependence. Reg. Sci. Urban Econ. 1996, 26, 77–104. [Google Scholar] [CrossRef] [Scilit]
- LeSage, J.; Pace, R.K. Introduction to Spatial Econometrics; CRC Press: Boca Raton, FL, USA, 2009. [Google Scholar]
- Aghion, P.; Antonin, C.; Bunel, S. The Power of Creative Destruction: Economic Upheaval and the Wealth of Nations; Harvard University Press: Cambridge, MA, USA, 2021. [Google Scholar]

Disclaimer/Publisher’s Note: The statements, opinions and data contained in all publications are solely those of the individual author(s) and contributor(s) and not of MDPI and/or the editor(s). MDPI and/or the editor(s) disclaim responsibility for any injury to people or property resulting from any ideas, methods, instructions or products referred to in the content. |
© 2026 by the authors. Licensee MDPI, Basel, Switzerland. This article is an open access article distributed under the terms and conditions of the Creative Commons Attribution (CC BY) license.