


Abstract
This research aims to explore the difference in perceptions of transport modes between suburban and urban residents of the Quebec City region (Canada). Additionally, the study aims to compare its findings with those from three Swiss cities (Lausannne, Geneva and Bern), where a similar questionnaire was administered. This research involved a survey conducted among the population of the Quebec City Metropolitan Region, using an adapted and localized version of the Swiss questionnaire. The survey was administered to a statistically representative online panel (n = 1243) and was stratified between urban and suburban respondents. Findings indicate that, while urban residents held a generally positive view of automobiles, this perception was less favorable compared to that of suburban residents. Both urban and suburban residents exhibited similar perceptions regarding public transit. However, urban residents regarded bicycles as a practical mode of transportation while suburbanites did not. In contrast to their European counterparts in Swiss cities, residents of the Quebec City region displayed a markedly more favorable perception of the automobile and a less favorable perception of public transit and cycling.
1. Introduction
The relationship between the built environment and commuting behavior is well known in the literature. There is a broad consensus that population density and retail employment density [1,2] are linked to shorter commutes. Equally, it is well understood in the literature that urban dwellers are less prone to using a private automobile than their suburban counterparts [3,4,5]. However, few studies [6,7,8], even fewer published in English [9,10,11], have addressed the relation between the built environment and the perception of different transport modes. Schwanen et al. [9,11] explored the relationship between individuals’ preferences of neighborhoods and their travel behaviors. Zhu et al. [3] explored the willingness of Chinese commuters to engage in sustainable commuting and their actual commuting behaviors, but their study does not address how each mode of transportation is perceived. In the French-language literature, Kaufmann and Munafò [7,8] and Carpentier [12] have explored the difference in the perception of transport modes between central neighborhoods and suburban neighborhoods in France, Switzerland, and Luxembourg. Carpentier, in 2005 [12], found that there was no measurable difference in the perception of cars and public transit between urban residents and suburban residents.
Little is known about whether a difference in perceptions between urban and suburban neighborhoods is present in the North American context. Mobility patterns in Canada and the United States are sometimes different from Western Europe [13]. A large part of Western European countries’ residents live in a densely developed urban environment built before the age of the automobile and which is more conducive to sustainable mobility; fuel prices are notoriously higher in Europe than North America; and Western Europeans’ strong governments are more active in the public realm and more prone to subsidizing public transit [13]. Also, Carpentier’s research [12], published in 2005, predates the rise of telecommunication mobile technology, with the widespread use of smart phones and teleworking. Society’s perception of public transit is likely to have changed since then, thanks the widespread use of smart phones, mobile internet and computers. Time spent in public transit is now widely used for leisure activities and work [6].
This research project aims at bridging this gap in the literature by exploring the difference in perception between suburban and urban residents and comparing perceptions of various transport modes between North America and Western Europe. For this research, in the Quebec City Metropolitan Region (QCMR), residents were polled (n = 1243) to understand their mobility behaviors and their perceptions regarding different modes of transportation (cars, buses, bicycles, trains, Quebec City tramway project). Our research also aims to provide comparable data with Switzerland, where a similar questionnaire was also used.
Transit project costs run at a record high in North America [14]. This adversely affects social acceptability. Therefore, gaining social acceptability and public support or sustainable mobility transition projects (like a region’s first modern tram line) will require that policy makers tailor their public communications to specific audiences. This will require better understanding of how different demographics perceive cars, public transit and bicycles, and which arguments in favor of sustainable mobility might resonate with whom. This research helps by giving a glimpse of the difference in perception of travel modes between urban and suburban residents and providing further understanding of the difference in perceptions of transport modes for urban and suburban dwellers.
1.1. Context
For this paper, we chose QCMR as a typical case study of a car-dependent medium-sized North American city. This could come as a surprise, from an outsider’s perspective visiting the highly walkable old Quebec City. However, outside of its small and dense historical core, Quebec City is a typical widespread North American city with a vast network of highways connecting its suburbs with the city center. Its density (1214 persons/km2) [15] is as low as what one would expect from most post-war North American cities. For comparison, Detroit (1594 persons/km2 [16]) and Houston (1249 persons/km2) [17], both car-oriented cities, have a population density somewhat comparable to QCMR. On the other hand, cities in Europe generally have a higher density of population per square/km2. Geneva and Bern were surveyed for their residents’ perception of transport modes using the same survey method and have a much higher population density of 13,094 persons/km2 [18] and 2845 persons/km2, respectively [19]. QCMR is heavily car-dependent, with 78.3% of all trips made by car [20]. This high proportion is, again, as high as most North American cities of its size. For comparison, 76% of Americans commute by car to work [21].
It should also be noted that, even though French-speaking Quebecers share many cultural aspects with their European French counterparts, QCMR has a car culture closer to North America than Europe. For the past decades, Quebec City municipal officials have tried to change the face of the city’s car dependency with a sustainable mobility project known as Structural Public Transit Network (Réseau structurant de transport en commun in French). A 19 km tramway project running downtown and connecting major activity destinations will be the centerpiece of the project. At the same time, the provincial government supports projects geared toward an increase in the road capacity of the region. Coalition Avenir Québec (CAQ), the majority-holding elected party in the province, plans to build a highway bridge over the Saint-Lawrence River connecting the two shores of the metropolitan area. The Third link (as it is referred to in QCMR) is representative of a “sprawl as usual” [22] pattern of urbanization, where highways connect downtown with its suburbs, with cars being the favored mode of transportation [23].
This conflicting view of QCMR’s future mobility landscape is shared by its residents, with two sides opposing one another strongly [22]. On one side, a coalition stands in favor of a vision of “sprawl as usual” [22], with the car as the main mode of transportation, while another coalition supports a sustainable mobility agenda [24]. Moreover, the social and cultural context of the QCMR is unique in that some popular broadcast media are highly hostile to any sustainable mobility projects. Confrontational conservative radio stations play a key role in the political opposition to major public transportation projects in the QCMR [22,25,26]. In 2018, CHOI Radio X had 249,000 daily listeners [27]. This means that 29.8% of the population of the QCMR regularly listens to confrontational conservative radio stations. Such radios have also played a key role in supporting the Third link highway project since its inception. In this regard, QCMR’s highly polarized media environment is reflected in its residents’ perception of transport modes in general, with the car being very favorably viewed in the QCMR, making it a particularly interesting location to study transport mode perceptions.
1.2. Literature Review
Our literature review explores how different transportation modes are perceived and how these perceptions influence mobility behaviors. It also considers the built environment and its influence on transport mode perceptions, and finally, the differences in transport mode perceptions and mobility behaviors between urban and suburban residents.
Regarding perceptions of the car, in the past two decades, social scientists have explored the car as a social object [28]. Many emphasize its role not only as a practical tool but also as a status symbol and an affective object [29]. The car is perceived in its practical aspect, i.e., speed, reliability, flexibility, or cost, but also as a status symbol for one to express social status, aspirations, and values [29]. Cars can influence one’s mood (e.g., is thrilling, exciting and relaxing) [29]. Ratan [30] argues that cars are an avatar of an individual expressing their desired identity and social relations and/or as a utilitarian tool.
Walker et al. [31] explored the normative perception of cars, noting that individuals’ perceptions of negative impacts of cars are shaped by their omnipresence in society. They introduced the concept of “motonormativity”, describing it as the widely shared unconscious assumption that car-based transportation must continue to be the default way to move, connected with a positive bias for car-based mobility, obfuscating its negative repercussions [31]. They observed that, when applied to car’s negative impacts, individuals “suspend the ethical and moral judgements that would apply in other contexts” (p. 4). Their study, based on a comprehensive British survey, revealed that individuals were more accepting of car-related pollution compared to cigarette smoke and less lenient regarding auto theft than theft of other belongings. They also observed greater tolerance for health and safety risks associated with delivery drivers compared to other professions, and for alcohol-related harms compared to car-related harms [31], attesting the important role that perceptions of transport mode (i.e., the cars) can play.
People who walk or take the train to work are, on average, the happiest commuters, cyclists come close third. People who drive are noticeably less satisfied than any of those three modes. And people who take the metro or the bus are the least satisfied of all, with the bus finishing at the very bottom [32,33,34]. According to St-Louis et al. [33], transport modes that are more affected by external factors are associated with lower satisfaction. Modes that are perceived as having a value other than reaching a destination are more positively perceived [33]. Active commutes are seen a more “healthy” by respondents [33].
The literature indicates that perceptions of transport modes are predictive of mobility behaviors, although the built environment appears to be a more robust predictor of transportation choices. Joireman et al. [35] found that individual preferences of transportation mode were predictive of their actual mode of commuting. Van Bekkum et al. [36,37] discovered that individuals’ perceptions of cycling, including perceived benefits, influenced their decision to cycle to work. Negm & El-Geneidy [38] observed that individuals who perceive walking as suitable make roughly 15% more trips on foot, and those who perceive public transit as suitable make roughly 10% more trips by transit. Mehdizadeh & Kroesen [39] showed that perceived-mode accessibility shapes behavior even more than stated preferences. Perception appears especially decisive for public transport, where it consistently shapes both use and stated preferences, unlike cars and bicycles [39]. Positive attitudes toward walking and cycling are similarly associated with higher active-transport use and lower car use [40]. Van Lierop et al. [41] observed that public transit users that have a positive image of public transit are more likely to be long-term users of public transit.
There is substantial evidence in the transportation literature that urban form, i.e., the built environment, significantly influences travel behaviors and commuters’ choice of transport mode. Suburban residents have on average a higher vehicle kilometers traveled (VKMs) compared to those residing in central neighborhoods and are more inclined to use automobiles [5]. In Washington D.C., Zhu et al. [2]. demonstrated that the built environment accounts for 65% of the variance in commute mode choice, making it a critical determinant in commuting mode choice [3]. Equally, various studies have noted that the built environment, both perceived by individuals [42,43] and observed aspects of the built environment [11], affect commuting behaviors. Zhu et al. [3] attribute this influence to the greater distance between suburban neighborhoods and central business districts (CBDs), where most urban employment is concentrated. In San Francisco, Cervero and Gorham [44] found that the main characteristics of suburban areas that foster car dependency were a low density of activities, less grid-like street patterns compared to downtown neighborhoods, limited public transit options and a pervasive auto-oriented design. In Montreal metropolitan area, likewise, Chen and Akar [1] observed that sociodemographic factors had a minimal impact on an individuals’ commuting distances compared to their residential location. In Luxembourg, Carpentier’s [12] research revealed that urban residents had fewer cars per household than their suburban counterparts. Carpentier attributes this difference to the limited parking options in central neighborhoods, better public transit options and closer walking destinations [12] (a finding also supported by Vale and Pereira [45]).
Regarding the effect of the built environment on perceptions of transport modes, Berry and al. [46] found that urban residents had a more favorable perception of walking compared to rural residents. Hatamzadeh [47] found that, as distances increase, individuals’ willingness to walk decreased, but individuals who preferred walking tended to perceive distances as shorter. Horning et al. [48] found in a similar way that perceived walking distances, the distance individuals estimate they walk to reach their destination, varied based on the respondent’s neighborhood characteristics. In Taiwan, Chang & Chang [49] found that urban students perceived fewer difficulties cycling to school compared to suburban counterparts. The English-language literature does not extensively address the differences in perceptions of public transit between urban and suburban residents; however, in California, Holian and Khan [50] found that suburbanization diminishes voter support for public transit investments among both Republican and Democrat voters. The authors credit this difference in approval to higher usage of the new public transit infrastructures by urban dwellers compared to suburbanites, and a perceived increase in house values for urban respondents [50]. Van Soest et al. [51] measured transport perceptions across four neighborhoods in Birmingham, UK, with different degrees of income deprivation and public transport provision. They found that respondents with no public transport available had a less positive perception of walking and a much less positive perception of buses. The number of bus departures within 1 km of a respondent’s home has a negative influence on being positive about car driving [51].
Schwanen et al. [52] explored if a lack of congruence between physical neighborhood structure and an individual’s preferences regarding land use near one’s home location affected distance traveled and the choice of mode of transportation. The authors note that individuals have preferences for certain neighborhood characteristics (e.g., density, proximity to amenities, etc.) and that a lack of congruence between these preferences and their actual living situation can influence their travel patterns. They found that an individual’s preferences for their neighborhood were predictive of their choice of transportation mode and distance traveled. For example, individuals living in a dense urban built environment but preferring to live in a suburban built environment were more likely to opt for a car and to travel longer distances; vice versa, individuals with preferences for an urban built environment but living in a suburban neighborhood traveled less by car. However, the authors note that the built environment had a stronger influence than individual preferences. Furthermore, they found that individuals living in an urban center preferring a suburban built environment were more likely to drive than a dissonant suburban resident was to use public transit and active transportation. This finding stresses the fact that suburban neighborhoods lock their residents in a car dependency and leave them few options apart from automobile transportation, no matter what their preferences are. On the other hand, central neighborhoods allow their residents to use their preferred mode, including the car. These findings underscore the dominant role of neighborhood built environment in shaping an individual’s choice of transportation, prior to considering individuals’ perceptions and preferences in terms of mobility.
Regarding the difference in perception of transport modes between suburban residents and urban residents, Chen et al. [10] found that urban residents were more familiar with sustainable commuting and were more willing to maintain their sustainable commute habits. However, their findings based in China are hardly indicative for QCMR, for Asian cities have a very different built environment than North American cities. Kaufmann et al. [6] and Carpentier [12], whose works are published in French, investigated the social representations of various modes of transportation in Europe.
In 2005, in Luxembourg, Carpentier [12] found no significant difference between urban and suburban residents in their perceptions of cars as “fast”, “flexible” and “comfortable”. However, urban residents were more likely to perceive cars as “expensive”, “stressful” and “dangerous”, resulting in a less favorable view compared to suburban residents. Carpentier concludes that “the perception of cars in densely populated areas is more built from the negative side and adds up to a less flattering perception of cars than the one prevailing in suburban areas” (our translation). The bus, on the other hand, was generally perceived a “slow” and “restrictive”, although this view was more common among suburban residents. The bus is also perceived as more “ecological” in densely populated areas. Carpentier [12] concluded that the overall difference in perception of cars and buses was not statistically significant different between urban and suburban residents.
2. Methods
This research project aims to survey a representative sample of the population of the QCMR (Figure 1) in order to create a knowledge base about Quebec City Metropolitan Region residents’ perceptions of the region’s transportation challenges and projects. It also aims to provide comparable data with Switzerland, where a similar questionnaire was also used in three cities. In this paper, we define transport mode perception as a subjective evaluation of a given mode based on Kaufmann et al.’s [53] methodology, in which the survey respondents are asked to choose three adjectives from a list of 26 adjectives, half being positive and half being negative. Using vocabulary to measure subjective perceptions of transport modes has also been used with an open form approach by van Soest [51], while Vasquez-Henriquez et al. [54] used psycho-linguistic lexicon inquiry and word count on public Twitter messages to inquire into differences in perception of transport modes across genders. Our use of a predefined list of adjectives allows us to compare our data with that of previous surveys in three Swiss cities (Bern, Geneva and Lausanne).
Figure 1.
Map of Quebec City Metropolitan Region (QCMR).
Using a local survey firm’s panel, a representative sample of the QCMR population was surveyed using an adapted and localized version of the Swiss questionnaire. Table 1 shows a descriptive overview of the QCMR sample. SPSS statistical software version 31 was used to perform cross-table analysis of the survey answers using Pearson chi-square tests to identify statistical correlations between variables. When we mention a difference between both samples of respondents, the p-value is therefore inferior to 0.05 and hence statistically significant. In this paper, a p-value ranging from 0.002 to 0.05 is referenced with a single asterisk (*). A highly statistically significant p-value will be characterized by two asterisks (**), with a p-value of ≤0.002. Finally, we characterized the most significant p-value results ≤ 0.001 by three asterisks (***).
Table 1.
Sample structure of the 2023 QCMR survey.
The questionnaire developed by the research team of the Lemanic Panel for Monitoring the Sustainability of Practices, led by Professor Vincent Kaufmann, is adjusted to generate locally relevant data that can also be shared and compared with data from the study conducted in Switzerland. Table 2 sums up the demographic characteristic of a sample of the Swiss survey (n = 4986). Data collection for the Swiss survey was conducted between 3 October 2018 and December 31 of the same year, for Geneva, and summer 2019 for Lausanne and Bern. Table 2 shows an overview of the Swiss sample.
Table 2.
Sample structure of the 2018 Swiss survey.
Although QCMR differs substantially from Geneva, Lausanne, and Bern in the governance structures underpinning their public transit systems, in the density and subsidization of that supply, and in aggregate levels of wealth, this divergence is analytically productive rather than an obstacle to comparison. Robinson [55], drawing on Pickvance [56], argues that comparing “most different” cases need not presuppose that similar outcomes are produced by a single universal cause; instead, such comparisons open onto a logic of plural causality, in which comparable or divergent perception of transport modes among QCMR and Swiss respondents could stem from entirely distinct configurations of governance, infrastructure, and wealth particular to each context. Comparing QCMR with Geneva, Lausanne, and Bern is therefore not an attempt to hold transit systems constant while isolating a single explanatory variable, but an opportunity to examine how differently structured governance regimes, built environment and levels of resourcing give rise to convergent or divergent perceptions of transport modes. This approach has already produced valuable insights in the context of mobility research, as illustrated by Gauer et al. [57], whose comparison of Canadian and German respondents, two contexts diverging sharply in car ownership, urban density, and transit adoption, identified both shared and country-specific predictors of interest in shared, automated, and electric mobility.
Each respondent had to choose three adjectives from a list of 26 adjectives (13 positives, and 13 negatives) for different modes of transportation: car, bicycle, walking, bus, trains and Quebec City tramway project. The positive adjectives were: inexpensive, comfortable, eco-friendly, vital, practical, predictable, fast, autonomous, relaxing, quiet, healthy, safe and useful. The negative adjectives were: loud, expensive, restrictive, dangerous, tiring, unpredictable, uncomfortable, useless, slow, harmful, unpractical, polluting and unnecessary. For each mode of transportation, we created an aggregated mean of perception by creating an average of positive adjectives selected by respondent. For example, we found that our QCMR sample had a rather positive view of cars, with 91.7% of adjectives selected for cars being positives. The opposite was true: only 8.3% of the adjectives selected were negative for the car. The calculations excluded responses for which the respondent did not select three options as required.
We then split the whole QCMR sample in two groups: one urban, with the participants living in the borough of La Cité-Limoilou, and a suburban group for the rest of the sample. As shown in Figure 1, La Cité-Limoilou is the central urban borough of the QCMR. To differentiate urban and suburban residents, we have associated only this central borough as our urban group for lack of access to a more granular indicator of urbanity. This is the borough with the highest population density, with 4888 persons/km2 compared to 1020 persons/km2 for the rest of the metropolitan region (excluding La Cité-Limoilou) [58]. From now on, we will characterize the La Cité-Limoilou respondent group as the urban group (12.1% of the entire sample; n = 151) and the rest of the respondents as the suburban group (87.9% of the entire sample; n = 1092).
Demographically, in the QCMR sample, the urban group is like the rest of the sample in every regard except in terms of educational attainment. It is observed that the urban group, on average, has achieved a higher level of education compared to the suburban respondents*. Also, both groups show different vehicle ownership rates, i.e., the number of vehicles owned by respondents (see Table 3).
Table 3.
Number of cars as declared per respondent, in the QCMR.
On average, urban respondents own fewer vehicles per household. The average vehicle ownership rate for urban residents is 1.34 vehicles per household compared to 1.66 vehicles per household for the suburban group. For comparison, the average number of cars per household in Canada, 1.49 cars per household [59], is somewhere in the middle. In Switzerland, in Geneva, there are 1.14 cars per household on average, 1.17 in Lausanne and 0.93 in Bern [53].
Both groups are also different in the average of respondents in possession of a driving license. Urban respondents are less likely to have a driving license. A total of 93.1% of suburban respondents said they had a regular driving license compared to 87.3% of urban respondents; 5% of suburban respondents did not have a driving license compared to 11.3% of urban respondents. Finally, more urban respondents reported having a bicycle (66.9%) compared to suburban respondents (61.1%).
Knowing that the Pearson chi-square test alone is insufficient, we tested and confirmed the validity of our analysis with various statistical tests. One of the Pearson chi-square test’s weaknesses is that it has a large-sample approximation that breaks down with sparse cells. This is why we tracked empty-cell rates against Cochran’s 20% threshold. Reporting deviance alongside Pearson provides a methodological cross-check, since the two statistics are computed differently yet should converge on the same conclusion. An overall fit test was needed to confirm predictors improved on a baseline, while the test of parallel lines (evaluated at the more conservative α = 0.01, given our large sample’s tendency to over-reject) verified that the proportional odds assumption held, as advised by Williams et al. [60]. Finally, since none of these tests indicate explanatory strength, the Nagelkerke pseudo-R2 was also performed to see how much variance the model actually explains. Together, these five checks address distinct blind spots (sparsity, convergence, baseline improvement, structural validity, and explanatory magnitude) that the Pearson test alone cannot detect. Table A1 and Table A2 in Appendix A present the results of statistical tests made in order to counter-validate our Pearson chi-square test. We did not employ additional statistical tests for the perception of buses in regard to urbanity, as its p-value was not significant (p = 0.166 above p < 0.05 threshold).
For the Swiss data, the sample was also divided in two between suburban and urban boroughs. The choice of suburban boroughs in the Swiss dataset was based on population density of boroughs and spatial dependence to the urban core. For Geneva, Carouge, Lancy, Meyrin, Onex, and Vernier were classified as suburban. In the case of Lausanne and Bern, their respective suburban municipalities were classified as such, in accordance with the categorization used by the Swiss Federal Statistical Office at the municipal level.
3. Results
3.1. Difference in Perception of Transport Modes Between Urban and Suburban Residents
Our results show that, unsurprisingly, the car is the most favorably perceived mode of transport for both the urban and suburban respondents (Table 4). This especially holds true for the suburban respondents, who classified the car most favorably, with a score of 94.4%. Across the sample, the bicycle is the second most favorably perceived mode. For the suburban respondents, the gap between the car and the bicycle is 19.9%, whereas for urban respondents the gap in perception is only 1.6%. This difference in the perception gap between the two modes indicates that, while cars and bicycles are perceived relatively similarly by urban residents, cars hold a markedly more favorable position among suburban residents when compared to all other transport modes. Overall, options of public transit are perceived much less favorably by the whole sample. However, public transit (bus) and the Quebec City tramway project were both rated somewhat more positively by urban respondents (61.2% vs. 54%, and 53% vs. 44.2%, respectively), whereas interurban rail perceptions were nearly identical across both groups.
Table 4.
Average perception of transport modes by types of respondents.
Overall, car and bicycle showed the largest urban–suburban gaps in transport mode perception, both marked as statistically significant (*). Although we found a difference in the perception of buses between urban and suburban respondents (54% urban vs. 61.2% suburban), the difference between the two groups was not statistically significant (p > 0.05). Table 4 reports the average share of positive adjectives selected by suburban and urban respondents for each transport mode.
Statistically significant associations were observed for several variables, although their prevalence varied across transportation modes. Age and driving license ownership were significantly associated with perceptions of all three modes. In contrast, several associations were mode-specific. For example, urbanity status influenced perceptions of cars and bicycles, but not buses, while parental status was associated with differences in the perceptions of buses and bicycles, but not cars. Education was significantly associated with bicycle perception only, whereas self-reported health was associated with car perception only. Table 5 below presents the results of the chi-square tests, examining the associations between sociodemographic and mobility-related characteristics and perceptions of cars, buses, and bicycles.
Table 5.
QCMR sample Pearson chi-square tests: p-values from chi-square tests examining the associations between sociodemographic and mobility-related characteristics and perceptions of cars, buses, and bicycles.
We validated our chi-square tests using multiple statistical tests; several models showed diagnostic issues warranting caution. Overall results indicate that models are fit for interpretation, as shown in Table A1 and Table A2 in the Appendix A. However, for the first dependent variable, the perception of bicycles, the model including age failed the goodness-of-fit test (p < 0.001) and violated the proportional odds assumption (p < 0.001), suggesting its relationship with the dependent variable is not well captured by a single set of coefficients. The parental status model also showed poor goodness-of-fit (Pearson/Deviance) (p = 0.039/0.021) despite significant overall fit. For the second dependent variable, the perception of cars, the number of vehicles per household model showed borderline goodness-of-fit and a high proportion of empty cells (20.8%) and was excluded from substantive interpretation. Across all models, low Nagelkerke pseudo-R2 values (0.01–0.049) indicate that predictors, while significant, explain only a modest share of variance.
3.1.1. Perception of Cars
The difference in perception was also apparent in how the two groups perceive the different modes of transport. With regard to the car, as shown in Table 6, QCMR urban respondents described cars as: louder *; more dangerous *; more polluting **; and more tiring *. All these adjectives are forms of negative externalities more often experienced by residents of central neighborhoods. While urban and suburban respondents exhibit different behaviors in terms of mobility, these behavioral differences seem reflected in their perception of transport modes.
Table 6.
Adjectives associated with the cars, for which there was significant statistical difference, in QCMR.
As shown in Table A3, in Appendix A, suburban and urban residents selected the same adjectives for the car: practical, autonomous, comfortable, fast and useful. The seventh adjective was different for both, with urban respondents selecting pollutant while suburbanites selected vital instead.
The difference in perceptions between urban and suburban respondents is evident when they are asked about the suitability of different modes of transportation for various activities. In general, urban respondents rated cars as less suitable for activities, and sustainable mobility options as more appropriate; see Table A6, in annex, Appendix A. This is the case for the following:
- -
- Grocery shopping, for which urban respondents considered the car less suitable compared to suburban respondents, and the bicycle more suitable *, as well as walking *;
- -
- Shopping in small stores, for which the activity was considered less suitable for the car by urban respondents *** and more suitable for biking * and walking *;
- -
- Administrative errands were considered less suitable for the car *, but not necessarily for biking or walking;
- -
- Artistic, cultural, associative, or intellectual activities were equally seen as less suitable for the car ** but more suitable for walking *, though not necessarily for biking;
- -
- Nighttime social activities were considered less suitable for the car* but more suitable for biking * and even more so for walking **.
Consistently with this pattern, suburban respondents were also more likely than urban respondents to rate the car as “very effective” for a range of everyday activities (including grocery shopping, small-store shopping, administrative errands, cultural activities, and nighttime social outings), while urban respondents rated it comparatively less effective across all five activity types (see Table A6, in Appendix A).
3.1.2. Perception of Public Transit
Suburban respondents perceive public transportation as relatively inefficient in outlying neighborhoods. A possible explanation for this difference could lie in the fewer viable options available for biking and public transit in QCMR suburbs compared to central neighborhoods. Suburban respondents were less likely to assign the following positive adjectives to public transportation: “predictable” *; “useful” * (see Table 7, below). They were also more likely to perceive public transportation as “restrictive” *. Suburban residents were also more likely to choose “safe” * as an adjective to describe public transit (see Table A4, in Appendix A). As shown in Table A4, in Appendix A, suburban and urban residents selected the same adjectives—economical, eco-friendly, restrictive, slow, useful—but not in the same order. Urban respondents found that the bus was slower and more uncomfortable than restrictive compared to suburban respondents, and more loud than unpredictable. This is, in fact, an accurate depiction of the difference in public transit service currently offered in central and suburban neighborhoods of QCMR. Buses in Quebec City, in central neighborhoods, are generally slow due to congestion and lack of segregated right of way. They are a more concentrated in central areas where they are predominantly more crowded and uncomfortable than in the suburbs. In the suburbs, buses are few, making them overly restrictive, especially compared to the car. They are impractical, especially when factoring the often multiple transfers needed to travel. Table 7 below shows adjectives associated with public transit (bus) for which there was significant statistical difference, in QCMR.
Table 7.
Adjectives associated with public transit (bus) as selected by respondent, for which there was significant statistical difference, in QCMR.
3.1.3. Perception of Bicycles
As shown in Table 8, with regard to the difference in perception of bicycles, among the adjectives showing a statistically significant urban–suburban difference for the bicycle, urban residents were more likely to associate it with positive descriptors, “relaxing” * (8.6% vs. 4.2%) and “quiet” (21.9% vs. 15.2%) *, while suburban residents were more likely to describe it with negative terms: “slow” ** (14% vs. 4.6%, the largest gap, significant at the stricter threshold) and “impractical” * (9.5% vs. 4%). As shown in Table A5, in Appendix A, suburban and urban residents selected the same adjectives for the car: ecological, economical and healthy, as the first three adjectives. At the fourth and fifth adjectives, both groups differ. The urban respondents selected superfluous and practical while the suburbanites selected useless and superfluous.
Table 8.
Adjectives associated with bicycle as selected by respondent, for which there was significant statistical difference, in QCMR.
3.1.4. Perception of Other Modes of Transportation
Another notable difference is that suburban respondents were proportionally less likely to use the adjectives relaxing * and useful * to describe interurban rail, which is limited in Canada and also in QCMR.
Urban residents were more likely to say that the tramway project was useful *, and less likely to declare that it was impractical *. Both samples had a similar perception of the tramway, with the five most selected adjectives being: expensive, eco-friendly, useless, superfluous, and practical. There was, however, no statistical difference in the perception of the tramway project between urban and suburban respondents. Nevertheless, overall, urban residents perceived the tramway project as relatively more comfortable and the suburban respondents as more economical. This is likely because the tramway, with a larger passenger capacity, will be less crowded than the current bi-articulated buses used by the public transit authority. Overcrowding being more a problem in central neighborhoods, it is plausible that this explains why urban respondents see the tramway project as more comfortable. On the other hand, the tramway project will provide many suburbs in QCMR, especially Sainte-Foy–Sillery–Cap Rouge and Charlesbourg boroughs, with sound options for commuting by public transit.
Both urban and suburban respondents did not show any significant difference in how they perceived public transit. Nevertheless, our data show that urban residents are more at ease with taking public transit, meaning they were more at ease with bus schedules, transfers, and orientations to and between bus stops. Considering that urban respondents use public transportation more and drive less, one could expect that these respondents are more comfortable using public transit compared to suburban respondents from QCMR. This is indeed the case (see Table 9).
Table 9.
Respondents’ self-declared ease with taking public transit.
3.2. Differences in Perceptions of Transport Modes Between Urban and Suburban Residents, Comparison Between Quebec City Region and Three Swiss Cities
Kaufman et al. shared similar conclusions when measuring perception of cars among Swiss respondents [53]. Urban residents both in Canada and Switzerland noticeably perceive the pollution problem more acutely than suburban residents, as shown by twice as many urban respondents identifying it as an adjective associated with the car (14.6% vs. 7%). Nonetheless, for both suburban residents and their urban counterparts, the five most selected positive adjectives for cars were: practical, autonomous, comfortable, fast, and useful, and the five most selected negative adjectives were: polluting **, dangerous*, restrictive, loud* and detrimental. Additionally, urban respondents are less likely to consider cars as faster* (see Table A3, in Appendix A).
As shown in Table A3, in Appendix A, Swiss respondents show a more negative perception of the car than QCMR respondents. Although QCMR respondents also chose negative adjectives such as “pollutant” and “expensive”, Swiss respondents are more prone to selecting these adjectives as their first choice. Moreover, the Swiss respondents report the car as “limiting”. In both cases, suburban residents have a more positive perception of the car than their urban counterparts. Also, without exceptions, both QCMR and Swiss respondents chose “practical” as the most selected adjective to describe the car and “comfortable” as the third one. Regardless of differences in perceptions between the two environments, this shows that cars in both settings are largely perceived in a positive light, being highly “practical”, even though the Swiss respondents seem more critical of cars in general.
The difference in perception of public transit between QCMR and Swiss respondents is stark. In QCMR, public transit is still perceived firstly as a cheap way to commute, and secondly, as a more ecological choice of commute (see Table A4, in Appendix A), as opposed to Switzerland, where it is seen as the practical, fast and comfortable choice to make. In terms of general perception, both groups show a somewhat similar level of perception of public transit as positive, although not as positive as the car. In both countries, suburbanites have a somewhat less positive perception of public transit than urban respondents. The difference in perception lies in the adjectives chosen by Swiss respondents to describe public transit. Swiss residents chose “practical” and, in equal measure, “comfortable” and “fast” to describe public transit. In contrast, QCMR respondents see public transit as an “economical” and “ecological” means of transportation. A likely cause for this difference could be in the contrast of quality of public transit infrastructures between QCMR and Switzerland, with Swiss cities having a far superior system of public transit than the QCMR.
Suburban respondents from both countries were less likely to use positive adjectives for biking * and more likely to use negative adjectives * (see Table A5, in Appendix A). Suburban respondents less frequently selected the following positive adjectives to describe biking in their responses: relaxing *; quiet * (see Table A5, in Appendix A). This finding fits Gatersleben et al.’s results, which show that cycling and walking were described as “relaxing” by urban commuters [32]. Suburban residents had a somewhat different perception of the bicycle than urban residents. In the five most selected adjectives of suburban respondents—“ecological”, “economical”, “healthy”,” useless”, “superfluous”—they did not select practical as an adjective. Meanwhile, urban respondents selected the following as their five most popular adjectives: eco-friendly, economical, healthy, superfluous and practical.
With the exception of Bern, there are few differences between the perception of bicycles among Swiss and QCMR respondents. In the QCMR, Geneva and Lausanne, the bicycle was seen mainly as sustainable mobility, being “healthy” and “ecological”. In Geneva and Lausanne, respondents use in the third place the adjective “comfortable” to describe the bicycle. In Bern, respondents describe the bicycle has been firstly “practical”, “ecological” and “fast”. Copenhagenize, an index measuring cities’ cyclability, rates Bern as the 20th best cyclable city in the world, while Geneva and Lausanne do not make it in the top 100 most cyclable cities [61]. Both in Switzerland and QCMR, urban residents had a somewhat more positive perception of bicycles than their suburban counterparts. QCMR suburban respondents were more likely to select the following negative adjectives to describe biking: slow*; impractical* (see Table A5, in Appendix A).
Based on three surveys conducted in 1994, 2011 and 2018, Kaufman et al. [6,53,62] found that the perception of cars among Geneva and Lausanne residents is becoming more negative with time. Bern remains an exception, with car perception stagnating over time. The percentage of respondents choosing “pollutant” as an adjective has been steadily rising. In Geneva, it went from 6% of respondents in 1994 to 9% in 2011 and 11% in 2018. In Lausanne, it went from 6% in 1994 to 9% in 2018 and 11% in 2018. In Geneva, in 1994, 12% of residents had a negative view of cars, 19% in 2011, and 33% in 2018. In Lausanne, it went from 9% in 1994 to 15% in 2011 and 26% in 2018. In Bern, negative perception as a percentage of respondents stagnated at 12% from 1994 to 2018. Kaufmann [63] states a possible explanation for these findings: an increase in the quality and quantity of public transit options; an increase in the quality and quantity of pedestrian and cycling options; and an evolution of communication, with the democratization of smart phones, turning the commuting time in public transit from “dead time” to leisure and working time.
4. Discussion
4.1. Transport Mode Perception vs. Mobility Behaviors
As seen in the literature review, perceptions are predictive of mobility behaviors. A such, mobility behaviors could explain in part some of the differences in perceptions of transport modes observed previously.
Urban respondents are more likely to use transportation modes other than driving compared to the suburban group *. For instance, urban residents are more likely to purchase transit tickets in bulk.
They are also more likely to have a bike share subscription ***. However, it should be noted that the bike share infrastructure is only available in QCMR central neighborhoods, which explains the difference in subscription rate between both groups. In our samples, there is a significant difference between how urban and suburban respondents commute to work (see Table 10).
Table 10.
Mode of transportation use by respondents for commuting to work, in QCMR.
When examining trips for reasons other than work or education, there are significant difference in transportation modes used between urban residents and suburban residents for the following activities:
- -
- Shopping (supermarket, small shops, grocery stores, market, etc.) ***;
- -
- Outdoor or sport activities (running, walking, sports in facilities, etc.) **;
- -
- Social, associative, or cultural activities (cinema, restaurant, museum, bar, nightclub, visiting friends/family, theater classes, volunteering, etc.) ***;
- -
- Accompaniment (children to school, elderly persons, etc.) *.
For all these activities, urban respondents use their cars less and rely more on public transportation, biking, and walking.
In terms of leisure mobility, one might expect residents of central neighborhoods to travel further on average for outdoor activities outside the city (skiing, hiking, biking tours, swimming, picnicking). However, no statistically significant difference is observed between the distance traveled to such activities by urban and suburban respondents. This is coherent with Munafò’s findings [8] that Swiss urban residents did not travel a greater distance by car for their leisure activities outside of cities compared to non-urban residents. Our and Munafò’s findings negate the validity of what the French literature calls “the BBQ effect” [64,65], i.e., the propension of urban citizens to travel greater distances for their leisure activities to compensate for their lack of personal space compared to non-urban residents, therefore negating the environmental benefits of compact cities. Similarly, one might expect suburban respondents travel a greater distance for cultural activities (strolling, shopping, exhibitions, concerts) or for gastronomic outings. Again, no difference is observed between the distances traveled by urban and suburban respondents. The difference in terms of distance traveled to visit relatives is also not statistically significant between both groups. The frequency of these activities is also not statistically different between the two respondent groups.
That said, if there is a difference between the two groups of respondents, it is found in the choice of transportation mode for activities outside of work. Urban respondents were less likely to choose the car for the following leisure activities: city visits or cultural excursions (strolling, shopping, museums, exhibitions, concerts) ***; visits to family or friends *; and visits to entertainment venues, amusement parks, sports events ***.
Equally, for short personal stays of one to three nights away from home, urban respondents were more likely to choose carpooling and trains and less likely to opt for solo driving *.
In terms of teleworking practices, urban respondents are more likely to practice teleworking *. A total of 23.7% of urban respondents report being almost exclusively teleworkers compared to 16% for the suburban group. This difference is likely due to the higher educational attainment achieved by the urban sample. When factoring different levels of educational attainment between all respondents, teleworking is more common among respondents with a bachelor’s degree, graduate, and postgraduate degree *. This is coherent with what is observed in the United States, where graduates and undergraduates are more likely to telework [66]. Frequently, workers with a college degree or less do not have the option of teleworking [66].
4.2. Interpretations of the Differences in Perception of Transport Modes Between the Urban and Suburban Respondents of the QCMR
Urban residents had more positive perceptions of bicycles than their suburban counterparts. We hypothesize that the plausible explanation for this difference could come from the recent improvements in the cycling infrastructure of downtown Quebec City. Chemin Sainte-Foy, a major road crossing the city, has been redesigned in 2023 with a 2.4 km bicycle segregated path, snow-plowed in the winter. A widely popular new e-bike share service was put in place in downtown areas in 2022. This, with additional sections of bicycle infrastructures being added every year, make cycling a more and more practical option for urban residents. This is not as true for suburban residents who mostly still lack some of the basic cycling infrastructures. Moreover, they have not benefited from the e-bike share service as of 2023, when polled. This finding indicates that urban residents tend to see the bicycle as a more viable and practical mode of transportation compared to suburban residents.
We also found that urban residents had a less positive perception of cars, compared to their suburban counterparts. However, the perception of cars remains very positive, even among urban residents. We hypothesize that, as imperfect as alternatives to private cars are in downtown Quebec City, they still aggregate to create a less flattering view of the car for urban dwellers. Our results show that walking, cycling, and commuting by public transit remain more viable in the eyes of downtown Quebec City urban residents. For various types of activities, urban residents perceived the alternatives to cars as more viable. Urban dwellers’ mobility behaviors show this, with walking, cycling and public transit being more used by urban dwellers compared to suburbanites (see Table 10). Also, we hypothesize that the perception of cars in Quebec City’s downtown borough is likely influenced by the fact that residents use their car less **, therefore deriving fewer benefits from car use, while being more impacted by its negative externalities. The urban areas being a popular destination, its residents suffer more from the pollution of the cars driven by the suburbanites traveling to their area.
In this paper, we found that, in the QCMR, suburban and urban residents had a similar indifference towards public transit, with slightly more positive than negative adjectives being selected. Urban residents’ perception of public transit was slightly better, although not statistically significant. We hypothesize that the lack of difference may be attributed to the challenges faced by the QCMR’s public transit network. To be fair, there is an important difference in quality, frequency and quantity of public transit options between Quebec City’s central neighborhood and its suburbs. However, saying this does not imply that the city overall has an efficient and responsive public transit network, especially compared to similar-sized European cities. Compared to most European cities, Quebec City is equally below average for both its suburban and urban residents alike. Public transit has been largely neglected by the provincial government for decades, with only minor exceptions. There are no urban rail options in the city, despite having a sizeable population of 550,000 inhabitants [58]. The main lines of buses are overcrowded, and often not on schedule due to overcrowding and bus bunching. Buses are often stuck in traffic with few grade-separated dedicated lanes.
Carpentier [12] found in Luxembourg that urban respondents had lower perceptions of public transit. He credited this difference by the higher expectations for quality transit for urban dwellers. We assume that, sadly, QCMR’s urban residents do not have much expectations towards their public transit network. Notably, Quebec City public transit network is somewhat average for a mid-size North American city. Thus, QCMR urban dwellers might not expect their public transit infrastructures to compare to higher European standards.
We found in our research that urban residents do not have a statistically different perception of the Quebec City tramway project than suburban dwellers. There was an 8.8% difference in approval between both groups, urban residents being more prone to approve of the planned tramway. Despite this, the difference was not statistically significant. On the other hand, Quebec City officials often polled the population in order to assess the project’s social acceptability; their results show consistently that approval for the tramway project declines the further from downtown respondents are located [67].
Carpentier [12] explains the difference observed in the perception of cars between urban and suburban residents by the fewer parking options available for urban residents. This undoubtedly applies to Luxembourg, where the price of parking is high, but not as much for Quebec City. Our poll results show that there was no difference in parking availability for both groups at work (with employers offered free parking) or at home. The only notable statistically significant difference was the parking permit: urban dwellers were more prone to having an on-street public parking permit. Therefore, parking availability could explain a small part of the difference in perception, but not all.
Lastly, we believe this paper calls for further questions. Previous research from Munafò and Kaufmann [6,7,68] has shown that the public perception of transport modes can quickly improve when cities invest in public transit infrastructures and active mobility options. In Switzerland, improvement in active transportation and public transit infrastructures seems to have lowered the perception of the car over time and contributed to improving the perception of public transit and active transportation. This is true for Europe at least, but it remains to be studied in the highly car-dependent North America. The future will tell if the QCMR bases its mobility on cars or sustainable options. If it is the latter, we could see a major shift in how its residents perceive transport modes. Therefore, the question is open: will we see a major shift in the perception of transport modes in the QCMR if the tramway project and the major bicycle infrastructures planned by the city go forth? Should one expect an improvement in the perception of public transit and a decrease in perception of the car just like in Europe? It is likely the case, as research on public perceptions points toward a positive influence of public transit infrastructures on perceptions of transit [51,53]. It will be relevant in the future to poll the QCMR’s residents to measure the change in their perceptions regarding mobility. Furthermore, future research should consider how perception of a mode influences the actual choice of transportation mode and how the built environment affects the individual choice. A future study could analyze in depth the reasons for the difference in perceptions between the Swiss residents, from Bern, Geneva and Lausanne, and QCMR residents, using a qualitative method and interviews.
5. Conclusions
Our findings indicate that, while urban residents held a generally positive view of automobiles, this perception was less favorable compared to that of suburban residents. Both urban and suburban residents exhibited similar perceptions regarding public transit. Urban residents were more likely to regard bicycles as a “practical” mode of transportation than suburban respondents.
We acknowledge that our research has limitations. While this study examines differences in perceptions of transportation modes between residents of La Cité-Limoilou and those of the broader QCMR, its analytical design remains relatively simple and does not fully capture the granularity of the urban gradient in the QCMR of factors underlying these perceptions. Notably, the Sainte-Foy–Sillery–Cap-Rouge borough contains areas with distinctly urban characteristics, evidenced by high population density in specific locations and their built environment. The reverse also holds true for La Cité-Limoilou, which includes a minority of more suburban areas characterized by low population density. Nonetheless, these local variations do not prevent La Cité-Limoilou from remaining, overall, the most urban of the city’s boroughs, and from constituting a relevant indicator for studying urban and suburban behaviors.
The Quebec City tramway project, at the time of the survey, was and remains a highly polarizing issue in local public debate, dominating municipal and provincial election campaigns and media coverage, with public opinion sharply split [69]. As such, perceptions of the “tramway project” collected in the QCMR survey may partly reflect this heightened political salience rather than an evaluation of the mode itself, as would be captured in a context where the tramway is not currently a matter of public contention.
On account of limited data for comparative analysis, another limitation concerns the temporal gap between the two datasets used for comparison. We used the Swiss data because it uses the same method and adjectives to measure perception as our QCMR sample. However, the Swiss survey data were collected in 2018–2019, prior to the COVID-19 pandemic, while the QCMR survey was administered in 2023, into the post-pandemic period. The pandemic constitutes a documented structural break in travel behavior across North America and Europe, including shifts in public transit ridership, the adoption of telecommuting, and changes in active transportation use [70]. These shifts could equally affect transport mode perceptions. As such, some of the observed differences between QCMR and Swiss respondents, particularly regarding cycling and public transit, may partly reflect divergent pandemic time-specific perceptions rather than stable structural or cultural differences between the two national contexts. Future comparative research would benefit from using survey data collected within closer temporal proximity.
Despite multi-test validation, several models showed diagnostic issues warranting caution, as shown in Appendix A, Table A1 and Table A2 For bicycle perception, the age model failed the goodness-of-fit test and violated the proportional odds assumption, while the parental status model showed poor goodness-of-fit despite significant overall fit. For car perception, the vehicles-per-household model showed borderline fit and a high proportion of empty cells, and was excluded from interpretation. Low pseudo-R2 values across all models indicate that predictors explain only a modest share of variance, so these findings should be treated as exploratory rather than confirmatory.
Lastly, we found that QCMR residents have different perceptions based on their urbanity status; we cannot assume scientifically the reasons for this difference. We hypothesize that the higher density of activities and employment and the additional viable alternatives to cars available to urban residents explain most of the difference observed. Further qualitative research with interviews would be needed to further investigate the reasons for the urban and suburban residents’ divergence on their perception of cars and bicycles.
Author Contributions
Conceptualization, V.K.; methodology V.K., D.V., J.G. and L.-J.C.; formal analysis, L.-J.C., D.V. and M.N.J.; investigation, D.V. and J.G.; writing—original draft preparation, L.-J.C. and D.V.; writing—review and editing, L.-J.C., D.V. and M.N.J.; visualization, L.-J.C.; supervision, D.V.; project administration, D.V.; funding acquisition, D.V. and V.K. All authors have read and agreed to the published version of the manuscript.
Funding
This research was funded by Laval University’s Faculty of planning, architecture, art and design faculty support program for new professors, grant number AP526808, and was supported by the Natural Sciences and Engineering Research Council of Canada (NSERC) [grant number ALLRP 577172-2022].
Institutional Review Board Statement
The study was conducted in accordance with the Declaration of Helsinki, and approved by the Research Ethics Board of Laval University (protocol code: 2023-047 A-1/31-05-2023 and date of approval: 31 May 2023).
Informed Consent Statement
Informed consent was obtained from all subjects involved in the study.
Data Availability Statement
The data presented in this study are not available on request from the corresponding author due to privacy restrictions.
Acknowledgments
The authors would like to thank all the participants who anonymously filled in the questionnaire. We would also like to thank Jimmy Mayrand for the map design.
Conflicts of Interest
The authors declare no conflicts of interest.
Appendix A
Table A1.
Summary of model fit diagnostics for ordinal regression models (PLUM) predicting positive bicycle perception among urban and suburban respondents.
Table A2.
Summary of model fit diagnostics for ordinal regression models (PLUM) predicting positive car perception among urban and suburban respondents.
Table A3.
Eight most popular adjectives associated with cars across samples.
Table A4.
Eight most popular adjectives associated with public transit (buses in QCMR and buses and rail in Switzerland) across samples.
Table A5.
Eight most selected adjectives associated with bicycle selected by respondent.
Table A6.
Suitability of commuting by car for activities, outside of work and formation, as declared by QCMR respondent.
References
- Chen, N.; Akar, G. How Do Socio-Demographics and Built Environment Affect Individual Accessibility Based on Activity Space? Evidence from Greater Cleveland, Ohio. JTLU 2016, 10, 477–503. [Google Scholar] [CrossRef] [Scilit]
- Yoon, Y.; Chang, H. Urban Spatial Structure and Vehicle Miles Traveled in 461 U.S. Cities. Appl. Sci. 2025, 15, 12156. [Google Scholar] [CrossRef] [Scilit]
- Zhu, P.; Ho, S.N.; Jiang, Y.; Tan, X. Built Environment, Commuting Behaviour and Job Accessibility in a Rail-Based Dense Urban Context. Transp. Res. Part D Transp. Environ. 2020, 87, 102438. [Google Scholar] [CrossRef] [Scilit]
- Yin, C.; Wang, X.; Shao, C.; Ma, J. Exploring the Relationship between Built Environment and Commuting Mode Choice: Longitudinal Evidence from China. Int. J. Environ. Res. Public Health 2022, 19, 14149. [Google Scholar] [CrossRef] [Scilit] [PubMed]
- Leck, E. The Impact of Urban Form on Travel Behavior: A Meta-Analysis. Plan. J. 2011, 19, 37–58. [Google Scholar] [CrossRef] [Scilit]
- Kaufmann, V. Comprendre Les Vraies Logiques de Choix d’un Mode de Transport. In Préparer La Transition Mobilitaire; Forum Vies Mobiles: Saint-Denis, France, 2015. [Google Scholar]
- Kaufmann, V.; Jemelin, C.; Guidez, J.-M. Pratiques Modales: La Force Des Représentation. In Automobiles et Modes de vie Urbains: Quel Degré de Liberté? La Documentation française: Paris, France, 2001. [Google Scholar]
- Munafò, S. Forme urbaine et mobilités de loisirs: L’ ”effet barbecue“ sur le grill. Cybergeo 2017. [Google Scholar] [CrossRef] [Scilit]
- Schwanen, T.; Mokhtarian, P.L. What Affects Commute Mode Choice: Neighborhood Physical Structure or Preferences toward Neighborhoods? J. Transp. Geogr. 2005, 13, 83–99. [Google Scholar] [CrossRef] [Scilit]
- Chen, K.; Liang, H.; Wang, X. Psychological Divergence Between Urban and Suburban Chinese in Relation to Green Commuting. Soc. Behav. Personal. Int. J. 2016, 44, 481–498. [Google Scholar] [CrossRef] [Scilit]
- Schwanen, T.; Mokhtarian, P.L. What If You Live in the Wrong Neighborhood? The Impact of Residential Neighborhood Type Dissonance on Distance Traveled. Transp. Res. Part D. Transp. Environ. 2005, 10, 127–151. [Google Scholar] [CrossRef] [Scilit]
- Carpentier, S. Les Mobilités Quotidiennes: Représentations et Pratiques. Vers l’identité de Déplacement. Comport. Mobilité et. Ancrage Résidentiel 2005, 19–47. [Google Scholar]
- Transportation Research Board. Transit Use, Automobility, and Urban Form Comparative Trends and Patterns. In Making Transit Work: Insight from Western Europe, Canada and the United States; National Academy Press: Washington, DC, USA, 2001; pp. 17–64. [Google Scholar]
- Golwin, E.; Levy, A.; Ensari, E.; Chitti, M. Transit Costs Project: Executive Summary; NYU Marron Institute of Urban Management: New York, NY, USA, 2021. [Google Scholar]
- Statistique Canada Profil Du Recensement de 2021, Agglomération de Québec 2021; Government of Canada: Ottawa, ON, Canada, 2021.
- Open Data Network Detroit Density. Available online: https://www.opendatanetwork.com/entity/1600000US2622000/Detroit_MI/geographic.population.density?year=2018 (accessed on 5 September 2024).
- Open Data Network Houston Density. Available online: https://www.opendatanetwork.com/entity/1600000US4835000/Houston_TX/geographic.population.density?year=2018 (accessed on 5 September 2024).
- République et Canton de Genève Statistiques Cantonnales. Available online: https://statistique.ge.ch/communes/apercu.asp?commune=21 (accessed on 11 August 2025).
- Stadt Bern Données. Available online: https://www.bern.ch/fr/en-visite-a-berne/portrait-de-la-ville-de-berne/donnees (accessed on 11 August 2025).
- Ministère du transport et de la mobilité durable. Enquête Origine-Destination 2023 Sur La Mobilité Des Personnes Dans La Région de Québec-Lévis Sommaire de L’enquête-Ménages; Ministère du Transport et de la Mobilité Durable: Quebec, QC, Canada, 2025. [Google Scholar]
- Richter, F. Cars Still Dominate the American Commute. World Economic Forum, 19 May 2022.
- Scanu, E.; Cloutier, G.; Trudelle, C. Contesting the Greening of the Urban Growth Machine: Ecological Modernization and the Promethean Counter-Discourse. Environ. Plan. E Nat. Space 2021, 4, 1369–1388. [Google Scholar] [CrossRef] [Scilit]
- Gagné, L. Radio-Canada L’Ordre Des Urbanistes Pourfend Le Discours de La CAQ Sur Le 3e Lien. Radio-Canada, 25 April 2022.
- Dubé, J.; Scanu, E.; Lemoine, R.; Charest, Y.; Landry, J.; Mercier, J. Comment Survivre Aux Controverses Sur Le Transport À Québec? Septentrion: Quebec, QC, Canada, 2021. [Google Scholar]
- Mercier J Comprendre Les Positions Des Participants Aux Débats. In Comment Survivre Aux Controverses Sur Le Transport À Québec? Septentrion: Québec, QC, Canada, 2021; pp. 95–136.
- Bouchard, S. Collectif Sortons Les Radios-Poubelles. In L’impact Des Radios-Poubelles sur la Perception du Transport Collectif Dans La Grande Région de Québec; Collectif Sortons Les Radios-Poubelles: Quebec, QC, Canada, 2020; p. 15. [Google Scholar]
- Provencher, N. Sondages Numeris: Radio-Canada et CHOI Grands Gagnants à Québec [AUTOMNE 2018]. Le Soleil, 29 November 2018.
- Fortin, A.; Villeneuve, M.-H.; Rioux, M. Jamais sans ma voiture? Les banlieusards des franges de Québec. Rech. Sociograph. 2009, 49, 447–473. [Google Scholar] [CrossRef] [Scilit]
- Macea, L.F.; Márquez, L.; Soto, J.J. How Do the Affective and Symbolic Factors of Private Car Driving Influence Car Users’ Travel Behavior in a Car Restriction Policy Scenario? Transp. Policy 2023, 140, 100–113. [Google Scholar] [CrossRef] [Scilit]
- Ratan, R. When Automobiles Are Avacars: A Self-Other-Utility Approach to Cars and Avatars. Int. J. Commun. 2019, 13, 2774–2792. [Google Scholar]
- Walker, I.; Tapp, A.; Davis, A. Motornomativity: How Social Norms Hide a Major Public Health Hazard. Int. J. Environ. Health 2022, 11, 21–33. [Google Scholar] [CrossRef] [Scilit]
- Gatersleben, B.; Uzzell, D. Affective Appraisals of the Daily Commute: Comparing Perceptions of Drivers, Cyclists, Walkers, and Users of Public Transport. Environ. Behav. 2007, 39, 416–431. [Google Scholar] [CrossRef] [Scilit]
- St-Louis, E.; Manaugh, K.; Van Lierop, D.; El-Geneidy, A. The Happy Commuter: A Comparison of Commuter Satisfaction across Modes. Transp. Res. Part F Traffic Psychol. Behav. 2014, 26, 160–170. [Google Scholar] [CrossRef] [Scilit]
- Handy, S.; Thigpen, C. Commute Quality and Its Implications for Commute Satisfaction: Exploring the Role of Mode, Location, and Other Factors. Travel Behav. Soc. 2019, 16, 241–248. [Google Scholar] [CrossRef] [Scilit]
- Joireman, J.A.; Van Lange, P.A.M.; Kuhlman, D.M.; Van Vugt, M.; Shelley, G.P. An Interdependence Analysis of Commuting Decisions. Eur. J. Soc. Psychol. 1997, 27, 441–463. [Google Scholar] [CrossRef] [Scilit]
- Van Bekkum, J.E.; Williams, J.M.; Graham Morris, P. Cycle Commuting and Perceptions of Barriers: Stages of Change, Gender and Occupation. Health Educ. 2011, 111, 476–497. [Google Scholar] [CrossRef] [Scilit]
- Van Bekkum, J.E.; Williams, J.M.; Graham Morris, P. Employees’ Perceptions of Cycle Commuting: A Qualitative Study. Health Educ. 2011, 111, 198–215. [Google Scholar] [CrossRef] [Scilit]
- Negm, H.; El-Geneidy, A. Subjectivity Matters: Investigating the Relationship between Perceived Accessibility and Travel Behaviour. Transp. Res. Part A Policy Pract. 2025, 193, 104399. [Google Scholar] [CrossRef] [Scilit]
- Mehdizadeh, M.; Kroesen, M. Does Perceived Accessibility Affect Travel Behavior or Vice Versa? Alternative Theories Testing Bidirectional Effects and (in)Consistency over Time. Transp. Res. Part A Policy Pract. 2025, 191, 1–13. [Google Scholar] [CrossRef] [Scilit]
- Arroyo, R.; Ruiz, T.; Mars, L.; Rasouli, S.; Timmermans, H. Influence of Values, Attitudes towards Transport Modes and Companions on Travel Behavior. Transp. Res. Part F Traffic Psychol. Behav. 2020, 71, 8–22. [Google Scholar] [CrossRef] [Scilit]
- Van Lierop, D.; Badami, M.G.; El-Geneidy, A.M. What Influences Satisfaction and Loyalty in Public Transport? A Review of the Literature. Transp. Rev. 2018, 38, 52–72. [Google Scholar] [CrossRef] [Scilit]
- Echiburú, T.; Hurtubia, R.; Muñoz, J.C. Role of Perceived Satisfaction and the Built Environment on the Frequency of Cycle-Commuting. JTLU 2021, 14, 171–196. [Google Scholar] [CrossRef] [Scilit]
- Morckel, V.; Terzano, K. The Influence of Travel Attitudes, Commute Mode Choice, and Perceived Neighborhood Characteristics on Physical Activity. J. Phys. Act. Health 2014, 11, 91–98. [Google Scholar] [CrossRef] [Scilit] [PubMed]
- Cervero, R.; Gorham, R. Commuting in Transit Versus Automobile Neighborhoods. J. Am. Plan. Assoc. 1995, 61, 210–225. [Google Scholar] [CrossRef] [Scilit]
- Vale, D.S.; Pereira, M. Influence on Pedestrian Commuting Behavior of the Built Environment Surrounding Destinations: A Structural Equations Modeling Approach. Int. J. Sustain. Transp. 2016, 10, 730–741. [Google Scholar] [CrossRef] [Scilit]
- Berry, N.; Coffee, N.; Nolan, R.; Dollman, J.; Sugiyama, T. Neighbourhood Environmental Attributes Associated with Walking in South Australian Adults: Differences between Urban and Rural Areas. J. Transp. Land Use 2017, 14, 965. [Google Scholar] [CrossRef] [Scilit] [PubMed]
- Hatamzadeh, Y. Do People Desire to Walk More in Commuting to Work? Examining a Conceptual Model Based on the Role of Perceived Walking Distance and Positive Attitudes. Transp. Res. Rec. 2019, 2673, 351–361. [Google Scholar] [CrossRef] [Scilit]
- Horning, J.; El-Geneidy, A.; Krizek, K.J. Perceptions of Walking Distance to Neighborhood Retail and Other Public Services. In Proceedings of the Transportation Research Board 87th Annual Meeting, Washington, DC, USA, 13–17 January 2008. [Google Scholar]
- Chang, H.-W.; Chang, H.-L. Students’ Perceptions of Difficulties in Cycling to School in Urban and Suburban Taiwan. Transp. Res. Rec. 2008, 2060, 123–130. [Google Scholar] [CrossRef] [Scilit]
- Holian, M.J.; Kahn, M.E. California Voting and Suburbanization Patterns: Implications for Transit Policy; Mineta Transportation Institute, San José State University: San Jose, CA, USA, 2013. [Google Scholar]
- Van Soest, D.; Tight, M.R.; Rogers, C.D.F. Exploring Transport Perceptions across Urban Areas Using Free Associations. Transp. Res. Part F Traffic Psychol. Behav. 2019, 65, 316–333. [Google Scholar] [CrossRef] [Scilit]
- Schwanen, T.; Dieleman, F.M.; Dijst, M. The Impact of Metropolitan Structure on Commute Behavior in the Netherlands: A Multilevel Approach. Growth Change 2004, 35, 304–333. [Google Scholar] [CrossRef] [Scilit]
- Kaufmann, V.; Gonzalez, J.; Bernier, E. Analyse Des Logiques de Choix Modal Auprès de La Population Active Urbaine Étude Comparée Du Grand Genève, Du Canton de Vaud, Et Des Agglomérations de Berne Et de Bienne; LaSUR: Geneva, Switzerland, 2019. [Google Scholar]
- Vasquez-Henriquez, P.; Graells-Garrido, E.; Caro, D. Tweets on the Go: Gender Differences in Transport Perception and Its Discussion on Social Media. Sustainability 2020, 12, 5405. [Google Scholar] [CrossRef] [Scilit]
- Robinson, J. Cities in a World of Cities: The Comparative Gesture: Cities in a World of Cities Compared. Int. J. Urban Reg. Res. 2011, 35, 1–23. [Google Scholar] [CrossRef] [Scilit]
- Pickvance, C.G. Comparative Urban Analysis and Assumptions about Causality. Int. J. Urban Reg. Res. 1986, 10, 162–184. [Google Scholar] [CrossRef] [Scilit]
- Gauer, V.H.; Axsen, J.; Dütschke, E.; Long, Z.; Kelber, A. Who Is More Attached to Their Car? Comparing Automobility Engagement and Response to Shared, Automated and Electric Mobility in Canada and Germany. Energy Res. Soc. Sci. 2023, 99, 103048. [Google Scholar] [CrossRef] [Scilit]
- Ville de Québec. Portrait d’arrondissement: La Cité-Limoilou; Ville de Québec: Quebec City, QC, Canada, 2024. [Google Scholar]
- Statistics Canada. Table 38-10-0173-02 Types of Vehicles Owned by Canadian Households. 2025. Available online: https://www150.statcan.gc.ca/t1/tbl1/en/tv.action?pid=3810017301 (accessed on 9 April 2024).
- Williams, R. Generalized Ordered Logit/Partial Proportional Odds Models for Ordinal Dependent Variables. Stata J. Promot. Commun. Stat. Stata 2006, 6, 58–82. [Google Scholar] [CrossRef] [Scilit]
- Copenhagenize Bern–Copenhagenize Index. Available online: https://copenhagenizeindex.eu/index.php/project/bern/ (accessed on 14 July 2026).
- Bernier, E.; Kaufmann, V.; Masse, F.; Gonzalez, J. Analysing the Potential for Modal Shift Based on the Logic of Modal Choice. Plan. Rev. 2022, 58, 54–67. [Google Scholar] [CrossRef] [Scilit]
- Kaufmann, V.; Schuler, M.; Crevoisier, O.; Rossel, P. Mobilité et Motilité: De L’intention à L’action; Laboratoire de Sociologie Urbaine de l’École Polytechnique Fédérale de Lausanne: Lausanne, Switzerland, 2003; p. 80. [Google Scholar]
- Orfeuil, J.; Massot, M. La Contrainte Énergétique Doit-Elle Réguler La Ville Ou Les Véhicules? Mobilités Urbaines et Réalisme Écologique. Ann. Rech. 2007, 103, 18–29. [Google Scholar] [CrossRef] [Scilit]
- Orfeuil, J.-P.; Bibliothèque Des Territoires (Eds.) Accessibilité, mobilité, inégalité: Regards sur la question en France aujourd’hui. In Transports, Pauvretés, Exclusions: Pouvoir Bouger pour s’en Sortir; de L’Aube: La Tour d’Aigues, France, 2004; pp. 27–47. ISBN 978-2-87678-951-7. [Google Scholar]
- Parker, K.; Horowitz, J.; Minkin, R. COVID-19 Pandemic Continues to Reshape Work in America. Pew Researh Center, 16 February 2002. [Google Scholar]
- Ville de Québec. Leger Marketing Sondage Exclusif: Projet de Tramway de Québec; Ville de Québec: Quebec, QC, Canada, 2022. [Google Scholar]
- Munafò, S.; Kaufmann, V.; Christie, D.; Vincent-Geslin, S.; Ravalet, E. Dispositions et usages de l’automobile et des transports publics entre 1994 et 2011: Analyse des cas de Berne, Genève et Lausanne. Rev. d’Économie Régionale Urbaine 2015, 5, 753–782. [Google Scholar] [CrossRef] [Scilit]
- Page, J. 3 Visions for Public Transportation Clash at 1st Quebec City Mayoral Debate. CBC News, 17 October 2017.
- Bista, S.; Thierry, B.; Victoriano-Habit, R.; El-Geneidy, A.; Kestens, Y. Understanding the Impact of COVID-19 on Travel Mode Choices and Predicting the Modal Shift after the Pandemic. Travel Behav. Soc. 2025, 40, 101019. [Google Scholar] [CrossRef] [Scilit]
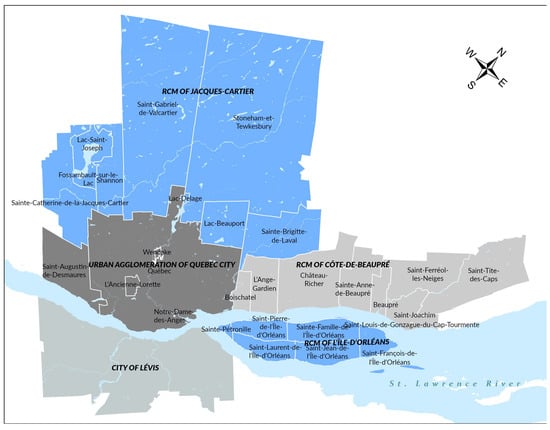
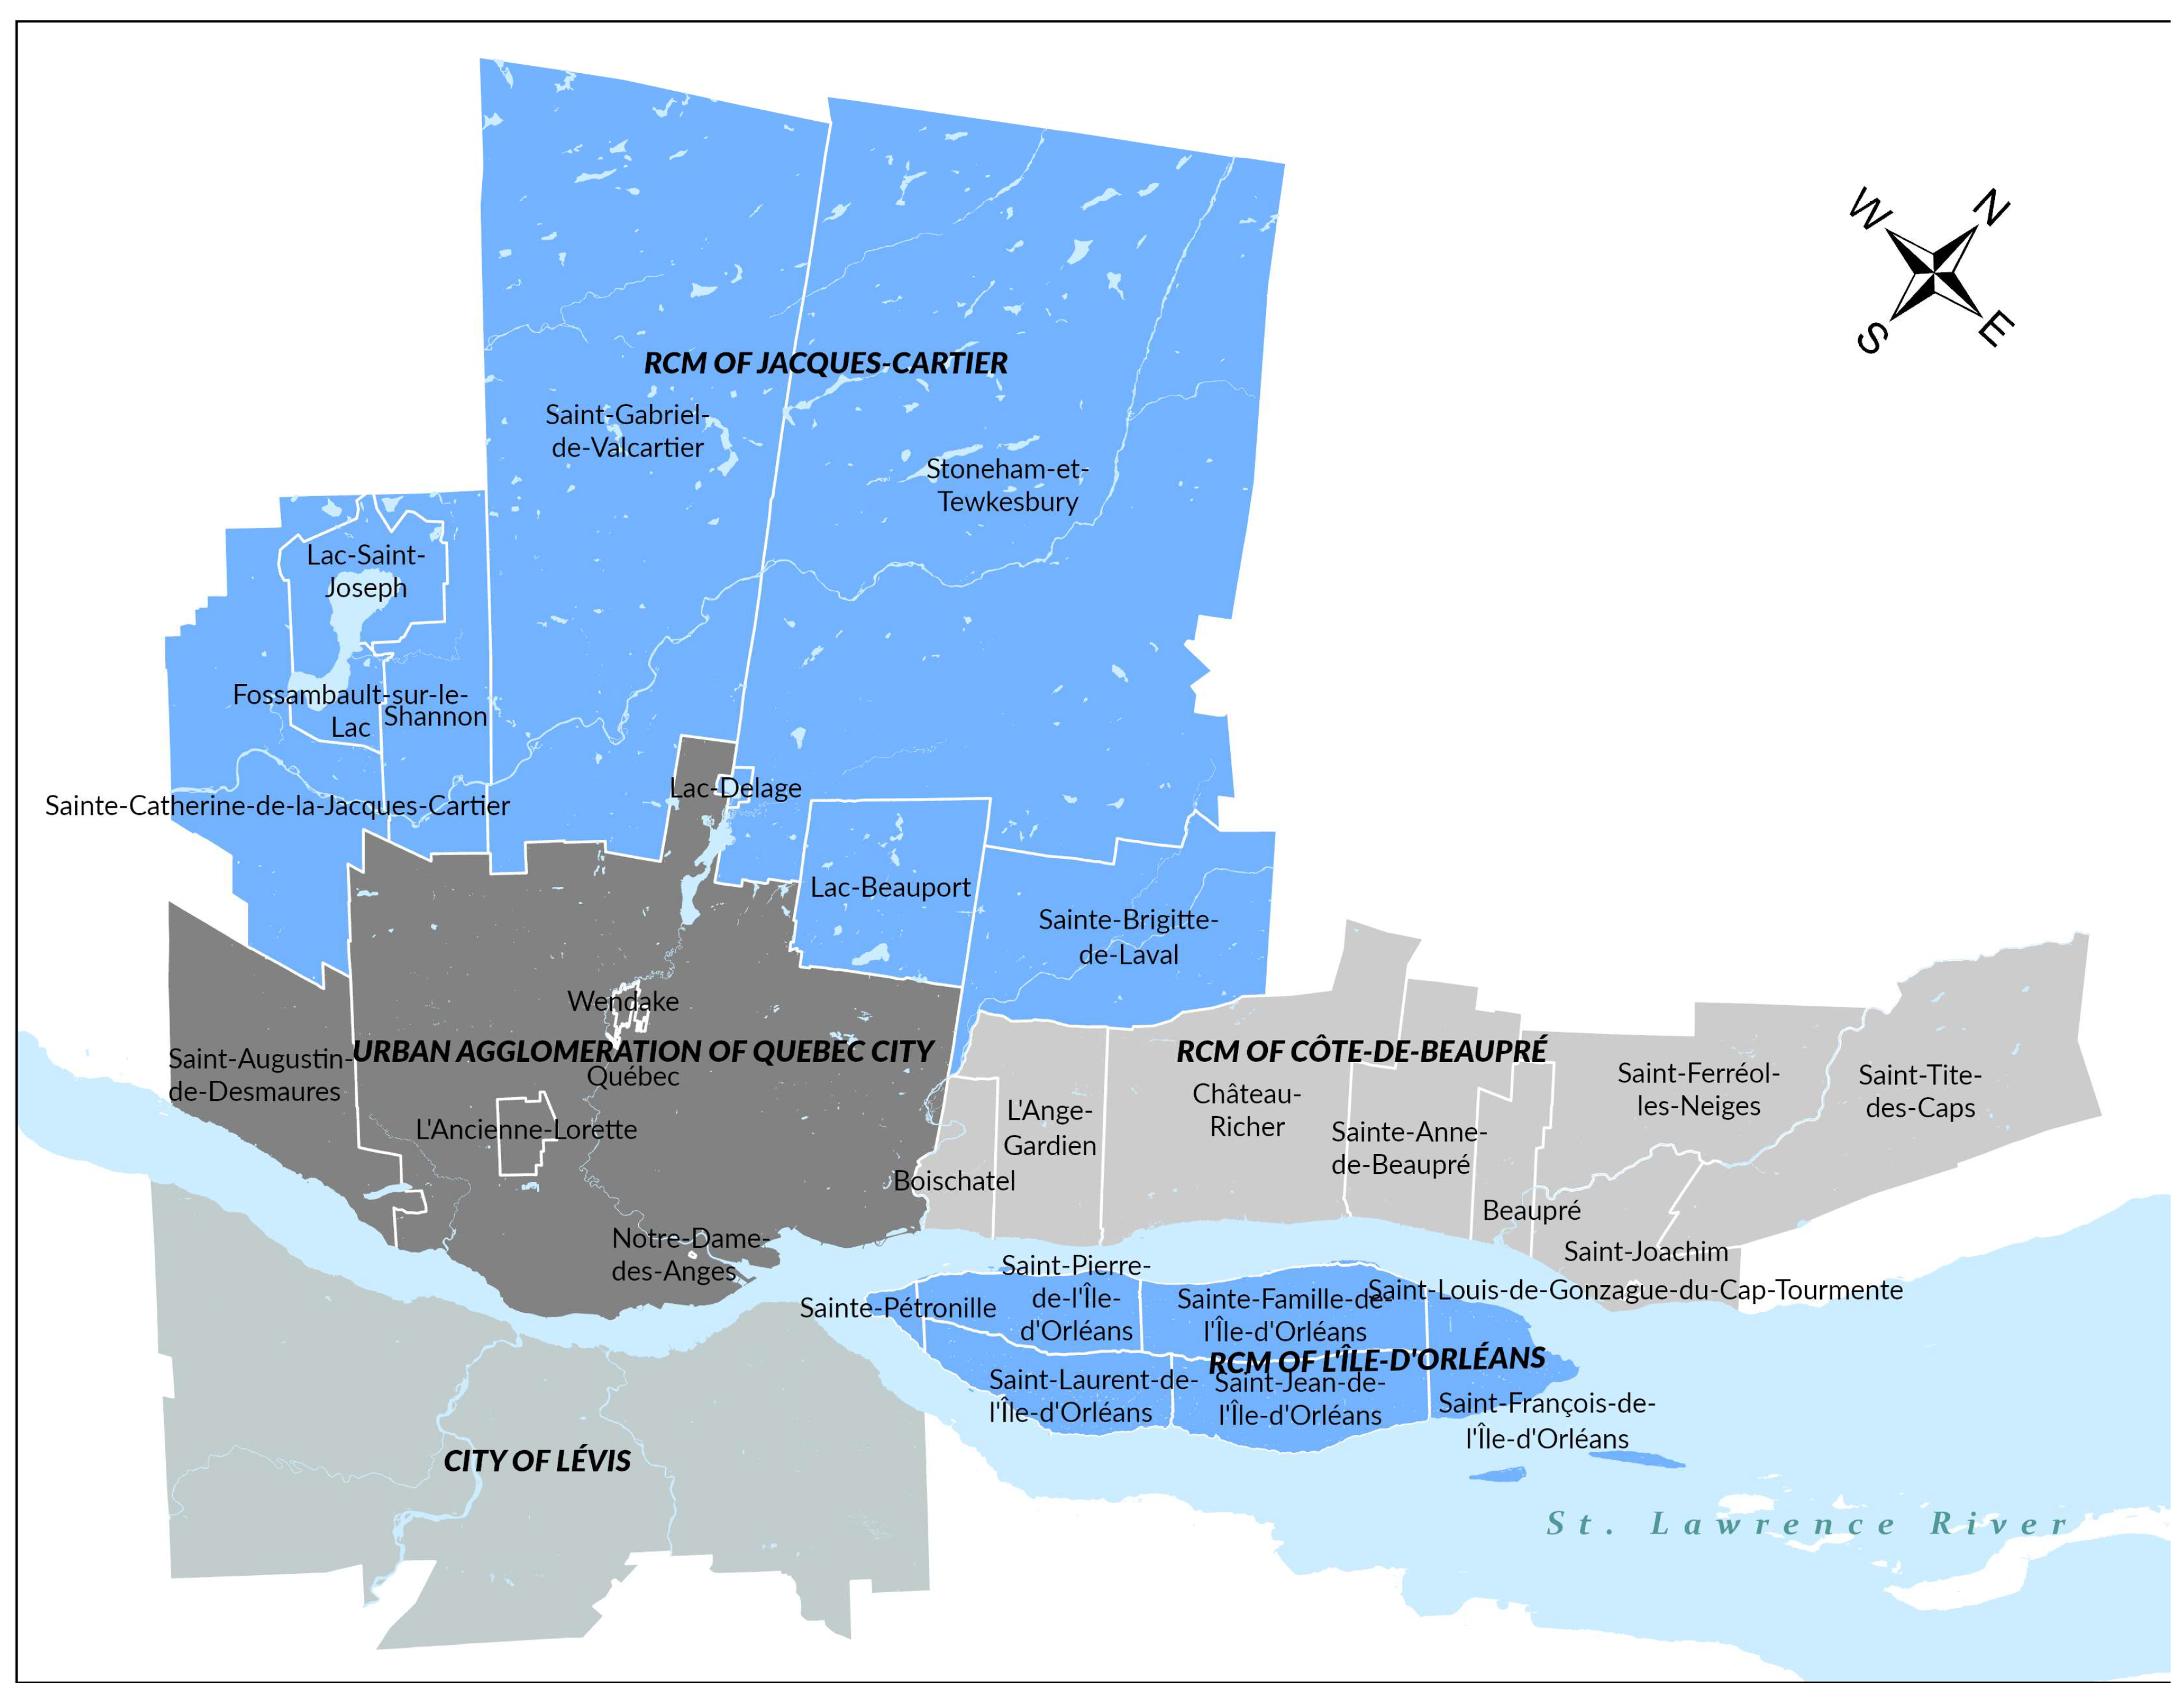

Disclaimer/Publisher’s Note: The statements, opinions and data contained in all publications are solely those of the individual author(s) and contributor(s) and not of MDPI and/or the editor(s). MDPI and/or the editor(s) disclaim responsibility for any injury to people or property resulting from any ideas, methods, instructions or products referred to in the content. |
© 2026 by the authors. Licensee MDPI, Basel, Switzerland. This article is an open access article distributed under the terms and conditions of the Creative Commons Attribution (CC BY) license.