


Abstract
In this study, we evaluate the effect of China’s Belt and Road Initiative (B&RI) on energy poverty, an essential energy issue that needs to be solved urgently in modern society, by deeply discussing whether energy poverty can be eradicated by expanding electricity supply during the gradual promotion of the B&RI. In this regard, this study applies the data of 126 countries from 2000 to 2019 to test the energy poverty eradication (EPE) effect of the B&RI, and the heterogeneous impacts and ecological consequence are further examined. We discover the following: (1) While the B&RI alleviates energy poverty from the perspective of electricity access, it does not alleviate multidimensional energy poverty, possibly due to limited improvements in energy affordability and cleanliness. (2) The EPE effect of the B&RI is particularly significant in low-income nations; moreover, across all countries, the effect is most prominent in those with stable official governments, low socioeconomic conditions, reliable investment profiles, and low levels of corruption. (3) The promotion and popularization of electricity in the B&RI countries is positively related to greenhouse effect, which may be closely related to the different types of national power generation. Accordingly, we further propose some policy implications to solve the issue of energy poverty.
1. Introduction
Energy poverty has been highly concerned by officials and academics in recent years, which has seriously affected the quality life and well-being of residents. Global energy poverty is a complex and serious issue involving multiple dimensions, including insufficient energy supply, high energy prices, low energy efficiency, and inaccessible energy services [1]. It generally refers to the inability of individuals or households to access or pay for the energy services needed to meet basic life needs (e.g., cooking, lighting, and heating). Specifically, the International Energy Agency (IEA)’s statistical report shows that the number of people around the world without access to clean electricity increased for the first time in decades, reaching 760 million in 2022. This is due to the influences of the COVID-19 pandemic and the Russia–Ukraine conflict. Most of this growth occurred in sub-Saharan Africa, where 80% of the population is unable to access electricity, wiping out almost all of the gains made since the pandemic. In addition, approximately 2.3 billion people worldwide lack access to clean cooking utensils and instead depend on traditionally contaminated solid biomass as their primary cooking fuel in 2022. The current energy crisis and post-pandemic inflationary environment have left consumers facing the twin threats of reduced incomes and rising prices for cleaner fuels. Thus, how to boost energy poverty eradication (EPE) is an urgent practical issue to achieve sustainable development goals.
Notably, the implementation of the Belt and Road Initiative (B&RI) provides a new opportunity to boost EPE [2]. Relying on the ancient Silk Road and the current complex and profound background of the times, the B&RI came into being in 2013. This initiative runs through the Eurasian continent, relying on main international passageways on land and primary harbors on sea as nodes, actively developing fellowship with B&RI economies, and jointly building a community of destiny and interests [3]. The B&RI nations have various resource endowment, strong economic complementarities, and huge potential and space for cooperation. The majority of the B&RI economies are developing and emerging countries [4], including Gulf Cooperation Council (GCC) countries that are actively involved in the B&RI. Despite the abundance of renewable energy and traditional fossil fuels, energy poverty is particularly prominent in some countries, with severe shortages in energy production and electricity supply, and relatively few effective EPE solutions.
Deepening international energy cooperation is the essential content of the B&RI [5]. The initiative closely connects energy consumers and producers and builds a bridge between resource-rich and energy-poor areas. In 2015, China proposed to explore the construction of a global energy Internet, which is a transcendence and innovation of the traditional energy development outlook, and has received wide response and active support from the international community. In recent years, China and economies along the B&RI have carried out multi-level cooperation in the fields of traditional and new energy. Among them, the process of oil and gas exploration and development as well as trade cooperation is deeper, the pattern of four major import pipelines has initially taken shape, and cooperation in the field of new energy has accelerated. Currently, the B&RI has made prominent achievements in energy facilities. Specifically, cooperation between China and GCC nations is on the rise, green and clean energy cooperation has become the two points of cooperation between China and GCC countries, and photovoltaic power stations contracted by Chinese enterprises in GCC countries have become the main force of local clean energy supply. China has further carried out cross-border electricity trade with neighboring economies such as Russia, Laos, and Myanmar. Substantial progress has been made in power cooperation, and cooperation mechanisms have been constantly improved. In this context, greatly stimulating the complementary demand for energy and the potential of technological cooperation will offer a strong impetus for the sustainable economic advancement of relevant countries.
In the context of outstanding progress in international energy cooperation and the establishment of an overseas diversified oil and gas supply guarantee system, whether the implementation of the B&RI can effectively empower EPE has become a key topic that needs to be discussed urgently. In addition, enterprises will consider factors such as the political environment, economic foundation, legal, and cultural risks of the host countries when investing in energy facilities and technologies. Unstable factors can lead to misunderstandings and conflicts when enterprises carry out project cooperation. What impacts these host country differentiation factors have on the EPE effect of the B&RI has not been paid attention to and verified by scholars. Under the carbon neutrality goal, while the B&RI countries cooperate in electricity to improve the power supply of the host country, what impact it will have on the carbon dioxide (CO2) emissions of the host country is also an issue that needs to be further explored. In this regard, this study takes 126 countries around the world as research objects, adopts 20 years of data from 2000 to 2019 as samples, and regards the B&RI as a quasi-natural experiment. While examining the influence of the B&RI on EPE in host countries, we further explore its actual effect on carbon neutrality. This discussion provides an essential reference for optimizing energy cooperation along the B&RI, empowering global EPE, and helping to achieve carbon neutrality goal.
Our study contributes to the current literature in the following three aspects. First, most B&RI countries have substantial advantages in renewable energy generation such as solar and wind power. As the cleanest energy, electricity has the potential to empower EPE, and whether and how it will be affected by the B&RI has not received attention. This study therefore innovatively adopts the policy evaluation method to check the actual impact of the implementation of the B&RI on the EPE effect of the host countries from the electricity popularity dimension. Furthermore, Che et al. [2] has examined the impact of the B&RI on EPE, but the energy poverty index it builds only comprises energy availability and affordability. Since it is a complex and multidimensional concept, we gauge a composite index from three ways: energy availability, cleanliness, and affordability for further testing. This exploration provides a substantive and valuable reference for identifying the underlying influence of the joint construction of energy community and achieving the sustainable goal from the dimension of the B&RI energy cooperation.
Second, when the B&RI actively encourages enterprises to carry out investment activities, enterprises will carefully cooperate with the host countries in combination with the factors such as economic foundation, religious culture, and political risks to avoid unnecessary losses and consequences. Thus, this study attempts to explore heterogeneity by dividing the entire sample into various regions in terms of the differences in income and political risks. This offers empirical evidence for firms to carry out high-value investment activities and significantly boost the construction of an energy community with a shared future.
Third, the main sources of global electricity currently include thermal power generation such as coal, oil, and gas, and renewable energy generation. For this reason, we further examine how the B&RI will affect the realization of the carbon neutrality goal when it influences the global EPE. In other words, this study finally focuses on the ecological consequences of the EPE effect of the B&RI. This lays a vital foundation for the investing and host countries to adjust the power generation structure and completely achieve the goal of carbon neutrality.
2. Literature Review and Theoretical Hypothesis
2.1. Policy Background
As Chaudhry and Shafiullah [1] stressed, EPE is a problem plaguing the whole world. Some studies indicate that this phenomenon occurs mainly in developing countries and is mainly caused by resource shortages [6]. In developed countries, it is also one of the thorny social problems, the high price of energy and the low efficiency of energy use are the main reasons [7]. In response to this issue, some developed countries have tried to boost EPE by subsidizing funds and helping residents install high-quality energy equipment. Specifically, France is the first country to introduce measures aimed at low-income households to cover the accumulated energy debt. Its “Grenelle 2” law, on the basis of defining EPE, applies a pension fund subsidy for citizens’ main residence, which is used to improve living conditions. As one of the countries of particular concern for EPE, the United Kingdom has introduced four policies to promote EPE: the Home Energy Efficiency Scheme, the Carbon Emission Target Reduction Plan, the Warm Front, and the Home Assistance Package. These programs boost EPE by increasing heating subsidies, requiring energy companies to provide money to low-income or elderly residents, offering insulation and heating subsidy packages, and reducing taxes. Australia is also very concerned about EPE, the Family Assistance Package and Low-income Energy Efficiency Program have played a huge role in the field of EPE.
In response to EPE and carbon neutrality, Russia proposed the “Russian Energy Strategy until 2035”, which further clarified the need to diversify the energy structure and continuously increase the share of clean energy. Hydrogen energy, as a potential energy source, is also included in the strategy. In 2021, the Russian government approved the Strategy for the Development of Hydrogen Energy, which defines the goals, strategic initiatives, and key measures for the creation of a new energy industry in the low-carbon energy era to ensure the competitiveness of the national economy in the context of the global energy transition.
In recent years, African countries focus on energy transition and EPE issue, launch development plans, promote project construction, and develop renewable energy. As an early African country to develop solar energy, Kenya has launched a national renewable energy plan. It is calculated that the plan can meet the electricity demand of 70,000 households and 380,000 people. Tunisia has identified the development of renewable energy as a national strategy, and actively built solar photovoltaic power plants and wind power plants. Morocco is also targeting renewable energy, aiming to increase the share of renewable energy in the energy mix to 52% by 2030. Egypt has encouraged the renewable energy, formulated the “Vision 2030”, Egypt’s “Comprehensive Energy Strategy 2035”, and the “National Climate Strategy 2050” plan, and indicated it would make full use of solar energy and wind energy to boost the implementation of renewable energy projects. The specific strategies and policies of countries related to EPE all list in Table A1 in Appendix A.
However, the policies introduced by these countries are mainly applicable to their own development, and international energy cooperation is also an essential means to help EPE. The B&RI offers a high-quality platform and resources for energy cooperation among these countries, aiming to jointly build an open and inclusive community of energy interests shared by all. The B&RI is a transnational economic cooperation framework proposed by China in 2013. Its core principles are extensive consultation, joint contribution, and shared benefits. It aims to promote the common development of participating countries through five cooperation priorities: policy coordination, facilities connectivity, unimpeded trade, financial integration, and people-to-people bonds. The initiative is not a unilateral domestic policy of China; rather, it operates in an open and inclusive manner, with participating countries voluntarily joining through bilateral or multilateral agreements. Through four channels—infrastructure investment, trade promotion, technology transfer, and financial support—the B&RI has had a significant impact on the economic development and energy accessibility of host countries.
2.2. Theoretical Mechanism and Research Hypotheses
The international energy cooperation derived from the B&RI has profoundly promoted the sustained transition of the global energy system. As the strategy advances, its impact on the host country’s energy system has been widely validated. Existing studies mainly focus on the nexus between the B&RI and energy consumption [8,9,10], ecological degradation [11,12], and energy efficiency [13]. However, the direct link between the B&RI and EPE, together with its environmental consequence, has not been fully articulated. This study therefore concentrates on the direct effect of the B&RI on EPE and its environmental trade-off.
A growing body of literature has documented how the B&RI may improve energy access and energy-related outcomes in host countries. Che et al. [2] and Zhou et al. [14] verified that participating in the B&RI could effectively stimulate EPE. Qi et al. [15] found an increased level of total factor energy efficiency in B&RI nations, while Wu et al. [16] confirmed that the B&RI significantly promotes energy efficiency in resource-rich, low-income countries. Studies also revealed that financial development [17] and trade integration [18] boost energy productivity. In addition, Li et al. [19] showed that Chinese renewable power investments in Pakistan potentially created 8905 jobs and generated 39.8 million output values, while Ma et al. [20] indicated that the B&RI can significantly reduce the incidence of poverty. These findings suggest that the B&RI may directly improve energy accessibility and affordability in host countries, and they also highlight the role of income and purchasing power in household energy use [18,21].
More specifically, the literature points to several ways in which the B&RI can directly affect energy poverty in host countries. First, through outward foreign direct investment (OFDI) and engineering contracts, China participates in building power generation plants, transmission networks, and distribution grids, which expands the physical coverage of electricity supply and lowers the threshold for energy access. Second, the B&RI facilitates the transfer of advanced energy technologies, such as ultra-high voltage transmission and photovoltaics, which can enhance energy utilization efficiency, reduce the unit cost of electricity, and make modern energy more affordable for low-income groups. Third, infrastructure investment acts as an economic stimulus, creating jobs and raising household incomes, thereby providing the purchasing power needed to afford electricity and household appliances. Fourth, the effectiveness of these direct effects may depend on the host country’s institutional environment. In countries with stable governments, sound socioeconomic conditions, and effective control of corruption, B&RI projects are more likely to be executed efficiently and benefit the public, whereas high political risks may lead to fund misappropriation and low project efficiency. These observations suggest that the direct EPE effect of the B&RI may vary across different economic and institutional contexts. Therefore, we propose the first hypothesis:
Hypothesis I.
The implementation of the B&RI significantly promotes EPE in host countries, and this effect exhibits significant heterogeneity across different economic and institutional contexts.
However, while the B&RI promotes energy access and economic growth, the promotion and popularization of electricity may exacerbate environmental pressures. Chen et al. [22] and Tang et al. [23] pointed out that B&RI nations remain highly polluting and energy-intensive, and the B&RI would increase total CO2 emissions. The expansion of energy supply, often dominated by traditional thermal power generation structures in host countries, could lead to increased greenhouse gas emissions. Therefore, it is necessary to explore the environmental trade-off of the B&RI’s EPE effect. We propose the second hypothesis:
Hypothesis II.
The promotion of electricity in B&RI countries increases CO2 emissions, with the environmental consequence closely related to the different types of national power generation.
3. Methodology
3.1. Model Construction
3.1.1. Benchmark DID Model
The difference-in-difference (DID) model is one of the mainstream methods currently used to evaluate the effects of policy or strategy [24,25]. The B&RI proposed in 2013, as an economic cooperation strategy implemented in some countries, offers a feasible and excellent quasi-natural experiment for this study to adopt the DID method. In this regard, the B&RI officially put forward in September 2013 is considered as a quasi-natural experiment, and the specific effect of the implementation of the B&RI on the EPE effect of the host country is examined by using the DID model. Notably, although countries formally joined the B&RI at varying times, we adopt 2013 as the common treatment year. The reason is that the 2013 policy shock is highly exogenous and macro-level; China’s OFDI, infrastructure contracting, and policy coordination began responding collectively from 2013 onward, making it the theoretically appropriate point to capture the overarching policy shock. Therefore, we selected the countries that had already signed cooperation agreements or memorandums of understanding with China during the sample period as the treatment group, while the others are classified as the control group. The empirical equations are built as follows:
where i and t represent country and year, respectively. refers to the national fixed effect, indicates time fixed effect, and is the error term, which involves all other unobservable influencing factors. Yit denotes the degree of EPE. Treat means the initiative grouping variable, Post is a time grouping variable that represents a dummy variable before and after the proposal of B&RI, and DID means their interaction item. Controls is a covariate group that involves economic growth, industrial structure, trade structure, population density, and urbanization level. denotes the coefficients of covariates. is the core parameter that our study focuses on, indicating the actual EPE effect of the B&RI.
3.1.2. DID Model for Environmental Consequences
As Dong et al. [26] and Kartal [27] indicate, consuming energy is the main cause of CO2 emissions. In other words, in the era of advocating carbon neutrality, the issue of carbon emissions cannot be ignored when examining energy-related issues. More importantly, it is imperative to consider the types of sources of electricity supply, such as coal-fired power, oil-fired power, natural gas power generation, and renewable energy power generation, when examining EPE from the perspective of electricity. On this basis, a meaningful question has triggered our thinking: what impact will the B&RI have on the greenhouse effect of the host country when it boosts EPE? Positive or negative? Thus, on the premise of assessing the EPE effect of this strategy, we further evaluate the environmental consequences of this effect. The specific model construction is presented as follows:
In Equation (3), PCO2 refers to per capita CO2 emissions, which is the core explained variable examined in this chapter. represents the increased access to electricity resulting from the B&RI. The coefficients in front of the variables are all parameters to be evaluated, and the others are the same as Equation (1). As the countries along the B&RI have been committed to cooperation in renewable energy projects in recent years, actively boosting the construction of power networks and injecting strong momentum into regional power supply, we anticipate that the coefficient of in Equation (3) will be significantly positive.
3.2. Data and Variables
This study manually collects statistical data of 126 countries from 2000 to 2019, resulting in 2520 country-year observations, mainly sourced from the World Development Indicators promulgated by the World Bank. We also exclude samples with more missing data, and utilize linear interpolation to fill in some missing data. The variables are as follows:
3.2.1. Explained Variable
Energy poverty eradication (expressed by EPE). The purpose of this study is to assess the EPE of countries along the B&RI from the electricity dimension. The share of the population who can effectively obtain electricity in each country is therefore utilized to gauge energy poverty level.
3.2.2. Core Explanatory Variable
Belt and Road Initiative dummy variable (denoted by DID, i.e., Treat × Post). DID means an interaction item, and its coefficient reflects the policy effect of the B&RI. In the sample interval, Treat is the initiative grouping variable, if country i participates in the B&RI, it will be considered as the treatment group with Treat being 1; otherwise, country i is regarded as the control group with Treat being 0. Post is a time grouping variable that represents a dummy variable before and after the proposal of B&RI. If t is before 2013, then Post is 0, and otherwise it is 1.
3.2.3. Covariates
To avoid estimation bias caused by missing variables, the covariates are selected as follows: (1) Economic growth (PGDP) is gauged by per capita gross domestic product (GDP) (2010 constant US dollars); (2) industrial structure (STR) is assessed by the industrial value added as a share of GDP; (3) trade structure (TRA) is measured by trade as a percentage of GDP; (4) population density (DEN) mainly utilizes the number of people per kilometer of land area as the proxy variable; and (5) rural population share (RUL) is evaluated by the percentage of rural population in the total population. The descriptive statistics of the main variables are shown in Table 1, and Table A2 in Appendix A lists the test outcomes of empirical correlation and multicollinearity. Notably, due to the relatively larger values of PGDP in the descriptive statistics, we apply a natural logarithmic transformation to PGDP during the regression analysis.
Table 1.
Summary statistics of the main variables.
4. Results
4.1. Results of the Benchmark Estimates
Table 2 reports the results of the impact of the B&RI on the EPE in host countries based on four regression techniques, i.e., pooled ordinary least square (OLS), fixed effect (FE), Tobit, and system generalized method of moments (SYS-GMM). Since the data in the dependent variable is limited or remains unchanged in some years, the Tobit model can effectively deal with such cases, identify the influence of outliers, and offer more accurate estimates. Columns (1), (3), (5), and (7) do not add control variables, while (2), (4), (6), and (8) include all covariates. Compared with the first three test approaches, we use SYS-GMM as the baseline estimator because the model includes a lagged dependent variable and potentially endogenous covariates. SYS-GMM addresses dynamic panel bias and endogeneity by combining the difference and level equations and using lagged values as instruments; thus, the estimated results of SYS-GMM are regarded as the baseline regression estimates. From Table 2, the regression coefficient of DID after adding covariates is 1.526, which suggests that compared with countries not participating in the construction of B&RI, the degree of EPE in countries participating in the B&RI has increased by 1.526.
Table 2.
Estimation outcomes of the baseline regression.
4.2. Sensitivity Checks
Five sensitivity tests are carried out to empirically check the robustness of the benchmark estimates, as follows:
4.2.1. Sensitivity Check I: Parallel Trend Test
The hypothesis of parallel trend is the first prerequisite for applying the DID model [28]. This assumption requires that if the B&RI is not launched, the trend of EPE in countries participating in the construction of B&RI and those not participating in the construction of B&RI is consistent [29]. To test this trend, this study introduces the event study method, and the model can be constructed as follows:
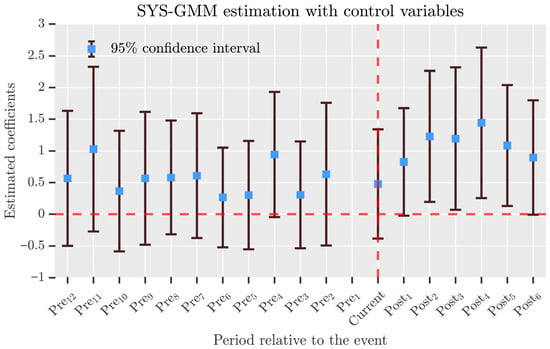
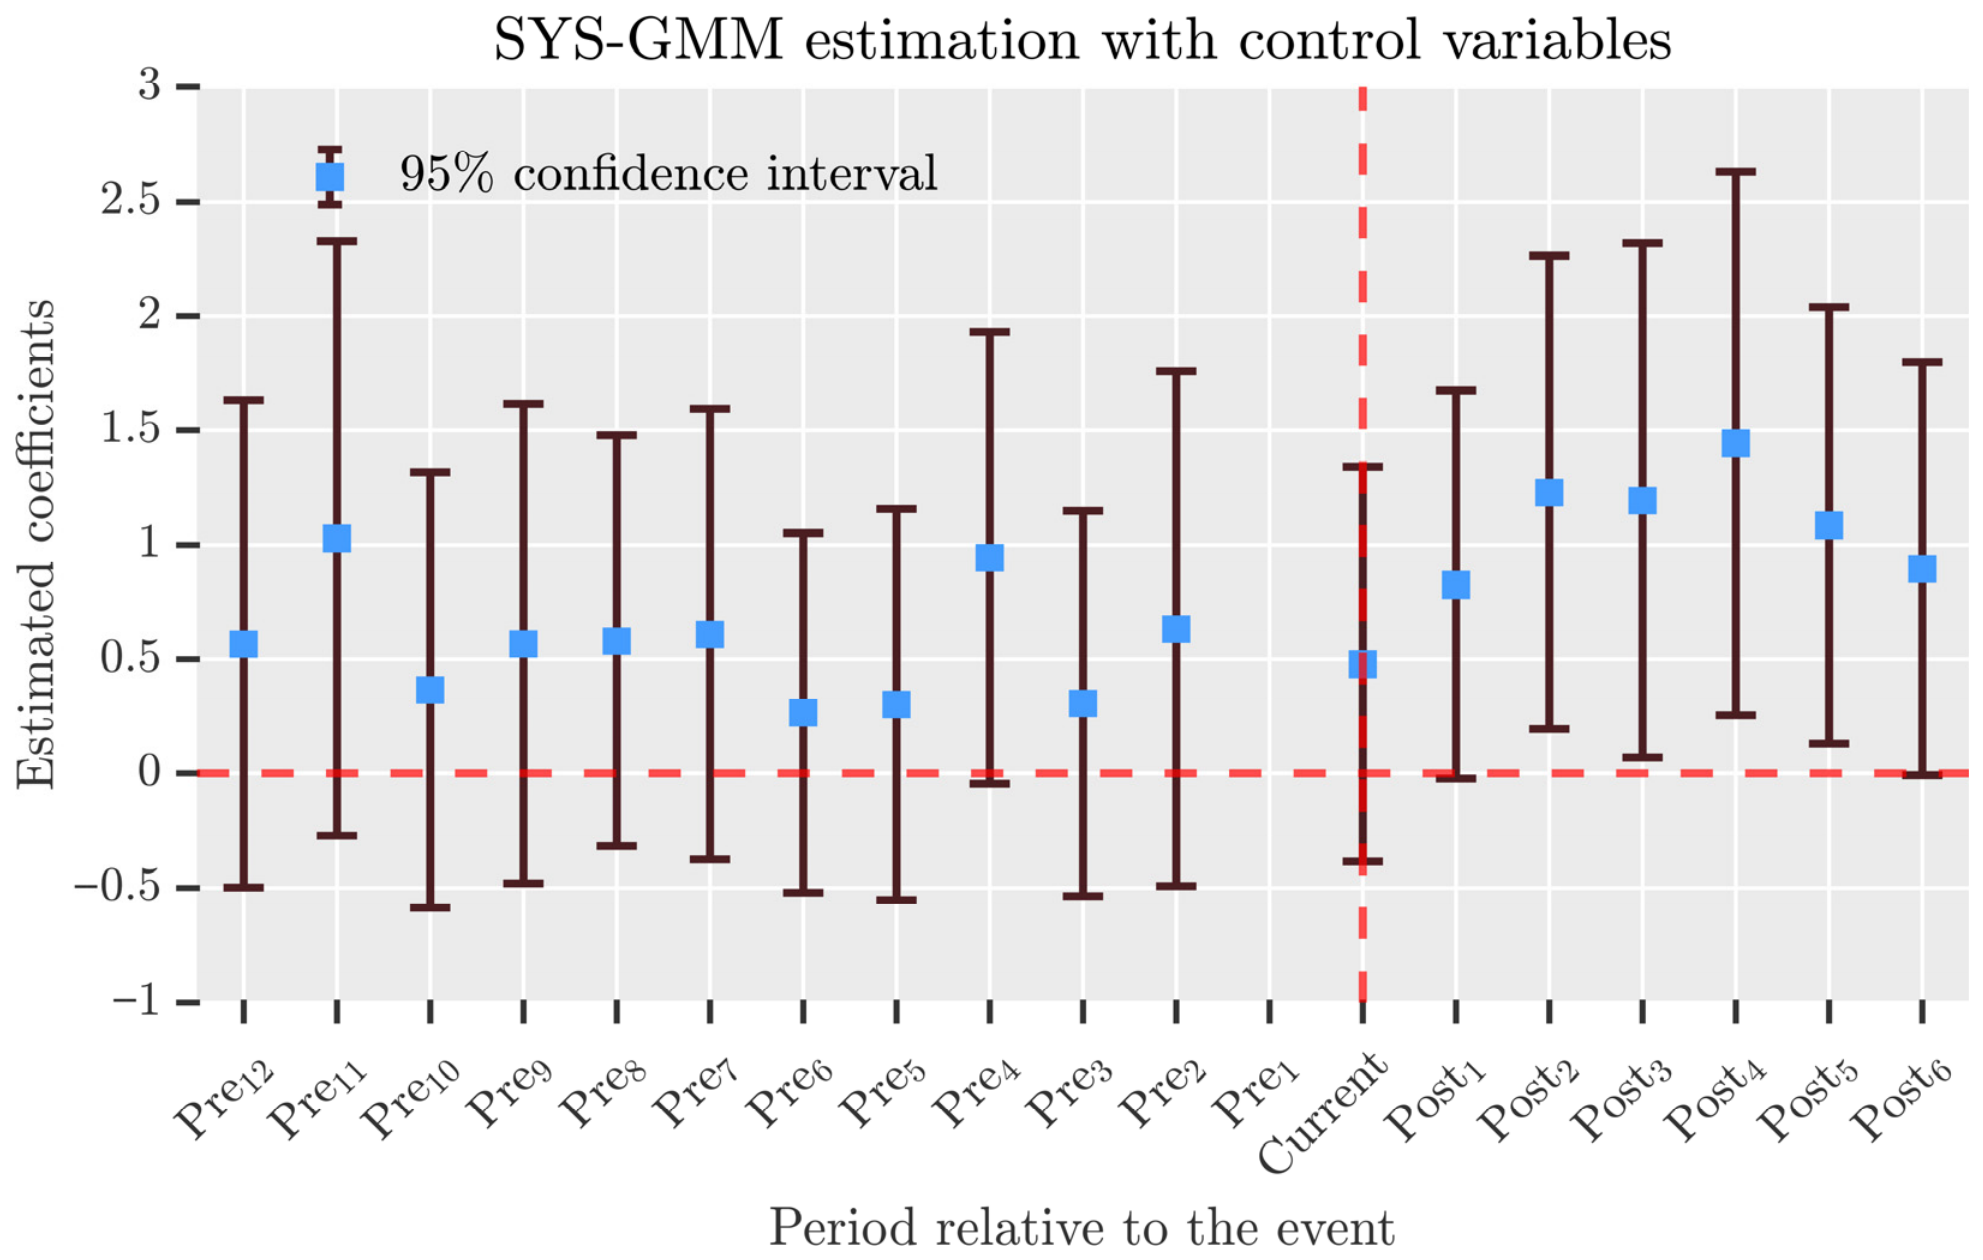
where reflects the differences in EPE between countries that did not participate in the construction of the B&RI and those that participate in the B&RI in the t year of the implementation of the B&RI. The symbolic meanings of the remaining variables are the same as those in Equation (1). This study draws a parallel trend chart for the 12 years before and 6 years after the implementation of the B&RI. Figure 1 shows the dynamic effects of the B&RI.
Figure 1.
Sensitivity check I: Common pre-trend test. Note: the p value of the joint test of pre-treatment years is 0.8056.
Clearly, the figure plots the estimated coefficients and 95% confidence intervals from 12 years before to 6 years after the policy shock. All pre-treatment coefficients are statistically insignificant at least the 5% significance level, and the joint test fails to reject the null hypothesis that they are jointly zero (p = 0.8056). This supports the parallel trend assumption. The coefficient in the treatment year (Current) is insignificant, while the coefficients from Post2 to Post5 are significantly positive at least the 5% significance level, indicating that the EPE effect of the B&RS emerges gradually and persists over time. This dynamic pattern is consistent with the long construction cycles of energy infrastructure projects.
4.2.2. Sensitivity Check II: Alternative Policy Shock Period
The Silk Road Economic Belt and 21st Century Maritime Silk Road were put forward in September and October 2013, respectively. More importantly, the proposal of a policy or strategy usually has a significant time lag in its effectiveness. This point is also validated in the parallel trend test. The launch of the B&RI in 2013 provided a preliminary notice and call for some nations to participate in the B&RI and carry out relevant cooperation. To test the delay of the policy and improve the validity of the results, this study further re-estimates Equation (1) with 2014 as the policy occurrence point; the corresponding outcomes are presented in Table 3. Obviously, the test outcomes are consistent with the benchmark estimates, confirming the reliability of the conclusions on policy lag effect and positive effects of B&RI on EPE across the globe.
Table 3.
Results of sensitivity check II: Alternative policy shock period.
4.2.3. Sensitivity Check III: Applying the Alternative Technique
Further, our study attempts to use the propensity score matching (PSM) technique to address the endogeneity issues caused by the application of national dimension statistics, which is a popular tool in the field of economies to deal with self-selection bias [30]. This approach seeks one or more individuals with the same or similar background features from the control group for each individual in the treatment group, and converts the original study data into randomized controlled trial data, with the aim of reducing the interference of data bias and confounding factors. Its basic principle is to replace multiple covariates with a single score and balance the distribution of covariates in the two groups. For the confounding factors in non-randomized studies, the randomization-like equilibrium treatment can effectively reduce selection bias. This ensures that the estimated objects can preferably satisfy the parallel trend hypothesis of the DID estimation. Subsequently, the matched samples are utilized for panel DID estimation to weaken the systematic differences between economies and reduce the estimation bias of using the DID alone.
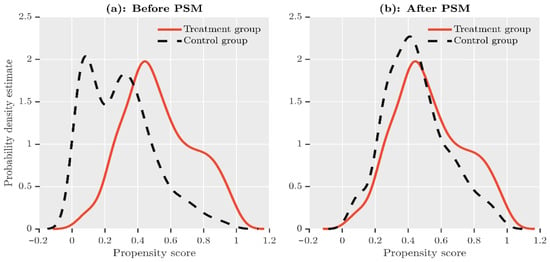
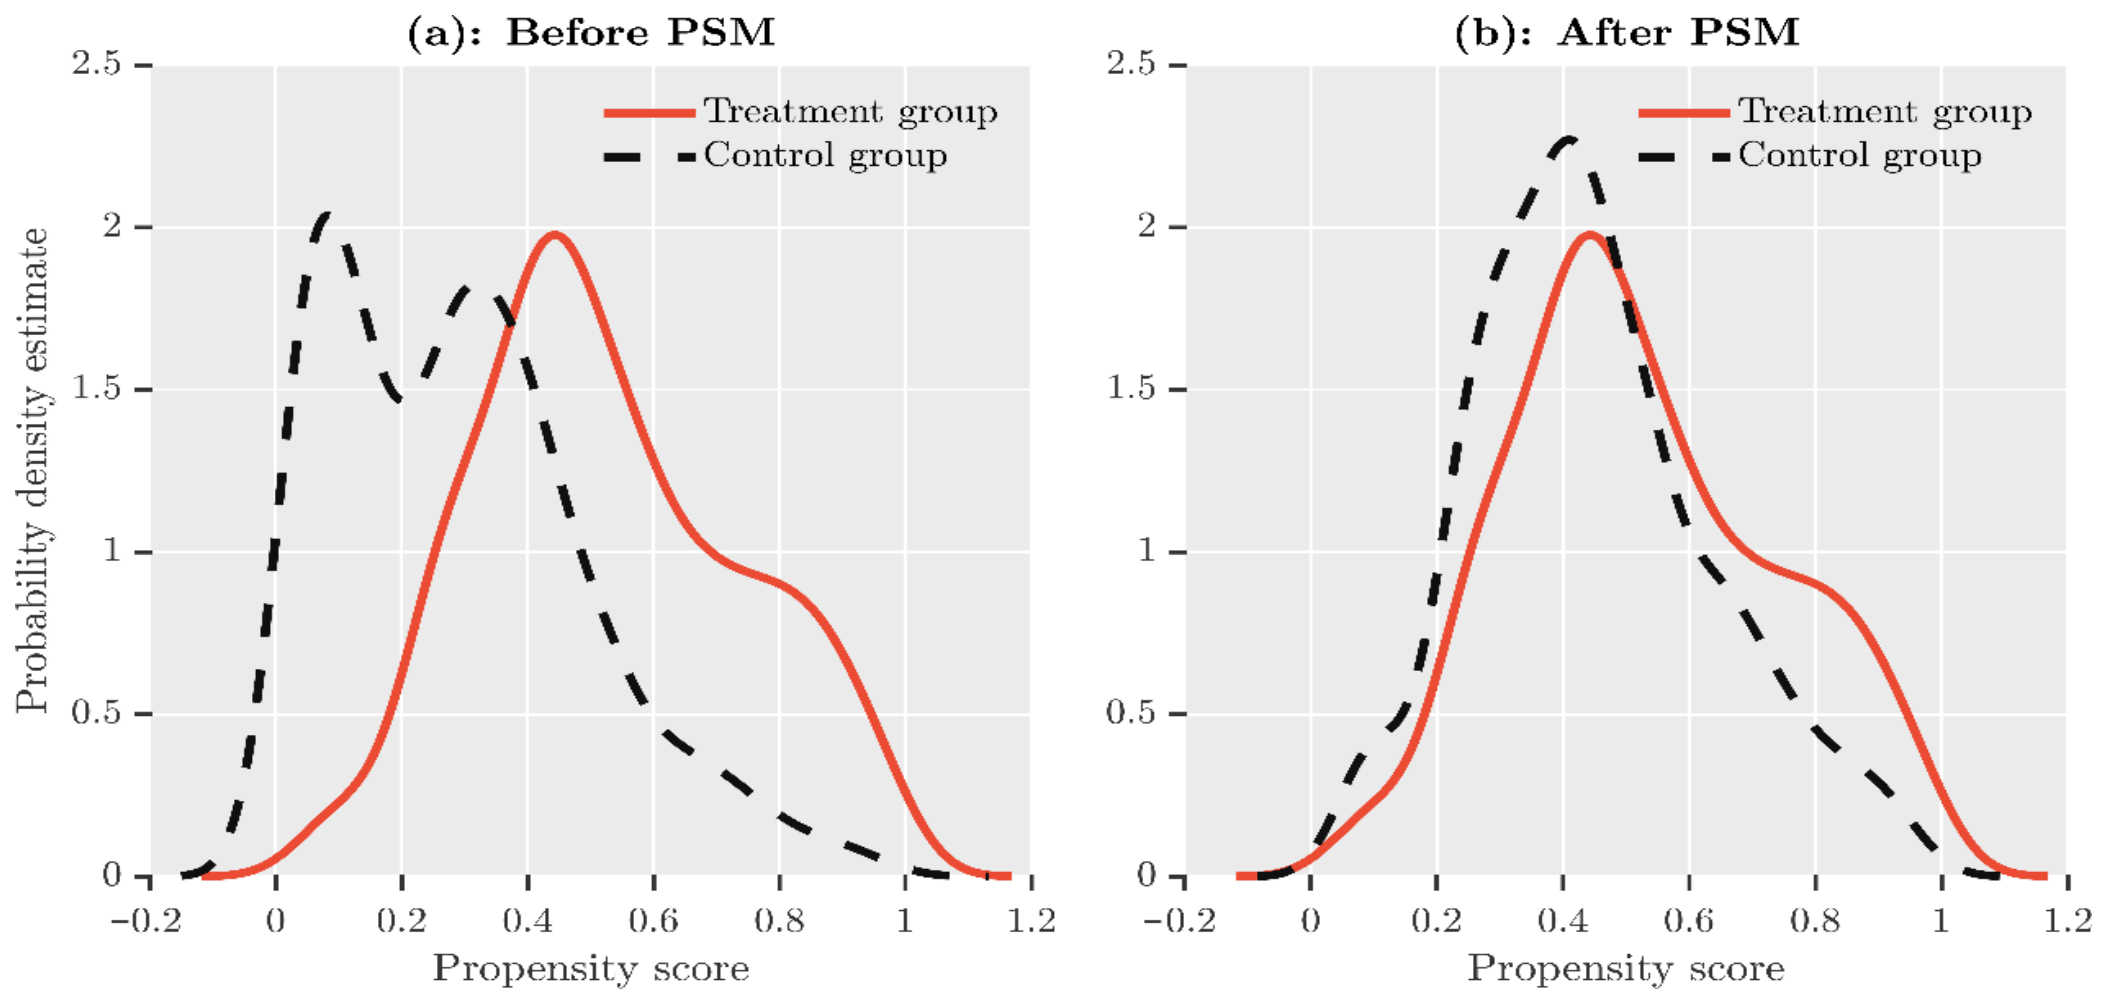
Figure 2 plots the probability density estimates for the treatment and control groups before and after PSM process. Apparently, after matching, the differences between the two groups significantly narrowed. Table 4 also reports the regression outcomes using the PSM-DID approach, which suggests that no essential changes have occurred in the estimation outcomes after data matching, confirming the reliability of the findings.
Figure 2.
Probability density estimate before and after PSM.
Table 4.
Results of sensitivity check III: Propensity score matching (PSM)-DID.
4.2.4. Sensitivity Check IV: Time-Based Placebo Test
Notably, the degree of EPE in nations participating in the B&RI and nations not participating may be due to time changes. To exclude this possibility, the counterfactual method is adopted in this study, and the policy occurrence time of the B&RI is set as 2009, 2007, 2005, and 2003, respectively. On this basis, this study constructs a virtual policy time variable and multiplies it with Treat, thus generating a virtual interaction item (i.e., PseudoDID) and performing regression on Equation (1) again; the corresponding outcomes can be seen in Table 5.
Table 5.
Results of sensitivity check IV: Time-based placebo test.
It is easy to find that under the assumption of virtual policies at different time points, the coefficient estimates of the four interaction items fail to pass the statistical test at the 10% level, indicating that no systematic variance is discovered in the time trends of countries participating in the B&RI and countries not participating in the B&RI, and it also reflects that the change in EPE in host countries is indeed caused by the joint construction of the B&RI.
4.2.5. Sensitivity Check V: Region-Based Placebo Test
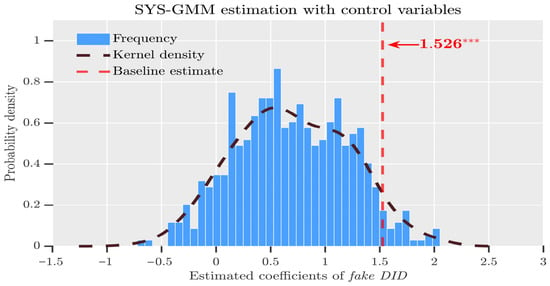
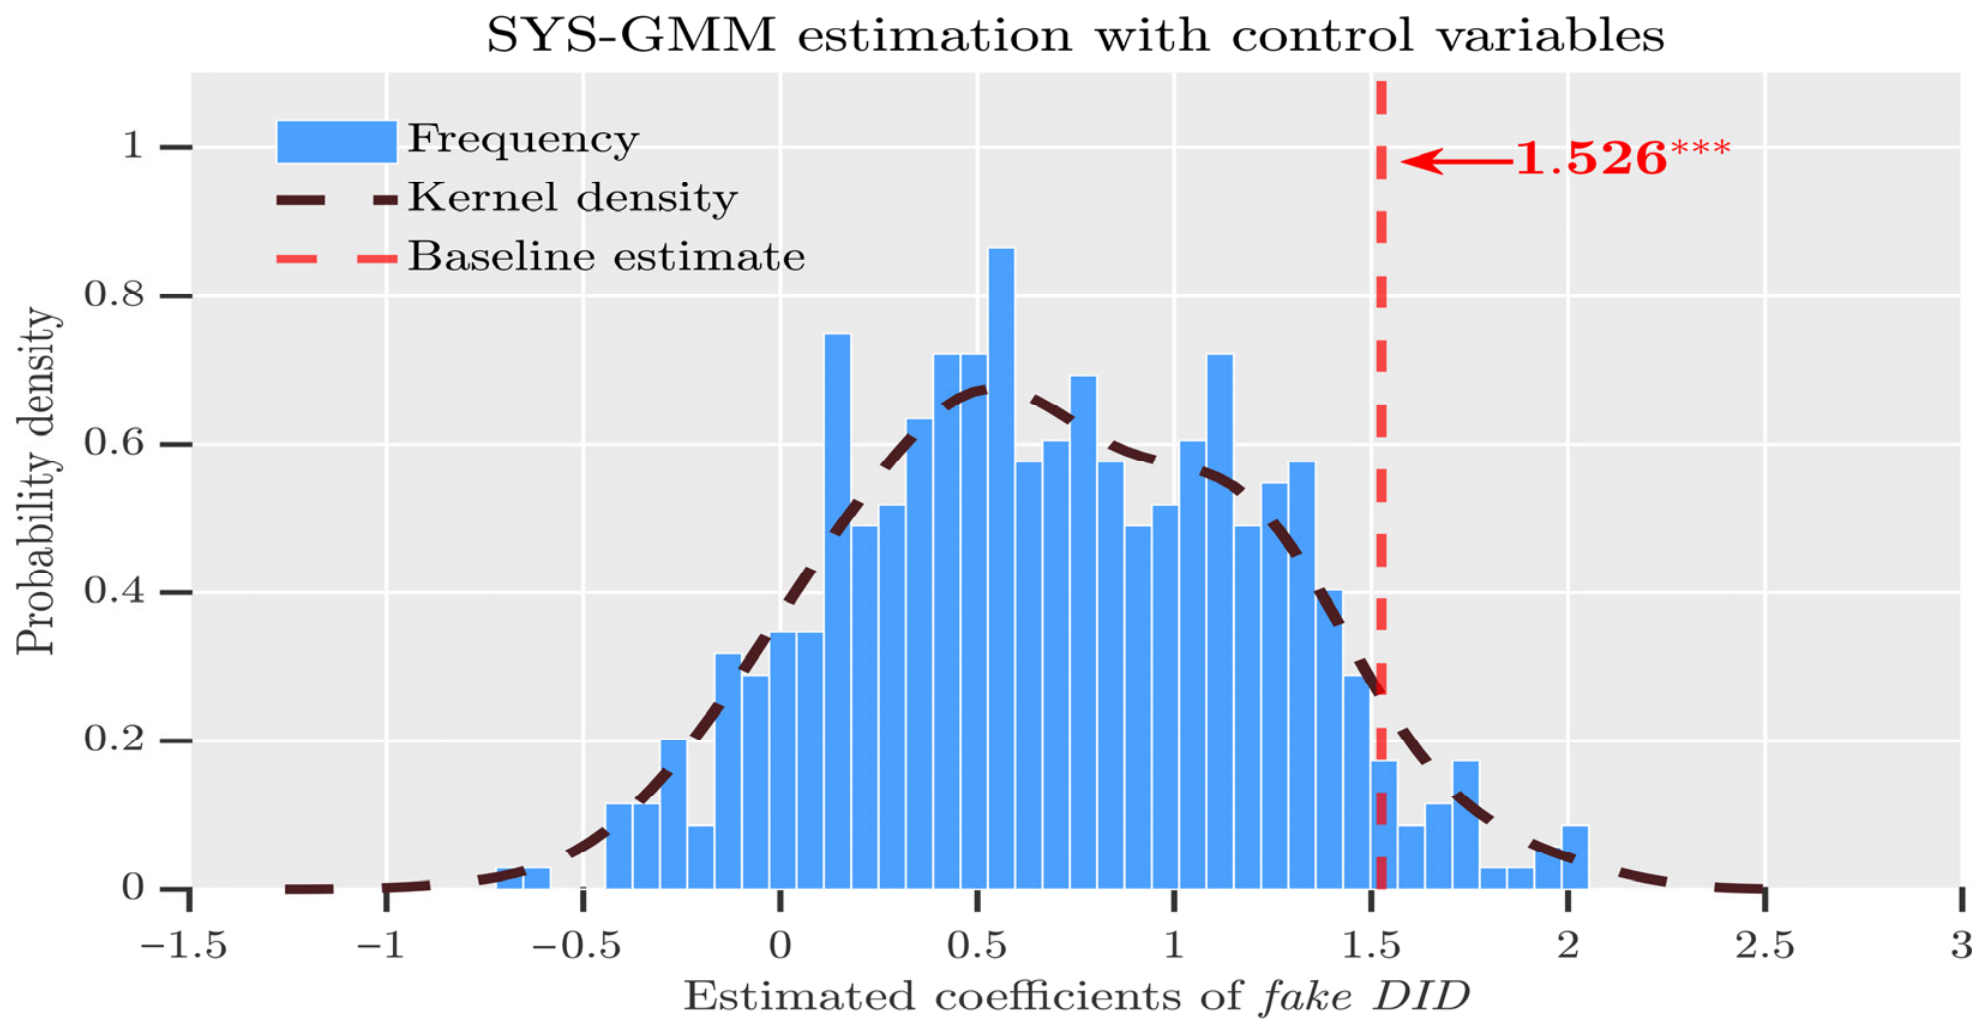
Following the work of Shi et al. [31], countries in the sample are randomly selected as the sham treatment group, and the remaining countries are taken as the control group. Moreover, the initiative implementation time of these processing groups is randomly determined, the false interaction term is constructed, and the coefficient estimate of the false interaction item is obtained by regression of the model. On this basis, this study repeats the above operation 500 times to successively acquire 500 regressive parameter values and their consequential p values. The p values, estimated coefficients, and kernel density distribution are plotted in Figure 3.
Figure 3.
Sensitivity check V: Region-based placebo test. Notes: the p value of the randomization inference is 0.0460 and *** represents the significance at the 1% significance level.
It can be observed that the placebo coefficients are positive on average, reflecting the general improvement in electricity access across developing countries during the sample period. The baseline estimate (i.e., 1.526) lies in the far right tail of the placebo distribution, and the empirical p value is 0.0460, indicating that the baseline effect is statistically significant at the 5% level. This suggests that the baseline result is not driven by random factors or common trends.
4.3. Results of the Addressing Endogeneity Issues
Although the SYS-GMM has advantages in dealing with possible endogeneity issues, especially in dynamic panel data analysis, the validity of the approach depends on the choice and quality of instrumental variables (IVs). To test the reliability of the results, we further use the two-stage least squares (2SLS) technique to check the EPE effect of the B&RI. Since the selection of IVs relies on whether the conditions of correlation and exogeneity are met, we therefore select whether a country belongs to the country along the ancient Silk Road of China (IV_Ancient) to construct the IVs. Notably, since this IV has a time-invariant property, we use IV_Ancient × Post as the IV for this study.
The rationality of the IVs lies in the fact that countries along the ancient Silk Road share a historical foundation of connectivity and are priority partners for infrastructure and energy cooperation under the B&RI, which satisfies the relevance condition. However, whether a country lies along the ancient Silk Road was determined by historical and geographical conditions dating back thousands of years. It is therefore a predetermined variable and is not subject to reverse causality from contemporary energy poverty levels. Moreover, ancient Silk Road history itself does not directly determine contemporary energy access; it can affect energy poverty only through B&RI cooperation projects that improve energy infrastructure. This satisfies the exclusion restriction.
Obviously, the outcomes of the first stage in Table 6 indicate that the estimation coefficients of the IV is significant at the 1% level, which suggests that the IV meets the correlation conditions, while the results of the second stage regression denote that the estimated parameters of DID are significantly positive, suggesting that the B&RI significantly boosts the popularization of electricity in host countries and EPE, which confirms the robustness of the benchmark regression.
Table 6.
Outcomes of addressing endogeneity issues.
4.4. Results of the Heterogeneous Effects
4.4.1. Heterogeneity I: High-, Middle-, Versus Low-Income Countries
To empirically check whether significant heterogeneity exists in the degree of EPE in different income countries in the face of the implementation of the B&RI, the sample is divided into high-, middle-, and low-income countries, and quantitative regression is performed on the three subsamples. Table 7 reports their regression outcomes. Clearly, the regression estimates of DID in high- and middle-income countries are insignificant, while that of DID in low-income countries is significantly positive at the statistical level of 5%.
Table 7.
Heterogeneity analysis: high-, middle-, versus low-income countries.
4.4.2. Heterogeneity II: Low-Political-Risk Versus High-Political-Risk Countries
In addition to discussing the impact of income disparity, we further compare the heterogeneity of the EPE effect of the B&RI in terms of political risk disparity, grouped by four dimensions of political risk: government stability, socioeconomic conditions, investment profile, and corruption. The relevant data are from the International Country Risk Guide (ICRG) published by PRS Group. We calculate the average values of each indicator, and those above the average are classified as High, while those below the average are classified as Low. Countries without political risk data are excluded. The results are shown in Table 8. The coefficient equality tests (i.e., Chowtest) for all four dimensions reject the null hypothesis of no difference between sample coefficients, confirming statistically significant heterogeneity in the policy effect. The AR(2) and Hansen test results generally support the validity of the dynamic GMM specification across subsamples. Overall, the positive effect of the B&RI on EPE varies significantly across different political risk dimensions, and this positive effect is particularly pronounced in host countries with high political stability, low socioeconomic conditions, high investment profile, and low corruption.
Table 8.
Heterogeneity analysis: low-political-risk versus high-political-risk countries.
4.5. Results of the Environmental Consequences of the B&RI
Table 9 lists the outcomes of the impact of the EPE effect induced by the B&RI on the CO2 emissions of host countries. Obviously, the statistical values of AR (1), AR (2), and Hansen have passed the test, confirming the validity of the DIF-GMM and SYS-GMM techniques. The results of the four approaches (i.e., OLS, FE, DIF-GMM, and SYS-GMM) show that the EPE effect caused by the B&RI produces a significant positive influence on CO2 emissions. This is consistent with Hypothesis II. Implicitly, the promotion in the B&RI countries are positively associated with greenhouse effect in host countries.
Table 9.
Environmental consequence analysis.
4.6. Results of the Impact of B&RI on the Multidimensional Energy Poverty
Notably, although the popularized electricity can reflect EPE issue from the two dimensions of energy supply and energy cleanliness, many scholars have stressed that EPE is a multidimensional issue involving multiple aspects such as energy supply, energy cleanliness, and energy affordability, and it is difficult to truly identify the EPE effect of the B&RI from the perspective of electricity alone. Accordingly, based on the work of Che et al. [32] and the features and realities of B&RI countries, we construct an index system from three ways: energy availability, energy cleanliness, and energy affordability (see Table A3), and then calculate the composite index of energy poverty in host countries (denoted by EPE_1) with the objective weighted entropy approach. Notably, this composite index is contrary to the actual situation of energy poverty. The larger the index, the lower the level of energy poverty. On this basis, Equation (1) is re-estimated based on the DIF-GMM and SYS-GMM methods, and the empirical results are listed in Table 10. Furthermore, we further employ the entropy weight-TOPSIS method to calculate the indicator system of Table A3 and obtain the composite index (denoted as EPE_2); the corresponding robust results are presented in Table A4. In this table, we discover that the coefficients of DID of the two methods are all significantly negative.
Table 10.
Outcomes of impact of China’s B&RI on multidimensional EPE effect.
5. Discussions
5.1. Discussions on the Benchmark Estimates
The positive effect of B&RI on EPE confirms that the building of the B&RI has played a valid and significant EPE effect. In other words, the advocacy and implementation of the B&RI is conducive to eliminating poverty in the energy field, enhancing universal energy services, and benefiting the people’s well-being of countries along the route.
At present, peace and development are still the theme of The Times [33]. The majority of countries along the B&RI are at a stage of preliminary rise and rapid evolution, and the desire for EPE is stronger. According to the report of IEA, the global energy poverty issue, especially in developing countries, reflects two dimensions: one is the insufficient provision of clean energy, and the other is the difficulty for residents with low incomes to purchase and use unpolluted and low- carbonized fuels [34,35]. To the best of our knowledge, energy is a critical area of cooperation in the joint building of the B&RI [36]. In September 2021, General Secretary Xi Jinping solemnly promised at the United Nations General Assembly that China would vigorously support the advancement of green energy evolution in developing countries, not build new overseas coal-fired power projects, and actively invest in green projects. With the support of China’s strong and efficient engineering construction capacity, China has deeply optimized the structure of the host country’s energy system, comprehensively promoted the reform of the supply and demand structure of the global energy market, boosted the clean transition of traditional energy and rapid evolution of the new energy industry, actively developed power projects, improved power supply capacity, and provided support for residents’ easy access to unpolluted electricity.
Additionally, when it comes to residents’ income, the B&RI has created a large number of public jobs for host countries through industrial investment and facility construction, and increased the income level of local residents. In response to the three major bottlenecks of lagging infrastructure, insufficient talents, and shortage of funds in some co-built countries, helping host countries integrate into the global industrial chain and supply chain through financial support and development equity funds will inject new vitality into the EPE cause of relevant countries and producing a positive promotion effect. The large-scale popularization of clean energy derived from the B&RI and the improvement of residents’ income level have laid an essential foundation for EPE in host countries.
5.2. Discussions on the Heterogeneity Effects
5.2.1. Discussions on the Heterogeneity in Different Income Countries
The heterogeneous results for different income countries in Table 7 imply that the promotion of the B&RI is particularly significant for EPE in low-income countries, which is consistent with the views of Wu et al. [16]. The possible reason is that energy is a critical field of cooperation among B&RI countries, and the establishment of the Energy Partnership in Beijing in 2019 marks the acceleration of the energy cooperation process [37]. The data from the Statistical Bulletin on China’s OFDI show that China’s energy cooperation with African countries rich in energy resources but with relatively weak economic foundation is relatively strong, and the construction of energy-related facilities is promoted at a faster pace. While building an energy community with a shared future, China has also leveraged its technological advantages in oil and gas exploration and development, as well as new energy fields such as coal-fired power, hydropower, wind power, and solar photovoltaic power generation. This significantly improves the overall economic level and electricity penetration level of low-income countries and helps to accelerate EPE process. In addition, China has formulated energy cooperation models in line with the basic national conditions of different countries, greatly improving the level of energy cooperation, which is of great significance for building a stable energy cooperation community and boosting EPE effect of the B&RI.
5.2.2. Discussions on the Heterogeneity in Different Political Risk Countries
The positive effect of B&RI on EPE in high political stability, low socioeconomic conditions, high investment profile, and low corruption countries can be explained in the following reasons. First, high political stability and low corruption imply a predictable policy environment and higher governance quality, enabling cross-border energy cooperation projects under the B&RI framework to obtain stable institutional support and reducing delays and cost overruns caused by political turbulence or corruption [38]. Second, countries with low socioeconomic conditions typically face more severe energy shortages and weak power infrastructure, so B&RI electricity investment can directly expand supply coverage and generate a significant marginal poverty reduction effect; in contrast, countries with high socioeconomic conditions already have relatively high electricity access rates, leaving limited room for further improvement. Finally, countries with a high investment profile have more complete legal regulations, property rights protection, and financial services, which can reduce the investment risks of Chinese enterprises and improve project execution efficiency, thereby enabling energy investment to translate more rapidly into improved electricity access. In summary, the EPE effect of the B&RI is not uniformly distributed across all host countries but depends heavily on their political stability, socioeconomic conditions, investment environment, and corruption control. This finding provides empirical evidence for differentiated and targeted energy cooperation policies under the B&RI framework.
5.3. Discussions on the Environmental Consequences of the B&RI
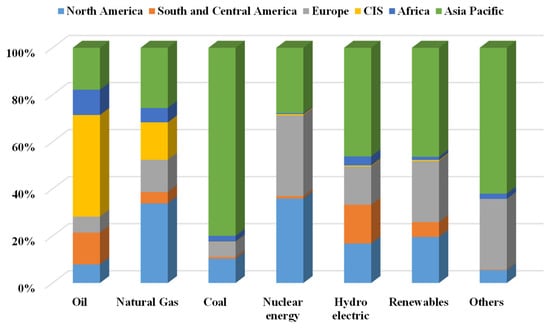
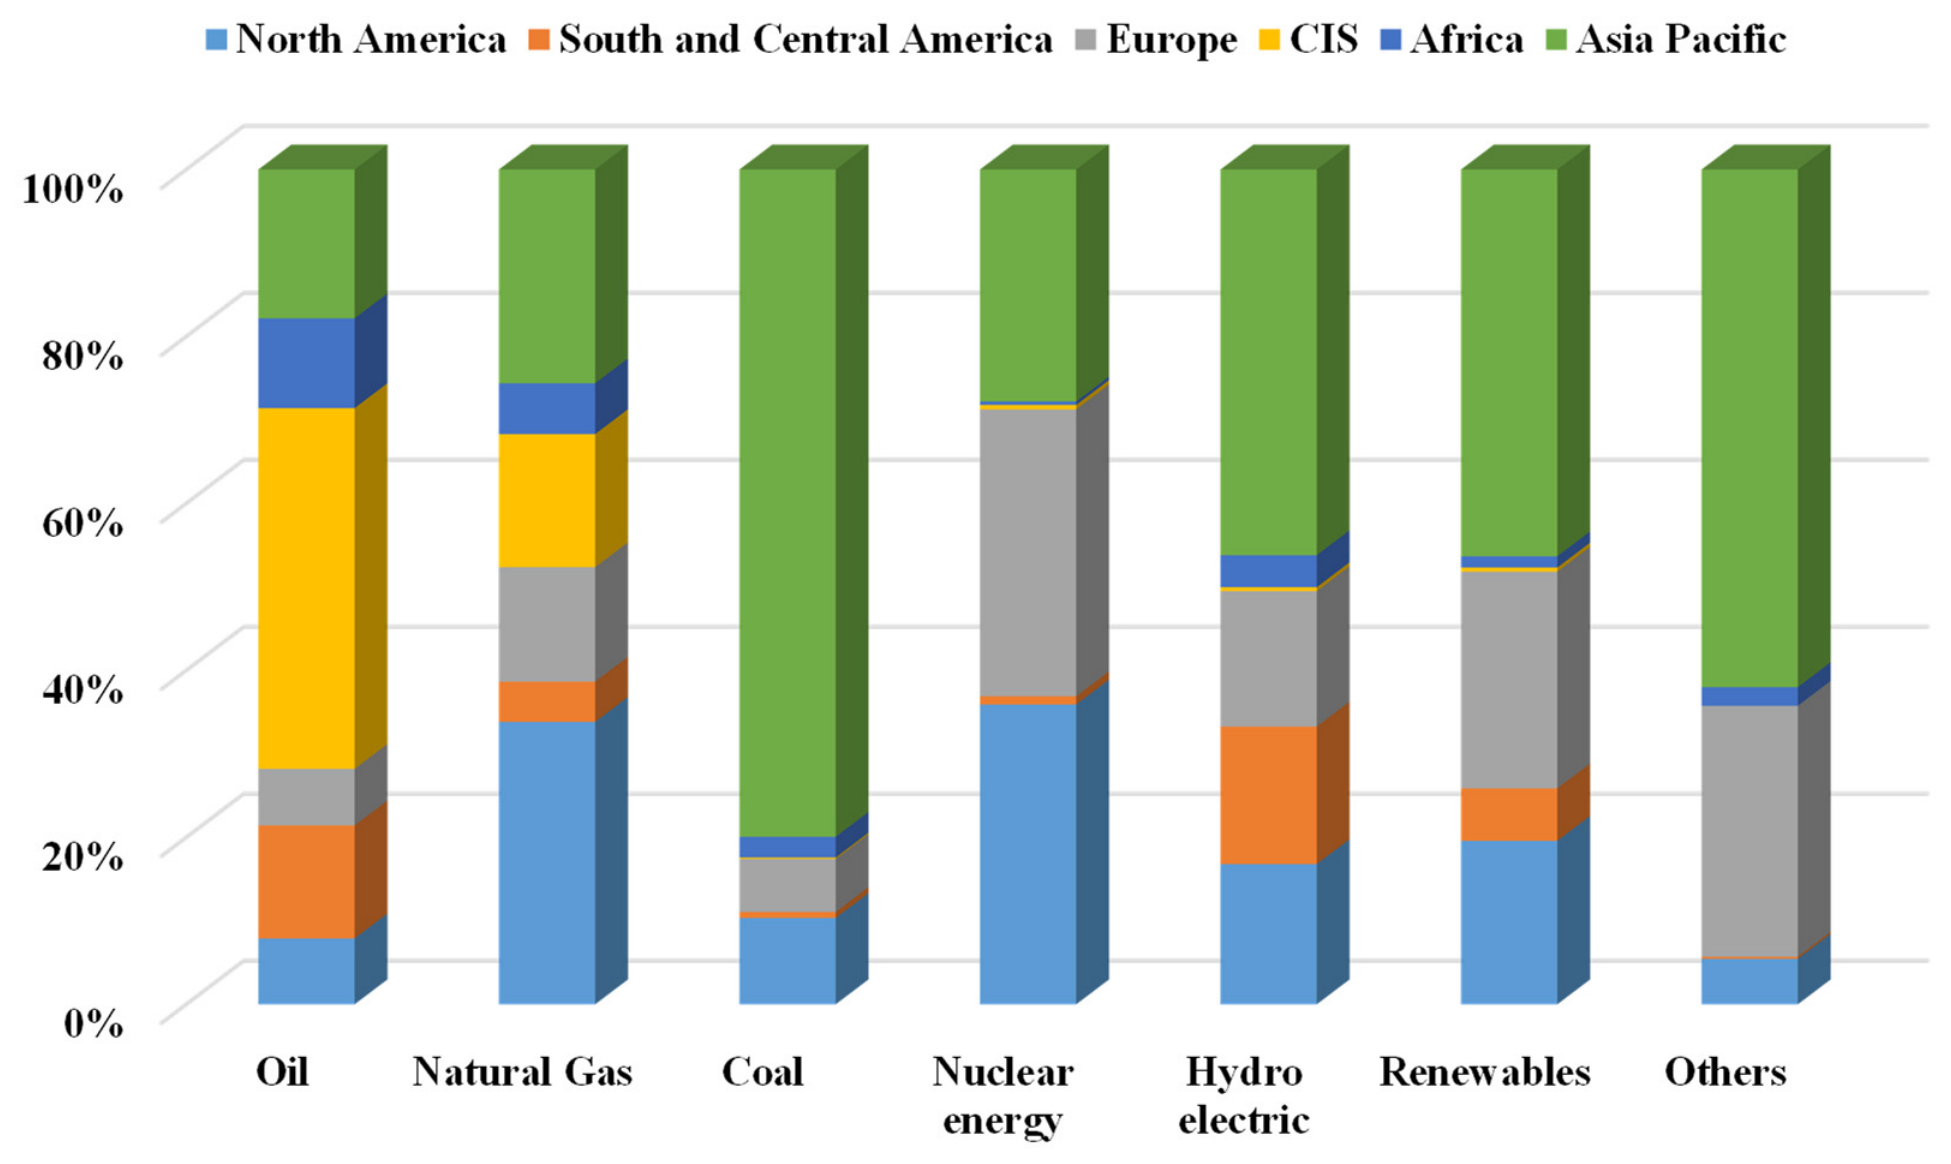
In Section 4.5, we find that the electricity access effect brought by the B&RI will increase the CO2 emissions of the host countries. This may be determined by the types of national power generation. Figure 4 shows the regional distribution of each power generation source in 2021, based on data from the British Petroleum Statistical Review of World Energy. In this figure, coal generation is heavily concentrated in the Asia-Pacific region, while natural gas generation is more evenly distributed across North America, Europe, and other regions. Africa accounts for only a very small share of global nuclear power. Overall, fossil fuels still account for a substantial share of global power generation. A possible explanation for the positive association between B&RI-induced electricity expansion and CO2 emissions is that many host countries rely on fossil-fuel-based generation.
Figure 4.
The proportion of different types of power generation in 2021. Notes: the bars represent the share of each source across regions and CIS represents Commonwealth of Independent States.
Notably, eradicating energy poverty and boosting carbon reduction are long-term processes that cannot accomplish at one stroke [35,39]. Jointly building the B&RI and strengthening power cooperation remain important prerequisites for achieving carbon neutrality. The studies of Tang et al. [23] show that enhancing the comprehensive cooperation of the B&RI has created an opportunity platform for implementing the carbon neutrality goal. The B&RI cover countries such as Russia, the Middle East, and Africa, which are endowed with superior energy resources, as well as European and Asian countries, which depend to varying degrees on energy imports. The former’s dilemma in the process of carbon reduction is that resources advantages are difficult to effectively convert into economic energy, and there is an urgent need to increase the added value of the fossil energy industry chain and seek broad and stable export markets, while the problem faced by the latter is the lack of safe and stable energy supply for socioeconomic advancement. For instance, southeast Asian countries are generally facing electricity shortages, and European countries and residents are on the verge of a severe energy dilemma after the conflict between Russia and Ukraine.
With the continuous advancement of the B&RI, energy cooperation infrastructure has begun to take shape, which will lay the foundation for stimulating fundamental and substantive changes in the global energy structure, and investment and construction in the field of clean energy will become a new growth driver, giving vitality to the B&RI cooperation. Therefore, in the future advancement, when the B&RI popularizes and penetrates the power supply, it will also empower EPE in the form of new energy power generation.
5.4. Discussions on the Impact of B&RI on the Multidimensional Energy Poverty
The negative coefficients of DID in Table 10 prove that the implementation of the B&RI will inhibit the EPE in host countries. Electricity access captures only the availability dimension—whether households are connected to electricity. The multidimensional index, by contrast, incorporates availability, affordability, and cleanliness simultaneously. The B&RS primarily promotes power infrastructure investment, which directly expands electricity coverage and thus improves the electricity-access measure. However, expanded supply does not necessarily make electricity affordable for low-income households, and many host countries rely on fossil-fuel-based generation. The resulting increase in CO2 emissions is penalized in the multidimensional index, which can therefore rise even when access improves. These findings are not contradictory but reveal that the energy poverty eradication effect of the B&RS is dimension-specific: it improves access but does not automatically improve affordability or cleanliness. Complementary policies—such as renewable energy investment, targeted subsidies, and clean cooking programs—are needed to translate electricity expansion into comprehensive energy poverty reduction.
6. Conclusions and Policy Implications
6.1. Conclusions
This study provides compelling evidence on the actual effect of B&RI on EPE across 126 countries from 2000 to 2019, utilizing the B&RI as a quasi-natural experiment. Our empirical analysis yields three core conclusions:
First, the implementation of the B&RI significantly alleviates energy poverty in host countries, confirming its positive role in promoting global energy accessibility.
Second, the positive effect on electricity-access-based energy poverty is particularly pronounced in low-income countries and in host countries characterized by high government stability, low socioeconomic conditions, high investment profile, and low corruption.
Third, we identify a critical environmental trade-off: the promotion of electricity in B&RI countries are positively associated with the greenhouse effect, which may largely depend on the host countries’ power generation structures.
6.2. Policy Suggestions
Based on the empirical findings, we put forward three policy suggestions to strengthen the energy cooperation of B&RI and eradicate fuel poverty.
First, regarding the benchmark finding that the B&RI significantly promotes EPE, policymakers should prioritize electricity infrastructure investment with a focus on “last-mile” connectivity. Since the empirical results confirm the macro-level EPE effect, energy cooperation should establish a dedicated “B&RI Energy Access Facility” to finance distribution grids and off-grid systems in underserved areas. This facility should target regions where the electricity access gap remains large, so that the measured EPE effect can be translated into actual improvements in household electricity access. Additionally, “electricity access improvement” should be incorporated as a Key Performance Indicator in project evaluations to ensure that investments directly target energy poverty.
Second, regarding the heterogeneous finding that the EPE effect is most prominent in low-income and low-political-risk countries, B&RI cooperation should adopt a “risk-screening and phased investment” approach. Our results indicate that high-income countries have saturated infrastructure, while high corruption and political risk weaken the EPE effect. Therefore, policymakers should implement a mandatory pre-investment screening mechanism using established governance metrics (e.g., the World Bank’s “Control of Corruption” indicator). In countries with higher political risks, investment strategies should shift from large-scale projects to “small-scale, phased, and community-based” energy projects (e.g., solar micro-grids) to mitigate fund misappropriation and ensure local benefits. This phased approach is directly derived from the heterogeneity results, which show that the EPE effect is stronger in countries with better governance and lower political risk.
Third, regarding the environmental consequence that the B&RI exacerbates carbon emissions, policies must couple energy access expansion with binding green technology transfer. Our findings reveal a critical trade-off, largely dependent on the host country’s power generation structure. To decouple energy access from carbon emissions, we recommend setting a minimum renewable energy investment threshold. International energy agencies and green investment principles commonly suggest that a substantial share of new power investment should target clean energy; for example, the IEA’s Net Zero by 2050 scenario implies that around 30–50% of total power sector investment in emerging markets should be allocated to renewables and low-carbon sources by 2030. We therefore propose this range as an illustrative policy target, not as a direct estimate from our regression. Furthermore, policymakers should establish “Green Technology Transfer Joint Ventures” between Chinese enterprises and host countries to build local capacity for maintaining and operating low-carbon power systems. In parallel, green logistics practices—such as low-carbon transport and optimized routing for energy equipment—should be promoted to reduce emissions from the logistics chain, thereby aligning operational processes with the environmental trade-off identified in this study.
6.3. Research Limitations and Future Directions
This study has several limitations. First, with respect to identification, our sample covers 2000–2019, while the B&RI was launched in 2013. Although countries joined the initiative at different times, many joined in the later years of the sample period, and countries that joined in 2019 have no post-treatment observations. As a result, we cannot implement a staggered DID design (e.g., Callaway–Sant’Anna or Sun–Abraham) with the current data. Future research could extend the sample period beyond 2019, incorporate newly available data, and use staggered-DID estimators to exploit variation in accession timing. This would allow a more precise identification of dynamic treatment effects and heterogeneous adoption paths. Second, with respect to the measurement of energy poverty, our baseline analysis focuses on electricity access as the proxy for EPE. Although we also construct a multidimensional energy poverty index, the main analysis centers on the electricity-access dimension. The contrasting results between electricity access and the multidimensional index suggest that the B&RI may improve access while not necessarily improving affordability or cleanliness. Future research should therefore focus more systematically on the multidimensional nature of energy poverty, using household-level and micro-level data on energy expenditure, clean cooking access, energy efficiency, and reliability. This would help clarify the conditions under which energy access expansion translates into comprehensive energy poverty reduction.
Author Contributions
Conceptualization, J.Z. and K.Z.; methodology, J.Z., Z.W. and S.S.; software, S.S. and Z.W.; formal analysis, K.Z.; investigation, S.S. and J.Z.; resources, J.Z.; data curation, K.Z. and S.S.; writing—original draft preparation, J.Z.; writing—review and editing, S.S., Z.W. and K.Z.; visualization, K.Z.; supervision, S.S. and K.Z.; funding acquisition, J.Z. All authors have read and agreed to the published version of the manuscript.
Funding
This research was funded by the National Natural Science Foundation of China (Grant No. 72403018), Humanities and Social Science Youth Foundation, Ministry of Education (Grant No 23YJC790198), Fuyang Normal University’s Key Laboratory Project on Regional Logistics Planning and Modern Logistics Engineering of Anhui Province (Grant No. FYKFKT24010), the Key Project of Scientific Research of Anhui Provincial Department of Education (Grant No. 2023AH050379), and the Fundamental Research Funds for the Central Universities (Grant No. 2-9-2024-053).
Institutional Review Board Statement
No applicable.
Informed Consent Statement
No applicable.
Data Availability Statement
The data of access to electricity, CO2 emissions, and control variables are from World Bank: https://databank.worldbank.org/source/world-development-indicators (accessed on 2 March 2023), the data of some variables from the multidimensional energy poverty indicator system are from https://ourworldindata.org/ (accessed on 5 March 2023), and the data of political risk are from the International Country Risk Guide (ICRG) produced by PRS group.
Conflicts of Interest
The authors declare no conflicts of interest.
Abbreviations
| B&RI | Belt and Road Initiative |
| CO2 | Carbon dioxide |
| DID | Difference-in-difference |
| EPE | Energy poverty eradication |
| FE | Fixed effect |
| GCC | Gulf Cooperation Council |
| GDP | Gross domestic product |
| IEA | International Energy Agency |
| IVs | Instrumental variables |
| OFDI | Outward foreign direct investment |
| OLS | Ordinary least squares |
| PSM | Propensity score matching |
| SYS-GMM | System generalized method of moments |
| 2SLS | Two-stage least squares |
Appendix A
Table A1.
The specific strategies and policies of countries related to EPE.
Table A2.
Outcomes of the correlation and multicollinearity tests.
Table A3.
The index system of energy poverty.
Table A4.
Robust outcomes of impact of China’s B&RI on multidimensional EPE effect.
References
- Chaudhry, S.M.; Shafiullah, M. Does culture affect energy poverty? Evidence from a cross-country analysis. Energy Econ. 2021, 102, 105536. [Google Scholar] [CrossRef] [Scilit]
- Che, X.; Kuang, W.; Zhang, H.; Jiang, M. Does the belt and road initiative alleviate energy poverty in participating countries? Energy Rep. 2023, 9, 2395–2404. [Google Scholar] [CrossRef] [Scilit]
- Lee, P.T.W.; Hu, Z.H.; Lee, S.; Feng, X.; Notteboom, T. Strategic locations for logistics distribution centers along the Belt and Road: Explorative analysis and research agenda. Transp. Policy 2022, 116, 24–47. [Google Scholar] [CrossRef] [Scilit]
- Mahadevan, R.; Sun, Y. Effects of foreign direct investment on carbon emissions: Evidence from China and its Belt and Road countries. J. Environ. Manag. 2020, 276, 111321. [Google Scholar] [CrossRef] [Scilit]
- Yang, B.; Swe, T.; Chen, Y.; Zeng, C.; Shu, H.; Li, X.; Yu, T.; Zhang, X.; Sun, L. Energy cooperation between Myanmar and China under One Belt One Road: Current state, challenges and perspectives. Energy 2021, 215, 119130. [Google Scholar] [CrossRef] [Scilit]
- Sy, S.A.; Mokaddem, L. Energy poverty in developing countries: A review of the concept and its measurements. Energy Res. Soc. Sci. 2022, 89, 102562. [Google Scholar] [CrossRef] [Scilit]
- Tardy, F.; Lee, B. Building related energy poverty in developed countries–Past, present, and future from a Canadian perspective. Energy Build. 2019, 194, 46–61. [Google Scholar] [CrossRef] [Scilit]
- Li, W.; Qiao, Y.; Li, X.; Wang, Y. Energy consumption, pollution haven hypothesis, and Environmental Kuznets Curve: Examining the environment–economy link in belt and road initiative countries. Energy 2022, 239, 122559. [Google Scholar] [CrossRef] [Scilit]
- Liu, Y.; Hao, Y. The dynamic links between CO2 emissions, energy consumption and economic development in the countries along “the Belt and Road”. Sci. Total Environ. 2018, 645, 674–683. [Google Scholar] [CrossRef] [Scilit]
- Weili, L.; Khan, H.; Khan, I.; Han, L. The impact of information and communication technology, financial development, and energy consumption on carbon dioxide emission: Evidence from the Belt and Road countries. Environ. Sci. Pollut. Res. 2022, 29, 27703–27718. [Google Scholar] [CrossRef] [Scilit]
- Jalil, A.; Rauf, A.; Sikander, W.; Zhang, Y.; Wang, T. Energy consumption, economic growth, and environmental sustainability challenges for Belt and Road countries: A fresh insight from “Chinese Going Global Strategy”. Environ. Sci. Pollut. Res. 2021, 28, 65987–65999. [Google Scholar] [CrossRef] [Scilit]
- Zhuo, J.; Qamruzzaman, M. Do financial development, FDI, and globalization intensify environmental degradation through the channel of energy consumption: Evidence from belt and road countries. Environ. Sci. Pollut. Res. 2022, 29, 2753–2772. [Google Scholar] [CrossRef] [Scilit]
- Fang, G.; Yang, K.; Tian, L.; Ma, Y. Can environmental tax promote renewable energy consumption?—An empirical study from the typical countries along the Belt and Road. Energy 2022, 260, 125193. [Google Scholar] [CrossRef] [Scilit]
- Zhou, K.; Wang, Y.; Hussain, J. Energy poverty assessment in the Belt and Road Initiative countries: Based on entropy weight-TOPSIS approach. Energy Effic. 2022, 15, 46. [Google Scholar] [CrossRef] [Scilit]
- Qi, S.; Peng, H.; Zhang, X.; Tan, X. Is energy efficiency of Belt and Road Initiative countries catching up or falling behind? Evidence from a panel quantile regression approach. Appl. Energy 2019, 253, 113581. [Google Scholar] [CrossRef] [Scilit]
- Wu, Y.; Hu, C.; Shi, X. Heterogeneous effects of the belt and road initiative on energy efficiency in participating countries. Energies 2021, 14, 5594. [Google Scholar] [CrossRef] [Scilit]
- Mills, E.F.E.A.; Dong, J.; Yiling, L.; Baafi, M.A.; Li, B.; Zeng, K. Towards sustainable competitiveness: How does financial development affect dynamic energy efficiency in Belt & Road economies? Sustain. Prod. Consum. 2021, 27, 587–601. [Google Scholar] [CrossRef] [Scilit]
- Peng, H.R.; Qi, S.Z.; Zhang, Y.J. Does trade promote energy efficiency convergence in the Belt and Road Initiative countries? J. Clean. Prod. 2021, 322, 129063. [Google Scholar] [CrossRef] [Scilit]
- Li, R.; Xu, L.; Hui, J.; Cai, W.; Zhang, S. China’s investments in renewable energy through the belt and road initiative stimulated local economy and employment: A case study of Pakistan. Sci. Total Environ. 2022, 835, 155308. [Google Scholar] [CrossRef] [Scilit]
- Ma, W.; Bo, N.; Song, Y.; Qiao, F. Impact of the belt and road initiative on poverty reduction in countries along the route. Discret. Dyn. Nat. Soc. 2022, 2022, 2502851. [Google Scholar] [CrossRef] [Scilit]
- Liu, Z.; Zhang, H.; Zhang, Y.J.; Qin, C.X. How does income inequality affect energy efficiency? Empirical evidence from 33 Belt and Road Initiative countries. J. Clean. Prod. 2020, 269, 122421. [Google Scholar] [CrossRef] [Scilit]
- Chen, Y.; Liu, S.; Wu, H.; Zhang, X.; Zhou, Q. How can Belt and Road countries contribute to global low-carbon development? J. Clean. Prod. 2020, 256, 120717. [Google Scholar] [CrossRef] [Scilit]
- Tang, D.; Li, X.; Xu, X.; Liu, X.; Zhang, H.; Shi, H.; Liu, S.; Zhang, H. Does the belt and road initiative really increase CO2 emissions? Ann. Am. Assoc. Geogr. 2022, 112, 948–967. [Google Scholar] [CrossRef] [Scilit]
- Lu, Y.; Kong, F.; Huang, L.; Xiong, K.; Xu, C.; Wang, B. Evaluation of the implementation effect of the ecological compensation policy in the Poyang Lake River Basin based on difference-in-difference method. Sustainability 2021, 13, 8667. [Google Scholar] [CrossRef] [Scilit]
- Dai, S.; Qian, Y.; He, W.; Wang, C.; Shi, T. The spatial spillover effect of China’s carbon emissions trading policy on industrial carbon intensity: Evidence from a spatial difference-in-difference method. Struct. Change Econ. Dyn. 2022, 63, 139–149. [Google Scholar] [CrossRef] [Scilit]
- Dong, J.; Dou, Y.; Jiang, Q.; Zhao, J. How does industrial structure upgrading affect the global greenhouse effect? Evidence from RCEP and non-RCEP countries. Front. Energy Res. 2021, 9, 683166. [Google Scholar] [CrossRef] [Scilit]
- Kartal, M.T. Production-based disaggregated analysis of energy consumption and CO2 emission nexus: Evidence from the USA by novel dynamic ARDL simulation approach. Environ. Sci. Pollut. Res. 2023, 30, 6864–6874. [Google Scholar] [CrossRef] [Scilit]
- Shao, X. Chinese OFDI responses to the B&R initiative: Evidence from a quasi-natural experiment. China Econ. Rev. 2020, 61, 101435. [Google Scholar] [CrossRef] [Scilit]
- Xue, M.; Razzaq, A.; Afshan, S.; Yang, X. Fiscal pressure and carbon intensity: A quasi-natural experiment based on education authority reform. Energy Econ. 2023, 126, 106919. [Google Scholar] [CrossRef] [Scilit]
- Fan, F.; Zhang, X. Transformation effect of resource-based cities based on PSM-DID model: An empirical analysis from China. Environ. Impact Asses. 2021, 91, 106648. [Google Scholar] [CrossRef] [Scilit]
- Shi, J.; Yu, C.; Li, Y.; Wang, T. Does green financial policy affect debt-financing cost of heavy-polluting enterprises? An empirical evidence based on Chinese pilot zones for green finance reform and innovations. Technol. Forecast. Soc. 2022, 179, 121678. [Google Scholar] [CrossRef] [Scilit]
- Che, X.; Zhu, B.; Wang, P. Assessing global energy poverty: An integrated approach. Energy Policy 2021, 149, 112099. [Google Scholar] [CrossRef] [Scilit]
- Barnett, J. Peace and development: Towards a new synthesis. J. Peace Res. 2008, 45, 75–89. [Google Scholar] [CrossRef] [Scilit]
- Dong, K.; Taghizadeh-Hesary, F.; Zhao, J. How inclusive financial development eradicates energy poverty in China? The role of technological innovation. Energy Econ. 2022, 109, 106007. [Google Scholar] [CrossRef] [Scilit]
- Zhao, J.; Shahbaz, M.; Dong, K. How does energy poverty eradication promote green growth in China? The role of technological innovation. Technol. Forecast. Soc. 2022, 175, 121384. [Google Scholar] [CrossRef] [Scilit]
- Bega, F.; Lin, B. China’s belt & road initiative energy cooperation: International assessment of the power projects. Energy 2023, 270, 126951. [Google Scholar] [CrossRef] [Scilit]
- Griffiths, S. Energy diplomacy in a time of energy transition. Energy Strateg. Rev. 2019, 26, 100386. [Google Scholar] [CrossRef] [Scilit]
- Schulhof, V.; Van Vuuren, D.; Kirchherr, J. The Belt and Road Initiative (BRI): What will it look like in the future? Technol. Forecast. Soc. 2022, 175, 121306. [Google Scholar] [CrossRef] [Scilit]
- Dong, K.; Dong, X.; Jiang, Q.; Zhao, J. Assessing energy resilience and its greenhouse effect: A global perspective. Energy Econ. 2021, 104, 105659. [Google Scholar] [CrossRef] [Scilit]

Disclaimer/Publisher’s Note: The statements, opinions and data contained in all publications are solely those of the individual author(s) and contributor(s) and not of MDPI and/or the editor(s). MDPI and/or the editor(s) disclaim responsibility for any injury to people or property resulting from any ideas, methods, instructions or products referred to in the content. |
© 2026 by the authors. Licensee MDPI, Basel, Switzerland. This article is an open access article distributed under the terms and conditions of the Creative Commons Attribution (CC BY) license.