


Abstract
This study examines whether backward-looking corporate environmental disclosure (CED) and forward-looking climate-resilience reporting (CLIM) constitute empirically distinct disclosure architectures in 19 JSE-listed mining firms over 2015–2025 (208 firm-years; 189 consecutive transitions), and whether directors’ ownership helps explain their differences. Original 0–4 scores show that CED is concentrated at score 3 (88.5%). Descriptively, 91.5% of CED transitions retain the same score, compared with 79.4% for CLIM; firm-level trajectories likewise show broader CED stability and greater CLIM movement. These comparisons describe the observed panel and do not provide a formal test of the persistence difference. Because the two constructs use different evidence anchors on the common 0–4 maturity scale, part of the observed contrast may reflect construct-specific rubric calibration. Directors’ ownership is weakly and imprecisely associated with both outcomes, and the adjusted CED–CLIM ownership contrast is statistically indistinguishable from zero. Secondary quadratic and CED institutional-period estimates are sample-sensitive and interpreted descriptively. The contribution is architectural: CED and CLIM differ in content, distribution and temporal behaviour, but those differences do not translate into reliably different ownership sensitivities.
1. Introduction
Carbon-intensive industries, particularly mining, face pressure to align with international climate frameworks [1,2,3,4]. Operational change associated with ecological stewardship can sit uneasily with short-term liquidity and can expose firms to regulatory and proprietary costs [5,6]. Environmental outlays are therefore often discussed as near-term capital drains [7]. Agency research has long asked whether director equity aligns managers with shareholders or, at high concentrations, insulates them from discipline [8,9]. Recent work links managerial short-termism to weaker environmental reporting [10,11,12]. That literature motivates an association study. It does not, by itself, identify myopia in this sample.
Prior work frequently aggregates backward-looking environmental disclosure and forward-looking climate reporting [1,13,14], although the two communicate different information. Sustainability-reporting research also shows that reporting systems differ in regards to materiality logic, information prioritisation, accountability pathways and standardisation [15,16]. In this study, disclosure architecture denotes the construct-specific configuration of information content, evidence anchors, maturity levels and temporal behaviour through which reporting is organised and interpreted. CED records realised environmental outcomes and past performance; CLIM concerns scenarios, transition risks, targets and preparedness. Treating them as one ESG disclosure construct can obscure differences in maturity, dispersion and persistence. This paper therefore places disclosure architecture first and uses directors’ ownership as an empirical probe determining whether conceptual differences correspond to different governance associations.
The study addresses three exploratory questions. RQ1: Do CED and CLIM display distinct original-score distributions, transition patterns and firm-level trajectories? RQ2: Is directors’ ownership associated with either disclosure architecture, and does the adjusted ownership contrast differ between CED and CLIM? RQ3: Does the association between directors’ ownership and CED vary between the pre-2018 and post-2017 reporting periods, without attributing contemporaneous differences causally to King IV?
Regarding RQ3, which examines whether the association between directors’ ownership and CED varies between the pre-2018 and post-2017 reporting periods, this comparison is exploratory and descriptive. The absence of an untreated comparison group prevents the post-2017 interaction from isolating King IV effects from commodity-market developments, global ESG reporting trends or other contemporaneous institutional changes. Accordingly, the analysis tests institutional-period heterogeneity rather than a causal King IV effect.
Recent governance research reinforces the importance of distinguishing executive ownership from broader directors’ ownership. Executive ownership refers specifically to equity held by senior managers, including chief executive officers, chief financial officers, and executive directors and therefore, represents a comparatively direct managerial incentive mechanism [17]. Directors’ ownership is conceptually broader because non-executive director holdings may also shape monitoring incentives and the concentration of board-level control. Related evidence distinguishes managerial entitlement, proxied by executive ownership, from directorial strongholds, proxied by concentrated director ownership excluding executives; these channels may support incentive alignment or, alternatively, board-level entrenchment and strategic rigidity [18]. DOWN combines executive and non-executive director holdings and cannot separate these mechanisms. The construct is therefore consistently described as directors’ ownership, and its estimated association is not attributed exclusively to managerial incentives or executive entrenchment. Board characteristics may also influence how sustainability-related information is interpreted and translated into strategic action, but these mechanisms are not directly measured in this study [19].
The contribution is a bounded comparison of disclosure architectures. First, the original 0–4 scores and firm-level transitions establish whether architectural differences survive the three-tier recoding. Second, the common median-split estimand and firm-cluster bootstrap directly test whether ownership associations differ across CED and CLIM. Third, the weak ownership results qualify the assumption that standard agency arguments transfer mechanically across sustainability disclosures. Different information architectures need not exhibit different ownership sensitivities. Broader reporting scholarship cautions that integrated and sustainability reports may differ in comparability, substantive implementation and the risk of symbolic decoupling [20,21,22,23,24,25,26].
The remainder of the paper develops the disclosure-architecture framework, explains the computer-assisted coding and exploratory estimators, reports distributional and transition evidence before ownership results, and concludes with the implications and limits of the architecture comparison.
2. Theoretical Framework and Literature Review
Disclosure architecture defines the information object being communicated and the institutional conditions under which managerial discretion operates. CED is backward-looking: it reports realised emissions, water use, waste, tailings and related outcomes that can be compared with prior commitments. CLIM is forward-looking: it reports scenarios, transition risks, targets and preparedness under greater uncertainty. These architectures may therefore differ in distribution and temporal movement even when their governance correlates are similar.
Accordingly, architectural distinctiveness is evaluated through the original-score distributions, year-to-year transitions and firm-level trajectories of CED and CLIM. The post-2017 boundary corresponds to the reporting environment following King IV, but King IV is used only as institutional context rather than as an identified treatment [27].
Agency theory and the alignment–entrenchment argument provide a secondary governance lens [8,9]. Moderate director equity may align interests, whereas concentrated holdings may weaken external discipline. However, DOWN combines executive and non-executive holdings, whose incentive and monitoring roles need not coincide, and comparable measures of board independence, institutional ownership, blockholding, foreign ownership, assurance and audit characteristics are unavailable. Directors’ ownership is therefore treated as an aggregate empirical probe, not a sufficient representation of the governance mechanism.
The ownership analysis therefore tests whether an aggregate board-equity measure adds explanatory information to either architecture and whether the two adjusted associations differ.
3. Research Methodology
3.1. Research Design and Data Operationalisation
The empirical setting is an 11-year panel of 19 JSE-listed mining companies: 209 potential firm-years, 208 observed firm-years, and 189 observations after one-period lags. DOWN combines executive and non-executive director holdings and is therefore described as directors’ ownership. CED and CLIM are constructed from environmental and climate-related evidence retained from integrated annual, annual, sustainability and climate reports. Evidence (Table 1) is recorded at the firm-year level, assigned an original 0–4 textual-maturity score, and harmonised into three ordered tiers: original scores 0–2 = Basic, 3 = Targeted, and 4 = High-Maturity. The label High-Maturity describes textual depth and does not establish third-party assurance. Appendix D documents the retained evidence–score records, reconstructed rubric, stratified reassessment set and 2025 source inventory. No independent blinded validation audit is claimed.
Table 1.
Variable meanings and operationalisation.
3.2. Econometric Strategy: Ordered Probit, Sparse-Event Check, and a Post-2017 Dummy
The historical coding workflow used FinBERT, a finance-domain language model, as a computer-assisted aid for locating and organising potentially relevant environmental and climate passages. The archived materials do not preserve the exact model version, preprocessing pipeline, evidence-window rules, classification thresholds, fine-tuning configuration or complete training log. FinBERT is therefore not presented as a reproducible standalone classifier or as a methodological contribution. The retained analytical record begins with the archived firm-year evidence excerpts and original scores.
The archived workbook preserves each firm-year score, together with the supporting CED and CLIM evidence excerpt. Table 2 provides a substantively reconstructed 0–4 rubric derived from the archived evidence–score pairs and reporting logic. The rubric supports transparent reassessment and consistent interpretation of the retained scores, but it does not establish the exact rule or computational path by which every historical score was originally assigned. CED and CLIM use a common maturity scale with construct-specific evidence anchors; observed differences may therefore reflect both reporting behaviour and calibration to different information objects.
Table 2.
Original 0–4 disclosure-maturity rubric.
The latent index () is specified as
The observed ordinal score equals j if for j = 0,1,2 with strictly increasing thresholds μ.
Here rho captures state dependence; the linear and squared ownership terms jointly describe the fitted quadratic; X contains lagged ROA, leverage, and firm size; firm-level means parameterise correlated unobserved heterogeneity; and the remaining disturbance is idiosyncratic. Board independence, institutional ownership, ownership concentration, foreign ownership, external assurance, and audit characteristics are not consistently available across the 2015–2025 archival reports. Manually reconstructing comparable measures for 19 firms over 11 years was beyond the scope of this exploratory study. Adding several governance covariates and their correlated-random-effects means would also rapidly exhaust degrees of freedom and increase overfitting risk. The parsimonious baseline, therefore, retains the core financial controls, and omitted governance variables are treated explicitly as limitations.
To address the initial conditions [34], unobserved heterogeneity is parameterised as
where contains firm-level means of director ownership, ROA, LEV, and SIZE.
For the reproducible specification, the descriptive vertex is D* = −/(2) = −8.445/[2(−26.263)] = 0.1608, or 16.08%. Seventeen lagged firm-years from three firms lie above this value. Because the ownership terms are imprecise and the curvature reverses when Exxaro is excluded, the vertex is not interpreted as a governance threshold.
Because CED is concentrated in the Targeted tier and the High-Maturity-versus-rest logit does not converge, the ordered model is secondary. Appendix A explains why the limited three-firm support in the upper ownership region and the six-event High-Maturity cell constrain inference. The continuous quadratic model and the median-split adjusted contrast estimate different quantities and are not treated as replications of one nonlinear relationship.
3.3. Additional Estimators and Finite-Sample Inference
The adjusted median split is retained only to compare CED and CLIM under a common estimand. It contrasts observations above and below the lagged-sample median ownership of 0.110%; controls for lagged ROA, size, leverage, the post-2017 indicator and a linear trend; and uses 1999 firm-cluster bootstrap replications. The split is sample-specific and is not an ownership threshold or an independent substantive result.
Inference uses firm-level resampling appropriate to each analysis. The dynamic ordered probit and fractional logit are secondary diagnostics because CED has limited within-firm movement and a sparse High-Maturity category. Appendix A documents small-N constraints; Appendix B, the ordinal-to-continuous mapping; Appendix C, ownership sensitivity; and Appendix D, the recoverable FinBERT-assisted coding workflow, audit scope and source comparability.
4. Empirical Results and Discussion
4.1. Disclosure Architecture: Original Scores and Transitions
Before examining the disclosure distributions, Table 3 outlines the underlying panel data structure and sample composition used for the empirical estimations.
Table 3.
Panel data structure and sample composition.
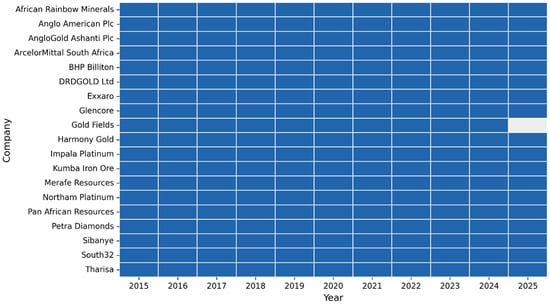
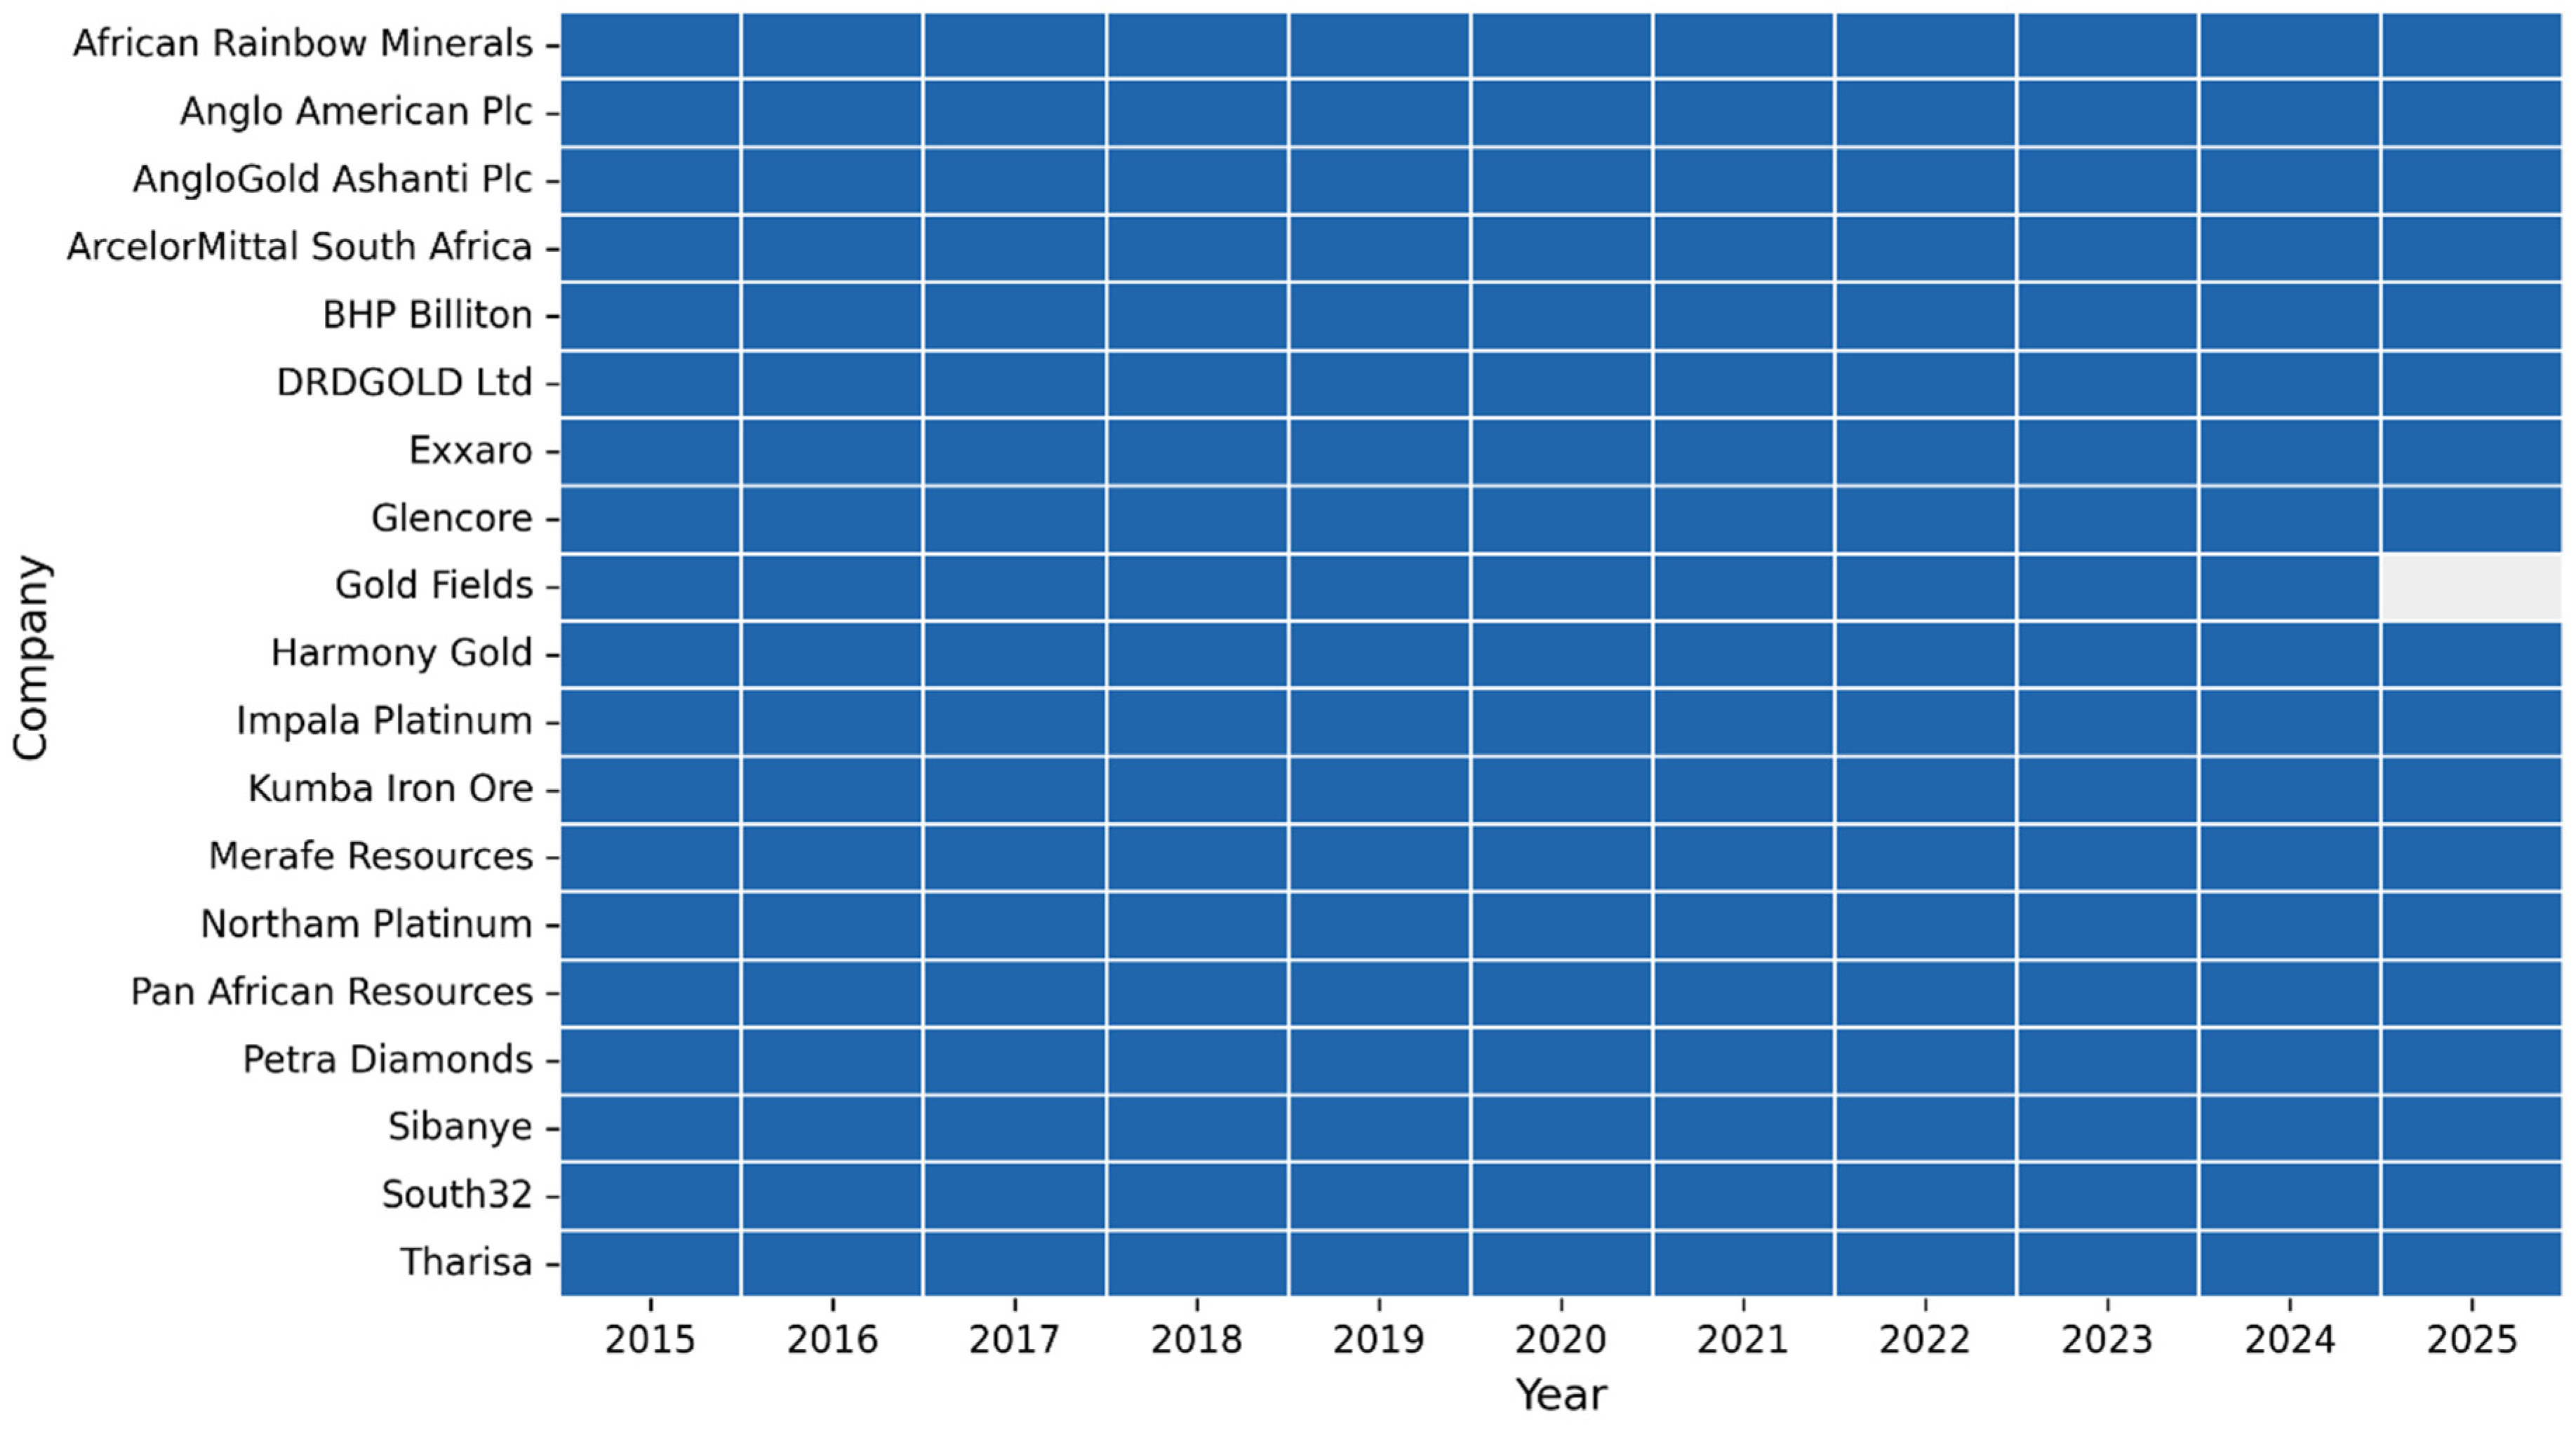
Figure 1 establishes the panel foundation for the subsequent architecture comparisons. It shows 208 of 209 possible firm-years, with Gold Fields in 2025 as the only missing observation; lag construction then yields 189 consecutive analytical observations.
Figure 1.
Firm-year coverage, 19 JSE mining firms, 2015–2025. Notes: [1] Figure 1 maps firm-year coverage for 19 JSE mining houses from 2015 to 2025 (208 of 209 possible firm-years) [2]. Dark cells are complete matched years; the isolated gap comprises Gold Fields in 2025 [3]. Coverage is high (99.5%), which reduces attrition concern but does not create a large-N design [4]. Lagged models use 189 firm-years [5]. Source: author computation via Python.
Table 4 reports transitions across the three maturity tiers. CED is highly persistent in the Targeted tier: 161 of 168 observations (95.83%) remain Targeted, six move to High-Maturity and one moves to Basic. Twelve of 15 Basic CED observations remain Basic, while all six lagged High-Maturity observations return to the Targeted category. CLIM is more mobile: 115 of 130 Targeted observations (88.46%) remain Targeted, 14 move to High-Maturity and one moves to Basic; 24 of 38 High-Maturity observations (63.16%) remain in that tier. These are descriptive transition frequencies. They do not provide cluster-adjusted uncertainty for the difference between architectures and do not imply causal progression or deterioration.
Table 4.
One-year transitions across CED and CLIM maturity tiers.
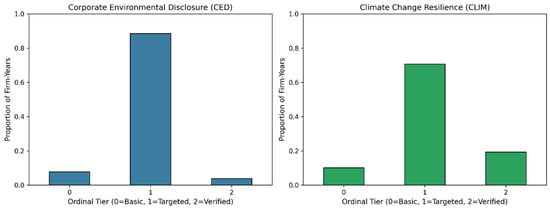
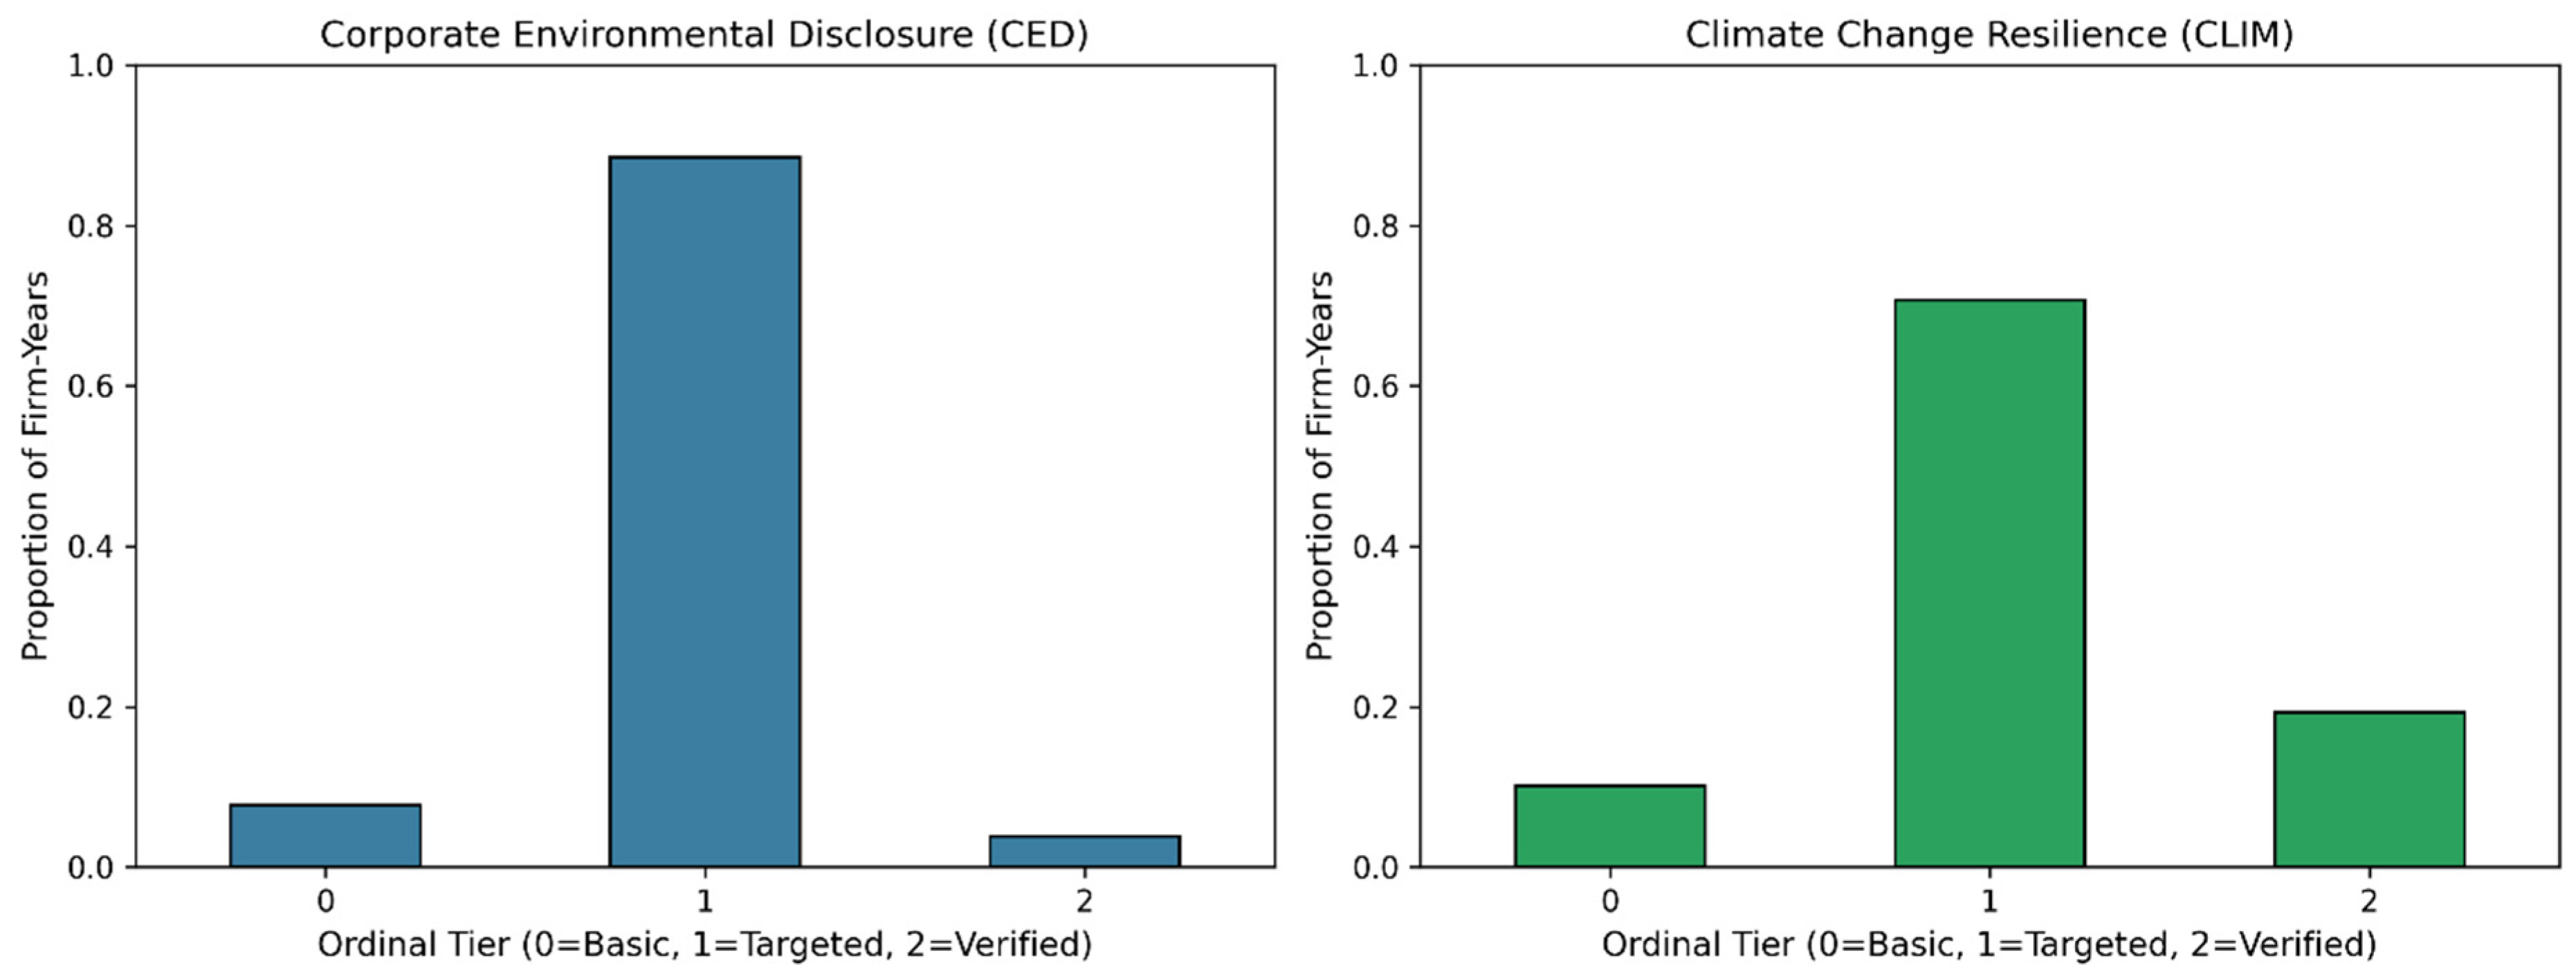
Figure 2 complements Table 4 by showing the cross-sectional tier composition. CED is more concentrated in the Targeted tier (184 observations; 88.46%) than is CLIM (147; 70.67%), whereas High-Maturity reporting is more common for CLIM (40; 19.23%) than for CED (8; 3.85%).
Figure 2.
CED and CLIM maturity tiers. Notes: [1] Percentages use the 208 observed firm-years [2]. Basic combines original scores 0–2, Targeted corresponds to score 3 and High-Maturity to score 4 [3]. Tier 3 denotes textual maturity, not third-party assurance [4]. Source: author computation via Python 3.
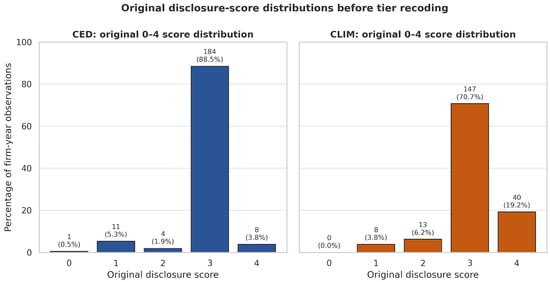
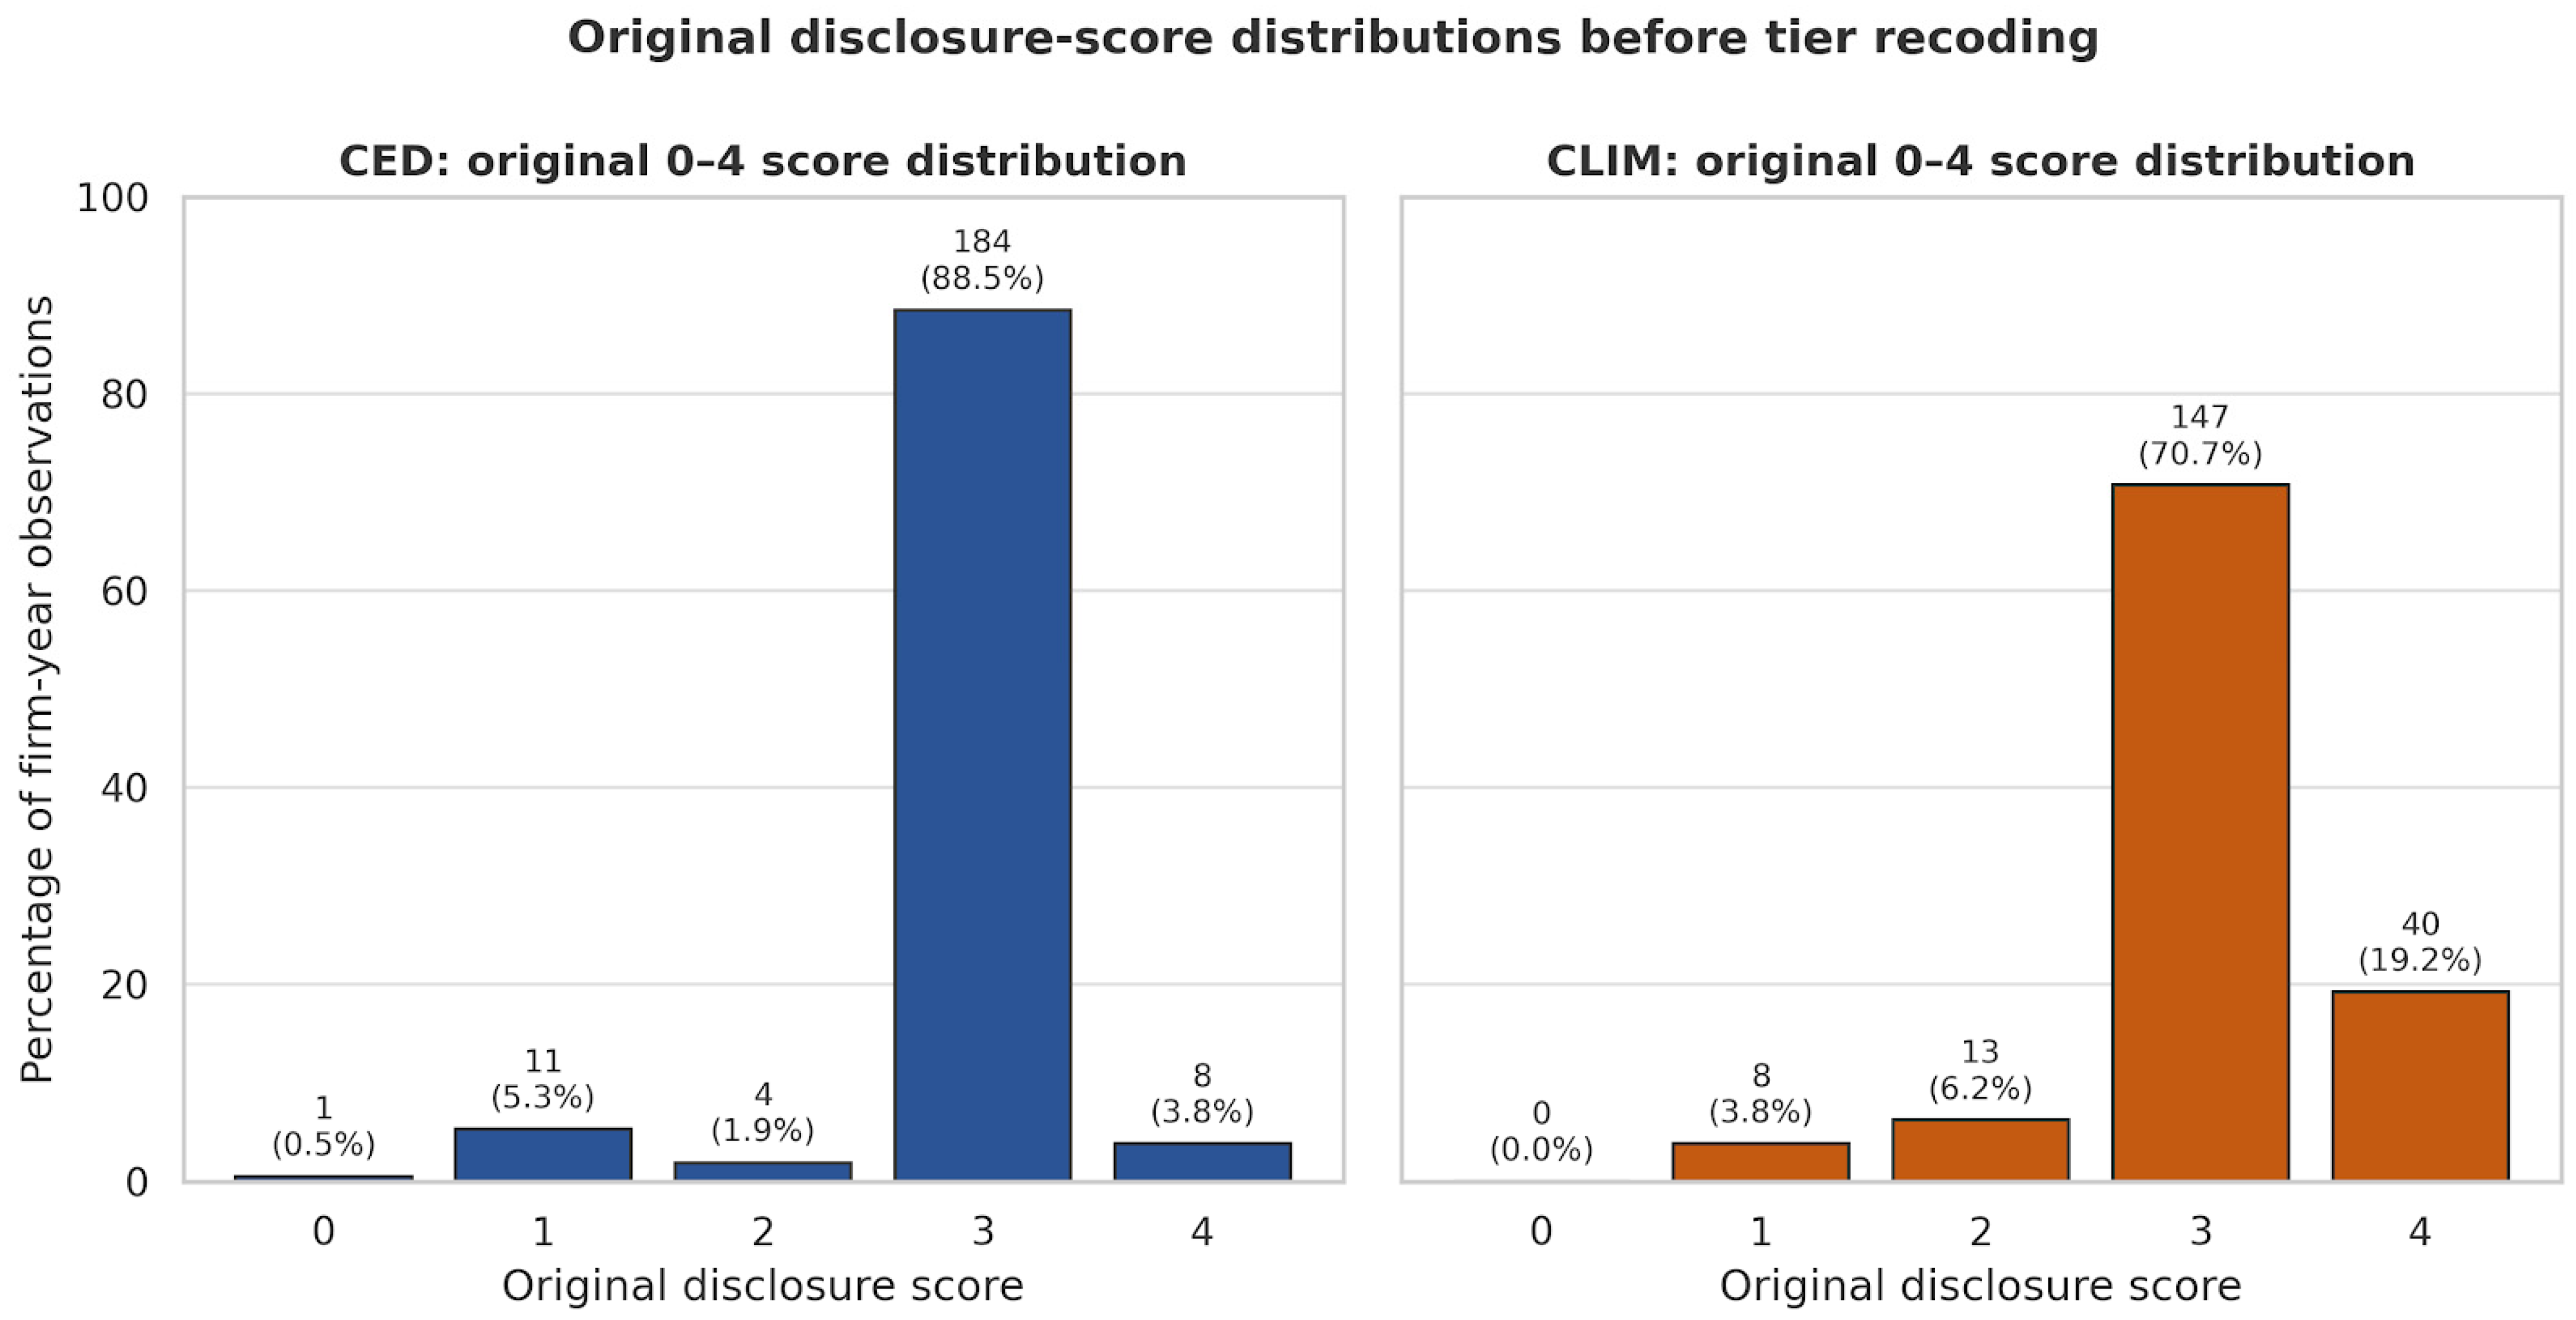
Figure 3 tests whether the tier concentration is an artefact of grouping scores 0–2. It is not: 184 CED observations already occupy original score 3, compared with 147 CLIM observations, while CLIM has substantially more score-4 observations (40 versus 8). The architectural difference, therefore, precedes recoding.
Figure 3.
Original 0–4 disclosure-score distributions before tier recoding. Notes: [1] Bars report frequencies and percentages for N = 208 firm-years [2]. The dominant CED category is original score 3; it is not produced by the three-tier collapse [3]. Author computation via Python 3.
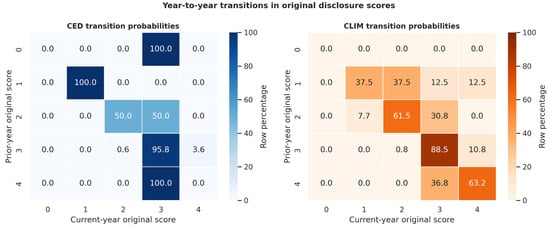
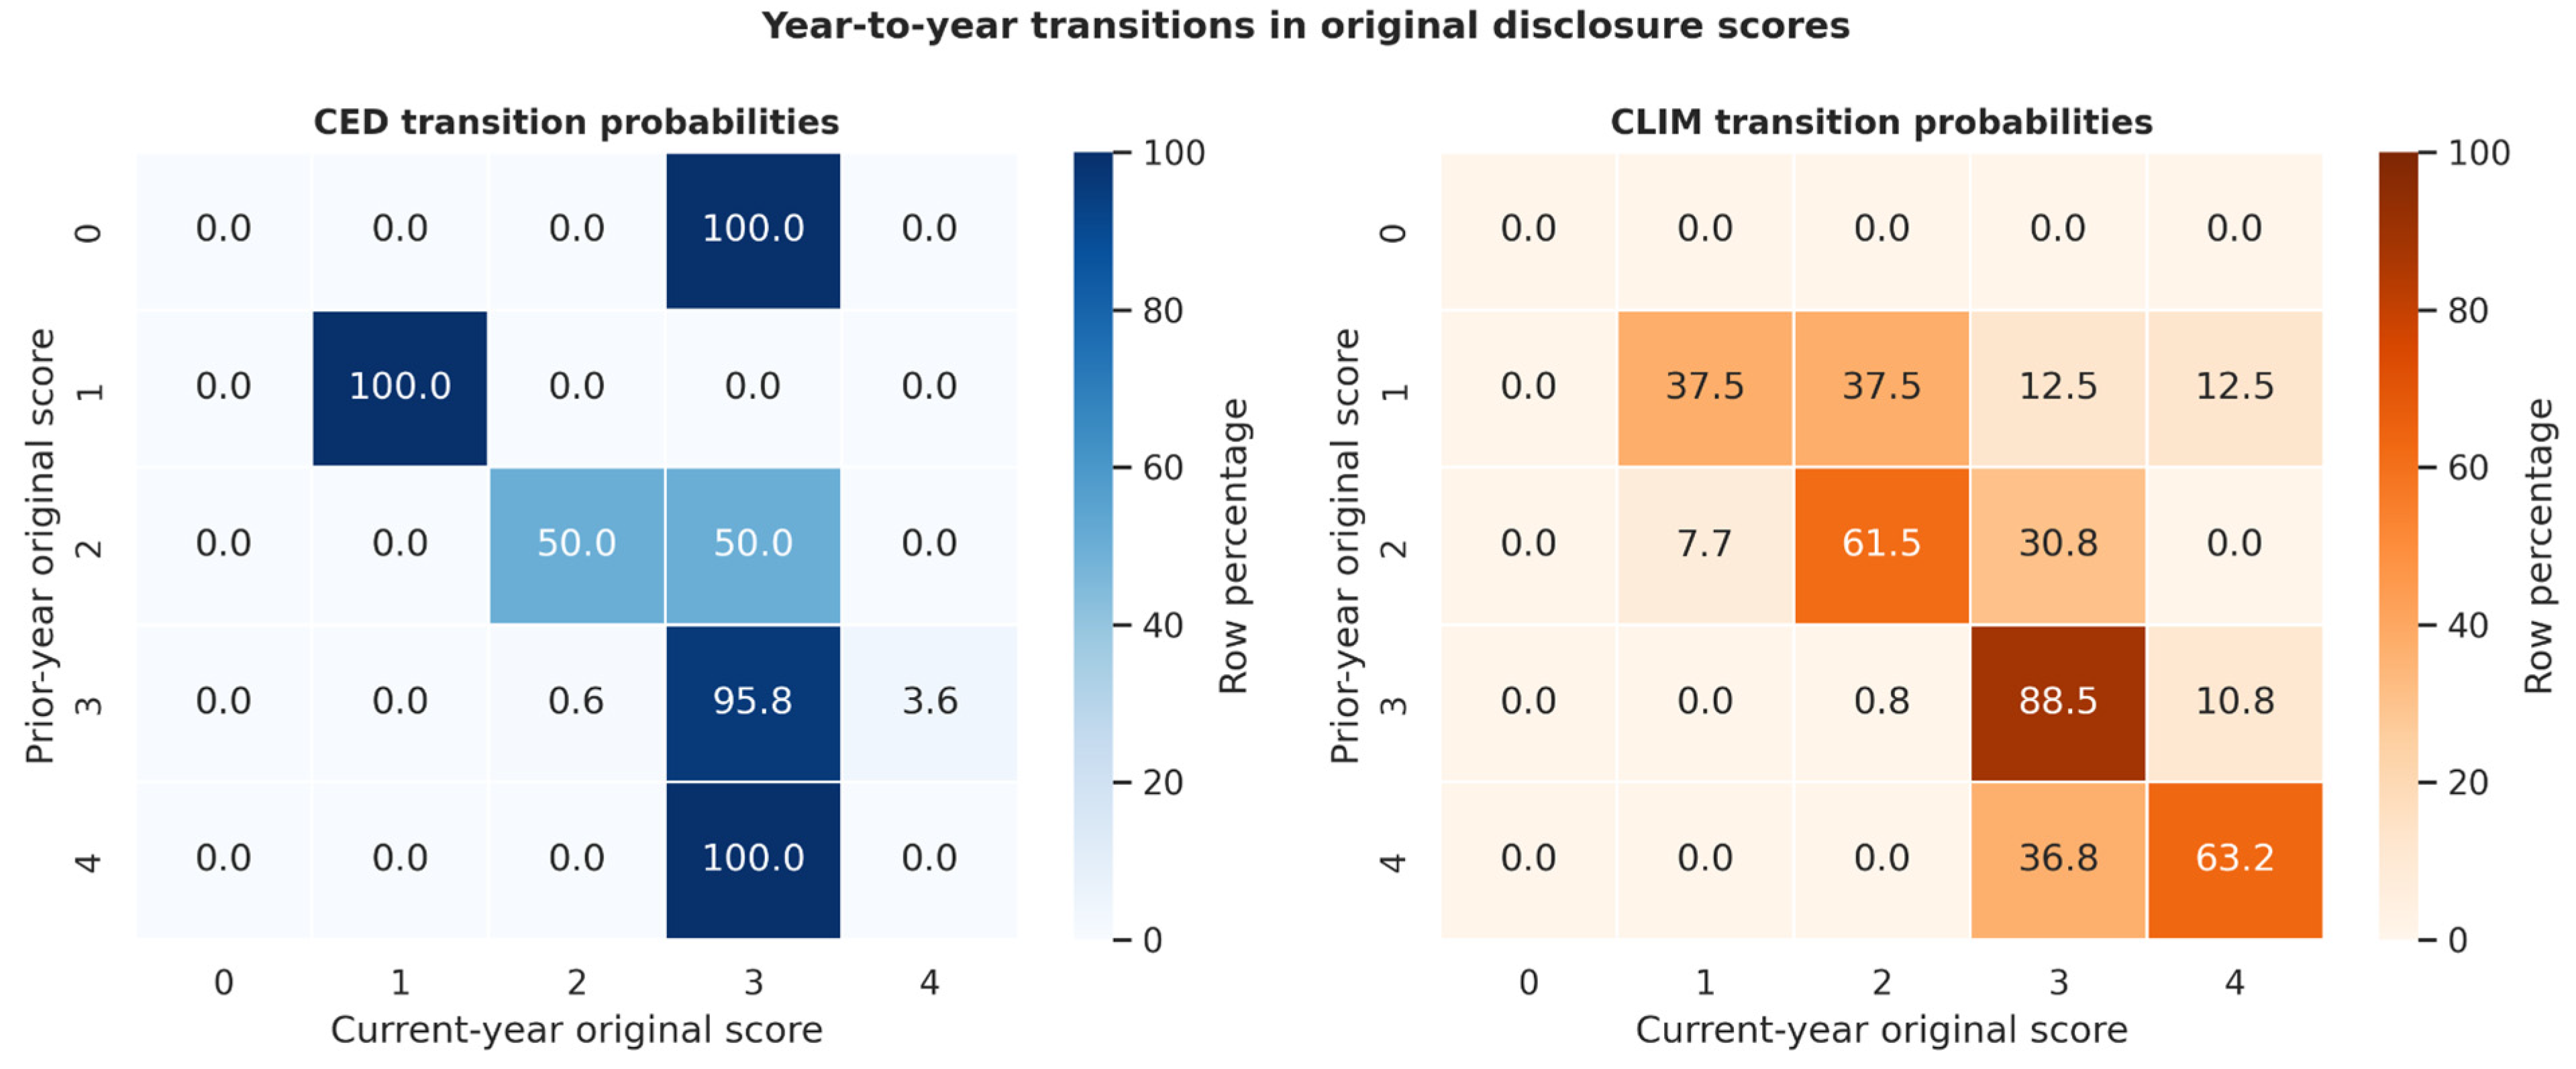
Figure 4 retains the full 0–4 scale. Across 189 consecutive transitions, CED remains at the same original score in 173 cases (91.53%), compared with 150 cases (79.37%) for CLIM. CED records nine upward and seven downward movements, whereas CLIM records 23 upward and 16 downward movements. The percentages are descriptive summaries of the observed panel; no formal firm-cluster test of the persistence difference is reported. Because CED and CLIM apply different evidence anchors to the common maturity scale, part of the contrast may reflect construct-specific calibration. Rows with no observed prior state are displayed as zeros and carry no transition interpretation.
Figure 4.
Year-to-year transitions in original CED and CLIM scores. Notes: [1] Cells are row percentages conditional on the prior-year score. Rows with no observed origin state are retained as zeros [2]. The matrices describe consecutive firm-year transitions and do not identify causal changes [3]. The CED–CLIM persistence comparison is descriptive and is not accompanied by firm-cluster uncertainty [4]. The shared 0–4 scale uses construct-specific evidence anchors [5]. Author computation via Python 3.
Directors’ ownership contains limited identifying variation (Table 5): its mean is 3.4%, within-firm standard deviation is about 4%, and only three firms contribute 17 lagged observations above the descriptive 16.08% vertex. Consistent with that support, the linear and squared ownership terms are imprecise, and the curvature reverses when Exxaro is excluded. The vertex is therefore a fitted-model description, not a governance threshold.
Table 5.
Variance decomposition.
Table 6 shows that linear correlations between ownership and CED or CLIM are weak (0.025). A linear correlation cannot establish, nor rule out, a tail contrast. Size is negatively correlated with ownership (−0.298). Leverage is negatively correlated with CED (−0.188).
Table 6.
Bivariate correlation matrix.
Table 7 reports baseline cut points. Distances between cuts are large, but that does not prove that the ordered model discriminates well or that the fractional index is validated. With 88.46% of CED mass in one cell, cut points can be large even when the outcome is nearly constant.
Table 7.
Baseline probit equidistance thresholds.
4.2. Secondary Ownership Associations
Table 8 summarises the secondary ownership estimates. Neither the linear nor squared ownership term is statistically precise for CED or CLIM. The fitted CED vertex is supported by only three firms and 17 lagged observations, and excluding Exxaro reverses the curvature. The full coefficients, cut points and leave-one-upper-tail-firm-out estimates are reported in Appendix A Table A1. The post-2017 interaction is retained as institutional-period heterogeneity and is not interpreted as a King IV effect.
Table 8.
Compact summary of secondary ordered-probit ownership estimates.
Lagged CED is statistically weak (0.819, SE 0.847); lagged CLIM is large (1.772, SE 0.441). Lagged ROA and firm size enter the CED column with positive signs; lagged leverage enters the CLIM column with a positive sign. These controls are descriptive. They are not used to claim that slack resources or creditor monitoring have been identified.
All full-sample and leave-one-firm-out interpretations use the same Table 7 specification. The 16.08% vertex is reported only to describe the fitted quadratic and is not used as evidence of an inverted-U relationship.
Seventeen lagged firm-years from three firms lie above the descriptive 16.08% vertex. The full-sample linear and quadratic ownership terms are not statistically distinguishable from zero. Excluding African Rainbow Minerals shifts the vertex to 27.99%, whereas excluding Exxaro reverses the quadratic sign and places the implied vertex outside the observed range. The curvature is therefore firm-sensitive and does not support a general ownership tipping point.
4.3. Formal Comparison of CED and CLIM Ownership Contrasts
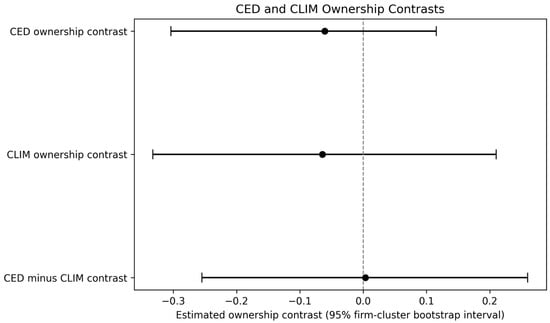
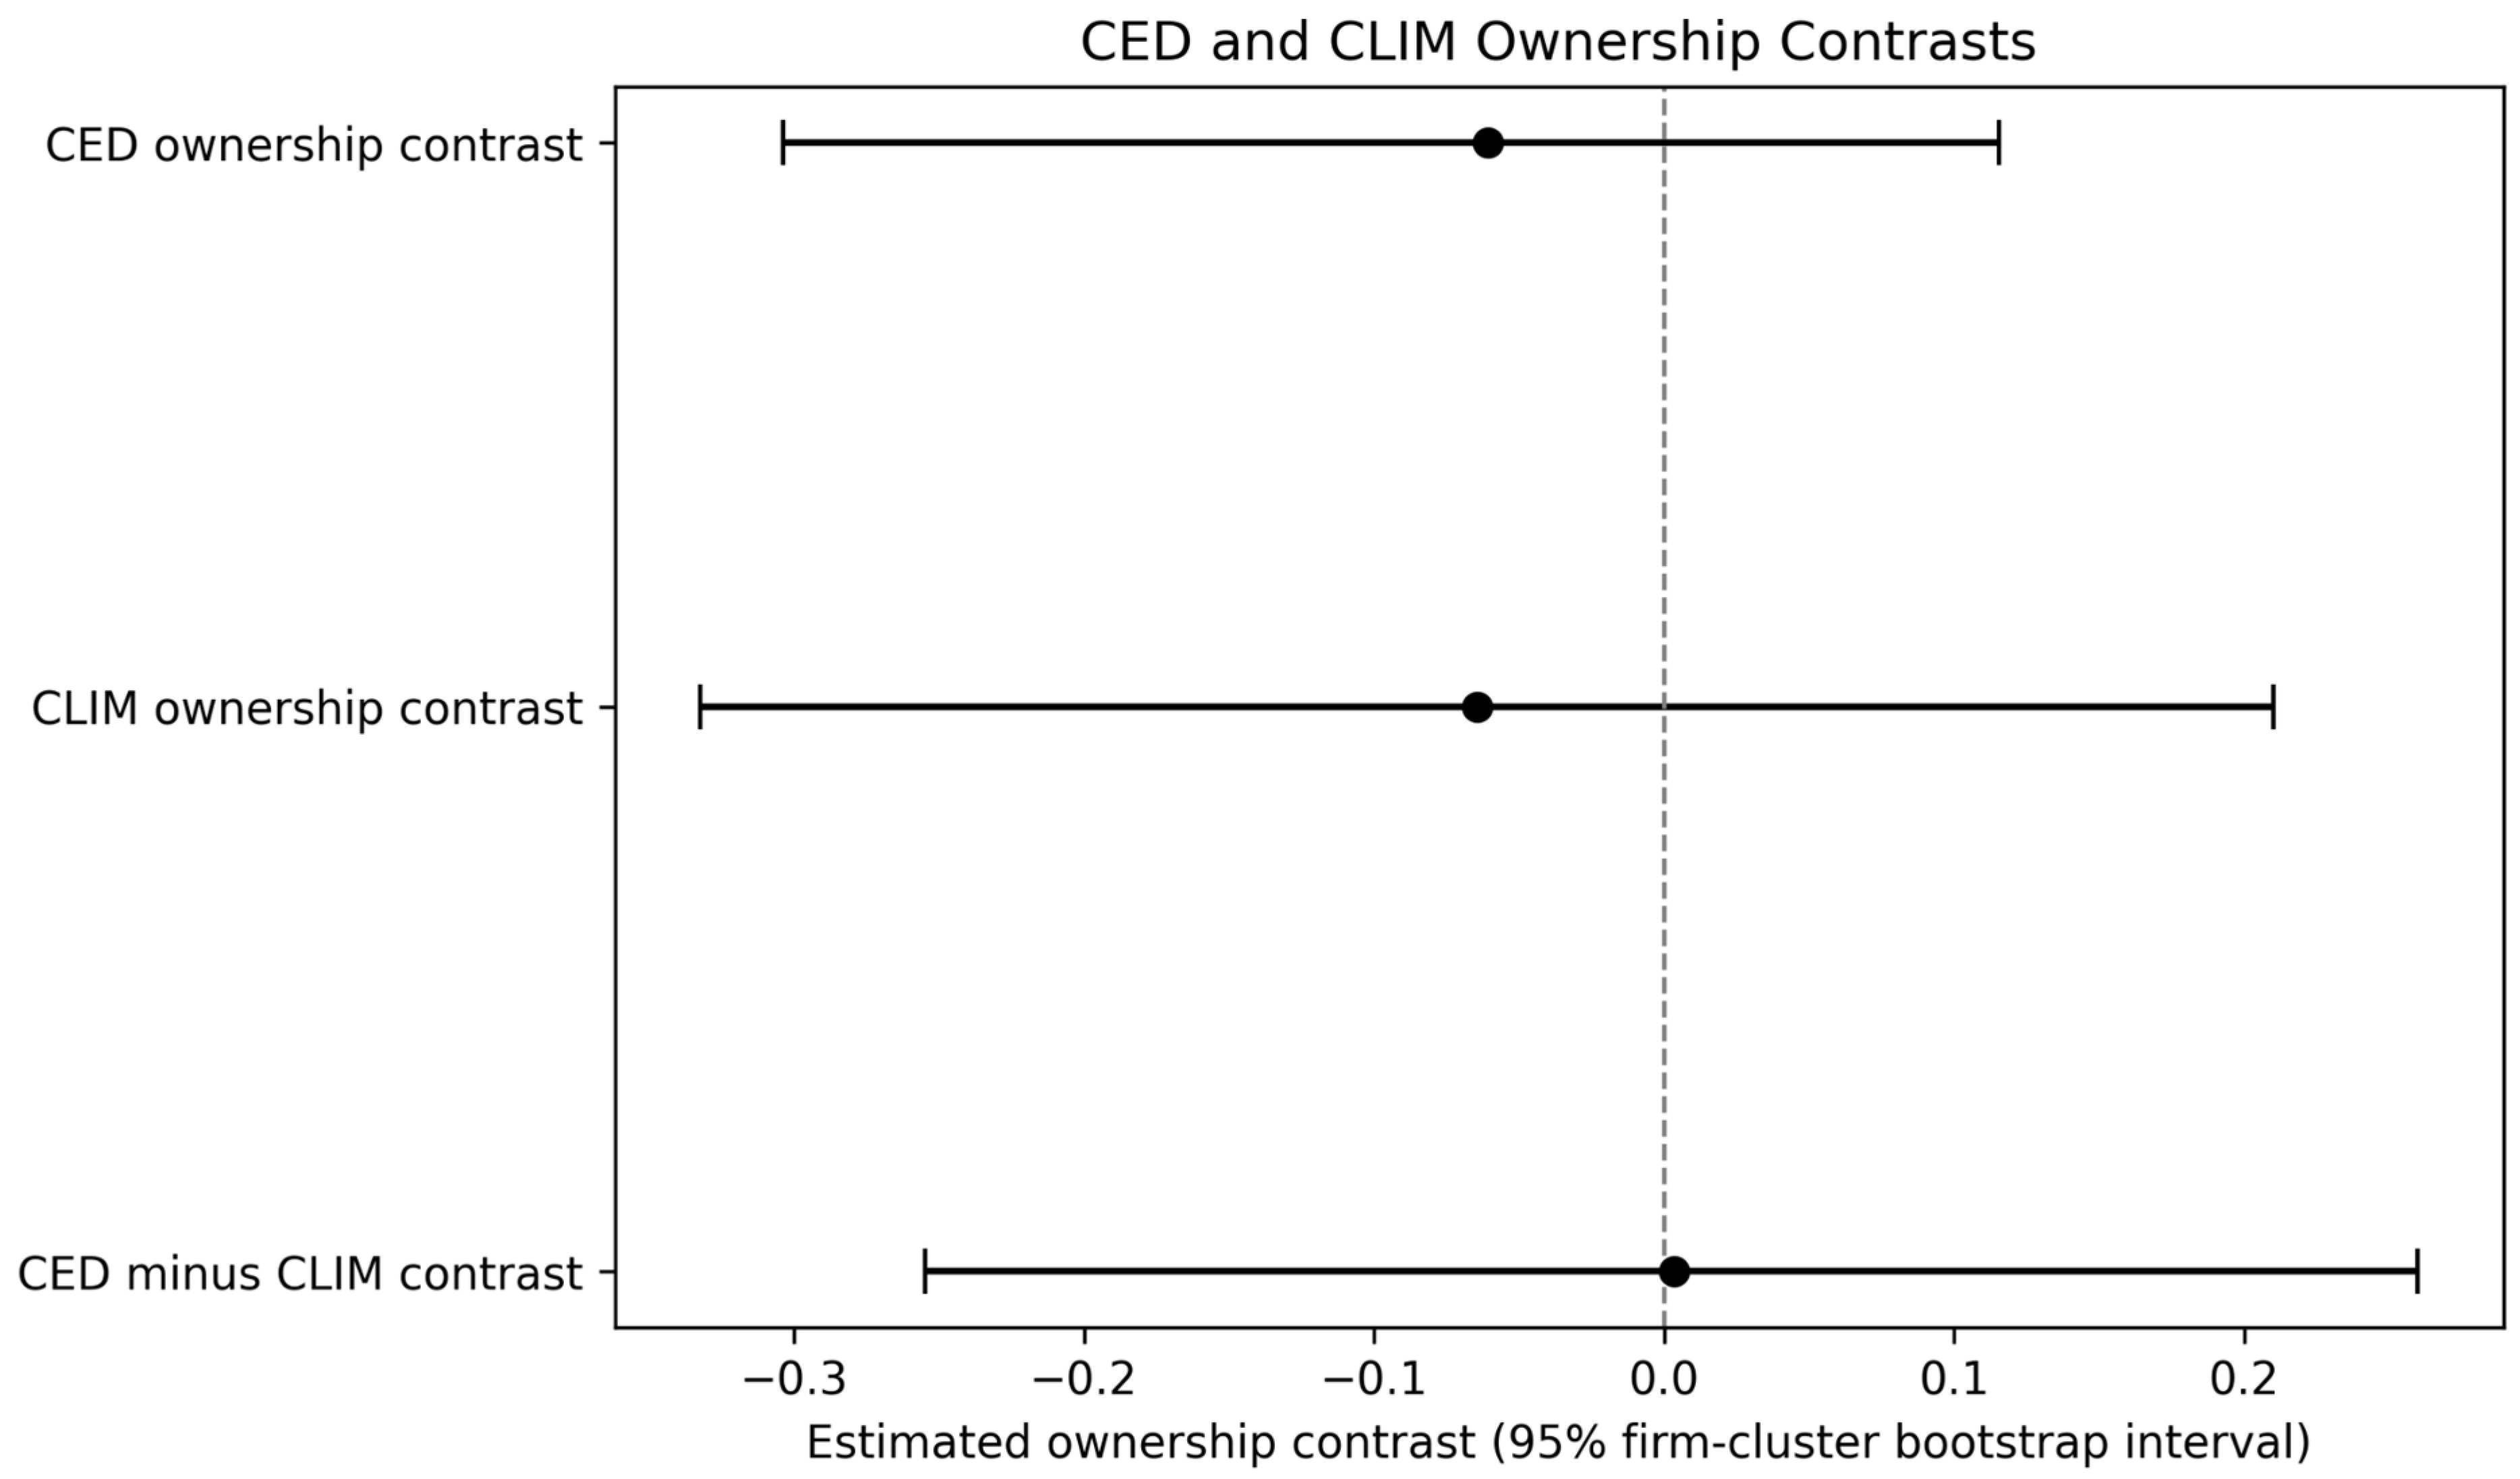
The common adjusted median-split analysis yields a CED contrast of −0.0606 (95% firm-cluster bootstrap CI [−0.3036, 0.1156], p = 0.6623) and a CLIM contrast of −0.0642 (95% CI [−0.3322, 0.2101], p = 0.6973). Their direct difference is 0.0036 (95% CI [−0.2546, 0.2598], p = 0.9105). Neither architecture-specific contrast nor their difference is statistically distinguishable from zero. The evidence does not support a differential CED–CLIM ownership association. The median split is a sample-specific adjusted comparison and is not evidence for the continuous quadratic pattern.
Figure 5 visualises the common-estimand comparison in Table 9. Both architecture-specific confidence intervals cross zero and overlap substantially; the direct CED-minus-CLIM contrast is 0.0036 (p = 0.9105). The figure, therefore, supports a null differential-ownership result, not equivalence of the two disclosure architectures.
Figure 5.
Adjusted CED and CLIM ownership contrasts. Notes: [1] Points are adjusted median-split contrasts; error bars are 95% firm-cluster bootstrap percentile intervals based on 1999 replications [2]. All intervals cross zero [3]. The CED-minus-CLIM contrast is 0.0036 (p = 0.9105) [4]. Source: author computation via Python 3.
Table 9.
Adjusted median-split ownership contrasts for CED and CLIM.
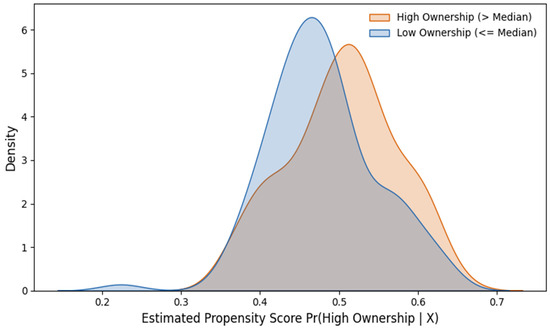
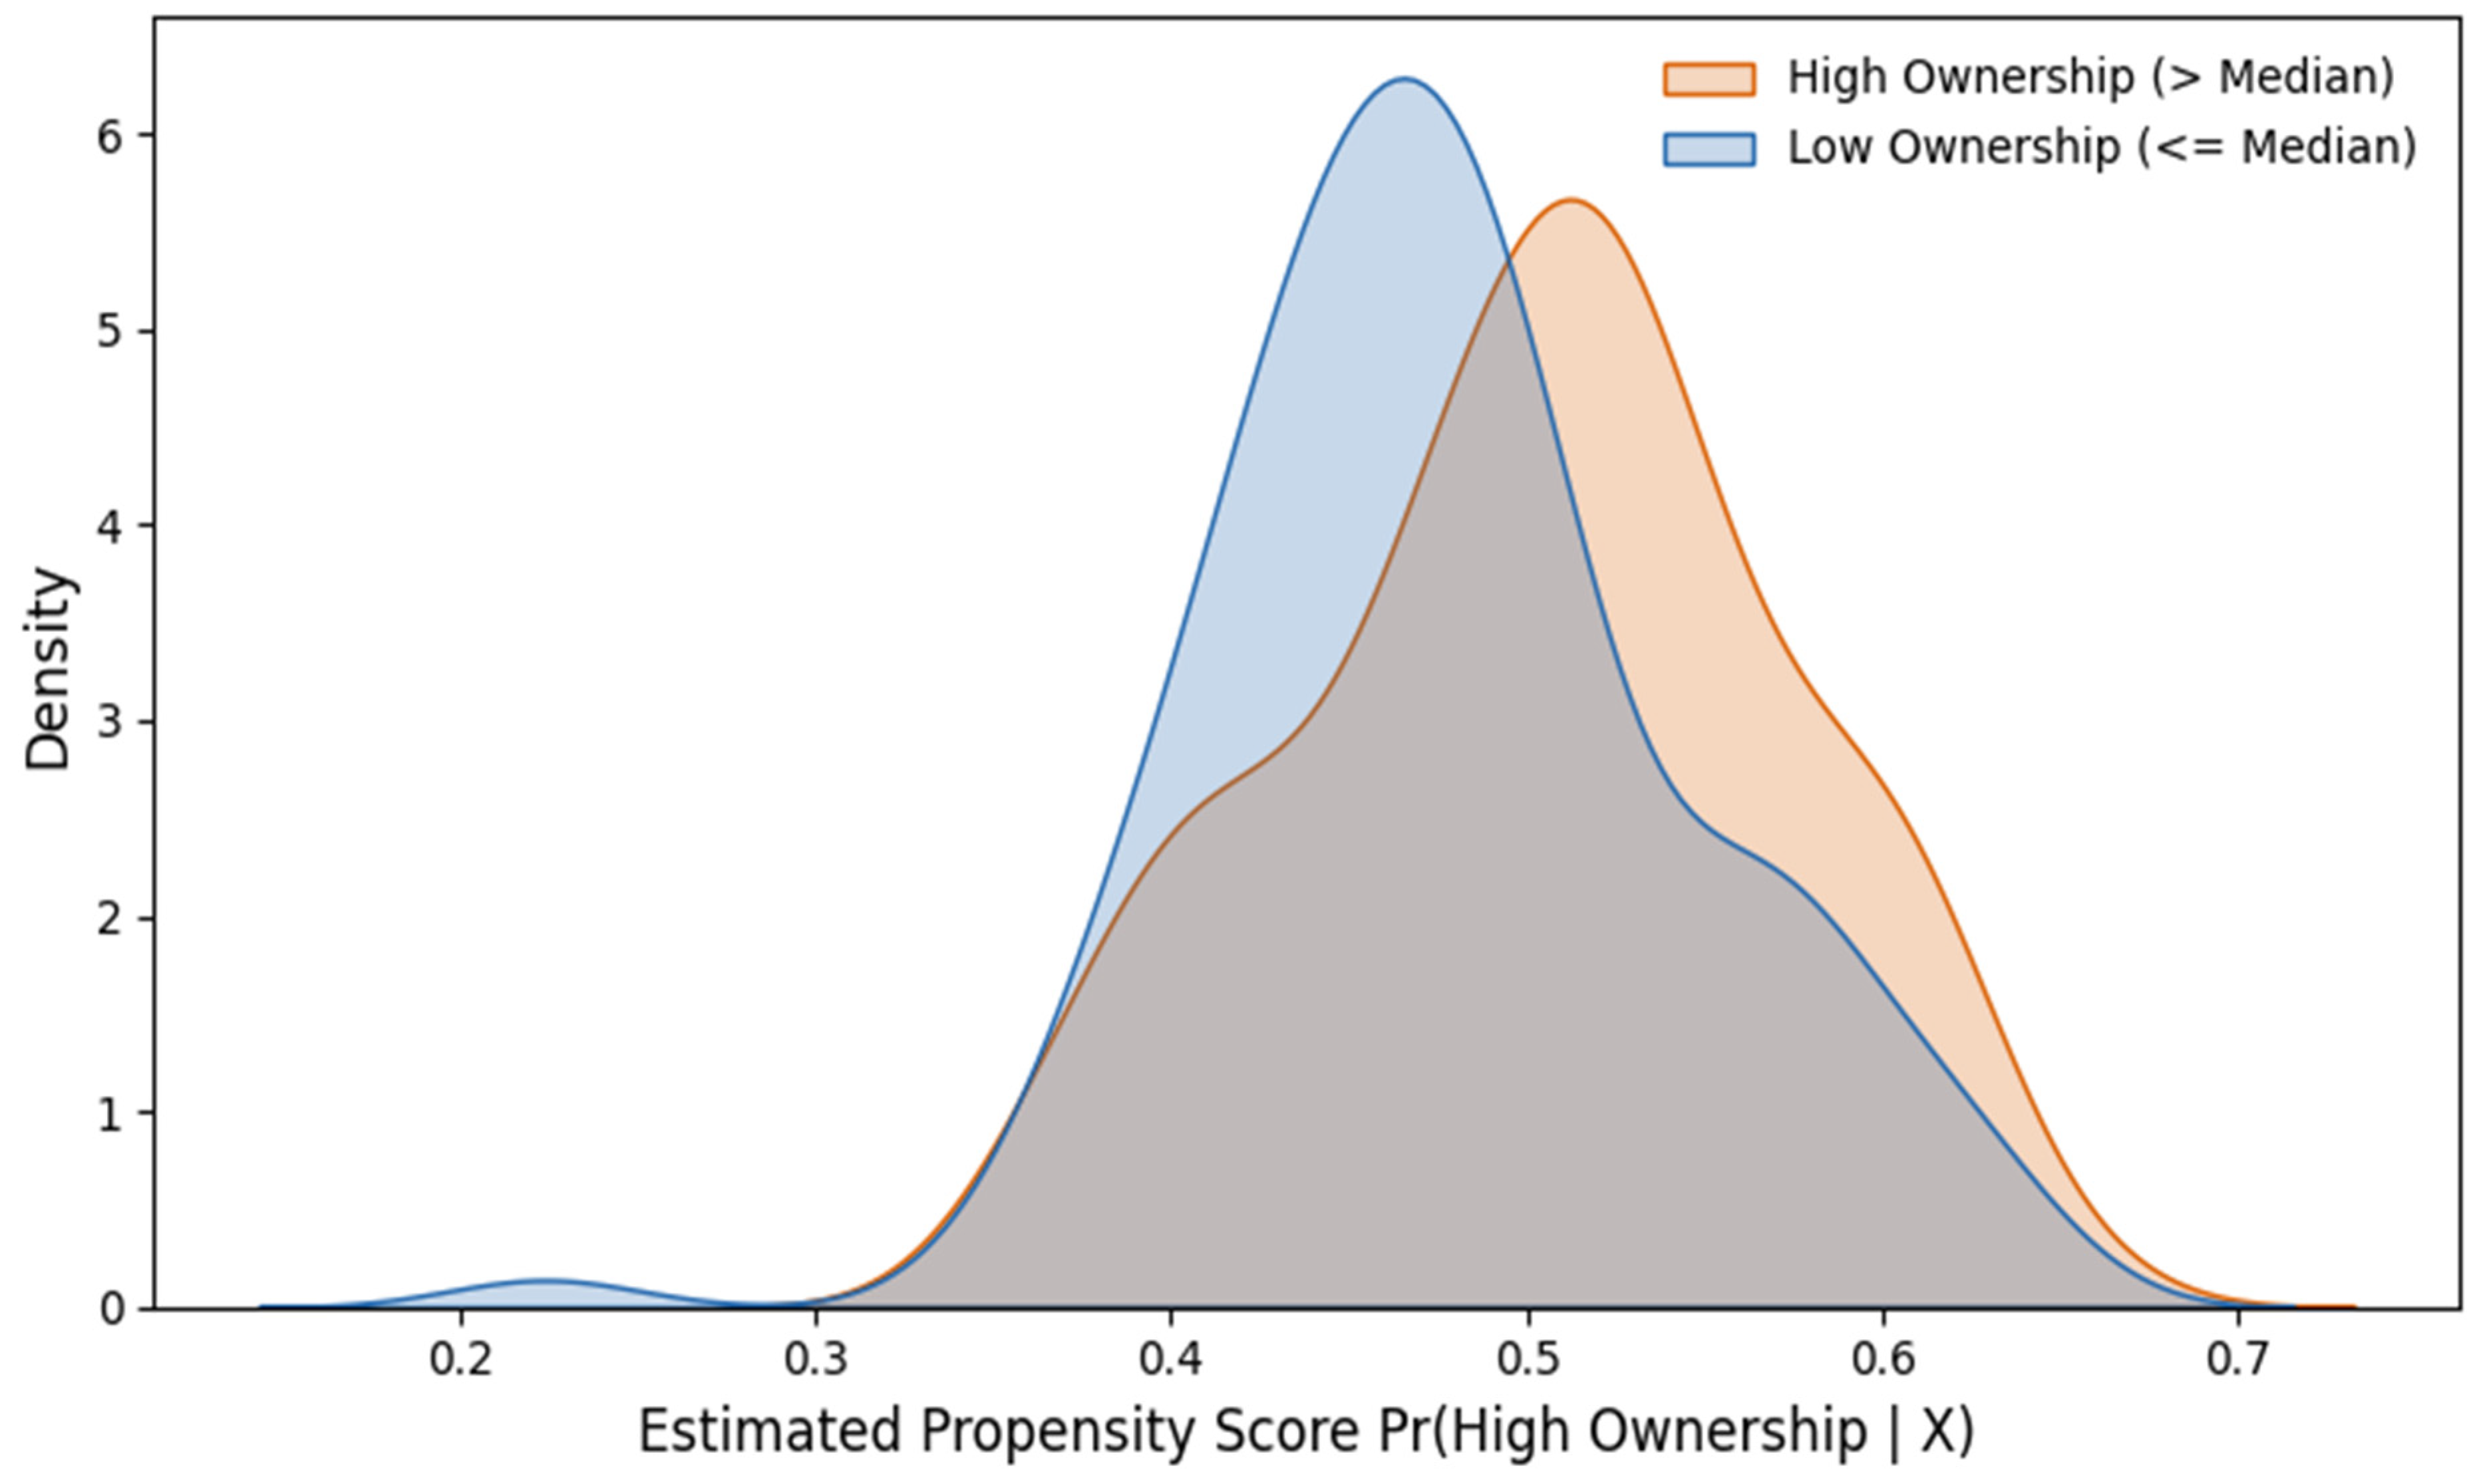
Figure 6 provides the positivity diagnostic for the adjusted median-split comparison. The two estimated propensity-score distributions overlap, indicating that both ownership groups are represented across the observed covariate range. This diagnostic supports comparability for Table 9 but does not create causal identification or validate the continuous quadratic specification.
Figure 6.
Propensity-score overlap for above- and below-median directors’ ownership. Notes: [1] Kernel densities show predicted propensity scores for observations above and below the lagged-sample median ownership [2]. Overlap is a positivity diagnostic for Table 9 only; it is not a robustness test of the descriptive quadratic vertex [3]. Source: author computation via Python 3.
The fractional logit (Table 10) does not strengthen the quadratic interpretation: both centred ownership terms are imprecise, and the squared term changes sign relative to the ordered model. As a separate sparse-event diagnostic, a clustered High-Maturity-versus-rest logit was estimated for CED. The lagged sample contains only six High-Maturity observations from five firms, and maximum likelihood does not converge because of quasi-separation. The binary model is therefore not used for inference. Together, these diagnostics reinforce the limited ownership information in the sample.
Table 10.
Fractional response logit for the continuous CED index [0, 1].
4.4. Cross-Architecture and Institutional-Period Comparisons
The adjusted median-split analysis serves one purpose, e.g., a direct CED–CLIM comparison under a common estimand. For each outcome, the adjusted tier contrast is estimated from the specified covariate-adjusted model at the lagged-sample median ownership split, and uncertainty is obtained from 1999 firm-cluster bootstrap replications. Neither architecture-specific contrast is statistically precise, and their difference is effectively zero. The split is sample-specific and is not interpreted as a governance threshold. The post-2017 interaction is reported only for CED under RQ3 and is interpreted as exploratory institutional-period heterogeneity rather than as a causal King IV effect.
5. Discussion of Findings
The clearest evidence concerns disclosure architecture. CED is more concentrated and persistent than CLIM at the original-score, tier and firm-trajectory levels. These observed differences support treating backward-looking environmental outcomes and forward-looking climate-risk preparedness as distinct information objects. The persistence comparison remains descriptive, however, and the use of construct-specific evidence anchors means that the observed contrast may partly reflect rubric calibration, as well as reporting behaviour.
The null ownership result is theoretically informative because conceptual differentiation does not guarantee differential exposure to one governance variable. The explanation most consistent with this setting is that external reporting frameworks and sector-wide institutional demands constrain the incremental discretion associated with directors’ ownership: CED is concentrated at one maturity level across firms, while the ownership contrasts for both outcomes are imprecise and nearly identical. Aggregation of executive and non-executive holdings and omitted governance dimensions remain plausible measurement-based alternatives, so the evidence cannot establish that institutional constraint is the sole mechanism. The defensible boundary result is that directors’ ownership does not reliably distinguish the two architectures in this sample.
The findings apply to a small panel of JSE-listed mining firms and should be read as exploratory architecture evidence. Interpretation of the ownership estimates is limited by the aggregation of executive and non-executive holdings, unavailable governance covariates, restricted upper-tail support and a noncausal period comparison. The reconstructed coding rubric permits reassessment of archived evidence–score pairs but does not reproduce the original FinBERT-assisted extraction and training process, and the 54-case reassessment set is not an independent blinded validation exercise.
6. Implications
The strongest practical implication is that researchers, investors and regulators should be cautious about collapsing backward-looking corporate environmental disclosure and forward-looking climate-resilience reporting into a single ESG disclosure measure. In the observed panel, CED is more concentrated and persistent, whereas CLIM is more dispersed and dynamic. A composite ESG disclosure measure could therefore conceal differences in the content, maturity and temporal behaviour of these two information objects. The findings do not support using directors’ ownership as a disclosure-quality proxy or policy instrument, and the post-2017 CED interaction should be interpreted only as exploratory institutional-period heterogeneity rather than as a King IV effect.
7. Conclusions
This paper asked first, whether backward-looking CED and forward-looking CLIM are empirically distinct disclosure architectures, and second, whether directors’ ownership helps explain those differences. Original-score distributions, transition matrices and firm-level trajectories show greater observed concentration and persistence for CED and greater mobility for CLIM. These comparisons are descriptive and may partly reflect the construct-specific evidence anchors used on the common maturity scale. The adjusted ownership contrasts are imprecise, and their difference is effectively zero. Distinct disclosure architectures, therefore, do not necessarily imply different associations with directors’ ownership.
This study is subject to four principal limitations. First, the 19-firm South African mining sample limits statistical power and wider generalisation. Second, DOWN combines executive and non-executive holdings and cannot isolate their potentially different incentive and monitoring mechanisms. Third, the observational design does not identify causal ownership effects or isolate King IV from contemporaneous institutional and market developments. Fourth, the retained materials permit reassessment of archived evidence–score pairs and reproduction of the reported analyses, but they do not permit exact reconstruction of the historical FinBERT-assisted extraction and training process; the 54-case reassessment set is not an independent blinded validation exercise. Future research should use larger multi-sector and multi-country panels, distinguish executive from non-executive ownership, document extraction and scoring protocols prospectively, retain original model artefacts and conduct independent full-report validation.
Funding
This research received no external funding.
Institutional Review Board Statement
Not applicable.
Informed Consent Statement
Not applicable.
Data Availability Statement
The firm-year analytical dataset, archived evidence–score records, transition files and analysis code supporting the reported results are available from the corresponding author upon reasonable request, subject to copyright restrictions governing the underlying corporate reports. The original FinBERT model-training artefacts and complete historical extraction log are not available.
Acknowledgments
Microsoft 365 Copilot was used for language improvement, readability, structural organization and formatting support. The author reviewed and verified all substantive arguments, data, analyses, citations and final wording and accepts full responsibility for the content. No generative AI system was used to create or alter the reported empirical observations.
Conflicts of Interest
The author declares no conflicts of interest.
Appendix A. Small-N Design Constraints
Table A1.
Full correlated-random-effects ordered-probit estimates and upper-tail sensitivity.
The analytical sample contains 189 lagged firm-years from 19 firms. Only three firms contribute observations above the model-implied descriptive vertex, and the High-Maturity CED tier contains six lagged observations from five firms. These features limit inference about nonlinear ownership relationships and transitions into the highest disclosure tier. The main analysis, therefore, emphasizes disclosure transitions, a parsimonious ordered model, the formal CED-CLIM contrast, and leave-one-firm-out sensitivity.
Appendix B. Ordinal-to-Continuous Mapping Used in Table 10
Continuous sensitivities map the three tiers to 0.0, 0.5 and 1.0. This preserves rank order but does not establish equal intervals or recover information beyond the retained maturity assignments. Table 10 uses this mapping for the fractional-logit sensitivity, whereas the adjusted contrasts in Table 9 use the ordered tier values directly.
Appendix C. Lag, Placebo, and Upper-Tail Sensitivity
Covariates in the ordered model are lagged one period. The post-2017 interaction describes institutional-period heterogeneity, not a causal King IV effect. In the leave-one-upper-tail-firm-out analysis, excluding African Rainbow Minerals shifts the descriptive vertex from 16.08% to 27.99%, whereas excluding Exxaro reverses the quadratic sign and places the implied vertex outside the observed range. Neither exclusion model yields statistically distinguishable ownership terms.
Appendix D. Retained Coding Materials, Reconstructed Rubric and Reassessment Boundaries
Appendix D documents what can and cannot be reproduced from the retained materials. The historical workflow used FinBERT as a finance-domain, computer-assisted aid for locating and organising potentially relevant report passages. The exact model version, preprocessing steps, evidence-window rules, thresholds, fine-tuning configuration and complete training log were not preserved. Consequently, the original computational extraction and scoring process cannot be reproduced exactly, and no independent machine-learning contribution is claimed.
The retained workbook contains the firm-year identifiers, CED and CLIM evidence excerpts, original 0–4 scores and derived three-tier classifications used in the analysis. These materials permit inspection of the archived evidence–score relationship and exact reproduction of the distributions, recoding, transitions, trajectories and econometric analyses reported in the paper. They do not independently establish that all relevant passages were extracted from each full report.
Appendix D.1. Retained Evidence and Reconstructed Score Interpretation
Table A2.
Retained coding materials and reproducibility.
Table A2 distinguishes the retained materials from the unavailable historical components. “Reproducible” in this appendix refers only to downstream recoding and analysis from the archived evidence–score pairs; it does not refer to recreation of the original FinBERT-assisted extraction or training process.
The rubric in Table 2 was reconstructed retrospectively from the retained evidence–score pairs and the substantive reporting logic. It provides explicit interpretation boundaries for reassessment of archived classifications. It should not be read as a contemporaneous training protocol or as proof of the precise historical rule used to generate every original score.
The historical evidence fields contain the excerpts retained for each firm-year. Because the archived files do not preserve a complete extraction log, exact search strings, evidence windows and exclusion rules cannot be reconstructed. The manuscript, therefore, makes no claim that the upstream evidence-selection stage has been independently validated.
The original 0–4 scores are retained for both architectures. CED and CLIM share an ordinal maturity logic but use different evidence anchors because they capture different information objects. CED concerns realised environmental performance; CLIM concerns forward-looking climate risks, targets, transition actions and preparedness. Differences between the two series may therefore reflect both reporting behaviour and construct-specific calibration.
For the ordinal analysis, original scores 0–2 were grouped as Basic, score 3 as Targeted and score 4 as High-Maturity. The High-Maturity category describes the depth and integration of the reported evidence and does not, by itself, indicate external assurance. External assurance was relevant only when it was explicitly stated in the underlying report. CED and CLIM were coded independently because they represent different information architectures: CED records realised environmental performance, whereas CLIM captures forward-looking climate risks, targets, transition actions and preparedness.
Appendix D.2. Stratified Reassessment Set
A 54-observation reassessment set was constructed to facilitate focused review of the retained evidence and maturity assignments. The set includes all 24 observations outside the dominant CED category and 30 observations randomly selected from the Targeted CED category using a fixed seed of 20261001. The sampling rule is reproducible, but no blind second-coder exercise was completed.
For each selected firm-year, the reassessment file retains the company identifier, reporting year, CED and CLIM evidence excerpts, original 0–4 scores and corresponding maturity tiers. The set supports transparent inspection of final coding decisions. It is not an independent full-report validation exercise, and no agreement, kappa, sensitivity, specificity or reclassification statistic is claimed.
Table A3.
Composition of the stratified reassessment set.
Appendix D.3. Report-Source Comparability for 2025
The source inventory covers 208 observed firm-year records. For 2025, full-year integrated annual reports are available for 18 firms. Gold Fields has no 2025 observation and accounts for the only missing firm-year in the potential 19-firm, 11-year panel. The available 2025 observations, therefore, use a consistent full-year document basis. The retained inventory records the company, reporting year, report title and the CED and CLIM evidence used in the classification process.
Table A4.
Source documents for the 2025 observations.
Appendix D.4. Firm-Level Disclosure Trajectories
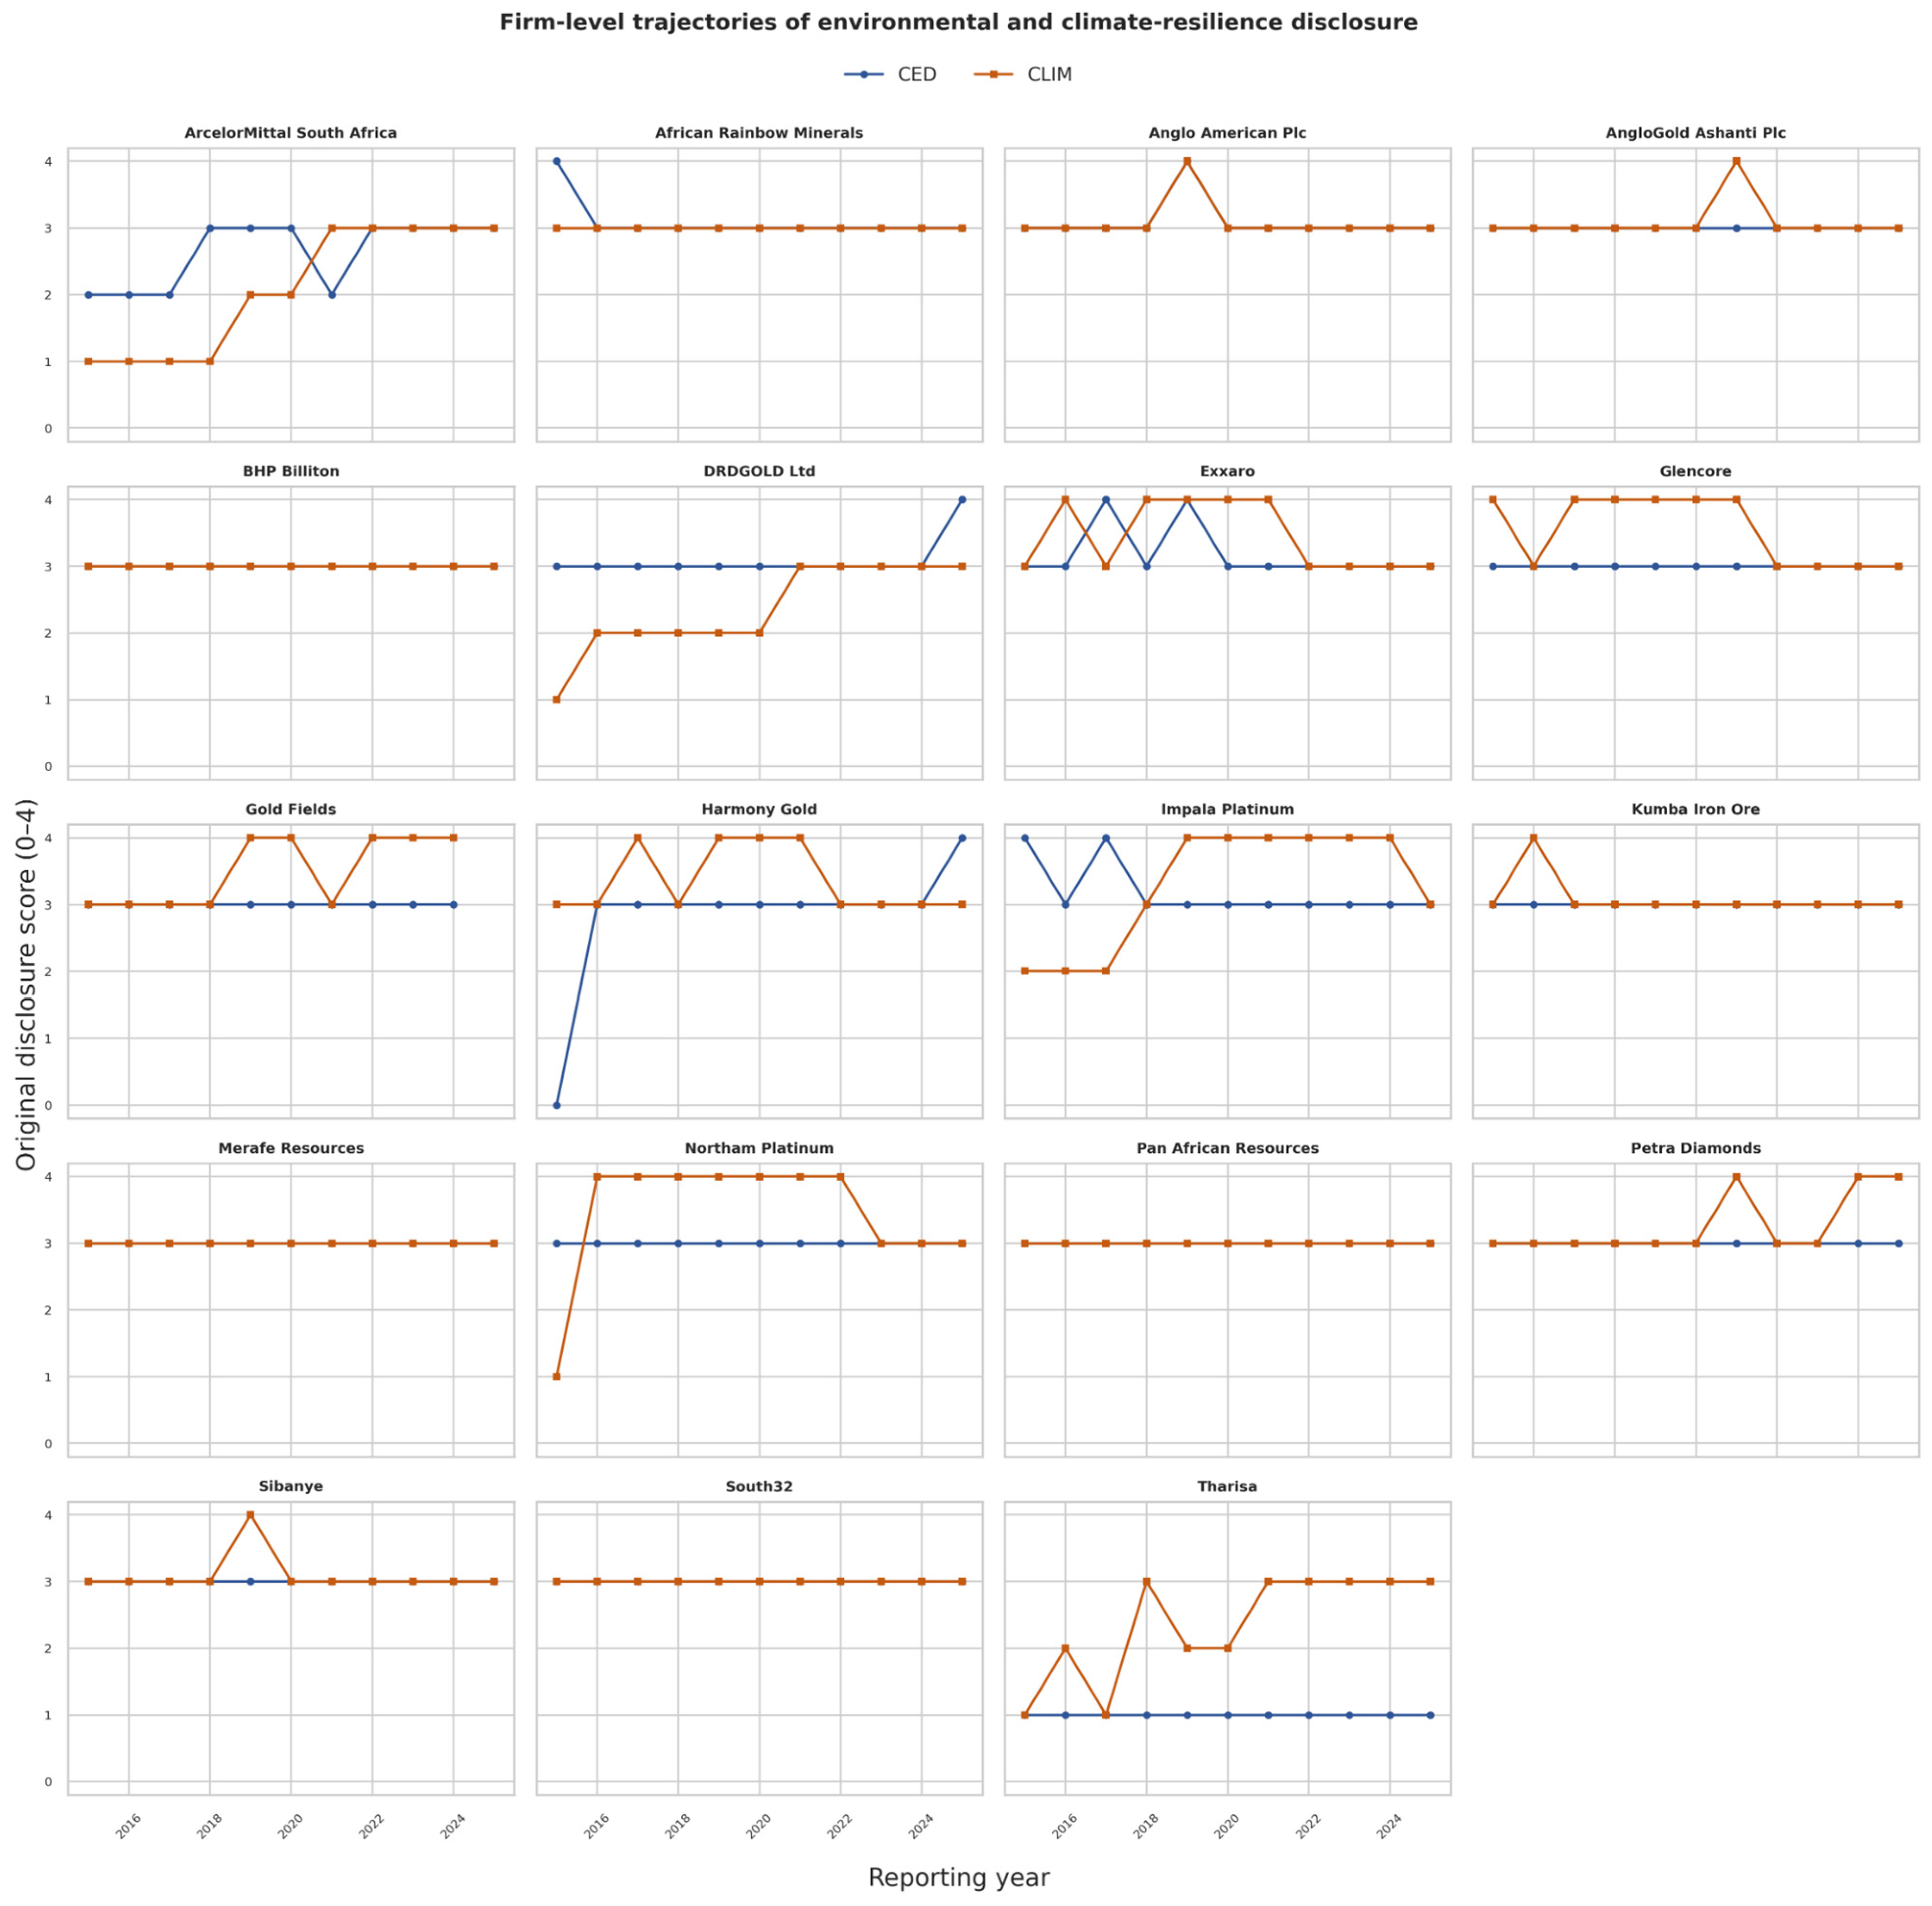
Figure A1 disaggregates the aggregate persistence findings by firm. CED remains at original score 3 for most companies and reporting years, indicating substantial standardisation in backward-looking environmental disclosure. CLIM exhibits more frequent movements between scores 3 and 4 and several gradual transitions from lower scores, consistent with greater variation in forward-looking climate-resilience reporting. The firm-level paths show that the architectural contrast is distributed across the sample rather than generated by a single company.
Figure A1.
Firm-level trajectories of original CED and CLIM scores, 2015 – 2025. Notes: [1] Scores range from 0 to 4 [2]. CED denotes corporate environmental disclosure, and CLIM denotes climate-resilience reporting [3]. The trajectories are descriptive and do not identify causal changes [4]. Gold Fields has no observation for 2025.
References
- Demaria, S.; Rigot, S. Corporate environmental reporting: Are French firms compliant with the Task Force on Climate-related Financial Disclosures’ recommendations? Bus. Strategy Environ. 2021, 30, 728–738. [Google Scholar] [CrossRef] [Scilit]
- Ilhan, E.; Krueger, P.; Sautner, Z.; Starks, L.T. Climate risk disclosure and institutional investors. Rev. Financ. Stud. 2023, 36, 2617–2650. [Google Scholar] [CrossRef] [Scilit]
- Lu, Z.; Liang, Y.; Hu, Y.; Liu, Y. Is managerial myopia detrimental to corporate ESG performance? Int. Rev. Econ. Finance 2024, 92, 998–1015. [Google Scholar] [CrossRef] [Scilit]
- Mans-Kemp, N.; Van der Lugt, C.T. Linking integrated reporting quality with sustainability performance and financial performance in South Africa. S. Afr. J. Econ. Manag. Sci. 2020, 23, 1–11. [Google Scholar] [CrossRef] [Scilit]
- Halidu, O.B.; Awuah-Gyawu, M.; Fianko, A.O.; Gyamfi, B.A.; Asongu, S.A. Corporate governance and circular supply chains: Synergizing eco-adaptive organizational culture, leadership eco-innovation willingness, and perceived urgency for circularity. J. Environ. Manag. 2025, 392, 126689. [Google Scholar] [CrossRef] [Scilit] [PubMed]
- Agapova, A.; King, T.; Ranta, M. Navigating transparency: The interplay of ESG disclosure and voluntary earnings guidance. Int. Rev. Financ. Anal. 2025, 97, 103813. [Google Scholar] [CrossRef] [Scilit]
- Demers, E.; Hendrikse, J.; Joos, P.; Lev, B. ESG did not immunize stocks during the COVID-19 crisis, but investments in intangible assets did. J. Bus. Finance Account. 2021, 48, 433–462. [Google Scholar] [CrossRef] [Scilit] [PubMed]
- Jensen, M.C.; Meckling, W.H. Theory of the firm: Managerial behavior, agency costs and ownership structure. J. Financ. Econ. 1976, 3, 305–360. [Google Scholar] [CrossRef] [Scilit]
- Morck, R.; Shleifer, A.; Vishny, R.W. Management ownership and market valuation: An empirical analysis. J. Financ. Econ. 1988, 20, 293–315. [Google Scholar]
- Tang, Y.; Jiang, W.; Shi, D. The effect of non-actual controllers on corporate green governance performance. Systems 2025, 13, 963. [Google Scholar] [CrossRef] [Scilit]
- Chi, C.; Cheng, Y. The dynamics of selective environmental disclosure: Earnings pressure and environmental committee. J. Bus. Res. 2026, 202, 115766. [Google Scholar] [CrossRef] [Scilit]
- Cao, J.; Huang, Z.; Shahid, A.U. Fostering environmental integrity via investor-focused communications: Private in-house meeting disclosures and greenwashing behaviors. J. Econ. Behav. Organ. 2025, 232, 106946. [Google Scholar] [CrossRef] [Scilit]
- Acar, E.; Tunca Çalıyurt, K.; Zengin-Karaibrahimoglu, Y. Does ownership type affect environmental disclosure? Int. J. Clim. Chang. Strateg. Manag. 2021, 13, 120–141. [Google Scholar] [CrossRef] [Scilit]
- Barg, J.A.; Drobetz, W.; El Ghoul, S.; Guedhami, O.; Schröder, H. Institutional dual ownership and voluntary greenhouse gas emission disclosure. J. Corp. Finance 2024, 89, 102671. [Google Scholar] [CrossRef] [Scilit]
- Delis, M.D.; Greiff, K.D.; Iosifidi, M.; Ongena, S. Being stranded with fossil fuel reserves? Climate policy risk and the pricing of bank loans. Financ. Mark. Inst. Instrum. 2024, 33, 239–265. [Google Scholar] [CrossRef] [Scilit]
- Suhardjo, I.; Akroyd, C. Stakeholder-driven disclosure architecture: A systematic review of sustainability reporting. Report. Account. Rev. 2026, 3, 21–36. [Google Scholar] [CrossRef] [Scilit]
- Yue, S.; Khatib, S.F.A.; Bajuri, N.H.; Sulimany, H.G.H.; Lee, Y. Executive ownership and minority shareholder protection: Drivers of environmental innovation in China’s A-share market. Corp. Soc. Responsib. Environ. Manag. 2025, 32, 3854–3873. [Google Scholar] [CrossRef] [Scilit]
- Yue, S.; Chang, C.; Ding, R.; Samara, H. Governance entrenchment and ESG effectiveness in driving environmental innovation: New evidence from China. Rev. Manag. Sci. 2026. [Google Scholar] [CrossRef] [Scilit]
- Yue, S.; Abdeldayem, B.; Samara, H.; Elamer, A.A. When ESG engagement becomes environmental innovation: Board cultural diversity and ESG intensity in European listed firms. Bus. Strategy Dev. 2026, 9, e70408. [Google Scholar] [CrossRef] [Scilit]
- Bartlett, R.; Bubb, R. Corporate Social Responsibility Through Shareholder Governance; European Corporate Governance Institute Law Working Paper 2023, No. 682/2023; European Corporate Governance Institute: Brussels, Belgium, 2023. [Google Scholar]
- Christensen, H.B.; Hail, L.; Leuz, C. Mandatory CSR and sustainability reporting: Economic analysis and literature review. Rev. Account. Stud. 2021, 26, 1176–1248. [Google Scholar] [CrossRef] [Scilit]
- Edmans, A.; Holderness, C.G. Blockholders: A survey of theory and evidence. In The Handbook of the Economics of Corporate Governance; Elsevier: Amsterdam, The Netherlands, 2017; Volume 1, pp. 541–636. [Google Scholar]
- Munisi, G. Mapping intellectual structure of ownership structure and corporate social responsibility: A bibliometric analysis. Cogent Bus. Manag. 2024, 11, 2371065. [Google Scholar] [CrossRef] [Scilit]
- De Villiers, C.; Sharma, U. A critical reflection on the future of financial, intellectual capital, sustainability and integrated reporting. Crit. Perspect. Account. 2020, 70, 102195. [Google Scholar] [CrossRef] [Scilit]
- García-Sánchez, I.M.; Hussain, N.; Khan, S.A.; Martínez-Ferrero, J. Do markets punish or reward corporate social responsibility decoupling? Bus. Soc. 2021, 60, 1431–1467. [Google Scholar] [CrossRef] [Scilit]
- Nedunuru, A.; George, N. Striking the balance: The role of ESG contracting and CEO power on ESG decoupling. Int. J. Discl. Gov. 2026, 1–16. Available online: https://link.springer.com/article/10.1057/s41310-026-00359-x (accessed on 9 October 2026). [CrossRef] [Scilit]
- Institute of Directors in Southern Africa (IoDSA). King IV Report on Corporate Governance for South Africa 2016; IoDSA: Sandton, South Africa, 2016. [Google Scholar]
- Plumlee, M.; Brown, D.; Hayes, R.M.; Marshall, R.S. Voluntary environmental disclosure quality and firm value: Further evidence. J. Account. Public Policy 2015, 34, 336–361. [Google Scholar] [CrossRef] [Scilit]
- Qiu, Y.; Shaukat, A.; Tharyan, R. Environmental and social disclosures: Link with corporate financial performance. Br. Account. Rev. 2016, 48, 102–116. [Google Scholar] [CrossRef] [Scilit]
- Dang, C.; Li, Z.F.; Yang, C. Measuring firm size in empirical corporate finance. J. Bank. Finance 2018, 86, 159–176. [Google Scholar] [CrossRef] [Scilit]
- Dhaliwal, D.S.; Li, O.Z.; Tsang, A.; Yang, Y.G. Voluntary nonfinancial disclosure and the cost of equity capital: The initiation of corporate social responsibility reporting. Account. Rev. 2011, 86, 59–100. [Google Scholar] [CrossRef] [Scilit]
- Cucari, N.; Esposito De Falco, S.; Orlando, B. Diversity of board of directors and environmental social governance: Evidence from Italian listed companies. Corp. Soc. Responsib. Environ. Manag. 2018, 25, 250–266. [Google Scholar] [CrossRef] [Scilit]
- Bolton, P.; Kacperczyk, M. Do investors care about carbon risk? J. Financ. Econ. 2021, 142, 517–549. [Google Scholar] [CrossRef] [Scilit]
- Heckman, J.J. The incidental parameters problem and the problem of initial conditions in estimating a discrete time-discrete data stochastic process. In Structural Analysis of Discrete Data with Econometric Applications; MIT Press: Cambridge, MA, USA, 1981; pp. 179–195. [Google Scholar]

Disclaimer/Publisher’s Note: The statements, opinions and data contained in all publications are solely those of the individual author(s) and contributor(s) and not of MDPI and/or the editor(s). MDPI and/or the editor(s) disclaim responsibility for any injury to people or property resulting from any ideas, methods, instructions or products referred to in the content. |
© 2026 by the author. Licensee MDPI, Basel, Switzerland. This article is an open access article distributed under the terms and conditions of the Creative Commons Attribution (CC BY) license.