


Abstract
Against the background of urban stock renewal, new public cultural facilities are important carriers for improving the public cultural service system, and their spatial configuration is closely related to the equity and efficiency of public cultural resource allocation. The spatio-temporal distribution patterns of public cultural facilities and the factors influencing them have important implications for optimizing the allocation of public cultural facilities and advancing the equalization and sustainable development of public cultural services. Using urban reading rooms (URRs) in Luoyang’s central urban area as a case study, this study employed kernel density estimation, standard deviational ellipse analysis, exploratory space–time data analysis (ESTDA), and the Optimal Parameters-based Geographical Detector (OPGD) to systematically reveal the evolutionary characteristics of their spatio-temporal patterns and driving mechanisms. The results show that (1) the agglomeration pattern evolved from “two primary cores, four secondary cores, and multiple nodes” to “one primary core, one secondary core, and multiple nodes,” and finally to “one primary core and multiple nodes.” The spatial extent first contracted and then expanded, the overall distribution exhibited a northeast–southwest orientation, and the center of gravity shifted from the northeast to the southwest and then to the southeast. (2) The spatial distribution of URRs exhibited significant positive spatial autocorrelation, although the strength of positive spatial autocorrelation gradually weakened. High–high clusters showed a contracting trend, whereas low–high spatial outliers showed an expanding trend and were the most numerous. (3) A total of 79.74% of the grid cells exhibited relatively stable local spatial patterns; the directions of local spatial dependence exhibited pronounced spatial volatility; and 81.39% of the grid cells showed coordinated growth, indicating a high degree of spatial integration. The spatio-temporal mobility and cohesion coefficients indicated that the local spatial association structure of URRs exhibited strong stability and path dependence. (4) Public service facilities, bus stops, shopping facilities, food and beverage facilities, and population are the major factors influencing the spatial distribution of URRs. The vast majority of interactions among the influencing factors exhibit bivariate enhancement or nonlinear enhancement, indicating that the spatial distribution of URRs is characterized by pronounced multi-factor coupled driving effects. (5) The spatio-temporal pattern evolution of URRs results from the combined effects of multiple factors. Road and transport factors enhance connectivity, educational resources exert an attracting effect, socioeconomic factors provide support, public cultural resource factors produce synergistic effects, and everyday service factors play a dominant role. Together, these five categories of factors form a coupled driving mechanism involving multiple factors: connectivity–attraction–support–synergy–dominance. The findings provide a scientific basis for optimizing the spatial configuration of new public cultural facilities and promoting the equalization and sustainable provision of public cultural services in the context of urban renewal.
1. Introduction
Against the dual backdrop of urban development shifting from incremental expansion to stock renewal and public cultural services transitioning from facility construction to quality improvement and equalized provision, greater emphasis has been placed on equity and efficiency in the spatial configuration of public cultural facilities. Meanwhile, public cultural services are increasingly extending into everyday life settings, while service delivery is becoming more digitalized, thereby driving the emergence of new public cultural facilities and changes in their functions and spatial configuration. The development of new public cultural facilities is an important approach to improving the modern public cultural service system and optimizing the allocation of public cultural resources [1]. To address insufficient service coverage by grassroots public cultural facilities, since the beginning of the 14th Five-Year Plan period, China has regarded the development of new public cultural facilities as an important direction for improving the grassroots public cultural facility network. Against the background of urban renewal, new public cultural facilities have become key carriers for upgrading public services and enhancing residents’ sense of gain. In response to the new-era demands for the equalization and high-quality development of public service facilities in China, an increasing number of scholars have focused on the spatial distribution patterns and formation mechanisms of new public cultural facilities [2].
The spatial distribution regularities and formation mechanisms of public cultural facilities have long been a major focus of geographical research. In terms of spatial distribution regularities, existing studies have found that different types of public cultural facilities generally exhibit a “core–periphery” structure at the citywide level, with the central urban area as the core and a gradual decline toward peripheral zones [3,4,5]. However, at the central urban area level, different types of public cultural facilities mainly exhibit a pattern of expansion from agglomeration centers toward peripheral urban areas [6,7,8]. Regarding influencing factors, existing studies have primarily identified the effects of socioeconomic conditions [9], population demand [10], transport location [6], educational, scientific, and cultural factors [11], and policy support [12] on public cultural facilities. Among these, GDP [12,13], population size [10,14], road network density [15], the number of universities [16], public fiscal expenditure [17], and tourism resources [6] have relatively prominent effects. In addition, household consumption levels [18], urbanization levels [11], degree of openness [9], innovation capacity [10], the spatial distribution of cultural industries [19], and urban administrative rank [12] also exert certain influences. However, given China’s vast territory, differences exist among regions in economic development, urbanization, cultural resources, and other conditions [18,20], resulting in pronounced differences in the distribution patterns and driving mechanisms of public cultural facilities. In cities in Central China, public cultural facilities are mainly influenced by infrastructure, social development, and cultural and educational factors, among which public fiscal expenditure, permanent resident population, the number of regular higher education institutions, the number of students enrolled in higher education institutions, and population density exert relatively prominent effects [9,11,12]. These findings indicate that the spatial distribution of traditional public cultural facilities exhibits a relatively pronounced supply-side orientation [9,10]. Existing studies have shown that the configuration of cultural facilities should be aligned with residents’ everyday cultural needs within life circles [21,22], that retail, food and beverage, and public service facilities are important components of the neighborhood built environment [23], and that community life circles have become an important spatial scale for promoting the equalization of public cultural services and optimizing the layout of cultural facilities [24,25]. Although actual utilization is also influenced by distance-decay effects, perceived accessibility, and temporal availability, the spatial distribution of public cultural facilities remains an important basis for assessing service accessibility and the equalization of public cultural services. However, the influencing factors and mechanisms through which everyday life-circle environments affect the distribution of public cultural facilities have not yet been fully revealed.
At present, the conceptual boundaries of new public cultural facilities have not yet been fully unified in academic research. Based on existing studies and policy documents [26,27,28], their main types include urban reading rooms (URRs), cultural stations, cultural corridors, and new forms of museum spaces. Compared with traditional public cultural facilities, new public cultural facilities are primarily developed through new construction, renovation, and spatial embedding; their service delivery is characterized by digitalization and intelligent technologies, while their siting logic is increasingly oriented toward 15-min community life circles. In recent years, scholars have begun to examine the development and evolution of new public cultural facilities and their underlying mechanisms. Overall, existing studies have commonly focused on factors such as population, economic conditions, transport, policy, market forces, and technology [29,30,31], although the dominant factors vary across regions [32,33]. Studies in eastern China have emphasized cultural landscapes and tourism resources, technological innovation, knowledge services, market forces, and talent agglomeration [29,34]; studies in Central China have mainly focused on population, economic conditions, transport, surrounding environmental conditions, policy orientation, market mechanisms, and changes in everyday life structures [30,31]; studies in western China have concentrated on the development of new technologies and growing public cultural demand [33]. Among the various types of new public cultural facilities, URRs emerged relatively early, have established relatively well-developed construction models, and have been widely promoted across many Chinese cities, making them an important practical type of new public cultural facility. Related studies have mainly focused on spatial patterns and siting optimization [30,32,35]. Although spatial balance and accessibility are regarded as basic principles for the siting of URRs [35], their spatial distribution often remains uneven [30,32]. As new public cultural facilities undergo changes in spatial form, service delivery, and layout characteristics, whether their spatial configuration still follows the configuration logic of existing public cultural facilities remains to be further examined. Meanwhile, the spatio-temporal diffusion of new public cultural facilities exhibits clear stage-specific and dynamic characteristics [31] and is jointly driven by multiple factors. Existing studies have tended to emphasize descriptive analyses of spatial distribution, with insufficient understanding of the dynamic evolution of local spatial patterns and spatio-temporal path dependence. Therefore, exploratory space–time data analysis (ESTDA) can leverage spatial data across different stages of urban reading room development to characterize the dynamic evolution of their spatio-temporal patterns, while the Optimal Parameters-based Geographical Detector (OPGD) can more effectively identify influencing factors and the synergistic driving mechanisms among them.
Currently, the number of new public cultural facilities of various kinds in China has exceeded 40,000 [1], yet disparities in their development across eastern, central, and western China remain pronounced [36]. Compared with eastern China, central and western China still face clear deficiencies in the planning and development of new public cultural facilities. In recent years, Central China, as a key region characterized by rich cultural resources and profound historical heritage, has faced growing demand for higher-quality public cultural services. The national urban renewal initiative has provided policy guidance and financial support for the planning and development of new public cultural facilities in the region, facilitating facility upgrading while also improving overall urban quality. As an important city in Central China, Luoyang has continued in recent years to advance the development of complete communities and 15-min convenient living circles. In 2026, Luoyang was selected as one of the cities receiving central government financial support for urban renewal initiatives. Both its ongoing urban renewal process and the extension of public cultural services to the grassroots level have influenced the spatial patterns of new public cultural facilities. Therefore, taking Luoyang as the study case has a certain degree of typicality and representativeness, and the findings can provide a reference for cities with similar development backgrounds.
Overall, existing studies have examined the spatial patterns and influencing factors of public cultural facilities in considerable depth, but further research is still needed in the following aspects: (1) greater attention should be paid to new public cultural facilities such as URRs, with a focus on revealing their spatial configuration characteristics and differences from traditional public cultural facilities; (2) methods such as the LISA time path and LISA space–time transition should be introduced to deepen the analysis of the dynamic evolution and path dependence of local spatial structures; and (3) greater attention should be paid to residents’ everyday needs and life-circle environments to further explain the synergistic effects of multiple factors and the mechanisms underlying the spatial configuration of new public cultural facilities.
Against this background, this study adopts a geographical perspective and uses URRs in Luoyang’s central urban area in Central China as a case study to systematically investigate the spatial distribution patterns and regularities, influencing factors, and driving mechanisms of new public cultural facilities. First, kernel density estimation, standard deviational ellipse analysis, and exploratory space–time data analysis (ESTDA), including global and local Moran’s I, the LISA time path, and related methods, are employed to reveal the dynamic evolutionary characteristics of their spatio-temporal patterns. Second, the Optimal Parameters-based Geographical Detector (OPGD) is used to identify and measure the key influencing factors. Furthermore, an explanatory framework is developed to elucidate the synergistic mechanisms among multiple dimensions, including road and transport, educational resources, socioeconomic conditions, public cultural resources, and everyday services. This study aims to provide a scientific basis for optimizing the spatial layout of new public cultural facilities in Luoyang’s central urban area and to offer a reference for the spatial optimization and sustainable development of similar new public cultural facilities in cities in Central China.
2. Materials and Methods
2.1. Study Area
Luoyang is located in western Henan Province, extending across both banks of the Yellow River in its middle and lower reaches. It is a regional subcenter within the Central Plains Urban Agglomeration, with a total area of 15,200 km2. As one of the important cradles of Chinese civilization, Luoyang has a profound Heluo cultural heritage and was among the first cities designated by the State Council as a National Historical and Cultural City. The study area covers Luoyang’s central urban area, including five municipal districts: Chanhe Hui District, Xigong District, Laocheng District, Luolong District, and Jianxi District (Figure 1). Its profound Heluo cultural heritage provides a cultural foundation for the development of URRs, while the extension of public cultural services into everyday urban settings has promoted the spatial restructuring of public cultural services and fostered new spatial forms such as URRs. Since 2017, Luoyang has continuously promoted the development of the “Heluo Shuyuan” URRs network, with the aim of establishing a “15-min reading circle.” Over the course of this sustained development, both the number and spatial distribution of URRs exhibited clear stage-specific changes. Luoyang’s practice in developing new public cultural facilities serves as a representative case for optimizing the allocation of public cultural resources in non-provincial-capital historical and cultural cities in Central China.
Figure 1.
Location of the study area.
2.2. Data Sources
(1) Data on URRs. This study focuses on URRs in Luoyang. The data were obtained from the citywide list of URRs published on the official website of the Luoyang Library (http://www.lyslib.cn/) and were supplemented through interviews and telephone consultations with relevant administrators and staff members. For reading rooms with unclear opening dates, the dates were verified individually by telephone. Between 13 and 21 April 2026, five interviews or telephone consultations were conducted with six relevant staff members, including one staff member from the Party History Literature Exhibition Hall of Luoyang Library, one staff member responsible for URR operations in the Community Services Department, one library administrator, one urban reading room staff member, and two staff members from the cultural and tourism authorities. Where discrepancies existed between the official website and the information obtained through interviews and telephone consultations, the most recent list provided by library staff was used as the primary reference and cross-checked item by item against the official website. The opening records date back to 2017 and cover URRs that had been completed and put into operation across the city’s districts and counties, with the data updated through December 2025. The statistical scope of this study was limited to Luoyang’s central urban area, comprising five municipal districts: Chanhe Hui District, Xigong District, Laocheng District, Luolong District, and Jianxi District. A total of 112 URRs within this area were selected as the study objects. No new URRs were added within these five central urban districts in 2025; therefore, the study period was defined as 2017–2024. The spatial locations of the reading rooms were obtained using the AMap Coordinate API. In late 2017, Luoyang began the pilot construction of “Heluo Shuyuan” URRs. In 2018, URR construction was incorporated into the municipal “9+2” work arrangement and was promoted as a key livelihood and public cultural service project under the “Bookish Luoyang” initiative. Through strengthened governmental coordination, clear implementation responsibilities, supervision, and social participation, URRs entered a period of concentrated construction and opening, resulting in the rapid expansion observed during 2017–2018. After 2020, the slowdown in URR construction was mainly related to the gradual saturation in the number of URRs and a shift in policy emphasis from incremental construction toward improving the quality of existing facilities. As the “15-min reading circle” had largely taken shape, subsequent development increasingly focused on the operation, management, and service improvement in existing URRs. Therefore, after 2020, URR development entered a low-growth stage focused primarily on the optimization of existing facilities and the improvement in service effectiveness. Based on the interannual distribution of newly opened URRs (Table 1), the construction peak in 2018 and the marked slowdown in growth in 2020 were used as turning points to divide the study period into three stages: Stage 1 (2017–2018), the rapid expansion stage; Stage 2 (2019–2020), the continued development stage; and Stage 3 (2021–2024), the low-growth improvement stage. For the First Stage, Second Stage, and Third Stage analyses, URRs newly opened within each stage were used rather than cumulative totals, while the Overall Stage analysis was based on all 112 URRs opened during 2017–2024.
Table 1.
Number of Urban Reading Rooms (URRs) by Year.
(2) Influencing-factor data. Data on major and secondary arterial roads were obtained from OpenStreetMap (https://www.openstreetmap.org, 2024). Point-of-interest (POI) data on bus stops, metro access points, electric vehicle charging stations, basic education facilities, higher education institutions, enterprises, cultural exhibition facilities, arts and performance venues, public leisure facilities, landscape resources, shopping facilities, food and beverage facilities, and public service facilities were obtained from AMap (2024). Population data were derived from the LandScan gridded population dataset at a spatial resolution of 1 km (2024). The spatial resolution of the dataset is consistent with the 1 km × 1 km analytical units, providing a basis for characterizing the overall spatial distribution of population, although certain limitations remain in representing population variations at finer spatial scales [37]. GDP data were obtained from the Resource and Environment Science Data Registration and Publication System (2023).
2.3. Research Methods
2.3.1. Kernel Density Estimation (KDE)
Kernel density estimation (KDE) measures the density of point features within a specified spatial neighborhood and can directly reveal the spatial clustering and dispersion patterns of URRs and their intensity [38]. A higher kernel density value indicates a denser spatial distribution of URRs. The calculation formula is as follows:
where n is the total number of sample points, k is the kernel function, and h is the bandwidth. A larger fn(x) value indicates more pronounced clustering of point features and a denser spatial distribution.
2.3.2. Standard Deviational Ellipse (SDE)
The standard deviational ellipse (SDE) is used to analyze the spatial distribution range and directional characteristics of agglomeration areas. The major axis indicates the dominant direction, while the minor axis reflects the breadth of the spatial distribution. The more pronounced the difference between the two axes, the stronger the directionality of the agglomeration area and the higher its degree of spatial concentration [39]. The calculation formulas are as follows:
where XSDE is the standard deviation along the X-axis and YSDE is the standard deviation along the Y-axis; tanθ is the tangent of the rotation angle θ of the major axis of the ellipse; xi and yi are the coordinate values of the ith URR; and are the X- and Y-coordinates of the mean center of the URRs, respectively; n is the total number of URRs; and and are the centered coordinates, representing the offsets of each URRs from the mean center.
2.3.3. Exploratory Space–Time Data Analysis (ESTDA)
Exploratory space–time data analysis (ESTDA) integrates temporal and spatial attributes into the evolution of geographic phenomena, helping to reveal the spatio-temporal interactions of the research object and thereby addressing the limited consideration of temporal attributes in conventional exploratory spatial data analysis (ESDA) [40]. In this study, Luoyang’s main urban area was divided into 1 km × 1 km grid cells. A 1 km × 1 km grid can achieve a balance between spatial resolution and statistical robustness [41]. The selection of this grid size considered the spatial distribution of the 112 URRs, the sparsity of facility counts, and the need to integrate 17 influencing factors within a unified spatial analytical framework. Among the 908 grid cells, 817 contained no URRs, while only 17 (1.87%) contained two or more URRs. Further subdivision into finer grids would increase the number of zero-value cells. Global Moran’s I was used to measure the spatial autocorrelation of URRs and to determine whether their distribution exhibited potential spatial interdependence. Local Moran’s I was used to examine the spatial association and differences between the number of URRs in each grid cell and those in neighboring grid cells. LISA time path analysis incorporates the temporal dimension by tracking the movement trajectories of each grid cell’s attribute value and its spatial lag over time in the Moran scatter plot, thereby revealing the intensity of spatio-temporal dynamics of URRs in Luoyang’s central urban area. LISA space–time transition analysis identifies transitions between quadrants in the Moran scatter plot for the attribute values of the study units and their spatial lags over time, thereby revealing the stability of the spatial association structure between each grid cell and its neighboring grid cells.
(1) LISA Time Path
The LISA time path identifies the movement trajectories of research objects in the local Moran scatter plot, thereby introducing a dynamic perspective into static LISA analysis [40]. It mainly includes relative length, tortuosity, and movement direction. The calculation formulas are as follows:
where di and εi denote the relative length and tortuosity of grid cell i, respectively. di > 1 indicates that the movement distance of grid cell i is greater than the mean. A larger di indicates lower stability of the movement path, while a larger εi indicates greater tortuosity and fluctuation in the local spatial structure. N is the number of grid cells, T is the length of the study period, Li,t denotes the LISA coordinate of grid cell i at time t on the Moran scatter plot, and d(Li,t, Li,t+1) denotes the movement distance of grid cell i from time t to t + 1. θi denotes the movement direction of grid cell i. Here, high- and low-growth trends are defined relative to the mean. Directions of 0–90° indicate positive co-movement, with both the focal grid cell and its neighboring grid cells exhibiting high-growth trends; directions of 90–180° indicate a low-growth trend in the focal grid cell and a high-growth trend in its neighboring grid cells; directions of 180–270° indicate negative co-movement, with both the focal grid cell and its neighboring grid cells exhibiting low-growth trends; and directions of 270–360° indicate a high-growth trend in the focal grid cell and a low-growth trend in its neighboring grid cells. Thus, the 0–90° and 180–270° directions represent coordinated movement between the focal grid cell and its neighborhood, whereas the 90–180° and 270–360° directions indicate opposite growth trends between them.
(2) LISA Space–Time Transition
LISA space–time transition is based on a traditional Markov chain framework and classifies space–time transitions into four types (Table 2) [42]. On this basis, spatio-temporal flow (SF) and spatio-temporal cohesion (SC) are calculated. The formulas are as follows:
where Type 0, Type 1, Type 2, and Type 3A denote the numbers of the corresponding transition types, respectively, and m is the total number of transitions.
Table 2.
Classification of LISA spatio-temporal transition types.
2.3.4. Optimal Parameters-Based Geographical Detector (OPGD)
Geodetector is a statistical method used to evaluate the explanatory power of independent variables for the spatial distribution of a dependent variable and can effectively avoid the multicollinearity problems commonly encountered in traditional linear regression models [43]. However, when continuous variables are analyzed using the conventional Geodetector, the results are highly sensitive to the discretization method and the number of classification levels. The Optimal Parameters-based Geographical Detector (OPGD) model can automatically select the optimal combination of discretization method and number of classes for each continuous variable [44]. In this study, the OPGD model was implemented in the R environment, with the number of discretization classes for the independent variables set to 3–7. After selecting the optimal parameters, the factor detector and interaction detector in Geodetector were applied to identify the driving factors underlying the spatial distribution of URRs in Luoyang’s central urban area and to analyze their mechanisms of influence. The calculation formulas are as follows:
where q is the q-statistic, ranging from 0 to 1. A larger q value indicates greater explanatory power of the corresponding influencing factor for the spatial differentiation of URRs. L is the number of strata of the independent variable; Nh is the number of samples in stratum h; N is the total number of spatial units in the study area; σh2 and σ2 are the variances of stratum h and the entire study area, respectively; and SSW and SST denote the within sum of squares and the total sum of squares, respectively.
3. Results
3.1. Spatio-Temporal Distribution Characteristics
3.1.1. Spatial Agglomeration Characteristics
KDE was used to examine the spatial agglomeration pattern and evolutionary characteristics of URRs (Figure 2). The spatial agglomeration pattern of URRs evolved from “two primary cores, four secondary cores, and multiple nodes” to “one primary core, one secondary core, and multiple nodes,” and finally to “one primary core and multiple nodes.”
Figure 2.
Kernel density distribution of URRs: (a) Stage 1; (b) Stage 2; (c) Stage 3.
Specifically, from the first stage to the second stage, the spatial structure of URRs evolved from “two primary cores, four secondary cores, and multiple nodes” to “one primary core, one secondary core, and multiple nodes.” In the first stage, the two primary cores were located around Luoyang East Railway Station and the Luoyang Municipal People’s Government, respectively, while the four secondary cores were located around Luoyang Railway Station, Qilihe Station on Metro Line 1, the Luoyang Civil Affairs Bureau, and Zhoushan Forest Park. By the second stage, a new primary core had formed in the area extending from Luoyang Dongfang Hospital to Shanghai Market Station on Metro Line 1, while a secondary core formed along Longmen Avenue, and the remaining nodes were scattered. From the second stage to the third stage, the spatial structure further evolved into “one primary core and multiple nodes.” The primary core became concentrated again in the area extending from Luoyang Railway Station to Luoyang East Railway Station, while the multiple nodes became increasingly dispersed. This indicates that, with the implementation of the Management Measures for the Construction of “Heluo Shuyuan” Urban Reading Rooms in Luoyang and related institutional arrangements, the development of URRs gradually shifted from incremental expansion toward spatial layout optimization, with increasing emphasis on the equalized provision of grassroots public cultural services.
3.1.2. Distribution Extent, Direction, and Center of Gravity
The SDE was used to analyze the spatial distribution extent, direction, and center of gravity of URRs. The spatial distribution extent of URRs first contracted and then expanded, the overall direction of the spatial distribution exhibited a northeast–southwest orientation, and the center of gravity shifted along a trajectory from the northeast to the southwest and then to the southeast (Table 3 and Figure 3).
Table 3.
Results of Standard Deviational Ellipse and Center-of-Gravity Migration Analyses of URRs.
Figure 3.
Standard Deviational Ellipses and Center-of-Gravity Migration Trajectory of URRs.
Specifically, in terms of the axis lengths of the SDE, the X- and Y-axis lengths of URRs decreased from 8.573 km and 5.789 km in the first stage to 7.106 km and 4.930 km in the second stage, respectively, indicating a contraction in the spatial distribution extent of URRs during the second stage. In the third stage, the X- and Y-axis lengths increased to 8.600 km and 6.369 km, respectively, indicating that the spatial distribution extent of URRs shifted from contraction to expansion. Overall, both the X- and Y-axis lengths first decreased and then increased, indicating a phased evolutionary pattern of “contraction followed by expansion” in the spatial distribution extent of URRs. In terms of the rotation angle of the SDE, the rotation angle was 87.308° in the first stage, exhibiting a northeast–southwest orientation; it increased to 100.837° in the second stage, shifting to a northwest–southeast orientation; and decreased to 79.073° in the third stage, shifting back to a northeast–southwest orientation. For the overall stage, the rotation angle was 87.717°, indicating that the overall direction of the spatial distribution of URRs exhibited a northeast–southwest orientation, consistent with the direction of the mountain–river axis jointly shaped by Waifang Mountain, Xiong’er Mountain, the Luo River, and the Yi River. In terms of the center of gravity, the center of gravity of URRs in the first stage was located to the northeast, at 112.455° E and 34.658° N. In the second stage, it shifted to 112.427° E and 34.650° N, with the center of gravity shifting from the northeast to the southwest; in the third stage, it shifted to 112.442° E and 34.644° N, with the center of gravity further shifting southeastward. This change was associated with policy support during the “14th Five-Year Plan” period, including Luolong District’s efforts to accelerate the improvement in urban functions, enhance the quality of URRs, and develop a “15-min reading circle,” as well as provincial-level policy support for the quality enhancement and upgrading of Luoyang’s “Heluo Shuyuan.”
3.2. Spatio-Temporal Association Characteristics
3.2.1. Spatial Autocorrelation Analysis
To identify the spatial autocorrelation characteristics of URRs, this study employed global Moran’s I to test whether their spatial distribution exhibited spatial autocorrelation (Table 4). From the first to the third stage, the global Moran’s I values of URRs were 0.1223, 0.0799, and 0.0333, respectively, while the Moran’s I value for the overall analysis was 0.2050. A random permutation test with 999 permutations was further conducted using GeoDa 1.22. The pseudo p-values were 0.001, 0.001, and 0.033 for the three stages, respectively, indicating that the observed positive spatial autocorrelation in each stage was statistically significant. All global Moran’s I values were positive, with p < 0.05 (Table 4). This indicates that the spatial distribution of URRs in all three stages and in the overall analysis exhibited significant positive spatial autocorrelation and clustering patterns. Notably, the global Moran’s I values across the three stages showed a decreasing trend, indicating a gradual weakening of positive spatial autocorrelation and a decline in the degree of spatial agglomeration in the distribution of URRs.
Table 4.
Results of global spatial autocorrelation analysis of URRs.
3.2.2. Local Spatial Association Analysis
To further reveal the spatial associations and differences between individual grid cells and their neighboring grid cells in terms of URR distribution, local Moran’s I was applied to generate a LISA cluster map of the spatial distribution of URRs (Figure 4). The results show that local spatial association types exhibited differentiated spatio-temporal migration paths. High–high clusters showed a contracting trend, whereas low–high spatial outliers were the most numerous and exhibited an expanding trend, characterized by grid cells with fewer URRs being surrounded by neighboring grid cells with relatively more URRs. High–low spatial outliers showed an expanding trend, while low–low clusters consistently comprised only one grid cell.
Figure 4.
LISA cluster maps of URRs: (a) Stage 1; (b) Stage 2; (c) Stage 3.
In terms of spatial evolution, from the first to the second stage, the number of high–high cluster grid cells decreased from 11 to 8. In the first stage, high–high clusters were mainly distributed around Luoyangdong Railway Station, the People’s Government of Laocheng District, and Xingluo Lake Park. By the second stage, their distribution extent had contracted markedly, becoming concentrated along the section of Metro Line 1 from Chang’an Road Station to Peony Square Station. The number of low–high spatial outlier grid cells increased from 60 to 71. In the first stage, low–high spatial outliers were mainly distributed around Luoyang Railway Station, in the area extending from Peony Square to Lijing Men, and around the Civil Administration Bureau of Luoyang City and Luoyang International Peony Garden. By the second stage, their distributional focus had shifted toward the areas surrounding Datang Thermal Power Plant Park, Luoyang Baima Hospital, and Henan University of Science and Technology, gradually expanding toward areas with concentrations of parks and green spaces as well as educational and medical resources. High–low spatial outliers and low–low clusters changed little, remaining at 13 and 1 grid cells, respectively. From the second to the third stage, the number of high–high cluster grid cells further decreased from 8 to 2, with their distribution extent contracting to the vicinity of Mangling Park and the People’s Government of Laocheng District. In contrast, the number of low–high spatial outlier grid cells increased from 71 to 133, shifting from the relatively concentrated distribution of the previous stage to a dispersed pattern with multiple nodes. Newly emerging areas were mainly located around Luoyang Railway Station, the Luoyang City Administration Bureau, Luoyang Dongfang Hospital, and Zhoushan Forest Park, indicating a further increase in local spatial heterogeneity. Meanwhile, the number of high–low spatial outlier grid cells increased slightly from 13 to 15, while low–low clusters remained at one grid cell. The continuous expansion of low–high spatial outliers indicates that, as the total number of URRs increased, the distribution extent of low-value grid cells around high-value grid cells continued to expand, suggesting that the addition of new facilities did not correspondingly reduce local spatial differences. In other words, the growth in the number of URRs did not fully translate into a more balanced spatial distribution, and some grid cells adjacent to high-value clusters remained relatively low-value areas. This indicates that local imbalance persisted during the spatial expansion of URRs. While facility provision continues to increase, further efforts are needed to reduce disparities in facility supply across different areas and improve residents’ access to public cultural services.
3.3. Spatial Transition Characteristics
3.3.1. LISA Time Path Analysis
The relative length of the LISA time path reflects the dynamics of the local spatial patterns of URRs. In this study, the natural breaks method was used to classify the relative lengths of the LISA time paths of URRs across the three stages into four levels (Figure 5). As shown in Figure 5a, 724 grid cells had relative lengths of less than 1, accounting for 79.74% of all grid cells, indicating that most grid cells exhibited relatively stable local spatial patterns. Specifically, these grid cells were mainly distributed in the peripheral areas of the central urban area and in some central areas of Luolong District and Jianxi District, indicating relatively stable spatial structures and limited magnitudes of change. In contrast, 184 grid cells had relative lengths greater than 1, accounting for 20.26%, indicating that the local spatial association structures of some grid cells were relatively dynamic and exhibited greater magnitudes of change. Specifically, these grid cells were mainly distributed in the central part of the central urban area and showed a patchy distribution in the junction areas of Jianxi District, Xigong District, Laocheng District, Chanhe Hui District, and Luolong District.
Figure 5.
LISA time-path characteristics: (a) relative length; (b) tortuosity; (c) movement direction.
The tortuosity of the LISA time path reflects the volatility in the direction of local spatial dependence of URRs. Similarly, the natural breaks method was used to classify the tortuosity of the LISA time paths of URRs across the three stages into four levels. As shown in Figure 5b, all LISA time path tortuosity values were greater than or equal to 1, indicating that the directions of local spatial dependence of all grid cells exhibited pronounced spatial volatility. Grid cells with higher tortuosity were mainly distributed in patches in the junction areas of Jianxi District, Xigong District, and Laocheng District in the northwestern part of the central urban area, indicating more pronounced fluctuations in the direction of spatial dependence. Most grid cells in the southeastern and peripheral areas of the central urban area exhibited lower tortuosity, indicating relatively stable directions of spatial dependence.
The movement direction of the LISA time path reveals the degree of spatial integration in the evolution of the local spatial patterns of URRs. In this study, the movement directions of the LISA coordinates of URRs across the three stages were calculated to evaluate the coordinated growth relationship in the evolution of local spatial association patterns between each grid cell and its neighboring grid cells. As shown in Figure 5c, 723 grid cells exhibited positive coordinated growth (0–90°), while 16 grid cells exhibited negative coordinated growth (180–270°), together accounting for 81.39% of all grid cells, indicating that most grid cells exhibited a high degree of spatial integration. Areas characterized by positive coordinated growth were mainly distributed in the southeastern and peripheral parts of the central urban area. Areas characterized by negative coordinated growth were mainly distributed contiguously in the junction areas of Jianxi District, Xigong District, Laocheng District, Chanhe Hui District, and Luolong District in the northeastern part of the central urban area, with a few scattered areas in the eastern part of the central urban area.
3.3.2. LISA Space–Time Transition Analysis
The LISA time path cannot fully reveal the transition characteristics of local spatial association types of URRs in Luoyang. Therefore, this study employed the LISA space–time transition method to further characterize the evolutionary trends of local spatial association types of URRs. The spatial distribution of different transition types is presented (Figure 6), while the spatio-temporal transition matrix characterizes the transitions among different local spatial association states (Table 5), and the transition types, counts, and proportions reflect the overall transition structure (Table 6).
Figure 6.
Spatial distribution of LISA spatio-temporal transition types of URRs: (a) Stage 1–Stage 2 transition; (b) Stage 2–Stage 3 transition.
Table 5.
Spatio-temporal transition matrix of Moran scatter plot.
Table 6.
Statistics of LISA spatio-temporal transition types.
The LISA space–time transition results showed that Type 0 was the most prevalent transition type, accounting for 75.94%, indicating that the local spatial association patterns of URRs remained relatively stable in most grid cells. Type 1 and Type 2 accounted for 4.63% and 17.02%, respectively, indicating that 21.64% of the grid cells experienced either a transition of the focal grid cell or a transition of its neighborhood. Among them, Type 1 was mainly distributed in the boundary areas among Jianxi District, Xigong District, Laocheng District, Chanhe Hui District, and Luolong District, with scattered occurrences in the northern periphery of the central urban area. Type 3A and Type 3B together accounted for 2.42%, indicating that only a small proportion of grid cells experienced transitions in both themselves and their neighborhoods and were mainly scattered across the central part of the central urban area. The spatio-temporal mobility of local spatial association patterns was 21.64%, while spatio-temporal cohesion reached 77.26%, indicating that the local spatial association types of URRs in most grid cells of Luoyang’s central urban area remained relatively stable and exhibited a high degree of path dependence.
3.4. Driving Factors and Driving Mechanisms
3.4.1. Construction of the Indicator System for Influencing Factors
Based on a review of existing studies, this study constructed an analytical framework for examining the driving mechanisms through which road and transport factors, educational resources, socioeconomic conditions, public cultural resources, and everyday services influence the evolution of the spatio-temporal patterns of URRs (Table 7). The selected influencing factor indicators are as follows:
Table 7.
Indicator system for factors influencing the spatial distribution of URRs.
(1) Road and transport factors. Road and transport conditions constitute an important locational basis for the spatial configuration of public service facilities. The morphology of road networks and the distribution of transport nodes can affect the spatial agglomeration, accessibility costs, and service coverage of public service facilities [45]. Based on the actual conditions of the study area and previous research experience [46,47], this study selected the density of main arterial roads, density of secondary arterial roads, number of bus stops, number of charging stations, and distance to the nearest metro access point to represent road and transport factors.
(2) Educational resource factors. Educational level is an important factor driving demand for cultural facilities, as its overall improvement can increase demand for facilities and venues for knowledge acquisition and cultural experiences [9,10]. Drawing on previous studies [10,48], this study selected basic education and higher education to represent educational resource factors.
(3) Socioeconomic factors. Socioeconomic factors reflect population agglomeration, the level of economic development, and the intensity of urban human activities [10,13], and constitute important underlying conditions affecting the service demand and spatial distribution of URRs. Drawing on previous studies [14,15], this study selected population, GDP, and enterprises to represent socioeconomic factors.
(4) Public cultural factors. Public cultural resources are important carriers for the transmission of regional culture and key elements in spatial evolution, constituting the material basis for cultural activities and reflecting the supply of public cultural services [49,50,51]. Drawing on previous studies [52,53], this study selected cultural exhibition facilities, arts and performance venues, public leisure facilities, and landscape resources to represent public cultural factors.
(5) Everyday service factors. Everyday service facilities are important spatial carriers of residents’ daily consumption, social interaction, and community activities [54], and their degree of agglomeration reflects the spatial conditions under which URRs are embedded in everyday life circles. Drawing on previous research experience [48,55], this study selected shopping facilities, food and beverage facilities, and public service facilities to represent everyday service factors.
3.4.2. Factor Detection Analysis
Prior to the geographical detector analysis, pairwise Spearman correlation analysis was conducted among the 17 influencing factors (X1–X17). The results showed that only shopping facilities and food and beverage facilities exhibited a relatively high correlation (ρ = 0.8493, p < 0.001), whereas the absolute correlation coefficients of all other factor pairs were below 0.80. Considering that shopping facilities and food and beverage facilities represent two distinct types of everyday services and differ in their functional connotations, the two factors were neither combined nor excluded and were both retained in the subsequent geographical detector analysis.
The analysis was conducted using the GD package in R. Five discretization methods—equal interval, natural breaks, quantile, geometric interval, and standard deviation—were applied, with the number of discretization intervals ranging from 3 to 7, to discretize the 17 selected influencing factors. The discretization method and number of intervals yielding the maximum q value were selected as the optimal parameters for the geographical detector. The q values of each influencing factor varied under different discretization methods and numbers of intervals (Figure 7). Taking public service facilities as an example, the q value reached its maximum of 0.3203 when the geometric interval method with seven intervals was applied; therefore, this parameter combination was identified as the optimal discretization scheme for public service facilities, while the optimal parameters for the remaining factors were determined following the same criterion. On this basis, the factor detector was used to calculate the explanatory power and significance level of each influencing factor for the spatial differentiation of URRs.
Figure 7.
Optimal parameter discretization results of influencing factors based on OPGD.
The results showed that all factors were statistically significant (p < 0.001). The explanatory power of the influencing factors was ranked as follows: public service facilities > bus stops > shopping facilities > food and beverage facilities > population > basic education > distance to the nearest metro access point > public leisure facilities > enterprises > density of secondary arterial roads > cultural exhibition facilities > higher education > GDP > charging stations > arts and performance venues > density of main arterial roads > landscape resources. According to this ranking, public service facilities and bus stops (q > 0.3) were classified as core influencing factors, indicating that the spatial distribution of URRs is highly dependent on the provision of public service facilities and the convenience of public transport. Shopping facilities, food and beverage facilities, population, basic education, distance to the nearest metro access point, and public leisure facilities (q > 0.2) were important influencing factors; enterprises, density of secondary arterial roads, cultural exhibition facilities, higher education, GDP, and charging stations (q > 0.1) were general influencing factors; and arts and performance venues, density of main arterial roads, and landscape resources (q < 0.1) were relatively weak influencing factors. Overall, everyday services and road and transport factors were the dominant drivers of the spatial differentiation of URRs (Figure 8).
Figure 8.
Explanatory power of influencing factors on the spatial differentiation of URRs.
To further assess the robustness of the above factor ranking to alternative discretization settings, a sensitivity analysis was conducted. The results showed that the q values varied to some extent across alternative discretization settings. Under the common parameter settings for which valid q values were available for all 17 factors, the rankings showed high consistency with the OPGD optimal ranking, with Spearman rank correlations ranging from 0.9093 to 0.9632. Public service facilities, bus stops, shopping facilities, and food and beverage facilities remained within the top four under all common parameter settings, indicating that the identification of the principal influencing factors was generally robust, although the relative ordering of some intermediate-ranking factors was more sensitive to parameter settings.
3.4.3. Interaction Detection Analysis
To examine the interaction effects of different factors on the spatial differentiation of URRs in Luoyang’s central urban area, interaction detection analysis was conducted (Figure 9). Among the 136 factor pairs, 122 exhibited bivariate enhancement, 6 exhibited nonlinear enhancement, and 8 exhibited univariate weakening. Bivariate enhancement was the predominant interaction type, indicating that the factors influencing the spatial distribution of URRs do not operate independently but instead exert joint and interactive effects. Notably, public service facilities exhibited stronger interactions with other factors. In particular, the interactions of public service facilities ∩ density of secondary arterial roads, public service facilities ∩ population, public service facilities ∩ bus stops, and public service facilities ∩ density of main arterial roads all showed relatively high explanatory power, suggesting that the synergistic effects among public service facility concentration, transport conditions, and population demand constitute an important mechanism influencing the spatial distribution of URRs. This indicates that the interactions between everyday services and road and transport factors, as well as between everyday services and socioeconomic factors, are relatively strong. Everyday service facilities can meet residents’ daily life needs and improve service provision within everyday life circles, while road and transport conditions can enhance regional accessibility, reduce travel costs, and expand the coverage of public cultural services. Their joint effects can improve the convenience and coverage of URR services. Socioeconomic conditions can provide an economic foundation and resource support for the construction and operation of URRs, while a well-developed everyday service environment can meet residents’ daily service needs. Their joint effects can provide support for the stable operation and continued development of URRs. In addition, shopping facilities also exhibited strong interactions with other factors, such as shopping facilities ∩ bus stops, shopping facilities ∩ higher education, shopping facilities ∩ density of main arterial roads, and shopping facilities ∩ GDP. These results further indicate the combined influence of everyday service environments and road and transport conditions on the spatial distribution of URRs in Luoyang’s central urban area. Specifically, everyday service facilities can improve service provision within residents’ everyday life circles, while road and transport conditions can enhance the accessibility of these areas. Their joint effects can facilitate the integration of URRs into residents’ everyday life circles and strengthen the connection between public cultural services and residents’ daily activities.
Figure 9.
Interaction detection results of factors influencing the spatial differentiation of URRs.
3.4.4. Driving Mechanism Analysis
Based on the results of factor detection and interaction detection, this study synthesized and refined the factors influencing the evolution of the spatio-temporal patterns of URRs and constructed an explanatory framework of their driving mechanisms (Figure 10). In cities in Central China, as represented by Luoyang, everyday services and road and transport factors were the dominant drivers shaping the evolution of the spatio-temporal patterns of URRs, exhibiting characteristics that differ markedly from those of public cultural facilities. In brief, new public cultural facilities represented by URRs rely more heavily on everyday services and road and transport conditions on the “demand side,” rather than primarily on macro-level supply conditions such as infrastructure, social development, and cultural and educational resources on the “supply side.” URRs exhibit a five-in-one form of life-circle embeddedness encompassing “space–users–operation–function–services”: spatial access depends on public transport networks, user demand is fostered through education, operation depends on resource support, functions depend on cultural provision, and services depend on supporting everyday amenities. On this basis, this study constructed a coupled multi-factor driving mechanism characterized by “connectivity–attraction–support–synergy–dominance”. Within this mechanism, road and transport factors enhance connectivity by reducing the spatial costs for residents to access public cultural facilities; educational resource factors foster cultural demand and thereby exert an attracting influence; socioeconomic factors provide support by ensuring the operation and development of URRs; public cultural factors generate synergy through functional linkages with URRs; and everyday service factors exert a dominant effect by creating everyday service environments. The coordinated effects of these five forces promote a shift in the configuration of new public cultural facilities from relatively singular spatial provision toward an approach that places greater emphasis on residents’ everyday needs and life-circle embeddedness, thereby further supporting more accessible, efficient, and sustainable provision of public cultural services.
Figure 10.
Driving mechanisms of the spatio-temporal pattern evolution of URRs.
(1) Connectivity—Road and Transport Factors
Road and transport systems serve as a key medium linking the provision of public cultural services with residents’ daily activity spaces and constitute an important spatial linkage through which URRs are embedded in urban life networks. Improvements in road and transport conditions can reduce residents’ travel costs in accessing URRs while enhancing the proximity of public cultural service facilities to residents’ daily activity spaces and expanding their service coverage. The factor detection results showed that bus stops (q = 0.308), metro access points (q = 0.222), density of secondary arterial roads (q = 0.167), charging stations (q = 0.135), and density of main arterial roads (q = 0.079) all exhibited a certain degree of explanatory power for the spatial distribution of URRs. Smart transportation technologies enable residents to accurately locate URRs through navigation platforms, plan travel routes using real-time public transport information, and complete last-mile connections through multiple transport modes. Bus stops and metro access points therefore constitute key nodes in the spatial distribution of URRs. URRs located near these public transport nodes are more easily identified, accessed, and used by residents. The density of secondary arterial roads, density of main arterial roads, and charging stations primarily play supplementary supporting roles in terms of road connectivity and transport infrastructure. Overall, although road and transport factors are not decisive, they constitute important locational conditions linking residents’ daily activities with public cultural services.
(2) Attraction—Educational Resource Factors
Educational resources cultivate professional talent for public cultural services, while improvements in residents’ cultural literacy can also increase their demand for public cultural services, thereby constituting an attracting force shaping the spatial distribution of URRs. ① Areas with concentrations of basic education resources (q = 0.230), such as primary and secondary schools, often have relatively stable student populations, needs for family-accompanied reading, and after-school learning activities, providing URRs with a sustained pool of potential users. ② According to demand-pull theory and human capital theory, people with higher levels of education generally have stronger needs for knowledge acquisition. Higher education (q = 0.158), through universities and their surrounding areas, concentrates young students and teachers and generates relatively strong demand for knowledge acquisition and cultural activities. The digitalization of public services and the growing prevalence of lifelong learning have extended the role of educational resources in fostering cultural demand beyond school education to encompass digital learning, community reading, and open forms of knowledge acquisition. As low-barrier public cultural facilities, URRs can therefore supplement learning-support functions beyond formal school education.
(3) Support—Socioeconomic Factors
Socioeconomic factors provide essential support for the construction and sustained operation of URRs. ① Population (q = 0.277) showed relatively strong explanatory power, indicating that areas with higher population concentrations tend to have more stable user groups, more frequent demand for public cultural services, and a stronger basis for facility utilization. ② Areas with concentrations of enterprises (q = 0.195) are often characterized by higher employment density and substantial daily commuting flows, providing URRs with potential user groups and demand for reading during fragmented periods of time. ③ Areas with higher levels of economic development (q = 0.155) generally have a greater capacity for the provision of supporting public service facilities and a stronger willingness to invest in public cultural services, thereby providing economic support for the spatial distribution of URRs. According to central place theory, public service facilities tend to be located in urban centers where service demand is concentrated and service coverage is relatively extensive. This indicates that the spatial distribution of URRs does not depend solely on any single socioeconomic factor; rather, URRs tend to be embedded in multifunctional urban spaces characterized by high population density, concentrated employment, and active economic activity.
(4) Synergy—Public Cultural Factors
Public cultural resources constitute a synergistic force that promotes the functional integration of URRs and, together with URRs, form a cultural service network. ① Public leisure spaces (q = 0.206), such as parks and squares, are characterized by high openness, relatively long durations of stay, and frequent use. Locating URRs in their vicinity can better integrate them into open public cultural activity spaces and enhance public participation. ② Cultural exhibition facilities (q = 0.167) showed a certain degree of explanatory power for the spatial distribution of URRs. Through digital reading platforms, smart borrowing systems, online event reservation services, and public cultural information platforms, URRs can establish service linkages with existing public cultural facilities such as libraries, museums, and cultural centers, thereby enhancing the circulation of different public cultural resources. ③ Arts and performance venues (q = 0.088) and landscape resources (q = 0.064) provide URRs with contexts for performances, cultural consumption, and local cultural experiences. Although both factors showed relatively weak explanatory power, arts and performance venues can support activities such as reading salons and art exhibitions in URRs, while landscape resources draw on the historical memory and regional cultural identity carried by historical sites such as the Longmen Grottoes and the Sui–Tang Luoyang City archaeological site, as well as the cultural landscape corridor along the Luo River, thereby imbuing URRs with the historical depth of Heluo culture.
(5) Dominance—Everyday Service Factors
Digital public services facilitate the linkage between online information and offline spaces, making everyday services not only important spatial carriers of residents’ daily consumption and community interaction but also a dominant force enabling URRs to become embedded in residents’ 15-min everyday life circles. ① Public service facilities (q = 0.320) showed the highest explanatory power among all factors, indicating that facilities such as community health centers, post offices, and Party–Masses Service Centers are most closely associated with the spatial distribution of URRs. These facilities directly respond to residents’ everyday needs and are characterized by high service frequency, broad coverage, and close proximity to residents, thereby reflecting the extent to which URRs are embedded in community living spaces. ② Shopping facilities (q = 0.297), including commercial facilities such as shopping centers and department stores, are typically located in areas with frequent pedestrian activity and well-developed commercial services, thereby providing URRs with access to stable consumer flows. ③ Food and beverage facilities (q = 0.290) provide residents with convenient nearby dining options after participating in cultural activities at URRs, allowing these spaces to become more naturally integrated into residents’ everyday dining routines and strengthening the connection between cultural life and everyday life circles.
(6) Coupling—Multi-Factor Synergistic Mechanism
The five forces described above do not operate independently; rather, they form a functionally coordinated system through complex interactions. Specifically, road and transport factors enhance spatial accessibility to areas where educational resources are concentrated, while educational resources foster stable learning demand among the population served by transport networks. Their interaction facilitates the conversion of potential demand into actual use. Educational resources stimulate cultural demand within the socioeconomic system, while socioeconomic conditions provide operational support for educational resources; together, they strengthen the operational foundation of URRs. Socioeconomic conditions provide a material basis for the development of public cultural resources, while public cultural resources contribute to enhancing regional cultural soft power; together, they improve the cultural quality of URRs. Public cultural resources enrich everyday services with cultural content, while everyday service factors enhance service convenience around public cultural resources; together, they facilitate the integration of URRs into residents’ everyday life settings. Everyday service factors increase daily activity intensity and everyday consumption demand around road and transport nodes, while road and transport factors expand the service coverage of everyday service settings; together, they strengthen the public service network of URRs. These interlinked and mutually reinforcing relationships collectively form a coupled multi-factor driving mechanism characterized by “connectivity–attraction–support–synergy–dominance.”
4. Discussion
(1) This study extends the research area to cities in Central China, with Luoyang as a representative case, thereby providing an important supplement to the geographical scope of existing research. The development of URRs in Luoyang is representative to a certain extent, and the findings may provide a reference for cities with rich cultural resources that continue to develop new public cultural facilities. The findings are consistent with previous studies showing that public cultural facilities mainly exhibit a pattern of expansion from agglomeration centers toward peripheral urban areas [6,7,8], as well as with findings that URRs in cities such as Wuhan and Yangzhou exhibit uneven spatial distributions [30,32]. Previous studies have shown that traditional public cultural facilities in cities in Central China are mainly influenced by infrastructure, social development, and cultural and educational factors [9,11,12]. In contrast, this study finds that, in cities in Central China, as represented by Luoyang, everyday services and road and transport factors play more central and dominant roles. Existing studies of new public cultural facilities in cities in Central China have also shown that factors such as population, economic conditions, transport, policy, market forces, and the living environment influence their spatial distribution [30,31]. Related studies have further demonstrated the important role of these factors in the siting of URRs [30,32]. Compared with traditional public cultural facilities, new public cultural facilities represented by URRs exhibit a distinct configuration logic associated with changes in service provision modes. The configuration of traditional public cultural facilities relies more heavily on social infrastructure, social development, and cultural and educational conditions on the “supply side,” whereas new public cultural facilities depend more strongly on everyday services and road and transport conditions that are closely related to residents’ everyday activities on the “demand side.” These differences further indicate that new public cultural facilities place greater emphasis on matching their spatial configuration with residents’ everyday needs, providing a new theoretical explanation for understanding differences in the configuration mechanisms of public cultural facilities under different modes of service provision and offering implications for optimizing the allocation of public cultural resources, promoting the equalization of public cultural services, and supporting the sustainable provision of public cultural services.
(2) This study confirmed the important roles of population, transport, and other factors in the spatial distribution of public cultural facilities and incorporated everyday service factors, including shopping facilities, food and beverage facilities, and public service facilities, into the analytical framework, thereby addressing the limitation of previous studies that primarily focused on socioeconomic conditions, transport location, and educational, scientific, and cultural factors while paying insufficient attention to everyday services. On this basis, this study proposed a coupled multi-factor driving mechanism model comprising five dimensions—road and transport, educational resources, socioeconomic conditions, public cultural resources, and everyday services—and characterized by “connectivity–attraction–support–synergy–dominance.” This model deepens the understanding of the spatial configuration and formation mechanisms of new public cultural facilities and provides a reference for the rational layout of facilities and the improvement in public cultural service effectiveness.
(3) Based on the comprehensive analysis of the above evolutionary patterns, influencing factors, and driving mechanisms, the following recommendations are proposed for the optimization and development of URRs:
① Optimize the spatial layout and promote spatial equity. The existing configuration in the central parts of the study area should be adjusted to improve the efficiency of resource allocation. At the same time, service gaps in peripheral areas should be addressed, and appropriate compensatory allocation should be implemented in areas with relatively low levels of service provision to further improve the spatial coverage of URRs. On this basis, disparities in service provision among different areas should be reduced, overall service coverage and equity in service provision should be improved, and the equalization of public cultural services should be promoted.
② Optimize the transport network and strengthen transport connectivity. The siting of URRs should take transport accessibility as a basic siting criterion, with priority given to core locations that are well served by public transport and experience high pedestrian flows, such as areas near bus stops and metro access points. At the same time, transport hubs can be developed as new cultural settings for URRs by activating residual spaces and introducing cultural functions, thereby integrating public cultural services with residents’ daily travel.
③ Strengthen educational resources and enhance their attraction effect. The coordinated spatial arrangement of URRs and educational resources should be promoted, while service content should be expanded to include after-school study, cultural experiences, parent–child co-learning, and study-tour activities. These measures would facilitate effective linkages between public cultural services, school education, and social education, enabling URRs to become important platforms for strengthening the urban education network and building a learning society.
④ Strengthen Economic Support and Consolidate the Socioeconomic Foundation. Areas with high population density, concentrated employment, and relatively high levels of economic development should be prioritized in the optimization of URRs layouts, with stronger spatial matching between URRs, population concentrations, and consumer markets. Meanwhile, fiscal investment, social collaboration, and optimized operational mechanisms should be used to translate socioeconomic vitality into tangible support for the sustained operation and service improvement in URRs.
⑤ Promote cultural linkages and strengthen the synergistic role of public cultural resources. URRs should establish service linkages with public cultural resources such as libraries, museums, and intangible cultural heritage exhibition venues, thereby promoting the joint development and sharing of cultural resources. At the same time, drawing on Luoyang’s rich historical and cultural heritage and profound Heluo cultural traditions, intangible cultural heritage craft demonstrations, transmission and learning activities, and related programs should be integrated into the daily operation and spatial design of URRs to enhance their cultural distinctiveness and endogenous appeal.
⑥ Embed URRs in everyday life and strengthen the dominant role of everyday services. The coordinated spatial layout of URRs with everyday service facilities such as shopping, food and beverage, and public service facilities should be promoted, facilitating their integration into residents’ “15-min everyday life circles.” Stable activity demand generated by everyday service facilities, together with stronger integration and resource sharing with surrounding public services, can help improve facility utilization efficiency, expand the coverage of public cultural services, and better meet residents’ everyday cultural needs.
⑦ At the implementation level, the optimization and development of URRs need to be aligned with Luoyang’s existing public cultural service and urban renewal mechanisms. Local governments should coordinate public cultural services, while cultural authorities should assume their corresponding responsibilities and strengthen coordination with finance, natural resources and planning, housing and urban–rural development, and transport authorities. In terms of funding, relevant expenditures should be incorporated into government budgets in accordance with the division of responsibilities for public cultural services and corresponding expenditure responsibilities. Government procurement of services and social participation should also be combined to provide support for the construction, operation, and service improvement in URRs. During implementation, the use of existing spaces, planning approval, and the coordination of responsibilities among different departments also need to be addressed. Luoyang can promote the optimization of URR layouts in conjunction with urban renewal and the development of complete communities and 15-min convenient living circles, improve existing facilities and service effectiveness, and promote the optimized allocation of public cultural resources as well as the equalization and sustainable development of public cultural services.
(4) This study has certain limitations that also point to valuable directions for future research. First, future research could further extend the analysis from the spatial distribution patterns and influencing factors of URRs to their actual utilization by integrating multi-source data, including borrowing records, visitation data, seat occupancy information, questionnaire surveys, and in-depth interviews, and further examine user satisfaction, travel distance, and the relationship between the spatial distribution of URRs and their actual use. In addition, although the 1-km LandScan population data are consistent with the analytical grid scale of this study and are suitable for characterizing the overall population distribution, they may smooth fine-scale population heterogeneity within the central urban area. Future research could incorporate finer-resolution population data to further improve the accuracy of population-related spatial analysis. Different grid scales could also be examined to further assess the robustness of spatial autocorrelation patterns and influencing-factor identification. In addition, some explanatory variables exhibit relatively high correlations, and both their correlations and functional differences should be taken into consideration. Second, future studies could select cities in different countries and regions for comparative analysis to examine the similarities and differences in the spatio-temporal evolution characteristics and driving mechanisms of new public cultural facilities under different urban development contexts, and further assess the generalizability of the relevant findings and the scope of applicability of these driving mechanisms across different urban contexts. Third, future research could conduct stage-specific OPGD analyses to compare the relative importance and interaction effects of influencing factors across different evolutionary stages, thereby further examining changes in the driving mechanisms of URRs across stages.
5. Conclusions
This study employed KDE, SDE, ESTDA, and OPGD to systematically reveal the evolutionary characteristics of the spatio-temporal patterns of URRs in Luoyang’s central urban area and to further investigate their multi-factor coupled driving mechanism. The main conclusions are as follows:
(1) In terms of spatial distribution characteristics, URRs in Luoyang exhibit a pronounced uneven spatial distribution, which is broadly consistent with findings from related studies of URRs in Wuhan and Yangzhou [30,32]. In terms of spatio-temporal evolution characteristics, the agglomeration pattern of URRs evolved from multicore agglomeration toward a single-core-dominated structure with multiple dispersed nodes. The spatial distribution extent first contracted and then expanded, the overall direction of the spatial distribution exhibited a northeast–southwest orientation, and the center of gravity shifted along a trajectory from the northeast to the southwest and then to the southeast. Specifically, the KDE results showed that the agglomeration pattern of URRs evolved from “two primary cores, four secondary cores, and multiple nodes” to “one primary core, one secondary core, and multiple nodes,” and then to “one primary core and multiple nodes.” The SDE analysis showed that the standard distances along both the X- and Y-axes first decreased and then increased, indicating that the spatial distribution extent of URRs first contracted and then expanded; the direction of the spatial distribution exhibited a phased change from northeast–southwest to northwest–southeast and then back to northeast–southwest, while the overall SDE exhibited a northeast–southwest orientation; the center of gravity shifted from the northeast in the first stage to the southwest in the second stage, and then southeastward in the third stage.
(2) The spatial distribution of URRs exhibited significant positive spatial autocorrelation, while local spatial association types showed differentiated spatio-temporal migration paths. Specifically, all global Moran’s I values were positive, with p < 0.05, indicating significant positive spatial autocorrelation in the spatio-temporal distribution of URRs, with the degree of positive spatial autocorrelation gradually weakening. The local Moran’s I results further showed that the numbers of high–high cluster grid cells were 11, 8, and 2 across the three stages, respectively, indicating a continuous contraction; low–high spatial outlier grid cells were the most numerous, numbering 60, 71, and 133, respectively, and showed continuous expansion; the number of high–low spatial outlier grid cells remained at 13 in the first two stages and increased to 15 in the third stage, indicating slight expansion; and low–low clusters consistently comprised only one grid cell. The continuous expansion of low–high spatial outliers indicates that an increase in the number of facilities does not necessarily lead to a corresponding reduction in regional disparities. From the perspective of public cultural service equalization, equalization is reflected not only in the growth of facility provision but also in the balanced allocation of resources, service accessibility, and the protection of residents’ basic cultural rights.
(3) URRs exhibited significant spatio-temporal transition characteristics. The LISA time path analysis showed that 79.74% of the grid cells had relative lengths of less than 1, indicating stable local spatial patterns; the tortuosity values of all grid cells were greater than or equal to 1, indicating pronounced spatial volatility in the directions of local spatial dependence; and 81.39% of the grid cells exhibited coordinated growth, reflecting a high degree of spatial integration. The LISA space–time transition analysis further revealed that 77.26% of the spatio-temporal transition cases exhibited high spatio-temporal cohesion, indicating that the local spatial association structures of URRs in most grid cells of Luoyang’s central urban area were characterized by strong stability and path dependence.
(4) Everyday services and road and transport factors were the dominant drivers, with enhancement effects predominating in multi-factor interactions. The factor detection results showed that public service facilities (q = 0.320), bus stops (q = 0.308), shopping facilities (q = 0.297), and food and beverage facilities (q = 0.290), population (q = 0.277) ranked among the factors with the highest explanatory power, indicating that everyday services and road and transport factors constituted the core drivers of the spatial differentiation of URRs. Interaction detection further revealed that most pairs of influencing factors exhibited either bivariate enhancement or nonlinear enhancement, indicating that the spatial differentiation of URRs was not driven by a single factor but rather resulted from the synergistic coupling of multiple factors.
(5) The spatio-temporal pattern evolution of URRs was driven by the coupled effects of five forces: connectivity–attraction–support–synergy–dominance. Specifically, road and transport factors enhanced connectivity; educational resources exerted an attracting influence; socioeconomic factors provided support; public cultural factors generated synergistic effects; and everyday service factors played a dominant role. The interactions and coupling among these five categories of factors jointly shaped the spatio-temporal evolution patterns of URRs in Luoyang’s central urban area. However, the present study does not further compare changes in the relative importance and interaction effects of these influencing factors across different evolutionary stages, which warrants further investigation through stage-specific OPGD analyses.
Author Contributions
Conceptualization, Q.L. and F.L.; methodology, Q.L. and F.L.; software, Q.L.; validation, Q.L., F.L. and S.Y.; formal analysis, Q.L.; investigation, Q.L.; resources, F.L.; data curation, Q.L.; writing—original draft preparation, Q.L. and F.L.; writing—review and editing, Q.L., F.L. and S.Y.; visualization, Q.L.; supervision, F.L.; project administration, F.L.; funding acquisition, F.L. All authors have read and agreed to the published version of the manuscript.
Funding
This study was supported by the National Natural Science Foundation of China (No. 42101219), and Jiangsu Province Rural Revitalization Soft Science Foundation (No. 26ASS049).
Institutional Review Board Statement
The study was conducted in accordance with the Declaration of Helsinki and approved by the Institutional Review Board (or Ethics Committee) of the School of Art, Nanjing University of Information Science and Technology (protocol code: NJISTSA20261001, date of approval: 6 April 2026).
Informed Consent Statement
Informed consent was obtained from all subjects involved in the study.
Data Availability Statement
The original contributions presented in this study are included in the article. Further inquiries can be directed to the corresponding author.
Conflicts of Interest
The authors declare no conflicts of interest.
Correction Statement
This article has been republished with a minor correction to the Institutional Review Board Statement and Informed Consent Statement. This change does not affect the scientific content of the article.
References
- Wang, Y.; Xu, B.; Wang, Z. Exploration of Construction Paths of New Public Cultural Spaces Based on 5W Model—Taking the Practice of Beijing-Tianjin-Hebei Region as an Example. Libr. Work Study 2026, 1, 94–103. [Google Scholar] [CrossRef]
- Zhang, S.; Xu, S.; Wan, D.; Liu, H.; Zhao, L.; Guo, L.; Ren, J. Equalization Measurement and Optimization of the Public Cultural Facilities Distribution in Tianjin Central Area. Sustainability 2023, 15, 4856. [Google Scholar] [CrossRef] [Scilit]
- Zhuang, L.; Tian, N.; Zhao, B. Spatio-Temporal Characteristics and Impact Factors of Museums in Shanghai. Trop. Geogr. 2020, 40, 539–550. [Google Scholar] [CrossRef]
- Yang, Y.; Tang, J.; Li, Z.; Gao, X.; Li, W. Study on the Spatial-temporal Distribution Patterns of Cultural Facilities in Changsha City Based on POI Data. Resour. Dev. Mark. 2021, 37, 1046–1052. [Google Scholar] [CrossRef]
- He, D.; Jin, F.J.; Dai, T.Q.; Sun, Y.; Zhou, Z. Spatial patterns and characteristics for service level of urban public cultural facilities in central Beijing. Prog. Geogr. 2017, 36, 1128–1139. [Google Scholar] [CrossRef] [Scilit]
- Shao, X.; Chu, D.; Luo, W.; Liao, M.; Tang, S. Spatial distribution and driving mechanism of public cultural venues based on parameter-optimized geographical detector: A case study of the central urban area of Fuzhou. Geogr. Geo-Inf. Sci. 2025, 41, 19–30, 57. [Google Scholar] [CrossRef]
- Li, Y.; Xue, D.; Zhang, P.; Song, Y. Spatial structure and accessibility mode of entertainment industries in Xi’an City. Prog. Geogr. 2022, 41, 797–811. [Google Scholar] [CrossRef] [Scilit]
- Meng, K.; Yan, J.; Wang, S. Spatial pattern evolution and interpretation of leisure facilities in central Chongqing. World Reg. Stud. 2022, 31, 1057–1069. [Google Scholar] [CrossRef]
- Zhao, K.; Cao, X.; Wu, F.; Chen, C. Spatial Pattern and Drivers of China’s Public Cultural Facilities between 2012 and 2020 Based on POI and Statistical Data. ISPRS Int. J. Geo-Inf. 2023, 12, 273. [Google Scholar] [CrossRef] [Scilit]
- Ma, W.; Zhang, W.; Chen, Q.; Jiang, H.; Zhao, K.; Song, C.; Yin, Y. Understanding the regional dynamics and determinants of urban cultural facilities in the Yangtze River Economic Belt, China. Humanit. Soc. Sci. Commun. 2025, 12, 547. [Google Scholar] [CrossRef] [Scilit]
- Li, X.; Xiao, P.; Wu, Q.; Zhou, Y.; Li, Q. Research on Influence Factors and Temporal-Spatial Evolution of Public Library in China. Hum. Geogr. 2019, 34, 140–150. [Google Scholar] [CrossRef]
- Liu, J.; Tang, H.; Su, C.; Li, X. Spatial Distribution Characteristics and Influencing Factors of Public Cultural Facilities in the Urban Agglomeration of the Middle Reaches of the Yangtze River. Econ. Geogr. 2025, 45, 85–92. [Google Scholar] [CrossRef]
- Li, X.; Hou, J. Spatial Differentiation Characteristics and Influencing Factors of Public Cultural Facilities in Xinjiang. Sustainability 2025, 17, 4994. [Google Scholar] [CrossRef] [Scilit]
- Zhao, H.; Yu, D.; Miao, C.; Li, G.; Feng, Y.; Bie, Q. The Location Distribution Characteristics and Influencing Factors of Cultural Facilities in Zhengzhou Based on POI Data. Sci. Geogr. Sin. 2018, 38, 1525–1534. [Google Scholar] [CrossRef]
- He, D.; Chen, Z.; Ai, S.; Zhou, J.; Lu, L.; Yang, T. The spatial distribution and influencing factors of urban cultural and entertainment facilities in Beijing. Sustainability 2021, 13, 12252. [Google Scholar] [CrossRef] [Scilit]
- Liu, H.; Liu, M.; Hu, X.; Guo, X. Temporal and Spatial Evolution of Chinese Museums and Their Causes Analysis. Trop. Geogr. 2022, 42, 469–480. [Google Scholar] [CrossRef]
- Liu, S.; Yang, Z.; Liu, Y.; Liu, B. The Spatial Distribution of Museums and the Associated Factors in the Yangtze River Delta Region. J. South China Norm. Univ. (Nat. Sci. Ed.) 2022, 54, 91–99. [Google Scholar] [CrossRef]
- Zhu, Y.; Gan, Y.; Li, X.; Yu, R. Study on the Regional Differentiation and Influencing Factors of Cultural Consumption Level in Chinese Provinces. Econ. Geogr. 2020, 40, 110–118. [Google Scholar] [CrossRef]
- Zhu, B.; Ma, R. Externality of cultural facilities in the central urban area of Ningbo City from the perspective of spatial distribution of cultural industry. Prog. Geogr. 2023, 42, 478–490. [Google Scholar] [CrossRef] [Scilit]
- Zhu, Y.; Yang, Q.; Zeng, J.; Jin, X.; Li, X. Constructive Optimization from the Urban Human Cultural Settlements of the City Cluster in the Middle Reaches of the Yangtze River. Econ. Geogr. 2017, 37, 56–62. [Google Scholar] [CrossRef]
- Xu, R.; Liu, Q.; Liao, Y.; Zhang, W.; Zhan, D. Coverage-suitability assessment and optimization of public service facilities within the 15-minute living circle: A case study of Nanjing’s main urban area. Prog. Geogr. 2026, 45, 209–224. [Google Scholar] [CrossRef] [Scilit]
- Gu, X.; Gu, B.; Luo, X.; Chen, H.; Zhao, H.; Fan, G.; Wang, M. Achieving a balance between supply and demand for urban cultural infrastructure: A case study of Nanjing, China. Appl. Geogr. 2025, 181, 103693. [Google Scholar] [CrossRef] [Scilit]
- Jia, Q.; Zhang, T.; Cheng, L.; Cheng, G.; Jin, M. The Impact of the Neighborhood Built Environment on the Walking Activity of Older Adults: A Multi-Scale Spatial Heterogeneity Analysis. Sustainability 2022, 14, 13927. [Google Scholar] [CrossRef] [Scilit]
- Chang, F.; Wang, L.; Ma, Y.; Yan, C.; Liu, H. Do urban public service facilities match population demand? Assessment based on community life circle. Prog. Geogr. 2021, 40, 607–619. [Google Scholar] [CrossRef] [Scilit]
- Wang, M.; Song, Z.; Huang, Z. Museum accessibility and equity in central Changsha: Multimodal evidence from the 15-minute community life circle. J. Asian Archit. Build. Eng. 2026, 25, 1–15. [Google Scholar] [CrossRef] [Scilit]
- Li, S.; Zhang, H.; Chen, Y. The Development Status and Prospects of New Public Cultural Spaces in China. Doc. Inf. Knowl. 2024, 41, 6–13. [Google Scholar] [CrossRef]
- He, Y. New Public Cultural Space: Concept, Formation Process and Structure. Libr. Theory Pract. 2023, 4, 41–46. [Google Scholar] [CrossRef]
- Outline of the 15th Five-Year Plan for National Economic and Social Development of the People’s Republic of China (2026–2030). 2026. Available online: https://www.gov.cn/yaowen/liebiao/202603/content_7062633.htm (accessed on 30 August 2026).
- Yang, Y.; Mao, Y.; Chen, W. Research on Innovative Model of New Public Cultural Space Enabling Urban–Rural Integrated Development Driven by Digital Intelligence Technology: Based on Field Investigation in Zhejiang Province. Archit. Cult. 2025, 2, 216–218. [Google Scholar] [CrossRef]
- Hua, X.; Li, Y. GIS Assisted Site Selection of City Study: Taking Wuhan as an Example. Libr. Res. 2022, 52, 11–19. [Google Scholar]
- Zhu, Y.; Luo, Y.; Wang, Y.; Chen, S. Evolution and mechanism of rural public cultural space under the urban-rural factors interaction: A case study of Chaizhuang Village, Wuyang County, Henan Province. Sci. Geogr. Sin. 2023, 43, 847–859. [Google Scholar] [CrossRef]
- Wang, Y. Research on the Spatial Layout Characteristics of City’s Study in Yangzhou. Archit. Cult. 2020, 5, 141–143. [Google Scholar]
- Zhan, H.; Li, Y. Exploration and Reflections on the Smart Development of New Public Reading Spaces: A Case Study of the Smart Reading Space of Ningxia Library. Libr. J. Henan 2025, 45, 103–105, 109. [Google Scholar]
- Zhang, Y.; Li, X.; Xu, Z. The Construction of a New Public Cultural Space in Urban Communities in Hebei Province Based on Intergenerational Integration of the Elderly and the Young: A Case of the 5–10 Minute Community Life Circle of Handan Xuebu Bridge. Urban. Archit. 2025, 22, 26–28, 89. [Google Scholar]
- Sun, X. Research on the Optimization of Urban Schoolroom’s Site Selection Considering the Proportionality and Accessibility. J. Libr. Inf. Sci. 2021, 6, 16–22. [Google Scholar]
- Li, G.; Li, S. The Development Status and Prospects of New Public Cultural Spaces in China. J. Libr. Sci. China 2023, 49, 4–14. [Google Scholar] [CrossRef]
- Chen, Y.; Xu, C.; Ge, Y.; Zhang, X.; Zhou, Y. A 100 m gridded population dataset of China’s seventh census using ensemble learning and big geospatial data. Earth Syst. Sci. Data 2024, 16, 3705–3718. [Google Scholar] [CrossRef] [Scilit]
- Wang, Z.; Zhu, J.; Wu, Z. Study on the spatial distribution characteristics of traditional villages and their response to the water network system in the lower Yangtze River basin. Sci. Rep. 2024, 14, 22586. [Google Scholar] [CrossRef] [Scilit] [PubMed]
- Xu, L.; Liao, Y.; Liu, J. Study on the evolution of the spatial patterns and driving factors of national agricultural cultural heritage in China. PLoS ONE 2025, 20, e0313926. [Google Scholar] [CrossRef] [Scilit] [PubMed]
- Wu, Z.; Xie, J. The impact and dynamic spatial effect of the digital economy on the synergistic growth of cultural and tourism efficiency in China. Geogr. Res. 2025, 44, 3107–3127. [Google Scholar] [CrossRef]
- Yang, D.; Jian, Q.; Yu, C.; Xu, P.; Gao, L. From Concentration to Polycentric Embedding: Modeling the Spatial Restructuring of Low-Threshold Urban Food Economies Using Multi-Temporal POI Data in Xi’an. Buildings 2026, 16, 1778. [Google Scholar] [CrossRef] [Scilit]
- Wu, X.; Yang, S.; Yin, S.; Xu, H. Spatial-temporal Dynamic Characteristics and Its Driving Mechanism of Urban Built-Up Area in Yangtze River Delta Based on GTWR Model. Resour. Environ. Yangtze Basin 2021, 30, 2594–2606. [Google Scholar]
- Wang, J.; Xu, C. Geodetector: Principle and prospective. Acta Geogr. Sin. 2017, 72, 116–134. [Google Scholar] [CrossRef]
- Song, Y.; Wang, J.; Ge, Y.; Xu, C. An optimal parameters-based geographical detector model enhances geographic characteristics of explanatory variables for spatial heterogeneity analysis: Cases with different types of spatial data. GIScience Remote Sens. 2020, 57, 593–610. [Google Scholar] [CrossRef] [Scilit]
- Yang, Y.; Qian, Y.; Zeng, J.; Wei, X.; Yang, M. Walkability Measurement of 15-Minute Community Life Circle in Shanghai. Land 2023, 12, 153. [Google Scholar] [CrossRef] [Scilit]
- Liu, R.; Li, J.; Chang, F.; Ma, J. Spatial Distribution Pattern and Influencing Factors of Physical Bookstores of Large Cities: A Case Study of Three National Central Cities in Western China. Chin. Geogr. Sci. 2023, 33, 1082–1094. [Google Scholar] [CrossRef] [Scilit]
- Wang, J.; Wang, C. Spatial Association of Public Electric Vehicle Charging Stations and Urban Public Facilities: A Comparative Study of Historic and New Development Districts in Suzhou. ISPRS Int. J. Geo-Inf. 2026, 15, 287. [Google Scholar] [CrossRef] [Scilit]
- Ma, W.; Wang, N.; Li, Y.; Sun, D. 15-min pedestrian distance life circle and sustainable community governance in Chinese metropolitan cities: A diagnosis. Humanit. Soc. Sci. Commun. 2023, 10, 364. [Google Scholar] [CrossRef] [Scilit]
- Wu, Z.; Lin, S.; Gao, R.; Chen, S.; Lin, Z. Fine-grained evaluation of neighborhood quality in China using street view images and big data technologies. Sci. Rep. 2026, 16, 25049. [Google Scholar] [CrossRef] [Scilit] [PubMed]
- Xiao, M.; Zhang, R. Multi-scale spatial patterns and driving mechanisms of historical and cultural resources in the Beijing-Tianjin-Hebei region. npj Herit. Sci. 2026, 14, 204. [Google Scholar] [CrossRef] [Scilit]
- Li, Y.; Liao, Q.; Wang, W.; Shen, S.; Cao, Y.; Chen, J. Assessing recreation services for heritage resources in scenic areas based on behavioral semantic perspective. npj Herit. Sci. 2025, 13, 391. [Google Scholar] [CrossRef] [Scilit]
- Li, S.; Sun, H.; Liu, S.; Qin, W. Spatio-Temporal Evolution and Influence Factors of New Type Physical Bookstores in China Since 2000: Based on the Analysis of SISYPHE, YJY, and Momicafe. Econ. Geogr. 2020, 40, 67–73. [Google Scholar] [CrossRef]
- Chu, D.; Yang, F.; Shao, X.; Wang, Z.; Pan, J.; Wang, Z. Spatial and temporal differentiation and collaborative development of cultural venue service supply and regional innovation. Geogr. Res. 2024, 43, 3228–3248. [Google Scholar] [CrossRef]
- Luo, Y.; Zou, G.; Liu, Q. Relationships between community public service facilities and social capital: An exploratory study of Harbin, China. PLoS ONE 2025, 20, e0318144. [Google Scholar] [CrossRef] [Scilit] [PubMed]
- Yu, S.; Hu, S.; Ren, Y.; Xu, H.; Song, W. Leverage Effect of New-Built Green Spaces on Housing Prices in a Rapidly Urbanizing Chinese City: Regional Disparities, Impact Periodicity, and Park Size. Land 2024, 13, 1663. [Google Scholar] [CrossRef] [Scilit]
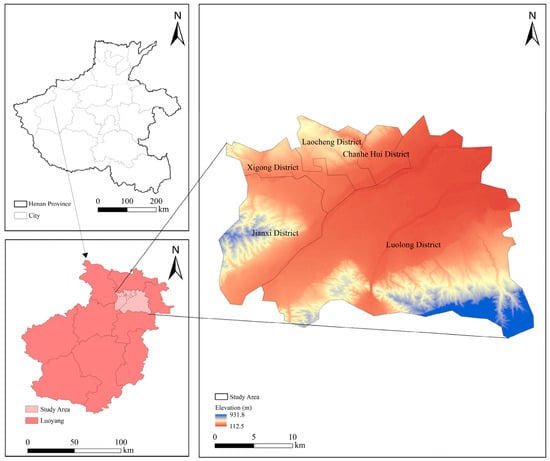
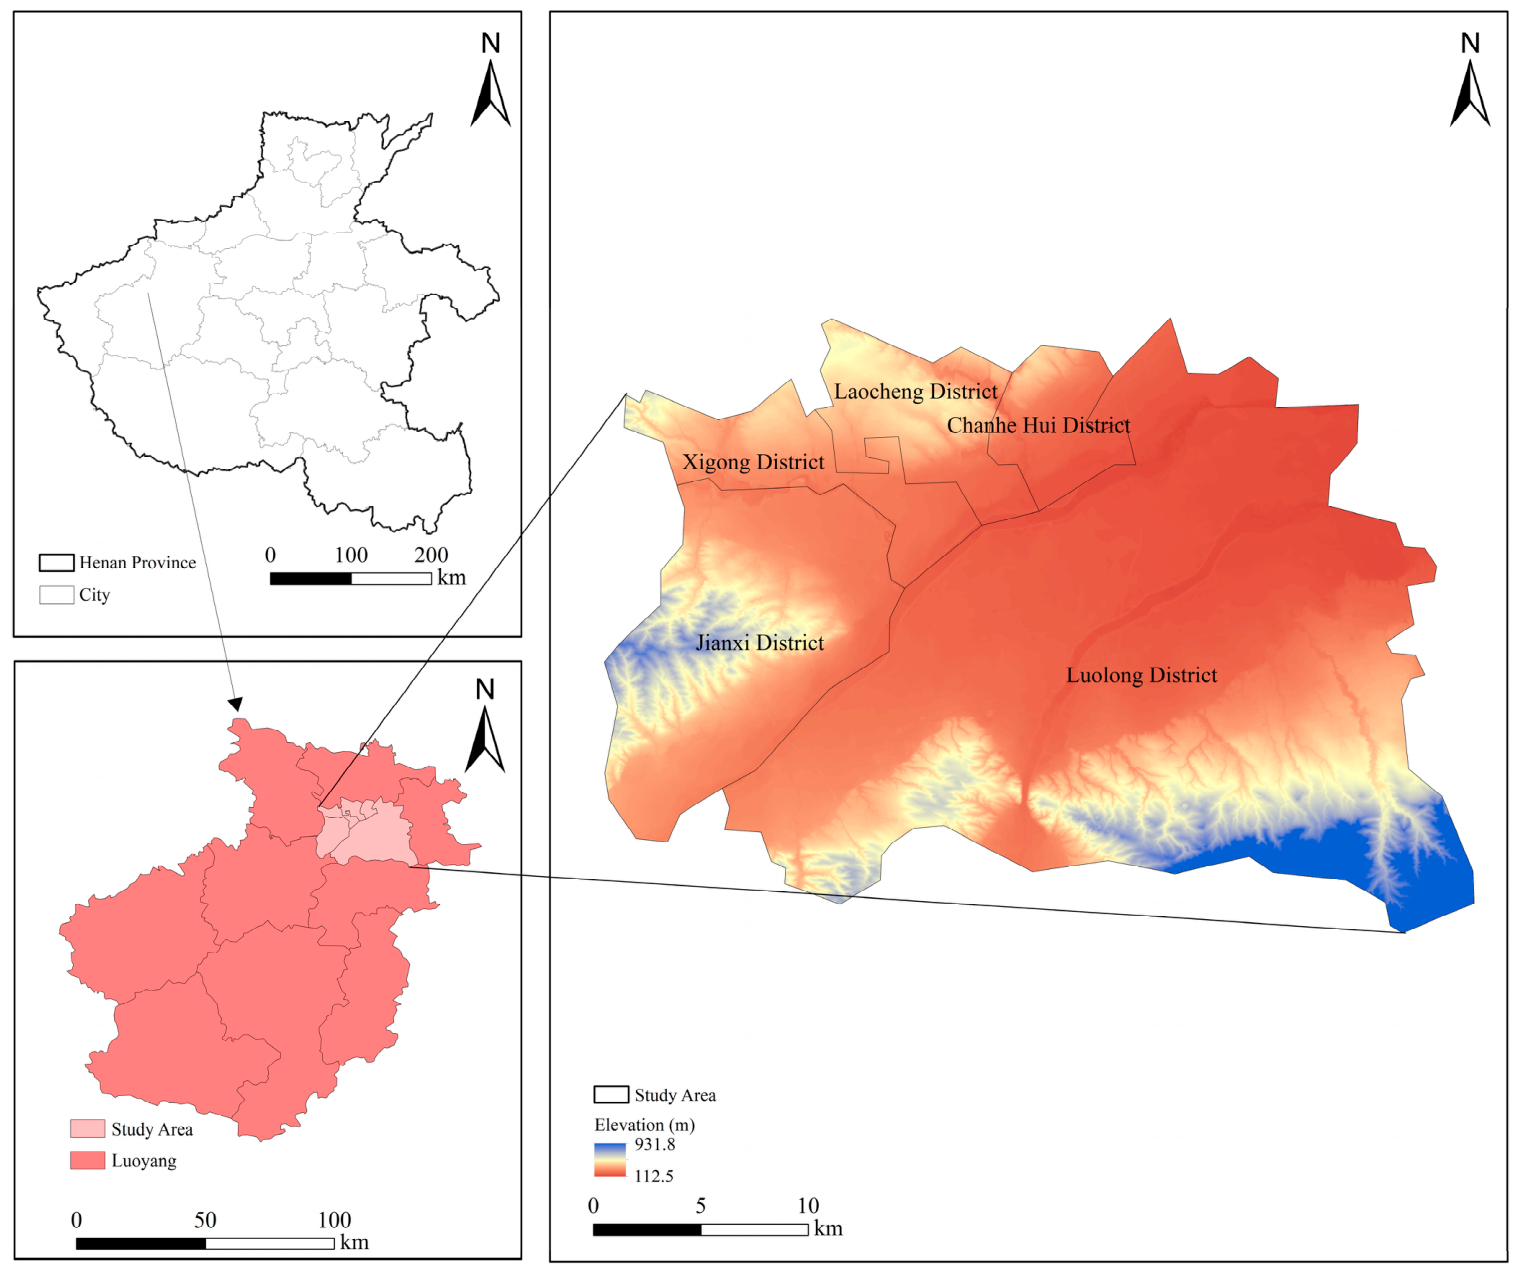
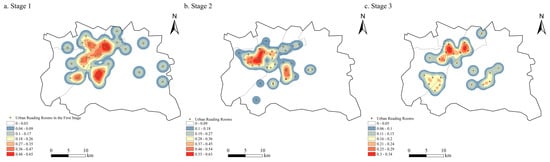
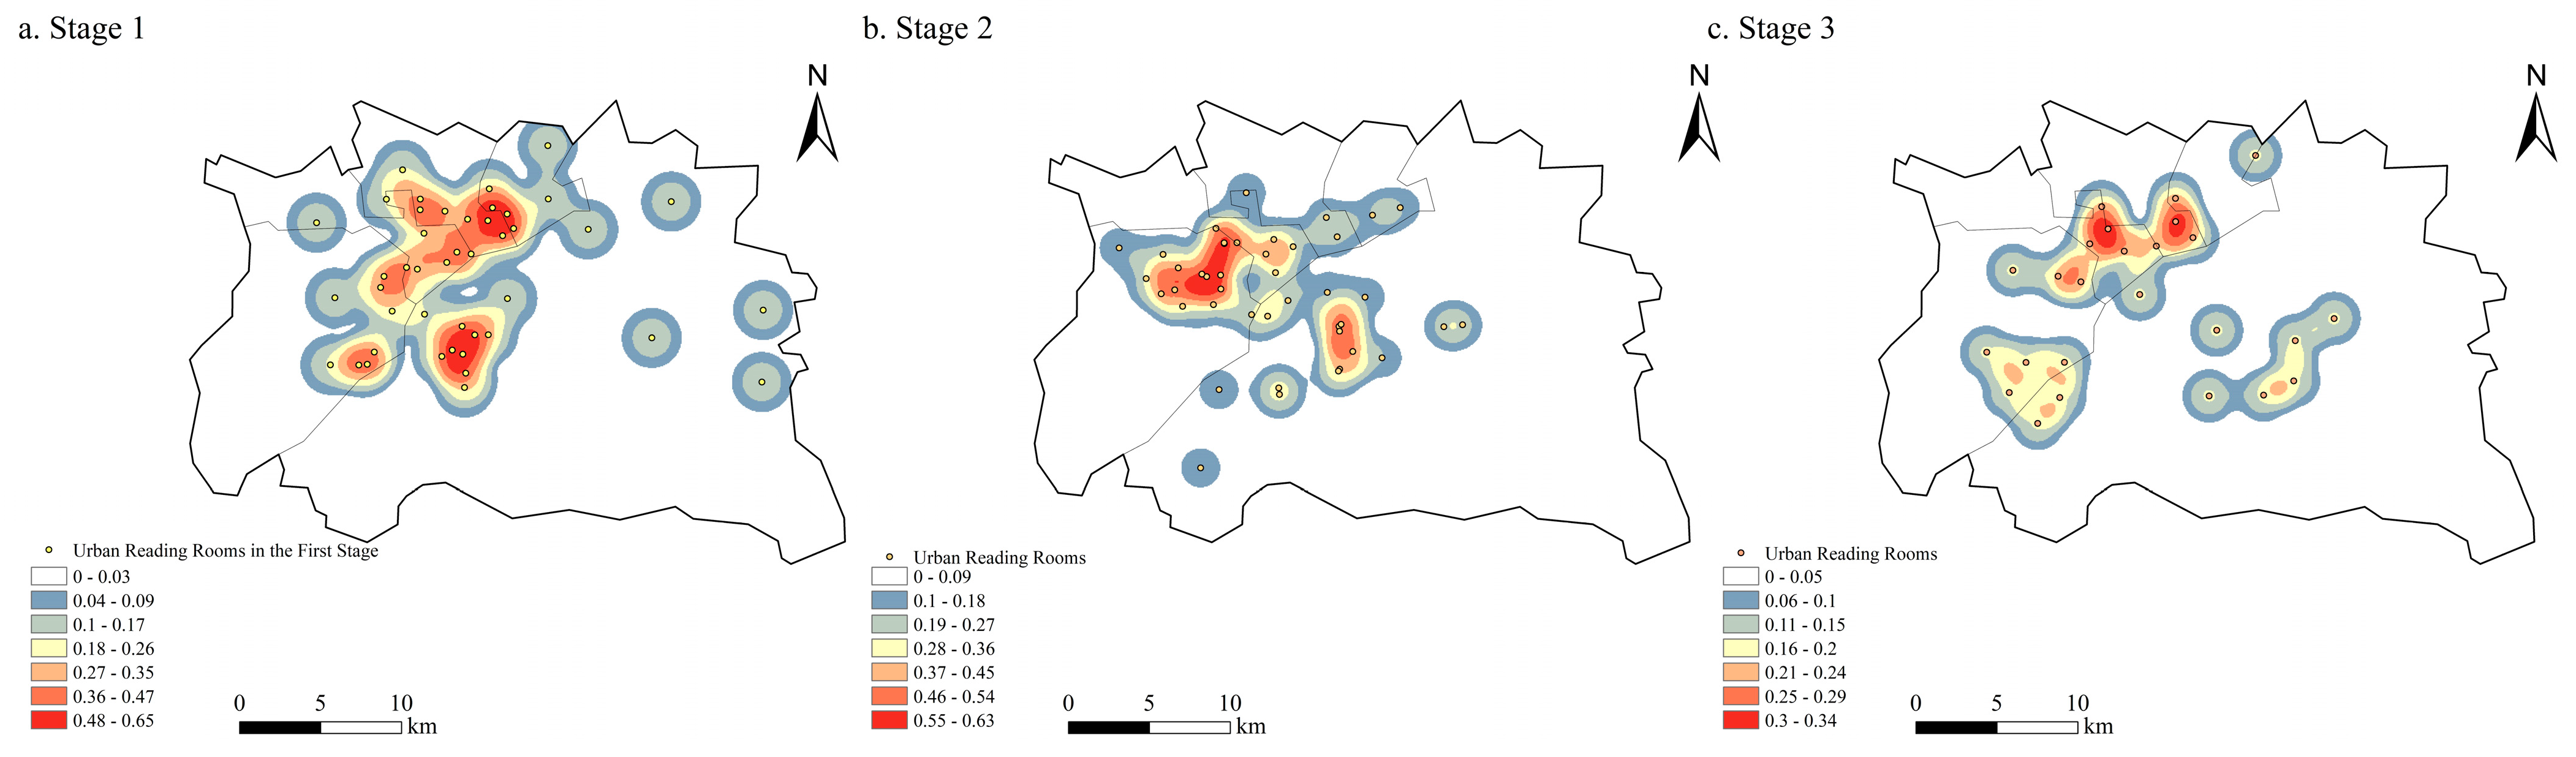
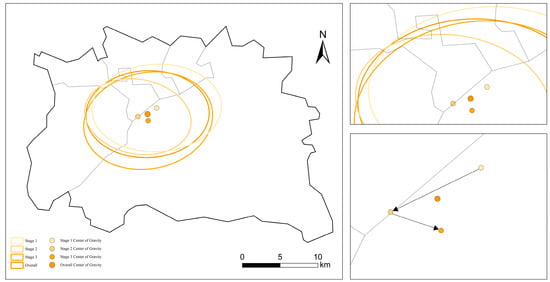
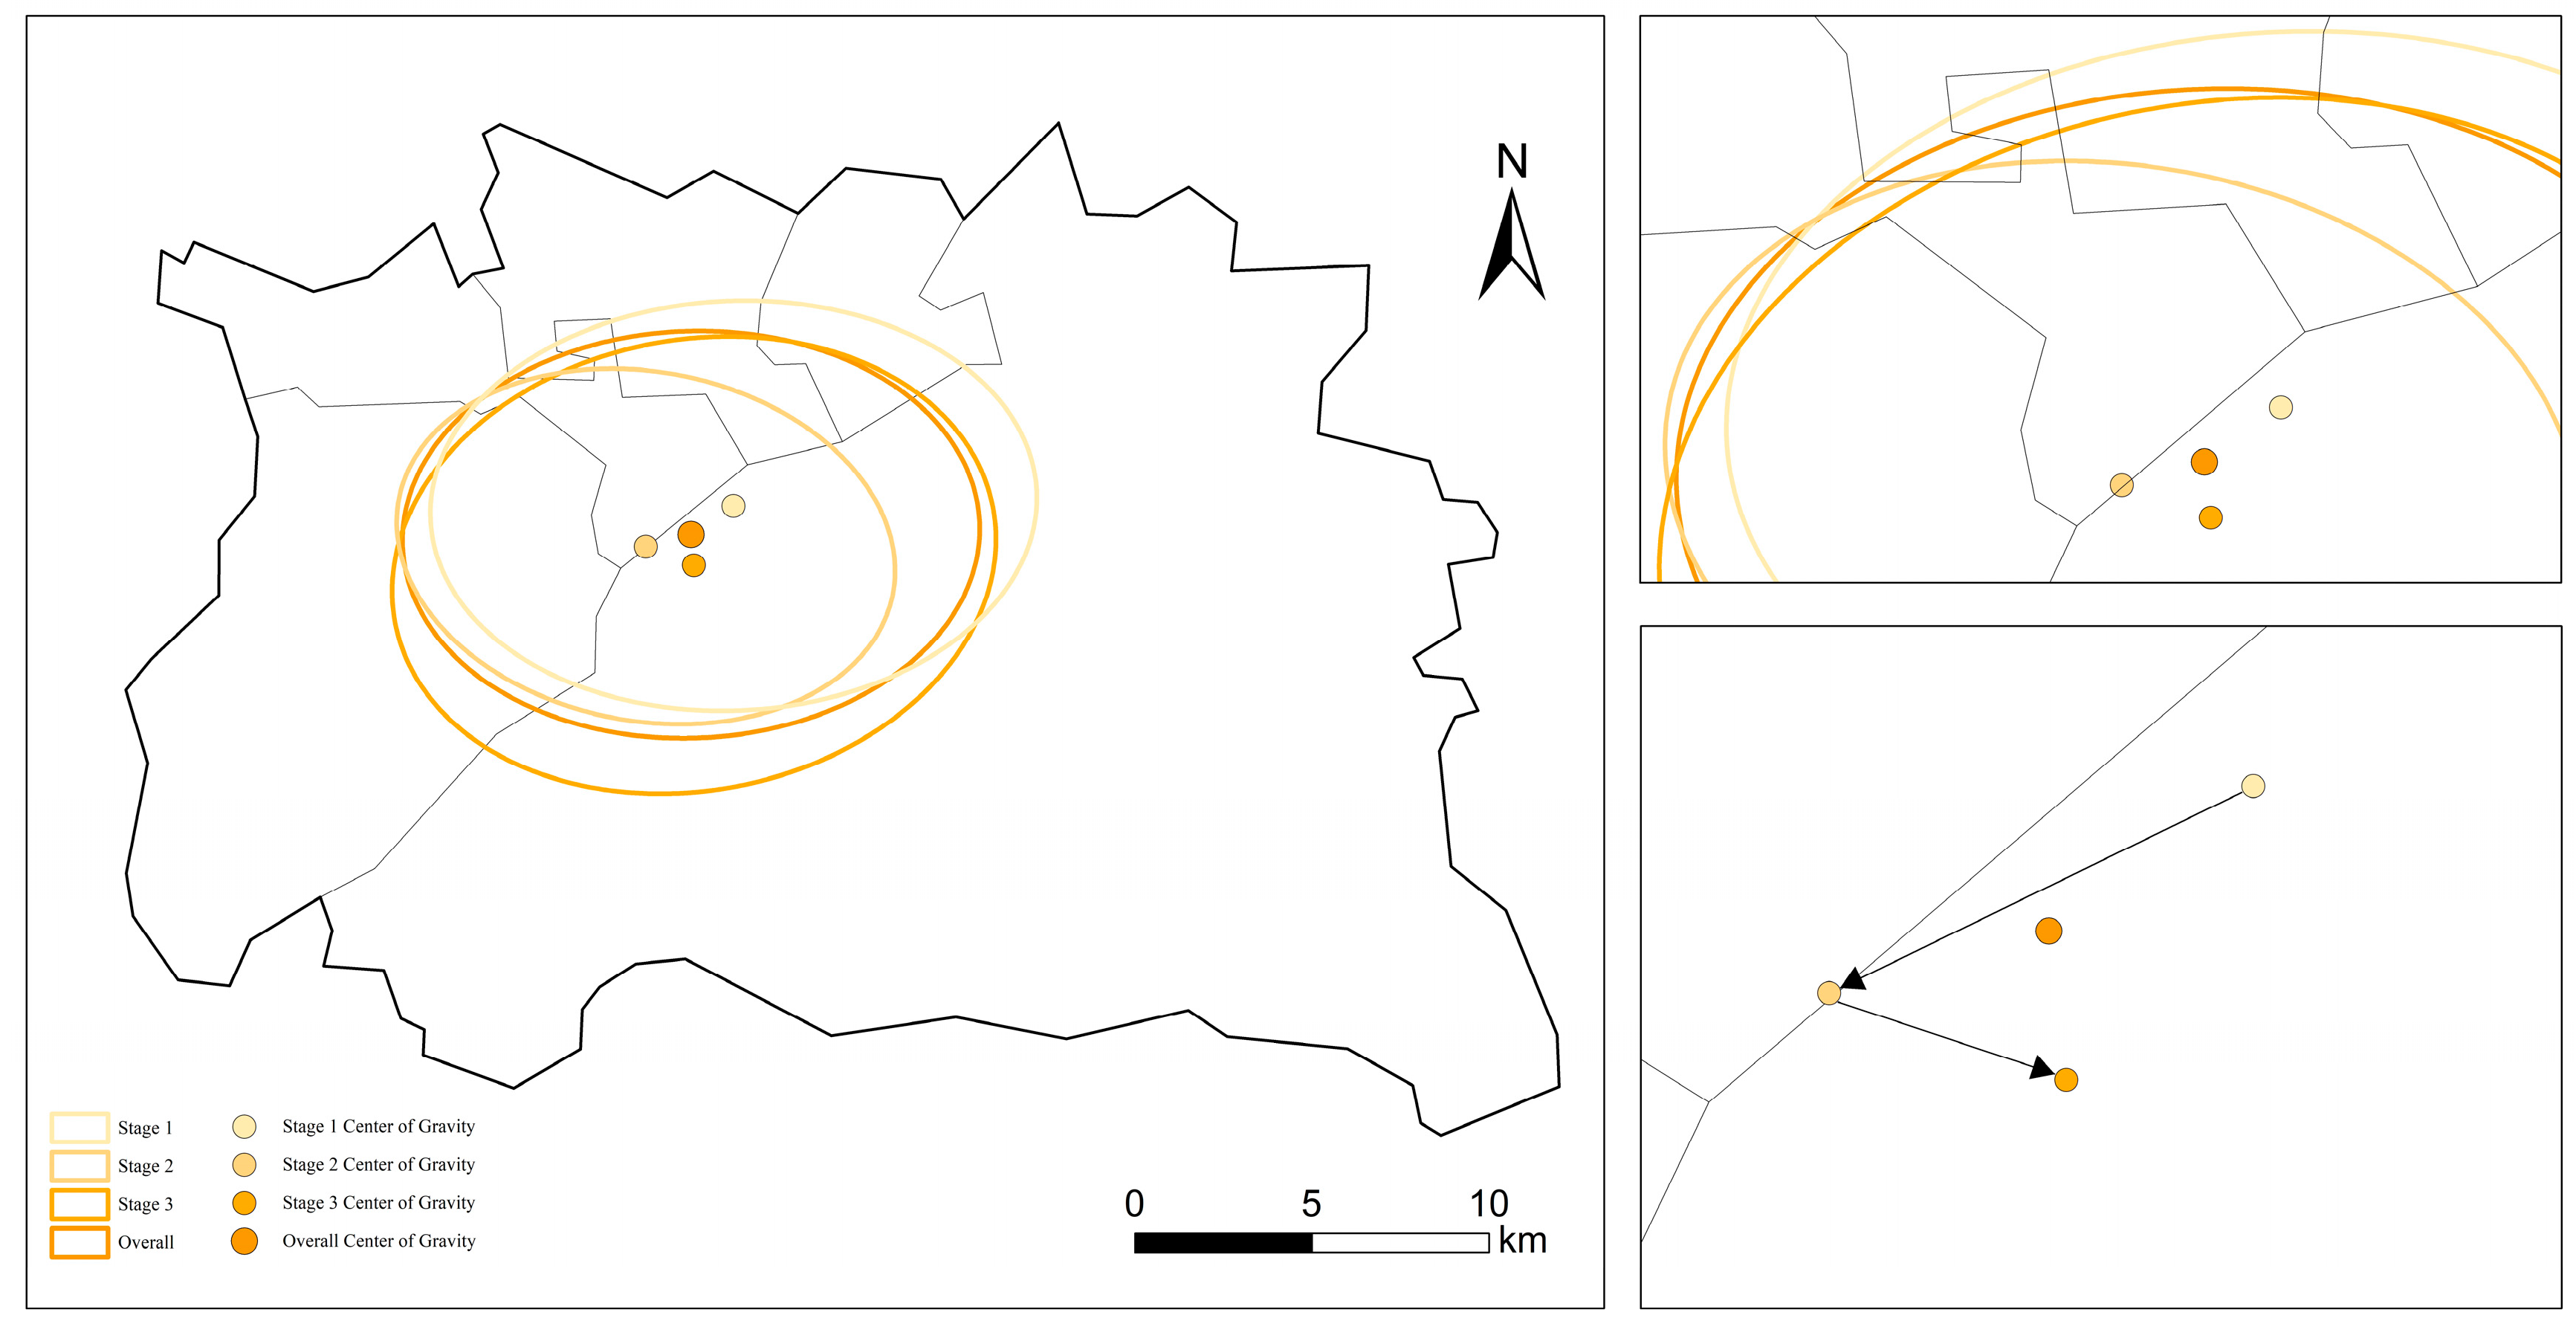
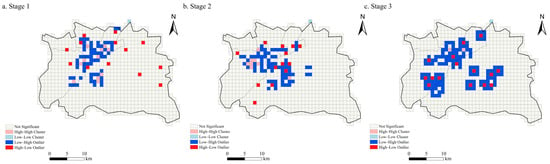
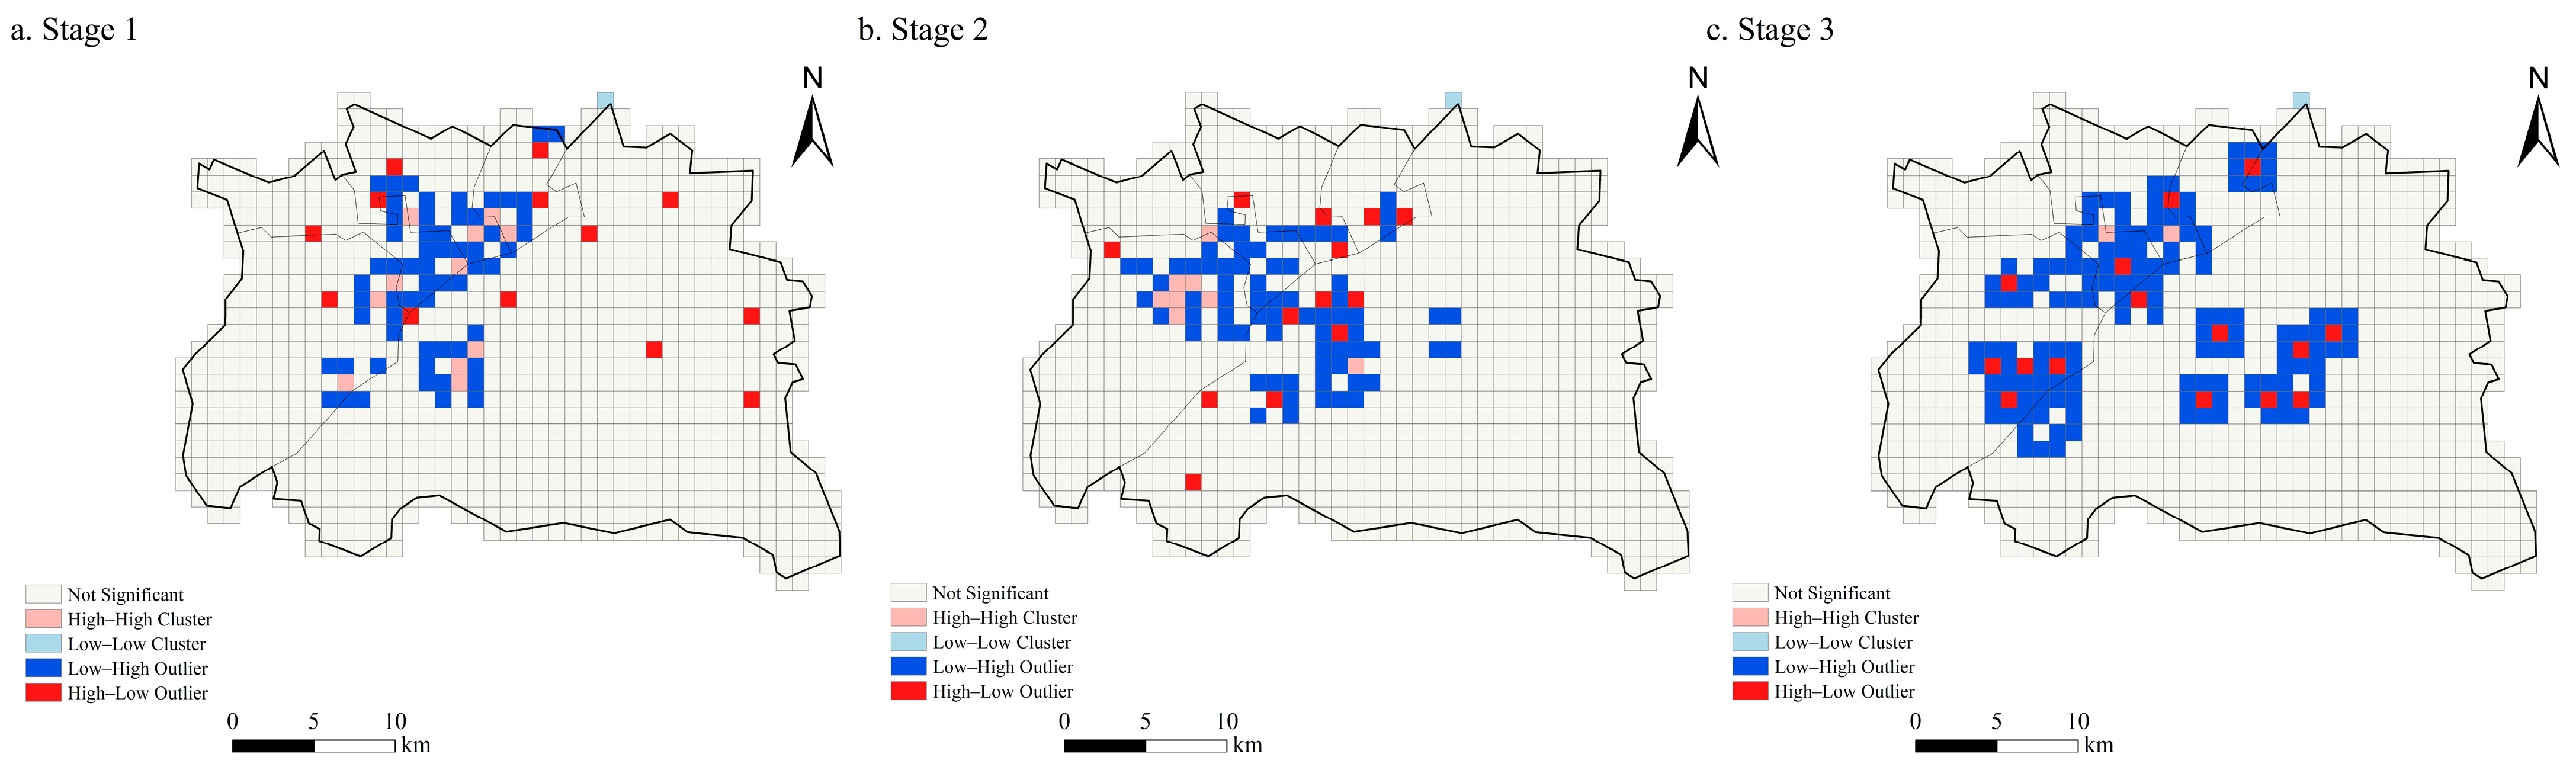
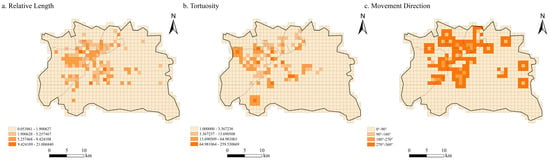
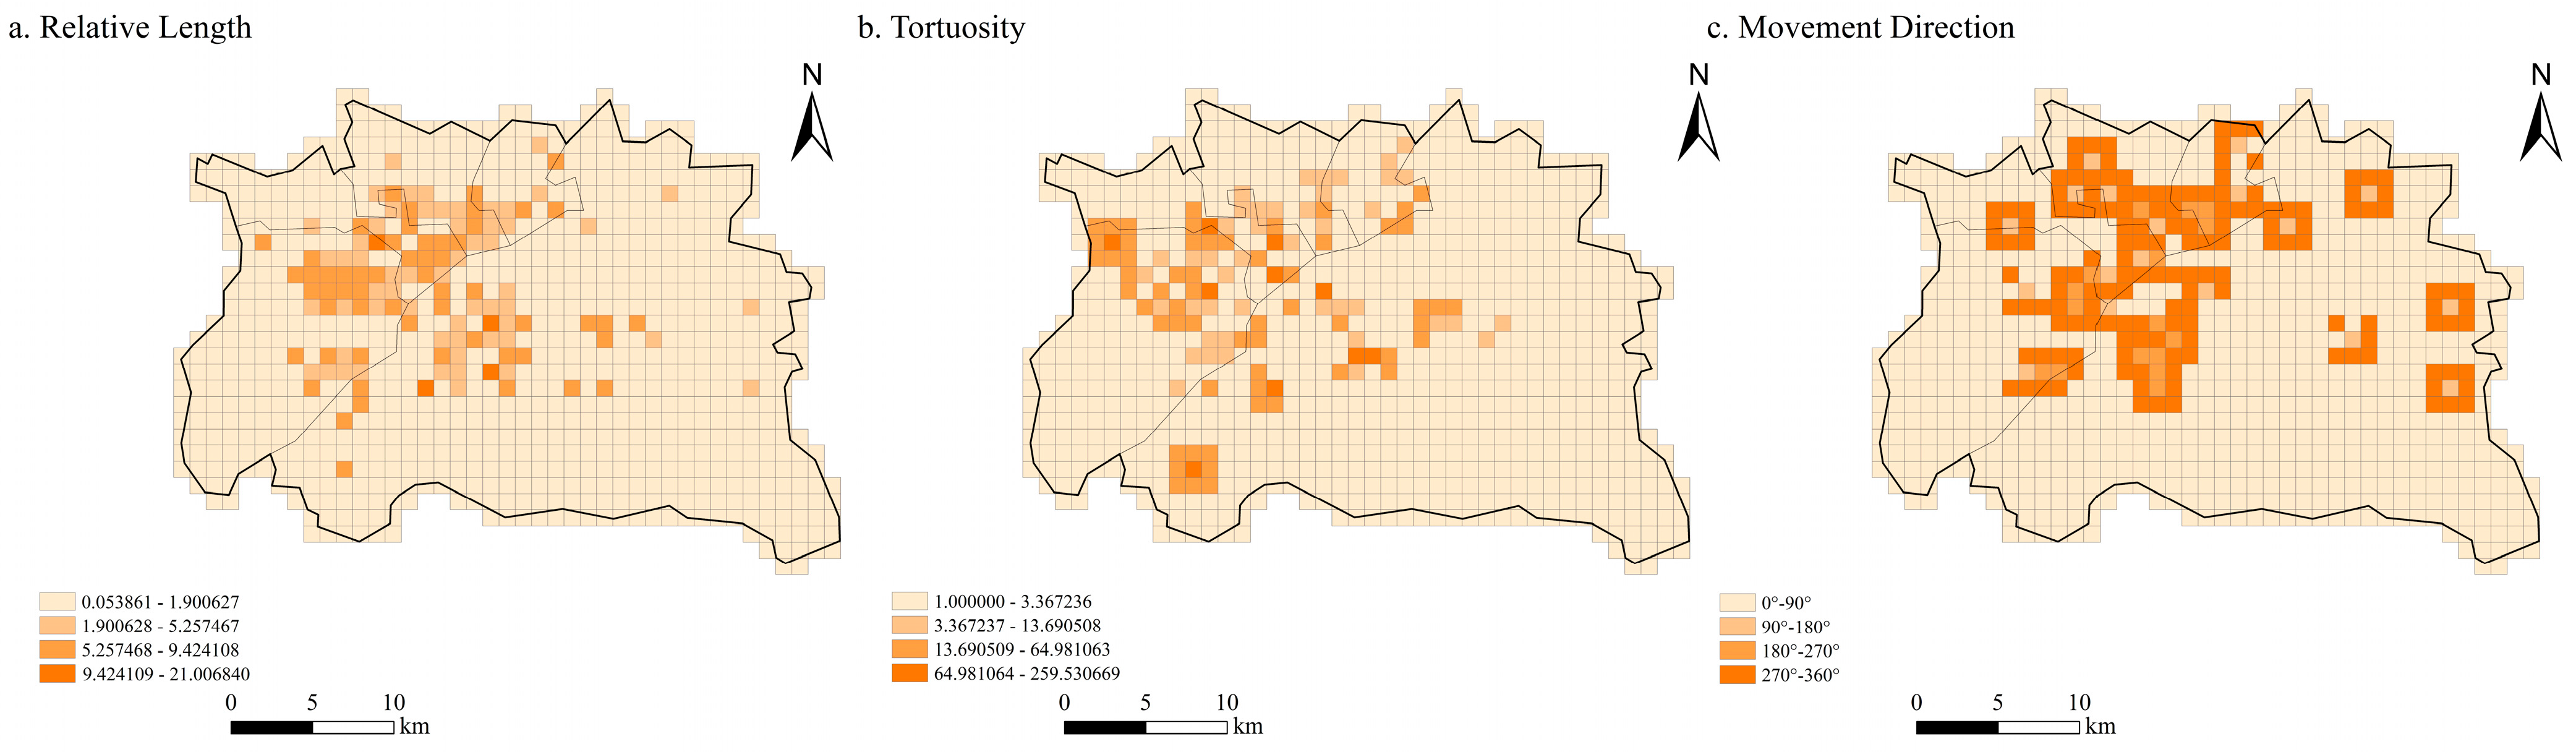
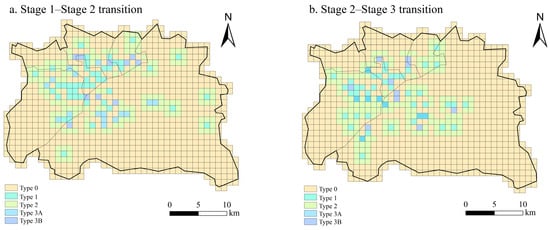
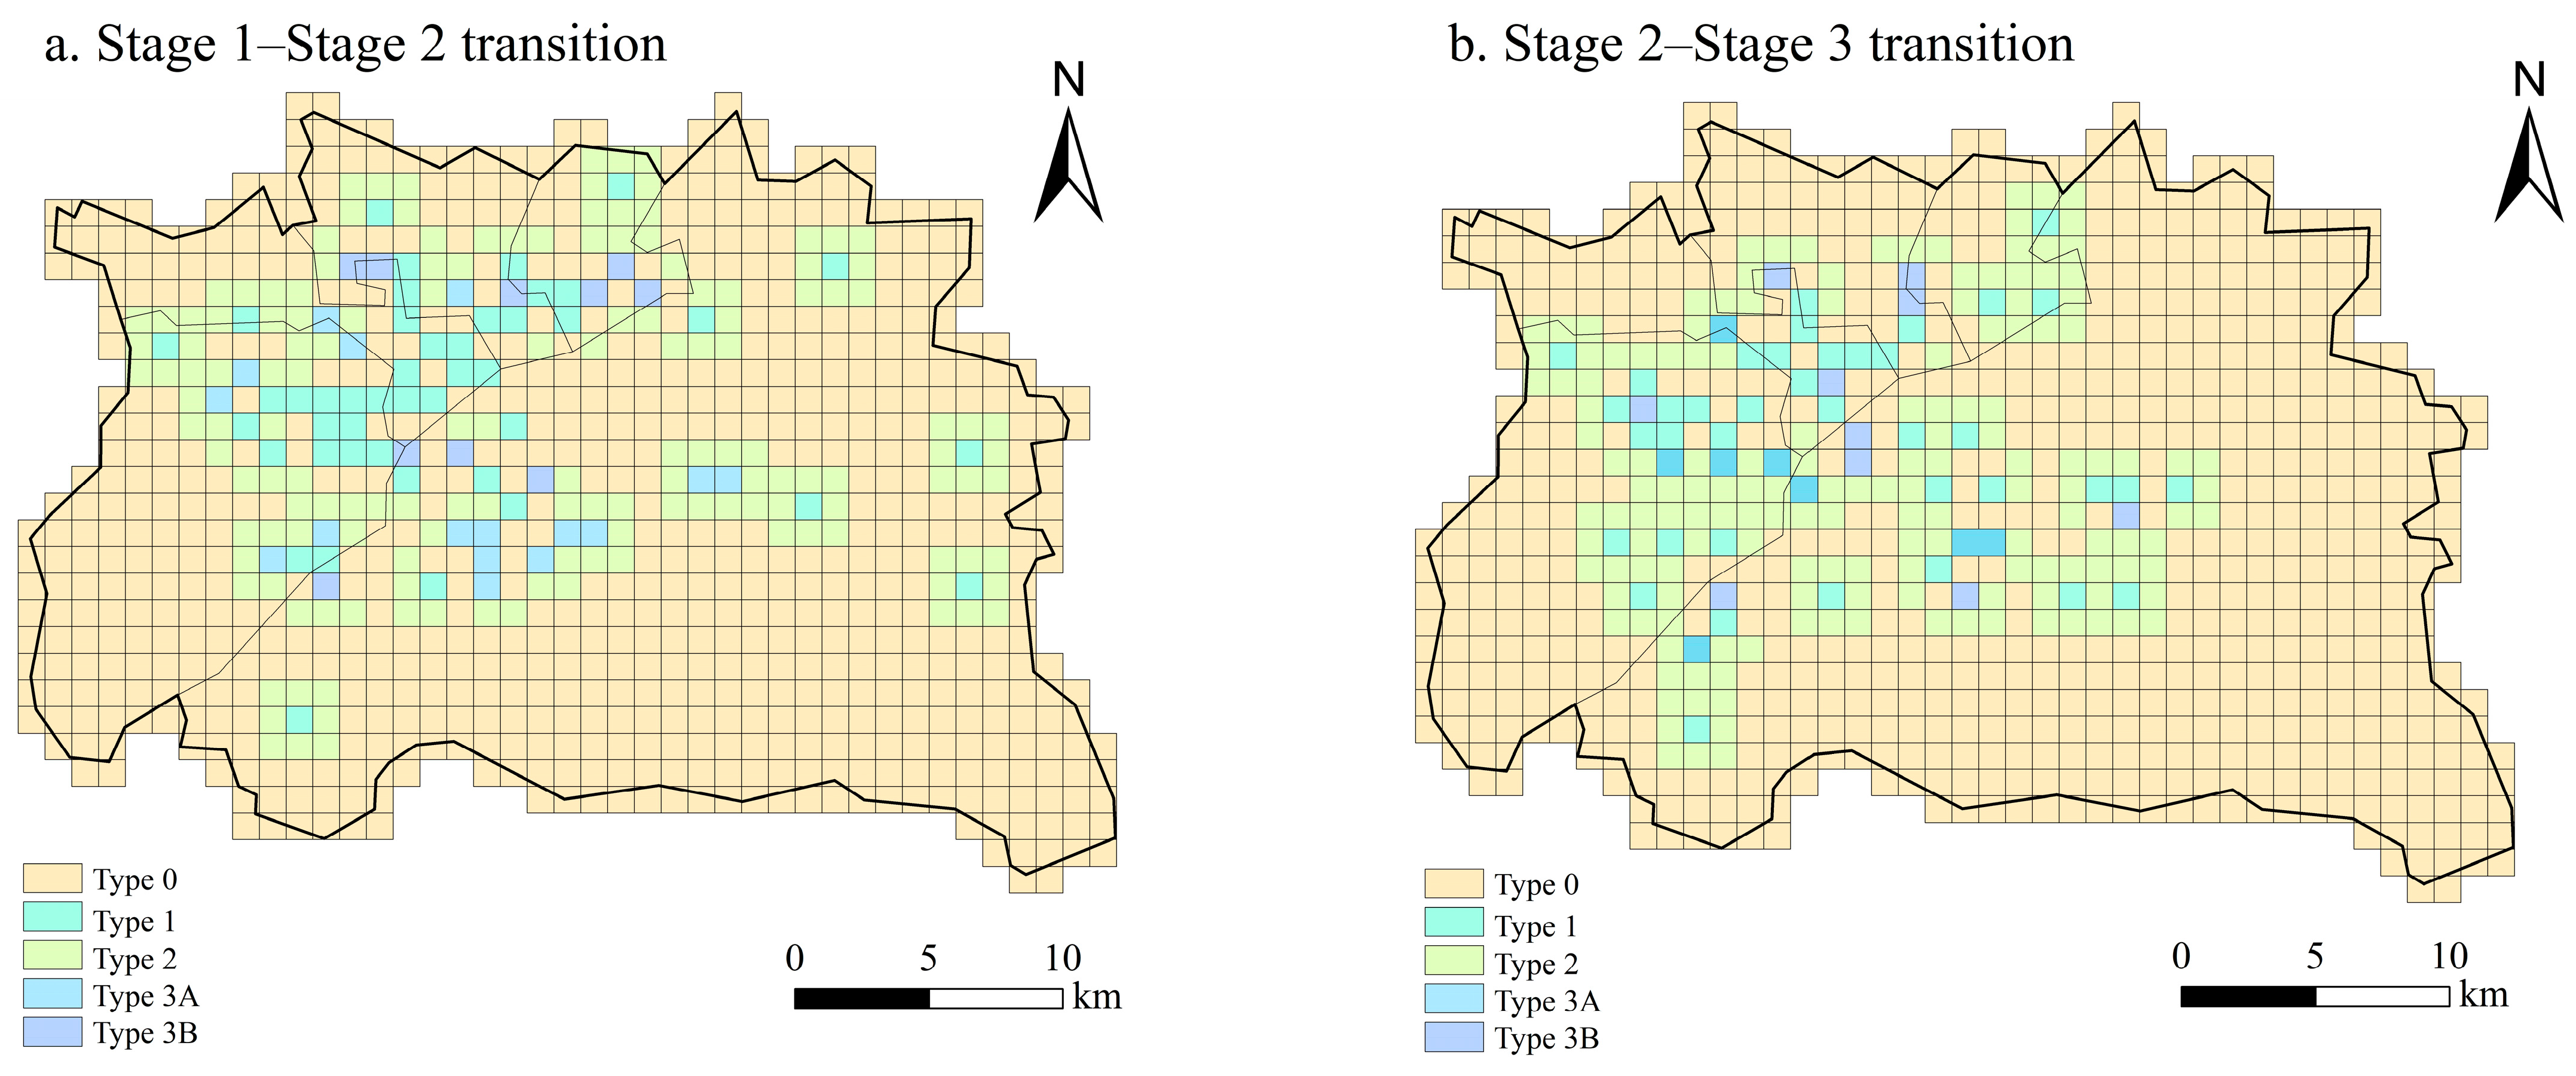
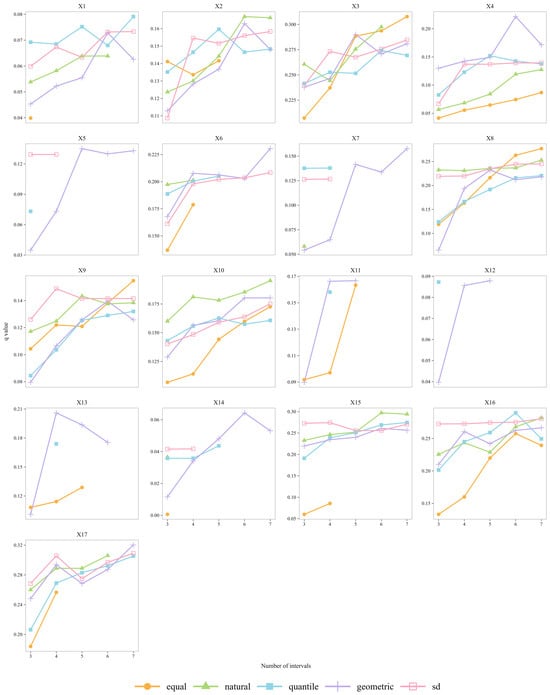
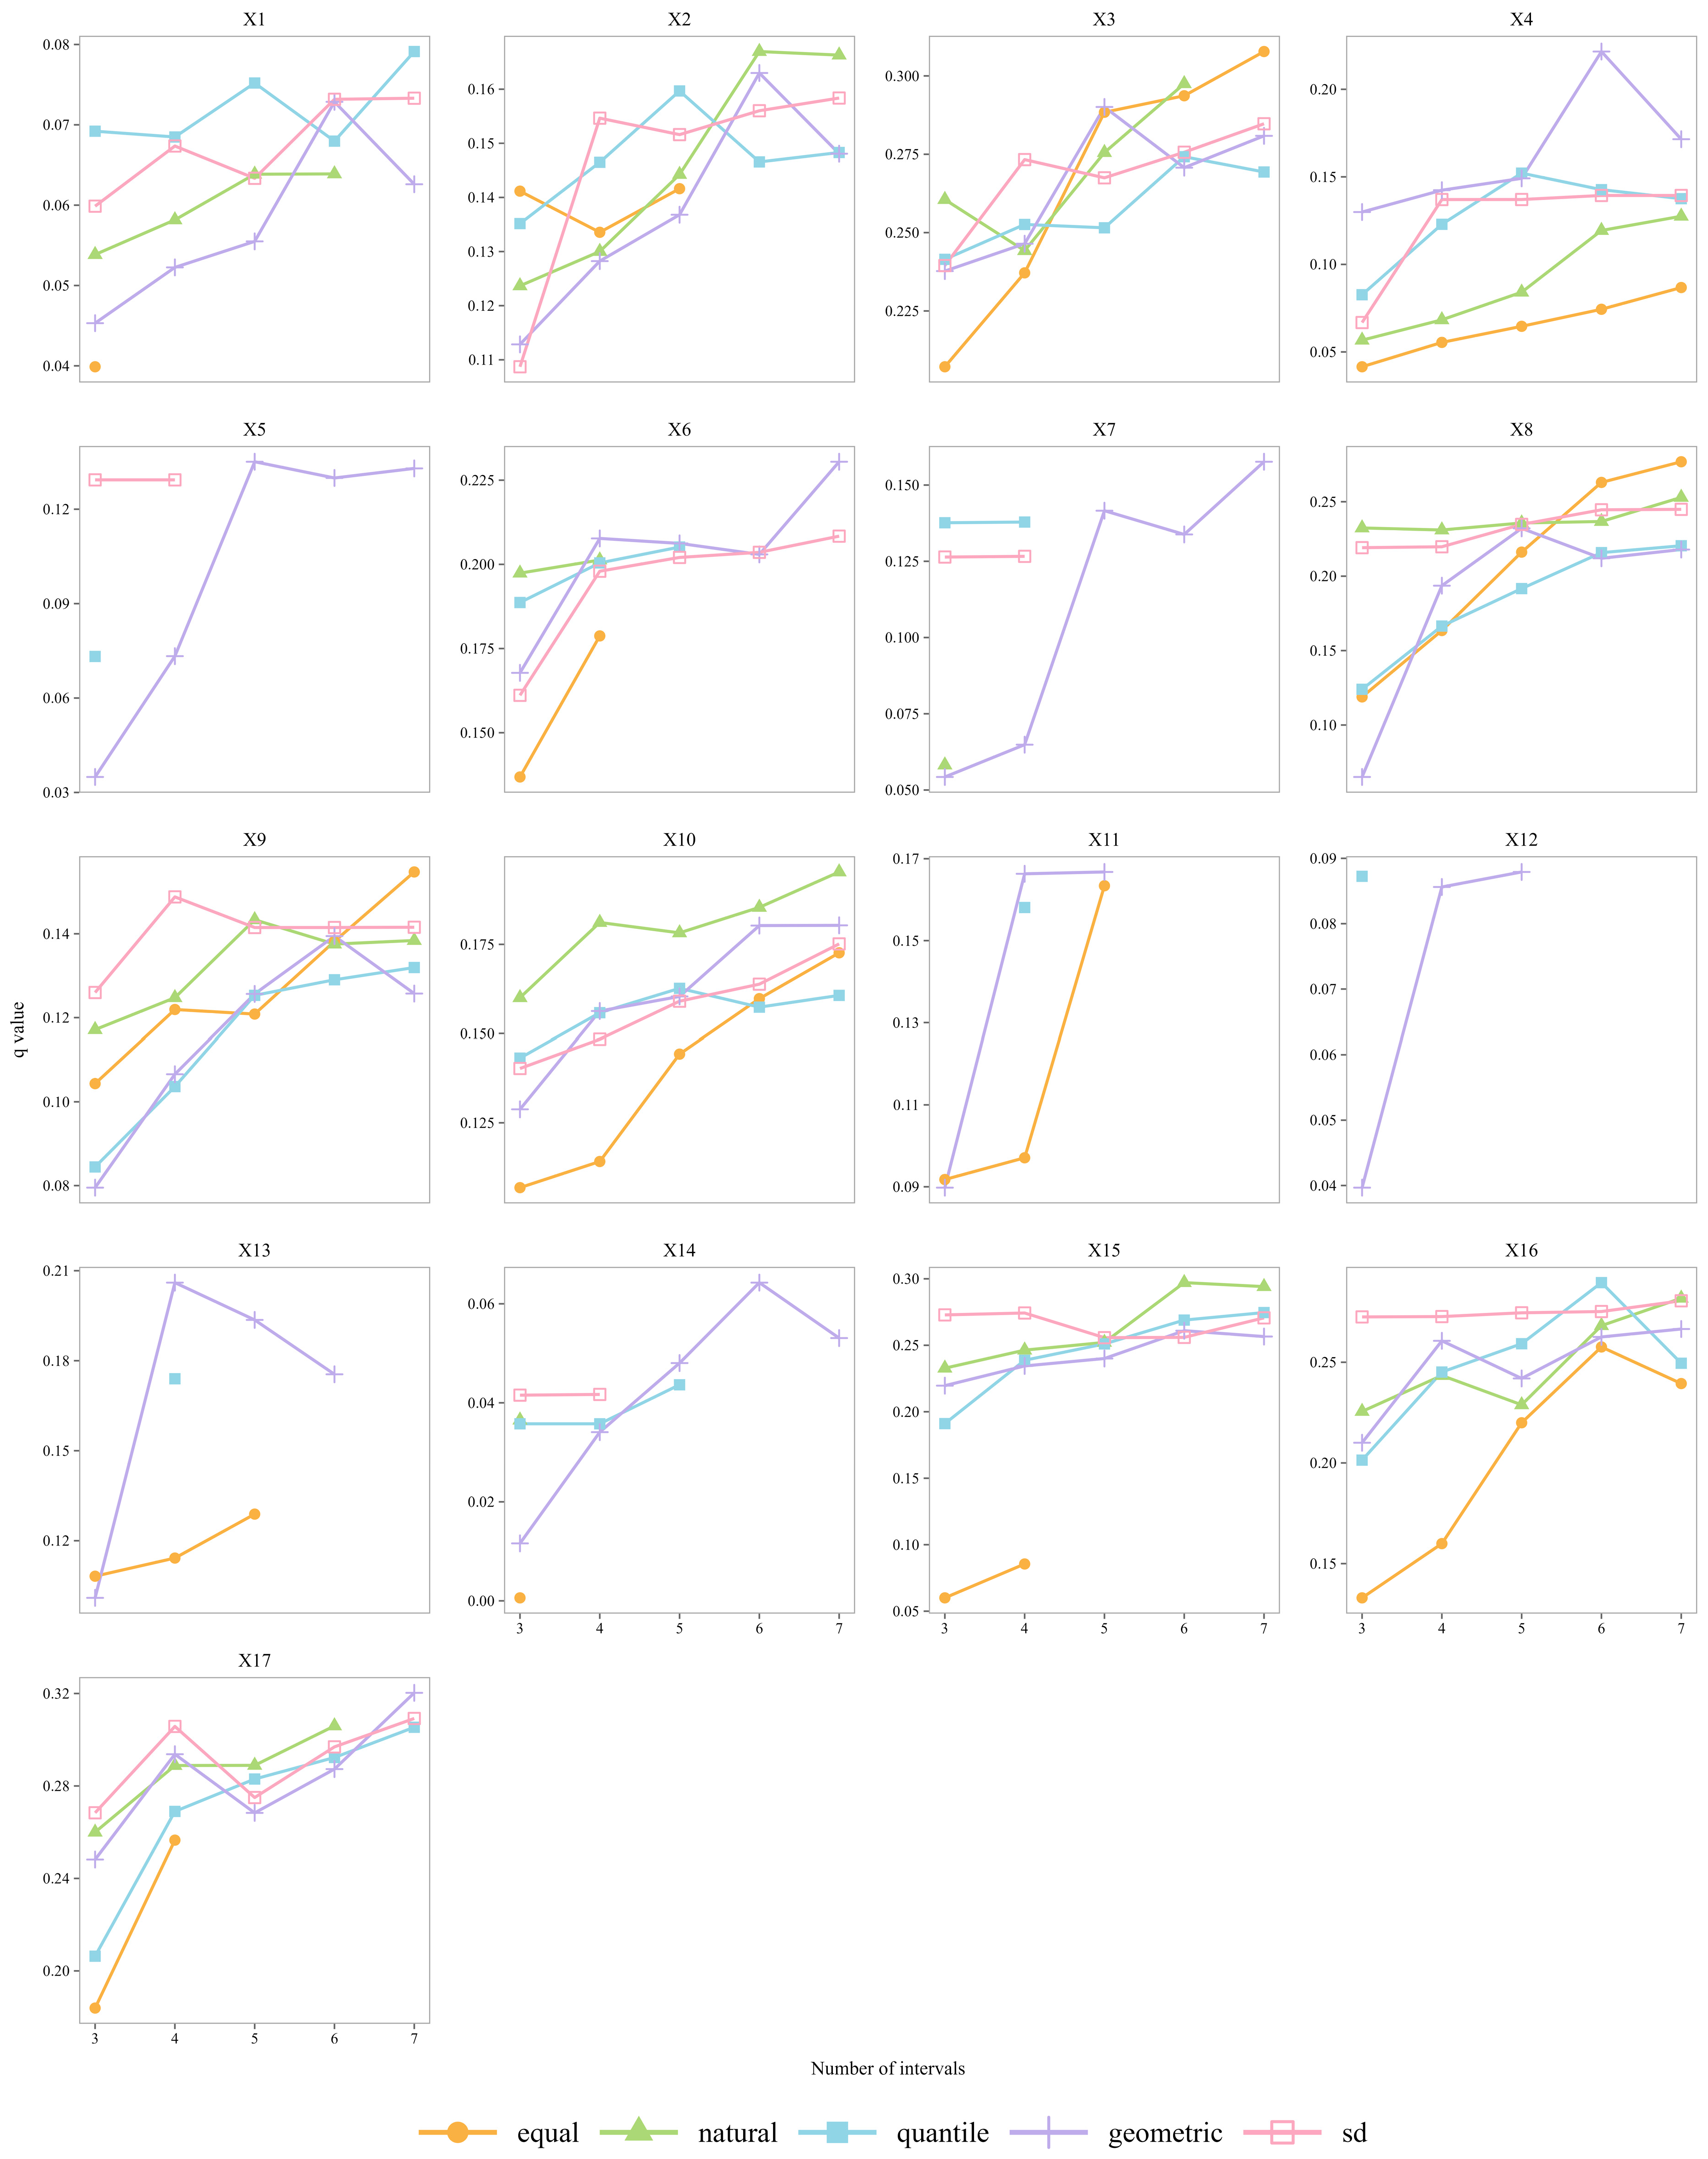
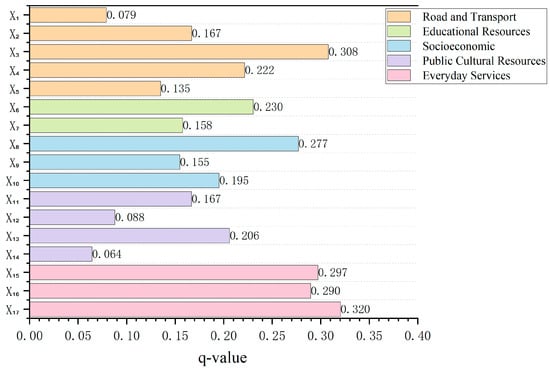
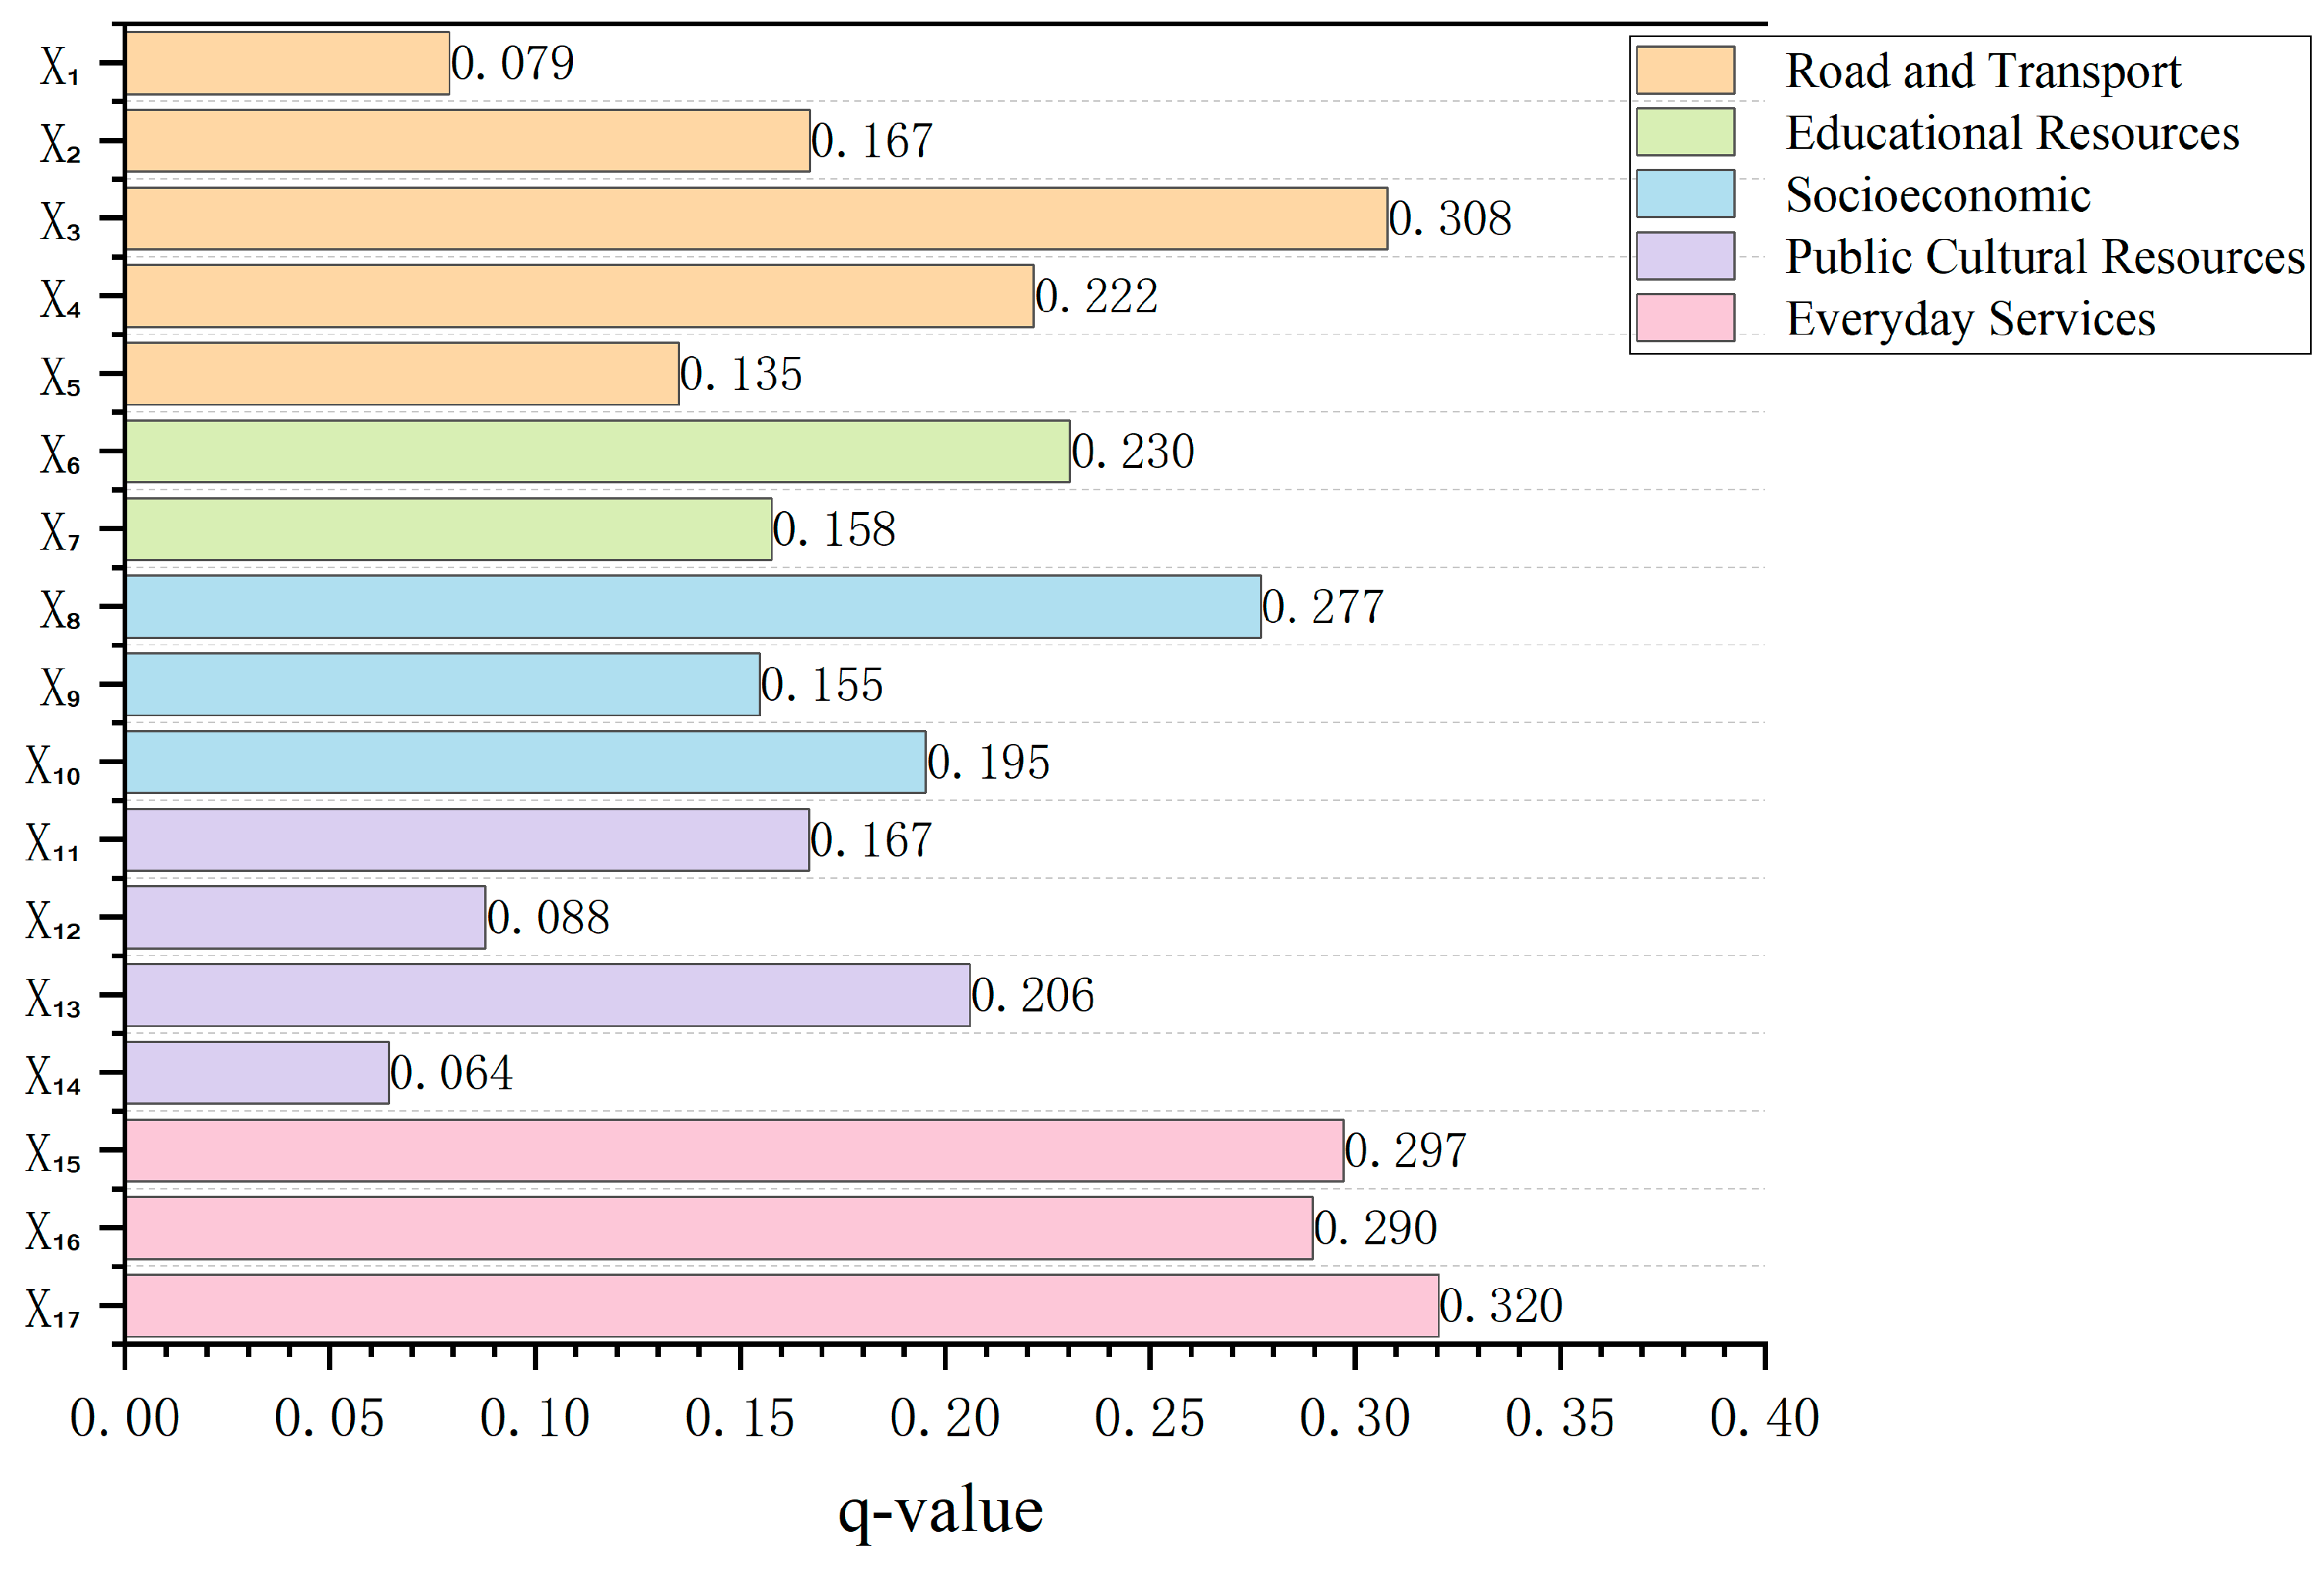
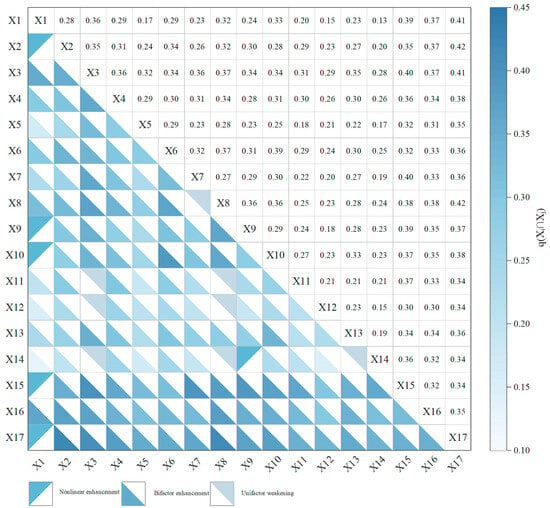
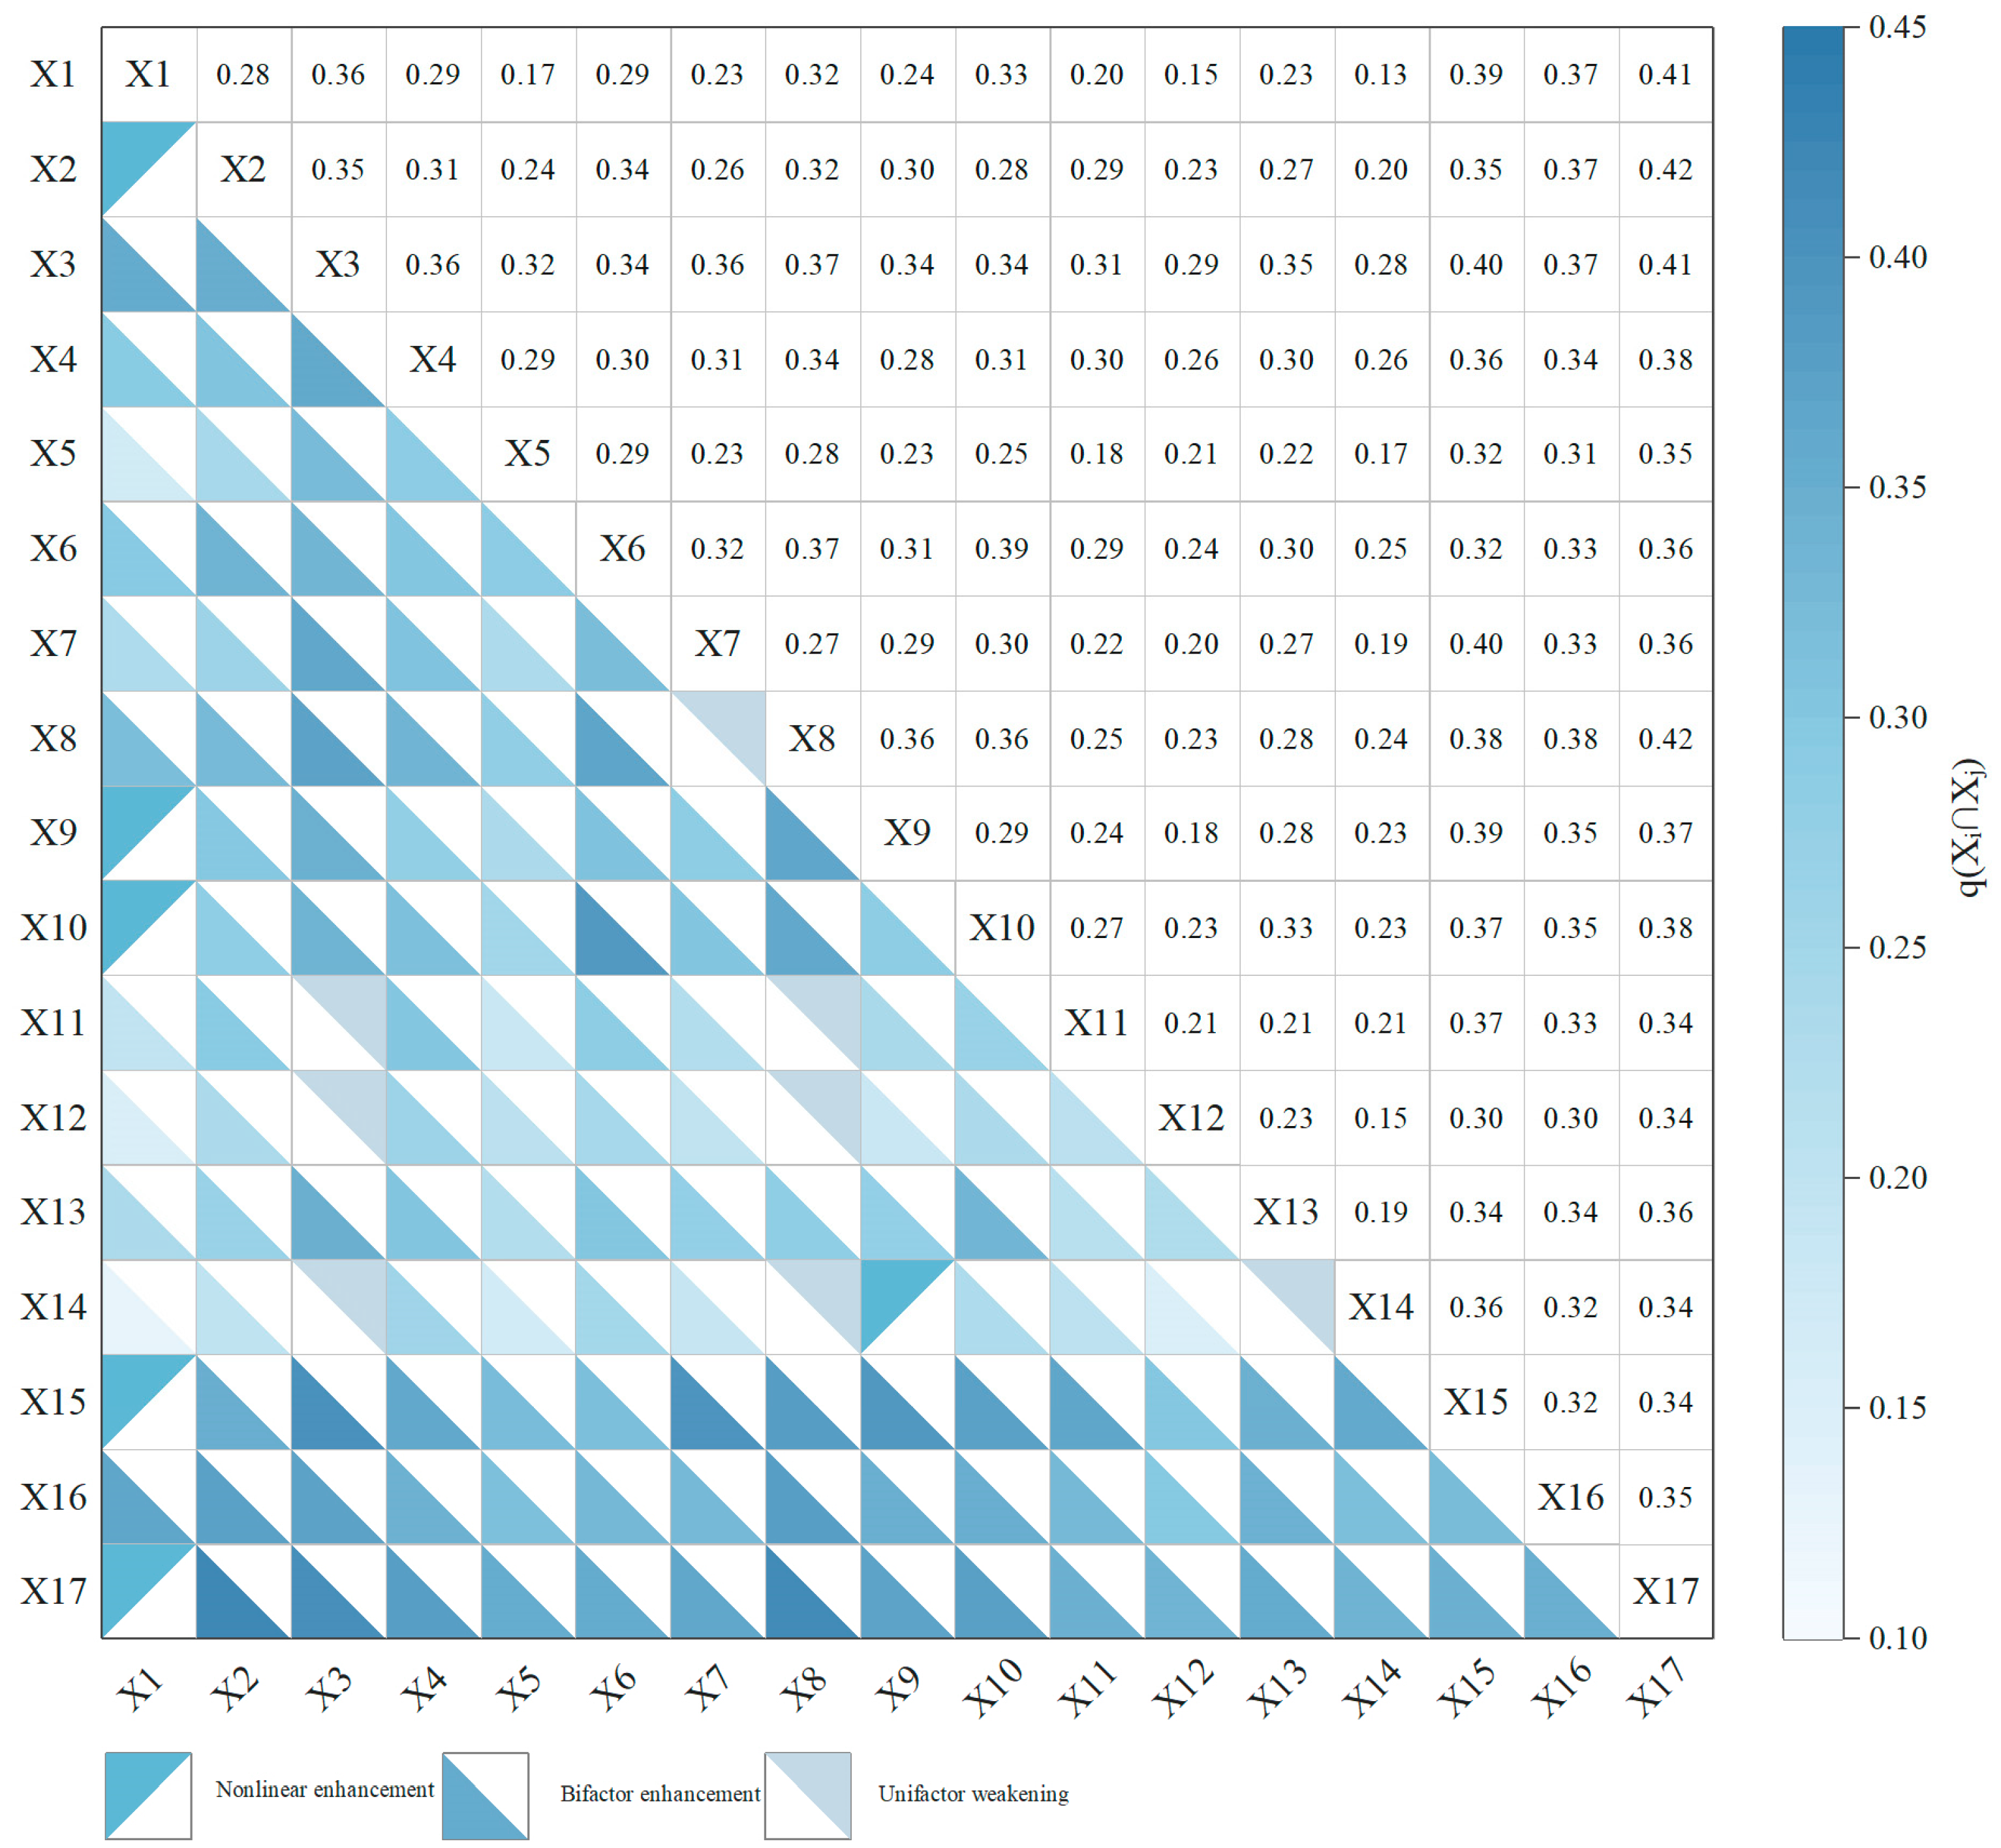
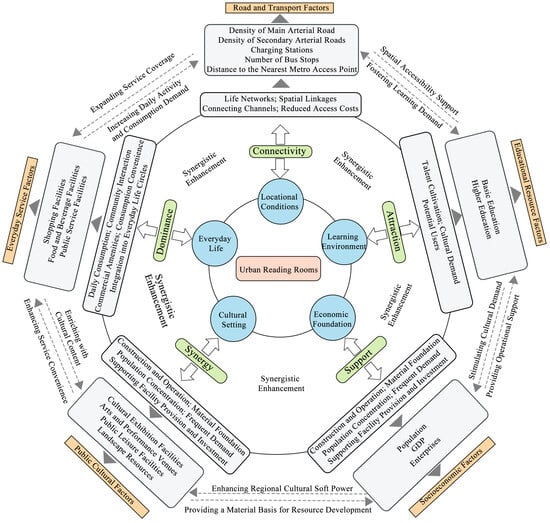
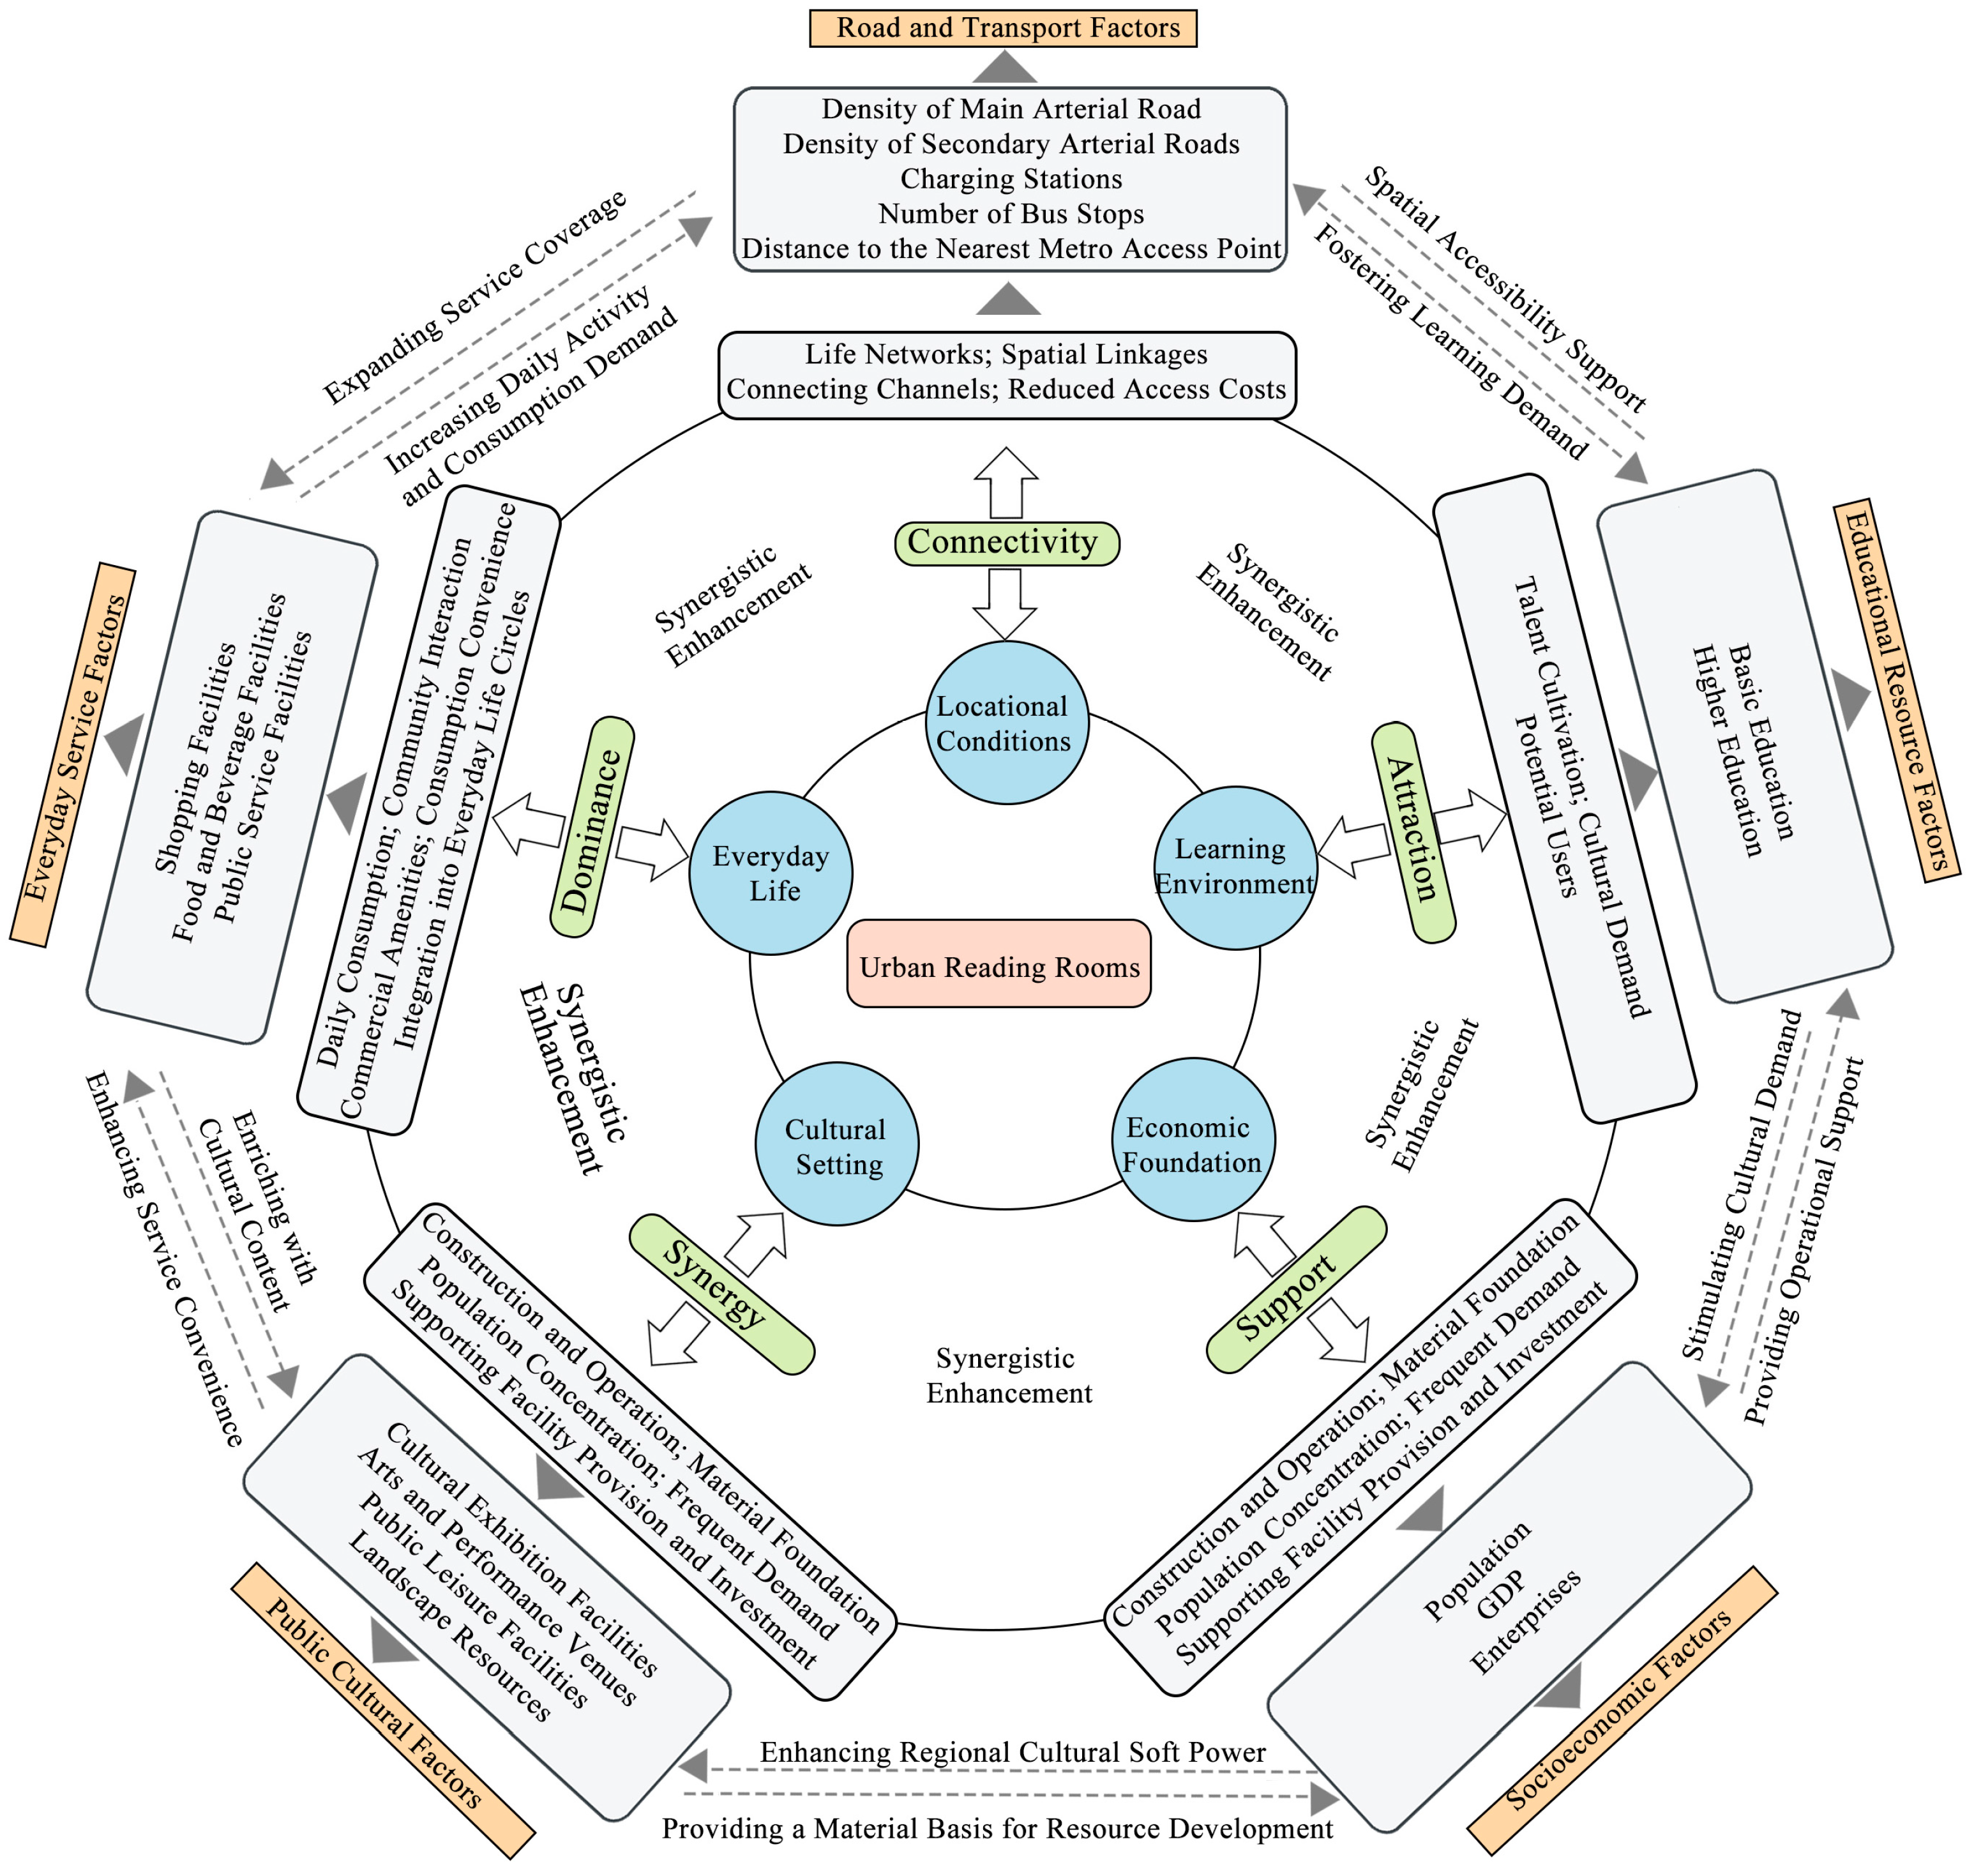

Disclaimer/Publisher’s Note: The statements, opinions and data contained in all publications are solely those of the individual author(s) and contributor(s) and not of MDPI and/or the editor(s). MDPI and/or the editor(s) disclaim responsibility for any injury to people or property resulting from any ideas, methods, instructions or products referred to in the content. |
© 2026 by the authors. Licensee MDPI, Basel, Switzerland. This article is an open access article distributed under the terms and conditions of the Creative Commons Attribution (CC BY) license.